Martian dust devils: Laboratory simulations of particle threshold Ronald Greeley, 1 Matthew R. Balme, 1 James D. Iversen, 2 Stephen Metzger, 3 Robert Mickelson, 4 Jim Phoreman, 5 and Bruce White 6 Received 30 September 2002; revised 21 January 2003; accepted 7 February 2003; published 17 May 2003. [1] An apparatus has been fabricated to simulate terrestrial and Martian dust devils. Comparisons of surface pressure profiles through the vortex core generated in the apparatus with both those in natural dust devils on Earth and those inferred for Mars are similar and are consistent with theoretical Rankine vortex models. Experiments to determine particle threshold under Earth ambient atmospheric pressures show that sand (particles > 60 mm in diameter) threshold is analogous to normal boundary-layer shear, in which the rotating winds of the vortex generate surface shear and hence lift. Lower- pressure experiments down to 65 mbar follow this trend for sand-sized particles. However, smaller particles (i.e., dust) and all particles at very low pressures (10–60 mbar) appear to be subjected to an additional lift function interpreted to result from the strong decrease in atmospheric pressure centered beneath the vortex core. Initial results suggest that the wind speeds required for the entrainment of grains 2 mm in diameter (i.e., Martian dust sizes) are about half those required for entrainment by boundary layer winds on both Earth and Mars. INDEX TERMS: 6225 Planetology: Solar System Objects: Mars; 0343 Atmospheric Composition and Structure: Planetary atmospheres (5405, 5407, 5409, 5704, 5705, 5707); 3322 Meteorology and Atmospheric Dynamics: Land/atmosphere interactions; 5415 Planetary Sciences: Erosion and weathering; 3307 Meteorology and Atmospheric Dynamics: Boundary layer processes; KEYWORDS: Mars, dust devils, particle threshold, laboratory simulation Citation: Greeley, R., M. R. Balme, J. D. Iversen, S. Metzger, R. Mickelson, J. Phoreman, and B. White, Martian dust devils: Laboratory simulations of particle threshold, J. Geophys. Res., 108(E5), 5041, doi:10.1029/2002JE001987, 2003. 1. Introduction [2] Aeolian processes are potentially important in mod- ifying the surface of Mars (reviewed by Wells and Zimbel- man [1989]; Greeley et al. [1992]; Kahn et al. [1992]; Zurek et al. [1992]; Martin and Zurek [1993]; and McKim [1995]). Recent results from the Mars Pathfinder (MPF) [Golombek et al., 1997, 1999; Smith et al., 1997; Greeley et al., 1999, 2002], Mars Global Surveyor (MGS), and Mars Odyssey missions confirm the presence of abundant aeolian features, including duneforms seen in Mars Orbiter Camera (MOC) high-resolution images [Malin et al., 1998; Malin and Edgett, 1999, 2001; Edgett and Malin, 2000a; Cantor et al., 2001]. The morphologies and diverse albedo patterns of these features suggest complex histories which might reflect changes in Mars’ climate [Thomas et al., 1999]. Moreover, because airborne dust is both an efficient absorber and scatterer of solar radiation, it could strongly influence the thermal structure of the atmosphere [Kahn et al., 1992]. [3] Lander data from Viking and MPF also demonstrate aeolian activity. For example, at the MPF site dust devils were observed in images [Smith and Lemmon, 1998; Metzger et al., 1999] and detected in meteorology measure- ments [Schofield et al., 1997]. Wind-eroded rocks (venti- facts) [Bridges et al., 1999], drifts, and duneforms were also identified, and are considered to reflect the action of wind- blown sand [Greeley et al., 1999, 2002]. Analysis of the orientations of these features and comparisons with features seen from orbit suggest a change in the wind regime through time [Bridges et al., 1998; Kuzmin and Greeley , 1999; Greeley et al., 1999]. [4] The observations of dust storms, dust devils, dunes, and other aeolian features on Mars suggest that the transport of sand and dust is important at all scales. The size of dust entrained in the atmosphere is estimated to be only a few microns in diameter [Pollack et al., 1979, 1995; Smith et al., 1997; Tomasko et al., 1999] yet particles this small are very difficult to move by simple boundary-layer wind shear [Greeley et al., 1981; Iversen and White, 1982], requiring winds an order of magnitude greater than those measured on the surface of Mars. For this reason, dust devils were proposed to be an efficient mechanism for raising dust [Neubauer, 1966; Sagan and Pollack, 1969]. [5] In this paper, we briefly review the characteristics of terrestrial and Martian dust devils, describe an apparatus to simulate dust devils, and give initial results from the JOURNAL OF GEOPHYSICAL RESEARCH, VOL. 108, NO. E5, 5041, doi:10.1029/2002JE001987, 2003 1 Department of Geological Sciences, Arizona State University, Tempe, Arizona, USA. 2 Aerospace Engineering and Engineering Mechanics Department, Iowa State University, Ames, Iowa, USA. 3 Department of Geological Sciences, University of Nevada at Reno, Reno, Nevada, USA. 4 Phoenix, Arizona, USA. 5 NASA Ames Research Center, Moffett Field, California, USA. 6 Department of Mechanical and Aerospace Engineering, University of California at Davis, Davis, California, USA. Copyright 2003 by the American Geophysical Union. 0148-0227/03/2002JE001987$09.00 7 - 1
Transcript
Martian dust devils: Laboratory simulations of particle threshold
Ronald Greeley,1 Matthew R. Balme,1 James D. Iversen,2 Stephen Metzger,3
Robert Mickelson,4 Jim Phoreman,5 and Bruce White6
Received 30 September 2002; revised 21 January 2003; accepted 7 February 2003; published 17 May 2003.
[1] An apparatus has been fabricated to simulate terrestrial and Martian dust devils.Comparisons of surface pressure profiles through the vortex core generated in theapparatus with both those in natural dust devils on Earth and those inferred for Mars aresimilar and are consistent with theoretical Rankine vortex models. Experiments todetermine particle threshold under Earth ambient atmospheric pressures show that sand(particles > 60 mm in diameter) threshold is analogous to normal boundary-layer shear, inwhich the rotating winds of the vortex generate surface shear and hence lift. Lower-pressure experiments down to �65 mbar follow this trend for sand-sized particles.However, smaller particles (i.e., dust) and all particles at very low pressures (�10–60mbar) appear to be subjected to an additional lift function interpreted to result from thestrong decrease in atmospheric pressure centered beneath the vortex core. Initial resultssuggest that the wind speeds required for the entrainment of grains �2 mm in diameter(i.e., Martian dust sizes) are about half those required for entrainment by boundary layerwinds on both Earth and Mars. INDEX TERMS: 6225 Planetology: Solar System Objects: Mars;
Citation: Greeley, R., M. R. Balme, J. D. Iversen, S. Metzger, R. Mickelson, J. Phoreman, and B. White, Martian dust devils:
Laboratory simulations of particle threshold, J. Geophys. Res., 108(E5), 5041, doi:10.1029/2002JE001987, 2003.
1. Introduction
[2] Aeolian processes are potentially important in mod-ifying the surface of Mars (reviewed by Wells and Zimbel-man [1989]; Greeley et al. [1992]; Kahn et al. [1992]; Zureket al. [1992]; Martin and Zurek [1993]; and McKim [1995]).Recent results from the Mars Pathfinder (MPF) [Golombeket al., 1997, 1999; Smith et al., 1997; Greeley et al., 1999,2002], Mars Global Surveyor (MGS), and Mars Odysseymissions confirm the presence of abundant aeolian features,including duneforms seen in Mars Orbiter Camera (MOC)high-resolution images [Malin et al., 1998; Malin andEdgett, 1999, 2001; Edgett and Malin, 2000a; Cantor etal., 2001]. The morphologies and diverse albedo patterns ofthese features suggest complex histories which might reflectchanges in Mars’ climate [Thomas et al., 1999]. Moreover,because airborne dust is both an efficient absorber and
scatterer of solar radiation, it could strongly influence thethermal structure of the atmosphere [Kahn et al., 1992].[3] Lander data from Viking and MPF also demonstrate
aeolian activity. For example, at the MPF site dust devilswere observed in images [Smith and Lemmon, 1998;Metzger et al., 1999] and detected in meteorology measure-ments [Schofield et al., 1997]. Wind-eroded rocks (venti-facts) [Bridges et al., 1999], drifts, and duneforms were alsoidentified, and are considered to reflect the action of wind-blown sand [Greeley et al., 1999, 2002]. Analysis of theorientations of these features and comparisons with featuresseen from orbit suggest a change in the wind regimethrough time [Bridges et al., 1998; Kuzmin and Greeley,1999; Greeley et al., 1999].[4] The observations of dust storms, dust devils, dunes,
and other aeolian features on Mars suggest that the transportof sand and dust is important at all scales. The size of dustentrained in the atmosphere is estimated to be only a fewmicrons in diameter [Pollack et al., 1979, 1995; Smith et al.,1997; Tomasko et al., 1999] yet particles this small are verydifficult to move by simple boundary-layer wind shear[Greeley et al., 1981; Iversen and White, 1982], requiringwinds an order of magnitude greater than those measured onthe surface of Mars. For this reason, dust devils wereproposed to be an efficient mechanism for raising dust[Neubauer, 1966; Sagan and Pollack, 1969].[5] In this paper, we briefly review the characteristics of
terrestrial and Martian dust devils, describe an apparatus tosimulate dust devils, and give initial results from the
1Department of Geological Sciences, Arizona State University, Tempe,Arizona, USA.
2Aerospace Engineering and Engineering Mechanics Department, IowaState University, Ames, Iowa, USA.
3Department of Geological Sciences, University of Nevada at Reno,Reno, Nevada, USA.
4Phoenix, Arizona, USA.5NASA Ames Research Center, Moffett Field, California, USA.6Department of Mechanical and Aerospace Engineering, University of
California at Davis, Davis, California, USA.
Copyright 2003 by the American Geophysical Union.0148-0227/03/2002JE001987$09.00
7 - 1
apparatus for the entrainment of sand and dust by vorticalmotions in the atmosphere.
1.1. Terrestrial Dust Devils
[6] Dust devils have been studied for many years onEarth [Baddeley, 1860; Ives, 1947; Brooks, 1960; Tanner,1963; Sinclair, 1966; Idso, 1974]. They are vortical col-umns of air and dust that develop from an unstable, near-surface layer of air resulting from surface heating. Asoutlined by Sinclair [1969, 1973], the structure within dustdevils consists of a swirling vortex with vertical upwardflow forming the core and lateral inflow of air near thebottom of the vortex. He also observed downward flow inthe center of some dust devil cores. The tangential velocityprofile of many dust devils approximates a Rankine orLamb-Oseen vortex model [e.g., Lugt, 1983; Green,1995]. In the Rankine model, the tangential velocity ofthe main core is proportional to the radius (solid bodyrotation), and the tangential velocity of the outer vortexflow is proportional to the inverse of the radius (irrotationalvortex), with a sharp peak at the point of greatest tangentialvelocity. The more complicated Lamb-Oseen model takesinto account the frictional loss of angular momentum nearthe surface and therefore does not contain the unrealisticallysharp maximum velocity peak. Tratt et al. [2001], however,studied active dust devils in Arizona and, while they foundsome departures from the Rankine model, they agreed thatthe overall structure can be approximated by this model.Because of the simplicity of the Rankine vortex modelcompared to the Lamb-Oseen vortex, we have chosen to usethis approximation of the pressure and tangential velocitystructure in a dust devil.[7] On calm days on Earth, the vorticity source for dust
devils can be the result of convective circulation leading to‘‘auto-initiation’’ [Metzger, 1999]. Dust devils can also formas spin-off eddies from wind gusts [Hallett and Hoffer,1971], especially when gusts move across a topographicallyirregular surface [Metzger and Lancaster, 1995]. Theirformation tends to be suppressed by ambient winds greaterthan about 8 m/s, depending on the sheltering effects ofsurface roughness elements [Sinclair, 1966; Ryan and Car-roll, 1970; Metzger and Lancaster, 1995]. Once initiated,thermal plumes sustain the vortex. A low-pressure zone inthe vortex core draws in additional ground-level air carryingangular momentum. The inward moving mass of rotating airincreases in tangential velocity by quasi-conservation ofangular momentum; in this region (outside the core) tan-gential velocity is inversely proportional to the radialdistance from the axis of rotation. Inside the core therotation is approximately solid-body. The vortex commonlydevelops wind velocities whose surface shear stresses farexceed those of horizontal turbulent winds. This oftenresults in particle saltation which forms a ‘‘skirt’’ of wind-blown sand and dust at the base of the vortex, initiating theentrainment of particles from surfaces otherwise resistant toturbulent wind shear [Gillette et al., 1980].[8] Once formed, terrestrial dust devils can extend to
heights of several kilometers, enabling particles to becarried aloft and transported great distances [Ives, 1947;Hess and Spillane, 1990]. Dust devils typically have radii of�1 to 150 m [Sinclair, 1966; Schwiesow and Cupp, 1975;Hess and Spillane, 1990; Metzger, 1999] and display
maximum tangential velocities of 25 m/s [Sinclair, 1966;Kaimal and Businger, 1970; Fitzjarrald, 1973; Schwiesowand Cupp, 1975; Hess and Spillane, 1990; Metzger, 1999].The decrease in pressure at the center of dust devils canrange from 250 to >2000 Pa [Sinclair, 1966; Metzger,1999]. This suggests that the pressure excursion is about0.25–2% of the ambient pressure, which could enhance the‘‘lift’’ of fine-grained materials from the surface.[9] Field studies indicate that terrestrial dust devils can
form on a variety of surface roughnesses, including smoothplayas and rocky alluvial fans [Metzger, 1999]. In addition,local topography can influence dust devil evolution. Forexample, some dust devils observed in southern Arizonadispersed upon passage over arroyos and channel-likedepressions. Recent remote sensing observations of terres-trial dust devil tracks [Rossi, 2002] also suggest that localtopography can influence their pathways. Although dustdevils are local phenomena, their high frequency in someareas suggests that their role in the evolution of dust stormscould be significant. For example, Metzger [1999] estimatesthat a single large terrestrial dust devil can inject �2000 kgof dust into the atmosphere.
1.2. Martian Dust Devils
[10] Dust devils were suggested on Mars [Neubauer,1966; Sagan and Pollack, 1969; Sagan et al., 1971; Ryanand Luchich, 1983] and then confirmed by Thomas andGierasch [1985], who discovered �100 dust devils inViking Orbiter images. These features were as large as 1km across and extended a few kilometers above thesurface (e.g., Figure 1). More recently, Edgett and Malin[2000b] found numerous dust devils, some as high as 6km, in an area of only �60 km2. Similarly, Biener et al.[2002] identified dust devils as wide as several kilometerson MOC images. Dust devils on Mars are thought to formin a similar manner to those on Earth [Renno et al.,2000].[11] Active dust devils (�20 m across) observed in MOC
images [Edgett and Malin, 2000b] left dark tracks (Figure1b), confirming earlier speculation based on Viking imagesthat some dark streaks on Mars result from the passage ofvortices [Grant and Schultz, 1987]. Tracks vary fromrelatively straight, to curvilinear, to looping and ‘‘curlicue’’patterns. Many of these tracks are only 10s of meters across,although some are 250 m wide. As outlined by Edgett andMalin [2000b], the patterns seem to form independently ofthe terrain over which they pass, including craters, crateredterrain, and fields of sand dunes. Although this is incontradiction to some observations of terrestrial dust deviltracks [Rossi, 2002], the lack of remote sensing data of dustdevil tracks on Earth make comparison difficult. Fromvarious cross-cutting relations, the inferred dark, Martiandust devil tracks appear to become brighter with time. Thisis considered to result from an initial formation in whichbright dust is removed from the surface beneath the vortexcore, exposing a darker substrate. With time and as dustsettles from the atmosphere, the track becomes mantled andhence brighter.[12] Dust devils have also been detected from landers on
Mars and analyzed [Ringrose and Zarnecki, 2002]. Forexample, the MPF meteorology data suggest that numer-ous atmospheric vortices passed over the lander [Schofield
7 - 2 GREELEY ET AL.: MARTIAN DUST DEVILS
et al., 1997], from which pressure excursions of 1–5 Pawere measured (at a height �10 cm above the Marssurface [Seiff et al., 1997]) equating to �0.2–1.0% ofambient pressure. In addition, the MPF camera captured atleast five dust devils which developed in rapid succession[Smith and Lemmon, 1999; Metzger et al., 1998a, 1998b,2000]. These results occurred during a relatively calmperiod on Mars (Ls = 143�), when maximum surface
winds were no more than about �10 m/s (Schofield etal., 1997), far less than boundary-layer threshold for themovement of sand and dust, and strongly suggesting thatdust devils are an effective mechanism for particle entrain-ment [Metzger, 2001].[13] Wind speeds measured by the Viking landers and
MPF never reached sufficient values to entrain the fine dustseen in the atmosphere. Consequently, numerous othermechanisms have been proposed to raise dust on Mars(reviewed by Greeley et al. [1992]), including: 1) dustfountaining by gas desorbtion, 2) impact by sand saltationto ‘‘kick up’’ dust, 3) aggregation of particles to form‘‘clumps’’ that are more easily moved, and 4) entrainmentby dust devils. The dust devil hypothesis is attractive,particularly given their apparent high frequency on Mars[Thomas and Gierasch, 1985; Edgett and Malin, 2000b;Beiner et al., 2002]. Yet, despite the potential importance ofdust devils in understanding the aeolian regime on Mars,little is known about their mechanisms for setting dust intomotion.
2. Approach
[14] Planetary research often requires a multiprongedapproach, including numerical modeling, laboratory simu-lations, and field studies. Each technique has unique attri-butes: field investigations involve full-scale events, but thecomplexities of natural processes often do not enableisolation of the critical variables for analysis. Moreover,the influence of some parameters for application to Mars,such as the low atmospheric density, cannot be assessed infield work on Earth. Numerical and analytical studies enablesome of these variables to be assessed, but computer modelsare often over simplified. Laboratory simulations, the pri-mary approach used here, have the advantage that experi-ments can be run under controlled conditions in whichcritical variables can be isolated for analysis, and in whichcertain environmental conditions can be simulated for Mars,such as the low atmospheric surface pressure. Finally, itshould be stressed that our methodology focuses on howdust devils entrain material on Earth and Mars rather thanhow dust devils are formed.
2.1. ASU Vortex Generator
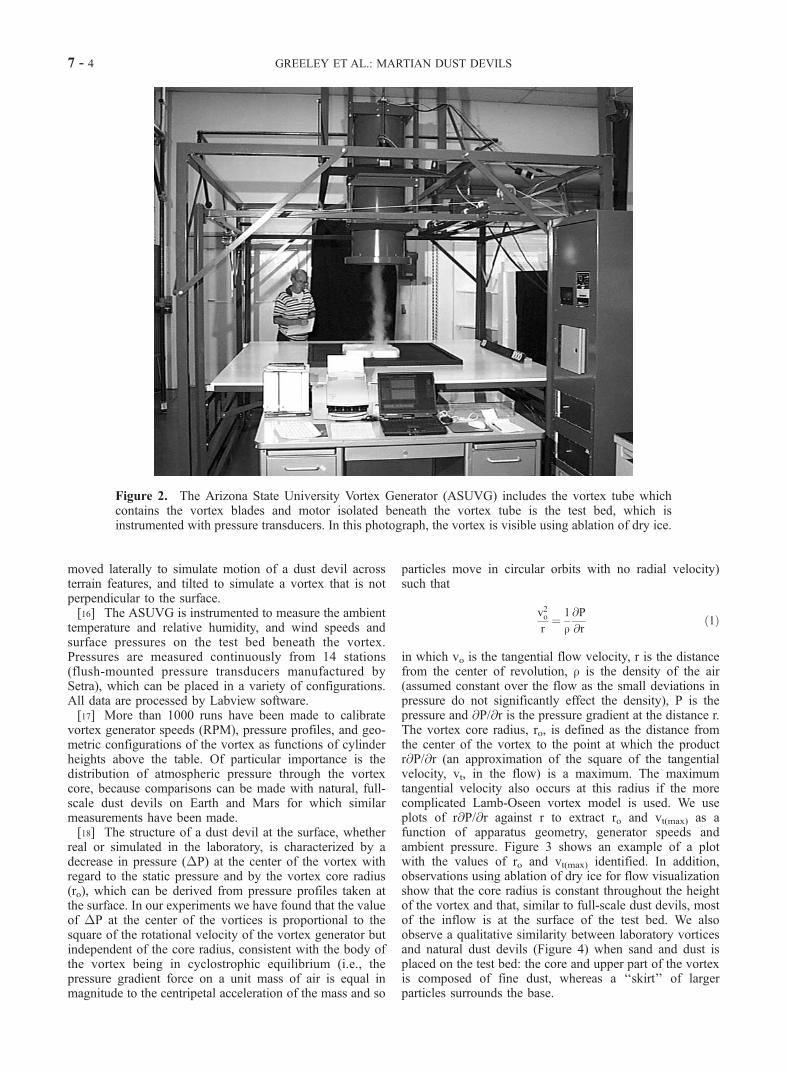
[15] The Arizona State University Vortex Generator(ASUVG) [Greeley et al., 2001; Balme et al., 2001, 2002]was fabricated to simulate dust devils in the laboratory. Itconsists of three components, the frame, the vortex gener-ator, and the test table (Figure 2). The apparatus can bedismantled for transport into the field for conducting experi-ments on natural surfaces and for use in a low-pressurechamber at NASA Ames Research Center for tests underMartian atmospheric conditions. The vortex generatorincludes a cylinder (45 cm in diameter by 1.3 m long) witha ‘‘bell mouth’’ to alleviate boundary effects at the edge ofthe cylinder, a motor drive, and a fan blade system. Thegenerator is mounted to the frame so that it can be loweredor raised above the test table, enabling the geometry of thesimulated dust devil to be varied. The table is 2.4 by 2.4 m,mounted independent of the frame which holds the vortexgenerator so that potential motor vibrations are isolatedfrom the test bed. The table can be raised or lowered,
Figure 1. (a) This active dust devil was imaged by theMars Observer Camera; the shadow cast by the dust liftedfrom the surface indicates the relatively uniform diameter ofthe vortex core (NASA image PIA 03223) from MalinSpace Science Systems. (b) These dark streaks areconsidered to be tracks on the surface left by the passageof active dust devils (NASA image PIA 02376, Malin SpaceScience Systems).
GREELEY ET AL.: MARTIAN DUST DEVILS 7 - 3
moved laterally to simulate motion of a dust devil acrossterrain features, and tilted to simulate a vortex that is notperpendicular to the surface.[16] The ASUVG is instrumented to measure the ambient
temperature and relative humidity, and wind speeds andsurface pressures on the test bed beneath the vortex.Pressures are measured continuously from 14 stations(flush-mounted pressure transducers manufactured bySetra), which can be placed in a variety of configurations.All data are processed by Labview software.[17] More than 1000 runs have been made to calibrate
vortex generator speeds (RPM), pressure profiles, and geo-metric configurations of the vortex as functions of cylinderheights above the table. Of particular importance is thedistribution of atmospheric pressure through the vortexcore, because comparisons can be made with natural, full-scale dust devils on Earth and Mars for which similarmeasurements have been made.[18] The structure of a dust devil at the surface, whether
real or simulated in the laboratory, is characterized by adecrease in pressure (�P) at the center of the vortex withregard to the static pressure and by the vortex core radius(ro), which can be derived from pressure profiles taken atthe surface. In our experiments we have found that the valueof �P at the center of the vortices is proportional to thesquare of the rotational velocity of the vortex generator butindependent of the core radius, consistent with the body ofthe vortex being in cyclostrophic equilibrium (i.e., thepressure gradient force on a unit mass of air is equal inmagnitude to the centripetal acceleration of the mass and so
particles move in circular orbits with no radial velocity)such that
v2or¼ 1
r@P
@rð1Þ
in which vo is the tangential flow velocity, r is the distancefrom the center of revolution, r is the density of the air(assumed constant over the flow as the small deviations inpressure do not significantly effect the density), P is thepressure and @P/@r is the pressure gradient at the distance r.The vortex core radius, ro, is defined as the distance fromthe center of the vortex to the point at which the productr@P/@r (an approximation of the square of the tangentialvelocity, vt, in the flow) is a maximum. The maximumtangential velocity also occurs at this radius if the morecomplicated Lamb-Oseen vortex model is used. We useplots of r@P/@r against r to extract ro and vt(max) as afunction of apparatus geometry, generator speeds andambient pressure. Figure 3 shows an example of a plotwith the values of ro and vt(max) identified. In addition,observations using ablation of dry ice for flow visualizationshow that the core radius is constant throughout the heightof the vortex and that, similar to full-scale dust devils, mostof the inflow is at the surface of the test bed. We alsoobserve a qualitative similarity between laboratory vorticesand natural dust devils (Figure 4) when sand and dust isplaced on the test bed: the core and upper part of the vortexis composed of fine dust, whereas a ‘‘skirt’’ of largerparticles surrounds the base.
Figure 2. The Arizona State University Vortex Generator (ASUVG) includes the vortex tube whichcontains the vortex blades and motor isolated beneath the vortex tube is the test bed, which isinstrumented with pressure transducers. In this photograph, the vortex is visible using ablation of dry ice.
7 - 4 GREELEY ET AL.: MARTIAN DUST DEVILS
[19] Experiments at Mars equivalent pressure (i.e., 10mbar air at Earth ambient temperature has the same fluiddensity as �6 mbar CO2 at Mars mean surface temperature)using high vortex generator speeds show similitude withone bar (i.e., ‘‘Earth’’) experiments running at lower speedsand the pressure profiles are very similar in shape to full-scale dust devils on Earth and Mars (Figure 5). In additionto the dependence of �P on the square of generator speed,the calculated peak tangential velocity vt(max) is directlyproportional to the vortex generator speed.
[20] The change in �P and vt(max) with decreasing ambi-ent pressure is nonlinear; below 100 mbar the vortex gen-erator must be run at increasingly higher speeds to generatethe same values of �P or vt(max). Vortex core radii observedat low atmospheric pressures are very similar to thoseobserved at one atmosphere, indicating that, for fixedapparatus geometry, the vortex core radius is a constantbut �P depends upon both atmospheric pressure and vortexgenerator rotational velocity.[21] On the basis of the similarity of ASUVG vortices and
natural dust devils (Figure 4), the similitude of the �P
Figure 3. Typical plot of calculated vt (vt2 = r/r.@P/@r) as
a function of distance from the center of revolution in thevortex. These plots allow an estimate of the highesttangential velocity in the flow, Vt(max), and the radius ofthe vortex core, ro. Error bars reflect standard deviation ofthe measurement of pressure gradient.
Figure 4. Comparison of a) particle entraining laboratory vortex simulation; b) terrestrial dust devil; c)laboratory vortex using sublimation of dry ice for visualization. Note the clear core with constant radiusin ‘‘c’’ and the well-defined dust- loaded core in the laboratory image ‘‘a’’ and the similar structure in thenatural dust devil. The ‘‘saltation skirt’’ zone is indicated by an arrow in each case.
Figure 5. Dimensionless pressure profile for Earth, Mars,and laboratory-scale vortices; r0 = 0 is the approximatecenter of the vortex core. The profiles are scaled usingnondimensional parameters �P0 and r0 in which �P0 = 1 isdefined as the depth of the pressure well and r0 = 1 isdefined as the radius at which the pressure deficit is one halfof the total �P.
GREELEY ET AL.: MARTIAN DUST DEVILS 7 - 5
(Figure 5), and the calibrations of the vortex speeds, wewere able to initiate experiments to determine particlethreshold by vortices.
3. Particle Threshold by Vortices
[22] Relatively few measurements of particle thresholdhave been made in field studies of dust devils [Metzger,1999] or previous laboratory simulations [Hsu and Fattahi,1976]. Although limited, results from these measurementsshow that vortex motions can lift both sand and dust, and
that vortex motion appears to be more efficient than simpleboundary layer winds for lifting dust [Greeley et al., 1977;Greeley and Iversen, 1985].[23] There are at least two mechanisms by which dust
devils lift particles into the atmosphere. The first is theupward component of force caused by frictional drag ofwinds moving over the bed of particles, which is analogousto the wind shear that lifts particles in simple boundary layerwinds [Bagnold, 1941]. The second mechanism, which werefer to as the ‘‘�P effect’’ is the decrease in pressure foundat the center of dust devils (Figure 5) which leads to a lift onthe particles as the vortex sweeps across the surface.Opposing these effects are the weight of the particles andinter-particle cohesion (Figure 6).[24] The lifting effect of the wind shear is relatively easy
to derive if the velocity of the vortex is known, as it dependson the greatest wind velocity in the flow. This effect hasbeen studied extensively in boundary layer wind tunnels forboth Earth and Mars conditions [e.g., Iversen et al., 1973;Greeley et al., 1977, 1981]. The lifting effect of the pressuredecrease at the surface is less easy to quantify because itdepends on unknown factors such as how deeply the �Peffect propagates into the bed of particles and how quicklythe pressure deficit is applied.[25] Our measurements of �P as a function of vortex
speed, vortex diameter, and atmospheric pressure quantifythe �P lift available for threshold. These ‘‘calibration’’measurements can then be applied to the threshold experi-
Figure 6. Forces on a particle at the point of movementbeneath an atmospheric vortex.
Walnut shells 212 1.3 X X X X X X X X X X X X X X X XWalnut shells 311 1.3 X X X X X X X X X XWalnut shells 393 1.3 X X XWalnut shells 527 1.3 X X XWalnut shells 660 1.3 X X XWalnut shells 880 1.3 X X X X X X X X X X X X X X X X X X X X X XWalnut shells 1097 1.3 X X XWalnut shells 1299 1.3 X X XWalnut shells 1862 1.3 X X X X X X X X X X X X X X XSilica sand 212 2.7 X X XSilica sand 311 2.7 X X XSilica sand 393 2.7 X X X X X X X X X X X X X X X X X X X X X X X X X X X XSilica sand 527 2.7 X X XSilica sand 660 2.7 X X XChromite 230 4.8 X X X X X X X X X X X X X X X X X X X X X X X X X X X X X X
Alum. oxide 311 3.8 X X X X X X X X X X X X X X X X X X X X X X X X X X X X X XAlum. oxide 527 3.8 X X XAlum. oxide 660 3.8 X X XAlum. oxide 1097 3.8 X X XAlum. oxide 1299 3.8 X X XSteel grit 212 7.6 X X XSteel grit 311 7.6 X X XSteel grit 768 7.6 X X X X X X X XSteel grit 1097 7.6 X X X X X X X X XSilica flour 8 2.5 X X X X X X X X X X X X X X X X X X X X X X X X X X XSilica beads 35 2.5 X X X X X X X X X X X X X X X X XSilica beads 42 2.5 X X X X X X X X X X X X X X X X X X X X X X X XSilica beads 59 2.5 X X XSilica beads 86 2.5 X X X X X X X X X X X X X X X X X X X X X X X X X XCarb. R. clay 2 2.6 X X X X X X X X X X X X X X
a‘‘X’’ represents a completed threshold test. The header of each column describes the pressure and the vortex radius (1 = 7.5 cm, 2 = 3.5 cm, 3 = 2 cm) atwhich the tests were performed.
7 - 6 GREELEY ET AL.: MARTIAN DUST DEVILS
ments in order to assess the importance of �P versus windshear as functions of particle density, particle diameter,atmospheric pressure, and surface roughness.[26] We build on the results of Greeley et al. [1981] and
Greeley and Iversen [1985] who first attempted to under-stand the threshold of particles subjected to vortices. Theyconsidered the force balance of a particle at the point ofvortex threshold:
k1�Pþ k2t ¼ k3rpgDp þ k4sp ð2Þ
in which t is the shear stress caused by the swirling wind, rpis the density of the particles, g is gravity, Dp is the particlediameter, and sp the inter-particle cohesive stress. k1–4 areconstants indicating the relative importance of the stresses.Our threshold experiments were run to quantify k1–4 usingvarious particle densities and diameters (Table 1). For eachmaterial, three types of threshold were recorded (firstmovement, intermittent saltation, and continuous saltation;continuous saltation is the result used here). Particlethreshold was detected using a television camera viewingthe test bed illuminated by a collimated 1000 W light beamoriented perpendicular to the camera. This enabled themoving particles to be visible as ‘‘fireflies’’ (bright spots)against a dark background, which provided reasonablyconsistent measurements of threshold.[27] Test materials included walnut shells (rp, 1300
kgm�3), silica (rp, 2500–2700 kgm�3), aluminum oxide(rp, 3800 kgm�3), chromite (rp, 4800 kgm�3), steel grit (rp,7600 kgm�3) and Carbondale Red Clay (rp, 2600 kgm�3).These particle densities follow a parametric hierarchy andenable an approximation of the difference in gravity
Figure 7. Earth ambient pressure vortex threshold results for all materials as a function of the thresholdparameter, �. The threshold values are approximately linear with increasing particle size for sands andthere are differences in this region among the data for different vortex core radii. The data become morecompressed for the smaller particles and there is an increase in the maximum tangential velocity requiredfor threshold.
Figure 8. Earth ambient pressure threshold results for 3.5cm radius vortex core for all materials with a density >2000kgm�3 as a function of the threshold parameter, � plottedagainst the empirical boundary layer threshold expressionfrom Iversen et al. [1976a, 1976b], Greeley and Iversen[1985], and Iversen et al. [1987]. The data with the lowestvalue of � (circled) are for the smallest particles (2 mmCarbondale Red Clay and 8 mm silica flour) and plot belowthe boundary layer threshold expression.
GREELEY ET AL.: MARTIAN DUST DEVILS 7 - 7
between Earth and Mars (i.e., for lift-off during particlethreshold, the walnut shells are of lower density, and hence‘‘easier’’ to lift due to less weight, as would be the case inthe lower gravity on Mars). Particle sizes ranged from 2 to1850 microns in diameter, similar to those used in previousthreshold tests under simple boundary-layer conditions[e.g., Iversen et al., 1976a, 1976b; Greeley et al., 1977,1981; Iversen and White, 1982] and enabled comparisonswith the previous experiments. Particles <70 mm in sizewere aerodynamically settled onto the test bed to form alayer �1 mm thick. The method used to emplace such airfall beds is similar to that of White et al. [1997] and Greeleyet al. [2000] and uses a small bucket of test material mixedwith sand. The bucket has a compressed air input near thebase and a screen over the opening with mesh size too smallfor the sand to pass through. The whole apparatus ispositioned within a ‘‘tent’’ to contain the dust. When com-pressed air is injected, the sand and dust are agitated and acloud of dust rises from the bucket to fill the tent and, withtime, settles from suspension to form a smooth air fall bed.Beds of larger particles were placed into a circular recess�1.2 m in diameter and �1.5 cm depth in the test bed andleveled to form a smooth surface.
3.1. Vortex Threshold at Earth Ambient Pressure
[28] We present results in terms of calculated maximumvortex tangential velocity at threshold and a thresholdparameter, �, defined as
ison with boundary layer thresholds [Iversen et al., 1976a,1976b; Greeley et al., 1977, 1981; Iversen and White, 1982].Results for Earth atmospheric pressure (Figure 7) show a
linear trend between threshold velocity and � for sand-sizeparticles (particle size > 60 mm and therefore � greater than�1.5 m/s), and an increase in velocity for smaller particles,similar to the relation seen for simple boundary layerconditions. The results from three experiments with differentvortex core radii (achieved using different geometries of theASUVG; the higher the cylinder above the test bed, thenarrower the vortex formed) each showed linear trendsbetween threshold velocity and � but with different slopes.This result is inconsistent with �P lift being a dominantmechanism for particles > 60 mm diameter because�P in ourcalibration experiments was independent of vortex radius.Thus we infer that wind shear in the vortex is the dominantmechanism for sand sized particles at one atmospherepressure; therefore k1 � k2 and k4 � k3 (because themagnitude of the interparticle cohesion is much less thanthe weight of sand sized particles) and in this case, fromequation (2),
k2t ¼ k3rpgDp ð3Þ
which is directly analogous to simple boundary-layerthreshold.[29] In simple boundary-layer threshold theory
t ¼ A2rpgDp ð4Þ
in which A is Bagnold’s coefficient, which can beapproximated as 0.11 for sand size particles at Earth pressure[Iversen et al., 1976a]. However, for small particles, A is not
Figure 9. Vortex threshold test results for 3.5 cm core radius vortex as a function of atmosphericpressure. Error bars represent measurement uncertainty and are marked only for the larger, denserparticles. Error bars for the other data are omitted in the sake of clarity but are typically <5% of thethreshold value with the lowest pressure data having uncertainties up to �8%.
7 - 8 GREELEY ET AL.: MARTIAN DUST DEVILS
fixed because it is a function of particle size (due toincreasing cohesion for progressively smaller particles) andparticle friction Reynolds number, B, defined as
B ¼ u*Dp=n ð5Þ
where u*is the friction velocity (defined as u
*=
ffiffiffiffiffiffiffit=r
p) and
n is the kinematic viscosity of the atmosphere. Thus thesimple approximation for A can only be extended to dust-size particles and different atmospheric conditions ifnormalized for DP and B. Such an empirical expression forA has been derived from extensive boundary-layer experi-ments [Iversen et al., 1976a, 1976b; Greeley et al., 1977,1981; Iversen and White, 1982] which resulted in theequations
A ¼ 0:2661þ 5:5 10�5=rpgD
2p
1þ 2:123B
!1=2
B 0:22
ð6aÞ
A ¼ 0:108þ 0:0323=B� 0:00173=B2� �� 1þ 5:5 10�5=rpgD
2p
� 1=20:22 B 10
ð6bÞ
A ¼ 0:11 B � 10 ð6cÞ
These equations are transcendental in u*and can be solved
iteratively to give an expression for u*as a function of �
[Iversen et al., 1976b]. The constants included aredimensionless except for 5.5 10�5 which has units kgs�2.[30] Because interpretation of our data suggest that vortex
and boundary layer threshold are equivalent for sandparticles, we can plot the vortex data (for a given vortexcore radius) over this empirical boundary layer curve (6) byapplying a fixed scaling factor to the vortex threshold datato fit the sand-size vortex data to the sand-size boundary-layer expression. Then, if the particle entraining mecha-nisms of both the vortex and the normal boundary-layer arethe same, the curves should be similar for all particle sizesand densities. For example, Figure 8 shows vortex thresh-olds for all particles with density > 2000 kgm�3 (less denseparticles diverge from the boundary-layer approximation forthe smaller sand particles [Greeley and Iversen, 1985, p. 77])plotted together with the empirical boundary-layer thresh-old curve (6). Figure 8 shows that, for the smallest values of�, the boundary-layer approximation ‘‘over corrects’’ thevortex data. In fact, where the empirical boundary-layerdeviates most from the vortex data in Figure 8 (for thesmallest particles with the lowest value of �) the differencereduces the u
*needed for particle movement by almost
80%. This supports the concept of an additional liftingmechanism in vortex threshold, which we infer to be theadditional �P effect.
Figure 10. Low-pressure vortex threshold test results for particle with densities >2000 kgm�3 with a3.5 cm core radius vortex as a function of threshold parameter, �. Each set of data is compared to anempirically derived normal boundary layer threshold expression, corrected for particle size and particlefriction Reynolds number. The vortex threshold data are scaled to fit the boundary layer data in the linearregion using the factor 0.12. Error bars are derived from initial determination of vortex generator RPM atthreshold.
GREELEY ET AL.: MARTIAN DUST DEVILS 7 - 9
[31] The Earth atmosphere data indicate that threshold fordust is more easily obtained by vortical atmosphericmotions than a boundary-layer wind. This has beenobserved in natural dust devils (i.e., entrainment of dustunder relatively calm boundary layer wind flow) but ourresult is the first time that the process has been quantified.
3.2. Vortex Threshold at Low Pressures
[32] The vortex threshold is plotted as a function ofatmospheric pressure in Figure 9. Data indicate a nonlinearrelationship in which there is relatively little change in slopebetween 1000 and 100 mbar with a much larger increasebetween 100 and 10 mbar. This nonlinear dependence ofthreshold on pressure suggests that even small increases inatmospheric pressure can substantially facilitate entrainmentof particles. This result suggests that dust devils wouldentrain material more easily in the regions of Mars withgreatest surface pressure. Thus we suggest that dust devilsmight be more common in the lowest regions of Mars, allother factors being equal.[33] Following the method used for the Earth (one bar)
data, we graphed the low-pressure threshold results forparticles with rp > 2000 kgm�3 as a function of � forcomparisons with boundary-layer threshold. We applied ascaling constant to the tangential velocity at threshold foreach value of atmospheric pressure and overlaid the resultsso that the data for sands fit the boundary-layer expression(Figure 10). The scaling factor used was 0.12; however, itis noted that for pressures <65 mbar there were no data toplot directly onto the linear part of the boundary layerexpression.[34] Consistent with the results of the one-bar experi-
ments, the data for low atmospheric pressure suggest thatvortices are more efficient in entraining dust than boundarylayer winds. In addition, the vortex threshold data for theMars case are lower than the boundary layer curve, suggest-ing that at very low pressure, vortices are far more efficientthan boundary layer winds at entraining particles of allsizes. Note, however, that threshold could not be achievedfor large, dense particles at the 10 mbar Mars equivalentatmosphere because of insufficient speed by the vortexgenerator, and the best-fit scaling was extrapolated fromthe experiments run at higher pressures.
4. Conclusions
[35] The ASU Vortex Generator appears to produce validsimulation of dust devils demonstrated by near-surfacepressure profiles that are similar to those for terrestrial dustdevils measured in the field and those measured on Mars.Moreover, the calculated tangential velocity structure of thelaboratory scale vortices is similar to field measurementsand theoretical Rankine vortex models.[36] Our experiments suggest that vortex threshold is
directly analogous to normal boundary layer shear forsand-size particles at Earth (1 bar) pressures. Thus, tounderstand the sand-lifting power of a dust devil, we needknowledge of the velocity structure within the vortex. Incontrast, fine dust is more easily moved by a vortex thanwhen subjected to boundary-layer winds. We suggest thatthe decrease in atmospheric pressure at the center of thevortex provides an additional lift function. When we extend
the experiments to atmospheric pressures as low as 65 mbar,we find similar results to Earth (1 bar) conditions. Althoughour data also suggest that vortex threshold becomes evenmore efficient at lower pressure, this assertion is based upona less rigorous extrapolation of results from the experimentsrun between 1020 and 65 mbar.[37] We conclude that for all pressures, the�P effect (i.e.,
the decrease in atmospheric pressure under the vortex cove)is the most likely mechanism for enhanced vortex lift. If ourscaling factor of 0.12 is appropriate for the 10 mbar data, weestimate that 2 mm dust at 10 mbar atmospheric pressurewill be entrained by a dust devil with tangential wind speedsof around 20–30 m/s. On Mars, this speed would bedecreased by the lower gravity and would be substantiallyless than the boundary layer wind speeds to entrain suchparticles, which are > 100 m/s [Greeley et al., 1992].Experiments suggest that the wind speeds necessary forentrainment of very small (�2 mm) particles by Martian dustdevils are about 20% of those required for entrainment byboundary-layer winds.
[38] Acknowledgments. We thank Gary Beardmore and Diana Bran-son for assistance in running experiments at Arizona State University,Gabriel Zavala-Diaz for assistance at NASA-Ames, and Stephanie Holadayfor aid in preparing the manuscript. We also thank Dallas Kingsbury,Laboratory Manager, ASU Civil and Environmental Engineering, forsubstantial assistance in writing appropriate code for LabView. This workwas supported by the National Aeronautics and Space Administrationthrough the Planetary Geology and Geophysics Program and the MarsExploration Program.
ReferencesBaddeley, P. F. H., Whirlwinds and Dust Storms of India, Bell and Daldey,London, 1860.
Bagnold, R. A., The Physics of Windblown Sand and Desert Dunes,Methuen, New York, 1941.
Balme, M. R., R. Greeley, B. Mickelson, J. Iversen, G. Beardmore, andS. Metzger, A laboratory scale vortex generator for simulation of Mar-tian dust devils, Eos Trans. AGU, 82(47), Fall Meet. Suppl., abstractP31A-0542, 2001.
Balme, M. R., R. Greeley, B. Mickelson, J. Iversen, G. Beardmore, andD. Branson, Dust devils on Mars: Results from thresholds tests using avortex generator, Lunar Planet. Sci. [CD-ROM], XXXIII, abstract 1048,2002.
Biener, K. K., P. E. Geissler, A. S. McEwen, and C. Leovy, Observations ofdust devils in MOC wide angle camera images, Lunar Planet. Sci. [CD-ROM], XXXIII, abstract 2004, 2002.
Bridges, N. T., R. Greeley, A. F. C. Haldemann, K. E. Herkenhoff,M. Kraft, T. J. Parker, and A. W. Ward, Orientation of aeolian flutes atthe Mars Pathfinder landing site, Lunar Planet. Sci. [CD-ROM], XXIX,abstract 1530, 1998.
Bridges, N. T., R. Greeley, A. F. C. Haldemann, K. E. Herkenhoff,M. Kraft, T. J. Parker, and A. W. Ward, Ventifacts at the Pathfinderlanding site, J. Geophys. Res., 104(E4), 8595–8615, 1999.
Brooks, H. B., Rotation of dust devils, J. Meteorol., 17, 84–86, 1960.Cantor, B. A., P. B. James, M. Caplinger, and M. J. Wolff, Martian duststorms: 1999 Mars Orbiter Camera observations, J. Geophys. Res., 106,23,653–23,689, 2001.
Edgett, K. S., and M. C. Malin, New views of Mars eolian activity, materi-als, and surface properties: Three vignettes from the Mars Global Sur-veyor Orbiter camera, J. Geophys. Res., 105, 1623–1650, 2000a.
Edgett, K. S., and M. C. Malin, Martian dust raising and surface albedocontrols: Thin, dark (and sometimes bright) streaks and dust devils inMGS high-resolution images, Lunar Planet. Sci. [CD-ROM], XXXIII,abstract 1073, 2000b.
Fitzjarrald, D. E., A field investigation of dust devils, J. Appl. Meteorol.,12, 808–813, 1973.
Gillette, D. A., J. Adams, A. Endo, D. Smith, and R. Kihl, Thresholdvelocities for input of soil particles into the air by desert soils, J. Geophys.Res., 85, 5621–5630, 1980.
Golombek, M. P., and Mars Pathfinder Team, Overview of the Mars Path-finder mission: Launch through landing surface operations, data sets andscience results, J. Geophys. Res., 104, 8523–8554, 1999.
7 - 10 GREELEY ET AL.: MARTIAN DUST DEVILS
Golombek, P. M., et al., Overview of the Mars Pathfinder mission andassessment of landing site predictions, Science, 278, 1743–1748,1997.
Grant, J. A., and P. A. Schultz, Possible tornado-like tracks on Mars,Science, 237, 883–885, 1987.
Greeley, R., and J. Iversen, Wind as a Geologic Process on Earth, Mars,Venus and Titan, Cambridge Univ. Press, New York, 1985.
Greeley, R., B. R. White, J. B. Pollack, J. D. Iversen, and R. N. Leach, Duststorms on Mars: Considerations and simulations, NASA Tech. Memo.,78423, 1977.
Greeley, R., B. R. White, J. B. Pollack, J. D. Iversen, and R. N. Leach, Duststorms on Mars: Considerations and simulations, Spec. Pap. Geol. Soc.Am., 186, 101–121, 1981.
Greeley, R., N. Lancaster, S. Lee, and P. Thomas, Martian Aeolian pro-cesses, sediments and features, in Mars, edited by H. H. Kieffer et al.,pp. 730–766, Univ. of Ariz. Press, Tucson, 1992.
Greeley, R., M. Kraft, R. Sullivan, G. Wilson, N. Bridges, K. Herkenhoff,R. O. Kuzmin, M. Malin, and W. Ward, Aeolian features and processes atthe Mars Pathfinder landing site, J. Geophys. Res., 104, 8573–8584,1999.
Greeley, R., G. Wilson, R. Coquilla, B. White, and B. Haberle, Windblowndust on Mars: Laboratory simulations of flux as a function of surfaceroughness, Planet. Space Sci., 48, 1349–1355, 2000.
Greeley, R., J. D. Iversen, G. Beardmore, B. Mickelson, and S. M.Metzger, Martian dust devils: Laboratory simulations, Lunar Planet.Sci. [CD-ROM], XXXII, abstract 1888, 2001.
Greeley, R., N. T. Bridges, R. O. Kuzmin, and J. E. Laity, Terrestrial analogsto wind-related features at the Viking and Pathfinder landing sites onMars, J. Geophys. Res., 107(E1), 5005, doi:10.1029/2000JE001481,2002.
Green, S. I., Fluid Vortices, 879 pp., Kluwer Acad., Norwell, Mass., 1995.Hallett, J., and T. Hoffer, Dust devil systems, Weather, 26, 247–250,1971.
Hess, G. D., and K. T. Spillane, Characteristics of dust devils in Australia,J. Appl. Meteorol., 29, 498–507, 1990.
Hsu, C. T., and B. Fattahi, Mechanism of tornado funnel formation, Phys.Fluids, 19, 1853–1857, 1976.
Idso, S. B., Tornado or dust devil, the enigma of desert whirlwinds, Am.Sci., 62, 530–541, 1974.
Iversen, J. D., and B. White, Saltation threshold on Earth Mars and Venus,Sedimentology, 29, 111–119, 1982.
Iversen, J. D., R. Greeley, J. B. Pollack, and B. R. White, Simulation ofMartian Aeolian phenomena in the atmospheric wind tunnel, NASA Spec.Publ., NASA SP336, 1910213, 1973.
Iversen, J. D., R. Greeley, and J. B. Pollack, Windblown dust on Earth Marsand Venus, J. Atmos. Sci., 33, 2425–2429, 1976a.
Iversen, J. D., J. B. Pollack, R. Greeley, and B. White, Saltation thresholdon Mars, the effect of interparticle force, surface roughness and lowatmospheric density, Icarus, 9, 382–393, 1976b.
Iversen, J. D., R. Greeley, J. B. Marshall, and J. B. Pollack, Aeolian salta-tion threshold: The effect of density ratio, Sedimentology, 34, 699–706,1987.
Ives, R. L., Behavior of dust devils, Bull. Am. Meteorol. Soc., 28, 168–174,1947.
Kahn, R. A., T. Z. Martin, R. W. Zurek, and S. W. Lee, The Martian dustcycle, in Mars, edited by H. H. Kieffer et al., pp. 1017–1055, Univ. ofAriz. Press, Tucson, 1992.
Kaimul, J. C., and J. A. Bussinger, Case studies of a convective plume anda dust devil, J. Appl. Meteorol., 9, 612–620, 1970.
Kuzmin, R. O., and R. Greeley, Local and regional aeolian geomorphologyat the Mars Pathfinder landing site area: Evidence for paleowind regime,Lunar Planet. Sci. [CD-ROM], XXX, abstract 1415, 1999.
Lugt, H. J., Vortex Flow in Nature and Technology, John Wiley, New York,1983.
Malin, M. C., and K. S. Edgett, MGS MOC the first year: Geomorphicprocesses and landforms, Lunar Planet. Sci. [CD-ROM], XXX, abstract1028, 1999.
Malin, M. C., and K. S. Edgett, Mars Global Surveyor Mars Orbiter Cam-era: Interplanetary cruise through primary mission, J. Geophys. Res., 106,23,429–23,570, 2001.
Malin, M. C., et al., Early views of the Martian surface from the MarsOrbiter Camera of Mars Global Surveyor, Science, 279, 1681–1685,1998.
Martin, L. J., and R. W. Zurek, An analysis of the history of dust activity onMars, J. Geophys. Res., 98, 3221–3246, 1993.
McKim, R., The dust storms of Mars, J. Br. Astron. Assoc., 106, 185–200,1995.
Metzger, S. M., Dust devils as aeolian transport mechanisms in southernNevada and in the Mars Pathfinder landing site, Ph.D. thesis, Univ. ofNev., Reno, 1999.
Metzger, S. M., Recent advances in understanding dust devil processes andsediment flux on Earth and Mars, Lunar Planet. Sci. [CD-ROM], XXXII,abstract 2157, 2001.
Metzger, S. M., and N. Lancaster, Dust devil activity in a playa basin,southern Nevada, Eos Trans. AGU, 76 (46), Fall Meet. Suppl., F66, 1995.
Metzger, S. M., J. R. Carr, J. R. Johnson, M. Lemmon, and T. J. Parker,Dust devil vortices identified in the Mars Pathfinder camera images(abstract), Bull. Am. Astron. Soc., 30, 1023, 1998a.
Metzger, S. M., J. R. Carr, J. R. Johnson, M. Lemmon, and T. J. Parker,Dust devil vortices identified in the Mars Pathfinder camera images-Ex-ploring the land-atmosphere link, Eos Trans. AGU, 79, F537, Fall Meet.Suppl., 1998b.
Metzger, S. M., J. R. Johnson, J. R. Carr, T. J. Parker, and M. Lemmon,Dust devil vortices seen by the Mars Pathfinder Camera, Geophys. Res.Lett., 26, 2781–2784, 1999.
Metzger, S. M., J. R. Carr, J. R. Johnson, T. J. Parker, and M. Lemmon,Techniques for identifying dust devils in Mars Pathfinder images, IEEETrans. Geosci. Remote, 38, 870–876, 2000.
Neubauer, F. M., Thermal convection in the Martian atmosphere, J. Geo-phys. Res., 71, 2419–2426, 1966.
Pollack, J. B., D. S. Colburn, F. M. Flasar, R. Kahn, C. E. Carlston, andD. Pidek, Properties and effects of dust particles suspended in theMartian atmosphere, J. Geophys. Res., 84, 2929–2945, 1979.
Pollack, J. B., M. E. Ockert-Bell, and M. K. Shepard, Viking lander imageanalysis of Martian atmospheric dust, J. Geophys. Res., 100, 5235–5250,1995.
Renno, N. O., A. A. Nash, J. Lunine, and J. Murphy, Martian and terrestrialdust devils: Test of a scaling theory using Pathfinder data, J. Geophys.Res., 105(E1), 1859–1865, 2000.
Ringrose, T. J., and J. C. Zarnecki, Martian and terrestrial dust devils, LunarPlanet. Sci. [CD-ROM], XXXIII, abstract 1183, 2002.
Rossi, A. P., Possible dust devils tracks detected in Tenere Desert, (Niger):An analogue to Mars, Lunar Planet. Sci. [CD-ROM], XXXIII, abstract1307, 2002.
Ryan, J. A., and J. J. Carroll, Dust devils wind velocities: Mature state,J. Geophys. Res., 75, 531–541, 1970.
Ryan, J. A., and R. D. Luchich, Possible dust devil vortices on Mars,J. Geophys. Res., 88, 11,005–11,011, 1983.
Sagan, C., and J. B. Pollack, Windblown dust on Mars, Nature, 223, 791–794, 1969.
Sagan, C., J. Veverka, and P. Gierasch, Observational consequences ofMartian wind regions, Icarus, 22, 24–47, 1971.
Schiewsow, R. L., and R. E. Cupp, Remote Doppler velocity measurementsof atmospheric dust devil vortices, J. Appl. Opt., 15, 1–2, 1975.
Schofield, J. T., J. R. Barnes, D. Crisp, R. M. Haberle, S. Larsen, J. A.Magalhaes, J. R. Murphy, A. Seiff, and G. Wilson, The Mars Pathfinderatmospheric structure investigation/meteorology (ASI/MET) experiment,Science, 278, 1752–1758, 1997.
Seiff, A., et al., The atmospheric and meteorology instrument on the MarsPathfinder Lander, J. Geophys. Res., 102(E2), 4045–4056, 1997.
Sinclair, P. C., A quantitative analysis of the dust devil, Ph.D. thesis, Univ.of Ariz., Tucson, 1966.
Sinclair, P. C., General characteristics of dust devils, J. Appl. Meteorol., 8,32–45, 1969.
Sinclair, P. C., The lower structure of dust devils, J. Atmos. Sci., 30, 1599–1619, 1973.
Smith, P. H., Results from the Mars Pathfinder camera, Science, 278,1758–1765, 1997.
Smith, P. H., and M. T. Lemmon, Opacity of the Martian atmospheremeasured by the Imager for Mars Pathfinder, J. Geophys. Res., 104,8975–8985, 1999.
Tanner, W. F., Spiral flow in rivers, shallow seas, dust devils and models,Science, 139, 41–42, 1963.
Thomas, P., and P. J. Gierasch, Dust devils on Mars, Science, 230, 175–177, 1985.
Thomas, P. C., M. C. Malin, M. H. Carr, G. E. Danielson, M. E. Davies, W.K. Hartmann, A. P. Ingersoll, P. B. James, A. S. McEwen, L. A. Soder-blom, and J. Veverka, Bright dunes onMars, Nature, 397, 592–594, 1999.
Tomasko, M. G., L. R. Doose, M. Lemmon, P. H. Smith, and E. Wegryn,Properties of dust in the Martian atmosphere from the image on MarsPathfinder, J. Geophys. Res, 104, 8987–9007, 1999.
Tratt, D. M., M. H. Hecht, D. C. Catling, and E. C. Samulon, In situmeasurements of dust devil dynamics, Eos Trans. AGU, 82(47), FallMeet. Suppl., abstract P31A-0539, 2001.
Wells, G. L., and J. R. Zimbelman, Extraterrestrial arid surface processes, inArid Zone Geomorphology: Processes, Form and Change, edited by D. S.Thomas, pp. 335–358, Halsted, New York, 1989.
White, B. R., B. M. Lacchia, R. Greeley, and R. N. Leech, Aeolian behaviorof dust in a simulated Martian atmosphere, J. Geophys. Res., 102,25,629–25,640, 1997.
GREELEY ET AL.: MARTIAN DUST DEVILS 7 - 11
Zurek, R. W., J. R. Barnes, R. M. Haberle, J. B. Pollack, J. E. Tillman,and C. B. Leovy, Dynamics of the atmosphere of Mars, in Mars, editedby H. H. Kieffer et al., pp. 799–817, Univ. of Ariz. Press, Tucson,1992.
�����������������������M. R. Balme and R. Greeley, Department of Geological Sciences,
Arizona State University, Box 871404, Tempe, AZ 85287-1404, USA.([email protected])
J. D. Iversen, Aerospace Engineering and Engineering MechanicsDepartment, Iowa State University, Ames, IA 50011-2271, USA.S. Metzger, Department of Geological Sciences, University of Nevada at
Reno, Mail Stop 172, Reno, NV 89557, USA.R. Mickelson,1821 West Seldon Way, Phoenix, AZ 85201, USA.J. Phoreman, NASA Ames Research Center, Mail Stop 242-6, Moffett
Field, CA 94035-1000, USA.B. White, Department of Mechanical and Aerospace Engineering,
University of California at Davis, Davis, CA 95616-5294, USA.