34
Cover Page Title Permit/Application Number Applicant: Name Address Phone Contact Person Contact Email Consultant: Name Address Phone Contact Person Contact Email Jul 2015
Cover Page
Title
Permit/Application Number
Applicant: Name
Address
Phone
Contact Person
Contact Email
Consultant: Name
Address
Phone
Contact Person
Contact Email
Date
Jul 2015

Table of Contents
Introduction
Background
Methods
Results
Conclusions
References
Attachments
Attachment 1 – Exhibits
1. Overview,2. Plan View3. Cross Section4. Sampling Locations
Attachment 2 – Sampling Analysis Plan (SAP)
Attachment 3 – Case Narrative
Attachment 4 – Tables
Attachment 5 – Approved USACE Permit
Jul 2015

EXAMPLE REPORT
INTRODUCTION
AGENT was contracted by the APPLICANT to provide assistance with the sampling, analysis, and reporting for maintenance dredging the PROJECT to comply with requirements of the Clean Water
Act (CWA). The maintenance dredging was performed from _______ to ______.
Please consider this final letter report and attachments as satisfying the requirements of the CWA.
Attached to this hardcopy is a CD containing all raw chemistry data, Water Quality Data sheets, and Excel and Word files.
BACKGROUND
The project site is located at _______ (Figure 1). Historically the site has been utilized as a _________. The site is surrounded by _________. The surrounding properties include _______. The project was
originally authorized under SWG-___-____ (Attachment 5) which authorized the dredging of _______ and placement into PA ______ Amendments? were authorized in ___ for the __________.
Current conditions show the elevation to be ____ (Figure 3 – Cross Section) Post-dredging elevation
will be ____ Approximately ____ cubic yards will be dredged during the maintenance dredging. Dredging will be accomplished utilizing MECHANICAL/HYDRAULIC PIPELINE dredge.
MET HODS
All sampling stations (Figure 2) noted in the Sampling and Analysis Plan (SAP - Attachment 1), have
been collected by AGENT, according to the requirements of the SAP.
All chemical analyses were performed by LAB , City , T e x a s , except for those constituents that were subcontracted by LAB to meet Contract Required Detection Limits (CRDLs). Subcontracted analyses
were performed by LAB 2 , City , T X (metals, except mercury), etc. All chemical analyses required have been completed according to the S A P, AND THE CRDLS HAVE BEEN MET/ OR EXCEPT THAT THE
CRDLs WERE NOT MET FOR (Ca s e N arrat i v e – A tt a c h m ent C ) . The implications of NOT MEETING
CRDLs for the aforementioned analytes will be addressed in the Results Section.
RESU LT S
CONSIDERATIONS If no analytes were detected in an analysis category, the reporting limits were not evaluated
and no QC values were outside of performance parameters, then that analyte group does not require further evaluation
If analytes were detected, evaluate the data against appropriate environmental screening values and include in a report table
For detects, be sure to include n (number, minimum, mean, and maximum if sample set allows) for each analyte and include in the data tables.
Incorporate site specific aspects that might impact the data discussions. Jul 2015

Incorporate laboratory case narrative findings for deviations or out of specification results for samples
EXAMPLE TEXTWater quality parameters taken at the time of collection are presented in Table 1 (Attachment 4), as are the coordinates at which samples were collected. Included in tables 2 – 5 (Attachment 4) are a
list of parameters for each analysis required under the SAP and the concentrations of detected parameters in various media. Also included in the tables are appropriate standards, criteria, or
screening values to which the detected parameters can be compared.
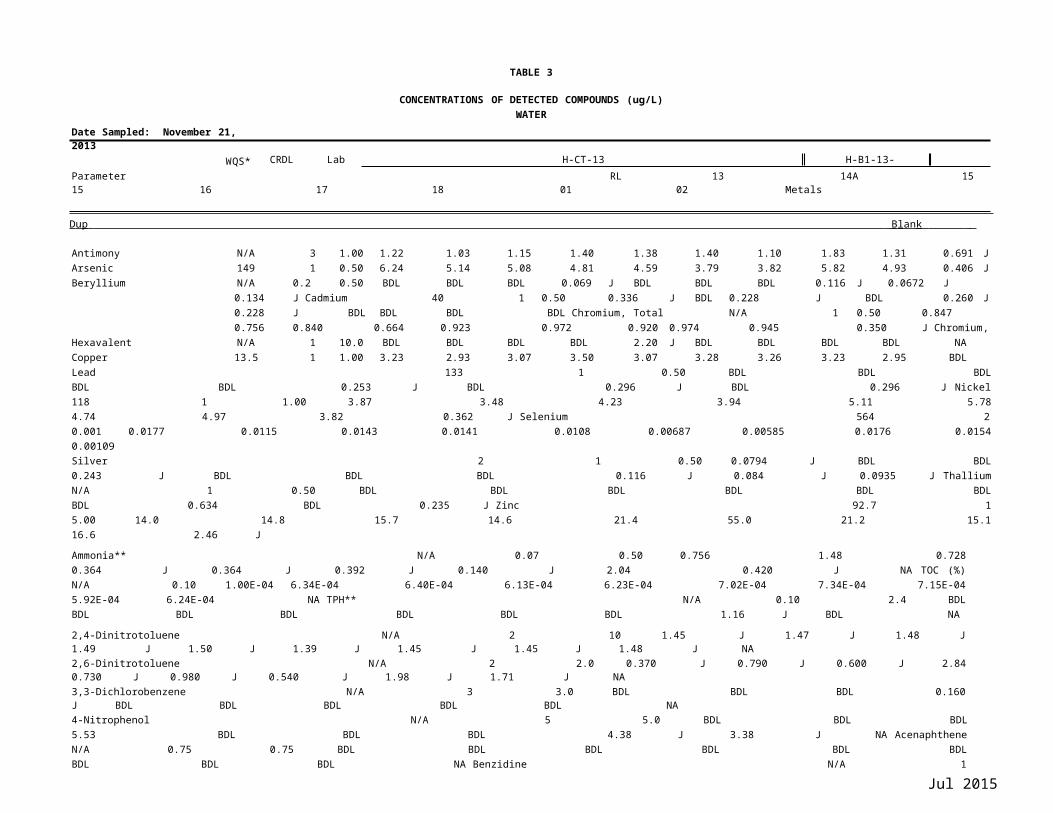
The results of chemical analyses for compounds detected in water and elutriate samples are
presented in tables 3 and 4. Also included in tables 3 and 4 are the Texas Surface Water Quality
Standards (WQS), provided by the Texas Commission on Environmental Quality (TCEQ) for the
protection of aquatic life. Since the sediment and water samples used to prepare elutriates are from
grab samples from a marine environment, and thus are a snap shot in time, not from a series of
samples taken over time, the acute marine WQS are appropriate for comparison.
Elutriates were prepared from test sediment and channel water, filtered or centrifuged to remove
suspended material for trace metal analysis (except mercury and selenium), and submitted for
chemical analysis. Therefore, elutriates provide information on those constituents that are
dissolved into the water column during dredging and open-water placement and as a worst-case
scenario of upland confined placement. An examination of tables 3 and 4 indicates the following:
1. Elutriate concentrations of zinc were consistently lower than water concentrations, likely
due to the zinc getting caught up in the fine sediments.
2. For the other metals, no clear pattern was discernable and some were detected only in a few
samples.
3. Most of the samples for detected organic analytes, except TOC, were below detection limits (BDL) or were qualified “J”, which indicates that reported values are between the method
detection limit (MDL) and the practical quantitation limit (RL). Therefore, meaningful comparison of water and elutriate values for these analytes is not possible.
4. No WQS were exceeded, so dredging and placement in an Upland Confined Placement Area
(UCPA) is not anticipated to violate any WQS, since the discharge from an UCPA will be of better water quality than the elutriate due to the increased settling time as the effluent
moves through the UCPA to the discharge weir.
As noted above, CRDLs were not met for some analytes in water and elutriates MDL and CRDL for each analyte are given in parentheses after each one: chromium III (1.90 µg/L/1.0 µg/L), chromium
VI (1.90 µg/L/1.0 µg/L), zinc (1.23 µg/L/1 µg/L), dieldrin (0.0212 µg/L/0.02 µg/L), total PCBs (0.013
µg/L/0.01 µg/L), TPH (0.570 mg/L/0.1 mg/L), and ammonia (0.124 mg/L/0.07 mg/L). An examination of tables 3 and 4 demonstrates that chromium III was not detected but by definition
could not exceed total chromium, which was detected in all samples to a maximum of 1.06 µg/L.
Jul 2015
There is no WQS for chromium III. Chromium VI was detected in one water and four elutriate samples but all concentrations and the MDL for chromium VI were orders of magnitude lower than
the WQS of 1090 µg/L. The zinc MDL of 1.23 µg/L is more than adequate to determine if the WQS of
150 µg/L had been exceeded. Additionally, all zinc concentrations were greater than 1.23 µg/L. The
MDL for dieldrin is very close to the CRDL and dieldrin was not detected in any water or elutriate sample. TPH was detected in only one water sample and there is no WQS for TPH. Total PCBs were
not detected in any water or elutriate sample nor were they detected in the sediments from which elutriates were prepared and the MDL is only slightly greater than the CRDL. The WQS for dieldrin is0.71 µg/L and the WQS for total PCBs is 10 µg/L, which could have been easily met by the MDLs.
Therefore, the conclusion of this report is that there were no impacts to the data interpretation
because these CRDLs were not met.
Sediment concentrations of detected compounds are presented in Table 5. The highest concentrations of metals were mostly found at station H-CT-13-14A, which did not have lower sand
percentages or higher concentrations of fines and water content. The lowest metals concentrations were mostly at station H-CT-13-18, which had the 2nd highest gravel/sand concentration. In
general, there seemed to be little correlation between grain size and metals concentration, indicating another controlling factor. There was no station with consistently higher or lower
organics concentrations.
There are no enforceable sediment quality criteria or standards with which to compare
concentrations in the sediment. However, there are several different guidelines that are used to
look for a cause for concern in sediment samples, one of which is the Effects Range Low, or ERL
(Buchman,2008). However, since these sediments are destined for any Upland Confined Placement Area, it is
customary to also compare to the Human Health Protective Concentration Levels
(PCL), provided by the TCEQ as part of the Texas Risk Reduction Program (TRRP, 30 TAC §350).
An examination of Table 5 reveals the following:
1. The only PCL (provided in TECQ Table 4, Combined Tier 1 Soil PCLs, Residential, June 29,
2012) that was exceeded was for Benzo(a)pyrene. However, since most water would exit the UCPA via the weir and no WQS were exceeded, the only logical exposure
pathway for a carcinogen in the slurry pumped into an UCPA is inhalation when the material is bulldozed, after complete drying, to build up the levees. This happens rarely
and is for a short duration. Even using the default values given in 30 TAC §350, a PCL for this single logical pathway was calculated to be 639,080 µg/kg, which is much higher
than the concentrations found in the sediments. If more appropriate exposure times were used, the PCL would be even higher.
2. ERLs were exceeded (as noted in Bold on the table) for copper, lead, mercury, silver, zinc, chlordane, dieldrin, 4,4’-DDD, 4,4’-DDE, 4,4’-DDT, Total PCBs, acenaphthene,
anthracene, benzo(a)anthracene, benzo(a)pyrene, chrysene, dibenzo(a,h)anthracene, fluoranthene, fluorene, phenanthrene, and pyrene.
Jul 2015

3. Effects Range Medium (ERM) were exceeded (as noted in Bold Italics on the table) for zinc, chlordane, dieldrin, 4,4’-DDT, anthracene, benzo(a)anthracene, benzo(a)pyrene,
chrysene, dibenzo(a,h)anthracene, fluoranthene, phenanthrene, and pyrene, mostly at stations H-B1-13-01 and H-B1-13-02.
4. In addition to TOC and TPH, 51 other organic compounds were detected including a
number of pesticides and PAHs.
As noted above, the CRDLs were not met for several analytes in sediment. As above, the MDL and
CRDL are included in parentheses after each analyte: benzidine (6.48 µg/kg/5 µg/kg), isophorone (8.24/1 µg/kg), TPH (variable: 25-41 mg/kg/5 mg/kg), and ammonia (6.20 mg/kg/0.1 mg/kg).
Benzidine was not detected in any sediment sample. The MDL is only slightly greater than the CRDL, and there is no ERL for benzidine. Isophorone was detected at all stations, at levels higher
than the CRDL, although there was blank contamination, but there is no ERL for isophorone. The MDL for TPH and ammonia are quite a bit larger than their respective CRDLs but neither has an ERL
so the fact that the CRDL was not met for these analytes is not likely to lead to impacts to the data interpretation presented in this report.
Dioxin and furan analyses on sediment samples were conducted and the results, both raw data and data normalized to total organic content of the individual sediments, are included in Table 5. The
range of values, 5.92 to 50.3 picograms/gram (pg/g or parts per trillion) dry weight total Toxic Equivalent of 2,3,7,8‐Tetrachlorodibenzo‐p‐Dioxin (TEQ), is similar to that found in the Florida
Panhandle Bays (0.51 to 77.51 pg/g, Hemming et al, 2002), Detroit/Rouge Rivers (3-62 pg/g, Kannan et al., 2001, in Hemming et al, 2002), Lake Ontario (68-500 pg/g, U.S. EPA, 1993, in
Hemming et al,2002), and Newark Bay (730-7600 pg/g, U.S. EPA, 1993, in Hemming et al, 2002). . These values are
also similar to those found in the adjacent channel in 2011 (4.6 to 58.0 pg/g). Additionally, all total
TEQ values are less than 1000 pg/g, the critical PCL for total TEQ from dioxins/furans.
CONCLUSION - Example
Based on the data discussed above and under the guidance provided by the RIA (EPA/USACE,
2003), the Upland Testing Manual (UTM, USACE 2003), and Texas TRRP regulations (30 TAC §350), the conclusion of this report is there is nothing in the chemical analyses that would indicate
a concern with the placement of these sediments in an Upland Confined Placement Area but that same conclusion may not be true for open water placement.
REFERENCES
Buchman, M.F. 2008. NOAA Screening Quick Reference Tables. NOAA OR&R Report 08-1. Seattle, Washington. Office of Response and Restoration Division. National Oceanic and Atmospheric Administration, 34 pp.
Hemming, J.M., M.S. Brim, R.B. Jarvis. 2002. Survey of Dioxin and Furan Compounds in Sediments
of Florida Panhandle Bay Systems. U.S. Fish and Wildlife Service Publication No. PCFO-EC 02-
Jul 2015

01.
Kannan, K., J.L. Kolber, Y.S. Kang, S. Masunaga, J. Nakanishi, A. Ostaszewski, J.P. Giesy. 2001.
Polychlorinated naphthalenes, biphenyls, dibenzo-p-dioxins, and dibenzofurans as well as
polycyclic aromatic hydrocarbons and alkylphenols in sediment from the Detroit and Rouge
Rivers, Michigan, USA. Environmental Toxicology and Chemistry 20(9), 1878-1889.
U.S. Army Corps of Engineers (USACE). 2003. Evaluation of Dredged Material Proposed for Disposal
and Island, Nearshore, or Upland Confined Disposal Facilities – Testing Manual. ERDC/El, TR-03-1, January 2003.
U.S. Environmental Protection Agency. 1993. Interim Reports on Data and Methods for Assessment
of 2,3,7,8-Tetrachlorodibenzo-p-dioxin Risk to Aquatic Life and Associated Wildlife. EPA/600/R93/055.
U.S. Environmental Protection Agency/U.S. Army Corps of Engineers (EPA/USACE). 1998. Evaluation of dredged Material Proposed for Discharges in Waters of the U.S., Inland Testing Manual. EPA-823/B/98/004. February, 1998
. 2003. Regional Implementation Agreement for Testing and Reporting Requirements for Ocean Disposal of Dredged Material off the Louisiana and Texas Coasts Under Section 103 of The Marine Protection, Research and Sanctuaries Act. U.S. Environmental Protection Agency, Region 6 and U.S. Army Corps of Engineers, Galveston and New Orleans Districts. Available at: http : // w w w .epa . g ov / r e gi on6/ w ater/ e c op r o/ e m / o c ean/ t e x t/ r i a.pdf
Jul 2015

ATTACHMENT 1 – EXHIBITS
Jul 2015

Figure 1. Overview Map
Jul 2015

Figure 2. Plan View
Jul 2015

Figure 3. Cross Section
Jul 2015

Figure 4. Sample Locations
Jul 2015

ATTACHMENT 2 – SAP
Jul 2015

ATTACHMENT 3 – Case Narrative
Jul 2015

CASE NARRATIVE
Job ID :
Client Name: Project ID:Date Received:Collected By:
________________
11/21/2013,11/25/2013Client
28 Samples were collected on 11/21/2013 and were received at NWDLS on 11/21/2013 properly thermally preserved and intact. These samples received a job number of 1311221. The lab sample ID’s, Client Sample ID’s, and dates of collection are at the top of each result page. Except as noted below, all method specified calibrations and quality control performance criteria were met for this job. For additional information, please refer to the Quality Form pages.
Semi volatilesProject requested TDL’s were not met for Benzidine or Isophorone in sediment samples.
QB13121604 - Samples 1311221- 01-09 had surrogate recoveries outside of the laboratory specified control limits.LCS, LCSD, MS, MSD had a precision failure.LCS, LCSD, MS had surrogate recoveries outside the laboratory specified control limits. Dimethyl Phthalate and Isophorone were present in the method blank.
QB13121605 - Samples 1310021- 1311221-11 thru 19 had surrogate recoveries outside of the laboratory specified control limits.LCS, LCSD had a precision failure.LCS, LCSD, MB had surrogate recoveries outside the laboratory specified
control limits. Dimethyl Phthalate was present in the method blank.QB13121703 - LCS, LCSD, MS, MSD had precision failures. Isophorone was present in the method blank.
Organochlorine PesticidesQB13121702 - MS had surrogate recoveries outside the laboratory specified control limits. Project requested TDL’s were not met on water samples for dieldrin.QB13121606 - MSD had a precision failure. QB13121701 - MS, MSD had a precision failure.
Mercury QB13120303 - MS had a precision failure.
Ammonia QB13121001 - DUP2 had a precision failure.
Project requested TDL’s were not met for water or sediment samples.
Metals Project requested TDL’s were not met on water samples for Zinc, Trivalent Chromium, or Hexavalent Chromium.
Total Petroleum HydrocarbonsProject requested TDL’s were not met for water or sediment samples. All sediment samples were extracted out of hold time.
Polychlorinated BiphenylsProject requested TDL’s were not met for water samples.
Project Manager
Jul 2015

Date: 12/31/2013 14:19 Page 2 of
184Certification #
Jul 2015

ATTACHMENT 4 - TABLES
Jul 2015

TABLE 1
STANDARD PARAMETERS
ChannelWaterDepth
DissolvedOxygen Salinity
WaterTemp
AirTemp
CoordinatesLatitude (N) Longitude (W)
S t a ti on * Da t e T ime S t a ti o n ( f t) (mg / L ) pH ( ‰) (° C) (° C) De g . M in. S e c. De g . M in. S e c.
H-CT-13- 13A 11/21/2013 1000 1150+00 38.5 6.39 7.47 10.42 17.0 24.9 29 43 37.3 94 15 26.7H-CT-13- 13B 11/21/2013 1015 1150+00 38.8 6.38 7.48 10.42 17.0 25.1 29 43 34.9 94 15 26.9H-CT-13- 14AA 11/21/2013 1115 1210+00 44.5 6.56 7.34 8.61 17.4 25.3 29 43 39.6 95 16 27.4H-CT-13- 14AB 11/21/2013 1125 1210+00 45.0 6.57 7.34 8.65 17.4 25.3 29 43 38.8 95 16 28.5H-CT-13- 14AC 11/21/2013 1135 1210+00 43.0 6.55 7.33 8.61 17.5 25.4 29 43 38.0 95 16 29.6H-CT-13- 15A 11/21/2013 1145 1250+00 42.0 6.56 7.36 8.14 17.5 26.7 29 44 15.8 95 16 43.6H-CT-13- 15B 11/21/2013 1150 1250+00 41.5 6.57 7.35 8.14 17.5 26.8 29 44 15.3 95 16 45.0H-CT-13- 15C 11/21/2013 1205 1250+00 39.5 6.57 7.36 8.13 17.4 27.1 29 44 14.8 95 16 46.3H-CT-13- 16A 11/21/2013 1220 0+00 39.0 6.33 7.38 6.04 18.5 26.8 29 44 41.7 95 17 3.5H-CT-13- 16B 11/21/2013 1226 0+00 39.0 5.92 7.36 6.05 18.5 27.8 29 44 41.2 95 17 4.4H-CT-13- 16C 11/21/2013 1239 0+00 38.0 6.00 7.37 6.04 18.5 27.3 29 44 40.8 95 17 5.4H-CT-13- 17A 11/21/2013 1250 25+00 38.5 6.53 7.21 4.50 19.2 27.3 29 45 3.0 95 17 17.9H-CT-13- 17B 11/21/2013 1255 25+00 41.0 6.50 7.18 4.52 19.2 27.3 29 45 1.6 95 17 20.9H-CT-13- 17C 11/21/2013 1310 25+00 39.0 6.51 7.18 4.51 19.2 27.3 29 45 0.3 95 17 23.9H-CT-13- 18A 11/21/2013 1320 9+00-A 29.0 6.44 7.21 2.99 18.5 27.8 29 44 52.0 95 17 32.4H-CT-13- 18B 11/21/2013 1325 9+00-A 32.5 6.45 7.21 3.00 18.5 27.8 29 44 51.6 95 17 32.1H-CT-13- 18C 11/21/2013 1335 9+00-A 35.0 6.47 7.21 2.95 18.5 27.2 29 44 51.2 95 17 31.8H-B1-13- 01A 11/21/2013 1035 15+00 15.0 5.71 7.35 10.27 16.9 24.9 29 43 15.7 95 16 25.6H-B1-13- 02A 11/21/2013 1100 30+00 2.5 5.80 7.48 8.72 17.1 25.0 29 43 23.7 95 16 36.4
Jul 2015
TABLE 2
PARAMETERS DETERMINED BY CHEMICAL ANALYSIS
M E T A L S Antimony Lead Arsenic Mercury Beryllium Nickel Cadmium Selenium Chromium, Total Silver Chromium, Trivalent Thallium Chromium. Hexavalent Zinc Copper
PES T ICIDES AND P C Bs Aldrin Dieldrin Alpha-BHC Endosulfan I Beta-BHC Endosulfan IIDelta-BHC Endosulfan sulfateGamma-BHC (Lindane) Endrin Chlordane Endrin aldehyde Alpha-Chlordane HeptachlorGamma- Chlordane Heptachlor epoxide4,4'-DDD Toxaphene4,4'-DDE Total PCBs4,4'-DDT
SE M IV O L A T I L ES Acenaphthene Dimethyl phthalate Acenaphthylene Di-n-butyl phthalate Anthracene 2,4-Dinitrotoluene Benzidine 2,6-Dinitrotoluene Benzo(a)anthracene Di-n-octyl phthalate Benzo(a)pyrene 1,2-Diphenylhydrazine Benzo(ghi)perylene Fluoranthene Benzo(b&k)fluoranthene FluoreneBis(2-chloroethyoxy)methane HexachlorobenzeneBis(2-chloroethyl)ether HexachlorobutadieneBis(2-chloroisoproply)ether HexachlorocyclopentadieneBis(2-ethylhexyl)phthalate Hexachloroethane4-Bromophenyl phenyl ether Indeno(123-CD)pyreneButyl benzyl phthalate Isophorone4-chloro-3-methylphenol 2-Methyl-4,6-dinitrophenol (4,6-dinitro-o-cresol)2-Chloronapthalene Naphthalene2-Chlorophenol Nitrobenzene4-Chlorophenyl phenyl ether 2-Nitrophenol Chrysene
4-Nitrophenol Dibenzo(ah)anthracene N-nitrosodimethylamine**1,2-Dichlorobenzene N-nitrosodi-n-propylamine1,3-Dichlorobenzene N-nitrosodiphenylamine1,4-Dichlorobenzene Phenanthrene3,3'-Dichlorobenzidine Phenol2,4-Dichlorophenol Pentachlorophenol2,4-Dinitrophenol PryeneDiethyl phthalate 1,2,4-Trichlorobenzene2,4-Dimethylphenol 2,4,6-Trichlorophenol
Jul 2015

TABLE 2 (Concluded)
PARAMETERS DETERMINED BY CHEMICAL ANALYSIS
C O NVE N T IO N AL PARA M E T ERS Ammonia Total Petroleum HydrocarbonsCyanide % Solids* Total Organic Carbon Grain Size*
DIOXIN/FURAN CONGENERS*
2,3,7,8 - Tetrachloro Dibenzo-p -Dioxin1,2,3,7,8 - Pentachloro Dibenzo-p-Dioxin 1,2,3,7,8,9 - Hexachloro Dibenzo-p-Dioxin1,2,3,4,7,8 - Hexachloro Dibenzo-p-Dioxin 1,2,3,4,6,7,8 - Heptachloro Dibenzo-p-Dioxin1,2,3,6,7,8 - Hexachloro Dibenzo-p-Dioxin Octachloro Dibenzo-p-Dioxin
2,3,7,8 - Tetrachloro Dibenzo-p-Furan 2,3,4,6,7,8 - Hexachloro Dibenzo-p-Furan1,2,3,7,8 - Pentachloro Dibenzo-p-Furan 1,2,3,7,8,9 - Hexachloro Dibenzo-p-Furan2,3,4,7,8 - Pentachloro Dibenzo-p-Furan 1,2,3,4,6,7,8 - Heptachloro Dibenzo-p-Furan1,2,3,4,7,8 - Hexachloro Dibenzo-p-Furan 1,2,3,4,7,8,9 - Heptachloro Dibenzo-p-Furan1,2,3,6,7,8 - Hexachloro Dibenzo-p-Furan Octachloro Dibenzo-p-Furan
* sediment only** Water/elutriate only
Jul 2015

TABLE 3
CONCENTRATIONS OF DETECTED COMPOUNDS (ug/L) WATER
Date Sampled: November 21, 2013WQS*
CRDL Lab H-CT-13 H-B1-13-Parameter RL 13 14A 15 15 16 17 18 01 02 Metals D u p B l an k
Antimony N/A 3 1.00 1.22 1.03 1.15 1.40 1.38 1.40 1.10 1.83 1.31 0.691 J Arsenic 149 1 0.50 6.24 5.14 5.08 4.81 4.59 3.79 3.82 5.82 4.93 0.406 J Beryllium N/A 0.2 0.50 BDL BDL BDL 0.069 J BDL BDL BDL 0.116 J 0.0672 J 0.134 J Cadmium 40 1 0.50 0.336 J BDL 0.228 J BDL 0.260 J 0.228 J BDL BDL BDL BDL Chromium, Total N/A 1 0.50 0.847 0.756 0.840 0.664 0.923 0.972 0.920 0.974 0.945 0.350 J Chromium, Hexavalent N/A 1 10.0 BDL BDL BDL BDL 2.20 J BDL BDL BDL BDL NA Copper 13.5 1 1.00 3.23 2.93 3.07 3.50 3.07 3.28 3.26 3.23 2.95 BDLLead 133 1 0.50 BDL BDL BDL BDL BDL 0.253 J BDL 0.296 J BDL 0.296 J Nickel 118 1 1.00 3.87 3.48 4.23 3.94 5.11 5.78 4.74 4.97 3.82 0.362 J Selenium 564 2 0.001 0.0177 0.0115 0.0143 0.0141 0.0108 0.00687 0.00585 0.0176 0.0154 0.00109Silver 2 1 0.50 0.0794 J BDL BDL 0.243 J BDL BDL BDL 0.116 J 0.084 J 0.0935 J Thallium N/A 1 0.50 BDL BDL BDL BDL BDL BDL BDL 0.634 BDL 0.235 J Zinc 92.7 1 5.00 14.0 14.8 15.7 14.6 21.4 55.0 21.2 15.1 16.6 2.46 J
Ammonia** N/A 0.07 0.50 0.756 1.48 0.728 0.364 J 0.364 J 0.392 J 0.140 J 2.04 0.420 J NA TOC (%) N/A 0.10 1.00E-04 6.34E-04 6.40E-04 6.13E-04 6.23E-04 7.02E-04 7.34E-04 7.15E-04 5.92E-04 6.24E-04 NA TPH** N/A 0.10 2.4 BDL BDL BDL BDL BDL BDL BDL 1.16 J BDL NA
2,4-Dinitrotoluene N/A 2 10 1.45 J 1.47 J 1.48 J 1.49 J 1.50 J 1.39 J 1.45 J 1.45 J 1.48 J NA2,6-Dinitrotoluene N/A 2 2.0 0.370 J 0.790 J 0.600 J 2.84 0.730 J 0.980 J 0.540 J 1.98 J 1.71 J NA3,3-Dichlorobenzene N/A 3 3.0 BDL BDL BDL 0.160 J BDL BDL BDL BDL BDL NA4-Nitrophenol N/A 5 5.0 BDL BDL BDL 5.53 BDL BDL BDL 4.38 J 3.38 J NA Acenaphthene N/A 0.75 0.75 BDL BDL BDL BDL BDL BDL BDL BDL BDL NA Benzidine N/A 1 1.0 BDL 2.00 BDL BDL 1.82 2.16 1.69 BDL BDL NA Bis(2-Chloroisopropyl)ether N/A 0.7 0.7 BDL BDL BDL 0.120 J BDL BDL BDL BDL BDL NA Bis(2-ethylhexyl)phthalate N/A 2 2.0 BDL BDL BDL 1.19 J BDL BDL BDL 0.850 J 0.590 J NA Diethyl phthalate N/A 1 1.0 BDL 0.140 J BDL 0.490 J BDL BDL BDL 0.340 J 0.320 J NA Dimethyl phthalate N/A 1 1.0 8.32 B 14.8 B 13.5 B 59.5 B 12.1 B 15.9 B 8.20 B 42.8 B 44 B NA Di-n-butyl phthalate N/A 1 1.0 0.190 J BDL BDL 3.67 BDL BDL BDL 1.86 1.33 NA Fluoranthene N/A 0.90 0.90 BDL BDL BDL BDL BDL BDL BDL BDL BDL NA Fluorene N/A 0.60 0.60 BDL BDL BDL BDL BDL BDL BDL BDL BDL NA Isopheron N/A 1 1.0 0.830 BJ 1.40 B 1.22 B 0.610 BJ 1.15 B 1.10 B 0.930 BJ BDL 0.770 BJ NA Nitrobenzene N/A 0.9 0.9 BDL 0.100 J BDL BDL BDL BDL BDL BDL BDL NA N-Nitrosodimethylamine N/A 3.1 3.1 0.260 J 0.370 J 0.470 J 0.150 J 0.340 J 0.230 J 0.140 J 0.160 J 0.150 J NA N-Nitrosodi-n-propylamine N/A 0.9 0.9 BDL BDL BDL 0.260 J BDL 0.130 J BDL 0.130 J 0.210 J NA N-Nitrosodiphenylamine N/A 2.1 2.1 BDL BDL BDL 0.170 J BDL 0.150 J BDL 0.320 J 0.190 J NA Phenanthrene 7.7 0.50 0.50 BDL BDL BDL BDL BDL BDL BDL BDL BDL NA Phenol N/A 10 10 0.330 J 0.830 J 0.500 J 2.40 J 0.650 J 0.570 J 0.550 J 2.28 J 1.49 J NA Pyrene N/A 1.50 1.50 BDL BDL BDL BDL BDL BDL BDL BDL BDL N/A
Dup = Duplicate SampleBDL = Below Detection Limits* Acute Texas Water Quality Standards for Saltwater** mg/LJ-Estimated result since result was less than reporting limit,B=Method Blank Contamination (associated method blank contains the target analyte at a reportable level).
Jul 2015
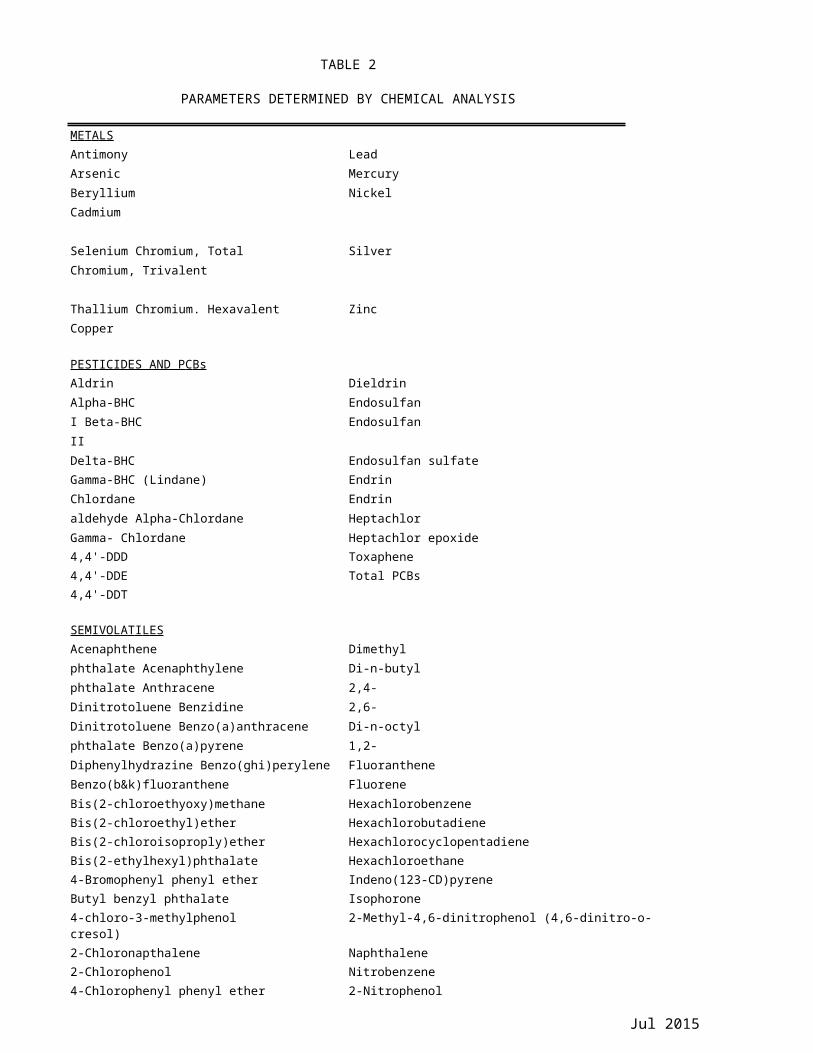
TABLE 4CONCENTRATIONS OF DETECTED COMPOUNDS (ug/L)
ELUTRIATE
Date Sampled: November 21, 2013WQS*
CRDL Lab H-CT-13 H-B1-13-Parameter RL 13 14A 15 15 16 17 18 01 02 Du p
Antimony N/A 3 1.00 2.10 4.82 1.66 1.93 1.53 1.70 1.23 2.08 2.32
Arsenic 149 1 0.50 2.10 17.0 10.8 11.6 5.86 5.75 3.34 4.68 5.52
Beryllium N/A 0.2 0.50 BDL BDL BDL 0.0796 J BDL BDL BDL BDL BDL
Cadmium 40 1 0.50 BDL BDL BDL 0.259 J BDL BDL BDL BDL BDL Chromium, Total N/A 1 0.50 1.05 0.801 0.971 1.06 0.632 0.766 0.655 0.632 0.649Chromium, Hexavalent N/A 1 10.0 BDL 3.40 J BDL BDL 2.30 J BDL 2.10 J BDL 2.30 J Copper 13.5 1 1.00 1.47 0.839 J 0.854 J 1.51 0.828 J 0.695 J 0.703 J 5.10 1.04Lead 133 1 0.50 0.499 J 0.361 J 0.443 J 0.526 BDL 0.325 J BDL 0.594 BDLNickel 118 1 1.00 3.84 3.55 4.17 3.90 5.80 5.95 5.73 5.94 3.36Selenium 564 2 0.001 0.0191 0.0147 0.0161 0.0157 0.0146 0.00937 0.00661 0.0159 0.0132Silver 2 1 0.50 BDL BDL BDL 0.0732 J BDL BDL BDL BDL BDL Thallium N/A 1 0.50 BDL BDL BDL 0.182 J BDL BDL BDL BDL BDL Zinc 92.7 1 5.00 12.8 8.93 8.72 9.30 11.10 9.76 12.6 17.9 10.8
Ammonia** N/A 0.07 0.50 7.64 BDL 5.68 0.450 J BDL 0.952 9.32 2.55 BDL TOC (%) N/A 0.10 1.00E-04 6.72E-04 8.41E-04 1.06E-03 1.04E-03 1.15E-03 1.10E-03 1.03E-03 1.01E-03 6.87E-04TPH** N/A 0.10 2.4 BDL BDL BDL BDL BDL BDL BDL BDL BDL
2,4-Dinitrotoluene N/A 2.00 10.0 1.44 J 1.51 J 1.42 J 1.47 J 1.47 J 1.44 J BDL BDL 1.45 J2,6-Dinitrotoluene N/A 2.00 2.00 0.180 J 0.170 J 0.480 J 0.250 J 1.12 J 1.09 J 0.870 J BDL 0.140 J3,3-Dichlorobenzene N/A 3.00 3.00 BDL BDL BDL BDL BDL BDL BDL BDL BDL4-Nitrophenol N/A 5.00 5.00 BDL BDL 1.26 J 1.63 J 1.91 J 2.26 J BDL BDL BDL Acenaphthene N/A 0.75 0.75 BDL BDL BDL BDL BDL BDL 0.420 J BDL BDL Benzidine N/A 1.00 1.00 BDL BDL BDL BDL 0.840 J BDL 1.11 BDL BDL Bis(2-Chloroisopropyl)ether N/A 0.70 0.70 0.230 J BDL BDL BDL 0.110 J 0.350 J BDL BDL BDLBis(2-ethylhexyl)phthalate N/A 2.00 2.00 2.10 3.89 0.480 J 2.43 0.710 J 1.81 J 2.95 2.89 1.42 J Diethyl phthalate N/A 1.00 1.00 BDL BDL 0.140 J BDL 0.220 J 0.210 J 0.160 J BDL BDL Dimethyl phthalate N/A 1.00 1.00 6.08 B 5.39 B 8.83 B 13.8 B 20.4 B 17.1 B 12.7 B 13.8 B 5.34 B Di-n-butyl phthalate N/A 1.00 1.00 0.180 J BDL 0.210 J BDL 0.290 J 0.210 J BDL BDL 0.230 J Fluoranthene N/A 0.90 0.90 BDL BDL BDL BDL BDL BDL 0.210 J BDL BDL Fluorene N/A 0.60 0.60 BDL BDL BDL BDL BDL BDL 0.320 J BDL BDL Isopheron N/A 1.00 1.00 0.950 J 0.650 J BDL BDL BDL BDL BDL BDL 0.620 J Nitrobenzene N/A 0.90 0.90 BDL BDL 0.110 J BDL BDL BDL BDL BDL BDLN-Nitrosodimethylamine N/A 3.10 3.10 0.150 J 0.150 J 0.140 J 0.170 J BDL BDL BDL 0.170 J 0.130 J N-Nitrosodi-n-propylamine N/A 0.90 0.90 BDL BDL 0.130 J BDL 0.330 J BDL BDL 0.210 J BDLN-Nitrosodiphenylamine N/A 2.10 2.10 0.150 J 0.120 J BDL 0.210 J BDL BDL BDL 0.210 J 0.120 J Phenanthrene 7.7 0.50 0.50 BDL BDL BDL BDL BDL BDL 0.460 J BDL BDL Phenol N/A 10.0 10.0 0.330 J 0.380 J 0.680 J 0.510 J 0.600 J 0.570 J 0.390 J 0.530 J 0.360 J Pyrene N/A 1.50 1.50 BDL 0.130 J BDL BDL BDL BDL 0.130 J 0.410 J BDL
Dup = Duplicate SampleBDL = Below Detection Limits* Acute Texas Water Quality Standards for Saltwater** mg/LJ-Estimated result since result was less than reporting limit,B=Method Blank Contamination (associated method blank contains the target analyte at a reportable level).
Jul 2015
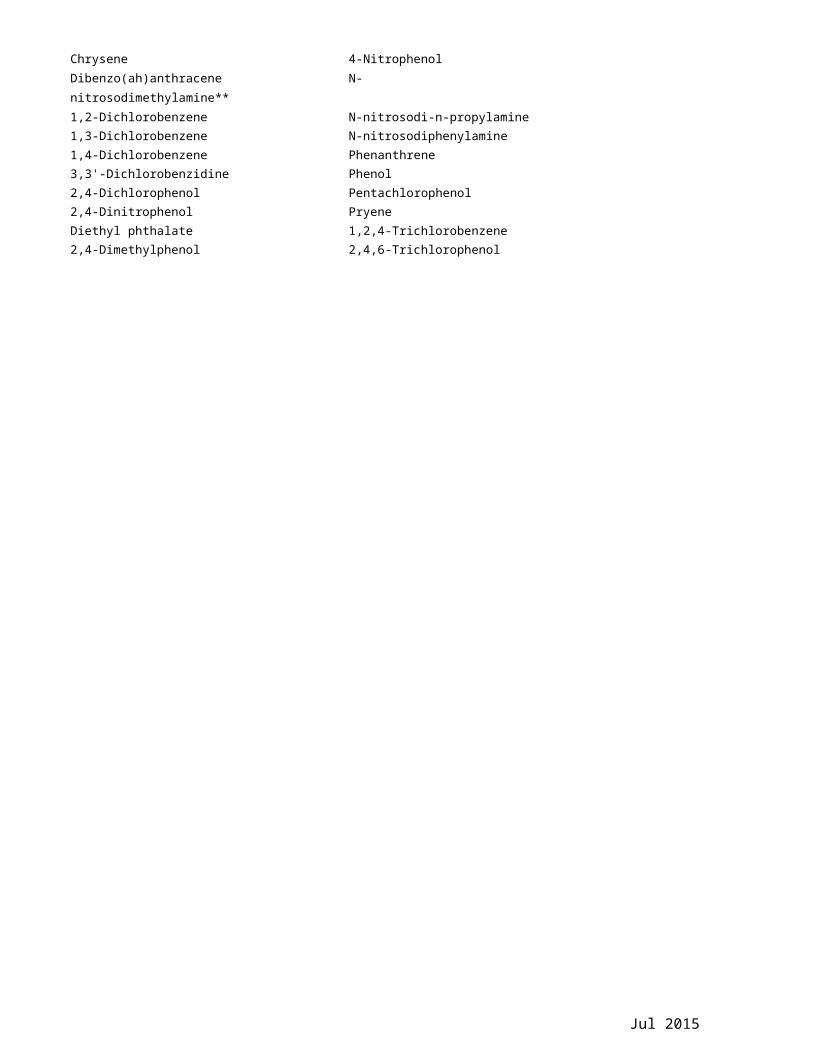
TABLE 5
Date Sampled: November 21, 2013
CONCENTRATIONS OF DETECTED COMPOUNDS (dry weight) SEDIMENT
Contract H-CT-13 H-B1-13- Required NOAA NOAA TCEQ 13 14A 15 15 16 17 18 01 02
Parameter Units Detection ERM ERL PEL D up Limit
Antimony mg/kg 2.5 N/A N/A 15 0.358 0.378 0.357 P 0.494 P 0.334 0.207 J 0.232 0.331 0.570Arsenic mg/kg 0.3 70 8.2 24 4.35 8.12 4.28 P 4.04 P 3.46 0.824 2.60 5.33 7.83Beryllium mg/kg 1 N/A N/A 38 1.04 0.834 1.04 1.01 0.869 0.824 0.605 0.457 0.761Cadmium mg/kg 0.1 9.6 1.20 52 0.960 2.33 1.01 1.03 0.663 0.588 0.448 0.745 1.04Chromium, Total mg/kg 1 370 81.0 3.3E+04 31.8 42.3 24.7 24.3 P 18.4 16.9 12.7 28.0 31.1Chromium III mg/kg 1 N/A N/A 3.3E+04 31.8 42.3 24.7 24.3 18.4 16.9 12.7 28.0 31.1Copper mg/kg 1 270 34.0 550 66.5 72.8 62.3 P 59.0 P 37.5 32.5 25.8 76.6 118Lead mg/kg 0.3 218 46.7 500 50.9 116 49.9 49.7 P 38.7 35.3 31.5 82.2 72.0Mercury mg/kg 0.2 0.71 0.15 3.6a 0.175 J 0.301 0.121 J 0.140 J 0.100 J 0.097 J 0.060 J 0.188 J 0.194 JNickel mg/kg 0.5 51.6 20.9 840 16.2 18.1 16.1 15.5 P 13.5 12.4 9.98 13.8 15.7Selenium mg/kg 0.5 N/A N/A 310 0.991 J 0.626 J 0.569 J,P 0.994 P 0.570 J 0.485 0.385 J 0.565 0.691Silver mg/kg 0.2 3.7 1 97 0.727 2.20 0.824 0.789 0.537 0.538 J 0.370 0.0181 1.06Thallium mg/kg 0.2 N/A N/A 6 0.162 J 0.139 J 0.126 J 0.396 P 0.346 0.112 J 0.0748 J 0.263 0.174 JZinc mg/kg 2 410 150 9900 257 391 263 P 254 P 197 178 147 425 432Aldrin ug/kg 3 N/A N/A 590 1.33 J 1.286 J 1.768 J 1.875 J 2.36 J 3.64 J 2.79 J 1.163 J 0.917 JChlordane ug/kg 3 6 0.5 6000c 25.9 J 25.6 J 27.3 J 26.9 J 29.1 J 29.3 J 30.8 J 26.3 J 33.4 Jα-Chlordane ug/kg 3 N/A N/A 13000c 8.56 J 4.98 J 9.88 J 8.86 J 11.31 11.62 12.87 6.74 J 11.58γ-Chlordane ug/kg 3 N/A N/A 7400c 14.44 13.13 15.06 15.50 15.04 14.26 15.09 14.43 18.89Dieldrin ug/kg 5 6 0.02 150c 3.80 J 9.62 J 3.91 J 8.47 J 3.32 J 4.03 J 4.46 J 7.78 J 8.59 J4,4'-DDD ug/kg 5 20 2 14000c < 0.0309 3.35 J < 0.0309 < 0.0309 < 0.0309 < 0.0309 2.98 J < 0.0309 2.03 J4,4'-DDE ug/kg 5 27 2 10000c 8.70 J 22.2 5.18 J 5.72 J 3.29 J 5.96 J 8.69 J 8.36 J 6.74 J4,4'-DDT ug/kg 5 7 1 5400c 18.3 49.6 71.2 36.1 11.3 11.1 9.14 J 51.5 29.7Endosulfan I ug/kg 5 N/A N/A 9.1E+04 2.47 J 0.790 J 2.32 J 1.24 J < 0.0193 < 0.0193 < 0.0193 0.753 J 1.34 JEndosulfan II ug/kg 5 N/A N/A 2.7E+05 7.21 J 13.01 5.01 J 11.17 3.11 J 2.3 J 2.451 J 12.62 11.96Endosulfan Sulfate ug/kg 5 N/A N/A 3.8E+05 10.53 17.48 16.98 15.06 20.6 19.71 18.01 6.67 J 10.72Endrin ug/kg 5 N/A N/A 9000 4.77 J 12.43 2.599 J 6.67 J 1.447 J 1.437 J 1.172 J 8.15 J 6.54 JEndrin Aldehyde ug/kg 5 N/A N/A 19000 10.73 15.78 7.24 J 15.81 7.34 J 5.25 J 5.12 J 9.49 J 10.31Endrin Ketone ug/kg 5 N/A N/A 19000 < 0.0201 < 0.0201 < 0.0201 < 0.0201 < 0.0201 < 0.0201 < 0.0201 < 0.0201 7.25 JHeptachlor ug/kg 3 N/A N/A 130c 0.904 J 1.985 J 0.38 J 0.608 J 0.824 J 0.971 J < 0.0126 0.469 J 0.372 JHeptachlor Epoxide ug/kg 3 N/A N/A 240c 1.78 J 5.40 J 1.82 J 1.67 J 1.64 J 2.21 J 2.74 J 4.59 J 2.26 Jα-BHC ug/kg 3 N/A N/A 260c 1.569 J 1.546 J 1.115 J 0.80 J 1.106 J 1.17 J 1.154 J 0.642 J 0.796 Jβ-BHC ug/kg 3 N/A N/A 930c 5.82 J 4.07 J 2.14 J 1.244 J 1.02 J 1.164 J 2.74 J 1.468 J 3.49 Jδ-BHC ug/kg 3 N/A N/A 2900c 2.079 J 1.792 J BDL 3.44 J BDL BDL 2.595 J BDL 3.44 Jγ-BHC (Lindane) ug/kg 3 N/A N/A 1100c 2.561 J 1.106 J 2.179 J 0.994 J 1.926 J 1.633 J 2.318 J 2.000 J 2.840 JToxaphene ug/kg 50 N/A N/A 1200c BDL 284 J BDL BDL BDL BDL BDL BDL BDLTotal PCBs ug/kg 1 180 22.7 1100.0 50.7 116 25.6 35.6 21.3 18.5 16.7 63.2 54.7Dup = Duplicate SampleBDL = Below Detection LimitJ = The reported value is between the limit of detection (MDL) and the practical quantitation limit (RL), B = Analyte was found in the associated method blank.P = Spike recovery outside control limits, possibly due to matrix interference.a = At pH=4.9, would be greater at pH expected inside an UCPA.PEL = TCEQ human health protective concentration levels as listed in 30 TAC §350, Table 4, Combined Tier 1 Soil PCLs, Residential, June 29, 2012.
Jul 2015

TABLE 5 (Continued)
CONCENTRATIONS OF DETECTED COMPOUNDS (dry weight) SEDIMENT
2,4-Dinitrotoluene ug/kg 200 N/A N/A 6900c 130 43.2 122.5 117.2 98.1 128.9 110.4 99.3 96.62,6-Dinitrotoluene ug/kg 200 N/A N/A 6900c 151.6 63.5 139.6 150.8 107 152.2 121.9 117.8 112.53,3-Dichlorobenzidine ug/kg 300 N/A N/A 10000c BDL BDL BDL BDL BDL BDL BDL 25.4 BDL2-Nitrophenol ug/kg 200 N/A N/A 1.3E+05 182.6 122 257 BDL 177.8 227.8 179.8 136.6 155.84-Nitrophenol ug/kg 500 N/A N/A 1.3E+05 BDL 570 BDL BDL BDL BDL 616 1353 BDLAcenaphthene ug/kg 20 500 16 3.0E+06 BDL 155 24.9 21.3 27.7 27.3 49.6 369 39.4Acenaphthylene ug/kg 20 640 44 3.8E+06 23.7 31.8 22.0 27.6 21.5 BDL 23.6 29.6 26.5Anthracene ug/kg 20 1100 85.3 1.8E+07 71.8 313 86.7 86.1 547 83.8 113 2248 116Benzo(a)anthracene ug/kg 20 1600 261 5700c 1160 1190 671 1005 1023 876 962 3917 1738Benzo(a)pyrene ug/kg 20 1600 430 560c 1009 987 791 803 804 713 752 3958 1681Benzo(b)fluoranthene ug/kg 20 N/A N/A 5700c 1796 1491 1385 1492 1463 1204 1310 5150 2711Benzo(g,h,i)perylene ug/kg 20 N/A N/A 1.8E+06 1045 767 856 792 883 773 801 2479 1631Benzo(k)fluoranthene ug/kg 20 N/A N/A 57000c 1832 1521 1413 1522 1492 1230 1336 5265 2754Bis(2-Chloroethyl)ether ug/kg 130 N/A N/A 2200c BDL BDL BDL BDL BDL 35.5 33.2 BDL BDLBis(2-ethylhexyl)phthalate ug/kg 50 N/A N/A 2.7E+05 1534 2824 BDL 1494 1504 1308 1260 1066 1974Buthyl benzyl phthalate ug/kg 50 N/A N/A 1.0E+07 65.1 39.4 44.5 48.6 52.9 62.2 122.7 28.6 93Chrysene ug/kg 20 2800 384 560000c 1139 1163 988 969 1074 923 992 4208 1758Dibenzo(a,h)anthracene ug/kg 20 260 63.4 55000c 183.2 29.2 38.9 138.9 138.3 131.2 131.3 23.3 306Dimethyl phthalate ug/kg 50 N/A N/A 5.3E+07 42.4 BDL 32.7 BDL 32.3 26.27 BDL BDL 18.92Di-n-butyl phthalate ug/kg 50 N/A N/A 6.2E+06 36 27.1 28.7 BDL 36.8 33.2 31.8 22.1 33.6Di-n-octyl Phthalate ug/kg 50 N/A N/A 2.6E+06 123.1 33.5 127.3 141.1 147.2 136 45.4 85.7 132.3Fluoranthene ug/kg 20 5100 600 2.3E+06 1635 2478 1506 1472 1551 1321 1569 8378 2582Fluorene ug/kg 20 540 19 2.3E+06 BDL 131 25.8 25.2 43.2 30.7 52.5 523 26.9Indeno(1,2,3-cd)pyrene ug/kg 20 N/A N/A 2700c 995 741 814 764 845 750 767 2479 1549Isopheron ug/kg 10 N/A N/A 4900000c 892 B 432 B 467 B 133.9 B 670 B 866 B 282 B 317 B 626 BNaphthalene ug/kg 20 2100 160 2.2E+05 BDL 53.2 BDL 12.2 18.8 BDL 32.9 155.6 BDLNitrobenzene ug/kg 160 N/A N/A 6600c 60.7 31.1 32.9 BDL 30.9 63.9 830 BDL BDLPhenanthrene ug/kg 20 1500 240 1.7E+06 344 775 332 328 525 395 613 6802 486Pyrene ug/kg 20 2600 665 1.7E+06 1494 2224 1329 1283 1310 1133 1289 6533 2281Ammonia mg/kg 0.1 N/A N/A 1.5E+06 171 39.2 J 195 255 159 236 224 93.0 J 75.9 JTOC % 0.1 N/A N/A N/A 3.44 3.01 3.63 3.67 3.32 3.83 4.18 2.40 3.57TPH mg/kg 5.0 N/A N/A 2.3E+06 408 1350 243 247 270 341 303 1210 676Cyanide mg/kg 2.0 N/A N/A 48000 BDL BDL BDL BDL BDL BDL BDL BDL 0.09 JPercent Solids % 0.1 N/A N/A N/A 36.1 47.2 35.5 36.0 44.0 35.2 38.3 52.0 46.5
Gravel % N/A N/A N/A 0.0 0.0 0.0 0.0 0.0 0.0 0.0 0.0 0.0Sand % N/A N/A N/A 13.5 18.7 8.9 7.3 12.7 14.8 34.2 47.6 22.7Silt % N/A N/A N/A 65.7 58.6 69.4 68.0 68.1 67.8 51.9 39.3 62.3Clay % N/A N/A N/A 20.8 22.7 21.7 24.7 19.2 17.4 13.9 13.1 15.0
D50 mm N/A N/A N/A 0.013 0.015 0.012 0.011 0.016 0.017 0.032 0.055 0.024
Date Sampled: November 21 2013Contract H-CT-13 H-B1-13- Required NOAA NOAA TCEQ 13 14A 15 15 16 17 18 01 02
Parameter Units Detection ERM ERL PEL D up Limit
Dup = Duplicate SampleBDL = Below Detection Limit
J = The reported value is between the limit of detection (MDL) and the practical quantitation limit (RL), B = Analyte was found in the associated method blank. P = Spike recovery outside control limits, possibly due to matrix interference.PEL = TCEQ human health protective concentration levels as listed in 30 TAC §350, Table 4, Combined Tier 1 Soil PCLs, Residential, June 29, 2012.
Jul 2015
Contract H-CT-13 H-B1-13-Required NOAA NOAA TCEQ 13 14A 15 15 16 17 18 01 02
Parameter Units Detection ERM ERL PEL D up Limit
UN-NORMALIZED DATA as TEQs2,3,7,8-TCDD pg/g N/A N/A 26.1 14.3 6.29 10.0 0.970 J 0.85 J 0.27 J 5.41 4.991,2,3,7,8-PeCDD pg/g N/A N/A 1.93 J 2.91 J 1.67 J 1.85 J 1.17 J 1.03 J 0.92 J 1.20 J 1.92 J1,2,3,4,7,8-HxCDD pg/g N/A N/A 0.308 J 0.610 0.284 J 0.309 J 0.210 J 0.192 J 0.157 J 0.201 J 0.318 J1,2,3,6,7,8-HxCDD pg/g N/A N/A 1.00 3.18 0.896 0.979 0.606 0.556 0.502 0.888 1.131,2,3,7,8,9-HxCDD pg/g N/A N/A 1.05 * 1.85 * 0.962 * 1.02 * 0.648 0.591 * 0.529 * 0.659 * 0.962 *1,2,3,4,6,7,8-HpCDD pg/g N/A N/A 2.94 12.5 ** 2.84 3.22 2.20 1.83 1.60 2.66 3.29OCDD pg/g N/A N/A 1.29 4.92 ** 1.22 1.49 0.978 E++ 0.807 0.726 0.99 1.36 ++2,3,7,8-TCDF pg/g N/A N/A 6.02 3.85 1.58 2.42 0.291 0.254 0.148 J 1.61 1.481,2,3,7,8-PeCDF pg/g N/A N/A 0.111 J 0.105 U*** 0.0507 J 0.069 J 0.0216 J 0.0194 J 0.0148 J 0.0585 J 0.0633 J2,3,4,7,8-PeCDF pg/g N/A N/A 0.846 J 1.16 J 0.516 J 0.654 J 0.279 J 0.261 J 0.207 J 0.531 J 0.693 J1,2,3,4,7,8-HxCDF pg/g N/A N/A 0.979 * 1.73 * 0.560 * 0.686 * 0.312 J 0.280 J * 0.224 * 0.583 * 0.701 *1,2,3,6,7,8-HxCDF pg/g N/A N/A 0.415 J 0.822 0.327 J 0.370 J 0.190 J 0.176 J 0.138 J 0.337 J 0.390 ***2,3,4,6,7,8-HxCDF pg/g N/A N/A 0.236 J 0.477 J 0.255 J 0.271 J 0.153 J 0.142 J 0.115 J 0.194 J 0.235 J1,2,3,7,8,9-HxCDF pg/g N/A N/A 0.035 J 0.059 J 0.026 U+ 0.033 J 0.015 J 0.013 U+ 0.0130 U+ 0.029 *** 0.034 J1,2,3,4,6,7,8-HpCDF pg/g N/A N/A 0.621 1.59 0.559 0.638 0.415 0.359 0.314 0.542 0.6751,2,3,4,7,8,9-HpCDF pg/g N/A N/A 0.0358 J 0.122 0.0289 J 0.0327 J 0.0213 J 0.0187 J 0.0160 *** 0.0325 J 0.0449 J OCDF pg/g N/A N/A 0.0525 0.123 0.0429 0.0474 0.0278 0.0263 0.0268 0.0309 0.0408Total TEQ pg/g N/A N/A 1000 44.0 50.3 18.1 24.1 8.51 7.41 5.92 16.0 18.3NORMALIZED DATA as TEQs per 1% Organic Carbon2,3,7,8-TCDD pg/g N/A N/A 759 475 173 272 29 22 6 225 1401,2,3,7,8-PeCDD pg/g N/A N/A 56.1 96.7 46.0 50.4 35.2 26.9 22.0 50.0 53.81,2,3,4,7,8-HxCDD pg/g N/A N/A 9.0 20.3 7.8 8.4 6.3 5.0 3.8 8.4 8.91,2,3,6,7,8-HxCDD pg/g N/A N/A 29.1 105.6 24.7 26.7 18.3 14.5 12.0 37.0 31.71,2,3,7,8,9-HxCDD pg/g N/A N/A 30.5 61.5 26.5 27.8 19.5 15.4 12.7 27.5 26.91,2,3,4,6,7,8-HpCDD pg/g N/A N/A 85.5 415.3 78.2 87.7 66.3 47.8 38.3 110.8 92.2OCDD pg/g N/A N/A 37.5 163.5 33.6 40.6 29.5 21.1 17.4 41.3 38.12,3,7,8-TCDF pg/g N/A N/A 175.0 127.9 43.5 65.9 8.8 6.6 3.5 67.1 41.51,2,3,7,8-PeCDF pg/g N/A N/A 3.2 3.5 1.4 1.9 0.7 0.5 0.4 2.4 1.82,3,4,7,8-PeCDF pg/g N/A N/A 24.6 38.5 14.2 17.8 8.4 6.8 5.0 22.1 19.41,2,3,4,7,8-HxCDF pg/g N/A N/A 28.5 57.5 15.4 18.7 9.4 7.3 5.4 24.3 19.61,2,3,6,7,8-HxCDF pg/g N/A N/A 12.1 27.3 9.0 10.1 5.7 4.6 3.3 14.0 10.92,3,4,6,7,8-HxCDF pg/g N/A N/A 6.9 15.8 7.0 7.4 4.6 3.7 2.8 8.1 6.61,2,3,7,8,9-HxCDF pg/g N/A N/A 1.0 2.0 0.7 0.9 0.5 0.3 0.3 1.2 1.01,2,3,4,6,7,8-HpCDF pg/g N/A N/A 18.1 52.8 15.4 17.4 12.5 9.4 7.5 22.6 18.91,2,3,4,7,8,9-HpCDF pg/g N/A N/A 1.0 4.1 0.8 0.9 0.6 0.5 0.4 1.4 1.3OCDF pg/g N/A N/A 1.5 4.1 1.2 1.3 0.8 0.7 0.6 1.3 1.1Total TEQ pg/g N/A N/A 1278 1671 499 656 256 193 142 665 513
Dup = Duplicate SampleBDL = Below Detection Limit* EMPC (Estimated Maximum Possible Concentration) due to Merged Peak** Reults are from 5X Dilution.*** EMPC due to Diphenylether interference present caused dibenzofuran detected to become a "non-detect" with an elevated detection limit.+ EMPC because peak detected does not meet ratio criteria and has resulted in an elevated detection limit.++ Exceeds Maximum Calibration Limit because - PCDD/DF - Exceeds maximum Calibration Limit.J-Estimated result between EDL and RDL, B=Method Blank Contamination , E = Analyte concentration excceds the maximum concetration level, U=Undetected at the limit of quantitation. PEL = TCEQ human health protective concentration levels as listed in 30 TAC §350, Table 4, Combined Tier 1 Soil PCLs, Residential, June 29, 2012.
Jul 2015

ATTACHMENT 5 – AUTHORIZED USACE PERMIT
Jul 2015


