The impact of Self-service technologies and other non-technology drivers on customer satisfaction in the Irish supermarket industry Kiran N Tawari Masters of science in Management National College of Ireland Submitted to the National College of Ireland, August 2019.
Transcript
The impact of Self-service technologies and other non-technology
drivers on customer satisfaction in the Irish supermarket industry
Kiran N Tawari Masters of science in Management
National College of Ireland
Submitted to the National College of Ireland, August 2019.
Abstract
Customer satisfaction in retail supermarkets is driven by the quality of service being offered. With rapid advancements in technology, self-service technologies (SST) is one such channel being adopted by retailers to serve customers. Other than these technological interface, there are also certain non-technology elements like servicescape, value for money and employee service present in the supermarket which justifies the service quality being offered by the firm which further affects the customer satisfaction levels. Therefore, the purpose of this paper is to examine the impact of SST on customer satisfaction, after controlling for known non-technology drivers of customer satisfaction in Irish supermarket industry.
This research embraces a cross-sectional research design following a quantitative approach in which questionnaire data was collected from 161 people through an online survey, who have previously used SST during their visit to the supermarket. Convenience and snowball sampling technique was used to get survey responses and in order to test the hypothesis posited in the study, multiple regression and hierarchical regression analysis was used.
The results of multiple regression analysis show that enjoyment, assurance and convenience attribute of SST are positively associated with customer satisfaction. Additionally, the hierarchical analysis reveals that when the controlling non-technology elements are included in the model with SST attributes, the non-technology elements by themselves contribute higher degree of variance in customer satisfaction in comparison to the SST attributes which add a minimal explanatory power to the model. The key finding obtained through this paper contributes to the existing literature by identifying the controlling non-technology drivers associated with customer satisfaction than the SST attributes, in Irish supermarket context. The results also give meaningful implication to retailers that they should not neglect the basic fundamental elements like employee service, value for money, servicescape in this digital age as they affect the customer satisfaction levels to a substantial extent.
Keywords: self-service technologies, customer satisfaction, non-technology factors, servicescape, value for money, employee service, supermarket industry
�2
Submission of Thesis and Dissertation National College of Ireland
Research Students Declaration Form (Thesis/Author Declaration Form)
Name: Kiran N TawariStudent Number: x17170192Degree for which thesis is submitted: Master of science in Management
Material submitted for award
A. I declare that the work has been composed by myself. B. I declare that all verbatim extracts contained in the thesis have been
distinguished by quotation marks and the sources of information
specifically acknowledged. C. My thesis will be included in electronic format in the College
Institutional Repository TRAP (thesis reports and projects)
D. Either* I declare that no material contained in the thesis has been
used in any other submission for an academic award.
Or * I declare that the following material contained in the thesis formed part of a submission for the award of
(State the award and the awarding body and list the material below)
Signature of research student:
Date: 21 August 2019
�3
Submission of Thesis to Norma Smurfit Library, National College of Ireland
Student name: Kiran N Tawari Student number: x17170192 School: School of BusinessCourse: MSc ManagementDegree to be awarded: Master of Science in Management
Title of Thesis: The Impact of Self service technologies and other non-technology drivers on customer satisfaction in the Irish supermarket industry
One hard bound copy of your thesis will be lodged in the Norma Smurfit Library and will be available for consultation. The electronic copy will be accessible in TRAP (http://trap.ncirl.ie/), the National College of Ireland’s Institutional Repository. In accordance with normal academic library practice all theses lodged in the National College of Ireland Institutional Repository (TRAP) are made available on open access.
I agree to a hard-bound copy of my thesis being available for consultation in the library. I also agree to an electronic copy of my thesis being made publicly available on the National College of Ireland’s Institutional Repository TRAP.
Signature of Candidate:
For completion by the School:
The aforementioned thesis was received by Date:
This signed form must be appended to all hard bound and electronic copies of your thesis submitted to your school.
�4
Acknowledgements
I would like to express my sincere gratitude to Dr. Paul Hanly for all his valuable and constructive suggestions throughout the course of research, from initial planning and conceptualisation till the completion of the full research work. His generosity of giving time is highly appreciated.
I would also like to thank all the library staff members for making the library always accessible for finding the relevant resources. Additionally, I would also like to thank all the participants for responding to the survey.
Finally, I would like to thank and dedicate this dissertation to my parents and my dear friend Krish Advani.
�5
Table of Contents Abstract 2 ..........................................................................................................................
Chapter 2: Literature Review 14 ......................................................................................
2.1 Introduction 14....................................................................................................2.2 Retail industry in Ireland 14.................................................................................2.3 Self-checkouts as SST in Supermarket 16.........................................................2.4 Service quality 17...............................................................................................2.5 Measurement of Service Quality 18...................................................................
2.5.1 SSTQUAL 21...............................................................................................2.6. Other drivers in the supermarket 22..................................................................
2.6.1 Servicescape 22..........................................................................................2.6.2 Value for money 24......................................................................................2.6.3 Employee service 25...................................................................................
3.1 Introduction 30....................................................................................................3.2 Theoretical Framework 30...................................................................................3.3 Research Aim 31.................................................................................................3.4 Hypothesis 31.....................................................................................................3.5 Research Philosophy 32.....................................................................................3.6 Research approach 33........................................................................................3.7 Research design and strategy 33.......................................................................3.8 Population and sampling 34...............................................................................3.9 Data collection 35...............................................................................................3.10 Questionnaire design 36...................................................................................3.11 Statistical Analysis 39.......................................................................................3.12 Pilot study 40....................................................................................................3.13 Ethical considerations 41..................................................................................3.14 Research Design Limitations 41........................................................................
Chapter 4: Data Analysis 43 ............................................................................................
4.5.1 Customer Satisfaction and Demographic variables 47..............................4.5.1.1 Customer satisfaction and Gender 474.5.1.2 Customer satisfaction and Age 484.5.1.3 Customer satisfaction and Education Level 48
6.1 Limitations and Future Research 65...................................................................6.2 Conclusion 66.....................................................................................................
Table 1: Questionnaire items and their specific Likert response scale
Table 2: Descriptive statistics
Table 3: Reliability coefficients
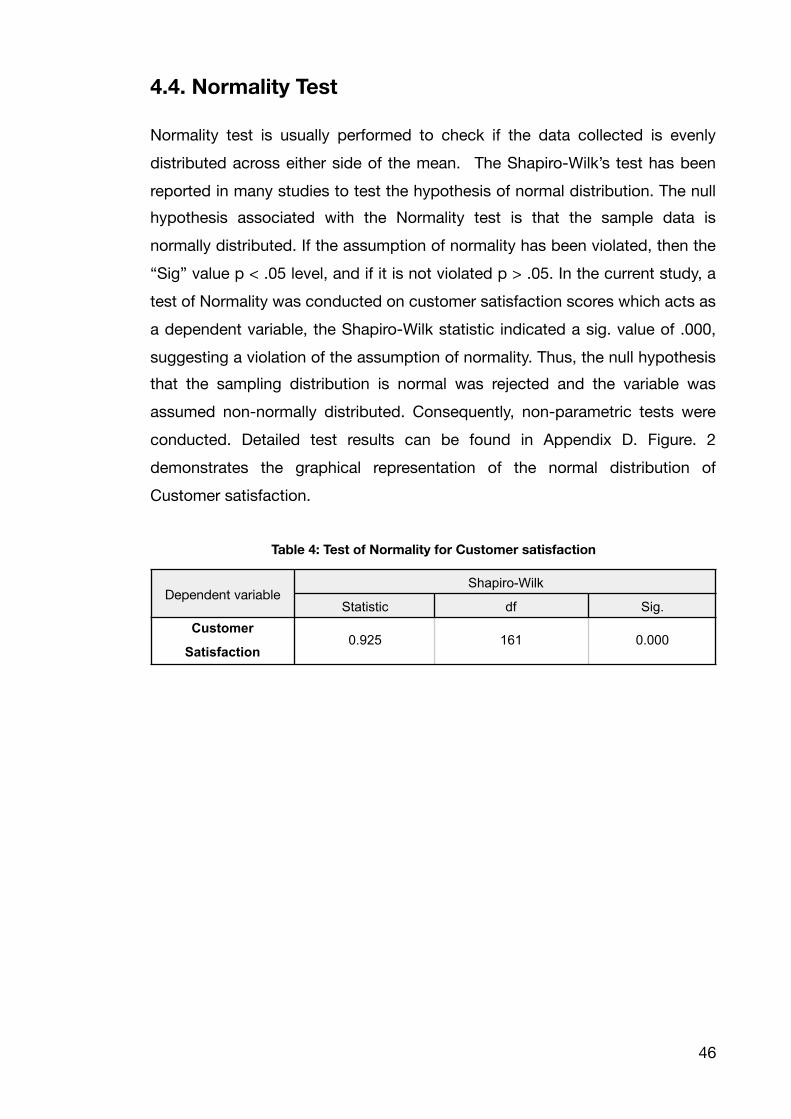
Table 4: Test of Normality for Customer satisfaction
Table 5: Mann-Whitney Test for Customer satisfaction and Gender variable
Table 6: Krushkal-Wallis test for Customer satisfaction and Age
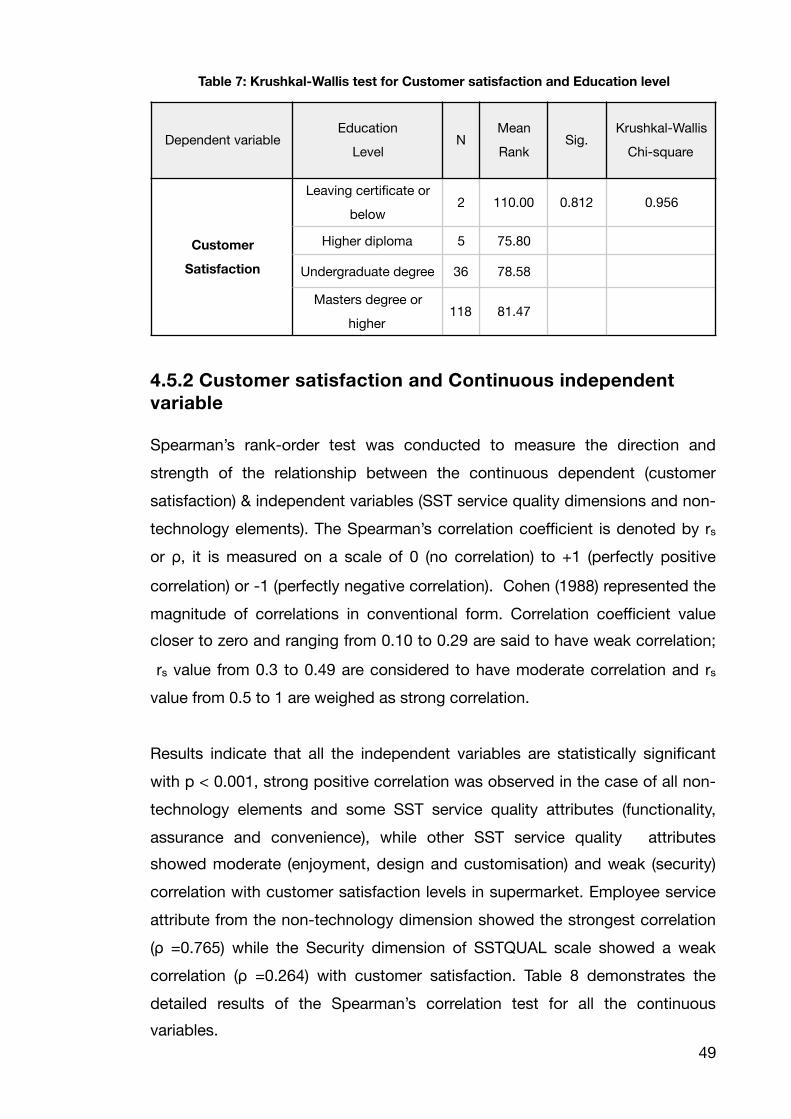
Table 7: Krushkal-Wallis test for Customer satisfaction and Education level
Table 8: Spearman’s correlation test
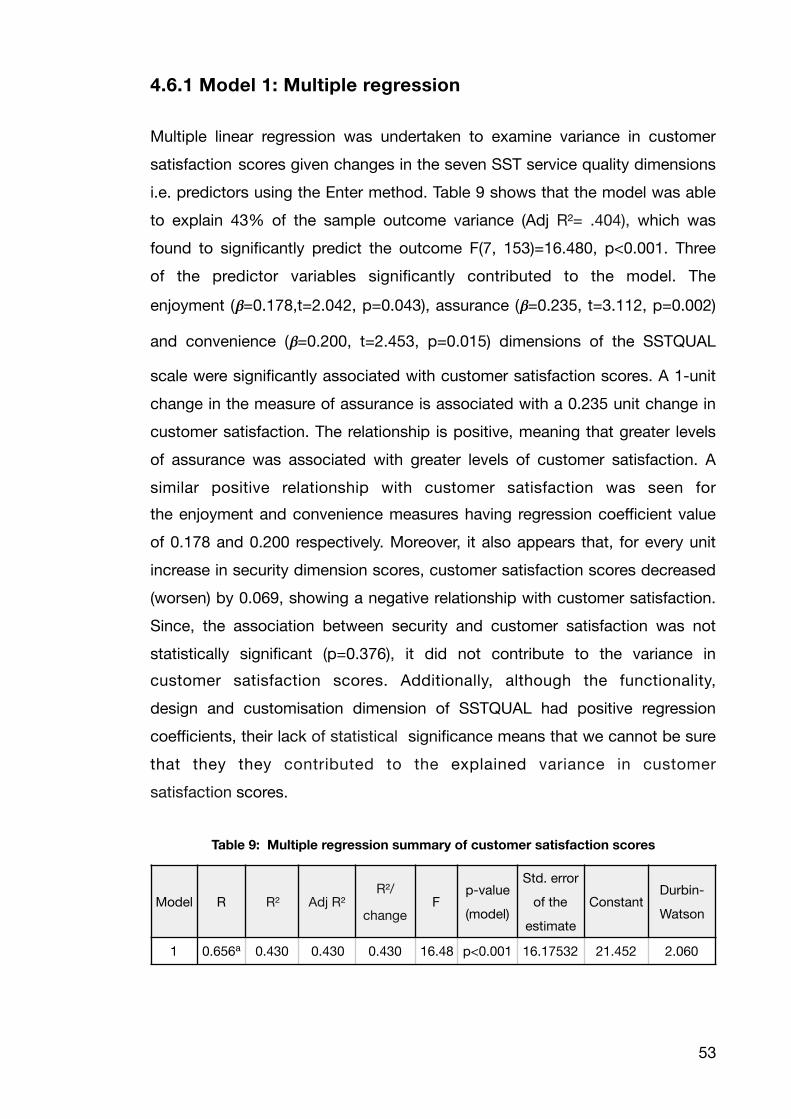
Table 9: Multiple regression summary of customer satisfaction scores
Table 10: Multiple regression coefficients
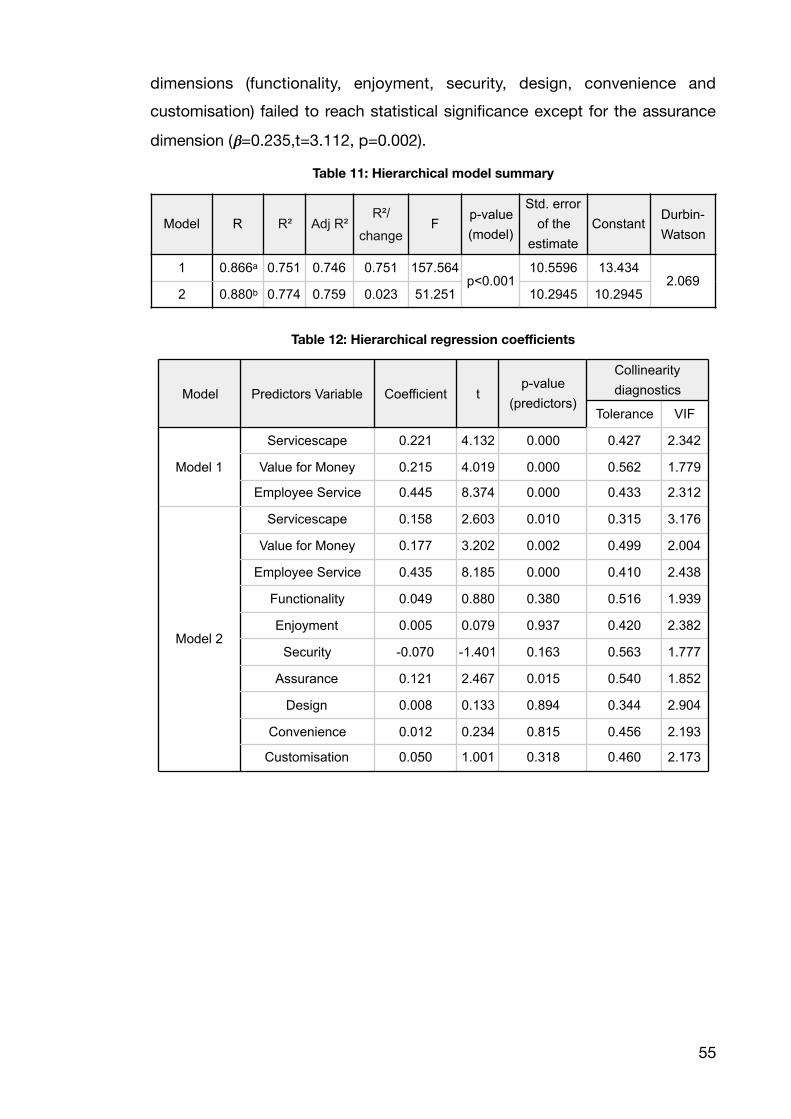
Table 11: Hierarchical model summary
Table 12: Hierarchical regression coefficients
�8
List of Figures
Figure 1: Theoretical framework
Figure 2: Normal distribution of Customer satisfaction
Figure 3: Normal distribution of standardized residual values
Figure 4: Scatterplot for standardized residual values
�9
List of Abbreviations
SST: Self-service technologies
CSAT: Customer satisfaction
GDP: Gross domestic product
ISQ: Internal service quality
ESQ: External service quality
RSQS: Retail Service Quality Scale
ACSI: American Customer Satisfaction Index
SCSB: Swedish Customer Satisfaction Barometer
GCSB: German Customer Satisfaction Barometer
ECSI: European Customer Satisfaction Index
NCSB: Norwegian Customer Satisfaction Barometer
SPSS: Statistical Package for Social Sciences
GDPR: General Data Protection Regulation
HIPAA: Health Insurance Portability and Accountability Act
�10
Chapter 1: Introduction 1.1 Introduction
The popularity of internet and evolution of technology has radically revolutionised the entire service delivery process by shifting from a traditional to a self-service mode (Campbell, Maglio and Davis, 2011). Self-service can be categorised into two different forms which is technologically driven and non technologically driven. This study focuses on self-service channels driven by technology i.e. known as the self-service technologies (SSTs). These are self-service channels that empower consumers to manage their services through technological interface by themselves without any human intervention (Meuter et al, 2000). Some examples of these technology-driven self-service options are self-checkouts in the retail supermarket, ATMs in banks and self-check-in option seen at the airport (Meuter et al, 2000).
Businesses are encouraging the use of SSTs as it helps them reduce the service delivery costs and improve customer experience (Scherer, Wünderlich and Wangenheim, 2015). For example, in the U.S. the cost of banking transactions decreased from 1.15 U.S. dollars to only 2 cents by replacing offline to online transaction (Moon and Frei, 2000); self check-in options at the airport enabled faster processing of passengers by 50 % (SITA, 2009); the self checkout kiosk in the grocery store replaced around 2.5 employees (The Economist, 2009). Moreover, service organisations are implementing SST due to its increased efficiency, flexibility and effectiveness (Kelly, Lawlor, & Mulvey, 2017; Kokkinou & Cranage, 2013). Furthermore, SSTs have been reported to be beneficial to both employees and customers as it allows them to save their time and access the service at their convenience (Yang & Klassen, 2008). Prior literature shows that SSTs can influence customer satisfaction and loyalty, which further helps in reaching out to new consumer segments (Bitner et al, 2002). Given the significance of SSTs in service environment, this research aims to study the impact of self-checkout SST on customer satisfaction levels in the supermarket industry.
�11
In a supermarket environment there are known non-technology factors like supermarket location, servicescape(physical environment), product quality, good price value, promotional offers, employee staff service, etc. that have been identified in the retail literature as drivers of customer satisfaction (Jayasankaraprasad and Vijaya Kumar, 2012; Puccinelli et al., 2009; Martensen, 2007). For the purpose of this study, supermarket servicescape, value for money and employee service have been chosen as the the non-technology elements that influence customer satisfaction. These non-technology elements have been chosen as controlling factors in the study to explore if these SSTs implemented by supermarkets add an extra explanatory power to customer satisfaction levels.
Customer satisfaction being an essential metric for service organisations has been considered a topic of research by many authors who have focussed their studies in understanding the relationship between service quality and customer satisfaction (Grönroos, 2001; Furrer, Liu, & Sudharshan, 2000; Cronin & Taylor, 1992). Even so, in the literature, there still exists a gap due to contradictory findings around the impact (Buell et al. 2010) of self-service quality on customer satisfaction despite of testing these relationships through single service channel. Therefore, it is essential to examine the impact of these SST attributes on customer satisfaction (Shamdasani et al., 2008).
This study aims to understand the role of SST service quality attributes on customer satisfaction in the Irish supermarket industry, after controlling for known non-technology drivers of customer satisfaction. We also aim to identify which of the SST attributes contributes the most to customer satisfaction. From the review of extant literature around service quality measurement, the SSTQUAL model developed by Lin and Hsieh (2011) has been used in this study to measure the service quality of SST. Moreover, this research takes a quantitative approach using online surveys for data collection. Finally, the findings obtained from this research are expected to contribute to the retail literature by identifying the strongest predictor of customer satisfaction amongst the SST attributes and the known non-technology factors.
�12
1.2 Dissertation Structure
Chapter 1 presents the the intent and motivation to research impact on customer satisfaction through technology and non-technology aspect in supermarket industry.
Chapter 2 discusses the literature around the key topics involved in study like self-checkout SST, service quality, service quality measurement, non-technology elements and customer satisfaction. Chapter 3 discusses the research methodology adopted in this study. It includes the theoretical framework, research aim and hypothesis formulated for this study. It also explains the justification for selecting the desired approach along with the limitations.
Chapter 4 presents the results obtained from the survey after analysing the data. It includes descriptive statistics and the results of different statistical tests undertaken in this study.
Chapter 5 presents the discussion around the key findings obtained from the study along with the theoretical and managerial implications identified from the study.
Chapter 6 outlines the conclusion, research limitations and recommendations for future research.
�13
Chapter 2: Literature Review
2.1 Introduction
The purpose of this literature review is to discuss known and potential technological and non technological drivers in the supermarket industry which affect customer satisfaction levels. This chapter will provide critical assessment of the key concepts and theoretical models involved around the study. Building upon the extant evidence base reported in previous research, the aim of this study is to investigate the impact of self service technologies (SST) and other drivers of customer satisfaction in the Irish supermarket industry. Specifically, the following chapter begins by reviewing the retail industry in Ireland, followed by a brief discussion around self-checkout option in the supermarket. Furthermore, the concept of service quality is explored and relevant scales and instruments to measure service quality are discussed. The remaining part of the chapter proceeds with discussion around the non technological factors chosen from the literature such as servicescape, value for money and employee service in the supermarket, concluding with a discussion around the theory and perception of customer satisfaction.
2.2 Retail industry in Ireland
With rapid globalisation, market convergence through information and communication technology, and the rise of homogeneous consumer preferences globally, retail internationalisation is on the march across the global service markets (De Mooij and Hofstede, 2002 ).
Retail has been an influential sector in Europe’s economy, it is a large source of employment and an important factor adding to the nation's Gross Domestic Product (GDP) (Knezevic, Renko and Knego, 2011). According to the Eurostat data (2018) of Europe's employment sector breakdown, the retail and wholesale sector recorded the highest percentage of total employment in Europe with 24.7% in comparison to the other sectors such as construction, agriculture or financial which contributed 6.4%, 4.3% and 2.5% respectively (Eurostat, 2018). In Ireland, retail is the biggest industry and it has a significant role in contributing to the overall nations economic growth and development. It
�14
has its presence all across the country in every town, city, and village, employing around 285,000 people (Retail Ireland, 2019). The Irish retail sector presently is generating revenues of around €30 billion every year and contributing up to nearly 12% of Ireland’s GDP (Retail Ireland, 2017).
In this highly competitive sector with giants such as Amazon, Walmart and Tesco, it is an absolute necessity to employ a high degree of innovation and understanding market trends in order to have a competitive advantage (Grewal, Roggeven and Nordfalt, 2017). According to several global retail conferences, the current global trends seen in the retailing sector are hybrid concepts of stores, changing consumer lifestyle, hyper-local retailing, fast and convenient shopping and Artificial Intelligence (Kunc and Krizan, 2018).
Researchers are of the opinion that technology plays a vital role in enabling firms to meet global business trends. Technology has been considered to be a ‘game changer’ for the retailing sector for customers and retailers (Grewal et al, 2017). Similarly, Sorace et al. (2017) mentions that continuous changes in technology challenges the retail sector to improve experiences and the overall retail process by identifying creative solutions to the challenges faced. Advancements like, mobile apps, scan-and-go technologies, self checkouts, QueVision and smart shelf technology have helped consumers in taking conscious purchasing decisions, receive focussed and valuable offers and obtain speedy service (Grewal et al, 2017; Inmam and Nikolova, 2017).
Inman and Nikolova (2017) pointed out that new technologies like the SSTs provide value by increasing profit through attracting new shoppers and decreasing labor cost through off-boarding to customers. These self-checkout enable customers to scan their items themselves and make payment. However, implementation of SSTs in retail service setting was increasing, there were certain retail organisations like Albertsons and Jewel-Osco and Provigo in the US and Canada who isolated the self checkout systems to provide superior customer experience through personalised human interaction (Buell, Campbell and Frei, 2014). Correspondingly, in France, a European country, the consumers preferred traditional checkouts in comparison to the self-checkouts
�15
which attracted only 10-15% of French customers in supermarkets (IFOP, 2014).
As the discussion above shows that competition amongst retail organisations is highly aggressive and one of the domains that may provide a competitive edge is through technological innovations as discussed. Hence, it is essential to examine whether these technological advancements like SSTs do actually offer better customer experience and satisfaction levels, or it is just an assumption.
2.3 Self-checkouts as SST in Supermarket
Retail organisations in Europe are massively investing in implementing SSTs as a part of their growth strategy (Retail Technology, 2010). The global self-checkout market is predicted to reach around $18 billion, and also the number of self-checkout installations are expected to rise from around 240,000 in 2016 to 468,000 by 2021 globally (Lufkin, 2017). Self-scan checkout seen at supermarkets are a technology-enabled self-service option in which customers play the role of the cashier themselves, by scanning and paying for the items purchased.
Adoption of these technologies has changed the concept of customer-staff relationship to consumer-technology relationship (Hilton et al, 2013), which, even though it gave consumers an independent experience, it also led to some consequences because of working customer (Anitsal & Schumann, 2007; Voss & Rieder, 2005). Moreover, a lot of customers might think that learning to operate this technology and the behavioural changes needed is not worthwhile enough (Gatignon and Robertson,1991). Beatson et al. (2006) in his research on examining SST characteristics versus personal service found out that customers prefer personal service interactions with staff in comparison to using SST. Likewise, Kokkinou and Cranage (2013) were also of a similar opinion that under certain situations, SSTs do not essentially create a pleasant customer experience. Technology trust and technology anxiety also directly affect consumer satisfaction levels when using SSTs like the self-scan checkouts in the supermarket (Liu, 2012).
Additionally, sudden failure or malfunction of technology while scanning the items can create a negative experience for the customer which hampers the entire service process in which he does not have any provision to recover the self-service, which directly has an impact on the customer satisfaction levels (Verhoef et al. 2009; Grewal, Levy and Kumar, 2009). Organisations in situations like this have appointed employees to help customers in the self-service recovery process. However, previous research findings state that having an employee involved in the recovery process can be disappointing for customers who were looking originally looking to avert human interaction (Mattila et al, 2011), whereas other research recommend that customers wish to have an employee close by whenever they encounter any failure situation ( Zhou et al, 2013, Dixon et al, 2001).
Self scan checkout systems have become an essential factor in the supermarket industry and consumers daily lives. This study attempts to examine the effect of these technology enabled self service channels like the self-checkout systems implemented in Irish supermarkets on customers satisfaction.
2.4 Service quality
Service quality has been explained differently in the literature. Service quality, in general, is the assessment of any kind of service and is a hypothetical concept because of its attributes such as intangibility, heterogeneity and inseparability of production and consumption (Parasuraman, Zeithaml and Berry, 1985), whereas other researchers have stated service quality as a multidimensional construct formed by different service characteristics (Mittal et al. 1999). Holbrook (1994, p. 407), states that "Quality is an extraordinarily slippery concept, easy to visualise but exasperatingly difficult to define”. (Parasuraman et al. 1985) has further elaborated service quality as the difference between customers expectation of service and perceived service, if there is a mismatch between customers expectation and the performance of the service, it is most likely to cause dissatisfaction. Mittal et.al (1999) has explained service quality as a focused assessment of the customer's perception of service quality
elements like the quality of communication, quality of physical environment and outcome quality. Chiou and Droge (2006) argued that service quality brings about overall customer satisfaction, trust and develops behavioural intentions.
Service quality can be classified into internal service quality(ISQ) and external service quality(ESQ) (Latif et al, 2016). ISQ refers to the quality of service provided to the internal employees of the organisation by different divisions in the organisations whereas ESQ refers to the quality of service provided to the customers of the organisation. Many researchers have laid emphasis on examining the quality of service being exchanged between representatives of the organisation (Omid et al. 2014). However, Vassileva and Balloni (2014) argue that service quality is generally defined keeping the customers as its focal point.
Customer service has been considered integral to service quality (Bennett & Rundle-Thiele, 2004; Cronin et al, 2000). Provisioning an excellent customer service remains a top priority for supermarkets as consumers have become value oriented and look for a pleasant shopping experience (Lewison, 1997). SST’s have been one such form of technology used by organisations to deliver better quality of services (Anderson et al.,2013). Thus, service organisations, like the supermarket, are constantly seeking to improve their service quality standards at every instance.
Therefore, the current research offers to examine the service quality of the SSTs implemented in the Irish supermarket.
2.5 Measurement of Service Quality
Service quality continues to remain a topic of interest across the service industry. Since quality has been defined differently by many researchers, it still remains a very abstract concept. However, irrespective of the ambiguity in the definitions, measuring service quality is an activity of high importance, as it allows us to measure the service quality before and after the changes have occurred, to identify what kind of impact it has on customer behaviour.
�18
Grönroos (1984) was one of the initial researchers to come up with two dimensions to measure service quality, which are technical and functional quality. Technical quality pertains to the end result of the service interaction process, on the other hand, functional quality is associated with the entire communication between the customer and the service provider. Furthermore, corporate image of the organisation was also considered as an essential attribute which helps in understanding the service quality (Grönroos, 1984). Rust and Oliver (1994) further contributed to the model suggested by Gronroos (1984) by adding a third dimension of the physical environment in which the services take place.
Parasuraman, et al (1985) came up with the “SERVQUAL” model to measure service quality. The “SERVQUAL” model is the most famous and widely used model to measure service quality in the retail context which has a five key dimensions to measure the service quality which are Tangibility, Reliability, Responsiveness, Empathy and Assurance (Zeithaml, Berry and Parasuraman, 1988). Although the “SERVQUAL” model is the most commonly used measurement instrument, it has faced much criticism like, multiple elements to measure, not capturing the process of encounter, paradigmatic foundation, use of different scoring mechanism and flawed seven point likert scale (Buttle, 1996). Owing to these criticisms, a new model was developed, known as SERVPERF developed by Cronin and Taylor (1992). This model measured the overall performance of the service quality which uses only 50% of the attributes as compared to SERVQUAL and incorporates performance properties, which makes it a better and efficient service quality measurement model (Babakus and Boller, 1992; Bolton and Drew, 1991).
Furthermore, Finn and Lamb(1991) tested the widely used ‘SERVQUAL’ model in retail stores carrying out confirmatory factor analysis and found that it was not suitable for retail setting which lead to Dabholkar et at. (1996) develop a new Retail Service Quality Scale (RSQS) appropriate for measuring the retail service quality which includes five key elements such as personal interaction (courteous and cordial staff), physical environment (store atmosphere and layout), reliability (ethical considerations), problem solving (trained personnel) and policy (store policies and quality of products). Nguyen and Le Nguyen
�19
(2007), are of the opinion that the RSQS scale when used in supermarket context was unable to meet the discriminant and validity tests for personal interaction and problem solving dimension. Nonetheless, irrespective of the limitations stated by several researchers, it is evident through the literature that SERVQUAL and RSQS are the most preferred instruments to measure service quality in retail context (Gaur and Agrawal, 2006).
Hence, all the major scales introduced were basically designed to measure the service quality levels where an interaction between a service employee and a customer was present, and these scales did not take into account the interactions between a customer and a technological interface such as SST. However, In order to quantify service quality perceived through technological interfaces, measures such as eTransQual by Bauer, Falk, and Hammerschmidt (2006) were developed. Furthermore, eSELFQUAL was developed by Ding, Hu, and Sheng (2011) to measure service quality of electronic service encounters. Moreover, other scales like SITEQUAL (Yoo and Donthu, 2001), IRSQ (Janda, Trocchia, and Gwinner, 2001), eTail (Wolfinbarger and Gilly, 2003), E-S-QUAL (Parasuraman, Zeithaml and Malhotra, 2005) included parameters like privacy, functionality, ease of use, aesthetic design, access, entertainment, accuracy, and efficiency, which measured electronic service quality in the context of internet and online shopping websites. Even so, these scales were designed to measure the consumer to online technology interaction, hence even though it was designed for technological interfaces, it was not suitable for service quality of SST’s. Fassnacy and Koese (2006, p.25) broadened the meaning of e-service quality by not restricting the e-service limited to just websites but any electronic service which is able to effectively and efficiently manage customer needs. Moreover, unlike the definitions of traditional service quality where the concept of ‘expectation’ and ‘actual performance’ are highlighted significantly, the e-service quality conceptualisation does not take into account much (Radomir and Nistor, 2014). This is because the quality of electronic service is generally analyzed through the experience while using it (Santos, 2003). To address this, Lin and Hsieh(2011) presented the SSTQUAL scale in line with Fassnacy and
�20
Koese(2006) viewpoint, which focused on measuring service quality in direct SST interactions of customers and is therefore being adopted in current research to measure SST service quality.
2.5.1 SSTQUAL
The SSTQUAL scale was primarily developed due to absence of standard instrument to measure SST service quality across different industries (Lin and Hsieh, 2011). SSTQUAL derives its’ dimensions from other scales developed on e-services (Mango, Muceldili and Erdil, 2017). It consists of 20 items across 7 essential dimensions (Lin and Hsieh, 2011) as follows:
• Functional characteristics of SSTs are attributed by responsiveness, reliability, and easy of use.
• Enjoyment is the level of joy which the customer experiences during SST delivery and outcome.
• Security/privacy is associated with security concerns of customers such as protection against intrusion, fraud, and loss of personal information.
• Assurance represents the confidence portrayed by the SST provider due to their reputation and competence.
• Design is associated with the visual structure of the overall system.
• Convenience is the ease of accessibility of SSTs services which are offered by the firm.
• Customisation is an attribute which is the capacity/degree of a particular system to be tailor made to fit the needs and wants of a customer through the process of co- production.
SSTQUAL has been the foundation model for examining the SST service quality across self-checkout at the supermarket (Orel and Kara, 2014) as well as in the banking sector (Radomir and Nistor, 2012). The SSTQUAL scale when used in banking context found only five quality dimensions (Assurance relabeled as Image, Functionality, Enjoyment, Customization and Security/Privacy) relevant compared to the seven dimensions suggested by Lin and Hsieh(2011). The difference between dimensions is because the experiment
�21
was conducted in different market where SST adoption varied across customers and banks, the sample was different and contrasting statistical techniques (Radomir & Nistor, 2012).
Thus, regardless of the disparity between the dimensions relevant across different sectors, the SSTQUAL scale has proven to be a powerful instrument from theoretical and managerial aspect across different markets and industries with generalizable results (Radomir & Nistor, 2012).
To conclude, the current study uses the SSTQUAL model to measure the service quality of the self checkout machines in Irish supermarkets.
2.6. Other drivers in the supermarket
In the supermarket context, technological attributes are not the only drivers of customer satisfaction, non-technological interfaces also play a vital role and have its share of contribution when it comes to customer satisfaction levels. Thus, from the literature available around retail, the retail servicescape, service employees and value for money have been considered as antecedents of customer value and satisfaction for the present study.
2.6.1 Servicescape
When consumers visit any retail supermarket, the first thing they notice is the service environment, depending on which they make their judgements about the kind of service they would receive (Hooper, Coughlan and Mullen, 2013). The service environment of any retail store has been referred by different terminologies such as ‘environment psychology’ (Mehrabian and Russell,1974), ‘store atmospherics’ (Kotler,1974), ‘store environment’ (Baker, 1987) or ‘servicescapes’ (Bitner, 1992), out of which servicescape is the most commonly used term when referring to the physical service environment (Hooper, et al., 2013).
Bitner (1992) came up with the term ‘Servicescape’ which referred to the retailers modifying the physical environment for providing better services and experience to the consumers through tangible and intangible components
�22
(Hoffman and Turley, 2002). Ambient conditions, spatial layout & functionality and aesthetic design elements are the dimensions identified by Bitner(1992). Ambient factors such as music, lighting, temperature have been widely studied in the atmospheric literature, which informs us of the way consumers think, feel and respond to particular components. There has been speculation in the literature that these ambient conditions do not have a direct impact on customer behaviour (Hooper, et al., 2013), however, Hightower et al. (2002) noted that if these ambient factors if ignored, can have a negative impact on consumer behaviour. The manner in which the visual elements like furniture and other facilities are arranged helps consumers to navigate across the supermarket (Grayson and McNeill, 2009). Zeithaml et al. (2009) mentioned that the layout of the supermarket can persuade customer satisfaction levels, their searching behaviour and the overall supermarket performance. Meanwhile, Bitner(1992) pointed out that a structural layout which makes consumers move around a lot can cause dissatisfaction. Furthermore, Newman(2007) noted that having effective signage in the service environment create a positive perception in customers mind that the organisation is aware of customer needs and satisfaction.Thus, from the above analysis on significance of servicescape elements on consumer behaviour, it will be interesting to find out if the servicescape of supermarket influence consumer satisfaction levels.
Mehrabian and Russel (1974) developed the Stimulus-Organism-Response (S-O-R) model. According to this model, stimulus elements like store layout, visual displays, music, lighting create an emotional response in the form of pleasure, arousal or dominance which further influences the consumer behavioural responses (Herrington & Capella, 1996).
Although service quality has been defined as a multidimensional construct, researchers have not been able to decide its fix dimensions (Hooper, et al., 2013). However, the tangible component meaning the physical service environment has been a common construct across all the service quality constructs. Parasuraman et al. (1985) in the SERVQUAL framework and Cronin and Taylor (1992) in SERVPERF model have stated the importance of servicescape for measuring the service quality. The current study has used servicescape as a construct from Cronin and Taylor’s (1992) service quality
framework to determine if it actually affects the consumer satisfaction levels in the supermarket.
2.6.2 Value for money
The concept of ‘customer value’ has gained a significant amount of attention in the marketing literature (Arnould, 2014). Johnson et al. (2006) defined ‘perceived value’ as a function of price and quality. Findlay and Sparks(2008) argue that consumers now are making rational choices while purchasing by taking into account factors like value for money, time and effortless shopping. In this current context, value for money can be understood as a general evaluation of the usefulness of the product, depending on what is received and what is provided (Zeithaml, 1998).
Value has been considered as a multidimensional construct (Sánchez-Fernández et al., 2009), which can be categorised into two main approaches i.e. trade-off approach and experiential approach (Ruiz, Gallarza and Gil, 2018). Trade-off approach defines value from price-quantity point of view (Dodds et al., 1991), which has been well suited and used by different researchers in shopping context (Sweeney et al., 1999; Baker et al., 2002) and modern situations (Beneke and Carter, 2015) where value for money, price and perceived risk are considered as critical factors. Meanwhile, in the case of experiential approach, value is not only defined from hedonic, utilitarian and cognitive perspective, taking into account the customer behaviour, but also from monetary and non monetary perspective (Ruiz et al, 2018).
Different scales and models were developed using the experiential approach and the first one, developed by Holbrook(1994, 1999) identified eight attributes of value as efficiency, excellence (quality), play, aesthetics, esteem, status, ethics and spirituality. These attributes were discovered through a three-dimensional model: extrinsic versus intrinsic; active versus reactive and self-oriented versus other oriented. The second scale suggested by Babin et al (1994) comprised of eleven hedonic and five utilitarian value indicators which is well suited to study shopping experience in retail service settings such as departmental or discount stores (Seo and Lee, 2008). Furthermore, Sweeney and Soutar (2001) developed the PERVAL scale, having emotional, social and
two functional values as dimensions, in which value for money and product quality accounted for the functional aspect. Finally, Mathwick et al. (2001, 2002) presented four dimensions namely aesthetics, playfulness, service excellence and customer return on investment from Holbrook’s original model, however, this scale was primarily developed for online shopping setting.
Value for money has been considered as a vital factor in the retail sector, especially in supermarkets, such as Wal-Mart with its Every Day Low Pricing (EDLP) policies which has led to a common perception among consumers that all supermarkets generally offer value for money, making it an essential metric for a supermarket to become profitable (Ellickson and Misra, 2008). According to Neilsen (2008) value-for-money is the most attractive factor for grocery store choice in 2008 globally, similarly, Sweeney and Soutar (2001) stated that value for money is going to be a critical factor for both organisations and consumers in the coming years.
This research has adopted an experiential scale by Sweeney and Souatr (2001) to test the value for money aspect offered by supermarket and attempts to identify if it is of any real significance to customers and if it really alters their satisfaction levels.
2.6.3 Employee service
Employees are considered to be the most valuable asset in any organisation. It is a known factor that humans are more receptive to other humans, thus in a retail environment the human component consists of sales assistants, store managers, cashiers and other service staff (Kim and Kim, 2012). The human variable is considered to be compelling factor in brick and mortar stores which can influence consumers shopping behaviour (Liao and Liaw, 2003).However, recent evidence inform us that online retail giants like Amazon are entering the brick and mortar space with disruptive technology such as Amazon Go, which will completely eliminate cashiers and the checkout systems (Soper, 2018). Technology like Amazon Go will knock out the discomfort of waiting in line for making payments, it allows you to enter the store and shop whatever you want and leave (Clifford, 2019).
The importance of social dimension is also mentioned in the literature of store atmospheric suggested by Baker (1986). Kim and Kim (2012) highlighted, number of salesperson, store employees physical attributes and behavioural characteristics as the three main components which could affect the human customer interaction in the supermarket. First, having adequate number of salesperson available in the supermarket makes consumers imagine that there will be less waiting time, which creates a positive impression about the store in their mind (Baker and Cameron, 1996). Hence, having the right number of service employees in the supermarket helps in delivering prompt services and giving personal attention to the customers whenever required. Second, the physical characteristics like supermarket employees attire and body structure have an impact on consumers perception about the service and further affecting the customer satisfaction (Söderlund and Julander , 2009). Furthermore, demographic factors like age, sex and ethinicity also play a role in consumer employee interaction in supermarket service setting (Churchill, 1975). Finally, the behavioural attribute is very important in retail service setting, the employees are expected to be well behaved when interacting with customers. Behavioural characteristics such as friendliness, trustworthiness, patience, competence, quick service, personable style are some of the essential attributes the employees in the supermarket should possess when communicating with the customers (Kim and Kim, 2012).
Most of the service quality instruments like RSQS (Dabholkar et al,1996), SERVQUAL (Parasuraman et al.,1985) and SERVPERF (Cronin and Taylor, 1992) have included employee-customer interaction as a sub-construct in their scales when assessing the service quality. The present study utilises the employee service attribute from the scale developed by Cronin and Taylor (1992) as it has been widely acknowledged in the literature to not only measure service quality but also the performance aspect in different service sectors like retail, healthcare, entertainment or banking, thus suiting well for our study (Yılmaz, 2009).
Therefore, from the above discussions around the importance of social interaction and behaviour in the supermarket and the retail organisations implementing advanced technological systems, it will be worthwhile to
�26
research and find out if it is the employee service or the technological interface in supermarket that cause greater customer satisfaction amongst the consumers.
2.7 Customer Satisfaction
In spite of a significant amount of literature available on customer satisfaction, researchers have found the concept very broad and vague (Bendaravičienė and Vilkytė, 2019). Angelova and Zekiri, 2011, p.61 defined customer satisfaction as “the degree of overall pleasure or contentment felt by the customer, resulting from the ability of the service to fulfil the customer’s desires, expectations and needs in relation to the service”. Similarly, Oliver (1980, p. 464) has cited satisfaction as “a cognitive and affective reaction to a service incident”. The overall customer experience with the product or service is considered as a driver for customer satisfaction (Cronin & Taylor 1992, Tsitskari et al., 2014). Furthermore, Oliver (1999) posited two levels of satisfaction, particularly as the transactional(micro) and the overall (global) level. Transactional level of satisfaction refer to distinct service experience whereas overall satisfaction considers a comprehensive experience with the organisation (Bitner and Hubbert, 1994). This study considers an overall satisfaction approach as it has been acknowledged as a stable evaluation measure owing to its aggregated approach of considering all the factors that affect the customer behaviour and experience with the organisation in comparison to transaction specific satisfaction which is considered very situation specific (Gupta and Zeithaml, 2006).
Customer satisfaction in the early stages was measured through confirmation and disconfirmation model where satisfaction is measured by comparing their initial expectation and perception with the actual product performance (Anderson and Sullivan, 1993). Rust et al. (1995) is of the opinion, that the inconsistency between perceived quality and expected quality is known as expectancy disconfirmation, which indeed is a strong indicator of customer satisfaction. Furthermore, Fornell et al. (1996) came up with an additional tool
for measuring customer satisfaction from an overall perspective known as American Customer Satisfaction Index (ACSI) which evolved from Swedish Customer Satisfaction Barometer (SCSB). Perceived quality, perceived value and customer expectations are the dimensions of customer satisfaction in ACSI (Fornell et al., 1996).
The current study employs ACSI as a measure to study customer satisfaction across supermarket industry, as it has been the most comprehensive and broadly used customer satisfaction index in the U.S which measures in-depth customer experience and has been validated across ten sectors and forty industries (Fornell, Morgeson and Hult, 2016). Large retail companies like Amazon, Walmart, Target have used ACSI standards to measure customer satisfaction which not only affected the companies economic return but also the U.S. retail economy (Anderson, Fornell, and Mazvancheryl, 2004). This model has been extensively used by many researchers for developing customer satisfaction ratios considering their own national economies (Aydin and Ozer, 2005). Some of the national and international customer index models developed are German Customer Satisfaction Barometer (GCSB), European Customer Satisfaction Index (ECSI) and Norwegian Customer Satisfaction Barometer (NCSB).
In the supermarket environment consumers usually physically interact with supermarket employees or technological systems which helps them analyze the overall service quality offered by the firm (Hult et al, 2019). Most previous researchers have examined the impact of SST on customer satisfaction (Dabholkar, 1996; Yen, 2005) and antecedents like servicescape, value for money, employee service in the supermarket environment as independent research topics (Parasuraman et al, 1985; Jayasankaraprasad and Vijaya Kumar, 2012). However, what is still unknown is whether technological interface like SST actually influence the level of customer satisfaction or it is the other non technological drivers which influence satisfaction levels in the supermarket environment. Therefore, this study aims to contribute and fill the gap of the growing literature on self-service technologies in the supermarket industry by exploring the impact of SST attributes on customer satisfaction and also
examine the effect of other controlling non-technology elements on customer satisfaction present in the supermarket.
�29
Chapter 3: Methodology
3.1 Introduction
This chapter showcases in details the chosen methods and approaches utilised in the research. It includes an overview of theoretical framework, philosophy, approach and design & strategy and indicates means of data collection and how they are analysed. Furthermore, it states in great depth the chosen scales along with justification for its selection, questionnaire design and sampling methods used for pilot and target audience. Ethical considerations and data security measures are stated. Finally, research design limitations are discussed.
3.2 Theoretical Framework
The theoretical framework developed for this study is illustrated in Figure 1, it takes into consideration the different concepts discussed in the literature review. The chosen scale for this study, SSTQUAL, developed by Lin and Hsieh (2011), examines the service quality attributes of SST, which in turn, affect the customer satisfaction levels of SSTs. Additionally, the study also seeks to understand the effect of non-technological elements (servicescape, value for money and employee service) acting as antecedents of customer satisfaction in the supermarket environment.
�30
Figure 1: Theoretical framework
3.3 Research Aim
The aim of this research is to investigate the impact of technological interfaces such as self-checkout SSTs and other non-technological factors on customer satisfaction in the Irish supermarket industry from a consumer’s point of view. Even though several researchers have contributed to the topic of SSTs and their impact on customer behavioural attributes, none of them have compared it to other controlling drivers present in the supermarket environment such as servicescape, value for money and employee service. Thus, the primary objective of this research is to understand if the use of SSTs in supermarkets have higher indicated impact levels on customer satisfaction, or is it one of the controlling non-technology drivers which are causing higher level of satisfaction.
3.4 Hypothesis
From the proposed theoretical framework following hypothesis can be drawn to study the research aim:
�31
H1a: Higher indicated levels of SST functionality attribute will be associated with higher levels of customer satisfaction.H1b: Higher indicated levels of SST enjoyment attribute will be associated with higher levels of customer satisfaction.H1c: Higher indicated levels of SST security attribute will be associated with higher levels of customer satisfaction.H1d: Higher indicated levels of SST assurance attribute will be associated with higher levels of customer satisfaction.H1e: Higher indicated levels of SST design attribute will be associated with higher levels of customer satisfaction.H1f: Higher indicated levels of SST convenience attribute will be associated with higher levels of customer satisfaction.H1g: Higher indicated levels of SST customisation attribute will be associated with higher levels of customer satisfaction.
H2: Servicescape of the supermarket will be associated with higher levels of customer satisfaction.H3: Value for money offered by the supermarket will be associated with higher levels of customer satisfaction.H4: Employee service offered at the supermarket will be associated with higher levels of customer satisfaction.
3.5 Research Philosophy
Saunders et al (2012) have explained the concept of research philosophy as the evolution of knowledge and the nature of that knowledge. Additionally, Cameron (2009) dictated that research philosophy is often guided by assumptions which the researchers consider when developing their research.
There are several categories of research philosophy, however the present study embraces a philosophy of positivism which comes under the perspective of epistemology, which is a natural phenomena adopted when you want to produce generalised results like other researchers through collecting data and identifying relationships from your data (Gill and Johnson, 2010). Positivism has been chosen for several reasons for the current study. First, the role of this
�32
study is restricted purely to data collection and interpretation in an objective, unbiased way, since this study chooses to focus on facts and not the meaning behind the facts. Second, this study first formulates hypothesis and then tests them based on factual scientific data collection around technology & non technology dimensions and customer satisfaction, which is one of the characteristics of positivism. Third, the study does not provision for human interest, no personal opinions are taken into consideration while conducting the research and minimal interaction is kept with the participants of the study to avoid any form of influence. All of these reasons are properties of positivism research philosophy, which makes it an ideal choice for the objectives of this research.
3.6 Research approach
Saunders et al (2012) put forward two approaches to study any research topic i.e. deductive and an inductive approach. When using a deductive approach, the hypothesis for the study is developed and tested based upon the pre-existing theory in a particular subject (Silverman, 2013). This research employs a deductive approach since a positivist study generally follows a deductive approach (Crowther and Lancaster, 2008). Moreover, this study makes several hypothetical propositions based on other studies in SST and retail customer satisfaction domain, in which a definite conclusion of a confirmation or rejection needs to be deducted in order to obtain generalised findings. Furthermore, due to the great abundance of existing literature available and shorter period of time available for conducting the search, deductive approach is well suited for the topic of self-checkout SST and other factors which affect customer satisfaction levels in the supermarkets.
3.7 Research design and strategy
The research design refers to the general plan and techniques used for carrying out the research, in which techniques relate to the specific details of how the data was collected and analysed (Saunders et al. 2012). Research design has been demonstrated into Exploratory, Descriptive and Explanatory type. This study intends to outline in great detail several hypotheses with scientific evidence without any influences and with a large sample size, for which, a
�33
descriptive approach to research was found to be most widely adopted by other researches and the most appropriate fit for this research, since, descriptive studies deal with a precise outline of events, individuals or situations (Robson, 2002) without influencing it in any way. Furthermore, the intention of this research is to test the existing hypothesis in the literature, it follows a quantitative approach since we wish to establish relationship between different variables, which is one of the characteristics of quantitative approach(Sekaran, 2003). A qualitative approach was not adopted in this study, because the intent is to reach to a larger population, and find relationship within variables to prove the existing hypothesis and not formulate any new hypothesis. In this research, the relationship between self-checkout SST characteristics, other service components and customer satisfaction is determined numerically and analysed using different statistical procedures to test the hypothesis highlighted in the literature.
The ideal choice for this quantitative research methodology is through a survey strategy, since they either have close-ended, multiple-choice, semantic differential or levels of satisfaction type questions (Wright, 2006). Since the hypothesis stated in this research attempts to measure the level of satisfaction with respect to particular dimensions with close-ended, quantitative questions, a survey is seemingly the adequate choice for this kind of research. Moreover, this research attempts to capture the opinions of a large population, which is one of the essential characteristics of a survey methodology (Quinlan, 2011). Finally, a survey strategy was preferred in case of this study because most researches in literature around examining self-checkout SST service quality and customer satisfaction in the retail environment have used a survey based approach. The prominent reason of choosing this approach of data collection by multiple researchers, is due to pre-validated, time-tested scales and measurement instruments available in area of interest of this research.
3.8 Population and sampling
Sampling techniques can be categorised into two main types as probability and non-probability type, the non-probability type is generally used when there is time and cost limitations (Saunders et al., 2012). The current study employs a non-probability type sampling technique, particularly using convenience and
�34
snowball sampling. Convenience sampling technique was utilized during the pilot study, since this sampling is suitable when population is easily accessible to the researcher, however, it can be inclined to biases which cannot be controlled (Saunders et al., 2012). In case of reaching out to the larger audience for the purpose of this research, which is essential for a quantitative study of this nature, snowball sampling was used to obtain chain-referral sampling, where audience recruit other acquaintances which are known to them (Saunders et al., 2012), therefore solving the problem of reaching out to a larger target audience.
The target population were customers of one or more supermarket chain located in Dublin, Ireland. The sample comprised of individuals who visited a supermarket equipped with self checkout SST’s and utilized this technology during their visit. The only criteria which was taken into consideration was one or more interactions with the self checkout SST in any of the supermarkets located in Dublin. Population of all age groups, education and professional background were considered as part of the data collection process for this study.
3.9 Data collection
Web-based surveys have been significantly acknowledged by researchers because it is considered as a low-cost and efficient way of collecting data across a large number of respondents (Byrne, 2017). However, Lavrakas (2008) noted inconsistent sample framework and non-response bias as shortcomings of online surveys. In-order to reduce non-response bias a few measures can be taken, such as, pretesting the survey on several mediums to ensure it renders properly and reduces the non-response bias. For this study, Google Forms were used which are time-tested forms that render properly on all devices, mobile or desktop, which contributes to reduction of non-response bias. Furthermore, rushed data collection in a short period of time can also cause non-response bias (Merkle and Edelman, 2002), for which this study, self-administered questionnaires were used as they offer respondents the flexibility to complete the survey at their convenience in complete isolation without the interviewer's bias which indeed leads to superior quality of data and attempts
�35
to reduce non-response bias (Vehovar and Manfreda, 2008). For these reasons, the survey was kept short and concise which took an average of approximately 10 minutes to complete.The survey was distributed through a public link which took the participants to a Google form page with all the questionnaires, data collection was carried out from the 1st of July till 15th of July 2019 (15 Days) through electronic mediums, emails and social media channels (Facebook, Reddit, WhatsApp and Instagram). A public link was shared on these mediums while having specified the target audience by categorizing them by country/region to collect data for this survey. Although, social media is an effective channel for reaching out to large numbers of people in an economic way, it has its own drawbacks, such as having a biased population according to age, gender or location, hence cannot be assumed as genuine representative of general population (Mayr and Weller, 2016).
For the purpose of this research, all the above mentioned mediums have been utilized to gather a total of 161 responses.
3.10 Questionnaire design
Designing the questionnaire plays a consequential role in entire research process specifically during data collection and analysis (Burns & Bush 2003). A questionnaire should be developed keeping in mind best practices such that it enriches the quality of survey (Clow and James, 2014). The basics include things like using appropriate wording, organisation and measurement (Sekaran and Bougie, 2010).
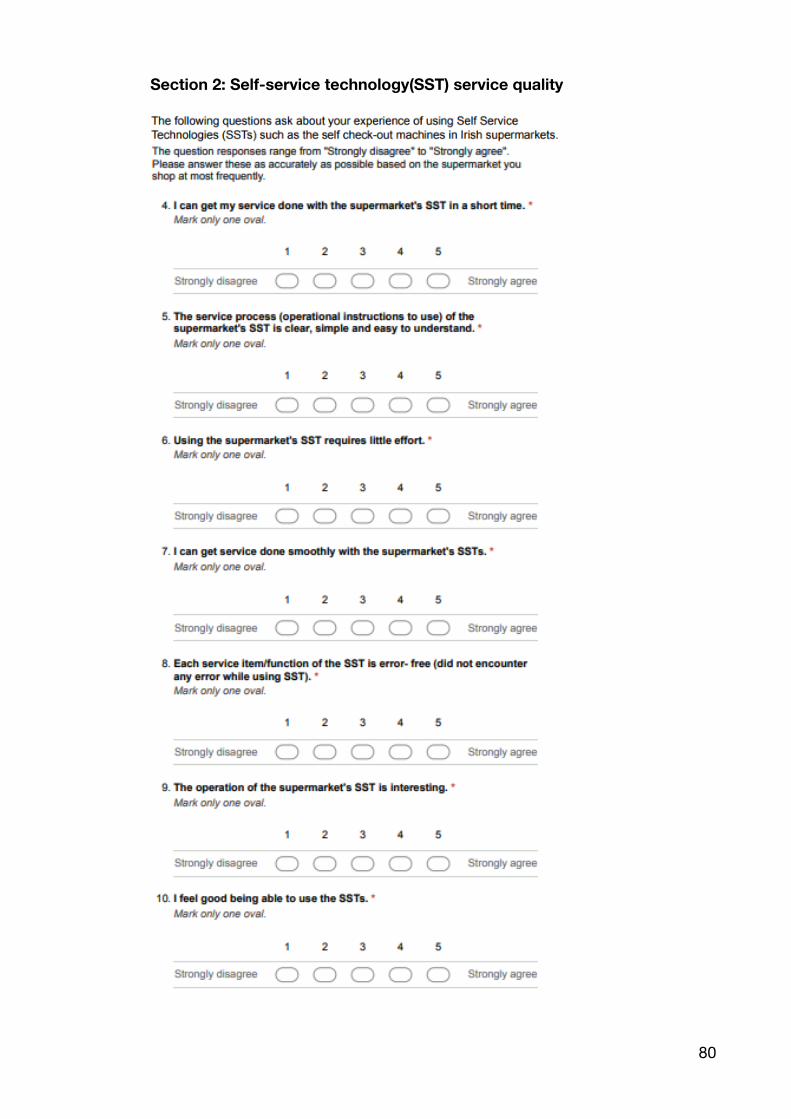
The present study employed structured, close ended questionnaire with fixed options, divided into four sections. Section one included demographic questions like age, gender and education level. The second section consisted of questions targeting the SSTQUAL scale developed by Lin and Hsieh (2011) comprising of 20 items and 7 dimensions measuring the service quality of SSTs. The third section constituted of the non-technology items existing in retail literature, 4 items measuring servicescape from the physical dimension and 7 items measuring employee service from reliability, empathy, safety and
�36
eagerness dimension of SERVPERF model by Cronin and Taylor (1992) and 4 items from Value for money construct in PERVAL scale by Sweeney and Soutar(2001). Finally, the fourth section included American Customer Satisfaction Index (ACSI) a 3 item scale measuring the customer satisfaction levels (Fornell et al, 1996).
The scoring mechanism used for the above instruments and scales was calculated by summing up the scores of individual items and normalising them to provide an overall score from 0 to 100.
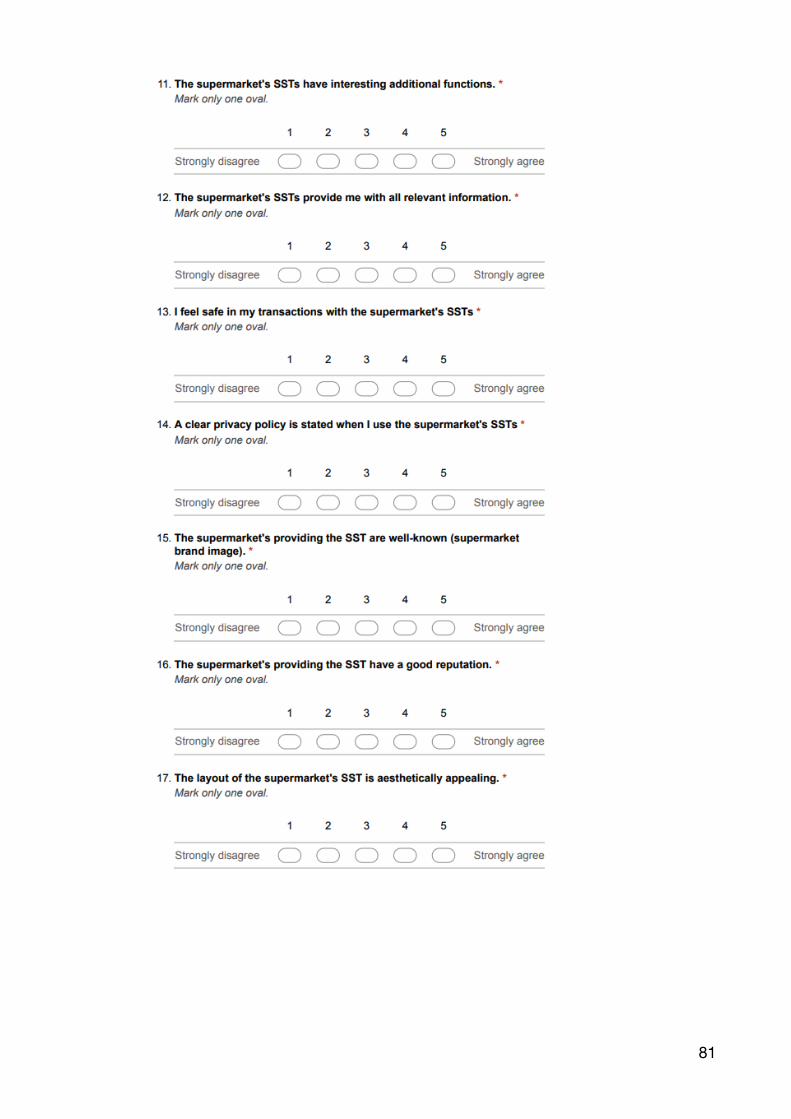
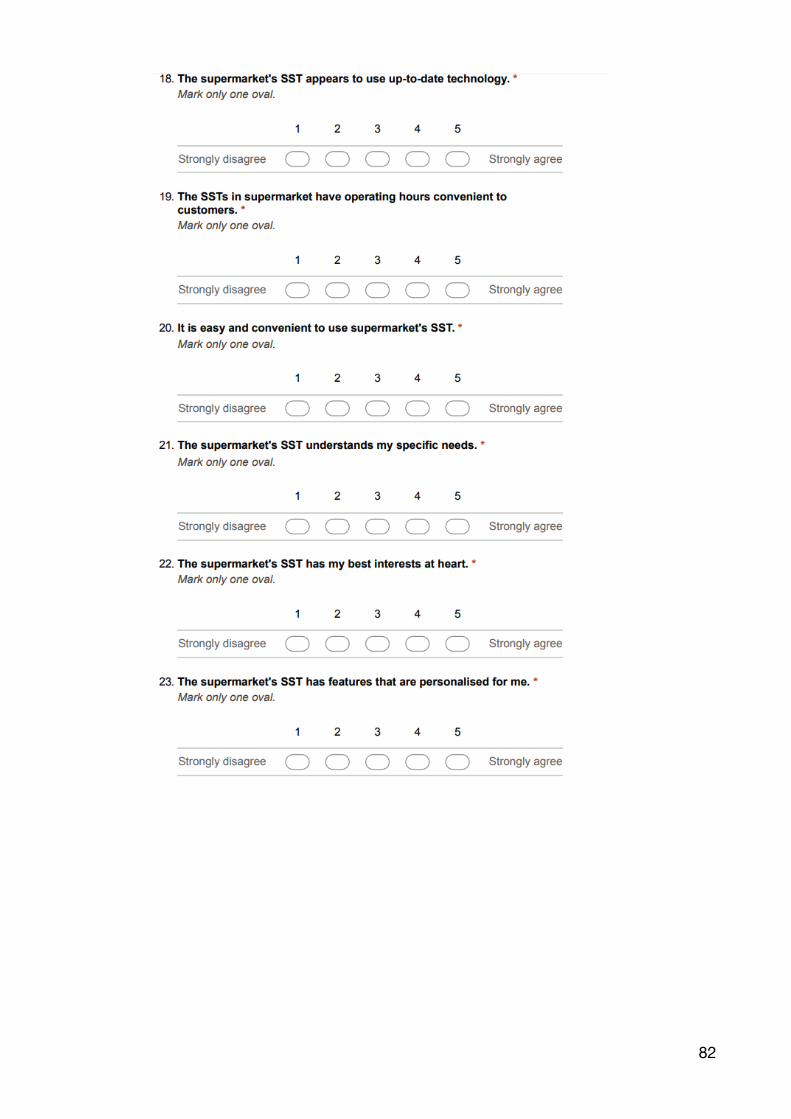
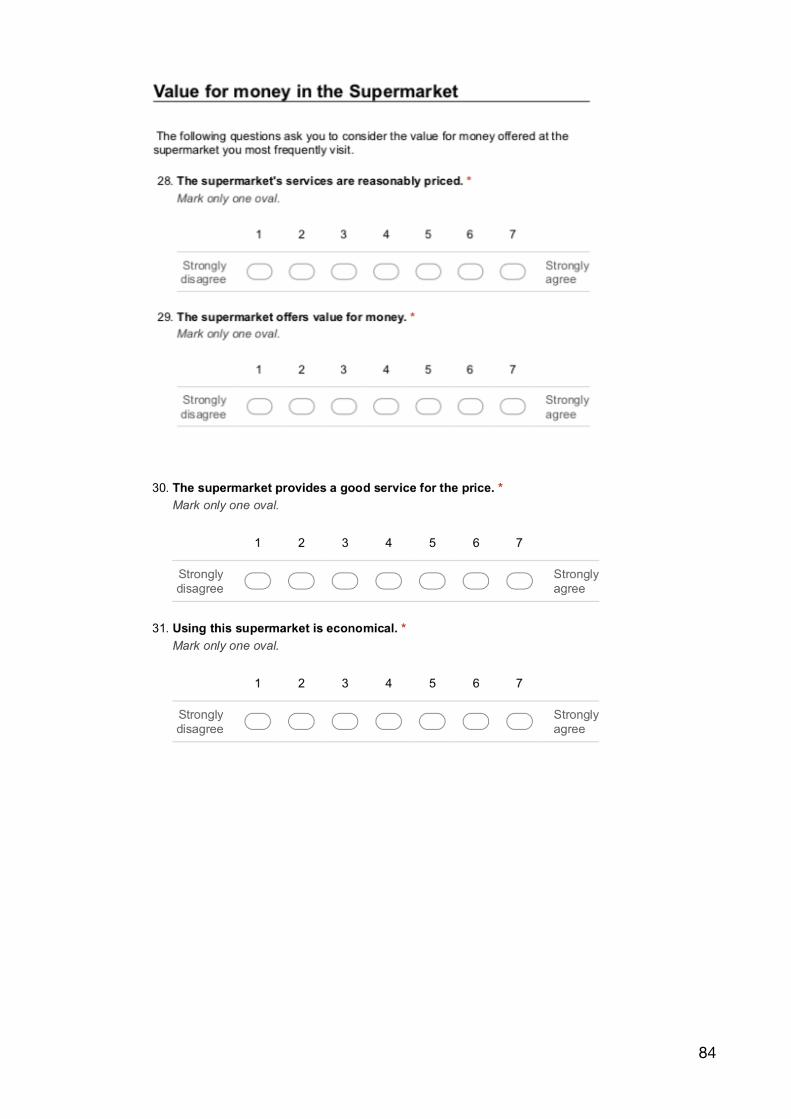
The questionnaire items were measured using Likert scale, which according to Boslaugh(2008) are psychometric scales which measure people's behaviour, judgement or perception and are generally used in questionnaires. The Likert scale usually come in different sizes such as three-point, five-point, seven-point, or nine-point, in which the responses range from “strongly disagree” to “strongly agree”. For the purpose of this study the SSTQUAL dimensions uses a five-point Likert scale and the other dimensions such as servicescape, employee service, value for money and customer satisfaction using a seven-point Likert scale. The reason for the diverse scale choices based on different dimensions is due to scientifically proven choices made by other researchers in this domain.
Table 1: Questionnaire items and their specific Likert response scale
Likert
scaleCategory Dimension Questions
I can get my service done with the
supermarket's SST in a short time.
The service process (operational instructions
to use) of the supermarket's SST is clear,
simple and easy to understand.
Using the supermarket's SST requires little
effort.
I can get service done smoothly with the
supermarket's SSTs.
Each service item/function of the SST is error-
free (did not encounter any error while using
SST).
�37
5-Point
Self-service
technology(SST)
service quality
(SSTQUAL)
-
The operation of the supermarket's SST is
interesting.
I feel good being able to use the SSTs.
The supermarket's SSTs have interesting
additional functions.
The supermarket's SSTs provide me with all
relevant information.
I feel safe in my transactions with the
supermarket's SSTs.
A clear privacy policy is stated when I use the
supermarket's SSTs
The supermarket's providing the SST are well-
known (supermarket brand image).
The supermarket's providing the SST have a
good reputation.
The layout of the supermarket's SST is
aesthetically appealing.
The supermarket's SST appears to use up-to-
date technology.
The SSTs in supermarket have operating hours
convenient to customers.
It is easy and convenient to use supermarket's
SST.
The supermarket's SST understands my
specific needs.
The supermarket's SST has my best interests
at heart.
The supermarket's SST has features that are
personalised for me.
Servicescape
of the
supermarket
The supermarket has up-to-date facilities.
The supermarket's physical facilities are
visually attractive.
The supermarket's employees are neat and
well dressed.
The appearance of the physical facilities at the
supermarket is in keeping with the type of
service provided.
Value for
money in the
Supermarket
The supermarket's services are reasonably
priced.
The supermarket offers value for money.
�38
3.11 Statistical Analysis
Statistical data analysis tool SPSS (Statistical Package for Social Sciences) was used to analyse the responses collected through online survey. This tool is widely used for analyzing large data sets used in quantitative studies (Quinlan, 2011).
First, data analysis began with conducting test for descriptive statistics to calculate the number of participants falling into demographic categories such as gender, age and highest education. Also, descriptive statistical values of mean, variance, standard deviation and interquartile range of independent and dependent variables were calculated.
Second, to check the internal reliability and consistency of responses, a reliability analysis was done in which the Cronbach’s alpha value was measured, which is considered to be the most frequently used indicator of internal reliability and consistency (Saunders et al, 2012).
7-Point
Other drivers of
supermarket
Supermarket
The supermarket provides a good service for
the price.
Using this supermarket is economical.
Employee
service at the
supermarket
I receive prompt service from the
supermarket's employees.
Employees of the supermarket are always
willing to help me.
The employees of the supermarket are never
too busy to respond to my requests.
I can trust the employees of the supermarket.
I feel safe in my transactions with the
supermarket's employees.
Employees of this supermarket are polite.
Employees of this supermarket give you
personal attention.
Customer
satisfaction in
Supermarket
ACSI
Overall, you are satisfied with the supermarket.
The supermarket matches your expectations.
The supermarket is close to your ideal one.
�39
Third, Normality test was conducted to check for normal distribution of data. With regards to the present study, a significance level of 5% has been chosen. The statistical significance is determined by the p-value of the data which helps us to either accept or reject the null hypothesis. If the p-value is greater than 0.05(5%), the null hypothesis will be accepted and if it is less than 0.05(5%) it will be rejected.
Furthermore, univariate statistical tests were performed to check the relationship between single dependent variable i.e. customer satisfaction and independent demographic and continuous variables.
Finally, two types of regression models were used in this study. The first model a multiple regression model checked the relationship between SST attributes and customer satisfaction and second model, a hierarchical multiple regression model to test the effect of controlling non-technology elements when added to the SST and customer satisfaction model. The multiple regression equation for model 1 can be represented as:
The pilot study was conducted with 10 members who have used self checkout SSTs in past during their visit to the supermarket. The feedback received from the initial participants was that the survey was too long to answer and some of the questions were unclear and sounding identical. For instance, the SSTQUAL questionnaire consisted of questions like “The service process of the supermarket's SST is clear, simple and easy to understand” and “The supermarket's providing the SST are well-known”. Terminology such as ‘service process’ and phrases like ‘well known’ were ambiguous and couldn’t be interpreted by participants. Feedback received was taken into consideration and modifications were taken into account, and the layout of the questionnaire was modified which made the survey look shorter and simpler to understand,
�40
and a short description was provided to offer better clarity about the questions, which was the intent of doing the pilot study since researches are of the opinion that pilot studies are purely to test the wording and design of the questionnaire and to measure how much time it time taken by respondents to fill out the survey (Ticehurst and Veal, 2000). Thus, the pilot study was conducted for this research helped in refining the questionnaire and reducing the possibility of encountering any error when subjecting it to a larger population.
3.13 Ethical considerations
Evaluating the ethical considerations around your study is one of the most essential parts when devising your research design (Saunders et al, 2012). In case of online research, anonymity and confidentiality are the two fundamental principles of ethics (Gaiser and Shreiner, 2009).
With regards to the current research, the participants were well informed about the ethical guidelines at all the relevant instance. The questionnaire designed for this study mentioned the nature and purpose of the study and it adheres to anonymity & confidentiality and the data storage scheme. The survey questionnaire did not ask for any personal details like name, email id, birthday or salary of the respondents, thereby keeping the identity completely anonymous. Data collected was stored confidentially in an externally non-accessible excel file available only to the researcher and the supervisor. Also, the data would be deleted post the completion of the study and within the period policy outlined for data storage by the institution.
Additionally, the participants were also informed about their right to opt out of the survey at any point of time. Overall, the ethical considerations taken into account during the entire research process is to reduce and avoid any conflict or negative effects with the participants, hence they were implemented in the study (Ticehurst and Veal, 2000).
3.14 Research Design Limitations
�41
Quantitative approach through structured and close-ended questionnaire has been adopted in this research which limits the opinion of the respondents further lacking an in-depth explanation. A qualitative approach through in-depth interviews or open-ended questionnaire would have helped in deeper understanding about the customer's perspective of self checkout SSTs and other factors in supermarkets. In-depth interviews have been considered as the most generally used qualitative methodology as it is very flexible and capable of providing fine details (Sarantakos, 2005). It would have helped in capturing an insider's perspective by embodying a view of social reality as a changing property of individuals’ perceptions and preferences. Furthermore, the present research is restricted by the size and uneven distribution of sample population. Hence, a small sample size and homogenous sample would affect the relationship between the variables considered for the study and have an impact on the statistical analysis. Additionally, in quantitative research design the participants' experiences and opinions cannot be controlled as there is a lack of communication between the researcher and the respondents during data collection, which makes this approach highly objective (Ary et al, 2013). Thus, from the above discussion around limitations of quantitative research design there is still scope for carrying out the research using other research methodologies.
�42
Chapter 4: Data Analysis 4.1 Introduction This chapter presents the results of all the statistical tests undertaken in this study. The chapter begins with reporting the descriptive statistic of all the dependent and independent variables, followed by results of reliability analysis and normality test. Based on the results of normality test non-parametric tests were conducted for doing univariate analysis of customer satisfaction and all the independent variables present in the study. Finally, regression test was conducted for hypothesis testing.
4.2 Descriptive Statistics
A total of 161 responses were received through online surveys, with no missing data. For the purpose of investigating the impact of customer satisfaction levels through SST and other non-technological drivers in the Irish supermarket industry, all 161 people were considered as the sample for analysis. Descriptive statistical analysis was done on the demographic as well as the continuous dependent & independent variables considered in the study. The study includes 3 demographic variables of categorical nature and 10 independent & 1 dependent variable of continuous nature as shown in table 2.
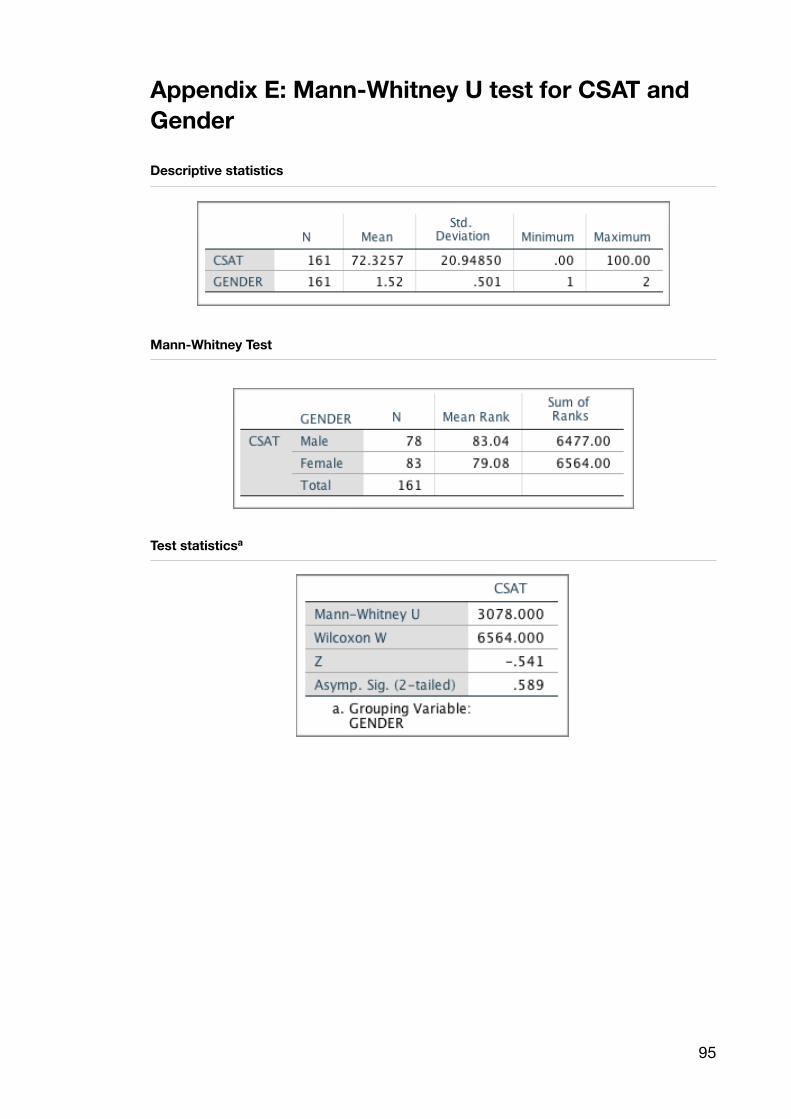
The sample distribution consists of 48.4% (78) of males and 51.6 % (83) females. Majority of the respondents are aged between 19-29 (65.8%) years. Furthermore, around 73.3% (118) of respondents hold a Masters degree or higher education level. Moreover, with respect to the continuous variables involved in the study their mean, standard deviation, variance and inter-quartile scores were calculated. Additionally, the range for all the continuous variables is between 0-100 following normalization as described in the methods chapter. The SST dimensions scored an average mean of 64.621 and standard deviation of 22.51 while the non technology elements scored an average mean value of 66.27 and standard deviation of 22.84. The assurance dimension from the SST continuous variables list showed highest mean value of 72.9 and standard deviation of 22.67, followed by customer satisfaction having mean
�43
value of 72.32 and standard deviation 20.94. The lowest mean value of 54.03 was seen for customisation SST dimension. Table 2 displays the descriptive statistics for the sample and the detailed descriptive information can be found in Appendix A.
Table 2: Descriptive statistics
Categorical Demographic
VariablesNumber %
Gender
Male 78 48.4
Female 83 51.6
Total 161 100
Age
Under 18 1 0.6
19-29 years old 106 65.8
30-39 years old 31 19.3
40-49 years old 14 8.7
50-59 years old 7 4.3
Over 60 2 1.2
Education Level
Leaving certificate or below 2 1.2
Higher diploma 5 3.1
Undergraduate degree 36 22.4
Masters degree or higher 118 73.3
Continuous Independent
VariableMean
Standard
DeviationVariance
Interquartile
Range
SSTQUAL dimensions
Functionality 65 20.39 415.62 30.00
Enjoyment 62.53 21.85 477.78 25.00
Security 62.34 21.82 476.53 25.00
Assurance 72.9 22.67 514.33 37.50
Design 64.05 24.11 581.55 25.00
Convenience 71.5 22.58 510.17 37.50
Customisation 54.03 24.19 585.16 33.33
Non-technology elements
Servicescape 63.32 23.86 569.39 31.58
Value for money 67.08 20.79 432.55 31.25
�44
4.3 Reliability Analysis
Reliability analysis was conducted on the questionnaire used in the study to check for the internal consistency between the items in the questionnaire. The internal reliability of the scale is determined through the value of Cronbach
alpha coefficient (𝛂), which should be above 0.7 to be considered as reliable.
In this study, all the questionnaire items were tested for reliability factor. First, the SSTQUAL scale by Lin and Hsieh (2011) consisting of 20 items was tested and the Cronbach alpha coefficient obtained was 0.921, proving very good for internal consistency. The item-total correlations were moderately correlated, the squared multiple regression generally explained that variance was moderately explained throughout. The Cronbach alpha value was not impacted significantly following the removal of any item. Furthermore, this level of internal consistency was also seen in case of the non-technology factors i.e. the servicescape, value for money and employee service confirming the Cronbach alpha score of 0.848, 0.902 and 0.935 respectively. Lastly, the items
in the customer satisfaction scale also showed high internal consistency with a value of 0.899. Table 3 illustrates the reliability coefficient values for all the Questionnaire items and the detailed results of the scale reliability test for all factors are available in Appendix C.
Table 3: Reliability coefficients
EmployeeService 68.42 23.88 570.46 39.47
Continuous Dependent Variable
Customer Satisfaction 72.32 20.94 438.84 27.78
Questionnaire Instrument No. of Items Reliability Coefficient
SSTQUAL 20 0.921
Servicescape 4 0.848
Value For Money 4 0.902
Employee Service 7 0.935
Customer Satisfaction 3 0.899
�45
4.4. Normality Test
Normality test is usually performed to check if the data collected is evenly distributed across either side of the mean. The Shapiro-Wilk’s test has been reported in many studies to test the hypothesis of normal distribution. The null hypothesis associated with the Normality test is that the sample data is normally distributed. If the assumption of normality has been violated, then the “Sig” value p < .05 level, and if it is not violated p > .05. In the current study, a test of Normality was conducted on customer satisfaction scores which acts as a dependent variable, the Shapiro-Wilk statistic indicated a sig. value of .000, suggesting a violation of the assumption of normality. Thus, the null hypothesis that the sampling distribution is normal was rejected and the variable was assumed non-normally distributed. Consequently, non-parametric tests were conducted. Detailed test results can be found in Appendix D. Figure. 2 demonstrates the graphical representation of the normal distribution of Customer satisfaction.
Table 4: Test of Normality for Customer satisfaction
Dependent variableShapiro-Wilk
Statistic df Sig.Customer
Satisfaction0.925 161 0.000
�46
Figure 2: Normal distribution of Customer satisfaction
4.5 Univariate analysis
Exploratory univariate analysis was performed to test the relationship between customer satisfaction and demographic & continuous independent variables.
4.5.1 Customer Satisfaction and Demographic variables
4.5.1.1 Customer satisfaction and Gender
A rank-based non-parametric test known as the Mann-Whitney U test was conducted to test the difference between the levels of customer satisfaction between males and females. The null hypothesis associated with this test is that there is no difference in customer satisfaction levels across the two genders. The test result indicated that there was no significant difference seen between levels of customer satisfaction across males and female at 5 per cent confidence level (p=0.589, U=3078), with males having a mean rank of 83.04 & females a mean rank of 79.08 and a similar median value for males and females of 77.77. Thus, the null hypothesis could not be rejected in this case. Appendix E shows the complete result of the Mann Whitney U test.
�47
Table 5: Mann-Whitney Test for Customer satisfaction and Gender variable
4.5.1.2 Customer satisfaction and Age
To explore the difference in scores of customer satisfaction levels between the different age categories Kruskal-Wallis test was performed. The null hypothesis related to this test is that there is no difference in customer satisfaction levels across the different age groups. The test results showed no significant difference (Chi square=4.886, p=0.430, df=5) among the age categories of the participants. Thus, the null hypothesis was not rejected. Table 6 shows the
result of Kruskal-Wallis test.
Table 6: Krushkal-Wallis test for Customer satisfaction and Age
4.5.1.3 Customer satisfaction and Education Level
A Krushkal-Wallis test was conducted to examine the difference in levels of customer satisfaction between the education level groups. The test result indicated that there was no significant difference (Chi square=0.956, p=0.812, df=3) in customer satisfaction levels between the education level groups of the respondents. So, the null hypothesis, in this case, was not rejected as p >0.05. Table 7 illustrates the results of Krushkal-Wallis test.
Dependent
variableGender Mean Rank Median Sig. Mann-Whitney U
Customer
Satisfaction
Male 83.04 77.778 0.589 3078
Female 79.08
Dependent
variableAge N Mean Rank Sig.
Kruskal-Wallis
Chi-square
Customer
Satisfaction
Under 18 1 153.00 0.430 4.886
19-29 years old 106 79.83
30-39 years old 31 79.45
40-49 years old 14 84.39
50-59 years old 7 74.71
Over 60 2 129.25
�48
Table 7: Krushkal-Wallis test for Customer satisfaction and Education level
4.5.2 Customer satisfaction and Continuous independent variable
Spearman’s rank-order test was conducted to measure the direction and strength of the relationship between the continuous dependent (customer satisfaction) & independent variables (SST service quality dimensions and non-technology elements). The Spearman’s correlation coefficient is denoted by rs or ρ, it is measured on a scale of 0 (no correlation) to +1 (perfectly positive
correlation) or -1 (perfectly negative correlation). Cohen (1988) represented the magnitude of correlations in conventional form. Correlation coefficient value closer to zero and ranging from 0.10 to 0.29 are said to have weak correlation;
rs value from 0.3 to 0.49 are considered to have moderate correlation and rs value from 0.5 to 1 are weighed as strong correlation.
Results indicate that all the independent variables are statistically significant with p < 0.001, strong positive correlation was observed in the case of all non-technology elements and some SST service quality attributes (functionality, assurance and convenience), while other SST service quality attributes showed moderate (enjoyment, design and customisation) and weak (security) correlation with customer satisfaction levels in supermarket. Employee service attribute from the non-technology dimension showed the strongest correlation (ρ =0.765) while the Security dimension of SSTQUAL scale showed a weak correlation (ρ =0.264) with customer satisfaction. Table 8 demonstrates the detailed results of the Spearman’s correlation test for all the continuous variables.
Dependent variableEducation
LevelN
Mean
RankSig.
Krushkal-Wallis
Chi-square
Customer
Satisfaction
Leaving certificate or
below2 110.00 0.812 0.956
Higher diploma 5 75.80
Undergraduate degree 36 78.58
Masters degree or
higher118 81.47
�49
Table 8: Spearman’s correlation test
4.6 Regression Analysis
Regression analysis was carried out to test the hypothesis and explore the relationship between the dependent and the independent variables involved in the study. Two regression models were used in this study. The first model (Model 1) was to check the relationship between SST service quality dimensions and customer satisfaction and second (Model 2), was a hierarchical multiple regression model to examine the effect of non-technology controlling elements when added to the SST and customer satisfaction model. The demographic variables involved in the study were not considered for regression analysis as their univariate analysis reported insignificant results.
Before conducting the regression analysis, the related assumptions required for this analysis were tested. First, the condition for normality was checked by running a linear regression model with all the dependent and independent variables. The standardised residual error values obtained were then further tested for a normal distribution. The Shapiro-Wilk’s test indicated a p-value of 0.127, which meant that we could reject the null hypothesis of a non-normally distributed set of error terms, and assume normality. Hence, one of the key underlying conditions for undertaking linear regression analysis was met.
Continuous
Dependent
Variable
Independent VariablesSig.
(2 tailed)
Correlation
coefficient
Strength of
correlation
Customer
Satisfaction
(CSAT)
SST service
quality
dimensions
Functionality 0.000 0.502 Strong
Enjoyment 0.000 0.476 Moderate
Security 0.000 0.264 Weak
Assurance 0.000 0.522 Strong
Design 0.000 0.396 Moderate
Convenience 0.000 0.539 Strong
Customisation 0.000 0.397 Moderate
Non-technology
elements
in supermarket
Servicescape 0.000 0.720 Strong
Value for money 0.000 0.632 Strong
Employee
Service0.000 0.765 Strong
�50
Figure. 3 demonstrates the graphical representation of the normal distribution of standardized residual values.
Figure 3: Normal distribution of standardized residual values
Furthermore, the scatterplot for the residuals satisfied the assumption of linearity and homoscedasticity. Figure 4. demonstrates the scatterplot for the residual values.
�51
Figure 4: Scatterplot for Standardized Residual values
Additionally, the multi-collinearity test was conducted to check for any correlation between independent variables present in both the regression models. The multicollinearity statistic values mentioned in table 2 (model 1) and 4 (model 2) showed no evidence of correlation between the independent variables as the tolerance values were greater than 0.1 and VIF values less than 10. Also, the Durbin-Watson (D-W) test was conducted to check the correlation between the residual values. The D-W statistic value usually ranges between 0 to 4, a score of approximately 2 points out that there is no correlation between the residuals; score less than 2 suggests positive correlation; score greater than 2 indicates negative correlation between the residuals. The Durbin-Watson statistic value for the Model 1 was 2.060 and Model 2 was 2.069, which meant that we could reject the null hypothesis of autocorrelation between the residuals, and assume that there was no correlation between the residuals.
Having checked for most of the assumptions of linear regression analysis, the following section shows the detailed explanation of multiple linear regression and hierarchical regression analysis undertaken for this study.
�52
4.6.1 Model 1: Multiple regression
Multiple linear regression was undertaken to examine variance in customer satisfaction scores given changes in the seven SST service quality dimensions i.e. predictors using the Enter method. Table 9 shows that the model was able to explain 43% of the sample outcome variance (Adj R²= .404), which was found to significantly predict the outcome F(7, 153)=16.480, p<0.001. Three of the predictor variables significantly contributed to the model. The
and convenience (𝜷=0.200, t=2.453, p=0.015) dimensions of the SSTQUAL
scale were significantly associated with customer satisfaction scores. A 1-unit change in the measure of assurance is associated with a 0.235 unit change in customer satisfaction. The relationship is positive, meaning that greater levels of assurance was associated with greater levels of customer satisfaction. A similar positive relationship with customer satisfaction was seen for the enjoyment and convenience measures having regression coefficient value of 0.178 and 0.200 respectively. Moreover, it also appears that, for every unit increase in security dimension scores, customer satisfaction scores decreased (worsen) by 0.069, showing a negative relationship with customer satisfaction. Since, the association between security and customer satisfaction was not statistically significant (p=0.376), it did not contribute to the variance in customer satisfaction scores. Additionally, although the functionality, design and customisation dimension of SSTQUAL had positive regression coefficients, their lack of statistical significance means that we cannot be sure that they they contributed to the explained variance in customer satisfaction scores.
Table 9: Multiple regression summary of customer satisfaction scores
A two-stage hierarchical multiple regression analysis was conducted to examine the effect of SST and non-technology elements on customer satisfaction. The variables of interest were entered in two separate blocks using the enter method, the first block included the controlling non-technology elements i.e. servicescape, value for money & employee service, and the second block included SSTQUAL scale dimensions. The results of the regression analysis are shown in Table 11. The hierarchical multiple regression revealed that the non-tech predictors in block 1 accounted for 75.1 % of the variance in customer satisfaction scores (p<0.001). Introducing the SST elements in the model (block 2) explained the variance of 2.3 % in customer satisfaction scores(p<0.001).The model as a whole was significant (p<0.001) and explained 77.4% variance on customer satisfaction scores. The three non-
technology predictors i.e servicescape (𝜷=0.158, t=2.603,p=0.010),value for
money (𝜷=0.177,t=3.202, p=0.002) employee service (𝜷=0.435,t=8.185,
p<0.001) were significantly associated to customer satisfaction. For every unit improvement in servicescape, value for money and employee service scores, the customer satisfaction scores increased by 0.158 (p=0.010) , 0.177 (p=0.002) and 0.435 (p<0.001), respectively showing positive and greater levels
of associations with customer satisfaction. Employee service (𝜷=0.435;
p<0.001) out of all the predictors showed highest association with customer satisfaction. Moreover, the addition of the SST elements into the model did not explain much of variance to customer satisfaction as most of the SST
Predictors
VariableCoefficient t
p-value
(predictors)
Collinearity diagnostics
Tolerance VIF
Functionality 0.150 1.732 0.085 0.524 1.908
Enjoyment 0.178 2.042 0.043 0.449 2.226
Security -0.069 -0.889 0.376 0.565 1.771
Assurance 0.235 3.112 0.002 0.556 1.798
Design 0.002 0.026 0.979 0.396 2.524
Convenience 0.200 2.453 0.015 0.483 2.070
Customisation 0.050 0.643 0.521 0.467 2.143
�54
dimensions (functionality, enjoyment, security, design, convenience and customisation) failed to reach statistical significance except for the assurance
dimension (𝜷=0.235,t=3.112, p=0.002).
Table 11: Hierarchical model summary
Table 12: Hierarchical regression coefficients
Model R R² Adj R²R²/
changeF
p-value (model)
Std. error of the
estimateConstant
Durbin-Watson
1 0.866ᵃ 0.751 0.746 0.751 157.564p<0.001
10.5596 13.4342.069
2 0.880ᵇ 0.774 0.759 0.023 51.251 10.2945 10.2945
Model Predictors Variable Coefficient tp-value
(predictors)
Collinearity diagnostics
Tolerance VIF
Model 1
Servicescape 0.221 4.132 0.000 0.427 2.342
Value for Money 0.215 4.019 0.000 0.562 1.779
Employee Service 0.445 8.374 0.000 0.433 2.312
Model 2
Servicescape 0.158 2.603 0.010 0.315 3.176
Value for Money 0.177 3.202 0.002 0.499 2.004
Employee Service 0.435 8.185 0.000 0.410 2.438
Functionality 0.049 0.880 0.380 0.516 1.939
Enjoyment 0.005 0.079 0.937 0.420 2.382
Security -0.070 -1.401 0.163 0.563 1.777
Assurance 0.121 2.467 0.015 0.540 1.852
Design 0.008 0.133 0.894 0.344 2.904
Convenience 0.012 0.234 0.815 0.456 2.193
Customisation 0.050 1.001 0.318 0.460 2.173
�55
Chapter 5: Discussion 5.1 Introduction
This chapter presents the discussion of important findings based on the data analysis completed in the previous chapter. Univariate, correlation and regression tests were undertaken to identify the relationship between the independent and dependent variable in the study. Multiple linear regression and hierarchical regression analysis was performed to understand which amongst the SST and the non-technology variables impact customer satisfaction levels in the supermarket. The following chapter proceeds with a brief discussion around the results obtained between SST service quality dimensions and customer satisfaction, followed by discussion around the effect of non-technology elements on customer satisfaction and finally a discussion around the theoretical and managerial implications from this study.
5.2 Discussion on Multiple Regression (model 1)
The key focus of this research was to test if the self-checkout SSTs implemented by supermarkets actually influence customer satisfaction levels. The findings obtained using the SSTQUAL model developed by Lin and Hsieh (2011) conveyed that the SST service quality attributes do influence customer satisfaction levels in supermarkets. This finding is consistent with other empirical study done by Ganguli & Roy (2011); Orel & Kara(2014) who investigated the effect of SST service quality attributes on customer satisfaction in banking and retail supermarket context. The results through the data analysis for this research confirm and support the
hypothesis that enjoyment (𝜷=0.178,p=0.043), assurance (𝜷=0.235, p=0.002)
and convenience attribute (𝜷=0.200, p=0.015) of SST indicated higher levels of
customer satisfaction. Hence, we can consider these three dimensions from SSTQUAL scale as the predominant predictors of customer satisfaction in this study. The hypothesis postulated for functionality, design, security and customisation attribute of SSTs were not supported through our research findings.
�56
Furthermore, 53.4% of the population who took the survey found experience of using the SST enjoyable. This insight dictates that customers are not anxious about using advanced technologies such as self-checkout SSTs. They also believe that the SST interface is provisioned with all the essential functions and provides them with the necessary information in regards to their purchase. The importance of the enjoyment attribute in assessing the overall customer satisfaction is consistent with findings of studies by Randomir & Nistor (2011) and Shahid Iqbal, Ul Hassan and Habibah (2018). However, our research also indicated that although customers enjoy using these SSTs, are still apprehensive while doing any transactions using SST as they fear to lose their personal information (debit or credit card pin, list of items bought) through any data security vulnerabilities. This finding is comparable with Gunawardana and Perera (2015) who evaluated the SST attributes in the banking scenario and found the security attribute has a negative impact on customer satisfaction. The security trends in the European region shows that compliance with the privacy regulations of General Data Protection Regulation (GDPR) is what most organisations are pursuing with a 100% growth from the year 2018 to 2019 (Synopsis, 2019). Compliance with such a strong guideline provided by the EU law should help in reducing fear in consumers to take advantage of technology driven services. Similarly, security and awareness training to all employees of the organisation is second most trending attribute in the software security trends (Synopsis, 2019). This allows employees to be able to communicate with customers and educate them with necessary information regarding security and privacy regulations implemented in the services to build trust and give assurance to the customers. Furthermore, the assurance dimension through our research findings appeared to be a major predictor of customer satisfaction amongst the other SST dimensions, indicating that around 64% of consumers take into consideration the brand image and reputation of the supermarkets providing SSTs. This finding is consistent with the research
findings of Trocchia & Janda (2003) and Kim and Stoel (2004). Additionally, the
convenience dimension of SST is significantly associated with customer satisfaction, informing us that around 65.2% customers feel satisfied being able to access SSTs at any given location and time, similar findings were observed in previous work done by Meuter et al (2000); Collier & Sherrell 2010;
�57
Wang (2012) on the importance of convenience attribute of SST in assessing customer satisfaction.
Our research findings demonstrated that the functionality, design and customisation attribute of SSTs were not significantly associated with customer satisfaction. These findings contradict previous findings of Shahid Iqbal, Ul Hassan and Habibah (2018) Ganguli & Roy (2011); Johnson et al. (2008) and Yen (2005) around the effect of SST dimensions on customer satisfaction, who found all seven attributes significant and contributing to the customer satisfaction levels. Moreover, studies conducted by Randomir and Nistor (2012) who used the SSTQUAL scale in Romanian banking industry through online questionnaires for a period of two weeks identified five dimensions (functionality, enjoyment, security, assurance and convenience) of SST contributing to customer satisfaction. Meanwhile, research done by Shahid Iqbal, Ul Hassan and Habibah (2018) in Pakistani service context using online surveys through emails, social media and purposive sampling technique discovered all the seven dimensions of SST to be positively associated with customer satisfaction. The results for important dimensions of SST differ across the industry due to inconsistent sample profile, different geography used for data collection and contrasting statistical procedures used by researchers (Randomir and Nistor, 2012). It has been well argued in statistics that a smaller sample size decreases the statistical power in quantitative studies and increases the margin of error (Saunders et al, 2012). The statistical power is usually determined through the effect size of the study which is directly proportional to statistical power, if the effect size increases, the statistical power increases. Since, the sample size in the present study was not large enough, some of the SST dimensions fell out of significance showing less effect on customer satisfaction levels in Irish supermarket context. Therefore, we can say that with respect to the Irish supermarket industry, the enjoyment, assurance and convenience attribute of SST were key indicators of customer satisfaction.
�58
5.3 Discussion on Hierarchical Regression (model 2)
While the main focus of the thesis was on studying the impact of SST attributes on customer satisfaction, it was equally important to investigate the influence of non-technology items to identify which had a higher impact as retail organisations are massively investing in adopting convenient technologies, which are considered to be ‘game changer’ in this industry (Grewal et al, 2017). However, studies have not considered comparing these technology driven attributes with other independent non-technology driven attributes such as employee service, monetary value, shopping environment, etc, which are dimensions previously proven to be impactful to customer satisfaction (Jayasankaraprasad and Vijaya Kumar, 2012). To identify its relation, hierarchical regression analysis was used to explore the effect of non-technology and SST items on customer satisfaction and the results of this analysis revealed some interesting observations. When the controlling non-technology elements are introduced into the model along with the SST ones, the non-technology items which are servicescape, value for money and employee service, in the model explained a high level of satisfaction of around 75% by itself, while the introduction of SST elements into the hierarchy resulted in a marginal increase in customer satisfaction levels.
The hypothesis stated for this study, which is the level of impact on customer satisfaction through technological SST dimensions and non technological dimensions was supported in case of all the non-technology elements i.e.
Servicescape (𝜷=0.158, p=0.010), Value for money (𝜷=0.177,p=0.002),
Employee service (𝜷=0.435, p<0.01). However, the results obtained did not
support the hypothesis for the majority of the SST attributes (functionality, enjoyment, security, design, convenience and customisation) as they did not appear to be statistically significant excluding ‘assurance’ attribute
(𝜷=0.121,p=0.015) following controlling for non-technology factors This
dimension is mainly associated with brand image and the reputation of the retail organisation providing the SST.
�59
First, the fact that employee service emerged as the strongest and major driver of customer satisfaction informs us that customers still value interpersonal interactions with the staff of the supermarket. This finding is consistent with Magi (2003); Darian, Tucci & Wiman (2001) findings who have stated that superior quality of interactions with the front-line employees of the supermarket creates a positive perception in customers mind about the service organisation, which further affects customer satisfaction levels and their repurchase intentions with the organisation.
Second, findings of Jayasankaraprasad and Vijaya Kumar, (2012); Lam et al., (2004) have mentioned ‘value for money’ to be positively associated with customer satisfaction. Jayasankaraprasad and Vijaya Kumar, (2012) in their research on antecedents of customer satisfaction in Food grocery & retail industry of India, conducted a survey using shopper intercept method, the results revealed that value for money explained highest variance of 20.4% on customer satisfaction value among the other predictors involved in the study such as value for time(16.2%), store reputation(12.8%), service quality(14.1%), social surroundings(10.4%) and store environment (11.5%). Moreover, Lam et al., (2004) identified the relationship between value for money and customer satisfaction in a Business-to-Business (B2B) courier service industry context, where data was collected from the existing corporate customers of courier services through an online questionnaire. Similarly, in this study, value for money was identified as the second most important factor affecting customer satisfaction, which depicts that customers when shopping in supermarkets do evaluate monetary value offered by the firm and choose a supermarket which is economically feasible.
Third, the supermarket servicescape was also recognised as an important determinant of customer satisfaction, representing that consumers highly consider the physical environment of the supermarket while shopping. Prior study conducted by Hooper et al., (2013) stated that aesthetics and visual cues present in the service environment create a positive perception in consumers mind with regards to the services being offered by the firm, further affecting the satisfaction levels and behavioural intentions with the firm. The results of Hooper et al., (2013) study shows the significance of servicescape in context of
�60
petrol service stations located in Dublin, Ireland where along with petrol & petrol related products there was a small retail store selling food and grocery items.
The results of this analysis also show that amongst the SST elements, the assurance dimension was the only element to be statistically significant and positively associated with customer satisfaction in the model while others did not achieve acceptable levels of statistical significance for it to be associated with customer satisfaction. The assurance attribute of SST is concerned with the overall brand image and reputation of the supermarket providing SST, this further tells us that consumers satisfaction levels are dependent on the brand value and image of the firm. This is similar to the findings of Shahid Iqbal, Ul Hassan and Habibah (2018) in the Pakistan service environment context and Randomir and Nistor (2012) in the banking domain in Romania, where assurance attribute was positively associated with customer satisfaction. This further indicates that supermarkets should invest in new and upcoming technologies to sustain or to enhance their brand image or reputation amongst its customers.
In conclusion, the findings obtained from this research have contributed to the literature by identifying the controlling non-technology elements as a strong driver of customer satisfaction in comparison to the SST attributes in the Irish supermarket industry. Although, there has been theoretical evidence in the literature which has stated similar findings as independent topics, hence, to our knowledge, this study is one of the first to report an analysis of this kind, which involves both technology and non-technology factors. It is safe to state that retail organisations are implementing technologies such as SST to simply gain a competitive advantage over other firms, reduce their operational costs or to increase their productivity and profitability (Scherer and Wünderlich, 2015), however, the results of this study reveal that SST elements have limited association with customer satisfaction after controlling for more fundamental elements such as servicescape, value for money and employee service. Regardless of the introduction of SSTs by supermarkets, our study identifies that SSTs do affect satisfaction levels of consumers to some extent but the
�61
non-technology factors seems to have a greater impact on customer satisfaction.
5.4 Theoretical Implication
The results obtained from this research have made important contributions in the existing literature in the supermarket industry in the Irish context. First, the study takes into consideration the technological attributes of SST and other non-technological constructs for identifying the relationship with customer satisfaction levels, since identification of the true source of customer satisfaction level is of great importance for enterprises to avoid over investing in the wrong areas while in search of a greater degree of customer satisfaction. Second, to our knowledge, this is currently the only study which takes into consideration non-technological dimensions in a hierarchical model to identify if technology plays a vital role or it is driven by other factors which were not considered by other researchers. This study can act as a reference for future studies in different contexts. Third, the results from this study contradict some of the existing literature and theories posited by several researchers, since we found that dimensions such as servicescape, value for money and employee service play a much larger role in influencing customer satisfaction levels as compared to the marginal increment discovered by introducing SST dimensions. These results provide a new perspective to this domain and give an opportunity for further exploration and contribution to the body of knowledge in the literature. Finally, the study employs the SSTQUAL, which is known to be a reliable and time tested scale in the Irish supermarket retail context. All measures of the constructs, both technological and non-technological were proven to be reliable. Thus, researchers can be confident about the scales and techniques used for future research.
5.5 Managerial Implication
The results achieved through this study offer some meaningful insights for retail organisations from a managerial and practical perspective. First, the results of this study have depicted that SST attributes do affect consumer satisfaction levels, however, only some of the attributes had a significant and positive
�62
relationship with customer satisfaction. We can say that while consumers do like to use the self-checkout SSTs, they still have certain inhibitions in their mind with regards to the overall operation, design and security aspect of SST. Hence, retailers should make an effort in understanding these concerns and address them by simplifying the SST service process, improving the design layout and by maintaining high-security standards. Some of these issues can be addressed by meeting the latest security standards such as GDPR (General Data Protection Regulation), HIPAA (Health Insurance Portability and Accountability Act) and others depending or region and context. Furthermore layouts can be designed with accessibility in mind, which are suitable for visually and hearing impaired people. Addressing these factors can increase satisfaction levels of the consumers.
Furthermore, the results showed employee service as the strongest predictor of customer satisfaction in this study. This implies that the supermarket managers should ensure that their employees are well trained in providing superior quality of customer service, their behaviour when interacting with any customer should be very friendly, courteous and helpful(Kim and Kim, 2012)as this creates a positive image in customers mind about the supermarket and the services offered by them. For instance, retail store managers should optimise the service environment by conducting promotional events within the store premises such that it attracts customers and creates an opportunity for them to socialise with service employees and other customers (Kim and Kim, 2012). Also, retailers should ensure that all the service employees have a presentable physical appearance which is consistent with the overall brand image of the organisation (Kim et al, 2010). The result of value for money affecting customer satisfaction conveys that retail managers should continue offering promotional offers, discounts and other interesting value propositions (Jayasankaraprasad and Vijaya Kumar, 2012) as it will further enhance customer satisfaction levels. For instance, Wong and Dean(2009) in their study based in China suggested that Chinese consumers are generally looking for exclusive product choices, hence, retailers should offer consumers broad range of products from multiple brands at different price levels to meet their expectations. Furthermore, Chi and Kilduff (2011)
�63
recommends offering a competitive-pricing aspect in retail industry is the most attractive attribute amongst consumers which influence their purchase intention, therefore, retail enterprises should attempt offering a valuable deal to its customers.
Moreover, apart from the employee service and value for money, the servicescape of the supermarket is also an impactful attribute to customer satisfaction levels. To ensure a high degree of customer satisfaction with servicescape, retailers should focus on the tangible components like the physical facilities, visual cues, modern and fully functional computer information systems (Pantouvakis, 2010). Researchers recommend that maintaining cleanliness and easy to navigate layout of the service environment help create a positive impression in customers mind (R and S, 2018).
Keeping these points in mind, enterprises, specifically in the retail context, should not consider technology to be the only and the greatest driver of customer satisfaction while undervaluing or deemphasising the importance of time-tested non-technology attributes in this digital age. As demonstrated by this study the non-technology elements attain a greater degree of customer satisfaction over technology attributes in all aspects, where technology acts merely a marginal advantage over attained levels of customer satisfaction as compared to non-technological attributes. Perhaps, saving time of customers and service delivery cost of enterprises are the core benefits of SST, however, its impact in the domain of customer satisfaction as identified in this study are simply not enough to be considered as an important and independent variable factor as compared to non-technology attributes. Enterprises perhaps should not consider technology driven elements as the only driver when in pursuit of attaining a greater level of customer satisfaction, as non-technology elements play a vital role in the retail context when it comes to customer satisfaction.
�64
Chapter 6: Conclusion 6.1 Limitations and Future Research
Like other research studies, this study also has certain limitations which have to be acknowledged before generalising its findings. Firstly, the findings reported in this paper concerning the relationship between customer satisfaction, SST attributes and non-technology elements is based on cross-sectional sample data. A longitudinal research in future will help us in understanding the causal relationship between these variables over a longer period of time.
Second, the study was conducted using an online survey strategy using social media channels which lead to biased population in our sample, as the majority of the participants fell in the age category of 19-29 years. This could be avoided in the future by using simple random sampling or stratified sampling method.
Third, the study was limited to the geography of Dublin, Ireland. According to Hofstede (1980) the relationship between the constructs vary across different cultural settings. Therefore, the findings obtained from this study may not be applicable in other countries which have a dissimilar culture from the Irish.
Fourth, the SST attributes explained only 2.3% of variance in customer satisfaction in comparison to the non-technology elements in the model, there is still scope for researchers to explore this topic by conducting future research with same or different constructs present in the service environment that impact the customer satisfaction levels in different geography and context.
Furthermore, this study did not take into account any moderating variable like supermarket brand image in the model, therefore, future researchers can examine the effect of moderating variable on customer satisfaction.
�65
Finally, the present study focussed only on self-checkout SST in supermarket context, future studies could study the attributes of other different types of technological interface present in other service industries.
6.2 Conclusion
The purpose of this thesis was to examine the impact of SST on customer satisfaction after controlling for the known non-technology elements present in the supermarket. Based on multiple regression analysis, the result indicated that SST attributes explain 43% of variance in customer satisfaction with the enjoyment, assurance and convenience attribute being associated with customer satisfaction. The other attributes like functionality, security, design and customisation did not contribute to an acceptable extent customer satisfaction as they were not statistically significant, informing us that service providers should provide customers with a user friendly interface which is reliable, easy to use and build trust on its security measures. Furthermore, the key finding revealed through hierarchical analysis was that the controlling non-technology drivers i.e. employee service, servicescape, and value for money explained 75.1% of customer satisfaction by themselves while the SST attributes explained only marginal level of satisfaction. The results of this study dictates that these technological interfaces are more beneficial to retailers than the customers, as it helps them save their labour resources, deliver faster service and increase their profitability. However, the primary intention of retailers to better serve customers, through use of technology and improve their satisfaction levels does not really get fulfilled based on our findings. We can thus imply that consumers prefer using SST to take advance of its accessibility and autonomy benefits.TThe non-technology factors showed to be more impactful on customer satisfaction levels suggesting us that retailers should perhaps give high priority to these fundamental attributes present in the supermarket as these will be more valuable in the long run when in pursuit of greater customer satisfaction levels, rather than investing technologies which are currently in trend. Moreover, retailers with capabilities of physical employee interaction with customers can assist in cross-sell of their products, provide more personalised
�66
shopping experience to customers as it supports in increasing the firm's profitability, while at the same time, create a wider and loyal customer base. Finally, as shown in the results of this study, a good customer service, promotional offers to provide an impression of great value for money and well designed & planned supermarket can attract more customers and substantially assist in enhancing the customers satisfaction levels.
To conclude, this study has well justified the research objective stated of identifying the significant predictors of customer satisfaction in the supermarket industry. The findings obtained from this study is valuable for researchers to conduct future studies as well as the retailers to improvise their service offerings.
�67
References
Anderson, E. W. and Sullivan, M. W. (1993). The Antecedents and Consequences of Customer Satisfaction for Firms. Marketing Science, 12 (2): 125-143.
Anderson, Eugene W., Claes Fornell and Sanal K. Mazvancheryl (2004), “Customer Satisfaction and Shareholder Value,” Journal of Marketing, 68 (4),172–85.
Anderson, L., Ostrom, A.L., Corus, C., Fisk, R.P., Gallan, A.S., Girado, M., Mende, M., Mulder, M., Rayburn, S.W., Rosenbaum, M.S., Shirahada, K. and Williams, J.D. (2013), “Transformative service research: an agenda for the future”, Journal of Business Research, Vol. 66 No. 8, pp. 1203-1210.
Angelova, B and Zekiri J (2011), ‘Measuring customer satisfaction with service quality using American Customer Satisfaction model (ACSI Model)’, International Journal of Academic Research in Business and Social Sciences, vol. 1, no. 3, pp. 232-258.
Anitsal and David W. Schumann (2007) ‘Toward a Conceptualization of Customer Productivity: The Customer’s Perspective on Transforming Customer Labor into Customer Outcomes Using Technology-Based Self-Service Options’, Journal of Marketing Theory and Practice, 15(4), p. 349. doi: 10.2753/MTP1069-6679150405.
Arnould, E.J. (2014), “Rudiments of a value praxeology”, Marketing Theory, Vol. 14 No. 1, pp. 129-133.
Ary, D., Jacobs, L., Sorensen, C., & Walker, D. (2013). Introduction to research in education. Cengage Learning.
Babakus, E & Boller, G.W (1992), An empirical assessment of the SERVQUAL Scale, Journal of Business Research , vol. 24, pp. 253-68
Baker, J. (1986). The role of the environment in marketing services: The consumer perspective. In J. A. Czepiel, C. A. Congram & J. Shanahan (Eds.), The services challenge: Integrating for competitive advantage (pp. 79-84). American Marketing Association.
Baker, J. and Cameron, M. (1996), “The effects of the service environment on affect and consumer perception of waiting time: an integrative review and research propositions”, Journal of the Academy of Marketing Science, Vol. 24 No. 4, pp. 338‐49.
Baker, J., Parasuraman, A., Grewal, D. and Voss, G.B. (2002), “The influence of multiple store environment cues on perceived merchandise value and patronage intentions”, Journal of Marketing, Vol. 66 No. 2, pp. 120-141.
Bauer, H. H., Falk, T., & Hammerschmidt, M. (2006). eTransQual: A transaction process-based approach for capturing service quality in online shopping. Journal of Business Research, 59(7), 866–875. doi: 10.1016/j.jbusres.2006.01.021
Beatson, A., Coote, L. V. and Rudd, J. M. (2006) ‘Determining Consumer Satisfaction and Commitment Through Self-Service Technology and Personal Service Usage’, Journal of Marketing Management, 22(7–8), pp. 853–882. doi: 10.1362/026725706778612121.
Bendaravičienė, R. and Vilkytė, B. (2019) ‘Measurement of Customer Satisfaction with Service Quality: Study of Fashion Chain Stores in Lithuania’, International Journal of Management, Accounting & Economics, 6(2), pp. 113–128. Available at: http://search.ebscohost.com/
login.aspx?direct=true&AuthType=ip,cookie,shib&db=bth&AN=136233983&site=eds-live&scope=site (Accessed: 5 August 2019).
Beneke, J. and Carter, S. (2015), “The development of a consumer value proposition of private label brands and the application thereof in a South African retail context”, Journal of Retailing and Consumer Services, Vol. 25, pp. 22-35.
Bennett, R. and Rundle-Thiele, S. (2004) Customer satisfaction should not be the only goal. Journal of Services Marketing 7:514-523.
Bitner, M.J, (1992), Servicescape: The Impact of Physical surroundings on customers and employees, Journal of Marketing Vol. 56 pp 57-71.
Bitner, M.J., and Hubbert, A.R. (1994) "Encounter Satisfaction Versus Overall Satisfaction Versus Quality: The Customer's Voice," in Service Quality: New Directions in Theory and Practice, R.T. Ruster and R.L. Oliver (eds.). Thousand Oaks,CA: Sage, pp. 72-94.
Bitner, M. J., Ostrom, A. L., & Meuter, M. L. (2002). Implementing successful self-service technologies. The Academy of Management Executive, 16(4), 96–108. https://doi.org/10.5465/AME.2002.8951333
Bolton, RN & Drew, JH (1991), “A Longitudinal Analysis of the Impact of Service Changes on Customer Attitudes”, Journal of Marketing, vol. 55, pp. 1-10.
Boslaugh, S. D. (2008) Encyclopedia of epidemiology, vol. 2, SAGE Publications, Inc., Thousand Oaks, CA, doi: 10.4135/9781412953948. [Accessed 14 July 2019]
Buell, R.W., Campbell, D. and Frei, F. X (2014) ‘Human cashiers still trump self-checkouts for most grocers’, Canadian Grocer , Available at: www.canadiangrocer.com/top-stories/cashiers-1-machines-0-39016 (Accessed: 5 August 2019)
Buell, Ryan W., Campbell D. and F.X. Frei. (2010). “Are Self-Service Customers Satisfied or Stuck?”. Production and Operations Management Journal. Vol. 19, No. 6, November–December: 679–697
Burns & Bush (2003) Marketing Research: Online Research Applications, 4th edn, Prentice Hall, Upper Saddle River, NJ.
Buttle, F. (1996). SERVQUAL: review, critique, research agenda. European Journal of Marketing. 30. 8-32. 10.1108/03090569610105762.
Byrne, D. (2017). What are online surveys?. Project Planner. 10.4135/9781526408563.
Cameron, R. (2009). 'A sequential mixed model research design: design, analytical and display issues', International Journal of Multiple Research Approaches, 3(2), 140-152
Campbell, C.S., Paul, M. and Davis, M. (2011). ‘From self-service to super-service: A resource mapping framework for co-creating value by shifting the boundary between provider and customer’. Inf. Syst. E-Business Management. 9. 173-191. 10.1007/s10257-010-0142-4.
Chi, T. and Kilduff, P.P.D. (2011), “Understanding consumer perceived value of casual sportswear: an empirical study”, Journal of Retailing and Consumer Services, Vol. 18 No. 5, pp. 422-429
Ching-Yuan Huang, Cheng-Kai Chou and Po-Hsuan Wu (2016) ‘Servicescape, Service Convenience, and Service Evaluation in Food and Beverage Industry’, International Journal of Organizational Innovation, 8(3), pp. 262–270. Available at: http://search.ebscohost.com/
login.aspx?direct=true&AuthType=ip,cookie,shib&db=ent&AN=112223615&site=eds-live&scope=site (Accessed: 16 August 2019).
Churchill, G.A. (1975), “Should retail salespersons be similar to their customers?”, Journal of Retailing, Vol. 51 No. 3, pp. 29‐79.
Clifford, C. (2019) ‘Jeff Bezos: Amazon is still ‘small’—90% of US retail sales happen in brick and mortar stores’, CNBC, 12 April, Available at: https://www.cnbc.com/2019/04/12/amazons-jeff-bezos-most-us-sales-still-in-brick-and-mortar-stores.html (Accessed: 7 July 2019).
Clow, K. E., & James, K. E (2014), 'Questionnaire design', in Essentials of marketing research: putting research into practice, SAGE Publications, Inc., Thousand Oaks, CA, pp. 322-356, doi: 10.4135/9781483384726. [Accessed 11 July 2019]
Collier, J. E., and S. E. Kimes. (2012) Only if it is convenient: Understanding how convenience influences self-service technology evaluation. Journal of Service Research 16 (1): 39–51. doi:10.1177/ 1094670512458454.
Cronin, J.J. and Taylor, S.A. (1992) ‘Measuring service quality: a re-examination and extension’, Journal of Marketing, vol. 56, no. 3, pp. 55-68.
Cronin, J.J., Brady, M.K. and Hult, C.T.M. (2000). Assessing the effects of quality, value and customer satisfaction on consumer behavioral intentions in service environments. Journal of Retailing 76(2):193-218.
Crowther, D. & Lancaster, G. (2008) “Research Methods: A Concise Introduction to Research in Management and Business Consultancy” Butterworth-Heinemann
Dabholkar, P. A (1996) "Consumer Evaluations in New Technology-Based Self-Service Options: An Investigation of Alternative Models of Service Quality," International Journal of Research in Marketing, 13(1),29-51.
Darian, J. C., Tucci, L. A. and Wilman, A. R. (2001) Perceived Salesperson Service Attributes and Retail Patronage Intentions. International Journal of Retail and Distribution Management, 29 (4/5): 205-13.
De Mooij, M. and Hofstede, G. (2002) 'Convergence and divergence in consumer behavior: implications for international retailing', Journal of Retailing 78(1): 61-69. doi: 10.1016/S0022-4359(01)00067-7
Ding, D. X., Hu, P. J.-H., & Sheng, O. R. L. (2011). e-SELFQUAL: A scale for measuring online self-service quality. Journal of Business Research, 64(5), 508–515. doi: 10.1016/j.jbusres. 2010.04.007
Dixon, A.L., Spiro, R.L. and Jamil, M. (2001), “Successful and unsuccessful sales calls: measuring salespeople attributions and behavioral intentions”, Journal of Marketing, Vol. 65 No. 3, pp. 64-78.
Dodds, W., Monroe, K.B. and Grewal, D. (1991), “Effects of price, brand, and store information on buyers’ product evaluations”, Journal of Marketing Research, Vol. 28 No. 3, pp. 307-319.
Ellickson, P. B. and Misra, S. (2008) ‘Supermarket Pricing Strategies’, Marketing Science, 27(5), pp. 811–828. doi: 10.1287/mksc.1080.0398.
Eurostat(2018) ‘Employment by A*10 industry breakdowns’ Available at: https://bit.ly/2Kt2O6d
Fassnacht, M. and Koese, I. (2006) ‘Quality of Electronic Services: Conceptualizing and Testing a Hierarchical Model’, Journal of Service Research, 9(1), pp. 19–37. doi: 10.1177/1094670506289531.
Findlay, A. And Sparks, L. (2008), "Switched: store-switching behaviours", International Journal of Retail & Distribution Management, vol. 36, no. 5, pp. 375-386.
Finn, D. and Lamb, C. (1991). An evaluation of the SERVQUAL scale in a retailing setting. Advances in Consumer Research. Vol. 18 No. 4, 83-90.
Forbes, L. P. (2008) ‘When something goes wrong and no one is around: non-internet self-service technology failure and recovery’, Journal of Services Marketing, 22(4/5), pp. 316–327. doi: 10.1108/08876040810881713.
Fornell, C, M.D. Johnson, E. W. Anderson, J. Cha, and B.E. Bryant. (1996). The American Customer Satisfaction Index: Nature, Purpose, and Findings. Journal of Marketing, 60 (4): 7-18.
Fornell, Claes, Forrest V. Morgeson III and G. Tomas Hult (2016), “Stock Returns on Customer Satisfaction Do Beat the Market: Gauging the Effect of a Marketing Intangible,” Journal of Marketing, 80 (5), 92–107
Furrer, O., Liu, B. S.-C., & Sudharshan, D. (2000). The relationships between culture and service quality perceptions: Basis for cross-cultural market segmentation and resource a l l o c a t i o n . J o u r n a l o f S e r v i c e R e s e a r c h , 2 ( 4 ) , 3 5 5 – 3 7 1 . h t t p s : / / d o i . o r g /10.1177/109467050024004
Gaiser, T.J and Shreiner A.E. (2009), 'Research standards and ethical considerations', in A guide to conducting online research, SAGE Publications Ltd, London, pp. 25-36, doi: 10.4135/9780857029003. [Accessed 15 July 2019]
Ganguli, S., & Roy, S. K. (2011). Generic technology-based service quality dimensions in banking: Impact on customer satisfaction and loyalty. International Journal of Bank Marketing, 29(2), 168–189. https://doi.org/10.1108/02652321111107648
Gatignon H., and Robertson,T. S. “Innovative decision processes,” Handbook of consumer behaviour, vol. 316, no. 8, 1991.
Gaur, S. and Agarwal, R. (2006), ‘Service Quality Measurement in Retail Store Context: A Review of Advances Made Using SERVQUAL and RSQS’, The Marketing Review,6.317-330
Gill, J and Johnson, P. (2010) Research methods for Managers (4th edn). London:Sage.
Grayson, R.A.S. and McNeill, L.S. (2009), “Using atmospheric elements in service retailing: understanding the bar environment”, Journal of Services Marketing , Vol. 23 No. 7, pp. 517-527.
Grewal, D., Levy, M. and Kumar, V. (2009) ‘Customer Experience Management in Retailing: An Organizing Framework’, Journal of Retailing, 85(1), pp. 1–14. doi: 10.1016/j.jretai.2009.01.001.
Grewal, D., Roggeveen, A. L. and Nordfält, J. (2017) ‘The Future of Retailing’, Journal of Retailing, 93(1), pp. 1–6. doi: 10.1016/j.jretai.2016.12.008.
Grönroos, C. (1984). A service quality model and its marketing implications. European Journal of Marketing, 18(4), 36–44. doi: 10.1108/EUM0000000004784
�71
Grönroos, C. (2001). The perceived service quality concept–a mistake? Managing Service Quality: An International Journal, 11(3), 150–152. https://doi.org/10.1108/09604520110393386
Gunawardana, H. M. R. S. S., D., K. and Perera, W. L. M. V. (2015) ‘Impact of Self Service Technology Quality on Customer Satisfaction: A Case of Retail Banks in Western Province in Sri Lanka’, Gadjah Mada International Journal of Business, 17(1), pp. 1–24. Available at: http://search.ebscohost.com login.aspxdirect=true&AuthType=ip,cookie,shib&db=bth&AN=113484671&site=eds-live&scope=site ( Accessed: 9 August 2019).
Gupta, S. and Zeithaml, V. (2006) ‘Customer Metrics and Their Impact on Financial Performance’, Marketing Science, 25(6), pp. 718–739. doi: 10.1287/mksc.1060.0221.
Herrington, J., & Capella, L. (1996). Effects of music in service environments: a field study. The Journal of services marketing, Vol. 10, No. 2, p. 26-41.
Hightower, R. , Brady, M.K. and Baker, T.L. (2002), “Investigating the role of the physical environment in hedonic service consumption: an exploratory study of sporting events”,Journal of Business Research , Vol. 55 No. 9, pp. 697-707.
Hilton, T. et al. (2013) ‘Adopting self-service technology to do more with less’, Journal of Services Marketing, 27(1), pp. 3–12. doi: 10.1108/08876041311296338.
Hoffman, K D and Turley L.W, (2002), Atmospherics, Service Encounters and Consumer Decision Making: An Integrative Perspective, Journal of Marketing Theory and Practice, Issue. Summer, pp 33-46
Holbrook, M.B. (1994), “The nature of customer value”, in Rust, R.T. and Oliver, R.L. (Eds), Service Quality: New Directions in Theory and Practice, Sage publications, Newbury Park, CA, pp. 21-71.
Holbrook, M.B. (1999), Consumer Value. A Framework for Analysis and Research, Routledge, London.
Hooper, D., Coughlan, J. and Mullen, M. R. (2013) ‘The servicescape as an antecedent to service quality and behavioral intentions’, The Journal of Services Marketing, p. 271. Available at: http://search.ebscohost.com/login.aspx?direct=true&AuthType=ip,cookie,shib&db=edsgao&AN=edsgcl.344885895&site=eds-live&scope=site (Accessed: 30 June 2019).
Hult, G. T. M. et al. (2019) ‘Antecedents and Consequences of Customer Satisfaction: Do They Differ Across Online and Offline Purchases?’, Journal of Retailing, 95(1), pp. 10–23. doi: 10.1016/j.jretai.2018.10.003.
IFOP (2014), Available at: www.wincor-nixdorf.com/internet/cae/servlet/contentblob/1181296/publicationFile/83217/Analyse%20Etude%20IFOP%20Parcours%20achat%20Juin%202014.pdf
Inman, J. Jeffrey and Hristina Nikolova (2017), “Shopper-Facing Retail Technology: A Retailer Adoption Decision Framework Incorporating Shopper Attitudes and Privacy Concerns,” Journal of Retailing, 93, 7–28.
Janda, S., Trocchia, P. J., & Gwinner, K. P. (2002). Consumer perceptions of Internet retail service quality. International Journal of Service Industry Management, 13(5), 412-431. Available at: http://www.emeraldinsight.com/doi/pdf/10.1108/09564230210447913 (Accessed: 12 June 2019).
Jayasankaraprasad, C. and Vijaya Kumar, P. V. (2012) ‘Antecedents and Consequences of Customer Satisfaction in Food & Grocery Retailing: An Empirical Analysis’, Decision (0304-0941), 39(3), pp. 101–140. Available at: http://search.ebscohost.com/login.aspx?direct=true&AuthType=ip,cookie,shib&db=bth&AN=87340153&site=eds-live&scope=site (Accessed: 16 July 2019).
Johnson, D. S., Bardhi, F., & Dunn, D. T. (2008). Understanding how technology paradoxes affect customer satisfaction with self-service technology: The role of performance ambiguity and trust in technology. Psychology & Marketing, 25(5), 416–443.
Johnson, M.D., Herrmann, A., and Huber, F. (2006) The Evolution of Loyalty Intentions. Journal of Marketing, 70 (2):122-132.
Kelly, P., Lawlor, J., & Mulvey, M. (2017). Customer roles in self- service technology encounters in a tourism context. Journal of Travel & Tourism Marketing, 34(2), 222–238. https://doi.org/10.1080/10548408.2016.1156612
Kim, J.E. and Kim, J. (2012), ‘Human factors in retail environments: a review. International’, Journal of Retail & Distribution Management, vol. 40, no. 11, pp. 818-841.
Kim, J.‐E., Ju, H.W. and Johnson, K.K.P. (2010), “Sales associate's appearance: links to consumers' emotions, store image and purchase”, Journal of Retailing and Consumer Services, Vol. 16 No. 5, pp. 407‐13
Kim, S. and Stoel, L. (2004), “Dimensional Hierarchy of Retail Website Quality,” Information and Management, 41 (5), 619–34.
Knezevic, B., Renko, S. and Knego, N. (2011) ‘Changes in Retail Industry in the Eu’, Business, Management & Education / Verslas, Vadyba ir Studijos, pp. 34–49. doi: 10.3846/bme.2011.03.
Kokkinou, A. and Cranage, D. A.(2013) “Using self-service technology to reduce customer waiting times,” International Journal of Hospitality Management, vol. 33, pp. 435-445, Available at: https://doi.org/10.1016/j.ijhm.2012.11.003 (Accessed: 15 June 2019).
Kotler, P, (1974), Atmospherics as a Marketing Tool, Journal of Retailing, Vol. 49, Issue. Winter, pp 48-64
Kunc, J. and Križan, F.(2018) ‘Changing European retail landscapes: New trends and challenges’, Moravian Geographical Reports, (3), p. 150. doi: 10.2478/mgr-2018-0012.
Lam, S. Y., Shankar, V., Erramilli, M. K. and Murty, B. 2004. Customer Value, Satisfaction, and Switching Costs: An Illustration from Business-To-Business Service Context. Journal of the Academy of Marketing Science, 32 (3): 293-311.
Lavrakas, P. J. (2008). Encyclopedia of survey research methods Thousand Oaks, CA: Sage Publications, Inc. doi: 10.4135/9781412963947
Lewison, D.M. (1997) Retailing, Prentice Hall: New Jersey: 883.
Liao, Y and Liaw, G (2005) ‘How cues in the multiple store environment influence shopping mood and patronage satisfaction?’, Journal of Retailing, vol. 6, no. 1, pp. 1- 8
Lin, J.-S. C. and Hsieh, P. L. (2011) ‘Assessing the Self-service Technology Encounters: Development and Validation of SSTQUAL Scale’, Journal of Retailing, 87, pp. 194–206. Doi: 10.1016/j.jretai.2011.02.006.
Liu, S. (2012) “The impact of forced use on customer adoption of self-service technologies,” Computers in Human Behavior, vol. 28, no. 4, pp. 1194-1201
Lufkin (2017) ‘Should cashiers be humans or machines?’ BBC, 13 May, Available at: http://www.bbc.com/future/story/20170512-should-cashiers-be-humans-or-machines (Accessed: 3 June 2019)
Magi, A. W. (2003) Share of Wallet in Retailing: The Effects of Customer Satisfaction, Loyalty Cards and Shopper Characteristic. Journal of Retailing, 79 (2): 97-106.
Mango, W , Muceldili, B , Erdil, O . (2017). An investigation of self-service technology (sst) of participation banking in Turkey, Journal of Economics Finance and Accounting, 4 (2), 145-153. DOI: 10.17261/Pressacademia.2017.444
Mango, W., Muceldili, B and Erdil, O.(2017) ‘An investigation of self-service technology (sst) of participation banking in Turkey’, Journal of Economics, Finance and Accounting, p.145-153, : http://doi.org/10.17261/Pressacademia.2017.444
Mathwick, C., Malhotra, N. and Rigdon, E. (2001), “Experiential value: conceptualization, measurement and application in the catalog and internet shopping environment”, Journal of Retailing, Vol. 77 No. 1, pp. 3-56.
Mathwick, C., Malhotra, N. and Rigdon, E. (2002), “The effect of dynamic retail experiences on experiential perceptions of value: an internet and catalog comparison”, Journal of Retailing, Vol. 78 No. 1, pp. 51-60.
Martenson, R. (2007), "Corporate brand image, satisfaction and store loyalty", International Journal of Retail & Distribution Management, Vol. 35 No. 7, pp. 544-555. https://doi.org/10.1108/09590550710755921
Mattila, A., Cho, W. and Ro, H. (2011), “The role of self-service technologies in restoring justice”, Journal of Business Research, Vol. 64 No. 4, pp. 348-355.
Mayr, P. and Weller, K. (2016). Think before you collect: setting up a data collection approach for social media studies. In Sloan, L., & Quan-Haase, A. The SAGE Handbook of social media research methods (pp. 107-124). 55 City Road, London: SAGE Publications Ltd doi: 10.4135/9781473983847
Mehrabian, A. and Russell, J.A. (1974), An Approach to Environmental Psychology , MIT Press, Cambridge, MA
Merkle, D, and Edelman, M. (2002) “Nonresponse in Exit Polls: A Comprehensive Analysis.” In Survey Nonresponse, ed. Robert M. Groves, Don A. Dillman, John L. Eltinge, and Roderick J. A. Little, pp. 243–58. New York: Wile
Meuter, M. L., Ostrom, A.L., Roundtree, R.I. and Bitner, M.J. (2000) ‘Self-Service Technologies: Understanding Customer Satisfaction with Technology-Based Service Encounters’, Journal of Marketing, 64(3), pp. 50–64. doi: 10.1509/jmkg.64.3.50.18024.
Mittal, V., Kumar, P. & Tsiros, M. (1999) Attribute-level performance, satisfaction, and behavioral intentions over time: a consumption-system approach. Journal of Marketing, 63, pp. 88–101.
Moon, Y., and Frei, F. X. (2000). “Exploding the Self-Service Myth,” Harvard Business Review (78:3), pp. 26-27.
Neilsen (2008) ‘Grocery Store Choice & Value for Money: A Global Nielsen Consumer Report’ Available at: http://referentiel.nouvelobs.com/file/947/454947.pdf (Accessed: 3 June 2019)
Newman, A.J. (2007), “Uncovering dimensionality in the servicescape: towards legibility”, Service Industries Journal, Vol. 27 No. 1, pp. 15-28.
Nguyen, D.D.N. and Le Nguyen, H. (2007), “Determinants of retail service quality: a study of supermarkets in Vietnam”, Science and Technology Development, Vol. 10 No. 8, pp. 15‐23.
Oliver, R.L. (1980), “A cognitive model of the antecedents and consequences of customer satisfaction decisions”, Journal of Marketing Research, Vol. 17 No. 4, pp. 460-469.
Oliver, R.L. (1999), “Whence consumer loyalty?”, Journal of Marketing, Vol. 63 No. 4, pp. 33-44.
Orel, A. and Kara, A. (2014), “Supermarket self-checkout service quality, customer satisfaction, and loyalty: empirical evidence from an emerging market”, Journal of Retailing and Consumer Services , Vol. 21 No. 2, pp. 118-129.
Pantouvakis, A. (2010) ‘The relative importance of service features in explaining customer satisfaction : A comparison of measurement models’, Managing Service Quality: An International Journal, (4), p. 366. doi: 10.1108/09604521011057496.
Parasuraman, A., Zeithaml, V. A. and Berry, L. L. (1985) ‘A Conceptual Model of Service Quality and Its Implications for Future Research’, Journal of Marketing, 49(4), pp. 41–50. doi: 10.1177/002224298504900403 .
Parasuraman, A., Zeithaml, V. A., & Malhotra, A. (2005). ES-QUAL: A multiple-item scale for assessing electronic service quality. Journal of service research, 7(3), 213-233. Available at: http://journals.sagepub.com/doi/abs/10.1177/1094670504271156
Puccinelli, Nancy M., Ronald C. Goodstein, Dhruv Grewal, Robert Price, Priya Raghubir and David Stewart (2009), “Customer Experience Management in Retailing: Understanding the Buying Process,” Journal of Retailing, 85 (1), 15–30
Quinlan, C. (2011). Business research methods. 1st ed. Andover: Cengage Learning.
R., S. and A. M., S. (2018) ‘Impact of Servicescape on Customer Perceived Value in Fine Dining Restaurants’, Amity Business Review, 19(1), pp. 33–46. Available at: http://search.ebscohost.com/login.aspx?direct=true&AuthType=ip,cookie,shib&db=bth&AN=133488783&site=eds-live&scope=site (Accessed: 17 August 2019).
Radomir, L. and Nistor, C.V. (2014) “Comparing the original and the revised SSTQUAL scale among high-educated consumers in Romania,” Procedia Economics and Finance, vol. 15, pp. 926-934
Retail Ireland (2017) ‘Shaping the future of Irish retail 2020’, Available at: https://www.retailireland.ie/Sectors/RI/RI.nsf/vPages/Services_and_Information~Research_-and-_Data~shaping-the-future-of-irish-retail-2020/$file/Retail+Ireland+Shaping+the+future+of+Irish+retail+2020.pdf (Accessed: 31 May 2019)
Retail Technology. (2010). Carrefour extends self-scanning roll out. Retail Technology. Available at: http://www.retailtechnology.co.uk/news/1543/carrefour-extends-self-scanning-roll-out/ (Accessed: 15 June 2019)
Robson, C. (2002). Real World Research: A Resource for Social Scientists and Practitioner-Researchers (2nd ed.). Oxford: Blackwell Publishers Ltd.
Ruiz-Molina, M.-E., Gallarza, M. and Gil-Saura, I. (2018) ‘A review of value drivers in service settings’, Journal of Services Marketing, 32(7), pp. 850–867. doi: 10.1108/JSM-11-2017-0399.
Rust, R.T. and Oliver, R.L. (1994), Service quality: insights and managerial implications from the frontier, in Rust, R.T. and Oliver, R.L. (Eds), Service quality: New directions in theory and practice. Sage, Thousand Oaks, CA (11-19)
Rust, R.T., Zahorik, A.J. and Keiningham, T.L. (1995), Return of Quality: Measuring the Impact of Your Company’s Quest for Quality, Irwin Professional Publishing, Chicago, IL
Santos, J. (2003), "E‐service quality: a model of virtual service quality dimensions", Managing Service Quality: An International Journal, Vol. 13 No. 3, pp. 233-246. Available at: https://doi.org/10.1108/09604520310476490
Sarantakos, S. (2005) ‘Social Research’ Palgrave Macmillan
Saunders, M., Lewis, P. and Thornhill, A. (2012). ‘Research methods for business students.’ 1st ed. Harlow, England: Pearson.
Scherer, A., Wünderlich, N. V. and von Wangenheim, F. (2015) ‘The Value of Self-Service: Long-Term Effects of Technology-Based Self-Service Usage on Customer Retention’, MIS Quarterly, 39(1), pp. 177–200. Available at: http://search.ebscohost.com/login.aspx?direct=true&AuthType=ip,cookie,shib&db=bth&AN=100717564&site=eds-live&scope=site (Accessed: 12 August 2019).
Sekaran, U. (2003) Research Methods for Business: A Skill-Building Approach. 4th Edition, John Wiley & Sons, New York
Sekaran, U., & Bougie, R. (2010). Research methods for business: A skill-building approach (5th ed.). Haddington: John Wiley & Sons.
Seo, S. and Lee, Y. (2008), “Shopping values of clothing retailers perceived by consumers of different social classes”, Journal of Retailing and Consumer Services, Vol. 15 No. 6, pp. 491-499.
Shahid Iqbal, M., Ul Hassan, M. and Habibah, U. (2018) ‘Impact of self-service technology (SST) service quality on customer loyalty and behavioral intention: The mediating role of customer satisfaction’, TiuWright, L. (ed.) Cogent Business & Management. Informa UK Limited, 5(1). doi: 10.1080/23311975.2018.1423770.
Shamdasani, P. & Mukherjee, A. & Malhotra, N. (2008). Antecedents and consequences of service quality in consumer evaluation of self-service internet technologies. Service Industries Journal. 28. 10.1080/02642060701725669.
Silverman, D. (2013). Doing Qualitative Research: A practical handbook. London: Sage.
SITA(2009).”PassengerProcessing,” Available at: http://www.sita.aero/content/passenger-processing
Soper, S.(2018) ‘Amazon said to plan 3,000 cashierless stores by 2021’, Independent.ie, 27 September Available at: https://www.independent.ie/business/commercial-property/amazon-said-to-plan-3000-cashierless-stores-by-2021-37357630.html (Accessed: 3 July 2019)
Sorace, S., Pantano, E., Priporas, C.-V., and Iazzolino, G. (2017). Patent analysis as a measure of innovation in retail settings: Some preliminary evidence. In P. Rossi (Ed.), Marketing at the confluence between entertainment and analytics (pp. 377–384). Springer.
Sweeney, J. and Soutar, G. (2001), “Consumer perceived value: the development of a multiple item scale”, Journal of Retailing, Vol. 77 No. 2, pp. 203-207.
Sweeney, J., Soutar, G. and Johnson, L.W. (1999), “The role of perceived risk in the quality-value relationship: a study in a retail environment”, Journal of Retailing, Vol. 75 No. 1, pp. 77-105.
Synopsis (2019) 'Software security trends from experts at Infosec Europe 2019', Software integrity blog, 25 July, Available at: https://www.synopsys.com/blogs/software-security/software-security-trends-2019/ [Accessed 18 August 2019]
Sánchez-Fernández, R., Iniesta-Bonillo, M.A. and Holbrook, M.B. (2009), “The conceptualisation and measurement of consumer value in services”, International Journal of Market Research, Vol. 51 No. 1, pp. 93-113.
Söderlund, M. (2010), “Other customers in the retail environment and their impact on the customer's evaluation of the retailer”, Journal of Retailing and Consumer Services, Vol. 18 No. 3, pp. 174‐82.
The Economist.( 2009). "Help Yourself-The Recession Spurs self-service," Available at: http://www.economist.com/node/13961621
Ticehurst, G.W. and Veal, A.J. (2000), Business research methods: a managerial approach, 2nd edn, Pearson Education, New South Wales.
Trocchia, P. J. and Janda, S. (2003), “How do Consumers Evaluate Internet Retail Service Quality,” Journal of Services Marketing, 17 (3), 243–5.
Tsitskari, E., Antoniadis, C.H. and Costa, G. (2014), “Investigating the relationship among service quality, customer satisfaction and psychological commitment in Cyprian fitness centres”, Journal of Physical Education and Sport, Vol. 14 No. 4, pp. 514-520 doi: 10.7752/jpes.2014.04079
Vassileva B, Balloni A (2014) Service quality measurement: implications for healthcare sector in Bulgaria. 11th International Conference on Information Systems and Technology Management – CONTECSI May, 28 to 30, 2014 – São Paulo, Brazil.
Vehovar, V and Manfreda, K. (2008) 'Overview: online surveys', in The sage handbook of online research methods, SAGE Publications, Ltd, , pp. 176-194, doi: 10.4135/9780857020055. [Accessed 10 July 2019]
Verhoef P.C., Lemon K.N., Parasurman A., Riggeveen A, Tsiros M., Schlesinger L.A. (2009) ‘Customer Experience Creation: Determinants, Dynamics and Management Strategies’, Journal of Retailing, 85(1) pp. 31–41. Available at : http://search.ebscohost.com/login.aspx? direct=true&AuthType=ip,cookie,shib&db=pbh&AN=36973538&site=eds- live&scope=site&custid=ncirlib (Accessed: 26 January 2019)
Voss, G. G., and Rieder, K. (2005). The working customer: when consumers become unpaid employees. New York, United States: Campus.
Wang, M. C-H. (2012) Determinants and consequences of consumer satisfaction with self-service technology in a retail setting. Journal of Service Theory and Practice 22(2):128-14DOI: 10.1108/09604521211218945
Wolfinbarger, M., & Gilly, M. C. (2003). eTailQ: dimensionalizing, measuring and predicting etail quality. Journal of retailing, 79(3), 183-198. Available at: https://www.sciencedirect.com/science/article/pii/S0022435903000344 (Accessed: 3 June 2019).
Wong, A. and Dean, A. (2009), “Enhancing value for Chinese shoppers: the contribution of store and customer characteristics”, Journal of Retailing and Consumer Services, Vol. 16 No. 2, pp. 123-134.
Wright, K.(2005) ‘Researching Internet-Based Populations: Advantages and Disadvantages of Online Survey Research, Online Questionnaire Authoring Software Packages, and Web Survey Services’ , Journal of Computer-Mediated Communication, 10(3), DOI: 10.1111/j.1083-6101.2005.tb00259.x
Yang, J., & Klassen, K. J. (2008). How financial markets reflect the benefits of self-service technologies. Journal of Enterprise Information Management, 21(5), 448–467. https://doi.org/10.1108/17410390810904238
Yang Z. and Peterson, R.T. 2004. Customer Perceived Value, Satisfaction, and Loyalty: The Role of Switching Costs. Psychology and Marketing, 21 (10):799-822.
Yen, H. R. (2005). An attribute-based model of quality satisfaction for Internet self-service technology. The Service Industries Journal, 25(5), 641–659. https://doi.org/10.1080/02642060500100833
Yoo, B., & Donthu, N. (2001). Developing a scale to measure the perceived quality of an Internet shopping site (SITEQUAL). Quarterly journal of electronic commerce, 2(1), 31-45. Available at: https://pdfs.semanticscholar.org/a2ac/37334af8efa6b46350e6c86e51c27decc345.pdf (Accessed: 3 June 2019)
Yılmaz, I. (2009) Measurement of Service Quality in the Hotel Industry. Anatolia. doi: 20. 10.1080/13032917.2009.10518915
Zeithaml, V. A., Berry, L. L. and Parasuraman, A. (1988) ‘Communication and Control Processes in the Delivery of Service Quality’, Journal of Marketing, 52(2), p. 35. doi: 10.1177/002224298805200203.
Zeithaml, V. A., Bitner, M. J., & Gremler, D. D. (2009). Services Marketing. Integrating Customer Focus Across the Firm (5th ed.). Boston: McGraw Hill.
Zhou, Y., Huang, M., Tsang, A. and Zhou, N. (2013), “Recovery strategy for group service failures”, European Journal of Marketing, Vol. 47 No. 8, pp. 1133-1156.