Page 1
‘An Investigation into the introduction of a tax on sugar
sweetened soft drinks in Ireland and its impact on consumers’
buying behaviour.’
Simon O’Connor
MSc. in Management
National College of Ireland
A Dissertation submitted for the MSc in Management
submitted to the National College of Ireland
Submission of Thesis and Dissertation
Page 2
i
Abstract
Title: ‘An Investigation into the introduction of a tax on sugar sweetened soft drinks in
Ireland and its impact on consumers buying behaviour.’
Name: Simon O’Connor
Purpose: The purpose of this study is to investigate the impact on buying behaviour of Irish
consumers since the introduction of a sugar tax on sugar sweetened soft drinks. It will seek
understand if behaviour has shifted since the introduction of the tax and will identify the
main factors that impact upon buying behaviour. In addition, the research will focus on
both the price and sugar content of soft drinks and explore if these influence behaviour
change. The Irish Government’s aim of the tax is to shift consumers from sugar sweetened
soft drinks to healthier alternatives, which may lead to lowering the obesity rates. This
study aims to establish if this tax is succeeding in its aim.
Structure: This study adopts a quantitative approach to research, where respondents were
questioned through a structured web-based, open and closed question survey to gather
robust data to understand the main factors that influenced any shifts in behaviour.
Originality/Value: This research adds knowledge and understanding to several areas, with
detailed attention on Irish consumer behaviour with regards to this tax, especially as this
tax was introduced less than six months before this research project. The research will also
add knowledge regarding the impact of a ‘sin’ tax on overall behaviour, the impact of price
on consumer decisions, and if sugar content is affecting behavioural decisions. The research
updates the vast existing literature in this area and identifies the challenges that
governments might face should they implement additional sin taxes. The research can also
provide important information on consumer behaviour to other fast-moving consumer
goods producers, should the base for sugar tax be widened to other categories such as
breakfast cereals or confectionary.
Concluding Statement: Results indicate that Irish consumers have not shifted their buying
behaviour since the introduction of the sugar tax on sugar sweetened soft drinks.
Price and sugar do not play a role when buying a soft drink and Irish consumers’ perceptions
of sugar content on a wide range of beverages is significantly inaccurate.
Keywords: Consumer Behaviour; Obesity; Sin Taxes; Public Health; Sugar tax; Addiction;
Soft drinks; Sugar Content, Sugar Perceptions.
Page 3
ii
National College of Ireland
Research Students Declaration Form
(Thesis/Author Declaration Form)
Name: Simon O’Connor
Student Number: 16121732
Degree for which thesis is submitted: MSc in Management
Material submitted for award
(a) I declare that the work has been composed by myself.
(b) I declare that all verbatim extracts contained in the thesis have been
distinguished by quotation marks and the sources of information
specifically acknowledged.
(c) My thesis will be included in electronic format in the College
Institutional Repository TRAP (thesis reports and projects)
(d) Either *I declare that no material contained in the thesis has been used
in any other submission for an academic award.
Or *I declare that the following material contained in the thesis formed
part of a submission for the award of
Master of Science in Management
Signature of research student: _______________________________
Date: _____________________
Page 4
iii
Dedication
I dedicate this Thesis to my late mother, Bernie O’Connor, although she didn’t manage to
get to see me finish my master’s, her unending love and support from the start stayed with
me all the way and ensured that I managed to get through it. I did it Mam.
Page 5
iv
Acknowledgements
I would to express my sincere gratitude to several people who have given their support and
guidance to make this dissertation possible.
I would like to thank my supervisor, Dr Louise Maguire, for her expert guidance throughout
this research project. From the start, Dr Louise provided excellent tutorage and exceptional
continuous feedback of which I am truly grateful.
I would also like to thank Dr Collette Darcy, Jonathan Lambert and Richard Barry from the
National College of Ireland who have each assisted in their own individual ways.
Furthermore, I would like to also express my gratitude to my employer Britvic Ireland for
funding my further education, my sincere gratitude also extends to my Director Brian
Magennis, for his support and made this education possible, and to my line manager Lesley
Ferris who fully supported me throughout this master’s programme.
I am very thankful to my family for their belief in me and unyielding support along the way.
I also express my gratitude to my best friend Mark Kirwan for his love of further education.
Finally, I must thank my girlfriend Ashling Curtis for her continued support and most
importantly her patience throughout this dissertation.
Page 6
v
Table of Contents
Contents 1. Abstract .................................................................................................................................................. i
2. Dedication .............................................................................................................................................. iii
3. Acknowledgements ................................................................................................................................... iv
4. Table of Contents ....................................................................................................................................... v
5. List of Tables ........................................................................................................................................... vii
6. List of Figures ......................................................................................................................................... viii
7. List of Appendices ..................................................................................................................................... ix
8. List of Abbreviations ................................................................................................................................... x
9. Introduction ............................................................................................................................................ 1
9.1. Thesis Outline .................................................................................................................................. 6
10. Literature Review ...................................................................................................................................... 7
10.1. Demand for Taxation ......................................................................................................................... 8
10.2. Alternatives to a Sin Tax.....................................................................................................................13
10.3. Current Gaps in Research ...................................................................................................................22
10.4. Conclusion .....................................................................................................................................24
11. Research Objectives and Hypotheses .............................................................................................................25
12. Methodology Chapter ...............................................................................................................................28
12.1. Introduction ...................................................................................................................................28
12.2. Research Problem Definition ...............................................................................................................29
12.3. Research Philosophy .........................................................................................................................30
12.4. Research Question ...........................................................................................................................30
12.5. Research Objectives ..........................................................................................................................31
12.6. Research Strategy ............................................................................................................................32
12.7. Research Design ..............................................................................................................................33
13. Proposed Methodology and Structure ............................................................................................................33
13.1. Questionnaire Design ........................................................................................................................34
13.2. Procedure ......................................................................................................................................36
13.3. Building the Questionnaire .................................................................................................................36
13.3.1. Pilot Test ............................................................................................................................................................ 37
13.3.2. Administrating the Survey .................................................................................................................................. 39
13.3.3. Research Approach............................................................................................................................................. 39
13.3.4. Research Sample ................................................................................................................................................ 40
13.3.5. Time Horizon ...................................................................................................................................................... 41
13.3.6. Data Collection, Data Storage and Data Privacy .................................................................................................. 41
13.3.7. Ethical Issues ...................................................................................................................................................... 42
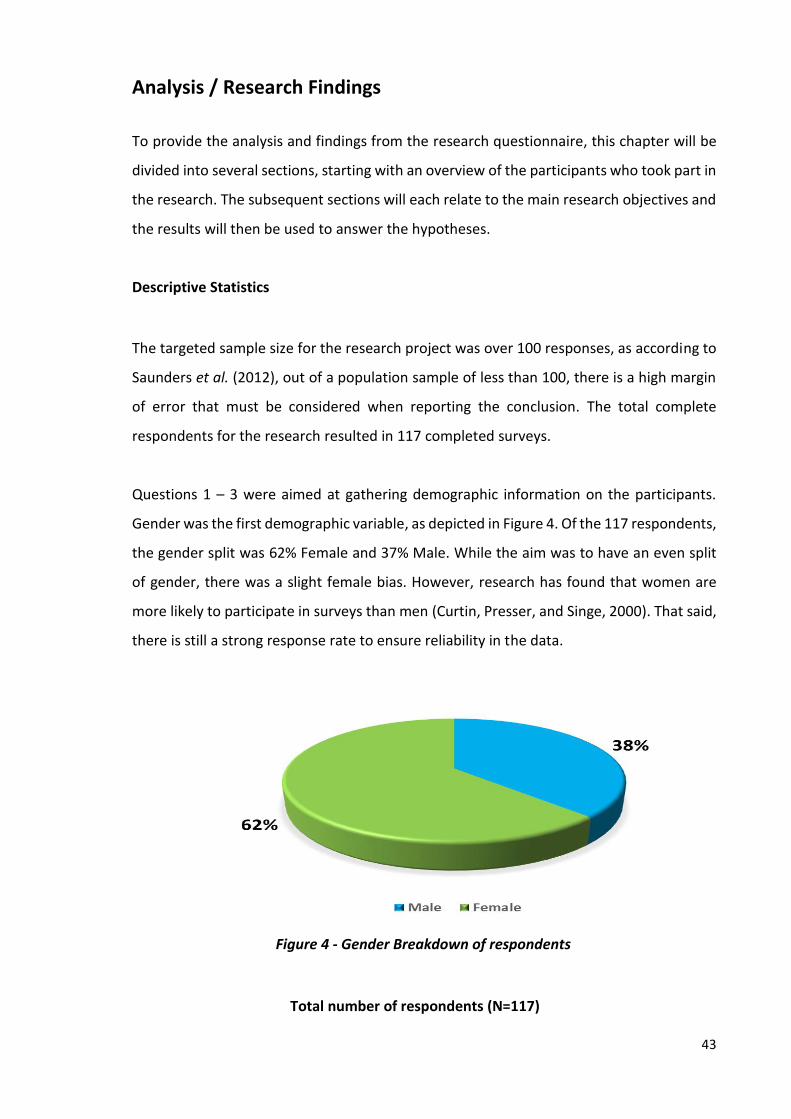
14. Analysis / Research Findings ........................................................................................................................43
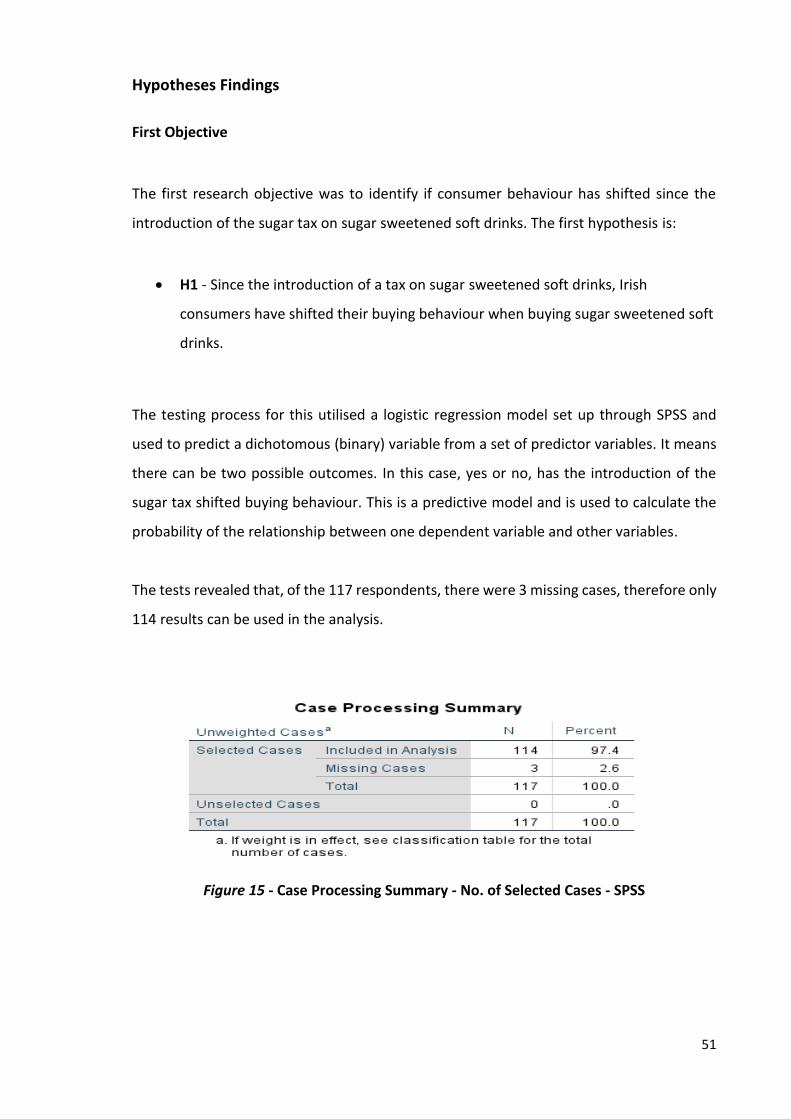
14.1. Hypotheses Findings .........................................................................................................................51
15. Conclusions and Recommendations ..............................................................................................................66
Page 7
vi
16. Discussion ..............................................................................................................................................67
16.1. Implications and recommendations for Governments ................................................................................70
16.2. Successes and Limitations of the Study ..................................................................................................71
16.2.1. Successes ........................................................................................................................................................... 71
16.2.2. Limitations ......................................................................................................................................................... 71
16.3. Recommendations for further study ......................................................................................................72
16.4. Conclusion .....................................................................................................................................73
17. References .............................................................................................................................................74
18. Appendices ............................................................................................................................................86
Page 8
vii
List of Tables
Table 10 - Purchasing and Consumption Behaviour .......................................................... 49
Page 9
viii
List of Figures
Figure 1 - Percentage of Irish people who are overweight or obese .................................. 1
Figure 2 - Examples of substitute beverages available to consumers in Ireland .............. 17
Figure 3 - Saunders Research Onion ................................................................................... 29
Figure 4 - Gender Breakdown of respondents ................................................................... 43
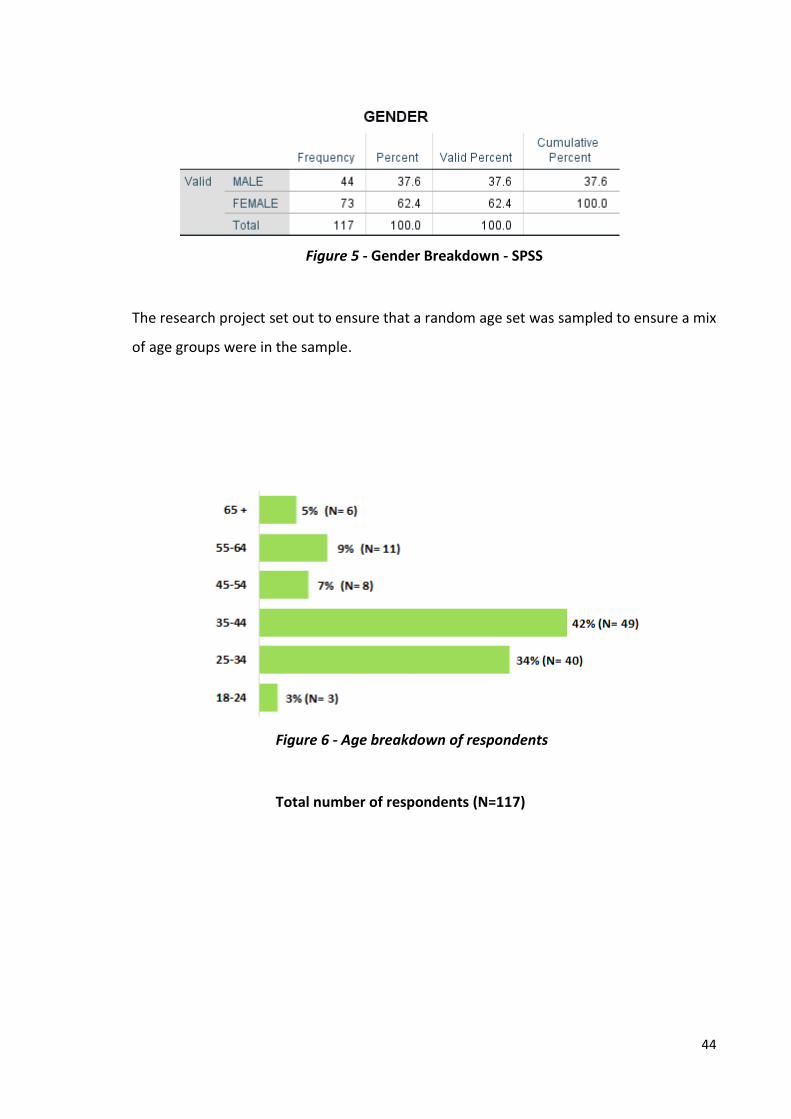
Figure 5 - Gender Breakdown - SPSS .................................................................................. 44
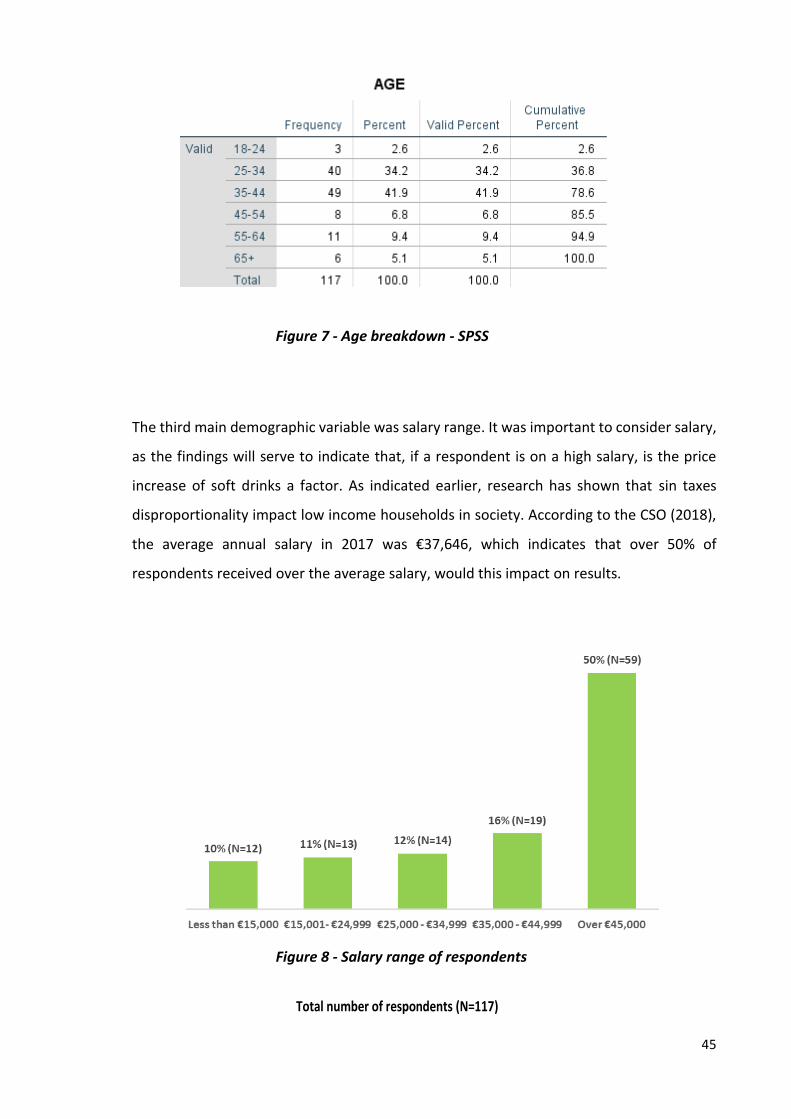
Figure 6 - Age breakdown of respondents ......................................................................... 44
Figure 7 - Age breakdown - SPSS ........................................................................................ 45
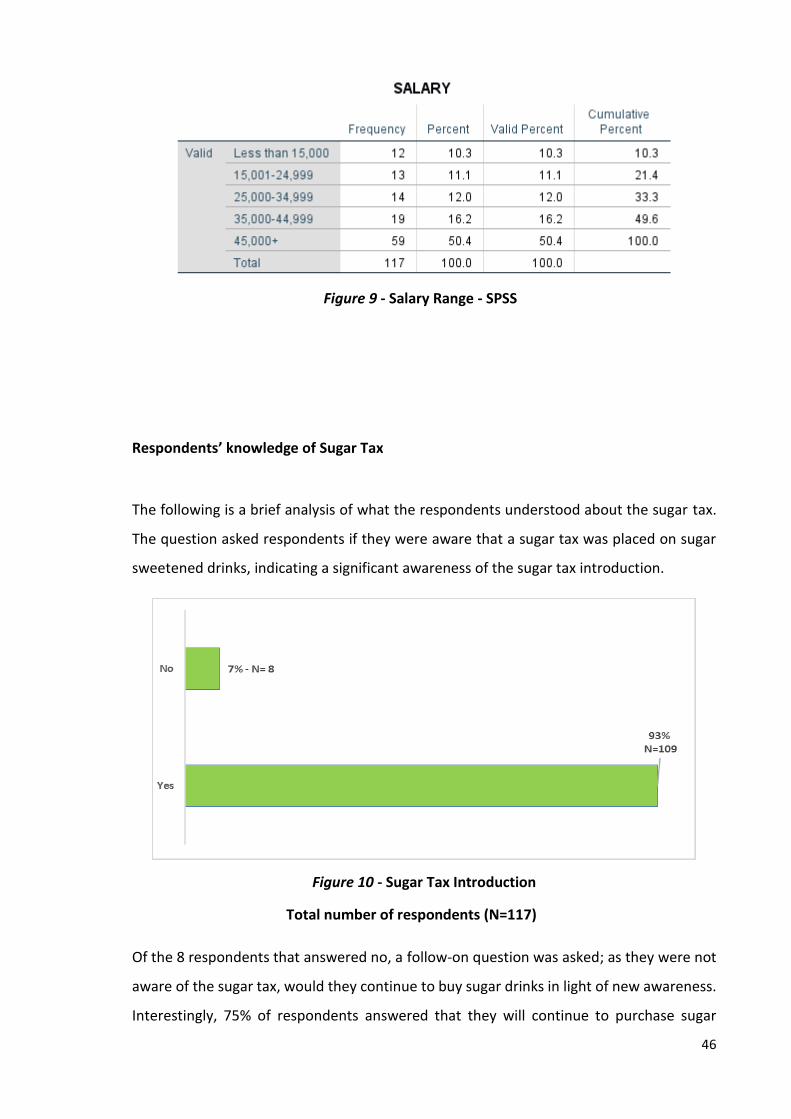
Figure 8 - Salary range of respondents ............................................................................... 45
Figure 9 - Salary Range - SPSS ............................................................................................. 46
Figure 10 - Sugar Tax Introduction ..................................................................................... 46
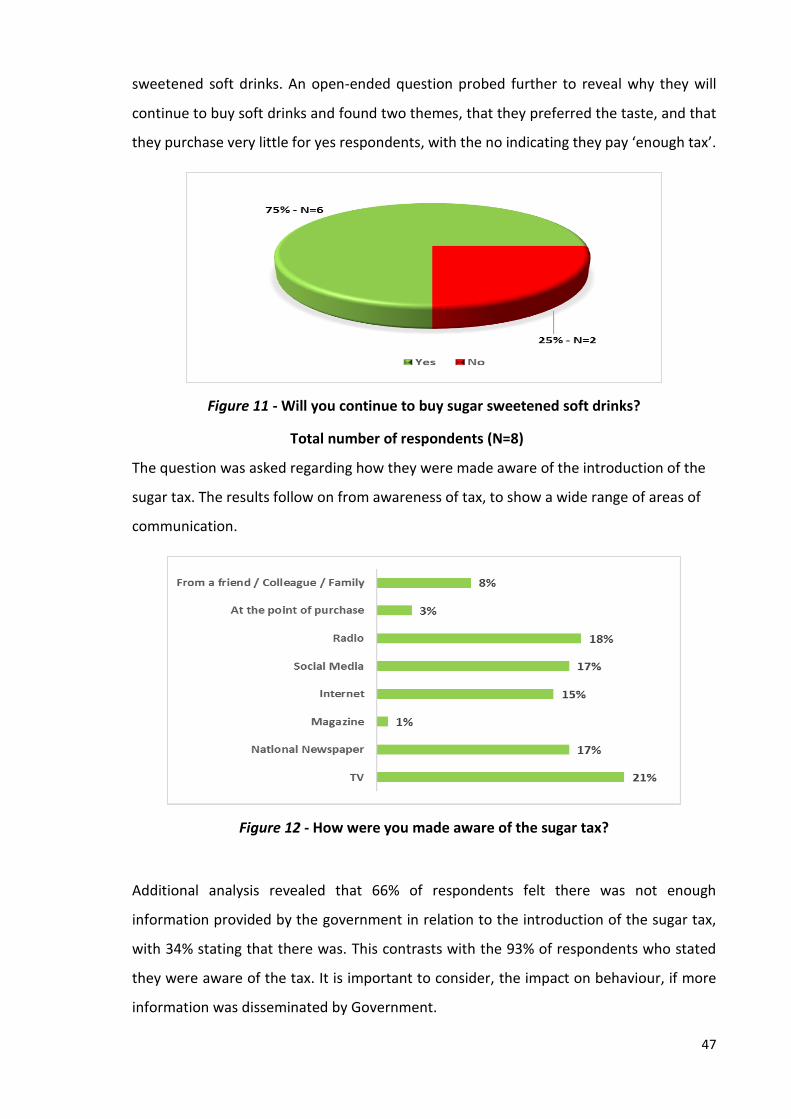
Figure 11 - Will you continue to buy sugar sweetened soft drinks? ................................. 47
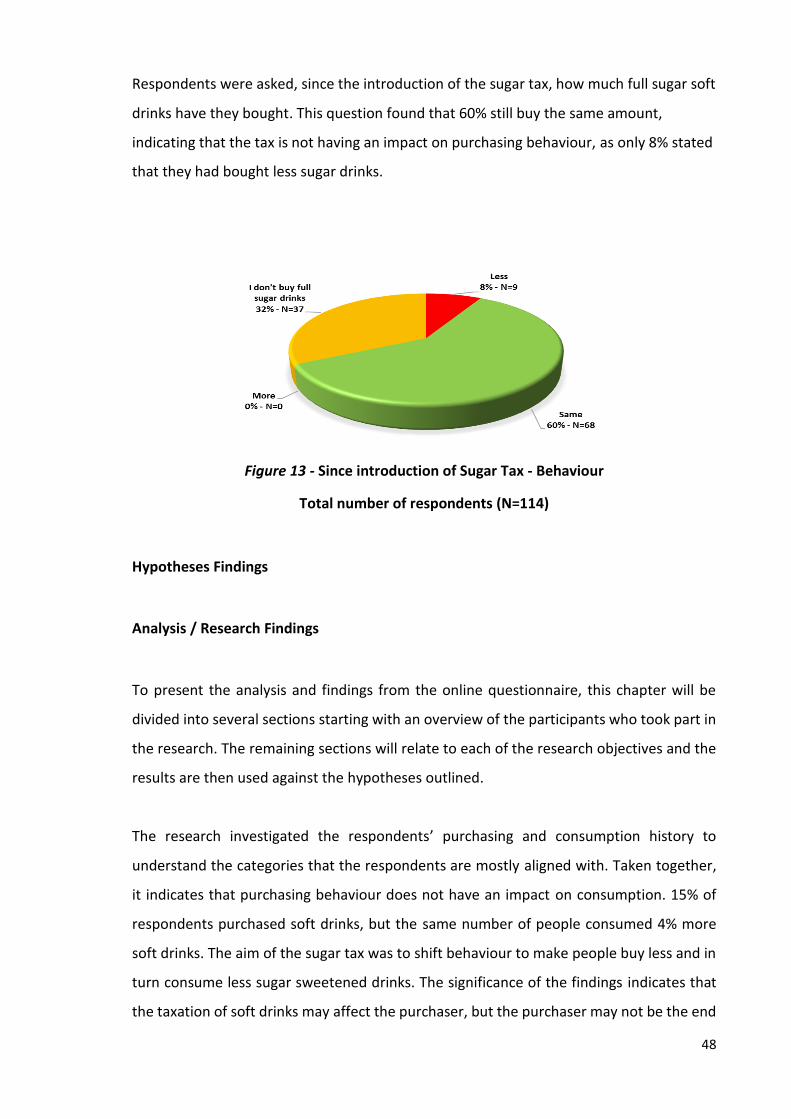
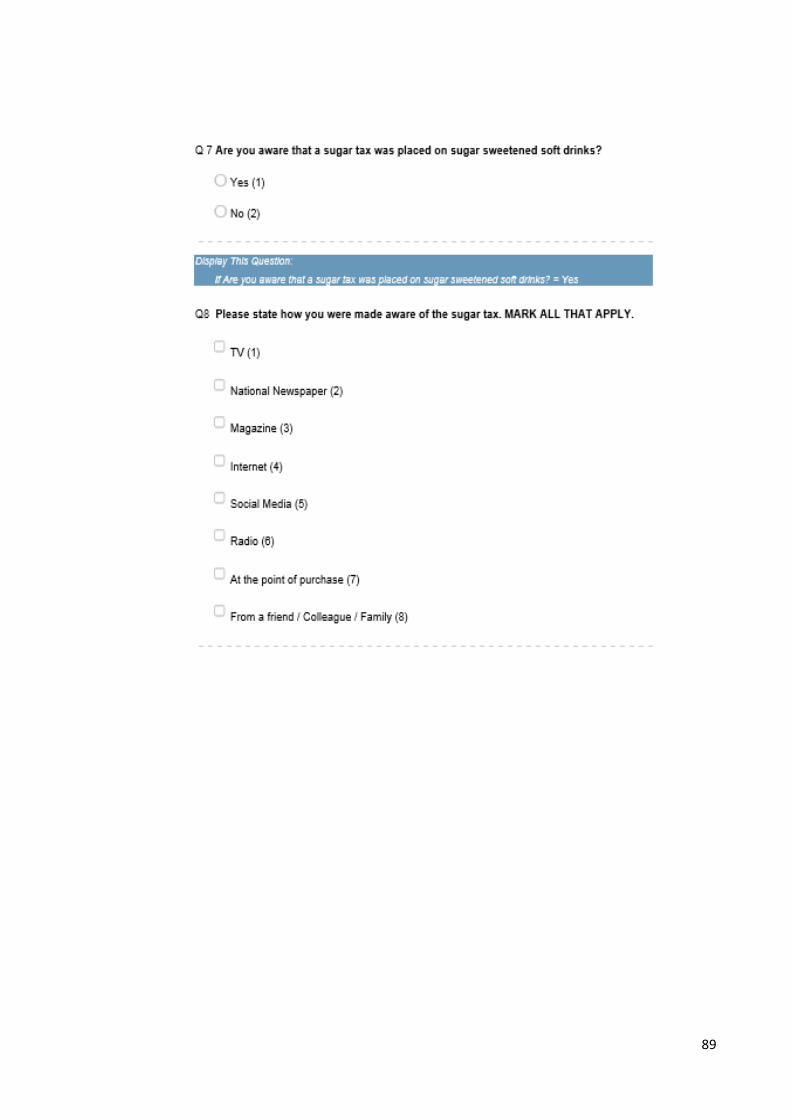
Figure 12 - How were you made aware of the sugar tax? ................................................. 47
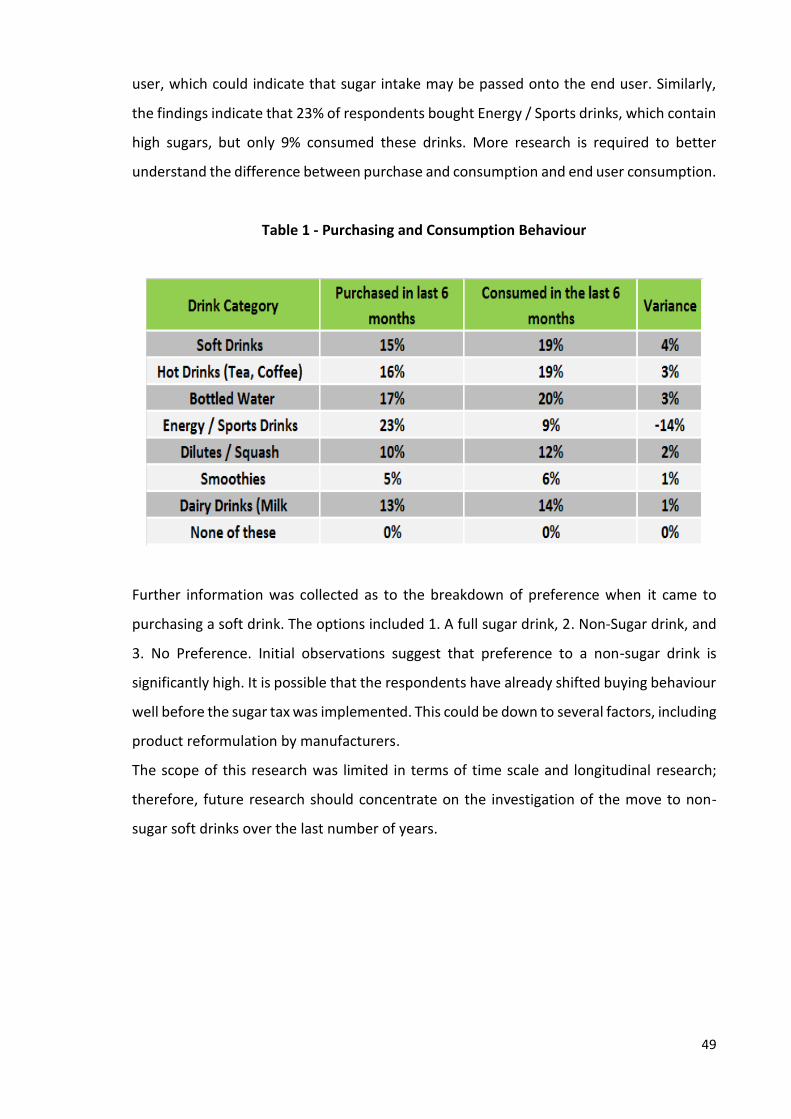
Figure 13 - Since introduction of Sugar Tax - Behaviour .................................................... 48
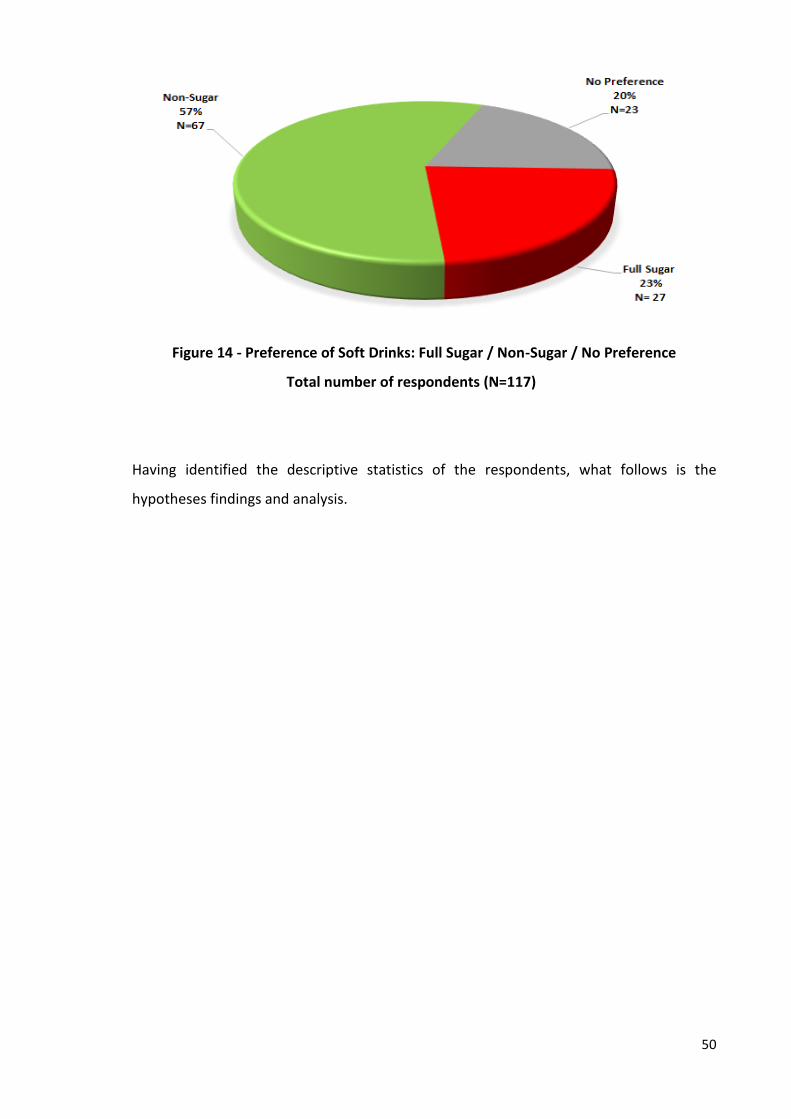
Figure 14 - Preference of Soft Drinks: Full Sugar / Non-Sugar / No Preference ............... 50
Figure 15 - Case Processing Summary - No. of Selected Cases - SPSS ............................... 51
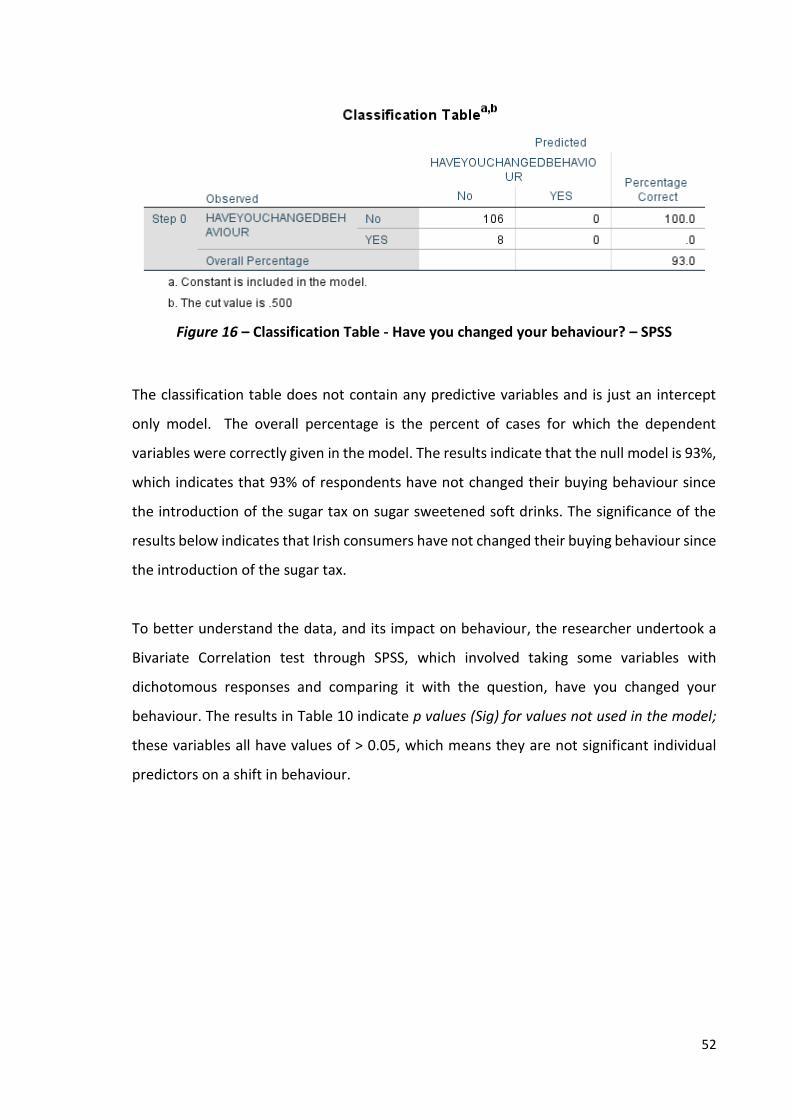
Figure 16 – Classification Table - Have you changed your behaviour? – SPSS ................. 52
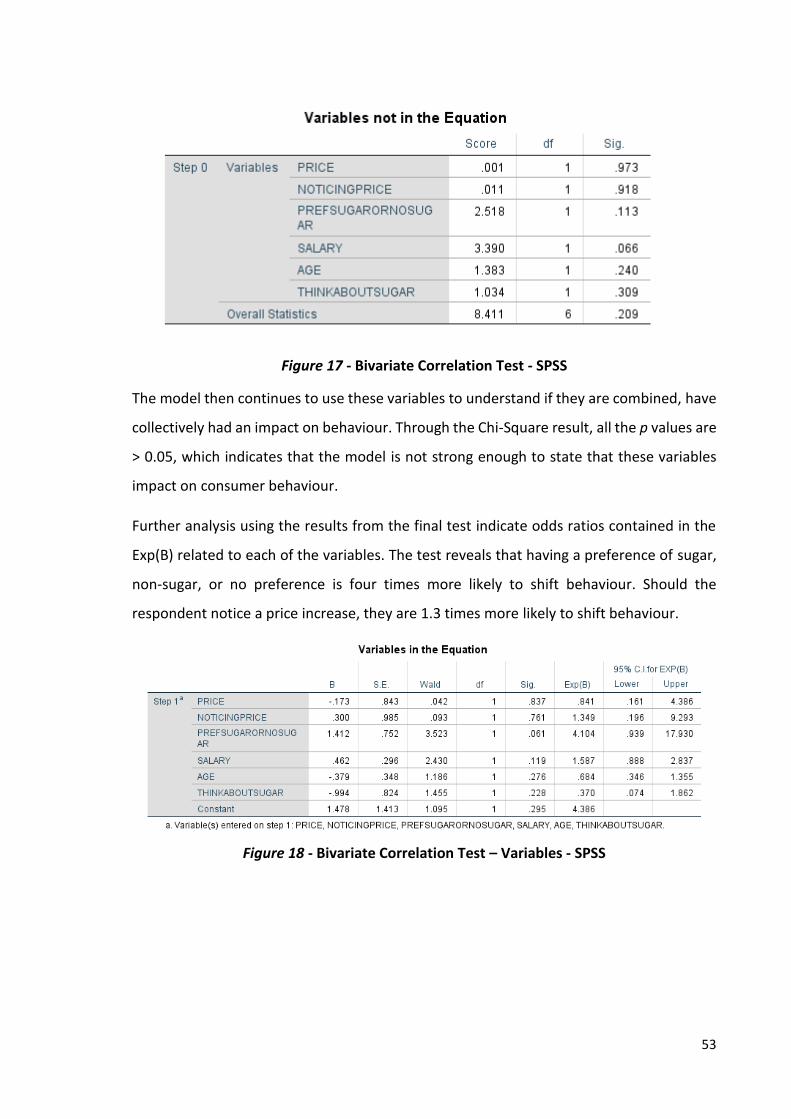
Figure 17 - Bivariate Correlation Test - SPSS ...................................................................... 53
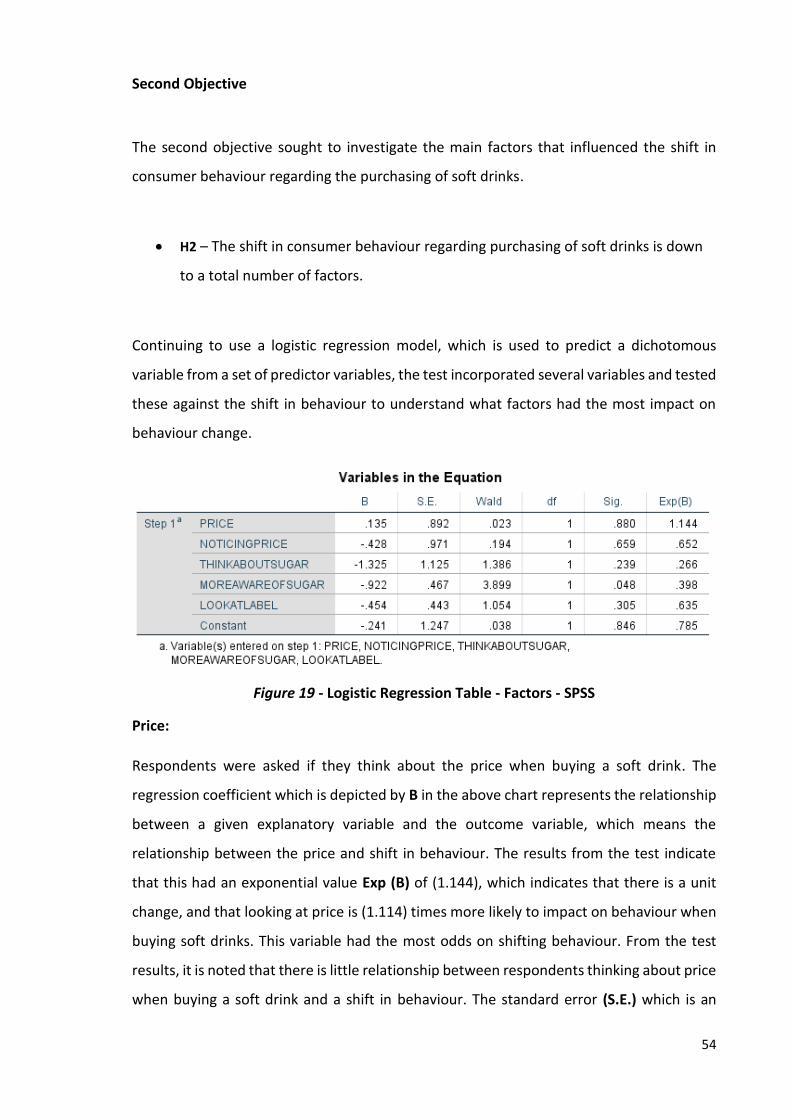
Figure 18 - Bivariate Correlation Test – Variables - SPSS ................................................... 53
Figure 19 - Logistic Regression Table - Factors - SPSS ........................................................ 54
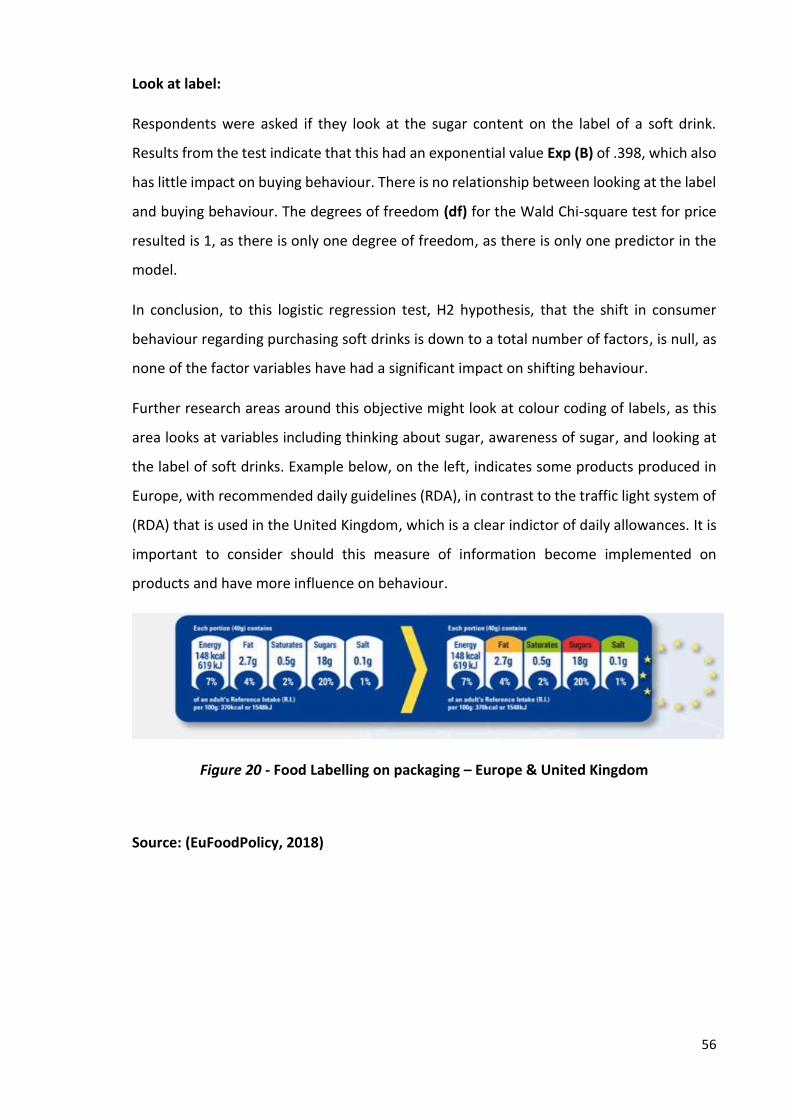
Figure 20 - Food Labelling on packaging – Europe & United Kingdom ............................. 56
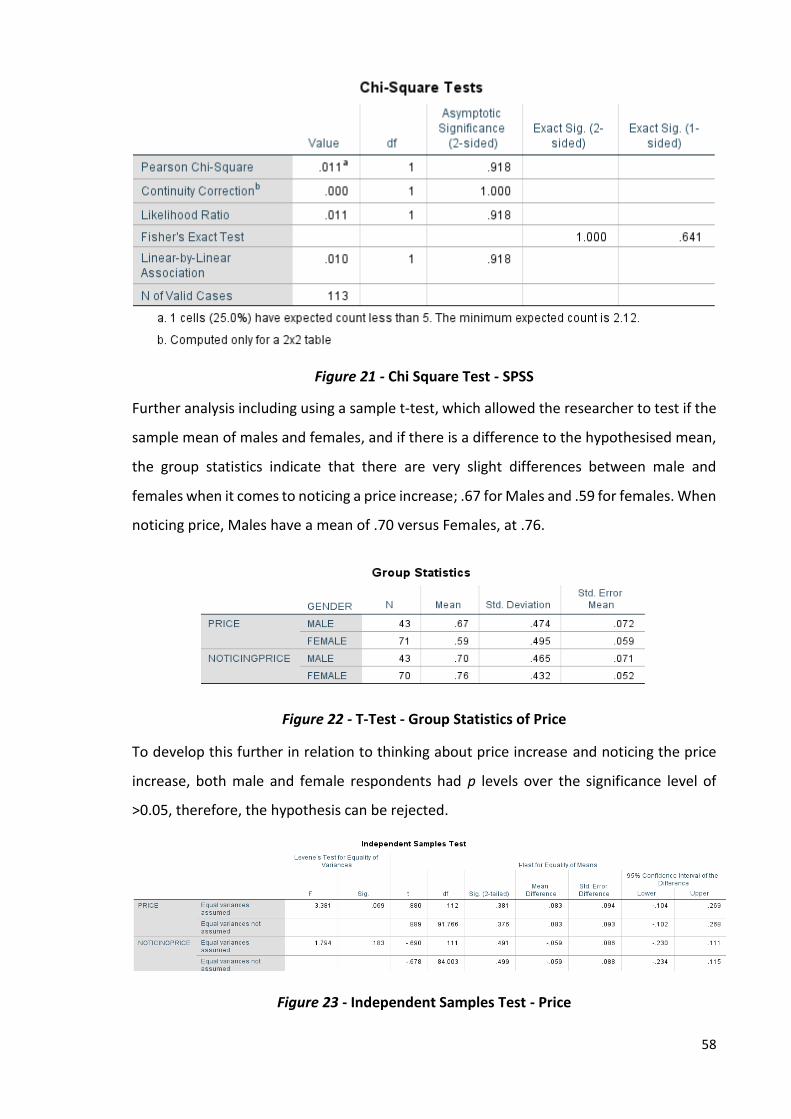
Figure 21 - Chi Square Test - SPSS ....................................................................................... 58
Figure 22 - T-Test - Group Statistics of Price ...................................................................... 58
Figure 23 - Independent Samples Test - Price .................................................................... 58
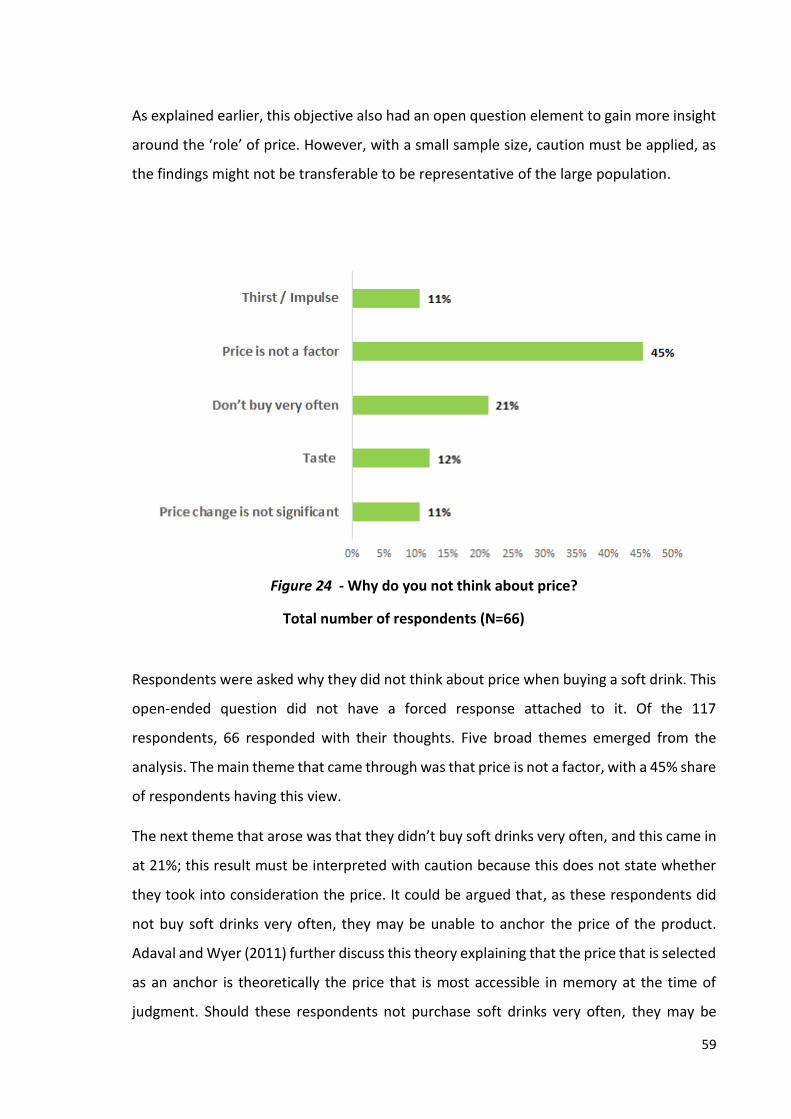
Figure 24 - Why do you not think about price? ................................................................ 59
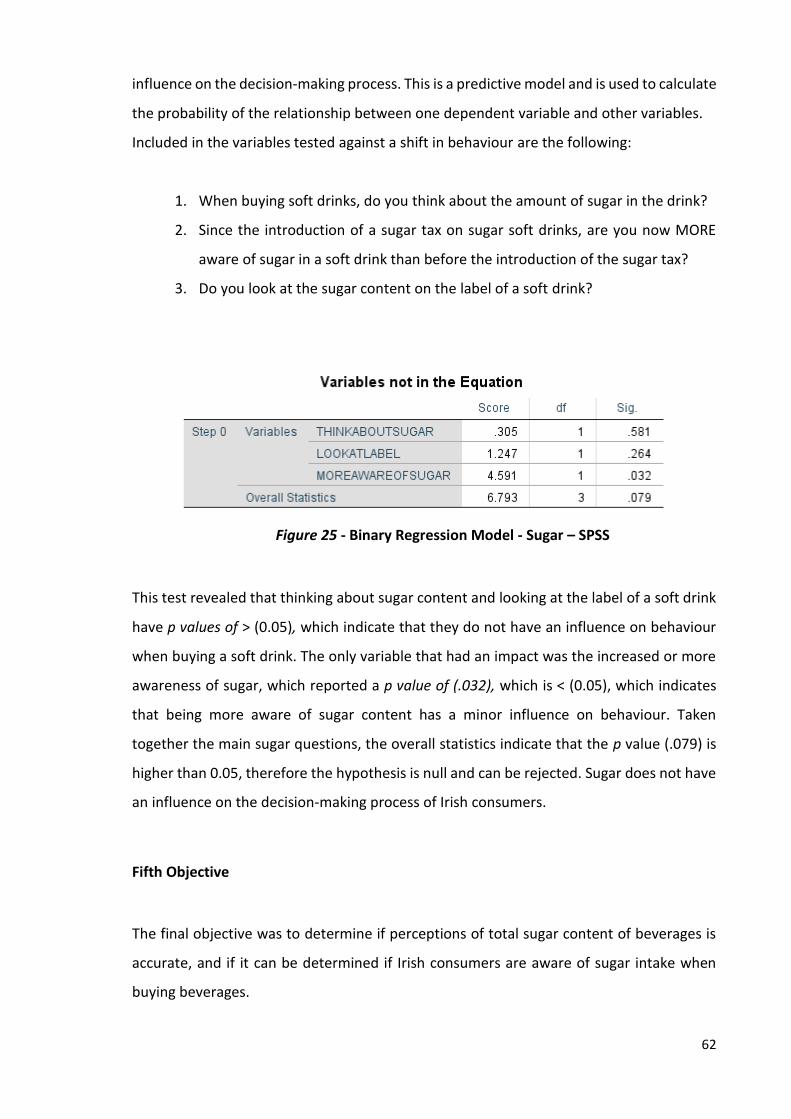
Figure 25 - Binary Regression Model - Sugar – SPSS .......................................................... 62
Figure 26 - Sugar content with beverages .......................................................................... 63
Figure 27 - Sugar Grading Chart .......................................................................................... 63
Figure 28 - Breakdown of total sugar perception .............................................................. 64
Figure 29 - Accuracy levels by respondents ....................................................................... 64
Figure 30 - Pepsi Max Advertisement ................................................................................ 65
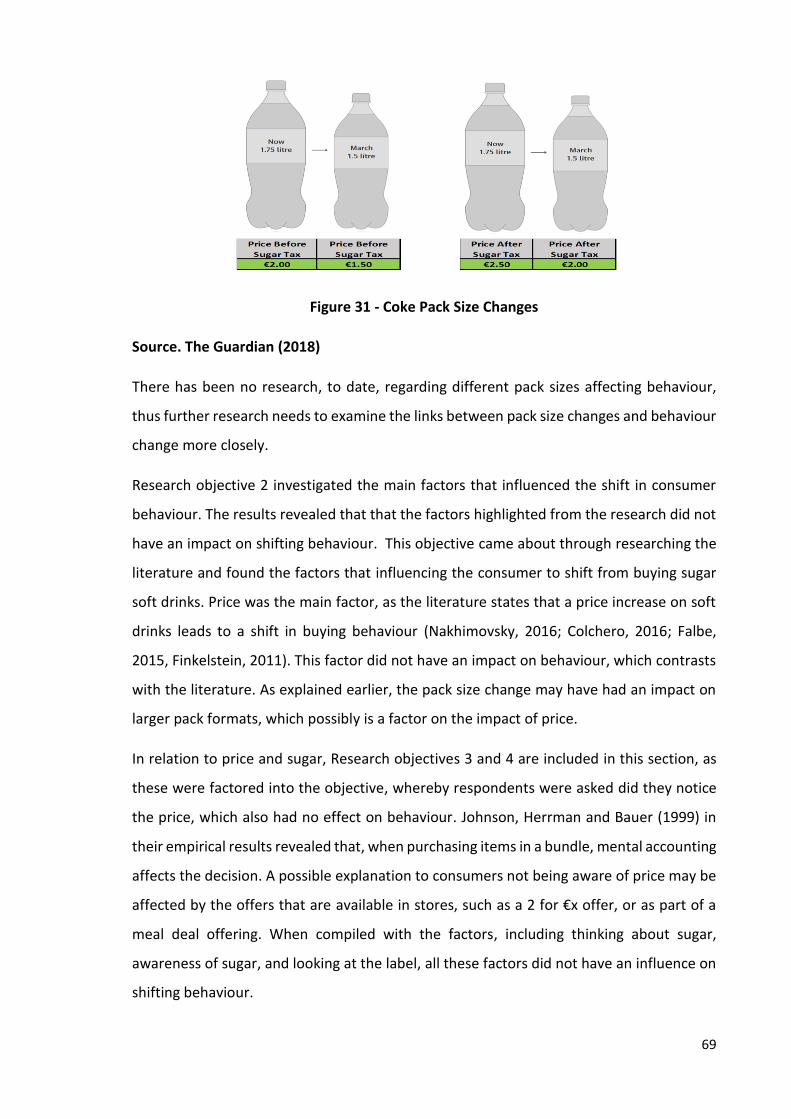
Figure 31 - Coke Pack Size Changes .................................................................................... 69
Page 10
ix
List of Appendices
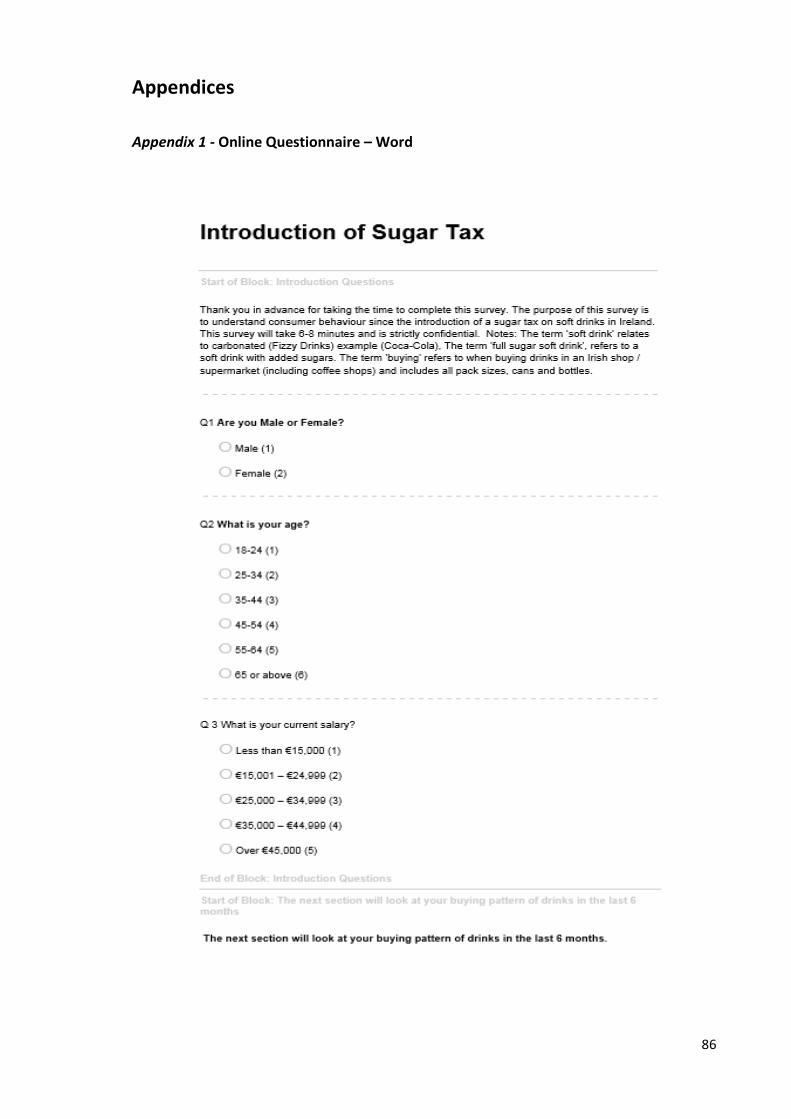
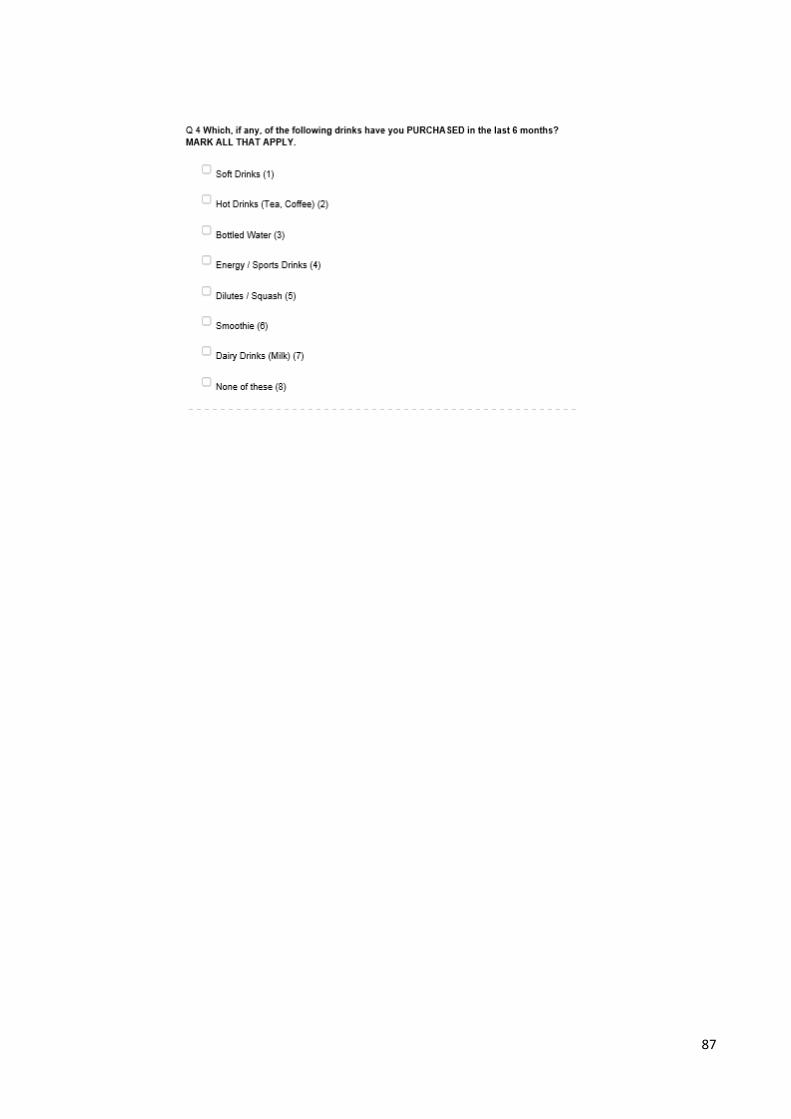
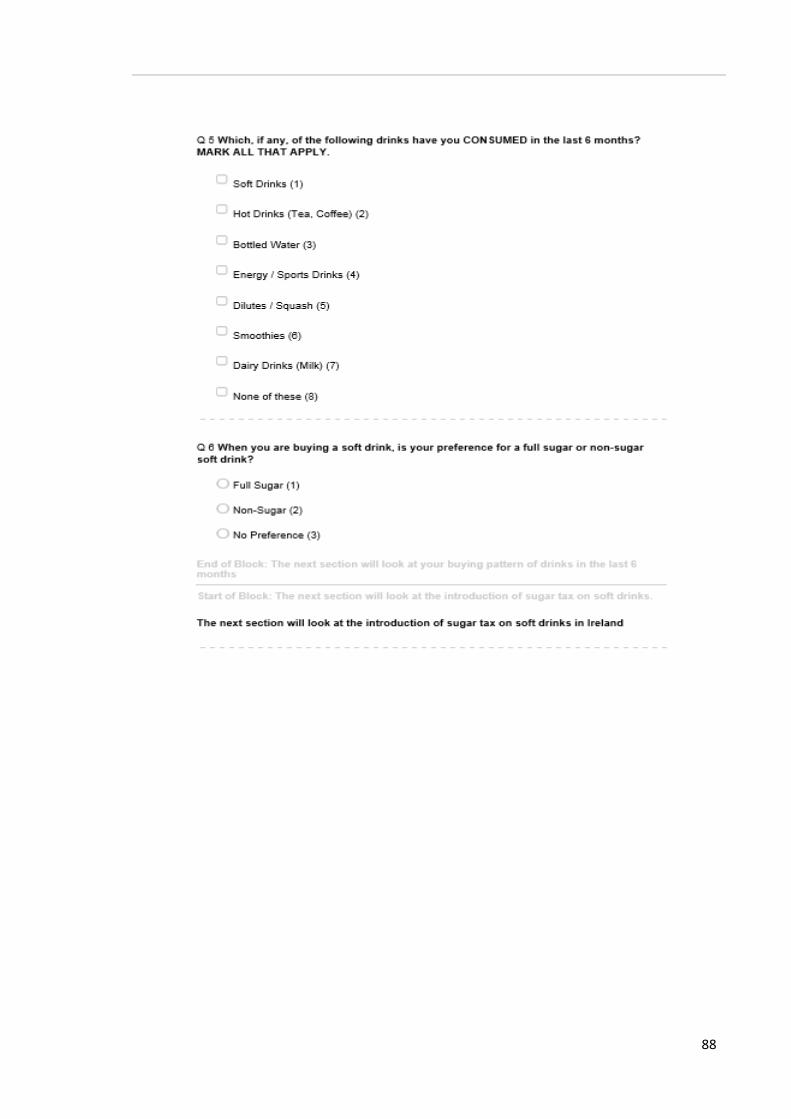
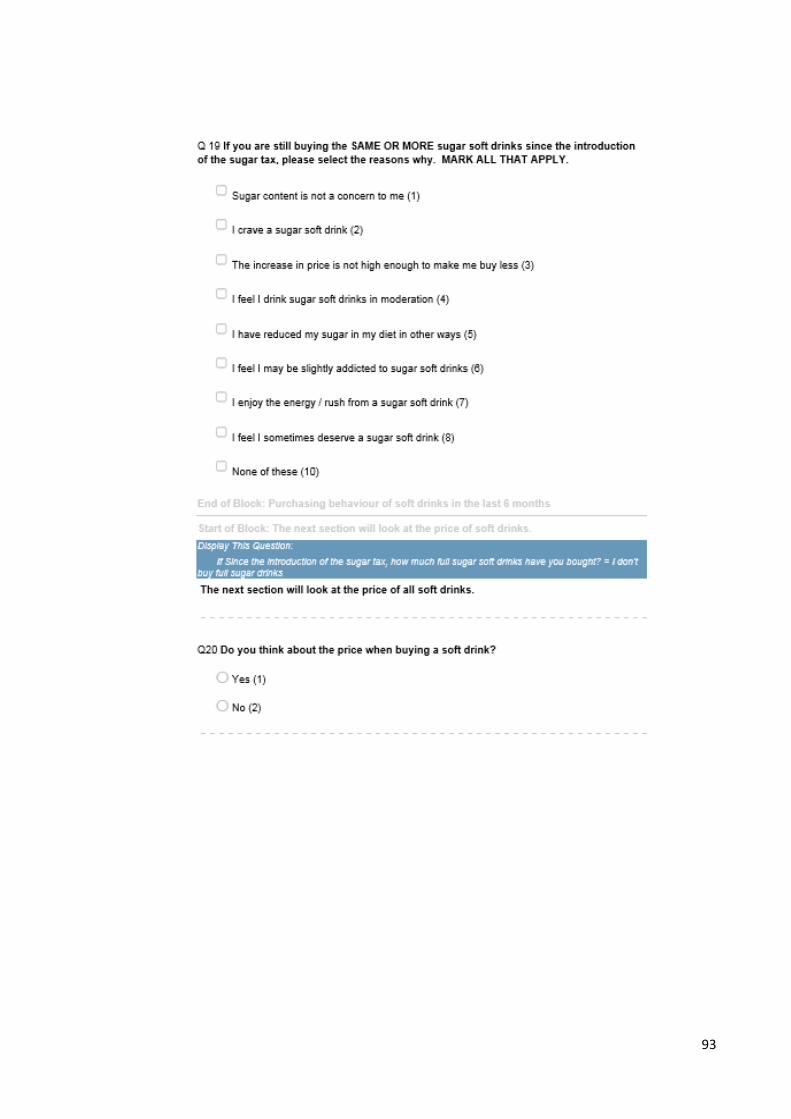
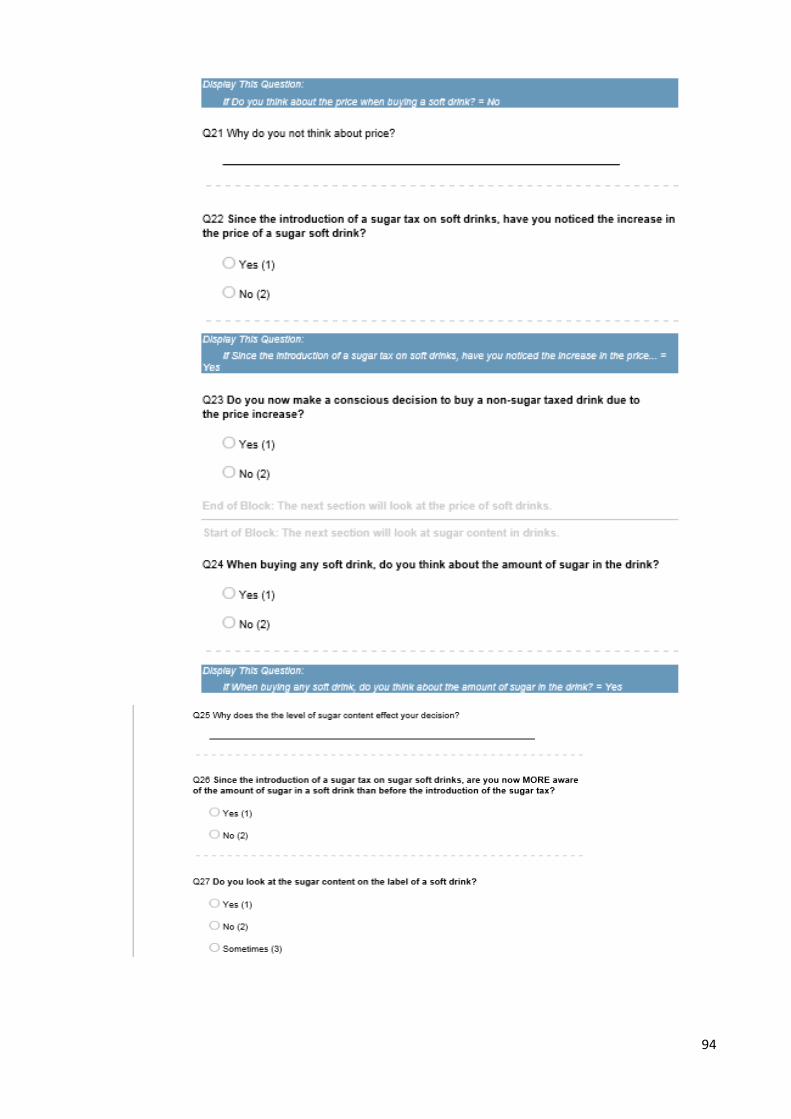
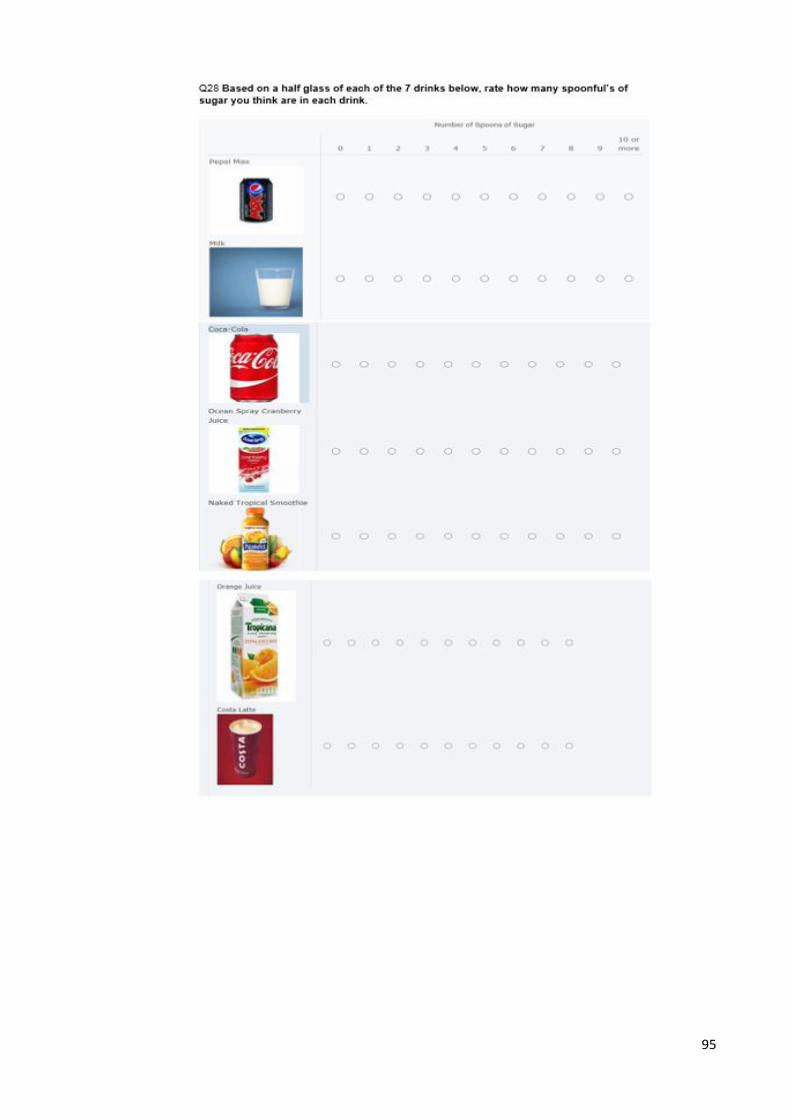
Appendix 1 - Online Questionnaire – Word ....................................................................... 86
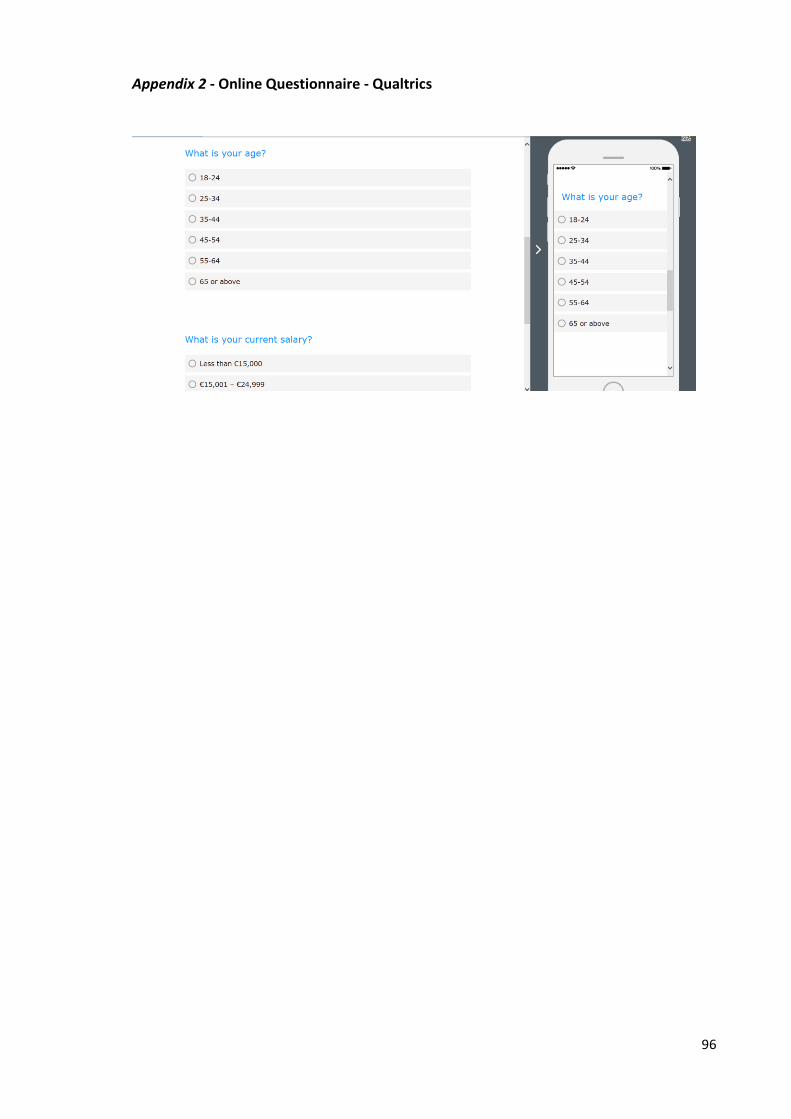
Appendix 2 - Online Questionnaire - Qualtrics .................................................................. 96
Page 11
x
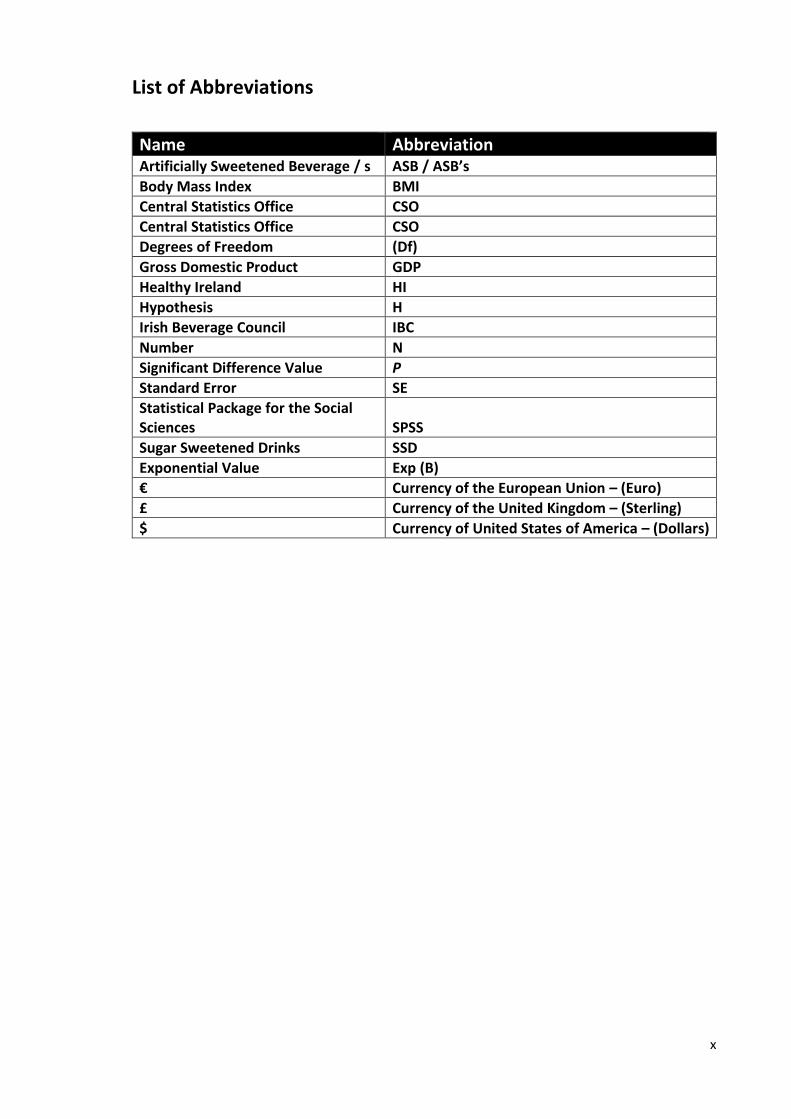
List of Abbreviations
Name Abbreviation Artificially Sweetened Beverage / s ASB / ASB’s
Body Mass Index BMI
Central Statistics Office CSO
Central Statistics Office CSO
Degrees of Freedom (Df)
Gross Domestic Product GDP
Healthy Ireland HI
Hypothesis H
Irish Beverage Council IBC
Number N
Significant Difference Value P
Standard Error SE
Statistical Package for the Social Sciences SPSS
Sugar Sweetened Drinks SSD
Exponential Value Exp (B)
€ Currency of the European Union – (Euro)
£ Currency of the United Kingdom – (Sterling)
$ Currency of United States of America – (Dollars)
Page 12
1
Introduction
In recent years, the study of worldwide obesity levels has significantly increased, leading to
claims that obesity and being overweight is now a worldwide epidemic. In addition, there
are more than 2.8 million people dying worldwide because of problems related to excess
weight (Mancini, Marotta, Nazzaro, Simonetti, 2015). A considerable amount of the
research has focused on the main causes of obesity and has resulted in the implementation
of effective interventions to control the crisis. However, Ireland as a nation has, so far, been
unsuccessful in its attempts to reduce rising obesity levels.
In 2005, the Irish Government identified obesity as a significant issue and developed a
strategy on obesity prevention. Outlined in the strategy were 93 recommendations to assist
in the prevention of obesity. However, in 2009, a review of its implementation found that
only 18 of the 93 recommendations were fully implemented (Dept. of Health, 2009), which
is strong evidence to suggest that it is a contributory factor that has led to Ireland becoming
a leading contributor to the obesity and overweight epidemic.
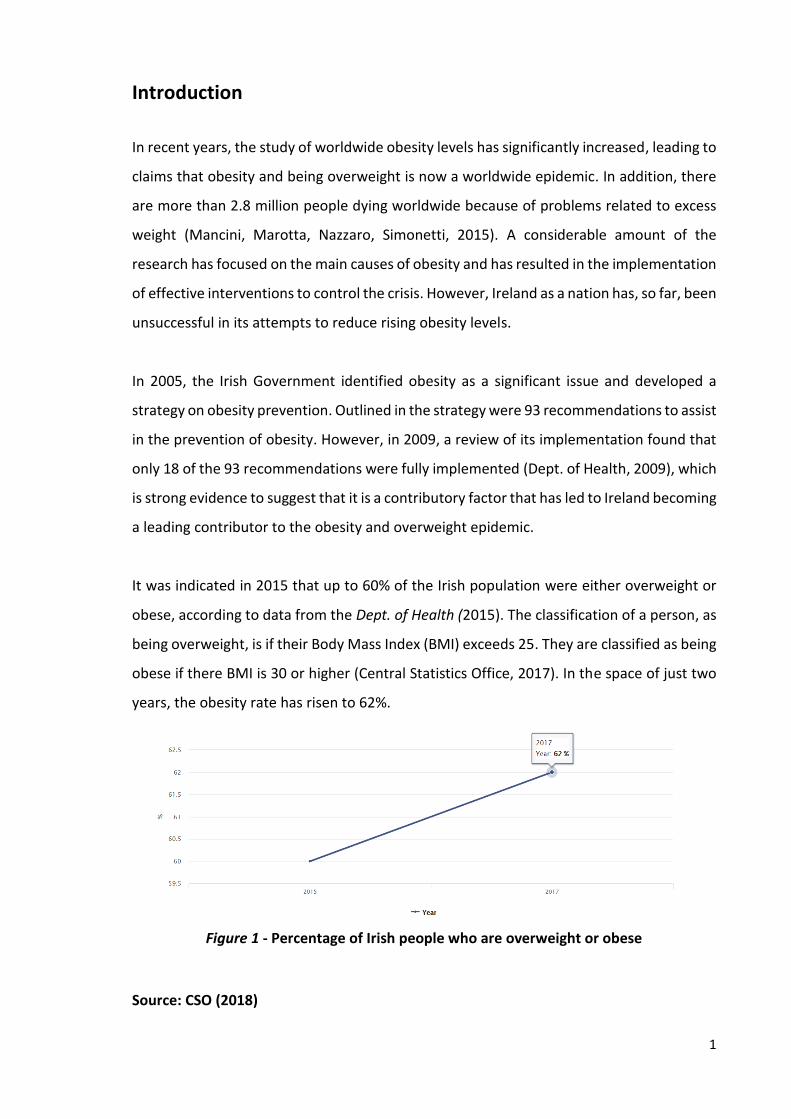
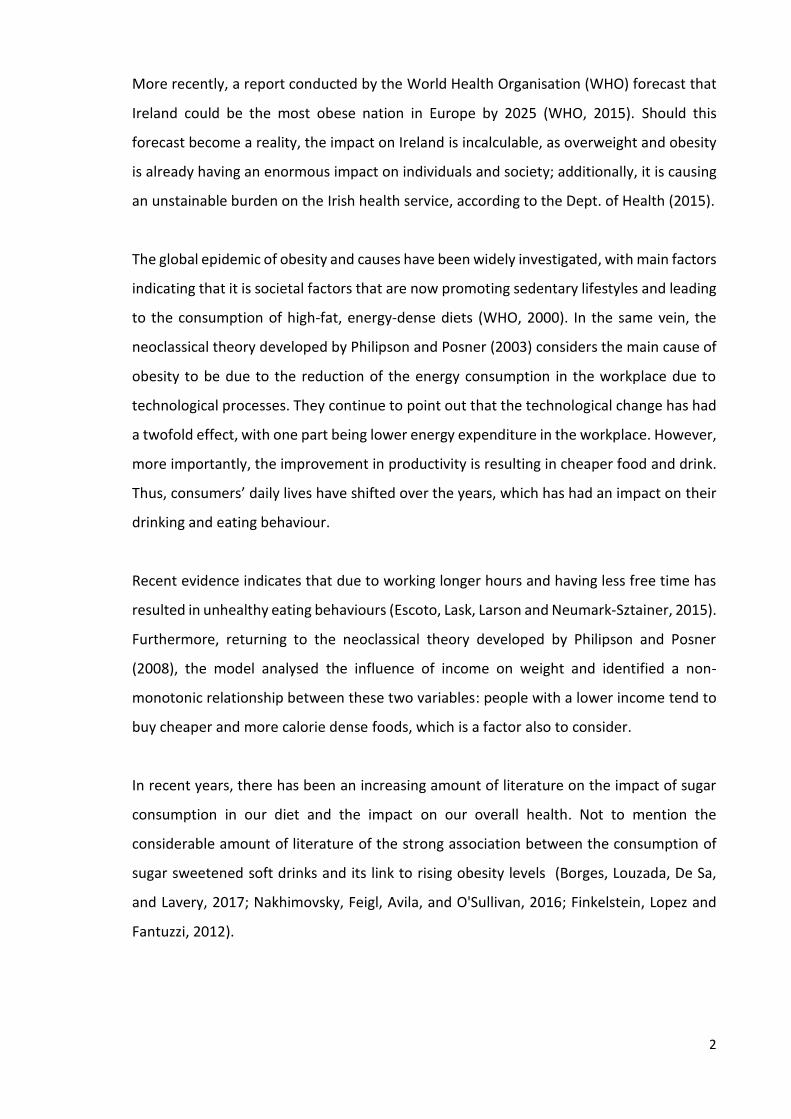
It was indicated in 2015 that up to 60% of the Irish population were either overweight or
obese, according to data from the Dept. of Health (2015). The classification of a person, as
being overweight, is if their Body Mass Index (BMI) exceeds 25. They are classified as being
obese if there BMI is 30 or higher (Central Statistics Office, 2017). In the space of just two
years, the obesity rate has risen to 62%.
Figure 1 - Percentage of Irish people who are overweight or obese
Source: CSO (2018)
Page 13
2
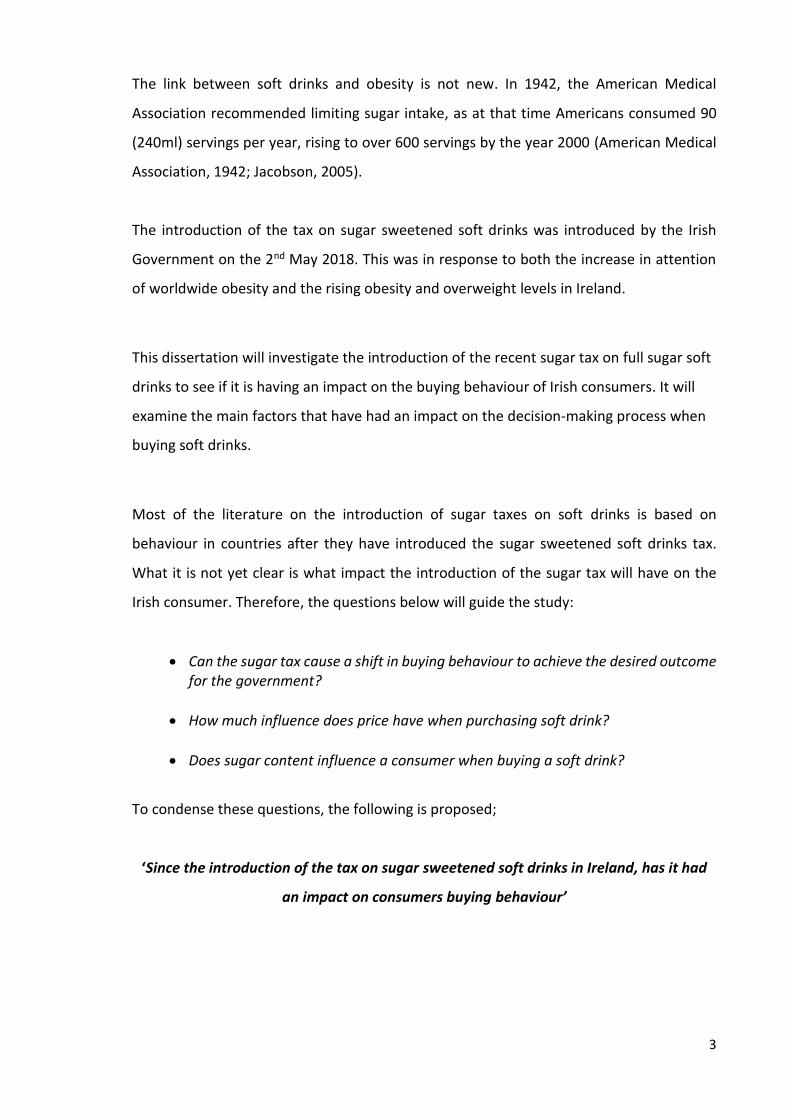
More recently, a report conducted by the World Health Organisation (WHO) forecast that
Ireland could be the most obese nation in Europe by 2025 (WHO, 2015). Should this
forecast become a reality, the impact on Ireland is incalculable, as overweight and obesity
is already having an enormous impact on individuals and society; additionally, it is causing
an unstainable burden on the Irish health service, according to the Dept. of Health (2015).
The global epidemic of obesity and causes have been widely investigated, with main factors
indicating that it is societal factors that are now promoting sedentary lifestyles and leading
to the consumption of high-fat, energy-dense diets (WHO, 2000). In the same vein, the
neoclassical theory developed by Philipson and Posner (2003) considers the main cause of
obesity to be due to the reduction of the energy consumption in the workplace due to
technological processes. They continue to point out that the technological change has had
a twofold effect, with one part being lower energy expenditure in the workplace. However,
more importantly, the improvement in productivity is resulting in cheaper food and drink.
Thus, consumers’ daily lives have shifted over the years, which has had an impact on their
drinking and eating behaviour.
Recent evidence indicates that due to working longer hours and having less free time has
resulted in unhealthy eating behaviours (Escoto, Lask, Larson and Neumark-Sztainer, 2015).
Furthermore, returning to the neoclassical theory developed by Philipson and Posner
(2008), the model analysed the influence of income on weight and identified a non-
monotonic relationship between these two variables: people with a lower income tend to
buy cheaper and more calorie dense foods, which is a factor also to consider.
In recent years, there has been an increasing amount of literature on the impact of sugar
consumption in our diet and the impact on our overall health. Not to mention the
considerable amount of literature of the strong association between the consumption of
sugar sweetened soft drinks and its link to rising obesity levels (Borges, Louzada, De Sa,
and Lavery, 2017; Nakhimovsky, Feigl, Avila, and O'Sullivan, 2016; Finkelstein, Lopez and
Fantuzzi, 2012).
Page 14
3
The link between soft drinks and obesity is not new. In 1942, the American Medical
Association recommended limiting sugar intake, as at that time Americans consumed 90
(240ml) servings per year, rising to over 600 servings by the year 2000 (American Medical
Association, 1942; Jacobson, 2005).
The introduction of the tax on sugar sweetened soft drinks was introduced by the Irish
Government on the 2nd May 2018. This was in response to both the increase in attention
of worldwide obesity and the rising obesity and overweight levels in Ireland.
This dissertation will investigate the introduction of the recent sugar tax on full sugar soft
drinks to see if it is having an impact on the buying behaviour of Irish consumers. It will
examine the main factors that have had an impact on the decision-making process when
buying soft drinks.
Most of the literature on the introduction of sugar taxes on soft drinks is based on
behaviour in countries after they have introduced the sugar sweetened soft drinks tax.
What it is not yet clear is what impact the introduction of the sugar tax will have on the
Irish consumer. Therefore, the questions below will guide the study:
Can the sugar tax cause a shift in buying behaviour to achieve the desired outcome for the government?
How much influence does price have when purchasing soft drink?
Does sugar content influence a consumer when buying a soft drink?
To condense these questions, the following is proposed;
‘Since the introduction of the tax on sugar sweetened soft drinks in Ireland, has it had
an impact on consumers buying behaviour’
Page 15
4
Returning to the Irish Government’s response to the obesity epidemic using established
international models and frameworks, the Irish Government in 2013 introduced a
framework titled ‘A framework for Improved health and wellbeing 2013-2025’, of which
part of the vision was ‘a healthy Ireland, where everyone can enjoy physical and mental
health and wellbeing’ (Dept. of Health, 2013).
As part of this framework, there was a clear indication that the rising levels of being
overweight and obese is having a detrimental effect on individuals and society and the
health service.
There are both direct and indirect economic consequences of obesity; direct costs include
all associated health care costs, while indirect costs include lower productivity and poor
performance due to absenteeism and presenteeism, social exclusion, premature morality,
disability, and even higher insurance premiums (Miljkovic, 2006).
According to the Dept. of Health (2013), obesity in Ireland is presenting a real clinical, social,
and financial challenge that would have a detrimental legacy that could last decades. Also
highlighted was the significant financial burden being put on the state, with an estimated
annual economic cost of €1.13 billion, which is a significant amount considering that the
total health expenditure in 2015 was €19.9 billion, which equates to a total of 7.8% of GDP
(CSO, 2015).
As part of this national framework, the Government highlighted its intent to introduce a
sugar tax on all sugar sweetened soft drinks as a method to shift consumer behaviour. This
was based on the basic principle that a price increase on a soft drink will cause a shift in
buying behaviour (Nakhimovsky, et al., 2016; Gustavsen and Rickertsen, 2011). This would
in fact result in Irish consumers buying and consuming heathier options, which would
reduce net energy intake through sugar and prevent further growth in obesity levels.
Total soft drinks production and consumption in Ireland is high. According to BordBia, the
Irish food board (2018), soft drinks in Ireland recorded a growth of 1% in 2016, with total
value sales of €1.4 billion. This equated to 169 litres of soft drinks per capita consumption
(Globaldata, 2018; CSO,2016), Using these figures and implementing this tax, the Irish
Page 16
5
Government has estimated the tax yield will be in the region of €40 million per annum
(Dept. of Finance, 2017).
The Irish Beverage Council (IBC) is a body that represents companies that produce,
distribute, and market beverages, including, soft drinks, fruit juices, bottle water, sports
and energy drinks throughout the island of Ireland. The council recognised the ‘growing
societal multifactorial challenge of obesity’ and stated that it was committed to playing its
part to reduce this obesity issue. However, they did indicate discontent with the
introduction of the tax and highlight that the tax is a discriminatory tax, as it ignores the
fact that only 3% of the nation’s total calorific intake is coming from sugar sweetened soft
drinks (Dept. of Finance, 2017), which when compared with the literature suggests that it
is closer to 7% (Drenkard, 2013). These results would seem to suggest that soft drink
consumption in Ireland is not a leading contributor to calorie intake, which calls into
question the introduction of the sugar tax.
As previously identified, the object of this thesis is to investigate what impact, if any, the
introduction of a tax on sugar sweetened soft drinks has had on consumer buying
behaviour. The study will first research recent and significant literature related to taxes on
soft drinks. This is based on countries that have introduced this tax already. It is not the
purpose of this study to investigate obesity levels in Ireland, or to investigate if there has
been a drop in BMI indicators on the Irish population. Nor will this study investigate the
attitudes towards the ‘sin tax’, taxation, individual consumption of soft drinks, or brand
loyalty.
Having researched the literature related to countries that have introduced the taxes, the
clear majority of the literature is based on sales data, post sugar tax implementation. Due
to the limitation that the sugar tax was only introduced in May 2018, this was not an option
for the research, as a more longitudinal approach would be needed. Therefore, a
quantitative approach was undertaken to investigate if buying behaviour has moved since
the introduction of the tax, to investigate what factors if any have influenced the shift, in
addition to understanding what role sugar content and price of soft drinks have on the Irish
consumer.
Page 17
6
Thesis Outline
This chapter identified the importance of the research topic, background information about
why the tax was introduced in Ireland and indicated what is set out in the research to
achieve answers to the objectives. The remaining chapters of the thesis are organised as
follows.
Chapter 2
Chapter two looks at the current obesity crisis, followed by a comprehensive literature
review. The key areas covered include: (1) The Obesity Crisis causes and impact, (2)
Measures to control obesity and overweight, (3) Substitution beverages, (4) Government
intervention, (5) Manufactures response, and (6) Gaps in current research. Also contained
is the description of the research aims and objectives that are to be investigated in the
study and the definition hypotheses used.
Chapter 3
Chapter three outlines the methodology and describes the research strategy and what
instrument was used. The chapter will also describe the research approach and justify its
use for the study.
Chapter 4
In chapter four, a comprehensive analysis of the collected data will be conducted, where
all findings will be clearly laid out relating to each research objective.
Chapter 5
Chapter six contains the results and analysis of the data, followed by analysis that will relate
back to the literature, it will also contain conclusions based on the findings. Also included
are limitations to the research and identifies areas where further research is required or
suggested.
Page 18
7
Literature Review
It is well documented that the world is facing an obesity epidemic (Conway, Han, Munro,
Gross, 2018; Taylor, Parento and Schmidt, 2015). This is underpinned by quantitative data
which highlights that world obesity has tripled since 1975 (WHO, 2015). To illustrate its
importance, in 2016, over 1.9 billion adults worldwide were overweight; included in this
figure is that over 41 million children under the age of 5 were overweight, indicating that
the obesity epidemic is far reaching and is affecting people of all ages (WHO, 2018). This
supports the view that a greater focus is required to control the rise in obesity levels
worldwide, especially as the World Health Organisation (WHO) states that obesity is
preventable (WHO, 2017).
Furthermore, according to Hawkes (2006), consumption of foods high in fats and
sweeteners is increasing throughout the developing world and the nutritional transition,
implicated in the rapid rise of obesity and diet-related chronic diseases worldwide, is
rooted in the processes of globalization. Similarly, others (Ezzati, Vanderhoorn, Lawes and
Leach, 2005) reported that the obesity epidemic is having an enormous impact on global
health trends, with health problems such as diabetes, which is now accounting for a greater
impact than on health than infectious diseases in developing countries. Although it is a
widely held view that industrialised countries have the highest obesity rates, the epidemic
is rapidly spreading to low and middle-income countries, with the increase of
‘Hyperpalatable foods’, which are laden with high levels of processed sugar and salt,
resulting in dramatic increases in obesity levels (Gearhardt, Grilo, Dileone and Bronell,
2011).
Governments worldwide have responded to the epidemic both by strengthening
traditional interventions and by developing novel legislative strategies. Some areas that
governments are tackling, and which have been identified by Taylor, Parento and Schmidt
(2015), include the following five areas:
Page 19
8
(1) Enhanced and tailored tax measures;
(2) Broadened use of counter-advertising and health campaigns;
(3) Expanded food labelling;
(4) Imposed greater restrictions on advertising and marketing to children;
(5) Strengthened restrictions, standards, and bans on specific foods and food
additives.
Despite these actions, Taylor et al. (2015) has called for a centralised publicly accessible
database of interventions and suggest there is a need for an international strategy to
overcome the global obesity crisis.
Demand for Taxation
Globally, there have been increased calls from the medical profession for governments to
introduce a tax on sugar sweetened drinks in order to control obesity, as these products
are viewed as a major contributory factor to obesity levels (Falbe and Madsen, 2017;
O’Dowd, 2015). With so much global attention on rising obesity levels and the introduction
of sugar taxes, it gave rise to the Irish medical profession calling for similar actions to be
introduced in Ireland (Briggs, Mytton, Madden, O'Shea, 2013).
One criticism with the literature is that the majority of the studies examining the effect of
a sugar tax have come from the United States, where consumption is far greater than
Ireland (Briggs et al., 2013). However, this interpretation contrasts with the expansive
evidence that shows that consumption of sugar sweetened beverages has a direct link to
obesity (Borges et al., 2017; Nakhimovsky et al., 2016; Finkelstein et al., 2013).
Indeed, recent reviews emphasise this inconsistency, citing the lack of multiple studies into
the effect of sugar intake and how increased levels of sugar intake are linked to increased
levels of diabetes, cancer, and micronutrient deficiencies (Hendriksen and Tijhuis, 2011),
accounting for approximately 184,000 related deaths per year worldwide (Singh, Micha,
Khatibzadeh and Lim, 2016). There are limitations to these studies, with the main
limitations centred on the failure of most of these studies to consider factors such as fitness
levels, the environment, overall diet, and peoples’ genetic makeup (Liu, 2018). More
Page 20
9
comprehensive studies of the impact of sugar intake on the human body are required,
nevertheless, there is a global obesity crisis, with more recent evidence indicating that
sugar is linked to obesity. To combat this crisis and shift human behaviours, it is important
that governments investigate all areas contributing to increased obesity levels. However,
with limited evidence on the economic impact of such a tax, it has been highlighted as one
of the major barriers for policy makers when implementing such a tax on unhealthy food
products (Sharma, Hauck, Hollingsworth and Sicilani, 2014).
It is interesting to note that where fiscal measures have been proposed as effective
strategies to influence behaviours, there is still limited ability to conclude that the
prospective effect of actual price changes have on actual changes in consumption, so price
changes may improve the diet, yet, this evidence lacks quantitative assessment of
effectiveness (Ashfin, Penalvo, Del Gobbo and Silva, 2017).
Addictive Nature of Sugar Sweetened Drinks
It is important to highlight and discuss the addictive nature of sugar sweetened drinks.
Much of the current literature on their addictive nature is due to the main ingredients,
which include caffeine and sugar, both of which have strong addictive qualities, with sugar
having a high glycaemic content, considered to be the key variable of the addictive attribute
(Wang, Rojas and Colantuoni, 2016). Extensive research suggests that consumers may in
fact be addicted to sugar in their diets (Westwater, Fletcher and Ziauddeen, 2016; Trivedi,
2010), while other researchers have gone a step further and have found that, in extreme
cases, sugar may be more addictive than cocaine (Gearhardt et al., 2011; Lenoir et al.,
2007). A growing body of research has identified that conventional addiction disorders and
excessive consumption of calorie-dense foods have major comparisons (Gearhardt et al.,
2011).
Several studies thus far have reported that sugar products exhibit reward-related natural
changes as identified with drug addiction, and despite the negative consequences, they
show that they have similar behavioural signs, such as issues with withdrawal, tolerance of
the product, and continuing to consume it (Avena, Rada and Hoebel, 2008). This evidence
suggests that government intervention is required to change behaviours in a society.
Page 21
10
Gearhardt et al. (2011) expands on this point by outlining that if people continue to ignore
the analogous neural and behavioural effects of foods and drugs abuse, it will result in
increased food-related disease and associated social and economic burdens.
These burdens are mainly attributed to the health service, with recent evidence from the
United States indicating that reducing sugar sweetened beverages by one fifth could
potentially reduce the country’s healthcare costs by $24 billion dollars (Falbe and Madsen,
2017). Much of the available literature implies there are significant benefits to the health
service with an introduction of a sugar tax (Veerman, 2016). In contrast, Cobiac, Tam,
Veerman and Blakely (2017) debate the full magnitude of the health gains. Equally,
implementing such a tax may be seen as a regressive tax, commonly known as a sin tax
(Briggs et al., 2013; Holmes Perkins, 2014; O’Donoghue and Rabin, 2006).
Taxation
The issue of a sugar tax has received considerable critical attention in the last 20 years, with
calls for the tax to be introduced as a sin tax. Sin taxes originated in medieval sumptuary
laws. A sumptuary law is any law designed to restrict excessive personal expenditures in
the interest of preventing extravagance and luxury. The term denotes regulations
restricting extravagance in food, drink, dress, and household equipment, usually on
religious or moral grounds. Such laws have proved difficult or impossible to enforce over
the long term (O’Donoghue and Rabin, 2006). These taxes have been justified as an attempt
to generate revenue for the government and curb the consumption of unhealthy or
undesirable products. Sin taxes are fast becoming a key instrument for governments to
increase their tax intakes, with the increase of making formerly benign activities more
“sinful” in order to make them taxable (Holmes and Perkins, 2014).
These taxes are used to raise revenue, as they rely on consumers that are addicted to the
product, whose inelastic demand is resistant to price increases (Hoffer, Shughart and
Thomas, 2017), with recent studies indicating that soft drinks have their own-price
elasticity (Colantuoni and Rojas, 2015). As Mattoon and Wetmore highlight, there are
other factors for a government to consider before implementing a sin tax, as revenue raised
by sin taxes tend to be unsustainable over time and will decline in the long run (Mattoon
and Wetmore, 2015).
Page 22
11
Furthermore, if a sin tax is set too high, it will be effective at discouraging unhealthy
consumption, but it will generate low levels of revenue; conversely, if the tax is set too low,
it will generate strong levels of revenue but will fail to have a significant impact on the
consumption of the sinful good (Liu, 2018). This is supported by research undertaken by
Colantuoni and Rojas (2015) in North America, which illustrates that current taxes on soft
drinks sales are too small and are failing to affect consumption in a sizeable manner.
There is significant discord that surrounds a sin tax and the ability of them to attain their
stated goals (Creighton, 2010). According to Hoffer et al. (2017), sin taxes violate the two
cornerstones principles of tax policy design:
(1) Horizontally, it violates tax equity as the sin tax liability only falls upon people who
buy the good or service.
(2) Vertically, it violates tax equity as the amount of the sin product or service paid by
a wealthier person is not any greater than the amount paid by a lower paid sinner.
Therefore, lawmakers need to be aware of the regressive nature and negative
consequences of implementing a sin tax on the public. In addition, implementing such a
‘corrective’ tax may have beneficial effects on weight and health (Basu et al., 2013).
However, it is difficult to justify a sugar sweetened beverage (SSB) tax using the classical
Pigouvian approach to taxation. A Pigouvian ( or “corrective”) tax hold the idea that placing
a small tax, equal to marginal social cost, on each unit of an activity to be discouraged,
prices rise, and as a result of rising prices, purchasing and consumption will decrease
(Fleischer, 2016; Holmes Perkins, 2014).
One major theoretical issue is that implementing such a tax in times of economic hardship,
appears to only serve to worsen the underlying economic situation (Creighton, 2010), and
they disproportionality impact low income households in society. These taxes reduce the
disposable income of the poor, leaving them with less money to spend on healthier items,
which in turn makes it difficult to prioritise their long-term health (Morse, 2009).
Page 23
12
It is important to consider that, if a government proposes to increase tax revenues from
such a sin tax, then the government must consider sin taxes can also incentivise tax
avoidance, either illegally though the enhancement of the black-market economy or legally
through cross-border purchases (Liu, 2018).
Contained in the literature is general conclusion that the demand for soft drinks is inelastic.
Colantuoni and Rojas (2015) conclude with the statement that their research casts some
doubt whether price elasticities should be used to form counterfactuals for how consumers
might react to price increases.
While Colchero and Guerrero-Lopez, Molina and Rivera, (2016) used a different approach
in their study of beverages sales in Mexico before and after implementation of a sugar
sweetened beverage tax, using sales data from the monthly surveys of the manufacturing
industry, through an estimation of ordinary least squares models to access changes in per
capita sales of SSBs, while also adjusting for seasonality and interestingly incorporated the
global indicator of economic activity. Their research found that a tax on sugar sweetened
soft drinks was associated with a reduction per capita sale of SSBs. However, they issued
caution as to the effectiveness of the tax, and that it should be evaluated in the medium
and long term.
Prior to this research, Gustavsen and Rickersten (2011) used a quantile regression
approach, which involved using a data set that included observations, and distribution of
annual per capita purchases of sweetened soft drinks of Norwegian households. Quantiles
are points on a cumulative distribution function of a random variable. Prior to the research
taking place, back in 2006, Norway held the position of the third highest per capita
consumer of carbonated soft drinks. It was found that light and moderate drinkers will
reduce their consumption, but it was uncertain whether heavy drinkers would change
consumption in relation to soft drinks.
Theoretically, the only reason for imposing a special tax on a product is on the basis that
the product creates what economists call a negative externality. Proponents of taxes on
SSBs, claim that obese people create a negative externality due to their lower levels of
Page 24
13
general health and related conditions attributed to their health condition, therefore,
proponents claim that taxpayers and insurance holders pay for the actions of obese people
due to the increased cost to the health system (Andreyeva, Chaloupka and Brownell, 2011).
There are limitations to these findings, as they don’t consider how much sugar is directly
attributed to the healthcare problem. What follows is an outline of alternative measures
to be considered in place of a sin tax.
Alternatives to a Sin Tax
Outright Ban
Outright bans of the sinful good or service is a method that can be adopted by the
government to have an impact on an underlying ‘sin’ product. Although this is an extreme
measure, according to Liu (2018) it has been introduced successfully in the past, most
notably in North America during the prohibition of alcohol. The prohibition of alcohol in
North America decimated a full industry as from 1916 to 1926 over 1300 beer breweries,
and over 85% of alcohol distilleries, closed, resulting in federal tax revenues dropping form
$365 million to less than $13 million (Shrestha and Markowitz, 2016). It is important to
highlight that it did have an impact on the health of the nation, resulting in a decline in
alcohol related deaths; post prohibition, alcohol consumption was far lower per capita,
with consumption levels not rising to pre prohibition days until the 1970s (Blocker, 2006).
This option would not be suitable for the Irish Government on many levels, as firstly, it
would impinge on the public’s right to free choice and, secondly, it would have a negative
economic impact due to the large number of people employed directly or indirectly within
the soft drinks industry. And much more indirectly, if an outright ban was introduced, it
would have a significant negative impact on the Irish economy.
Improved labelling of Sinful Goods
There have been calls for manufacturers of soft drinks to feature health warning levels
directly on products. Falbe and Madsen (2017) discuss a campaign named ‘live sugarfeed’,
which was a multiplatform media campaign to discourage consumption of sugar
sweetened beverages. This campaign had similarities to previous anti-smoking campaigns,
Page 25
14
and targeted rural, low-income regions of the United States. The results indicated there
was a decline of sugar sweetened beverages sales of 3.4% over a 15-week period. This
method of influencing a sinful good may be perceived as less Pigouvian, as it is the direct
consumer who makes the decision, therefore, not all consumers are penalised.
Consumer Behaviour
When considering consumer behaviour in relation to buying or the consumption of sugar
sweetened soft drinks, it is important to consider how behaviour affects the decision-
making process. Ajzen’s (1991) Theory of Planned Behaviour (TPB) is an individual level
health behaviour theory that has been used to understand behaviour around sugar
sweetened drinks consumption (Zoellner, Krzeski, Harden and Cook, 2012). The (TPB)
states that a person’s behaviour can be predicted by intention and perceptions of
behavioural control; also, indirectly influencing behaviour can include subjective norms,
attitude, and perceived behavioural control. In an investigation to understand soft drink
consumption using the Theory of Planned Behaviour, Kassem, Lee, Modeste, and Johnston
(2003) found that intention to drink soft drinks is influenced by the attitudes, subjective
norm, and behavioural control. This research supports other studies that used the theory
to research consumer behaviour in adults (Godin and Kok, 1996). There are limitations to
the theory, as it does not consider the time frame between “intent” and “behavioural
action”, which must be considered in relation to soft drinks, as these are sometimes viewed
as an impulse purchase.
Furthermore, it is important to consider the “law of demand” as one of the most applied
theories used by economists to predict consumer behaviour. It measures consumers’
sensitivity to price, which is commonly referred to as the “price elasticity of demand” and
indicates the proportional change in demand, given a change in price. Therefore, increasing
the price of unhealthy soft drinks by taxation will reduce consumption of the taxed product
and the behaviour of the broad population level (Powell, Chriqui, Khan, and Wada, 2013).
Therefore, the higher the tax on an item, the less appealing it becomes to consumers
(Creighton, 2010).
Page 26
15
Extensive research has demonstrated that in relation to smoking and drinking, higher taxes
prevents and promotes cessation among current users, reducing frequency and intensity
of consumption among continuing users, and deterring relapse among former users
(Andreyeva et al., 2011). In contrast, Besley and Rosen (1999) estimate that an increase in
soft drinks tax rates leads to an increase in the price of soft drinks and suggest that this is
“over shifting” of the tax burned is the result of imperfect competition in the soft drinks
industry.
However, consumers are now more brand loyal, and such an increase in taxation may not
deter consumers from purchasing the same product. To support this theory, Degeratu,
Rangaswamy and Wu (2000) found that consumer choice of soft drinks is driven by both
product and consumer characteristics. Furthermore, Pulligadda, Kardes and Cronley (2016)
conducted extensive research from previous studies on consumer purchasing behaviour
and their findings clearly show that consumers are willing to pay a higher price, as they are
loyal to their chosen brands.
Supporting this, Allender and Richards (2012) further show that less loyal brands are
promoted more frequently than stronger brands, and this demonstrates that loyal
consumers are willing to pay a higher price for a particular branded product. As highlighted
earlier, given imperfect market competition, the theory postulates that taxes can lead to
price increases, but the extent to which prices increase relative to the tax rate (“pass
through rate”) depends on factors such as consumers’ responsiveness to price change;
however, this may vary in different socio-economic settings (Nakhimovsky et al., 2016;
Afshin et al., 2017).
In direct contrast to these findings, research findings using systematic scoping of evidence
of specific interventions to behaviour change, Shemilt, Hollands and Marteau (2013) found
largely equivocal evidence to suggest that the public health case for using economic
instruments to promote behaviour change may be less compelling than proponents have
claimed.
Page 27
16
Substitutes
With any increase in price, it is important to understand the substitution effect on
consumers’ buying patterns, with overwhelming evidence indicating that, with subtle cues,
consumers’ consumption behaviour can be influenced (Finkelstein, Zhen, Bilger, and
Nonnemaker, 2013). Subtle cues may have an impact on sugar intake as taxes do reduce
consumption, but consumers tend to perfectly substitute soft drinks consumption for other
high calorie sources (Drenkard, 2013). This is further evidenced by Cobiac et al. (2017)
indicating there are less conclusive results related to the consumption of substitutes.
There is econometric evidence to suggest that increasing soft drinks taxes will cause
substitutions toward other non-taxed goods (Runge and Johnson, 2011). Equally, Couch
(2001) found that any health gains from large taxes on soft drinks would be largely offset
by increased calories from other beverages, such as pure juice or milk. For example, there
is evidence to show that taxes on soft drinks lead some people to increase their
consumption levels of beer, which in most instances are more calorific (Drenkard, 2013).
Through a quasi-experimental study, Nakhimovsky et al. (2016) found that milk was in fact
a complement and conflicts with another report that does not detect a relationship
between milk and sugar sweetened drinks. They argue that on a 1-for-1 substitution of milk
for soft drinks, when reviewing this on a per volume basis, the same substitution
consumption levels are unlikely, leading to the view that there would be no nutritional
benefit.
To address the increasing levels of obesity, an increasing number of countries are
implementing a dual initiative, which includes taxes on unhealthy foods and drinks while
simultaneously introducing a subsidy on healthier items such as fruit and vegetables.
Where this has taken place, results indicate that only the sugar tax led to improvements.
The subsidy on fruit and vegetables did not largely increase consumption levels. Due to
these findings, Cobiac et al. (2017) does not recommend a fruit and vegetable subsidy as
an intervention, as results suggest that it may lead to increased costs and no net health
benefit for the population. Conversely, recent studies undertaken by Afshin et al. (2017)
show that a 10% decrease in the price of fruit has an impact on lowering adiposity.
Page 28
17
A subsidy on bottled water may be a better approach, as this is a more comparable healthy
substitution for fruit and vegetable, but there are still significant research gaps in relation
to complementary items for sugar sweetened beverages, for example, fast food is a high
calorie attribute. Nakhimovsky et al. (2016) suggest a more accurate approach could be
based on estimating the potential unintended consequences of substituting sugar beverage
with alcohol and applying longitudinal data and quasi-experimental designs to trace the
effects of this substitute on people’s health over a designated period.
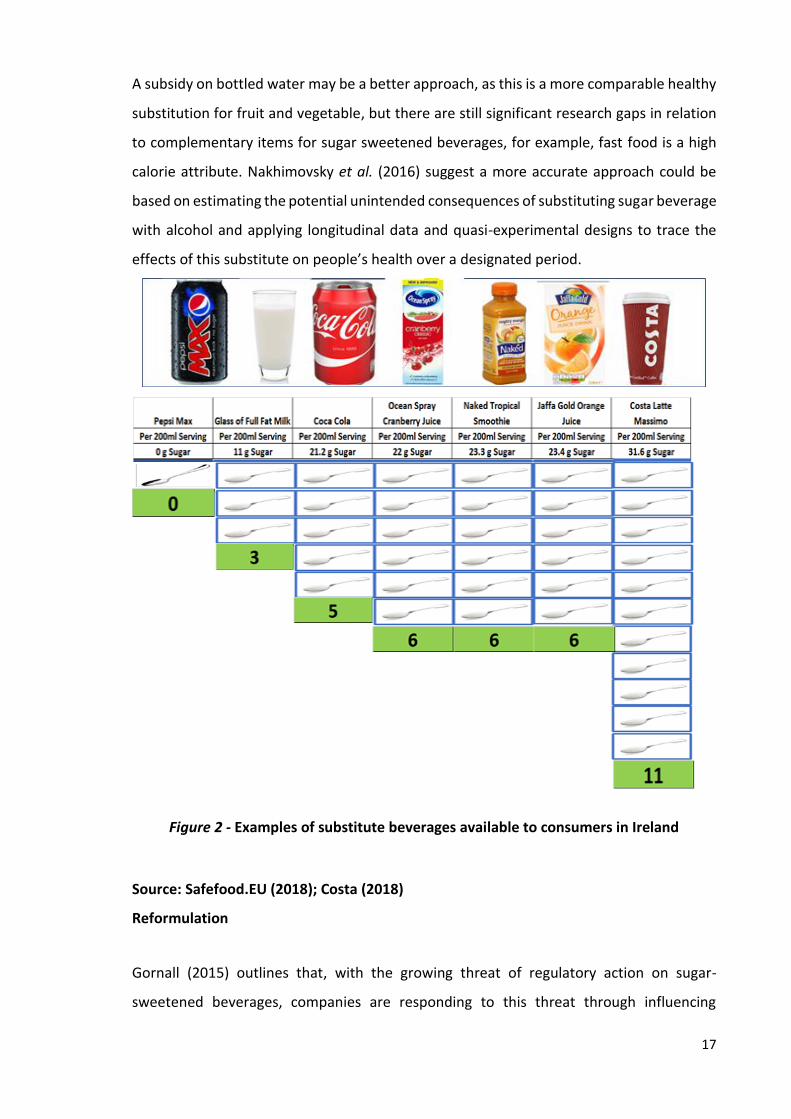
Figure 2 - Examples of substitute beverages available to consumers in Ireland
Source: Safefood.EU (2018); Costa (2018)
Reformulation
Gornall (2015) outlines that, with the growing threat of regulatory action on sugar-
sweetened beverages, companies are responding to this threat through influencing
Page 29
18
scientific research and equally the reformulation of products which will avoid any sugar tax
(Borges et al., 2017), while Cobiac et al. (2017) indicate that this should be a positive
development in relation to the health prospective as they pose less risk to health versus
sugar drinks.
For example, companies have increased the range of artificially sweetened beverages
(ASB’s), and these have replaced the traditional high sugar content artificial sweeteners
that contain little or no sugar (Borges et al., 2017; Hendriksen and Tijhuis, 2011). These
beverages have emerged as an important alternative to maintain sales and revenue for
large soft drinks organisations, with artificially sweetened drinks now accounting for 25%
of the soft drink market globally (Borges et al., 2017).
Scientists are divided in their views on the issue of artificial sweetener safety, with a large
number of studies concluding that ASBs are “safe under all conditions” to “unsafe” at any
dose (Tandel, 2011). Recent evidence suggests that substituting sugar sweetened
beverages with non-nutritive sweeteners, not only fails to prevent disease, but is
associated with an increased risk for some health outcomes associated with sugar-
sweetened beverages (Swithers, 2016). The major artificial sweetener used in soft drinks is
called Aspartame, and this has links to health effects such as cancer and epilepsy. However,
as part of their findings into the health effects of artificial sweeteners, Hendriksen and
Tijhuis (2011) concluded that there is insufficient evidence to this link. Furthermore, they
call for more detailed research into the benzoic acid content of drinks, which may have an
impact on health. More research on this topic needs to be undertaken before conclusive
findings can be provided linking ASB’s to negative impacts on people’s health. Until this
point in time, there does not appear to be sufficient evidence for a similar sugar related tax
to be introduced on products that contain ASB’s.
Government Intervention
As indicated by O’Donoghue and Rabin (2006), intervention may be used to correct self-
control problems, but they argue that such paternalistic policies may help people who
make normally short-term errors (i.e. consume more that they plan), while having little
effect on those who are fully rational. As highlighted earlier, consumers do not always
Page 30
19
comprehend information in relation to products that are harmful to them. The recognition
of tobacco as a health hazard and the effectiveness of tobacco control policies and
programmes to reduce tobacco use is rated as one of the top 10 achievements in public
health during the 20th century (CDC, 1999). Supporting this, Cobiac et al. (2017) calls for a
legally binding global convention around diet, like the World Health Organizations
Framework Convention on Tobacco Control; implementing this can help to support and
protect government rights to implement taxes and regularity measures to improve public
health.
An introduction of a sugar sweetened beverage tax will raise considerable revenue for
governments (Fletcher et al., 2010; Creighton, 2010). However, leading economists have
called into question the very justification for such a tax, as they only serve to stifle individual
choice and free enterprise (Creighton, 2010).
Drenkard (2013) argues that such policies are a blanket policy that would affect all
consumers, and that many people enjoy soft drinks and make their own adjustments in
their diet elsewhere to maintain a healthy lifestyle. It is not surprising that research has
found that this tax is viewed as regressive (Finkelstein et al., 2013; Fletcher et al., 2010), as
lower income households spend a larger share of their food budget on sugar sweetened
beverages (Fessenden, 2016; Drenkard, 2013; Creighton, 2010). Furthermore, lower
income households spend a larger percentage of their income to absorb the introduction
of a tax, compared to their wealthier counterparts. Where in contrast to income tax, which
incorporates progressive features that correlate with income level and the ability to pay, a
sin tax simply lacks this element in its formation (Hoffer et al., 2017). In contrast, a citizens
jury in Australia favoured taxation for sugar sweetened beverages (Cobiac et al., 2017). This
may support the perspective that sugar sweetened taxes are more effective in developed
countries, as the evidence shows that consumers are more responsive to price changes
than in developing countries (Nakhimovsky et al., 2016). However, findings from Denmark
indicate that support for new commodity taxes are low, and high public or political support
is likely to be required for taxes to be initiated (Wright, Smith and Hellowell, 2017).
Whereas Liu (2018) further supports the view that public opinion may be changing, with
respect to acceptance of non-traditional sin taxes.
Page 31
20
Creighton (2010) points out that the ability to tax should not be used as a mechanism for
government to bring about social change in society, and government is not justified in
excessively taxing individual choices, such as what to eat, simply because it disapproves of
the activity. Nakhimovsky et al. (2016) challenges that more empirical research and
monitoring of industry is required to effectively respond to health-related taxes on SSB’s,
as these are required to help policy makers ensure that the increase in prices are sufficient
to reduce population obesity outcomes. However, Liu (2018) discusses ways in which
governments may improve consumer access to healthier substitutes by using incentives to
increase purchases of healthier products.
Manufacturers’ Response
The soft drinks industry does not welcome polices that steer consumption away from
profitable product, particularly with the growing threat of regulatory action on SSBs (Cobiac
et al., 2017). Companies and corporations are responding in various ways, including
promoting sports and physical activity events and adopting social responsibly strategies.
According to the Irish Beverage Council (2017), its members, through reformulation of
products and innovation of product with less or no sugar and fewer or no calories have
removed 10 billion calories from the Irish national diet from 2005 to 2012. Coca Cola, one
of the largest producers of soft drinks in the world, has provided financial support to
scientists to promote the argument that weight conscious Americans are overly fixated on
how much they eat and drink while not paying enough attention to exercise (Connor, 2015).
Furthermore, these large firms are using financial power to promote information that
distracts and confuses the public and also to lobby politicians (Cobiac et al., 2017; Briggs et
al., 2013). Finkelstein et al. (2013) cites that advertising for high processed foods makes up
the second largest share of all advertising revenue in the USA. This has led to calls from
proponents of a sugar tax to also encompass a restriction of marketing for SSBs (Andreyeva
et al., 2011).
Page 32
21
Health Benefits
There is significant evidence that shows that a reduction in sugar intake leads to lower
obesity levels. Drenkard (2013) and Gustavsen and Rickertsen (2011) both agree that high
consumption of sugar-sweetened drinks will result in adverse health problems. Their
results suggest that light and moderate consumers of soft drinks are more responsive to
price than heavy drinkers, and indicate that with heavy drinkers of SSBs, the predicted
health benefit effect among heavy drinkers is larger but uncertain; this can only be
determined if reduced purchases are replaced by increased intakes of water.
Conversely, Fletcher (2010) highlights that reducing soft drink consumption may lead to
improvements in other areas of health such as dental health. Cobiac et al. (2017) also
emphasise how there are differences in the magnitude of health gains coming from sugar
taxes. However, there is an inconsistency with this argument, as Hendriksen and Tijhuis
(2011) found there is insufficient evidence that sugar sweetened beverages may contribute
to a high glycaemic load, which is a factor in pancreatic cancer. However, the results from
epidemiological studies are inconsistent and the study also found that there is a limited
number of epidemiological studies to show the intake of sugar sweetened drinks is
associated with the development of type 2 diabetes. The study also found that behavioural
problems from sugar intake are also insufficient. Nevertheless, the study did report that
through several trials and longitudinal studies, reducing sugar intake has a positive effect
on reducing dental caries. Andreyeva et al. (2011) supports this view with the case that the
impact of SSB taxes on weight outcomes are not clear and that existing research finds little
or no impact of existing taxes having an impact on a person’s body mass index or obesity.
According to Fletcher et al. (2010), soft drink consumption is the single largest contributor
of energy intake in the North America United States, with varied claims as to how much
this contributes to the total percentage of calories consumed, with highs of 15% and as low
of 7% being reported (Creighton, 2010). In contrast, obesity and overweight rates are far
higher in North America, compared to other countries (Nakhimovsky et al., 2016).
The reality of these taxes is that even if revenue is funnelled into the health care industry,
to mitigate the costs of poor health, the taxes fail to support the types and broad changes
Page 33
22
they seek and how there are differences in the magnitude of health gains coming from
sugar taxes (Cobiac et al., 2017).
Creighton (2010) highlights that for a tax scheme to be successful and generate enough
revenue to fund the health care plans the government desires, the rate would need to be
so high that it would prevent most consumers from affording the desired items. Powell
(2013) supports the view that there should be an offer of help to quit, as used to change
attitudes to smoking.
From the literature review, which has provided insights from studies, analyses,
investigation, and debates, there are mixed views as to the impact and influence of such a
tax. With the lack of literature underpinning any longitudinal research undertaken, the full
impact of such a tax is still uncertain.
Current Gaps in Research
The scope of the study will encompass the current gaps in research related to the
introduction of tax on sugar sweetened drinks in Ireland but include countries that have
implemented a form of sugar tax. As noted, there are significant gaps in the research as to
the nature and extent of substitutions with other beverages (Zheng, Allman-Farinelli,
Heitmann and Rangan, 2015; Manyema et al., 2014; Briggs et al., 2013).
For example, a 200ml serving of full sugar cola contains approximately 21.2 g of sugar
(equivalent to 5 spoonful’s of sugar (SafeFood, 2018), while substitutes such as fruit juices
(which are sugar sweetened drink (SSD) tax exempt) are perceived by consumers as
healthier options (Salois and Reilly, 2014; Labrecque and Charlebois, 2011). But, in fact, a
200ml serving of a high juice content substitute can contain approximately 23.4g of sugar
(equivalent to 6 spoonsful of sugar) (SafeFood, 2018), whilst another substitute such as
coffee, can contain approximately 36.6g of sugar per 200ml serving (Costa, 2018). The
author has identified a significant gap in the research in relation to product reformulation
by soft drink manufactures in advance of a SSD tax being introduced.
Page 34
23
Existing obesity related surveillance systems are incomplete and poorly integrated in
response to environmental influences which impacts on diets, activity, and weight ability
(Andreyeva et al., 2011). Although studies have indicated that introducing a tax on sugar
sweetened drinks does have an impact on reducing sugar intake and in turn reducing
weight, the studies fail to take into account the reduction in physical exercise and the
impacts of technology (Gustavsen and Rickertsen, 2011; Fletcher, 2010; Jacobson and
Brownell, 2000).
Other gaps within the research include the lack of substantial data collected in relation to
consumer behaviour. Most studies reported sales data as a tool for analysis but fail to
acknowledge that consumers may not always consume all beverages sold (Afshin, et al.,
2017). Additional factors highlight that some studies did not adjust for variables that will
have an impact on soft drinks sales, such as the temperature in countries during the data
collection, which would skew people’s purchasing behaviour.
Another weakness with the literature is the failure to analyse the impact that advertising
and promotion may have on consumption of beverages. One of the major concepts of
marketing is the influence of price and promotion, and as part of most studies undertaken,
there was a failure to investigate if the soft drinks companies increase advertising spending
for campaigns and if there was an increase regarding price promotions to drive more
purchases. There is also a significant gap in relation to substitutes that lower the price of
less energy-dense healthier beverages such as water. It is possible that drink manufacturers
and or retailers increase their marketing activity and increase investment with regards to
promotions in the time frame around new taxation by governments, leading to a significant
gap in research in this area.
The final gap relates to consumers and their perceptions when it comes to considering the
sugar content of beverages to make an informed decision, especially if this decision relates
to choosing a beverage to improve overall health or reduce sugar intake. There is little
research into this area, with most research relating to either shifting consumption of SSDs
to ASBs or, in some cases, switching to beer (Drenkard, 2013).
Page 35
24
Conclusion
There is a clear link between sugar intake and soft drink consumption, which in turn results
in a high calorie intake. Taking this into account, this can result in people becoming
overweight or obese. It is also clear that the world has an obesity epidemic and strong
action is required to solve this crisis, where Governments have failed in the past to
introduce steps to shift behaviour sooner, as indicated earlier with prohibition and taxes
on cigarettes. Governments are now taking punitive measures to ensure better health and
welfare, and the rising costs mounting on healthcare services.
The next section will discuss the research questions and objectives that have been set out
based on the on the literature review.
Page 36
25
Research Objectives and Hypotheses
From the review of the literature, the main research question and objectives have been
identified.
Overall Research Objective
Will the introduction of a sugar tax on soft drinks have an impact on Irish consumer buying
behaviour?
Research Objectives and Hypothesis
Objective 1 - Identify if consumer behaviour has shifted since the introduction of the
sugar tax on sugar sweetened soft drinks.
Purpose - Empirical studies indicate that an increase on the price of soft drinks can lead to
a change in behaviour (Wright et al., 2017; Nakhimovsky, 2016). The objective is to identify
if the introduction of a tax on sugar sweetened soft drinks has caused a shift in Irish
consumer buyer behaviour.
H1 - Since the introduction of a tax on sugar sweetened soft drinks, Irish
consumers have shifted their buying behaviour when buying sugar sweetened
soft drinks.
Objective 2 - To investigate the main factors that have influenced the shift in consumer
behaviour regarding the purchasing of soft drinks?
Purpose - To identify the main factors that have influenced the shift in consumer behaviour
since the introduction of the sugar tax on soft drinks and understand if the research is
Page 37
26
aligned or contrasts with existing literature on whether taxes can reduce consumption of
targeted products (Wright, Smith and Hellowell, 2017).
H2 – The shift in consumer behaviour regarding purchasing of soft drinks is down
to several factors and not just price.
Objective 3 - To explore the role of “price” when it comes to the buying process of soft
drinks.
Purpose - To explore the role of price when it comes to the buying process of soft drinks.
With the sugar tax’s aim to increase the price of a soft drink on a consumer, does the price
take a role in the decision-making process. Do consumers look or think about the price of
a soft drink? And, if so, is this impacting the decision-making process? This objective aims
to identify if Irish consumers are changing behaviour and are they as reactive to price as
other countries identified in the literature (Afshin et al., 2017; Falbe et al., 2016; Hoffer,
2014), in the same vein that Pulligadda et al., (2016) found that consumers are willing to
pay a higher price as they are loyal to their chosen brands. Also highlighted by Fletcher et
al., (2013) that for a tax to be effective, it would need to be a hefty tax to shift behaviour.
H3 - The price of a soft drink plays a significant role for Irish consumers when it
comes to purchasing a soft drink.
Objective 4 - To determine if Irish consumers take into consideration their consumption
of sugar when purchasing soft drinks.
Purpose - To explore how Irish consumers view their sugar intake when purchasing a soft
drink and drawing on the concept of addiction provided by Wang et al. (2016) that shows
that sugar has addictive qualities, therefore it can be assumed that consumers will not
consider sugar content regarding soft drinks. As indicated earlier, Degeratu et al. (2000)
Page 38
27
indicated that consumer choice of soft drinks is driven by both product and consumer
characteristics, therefore sugar content may not be a contributory factor in the decision
process.
H4 – The sugar content of soft drink has an influence on the decision-making
process of the Irish consumer.
Objective 5 - To determine if the perceptions of total sugar content of beverages is
accurate, therefore it can be determined that Irish consumers are aware of sugar intake
when buying beverages.
Purpose – To explore the perceptions of Irish consumers when it comes to sugar intake
when buying or consuming beverages. As Ireland moves towards becoming the most obese
country in Europe (WHO, 2015), the Government has introduced a sugar tax on sugar
sweetened drinks. However, findings from the Irish Beverage Council states that only 3%
of the nation’s total calorific intake is coming from sugar sweetened soft drinks (IBC, 2017).
This objective aims to explore if Irish consumers’ perceptions of sugar content in beverages
is in fact accurate, as a failure of consumers to be accurate could lead to a shift from sugar
sweetened soft drinks to a more sugar dense beverage.
H5 – Irish consumers’ perceptions of sugar content in beverages are accurate to
help them make an informed decision of sugar intake.
The next chapter will discuss the methodology used for this study.
Page 39
28
Methodology Chapter
Introduction
Having reviewed and analysed existing and most recent literature relevant to the research
topic, this chapter will define how primary research will be conducted. The chapter will
illustrate the methods used to gather the information, how the data is analysed, and
highlight any research limitations. Underpinning this will be the theoretical assumptions
that relate to the research. According to Saunders, Lewis and Thornhill (2015) this chapter
relates to the theory behind the research and how it can be justified.
Through the following sections of this chapter, the research choices will be detailed and
justified as the most appropriate method of research after considering all other options
available. Through this process, the problem is analysed through steps to ensure that the
research shows a relationship to the objectives of the problem. Vital parts of the research
include the following: the research problem definition, research objectives, proposed
methodology and structure, philosophy, approach, strategy, choice, time horizon, data
collection, procedure, and research ethics. To complete this section, the research
instrument used will be defined, as will the rationale for using it. Finally, a limitations
section will highlight any shortcomings in the process.
A key aspect of research is to manage the methods and ensure that they align with the
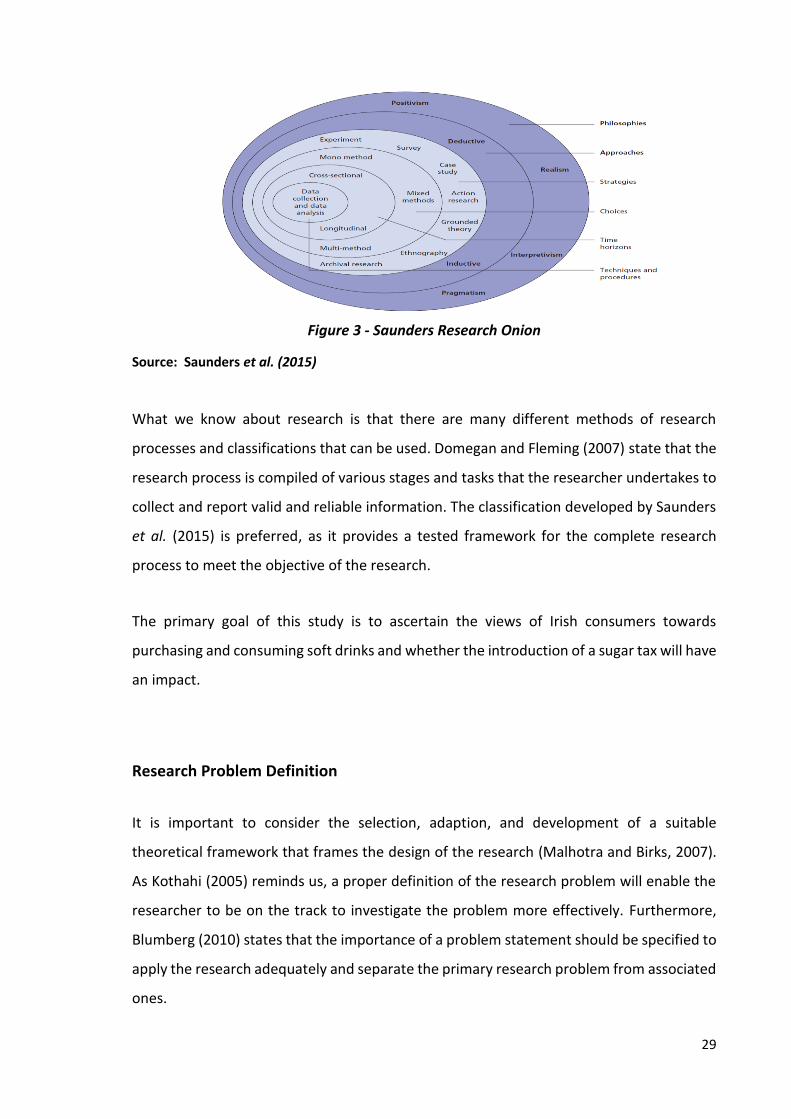
main objectives. The ‘Research Onion’, as presented by Saunders et al. (2015) illustrates
the main elements related to the research methodology, and the motivation behind the
research. It is presented in the form of an “onion”; the research problem is the centre and
to get to the research problem many layers need to be ‘peeled away’. These layers are
vitally important in determining the research methodology to be used in the research
project.
Page 40
29
Figure 3 - Saunders Research Onion
Source: Saunders et al. (2015)
What we know about research is that there are many different methods of research
processes and classifications that can be used. Domegan and Fleming (2007) state that the
research process is compiled of various stages and tasks that the researcher undertakes to
collect and report valid and reliable information. The classification developed by Saunders
et al. (2015) is preferred, as it provides a tested framework for the complete research
process to meet the objective of the research.
The primary goal of this study is to ascertain the views of Irish consumers towards
purchasing and consuming soft drinks and whether the introduction of a sugar tax will have
an impact.
Research Problem Definition
It is important to consider the selection, adaption, and development of a suitable
theoretical framework that frames the design of the research (Malhotra and Birks, 2007).
As Kothahi (2005) reminds us, a proper definition of the research problem will enable the
researcher to be on the track to investigate the problem more effectively. Furthermore,
Blumberg (2010) states that the importance of a problem statement should be specified to
apply the research adequately and separate the primary research problem from associated
ones.
Page 41
30
Research Philosophy
Research philosophy is a highly important issue in a research study, as it helps to develop
the logical, rational, reality-based thinking to analyse the viewpoints gathered in the data
collection method. Johnson (2014) asserts that the importance of the relationship between
theory and research cannot be underestimated. Other writers such as Quinlan (2011) and
Jankowicz (2005) hold the view that that it is the philosophical framework that underpins
every research project, and that it indicates the worldview in which the research is situated.
Both researchers emphasise that research is about creating new knowledge and, through
this, its development is based on strong judgement of what is known and unknown and
constitutes the epistemology concerns about acceptable knowledge in a study.
As discussed, the philosophical framework underpins every research project, but it also
relates to the way that the assumptions underpin the research strategy. This can be broken
down into three areas - Positivism, Realism, and Interpretivism.
Positivism sees society as shaping the individual. As discussed above, introducing a sugar
tax can have an impact on individuals and on shaping individual responses, with a
structured questionnaire framing the research, this will allow for rejection, or acceptance
of the set hypotheses. This will be important, as, with the tobacco industry, a significant
shift in smoking can be attributed to human behaviour due to the social unacceptability of
smoking in public. Sanders et al. (2012) addresses the significant importance for a
researcher to retain an emphatic stance with relation to positivism.
Research Question
This paper’s main research question is presented as follows:
“Will the introduction of a sugar tax on soft drinks have an impact on Irish consumer
buying behaviour”?
Page 42
31
Research Objectives
Saunders et al. (2012) highlights that the objectives of the research should be formulated
from the original research question. In the same vein, Saunders et al, (2009), point out that
the research topic must be accompanied by a clear set of objectives that the research must
address. The research objectives of this study were:
Overall Research Objective
“Will the introduction of a sugar tax on soft drinks have an impact on Irish consumer
buying behaviour”?
Research sub objective 1.
“To investigate the main factors that influenced the shift in consumer behaviour in regard
to the purchasing of soft drinks”
Research sub objective 2.
“To explore the role of “price” when it comes to the buying process of soft drinks”
Research sub objective 3.
“To determine if Irish consumers take into consideration their consumption of sugar when
purchasing soft drinks”
A considerable amount of literature has been published on consumer behaviour and how
this can be easily changed. Recent evidence by Finklestein et al. (2013) suggests that, with
subtle cues, consumer consumption behaviour can be influenced and can cause a shift in
behaviour. Furthermore, in an investigation into the effectiveness of taxes on sugar
sweetened soft drinks, Powell et al. (2009) provide evidence indicating that taxes on sugar
sweetened soft drinks resulted in a reduction of consumption of sugar sweetened soft
drinks. The studies presented thus far provide evidence that suggest that consumer
behaviour can be influenced. This study aims to understand will the introduction of a sugar
tax on sugar sweetened drinks have an impact on Irish consumer behaviour.
Page 43
32
In his review of ‘Fat Taxes’, Creighton (2010) points out that the higher the tax on an item,
the less appealing it becomes to consumers. However, Degeratu et al. (2000) applied
indicated that consumer choice of soft drinks is driven by both product and consumer
characteristics, while Pulligadda et al. (2016) reminds us that consumers are willing to pay
a higher price, as they are loyal to their chosen brands.
In a systematic review of taxes on sugar sweetened beverages in middle income countries,
Nakhimovsky et al. (2009) found that a tax may be more effective in middle income
countries versus high income countries, given the evidence that consumers are more
responsive to prices. Research objective 2 will attempt to apply and test this variable and
explore the role of price when it comes to the buying process of soft drinks. It will seek to
understand if consumers are aware of the price increase since the introduction of the sugar
tax, and investigate whether consumers are shifting consumption due to the price increase.
It also looks at whether salary has a link to buyer behaviour on soft drinks.
As was pointed out in the introduction to this paper, it has been identified that consumers
may in fact be addicted to sugar in their diets (Westwater, Fletcher and Ziauddeen, 2016;
Trivedi, 2010), and as far as sugar is concerned there is significant evidence to show that
Irish consumers are exceeding the recommended daily amount of sugar. Research
objective 3 aims to look at the Irish consumer and whether they take into consideration
the amount of sugar contained in soft drinks. Does the sugar content of a soft drink have
an impact on their buying behaviour? To develop this objective further, the research will
incorporate a question with images of seven various beverages, where each participant will
be asked to rate the estimated sugar content of each beverage. The results of this will
indicate if consumers are aware of the correct sugar content in beverages and may lead to
further research into the substitution effects of a sugar tax on soft drinks.
Research Strategy
Saunders et al. (2009) highlight that it is important that the research strategy chosen for
the study allows the researcher to answer the research question and meet the required
objectives. This stage involves the discussion and justification of the chosen research
strategy for the research. As noted by Saunders et al. (2009), it is important that there is a
Page 44
33
clear distinction between strategy and tactics. The former is concerned with the plan for
the research; the latter is about the finer detail of the data collection and analysis.
Research Design
The research design that was deemed the most appropriate for this project and to answer
the research question was quantitative research. The research design is the definition of
the overall research study, thus, to understand the nature of the research design, it is
important to understand the objectives of the research. This research is exploratory in
nature. The benefits of this research is that it is effective in laying foundations that may
lead to further studies. Sanders et al. (2012) maintain that this type of research is valuable
for asking open ended questions, as it assists in discovering what is happening, gaining a
deep understanding around the research problem. This method involves starting with a
broad focus, but with further processes, it develops further and the focus narrows and will
become more detailed, helping illicit strong responses to the questions.
Questionnaires will be used for data collection, in which each person is asked to respond
to the same set of questions (Saunders et al., 2009). Questionnaires are a well-established
tool within social science research for acquiring information on participant social
characteristics, present and past behaviour, standards of behaviour, and reasons for
actions with respect to a topic under investigation (Bulmer, 2004). The structure of the
questions will be mostly closed-ended questions, as these limit the respondent to the set
of alternatives being offered. There will also be a small number of open ended questions,
which allow for further probing and allow the participants to define, describe, or express
an opinion (Saunders, 2015; Dillman, 2007).
Proposed Methodology and Structure
Commenting on research, McGivern (2013) highlights ‘if the research is completed
correctly then it will be a success as the research can only be valued if it meets its objectives
and its purposes’. To ensure that the objectives are achieved, it is vital that the research
method procedure be researched and analysed in a thorough manner.
Page 45
34
As explained earlier, quantitative data will be collected through a questionnaire, which will
be developed through online software. The sample will be made up of Irish people, aged
between 18 to 65 and over. The reason this cohort was identified is due to the incidences
of soft drink they purchase and consume. These can both vary due to the nature of the
product, as soft drink products can be purchased and consumed immediately as an
‘immediate refreshment’ or purchased in larger formats for consumption at home. To
achieve the responses, the main data collection will target over 100 Irish supermarket and
convenience shoppers. The advantages of a survey is the access to consumers from a wide
range of backgrounds, age, and family size.
Questionnaire Design
When using the questionnaire survey approach to research, it is important to consider two
main concepts in questionnaire design: ‘reliability’ and ‘validly’. Reliability refers to the
consistency of a measure, whilst validly refers to its ability to measure what it is supposed
to be measuring (Adams and Cox, 2008).
There is a consensus among authors that good questionnaire design is crucial to generate
data that is conductive to the goals of the research, and understanding this can assist in
ensuring data collected is reliable and robust (Saunders, 2009; Bulmer, 2004; and Creswell,
2003). It is important to use words familiar to all respondents, and avoid words with
ambiguous meanings, catch words, or words with emotional connotations (Kothari, 2005).
This view is supported by Bird (2009) who points out that the format, sequence, wording,
and length need to be considered to ensure reliability, validly, and sustained engagement
of the participant. To ensure these factors are met and to maximise response rates, the
author, when designing the questionnaire, took into consideration the following steps, as
indicated by Saunders et al. (2009):
Careful design of individual questions;
Clear and pleasing layout of the questionnaire;
Explanation of the purpose of the questionnaire.
Page 46
35
Foddy (1994) developed a framework for questionnaire design, with stages that must occur
if a question is to be valid and reliable. It emphasised that the question must be understood
by the respondent in the way intended by the researcher, and the answer given by the
respondent must be understood by the researcher in the way intended by the respondent.
Questionnaire design and the set up of questions are considered important:
Ensures that the main research objectives are considered when constructing
questions,
Ensures that all questions and answers relate back to the research objectives,
Reaches a sample that is large enough to gather robust data,
The questionnaire is clear, easy to navigate, and understand.
To achieve all the above, it was decided that the questionnaire would be web based. Online
questionnaires allow for a low or no cost professional research tool, they offer simple
functionality, they allow for complete control over the flow, design and structure by the
researcher, and offer a simple easy to use survey tool for participants. They also offer a
significant benefit in the fact that interviewer bias is eliminated, as the survey is completed
by the solely by the respondent.
In his social exchange theory, Dillman (2007) identified that survey response rates depend
on a combination of factors, including reward, trust, and costs. The research hypothesized
the following: that ease and low cost (in relation to time taken to complete survey), origin
of the survey, structure and length of survey and finally assurance of confidentially are all
influential factors in increasing web survey response rates. Dillman also points out that in
covering the above steps it can portray professionalism on the part of the researcher.
Furthermore, Saleh and Bista (2017) found that online surveys now yield significantly
higher response rates than paper surveys.
Page 47
36
Procedure
A considerable amount of time was allocated to the questionnaire set up; all questions
were drafted and scripted in Microsoft word. Attention was paid to simple language and
wording of questions and ease of flow of question and sections, to ensure that participants
in the study understood each question clearly. It was avoided making the questionnaire
complicated or confusing, as this is likely to result in low response rates. To ensure valid
and completed surveys, the questionnaire was designed to ensure it would take less than
ten minutes to complete, as previous studies have asserted that shorter surveys have
higher response rates (Liu & Wronski, 2017; Porter, 2004).
The estimated time for completion for the survey, according to Qualtrics, was 8 minutes.
This estimation incorporates the open-ended text entry questions that may be completed
with one-word answers or a paragraph depending on the participant. During the process,
the open-ended questions had a forced response, with a minimum character count that
limited one-word answers, but through the pilot testing, this was viewed as frustrating by
testers, which may lead to participants exiting the survey before completing.
The survey was divided into four sections, with each section having a precise purpose and
was related to the research objective. Each section was explained at the start in simple
terms, to give participants an understanding of what was contained in the section:
Introduction,
Buying pattern,
Sugar tax introduction,
Buying behaviour,
Price,
Sugar content.
Building the Questionnaire
Initially, Surveymonkey.com was investigated as a survey tool; this is a free software used
to complete online surveys. However, after some research, the researcher encountered
Page 48
37
some major faults, as the software did not allow for filtering of questions or allow for
control on the flow of questions, which would result in questions from a section on price
appearing in a section on sugar, which could lead to lower response rates due to poor
structure (Saleh and Bista, 2017). To achieve the required control over the structure and
flow, the researcher would need to pay a subscription fee. After some further research, it
was found that Qualtrics.com provided a free, professional survey tool that allowed the
researcher full control over how the questionnaire would be built.
The software provided many additions such as forced responses to ensure that questions
were answered and to avoid gaps in the data. It also allowed for structure around how
different participants answered, for example, should a participant answer yes, the software
would ensure that the next question related to the response of yes, and if the response
was no, the following question would relate to the no response. This allowed for
continuous flow for the participant and ensured that they were not frustrated when
answering the survey. Another benefit to the Qualtrics tool was that during the set-up
stage, the researcher could preview the questions as to how they looked on a computer
and on a mobile device. Furthermore, the Qualtrics tool allowed for the link of the survey
to be distributed via email and through mobile applications such as text messages or
WhatsApp if required.
Pilot Test
Pilot testing refers to trial run or pre-testing of a research instrument done in preparation
for the major study (Baker, 1994; Polit, Beck and Hungler, 2001). Furthermore, Saunders et
al. (2009) state that the purpose of the pilot test is, to refine the questionnaire to ensure
respondents will have no problems in answering the questions and therefore there will be
no problems collecting the data. The first stage of testing was conducted through a printed
word document to test the questions’ structure and the flow of the stages through a sample
of colleagues. This provided important feedback on the flow, framing of the questions, and
structure. This feedback was then incorporated into the final set of questions.
The second stage of testing incorporated setting up the questions on the Qualtrics
software. Once the questions, images, and flow was complete, this was then trialled by six
Page 49
38
‘typical’ respondents and tested by two ‘non-typical respondents’. The two non-typical
respondents were work colleagues and, as the researcher works for a leading soft drinks
company, the research felt that this data could be viewed as flawed and unreliable due to
the knowledge around the sugar tax introduction. In addition, it must be highlighted, that
the researcher decided not to distribute the final survey to work colleagues to ensure that
data collected was robust and valid.
Of the six ‘typical’ respondents, the researcher observed two of these responses to ensure
that the flow was as intended, to ensure the duration to complete the survey was accurate,
and to highlight any problematic areas. This testing stage proved to be extremely valuable,
as there were several problematic areas identified; an example was how the readability
shifted on some questions when answered on mobile devices. The pilot testers were asked
for feedback in relation to the following:
Ease of access to open link
Was the introduction and instructions clear?
Time taken to complete survey?
Where the questions easy to understand?
How did they find the flow of the questions and the sections?
How user friendly was the layout, with importance on the final question that had
graphics?
Feedback was provided and there were concerns around the wording of questions, on how
two separate questions felt like they were asking the same question, which caused
confusion. Feedback was also raised on the issue of the minimum word count for the open-
ended questions; this resulted in the researcher removing this step on these questions. The
feedback was crucial and in turn minimal changes were made and the survey was then
distributed.
Page 50
39
Administrating the Survey
Once the survey was completed and ready to be distributed, the Qualtrics software
distribution section generated a hyperlink, which could be formatted to the researcher’s
requirements. Therefore, the researcher could attach the link to an email for distribution
through personal email list using the snowballing technique and through a mobile
application through a text message or WhatsApp, as the Qualtrics software allowed for
respondents to answer survey though a mobile device. The cover email and cover message
explained the nature of the research and highlighted that the survey was anonymous and
confidential. Once live, the questionnaire was active for a two-week period.
Research Approach
The research approach is a significant element to be considered for any research project,
consisting of three techniques: Inductive approach, Deductive approach, and the Abductive
approach (Saunders et al., 2012). The relevance of the research achieves success through
making correct choice of research approach. Research can be designed to develop a theory
or test a theory. This research project will take an inductive approach. The inductive
approach is used to explore the collected data for identifying the themes and patterns and
to create a conceptual framework.
Several studies investigating the impact of taxation on soft drink consumption has resulted
in a considerable amount of published studies describing the various methods of research
conducted worldwide. Colantuoni and Rojas (2015) conducted a study into the impact of
soda sales taxes on consumption and used evidence collected from two sets of scanner
data. This was collated through datasets of the volume sold of a specific range and brand
of soft drinks in two different American cities. The scanner data then incorporated income
distribution, population size, and temperature, which can have an impact on consumption
and buyer behaviour. The result of this study found that a price increase on soft drinks in
the two cities, Maine and Ohio, did not decrease consumption.
This approach helps to build theories of verification. The aim of this study is to understand
the buying behaviour of Irish consumers, post the introduction of a sugar tax on soft drinks.
To obtain this insight, data collected from a questionnaire survey will be analysed and
Page 51
40
interpreted to understand if the introduction of the tax will have or has had an impact on
consumer behaviour.
Research Sample
Sampling techniques that can be used are divided into two types:
Probability or presentative sampling
Non- Probability or judgemental sampling.
This research was conducted using probability sampling, as this is commonly used for
survey-based research and can assist in making inferences from the sample about the
population. As this research is based upon the impact of a sugar tax and the behaviour of
the Irish consumer, the researcher deems this the best fit for the research.
The target population to be included in the sample will be comprised of Irish consumers,
both male and female. Research conducted by Bordbia (2017) found that most of grocery
shoppers in Ireland tend to be female; the gender bias has narrowed in the last decade,
however. However, this research relates to overall grocery shoppers of which most of the
purchases would relate to items for consumption at home. For this research project,
impulse purchases must be considered, as O’Reilly (2011) found that soft drink sales were
higher for impulse soft drinks rather than at home consumption purchases.
As indicated, the research sample will include responses from male and females from ages
18 – 65+. The reason behind this age cohort is to have an overall view of Irish consumers
who are at all stages of the life cycle.
This research project also considers the social class of the sample group, as far too little
attention has been paid to this. Therefore, the author highlights a gap in research, and this
should be undertaken to understand if social classification and grouping have an impact on
buying behaviour when it comes to soft drinks purchases. It is vital to secure a high
response rate to gather a more informed and detailed data collection. The aim of the
research is to gather up to 100 responses via an online questionnaire, as it must be noted
that, according to Saunders et al. (2012), out of a population sample of less than 100, there
is a high margin of error, which must be considered when reporting the conclusion.
Page 52
41
The main objective of primary research is to collect details about a population of people.
Two methods can be used, and these include a census and a sample. A census is where data
is gathered from every person within a population, while a sample is a subset of the total
population and is said to be representative of the whole population being sampled
(Saunders et al., 2009). Sampling techniques provide a range of methods that enable you
to reduce the amount of data you need to collect by considering only data from a sub-group
(Saunders et al., 2009). The sampling technique was chosen due to nature and limitations
of the research.
Time Horizon
The time horizon relates to the time frame of when and how the research data will be
collected, and also how it will be analysed. It is broken into two areas and leads to a
separation between longitudinal and cross-sectional research. Longitudinal research is the
study of change and development, where the study is replicated over a period, and changes
and movements can be tracked. Adams and Schvaneveldt (1991) state that observing
people or events over time gives the researcher the ability to control variables being
studied. Cross sectional research is the study of a phenomenon at a particular time
(Saunders et al., 2015). For this research project, a cross-sectional study was undertaken,
due to the time frame available to gather data being constrained.
Data Collection, Data Storage and Data Privacy
All data collected in relation to this research will be stored in a password protected folder
on a cloud-based storage file. This cloud-based storage is provided by the author’s
employer and usage is agreed by the employer. Survey results will be collected via an online
process; details will be collected and stored correctly. Personal details will not be collected;
reference will only be related to age and sex. Data privacy is an extremely important
element of the research process, and, as indicated, no personal data will be collected.
Page 53
42
Ethical Issues
The researcher took careful consideration always to firmly observe the ethical guidelines
as indicated by the National College of Ireland. Ethical issues are a very important
consideration for a research project and relates to the rules of any research project being
undertaken. With the research collection method of the survey questionnaire, no personal
details will be collected; however, issues still need to be considered and the identity of the
responses should not be disclosed at any cost. The questionnaire should be based on the
main problem and sub objectives of the research project, and the respondents should be
made aware of what the topic is related to before commencing the questionnaire.
To achieve robust data that can be used, all questions need to be worded to ensure that
respondents can respond accurately without confusion. This in turn will illicit reliable
results. The method of choosing respondents should be unbiased, as this will also ensure a
more balance result in responses.
Page 54
43
Analysis / Research Findings
To provide the analysis and findings from the research questionnaire, this chapter will be
divided into several sections, starting with an overview of the participants who took part in
the research. The subsequent sections will each relate to the main research objectives and
the results will then be used to answer the hypotheses.
Descriptive Statistics
The targeted sample size for the research project was over 100 responses, as according to
Saunders et al. (2012), out of a population sample of less than 100, there is a high margin
of error that must be considered when reporting the conclusion. The total complete
respondents for the research resulted in 117 completed surveys.
Questions 1 – 3 were aimed at gathering demographic information on the participants.
Gender was the first demographic variable, as depicted in Figure 4. Of the 117 respondents,
the gender split was 62% Female and 37% Male. While the aim was to have an even split
of gender, there was a slight female bias. However, research has found that women are
more likely to participate in surveys than men (Curtin, Presser, and Singe, 2000). That said,
there is still a strong response rate to ensure reliability in the data.
Figure 4 - Gender Breakdown of respondents
Total number of respondents (N=117)
Page 55
44
Figure 5 - Gender Breakdown - SPSS
The research project set out to ensure that a random age set was sampled to ensure a mix
of age groups were in the sample.
Figure 6 - Age breakdown of respondents
Total number of respondents (N=117)
Page 56
45
Figure 7 - Age breakdown - SPSS
The third main demographic variable was salary range. It was important to consider salary,
as the findings will serve to indicate that, if a respondent is on a high salary, is the price
increase of soft drinks a factor. As indicated earlier, research has shown that sin taxes
disproportionality impact low income households in society. According to the CSO (2018),
the average annual salary in 2017 was €37,646, which indicates that over 50% of
respondents received over the average salary, would this impact on results.
Figure 8 - Salary range of respondents
Total number of respondents (N=117)
Page 57
46
Figure 9 - Salary Range - SPSS
Respondents’ knowledge of Sugar Tax
The following is a brief analysis of what the respondents understood about the sugar tax.
The question asked respondents if they were aware that a sugar tax was placed on sugar
sweetened drinks, indicating a significant awareness of the sugar tax introduction.
Figure 10 - Sugar Tax Introduction
Of the 8 respondents that answered no, a follow-on question was asked; as they were not
aware of the sugar tax, would they continue to buy sugar drinks in light of new awareness.
Interestingly, 75% of respondents answered that they will continue to purchase sugar
Total number of respondents (N=117)
Page 58
47
sweetened soft drinks. An open-ended question probed further to reveal why they will
continue to buy soft drinks and found two themes, that they preferred the taste, and that
they purchase very little for yes respondents, with the no indicating they pay ‘enough tax’.
Figure 11 - Will you continue to buy sugar sweetened soft drinks?
Total number of respondents (N=8)
The question was asked regarding how they were made aware of the introduction of the
sugar tax. The results follow on from awareness of tax, to show a wide range of areas of
communication.
Figure 12 - How were you made aware of the sugar tax?
Additional analysis revealed that 66% of respondents felt there was not enough
information provided by the government in relation to the introduction of the sugar tax,
with 34% stating that there was. This contrasts with the 93% of respondents who stated
they were aware of the tax. It is important to consider, the impact on behaviour, if more
information was disseminated by Government.
Page 59
48
Respondents were asked, since the introduction of the sugar tax, how much full sugar soft
drinks have they bought. This question found that 60% still buy the same amount,
indicating that the tax is not having an impact on purchasing behaviour, as only 8% stated
that they had bought less sugar drinks.
Figure 13 - Since introduction of Sugar Tax - Behaviour
Total number of respondents (N=114)
Hypotheses Findings
Analysis / Research Findings
To present the analysis and findings from the online questionnaire, this chapter will be
divided into several sections starting with an overview of the participants who took part in
the research. The remaining sections will relate to each of the research objectives and the
results are then used against the hypotheses outlined.
The research investigated the respondents’ purchasing and consumption history to
understand the categories that the respondents are mostly aligned with. Taken together,
it indicates that purchasing behaviour does not have an impact on consumption. 15% of
respondents purchased soft drinks, but the same number of people consumed 4% more
soft drinks. The aim of the sugar tax was to shift behaviour to make people buy less and in
turn consume less sugar sweetened drinks. The significance of the findings indicates that
the taxation of soft drinks may affect the purchaser, but the purchaser may not be the end
Page 60
49
user, which could indicate that sugar intake may be passed onto the end user. Similarly,
the findings indicate that 23% of respondents bought Energy / Sports drinks, which contain
high sugars, but only 9% consumed these drinks. More research is required to better
understand the difference between purchase and consumption and end user consumption.
Table 1 - Purchasing and Consumption Behaviour
Further information was collected as to the breakdown of preference when it came to
purchasing a soft drink. The options included 1. A full sugar drink, 2. Non-Sugar drink, and
3. No Preference. Initial observations suggest that preference to a non-sugar drink is
significantly high. It is possible that the respondents have already shifted buying behaviour
well before the sugar tax was implemented. This could be down to several factors, including
product reformulation by manufacturers.
The scope of this research was limited in terms of time scale and longitudinal research;
therefore, future research should concentrate on the investigation of the move to non-
sugar soft drinks over the last number of years.
Page 61
50
Figure 14 - Preference of Soft Drinks: Full Sugar / Non-Sugar / No Preference
Total number of respondents (N=117)
Having identified the descriptive statistics of the respondents, what follows is the
hypotheses findings and analysis.
Page 62
51
Hypotheses Findings
First Objective
The first research objective was to identify if consumer behaviour has shifted since the
introduction of the sugar tax on sugar sweetened soft drinks. The first hypothesis is:
H1 - Since the introduction of a tax on sugar sweetened soft drinks, Irish
consumers have shifted their buying behaviour when buying sugar sweetened soft
drinks.
The testing process for this utilised a logistic regression model set up through SPSS and
used to predict a dichotomous (binary) variable from a set of predictor variables. It means
there can be two possible outcomes. In this case, yes or no, has the introduction of the
sugar tax shifted buying behaviour. This is a predictive model and is used to calculate the
probability of the relationship between one dependent variable and other variables.
The tests revealed that, of the 117 respondents, there were 3 missing cases, therefore only
114 results can be used in the analysis.
Figure 15 - Case Processing Summary - No. of Selected Cases - SPSS
Page 63
52
Figure 16 – Classification Table - Have you changed your behaviour? – SPSS
The classification table does not contain any predictive variables and is just an intercept
only model. The overall percentage is the percent of cases for which the dependent
variables were correctly given in the model. The results indicate that the null model is 93%,
which indicates that 93% of respondents have not changed their buying behaviour since
the introduction of the sugar tax on sugar sweetened soft drinks. The significance of the
results below indicates that Irish consumers have not changed their buying behaviour since
the introduction of the sugar tax.
To better understand the data, and its impact on behaviour, the researcher undertook a
Bivariate Correlation test through SPSS, which involved taking some variables with
dichotomous responses and comparing it with the question, have you changed your
behaviour. The results in Table 10 indicate p values (Sig) for values not used in the model;
these variables all have values of > 0.05, which means they are not significant individual
predictors on a shift in behaviour.
Page 64
53
Figure 17 - Bivariate Correlation Test - SPSS
The model then continues to use these variables to understand if they are combined, have
collectively had an impact on behaviour. Through the Chi-Square result, all the p values are
> 0.05, which indicates that the model is not strong enough to state that these variables
impact on consumer behaviour.
Further analysis using the results from the final test indicate odds ratios contained in the
Exp(B) related to each of the variables. The test reveals that having a preference of sugar,
non-sugar, or no preference is four times more likely to shift behaviour. Should the
respondent notice a price increase, they are 1.3 times more likely to shift behaviour.
Figure 18 - Bivariate Correlation Test – Variables - SPSS
Page 65
54
Second Objective
The second objective sought to investigate the main factors that influenced the shift in
consumer behaviour regarding the purchasing of soft drinks.
H2 – The shift in consumer behaviour regarding purchasing of soft drinks is down
to a total number of factors.
Continuing to use a logistic regression model, which is used to predict a dichotomous
variable from a set of predictor variables, the test incorporated several variables and tested
these against the shift in behaviour to understand what factors had the most impact on
behaviour change.
Figure 19 - Logistic Regression Table - Factors - SPSS
Price:
Respondents were asked if they think about the price when buying a soft drink. The
regression coefficient which is depicted by B in the above chart represents the relationship
between a given explanatory variable and the outcome variable, which means the
relationship between the price and shift in behaviour. The results from the test indicate
that this had an exponential value Exp (B) of (1.144), which indicates that there is a unit
change, and that looking at price is (1.114) times more likely to impact on behaviour when
buying soft drinks. This variable had the most odds on shifting behaviour. From the test
results, it is noted that there is little relationship between respondents thinking about price
when buying a soft drink and a shift in behaviour. The standard error (S.E.) which is an
Page 66
55
indication of the reliably of the mean comes in at (.135) in regard to thinking about price
indicating
The degrees of freedom (df) for the Wald Chi-square test for price resulted in 1, as there is
only one degree of freedom, as there is only one predictor in the model.
Noticing Price:
Respondents were asked if they have noticed the increase in the price of a sugar soft drink.
The results indicate that this had an exponential value Exp (B) of .652, which indicates little
or no change, therefore respondents not looking at price is having little or no effect on
buying behaviour. There is no relationship between noticing the increase in price and a
shift in behaviour. The degrees of freedom (df) for the Wald Chi-square test for price result
of (1), as there is only one degree of freedom, as there is only one predictor in the model.
Think about sugar:
Respondents were asked if they think about the amount of sugar in a sugar soft drink.
Results from the test indicate that this had an exponential value Exp (B) of .266, which also
has little impact on buying behaviour. No relationship exists between respondents thinking
about sugar and behaviour or noticing sugar content and a shift in buying behaviour. The
degrees of freedom (df) for the Wald Chi-square test for price resulted is (1), as there is
only one degree of freedom, as there is only one predictor in the model.
More aware about sugar:
Respondents were asked if they are more aware about sugar since in the introduction of
the sugar tax. Results from the test indicate that this had an exponential value Exp (B) of
.398, which also has little impact on buying behaviour. There is no relationship between
being more aware of sugar and a shift in buying behaviour. The Wald statistical analysis
tests whether the regression coefficient is an explanatory variable in a logistic regression
that is different to zero. The result from this variable is 1.386, which indicates that being
more aware of sugar content is not making any impact on predicting the outcome, and is
not statistically significant, as values with a p <0.05 are only considered statistically
significant. The degrees of freedom (df) for the Wald Chi-square test for price resulted is 1,
as there is only one degree of freedom, as there is only one predictor in the model.
Page 67
56
Look at label:
Respondents were asked if they look at the sugar content on the label of a soft drink.
Results from the test indicate that this had an exponential value Exp (B) of .398, which also
has little impact on buying behaviour. There is no relationship between looking at the label
and buying behaviour. The degrees of freedom (df) for the Wald Chi-square test for price
resulted is 1, as there is only one degree of freedom, as there is only one predictor in the
model.
In conclusion, to this logistic regression test, H2 hypothesis, that the shift in consumer
behaviour regarding purchasing soft drinks is down to a total number of factors, is null, as
none of the factor variables have had a significant impact on shifting behaviour.
Further research areas around this objective might look at colour coding of labels, as this
area looks at variables including thinking about sugar, awareness of sugar, and looking at
the label of soft drinks. Example below, on the left, indicates some products produced in
Europe, with recommended daily guidelines (RDA), in contrast to the traffic light system of
(RDA) that is used in the United Kingdom, which is a clear indictor of daily allowances. It is
important to consider should this measure of information become implemented on
products and have more influence on behaviour.
Figure 20 - Food Labelling on packaging – Europe & United Kingdom
Source: (EuFoodPolicy, 2018)
Page 68
57
Third Objective
The third objective explored the role of “price” when it comes to the buying process of soft
drinks. This objective took account of a hypothesis to explain if price plays a significant role
when it comes to purchasing a soft drink. The result from this test will indicate if the
hypothesis is valid or can be rejected. The major limitation to this hypothesis is that,
although it provides robust results to the hypothesis in question, it would fail to give
indicators to areas that add to the existing knowledge or provide areas that require further
research.
H3 - The price of a soft drink plays a significant role for Irish consumers when it
comes to purchasing a soft drink.
The two questions asked were as follows,
1. do you think about price when buying a soft drink?
2. Since the introduction of a sugar tax on soft drinks, have you noticed the increase
in the price of a sugar drink?
A Chi-square test was used to test the probability of independence of the data and test
how likely the observed distribution is due to chance and test the null hypothesis that the
variables are independent. Anything with a value of <0.05 has a very low probability. The
test results indicate that with a Pearson Chi-Square value of .011 indicates an extremely
low probability.
Page 69
58
Figure 21 - Chi Square Test - SPSS
Further analysis including using a sample t-test, which allowed the researcher to test if the
sample mean of males and females, and if there is a difference to the hypothesised mean,
the group statistics indicate that there are very slight differences between male and
females when it comes to noticing a price increase; .67 for Males and .59 for females. When
noticing price, Males have a mean of .70 versus Females, at .76.
Figure 22 - T-Test - Group Statistics of Price
To develop this further in relation to thinking about price increase and noticing the price
increase, both male and female respondents had p levels over the significance level of
>0.05, therefore, the hypothesis can be rejected.
Figure 23 - Independent Samples Test - Price
Page 70
59
As explained earlier, this objective also had an open question element to gain more insight
around the ‘role’ of price. However, with a small sample size, caution must be applied, as
the findings might not be transferable to be representative of the large population.
Figure 24 - Why do you not think about price?
Total number of respondents (N=66)
Respondents were asked why they did not think about price when buying a soft drink. This
open-ended question did not have a forced response attached to it. Of the 117
respondents, 66 responded with their thoughts. Five broad themes emerged from the
analysis. The main theme that came through was that price is not a factor, with a 45% share
of respondents having this view.
The next theme that arose was that they didn’t buy soft drinks very often, and this came in
at 21%; this result must be interpreted with caution because this does not state whether
they took into consideration the price. It could be argued that, as these respondents did
not buy soft drinks very often, they may be unable to anchor the price of the product.
Adaval and Wyer (2011) further discuss this theory explaining that the price that is selected
as an anchor is theoretically the price that is most accessible in memory at the time of
judgment. Should these respondents not purchase soft drinks very often, they may be
Page 71
60
unable to anchor a price and therefore a higher price of a taxed soft drink may seem the
normal price to pay. One implication from this finding is that it refers to people being
unfairly taxed when it comes to buying soft drinks and these respondents could be
classified as low users of soft drinks.
Taste emerged from the findings with an 11% share, respondents replied that they bought
‘depending on taste buds’ and simply that they like the ‘taste of the product’. The evidence
from this result could suggest the link to the addictive nature of soft drinks. Studies have
indicated that tasting something sweet leads to the activation of pleasure-generating brain
circuitry. In addition, according to clinical studies, this circuitry is the same or overlaps with
parts of the brain that mediates the addictive nature of drugs such as alcohol and opiates
(Drewnowski, Mennella, Johnson and Bellisle, 2012). The researcher recommends that
further research should be conducted in this area. Although there was an option in the
questionnaire related to whether the respondent was ‘slightly addicted to sugar soft
drinks’. Of the 117 respondents, nobody said they were addicted.
Similarly, in the same vein, the themes of impulse and thirst were combined to give an 11%
share of the responses, since it can be viewed that thirst is aligned with an impulse
purchase.
The final theme that came through was that price change was not significant enough for
the respondents to think of price. Much of the literature states that an increase in price can
have an impact on soft drink purchases (Gustavesn and Rickersten, 2011; Colchero et al.,
2016), but the result of this study contradicts this literature. Although in contrast, the
findings of this study support research conducted by Falbe et al. (2015) that small price
increases may not have an impact on behaviour, this study’s findings provide information
that the price increase on sugar sweetened soft drinks may not be high enough to deter
purchase by consumers.
The findings in this question are subject to at least three limitations. The main limitation
relates to investigating actual sales figures from the Irish retail market, using information
from Nielsen scan track, which would provide specific sales data on each brand, pack, size
and spend, and which would indicate how much was spent by Irish consumers. The result
of this could agree with the respondents that they don’t think about price, when in fact
there has been a shift to more affordable non-taxed soft drinks. An example could be a full
Page 72
61
sugar 7up consumer who might shift to a lower priced 7up free, which is non-taxed and
cheaper, but not have a perception that they shifted behaviour. It is important to consider
if soft drinks are bought as a single purchase with a few items or part of the weekly grocery
shopping. If they are purchased in the latter, the individual price might be disguised within
the other items; this could be a possible explanation for these results.
It is recommended that further research determine if the price increase set by the Irish
government is high enough to shift behaviour. With the findings of the study indicating that
over 50% of the respondents had a salary higher than the average salary, it can be
suggested that the salary range of the respondents, may have an impact on the purchasing
behaviour of consumers.
The researcher would have liked to apply a forced response to this question to gather more
responses but adding these to questions can add to frustration for the respondent.
The following conclusions can be drawn from this objective that explores the role of price
when buying soft drinks. Irish consumers do not think about price when purchasing a soft
drink, which contrasts with the aim of the tax. Finally, Irish consumers are not noticing the
price increase when purchasing a soft drink.
Fourth Objective
The fourth objective sought to determine if Irish consumers take into consideration their
consumption of sugar when purchasing soft drinks. This objective took account of a
hypothesis to explain if sugar and sugar content plays a significant role when it comes to
purchasing a soft drink. The result from this test will indicate if the hypothesis is valid or if
it can be rejected.
H4 - The sugar content of soft drink has an influence on the decision-making
process of the Irish consumer.
For this analysis, the researcher undertook another logistic regression through SPSS, used
to predict a dichotomous (binary) variable from a set of predictor variables. It means there
can be two possible outcomes. In this case, yes or no, sugar content of a soft drink had an
Page 73
62
influence on the decision-making process. This is a predictive model and is used to calculate
the probability of the relationship between one dependent variable and other variables.
Included in the variables tested against a shift in behaviour are the following:
1. When buying soft drinks, do you think about the amount of sugar in the drink?
2. Since the introduction of a sugar tax on sugar soft drinks, are you now MORE
aware of sugar in a soft drink than before the introduction of the sugar tax?
3. Do you look at the sugar content on the label of a soft drink?
Figure 25 - Binary Regression Model - Sugar – SPSS
This test revealed that thinking about sugar content and looking at the label of a soft drink
have p values of > (0.05), which indicate that they do not have an influence on behaviour
when buying a soft drink. The only variable that had an impact was the increased or more
awareness of sugar, which reported a p value of (.032), which is < (0.05), which indicates
that being more aware of sugar content has a minor influence on behaviour. Taken
together the main sugar questions, the overall statistics indicate that the p value (.079) is
higher than 0.05, therefore the hypothesis is null and can be rejected. Sugar does not have
an influence on the decision-making process of Irish consumers.
Fifth Objective
The final objective was to determine if perceptions of total sugar content of beverages is
accurate, and if it can be determined if Irish consumers are aware of sugar intake when
buying beverages.
Page 74
63
H5 – Irish consumers’ perceptions of sugar content in beverages are accurate
enough to make an informed decision of sugar intake.
This objective was framed differently in the questionnaire, the respondent was asked to
guess on a scale from 0 – 12 the number of spoons of sugar from a range of beverages.
Each beverage had an image and description of the beverage, and the guess was for 200ml
/ small glass of each, as per Figure 26.
Figure 26 - Sugar content with beverages
z
All data collected was then graded as per the below grading system to group responses and
accuracy levels. Example of grading: Glass of Milk contains 3 spoons of sugar. If respondent
answered 3, they were allocated 5 points, if they answered 2 spoons, allocated 2 points, 1
spoon was allocated 1 point, and an incorrect answer or out by 3 spoons or more equalled
no points.
Figure 27 - Sugar Grading Chart
Grading Points
Correct Amount of sugar in drink 5 points
Out by 1 spoonful either way in drink 2 points
Out by 2 or more spoonfuls either way 1 point
Incorrect or out by 3 or more spoonfuls either way 0 points
Page 75
64
Figure 28 - Breakdown of total sugar perception
Total number of respondents (N=111)
Figure 29 - Accuracy levels by respondents
Total number of respondents (N=111)
Despite its exploratory nature, this research offers significant insights into perceptions of
sugar content when it comes to beverages. If the debate on sugar is to be moved forward,
introducing the tax to other sugar food and drink categories, the Irish government should
investigate consumers perceptions deciding to purchase a product for consumption.
Should Irish consumers perceptions be accurate, it can be argued that consumers are
making an informed choice when it comes to sugar intake. Should the findings reveal
otherwise, it can be argued that Irish consumers may move to a substitute, non-taxed
product that can contain more sugar, therefore eliminating the benefits of the tax
altogether
Grade Pepsi Max Milk Coca ColaOcean Cranberry
JuiceNaked Smoothie
Jaffa Orange
JuiceCosta Latte Massimo
Correct 28% 10% 7% 9% 10% 11% 6%
Out by 1 3% 32% 14% 31% 27% 29% 1%
Out by 2 2% 31% 13% 24% 19% 16% 5%
Incorrect by 3 or more 68% 28% 66% 36% 44% 44% 87%
Total 100% 100% 100% 100% 100% 100% 100%
Page 76
65
The findings indicate clearly that the perceptions of sugar content contrasts significantly
with the actual sugar content. Interestingly, Pepsi Max, which contains no sugar, reported
the most correct answers at 28%. An important limitation to this figure is that Pepsi Max’s
recent advertising campaigns and labelling contain the ‘No Sugar’ messaging, as indicated
in Figure 17.
Figure 30 - Pepsi Max Advertisement
Source: Youtube.com (2018)
Conclusion of Analysis
This chapter set out to give an overview of the main findings of the research project and
the give a clear analysis of the findings. Returning to the question posed at the beginning
of this research project, it is now possible to state that the introduction of the sugar tax on
soft drinks did not have an impact on Irish consumer buying behaviour.
The next chapter discuss the analysis further, with recommendations from the research,
with regards to how the research and findings relate to the literature reviewed.
Page 77
66
Conclusions and Recommendations
The following chapter provides a review of the findings in relation to the research question
‘Will the introduction of a sugar tax on soft drinks have an impact on Irish consumer buying
behaviour?’ along with the sub objectives. From this, conclusions will be compiled, and
recommendations will be made.
The obesity epidemic is very well documented, with healthcare services struggling under
the burden of obesity related illnesses. A clear example of how obesity affects the health
service is in the United Kingdom, where the National Health Service spent £1.3 million on
“supersize” ambulances to carry obese people, as the number of obese people requiring
rose from 52,000 in 2006 to 520,000 patents in 2016 (Telegraph, 2017). Unfortunately, this
trend shows no sign of slowing down.
This issue has serious implications for Governments, society and individuals worldwide,
which is the reason why governments are introducing a wide range of measures to slow
down this epidemic. One of the areas include a tax on sugar sweetened soft drinks, as some
research indicates that this is a major contributor to the obesity crisis. Although this tax has
been introduced in many countries worldwide, it was only introduced in Ireland in May
2018. Would this tax shift Irish consumers buying behaviour? Is a price increase enough to
stop people buying sugar drinks? Do Irish consumers consider sugar when purchasing soft
drinks? And finally, do Irish consumers have an accurate perception of sugar content
regarding a wide range of beverages?
A quantitative method was used for this research project and involved open and closed
questions through an online questionnaire. It questioned Irish consumers aged 18 – 65+ on
a range of areas related to soft drinks, buying behaviour, and what influence sugar and
price has on decision making. The data was collected from respondents using a snowball
technique and resulted in 117 responses, which provided robust and reliable data to use
for analysis.
Page 78
67
In keeping with the main research question and the sub-objectives, the research concludes
that Irish consumer behaviour has not shifted since the introduction of the sugar tax on
sugar sweetened soft drinks, and no variables, including price and sugar content, have been
identified as impacting buying behaviour. Thus, Irish consumers have a significant
inaccurate perception of sugar content in beverages.
The research highlights:
1. Irish consumers aged 18 – 65+ have not changed their buying behaviour when it
comes to buying soft drinks.
2. The findings of the current study does not support much of the literature regarding
the introduction of a sugar tax on sugar sweetened soft drinks, where it has been
indicated that an increase in price impacts behaviour.
3. Price does not have an impact on Irish consumers when buying soft drinks.
4. Sugar does not influence buyer behaviour with regards to soft drinks.
The importance of considering consumer perceptions of sugar content of food and
drink products.
5. Important factors for governments to consider when implementing measures to
improve health, including improved labelling on products, taxes impacting on
unintended people.
6. Gaps in research regarding introducing taxes to shift behaviour (which this thesis
attempts to fill).
Discussion
This section will review each objective, draw conclusions from the results and link back to
current literature.
Shift in consumer behaviour
Research objective 1 looked to identify if consumer behaviour had shifted since the
introduction of the sugar tax on sugar sweetened soft drinks. Literature in this area has
Page 79
68
identified that introducing such taxes, results in price increases and effectively shifts
consumer behaviour into alternative beverages. The findings were unexpected, and the
results indicate that 93% of respondents did not change their behaviour. These findings
contrast significantly with research in this area (Colchero, 2017; Falbe, 2015, Gustavsen,
2011).
To discuss the unexpected findings, the following will review the research methods for this
objective. The number of respondents used for the study was classified as valid for an
online questionnaire according to Saunders et al. (2012), although the researcher is of the
view that this should be larger to gather a more national representation.
The age cohort of respondents ranged from 18-65+, however the 18-24 age group was
small, this group should this have had more participants, this may have had an impact on
the results. Also, as highlighted earlier, younger teens aged between 13-17 should have
been used for research, as these disproportionately consume more SSBs than adults (Scully,
Morely, Niven and Crawford, 2017; Couch, 2011). However, due to limited access to this
age group, this group was not included in the research. A future study of this age group
alone would be interesting.
Nakhimovsky (2017) concluded that if the primary goal of the tax is to reduce consumption,
then the increase in price needs to be 20% or more. The sugar tax in Ireland was set at
different levels, calculated at the percentage of sugar per 100mls, which may not shift a
price point by 20%.
Another factor that may have had an impact on the results is that some manufactures
including Coca-Cola reduced their pack sizes ahead of the introduction of the sugar tax,
resulting in consumers buying a smaller pack with the tax added would in fact be closer to
the ‘framed’ price of soft drinks (The Guardian, 2018).
Page 80
69
Figure 31 - Coke Pack Size Changes
Source. The Guardian (2018)
There has been no research, to date, regarding different pack sizes affecting behaviour,
thus further research needs to examine the links between pack size changes and behaviour
change more closely.
Research objective 2 investigated the main factors that influenced the shift in consumer
behaviour. The results revealed that that the factors highlighted from the research did not
have an impact on shifting behaviour. This objective came about through researching the
literature and found the factors that influencing the consumer to shift from buying sugar
soft drinks. Price was the main factor, as the literature states that a price increase on soft
drinks leads to a shift in buying behaviour (Nakhimovsky, 2016; Colchero, 2016; Falbe,
2015, Finkelstein, 2011). This factor did not have an impact on behaviour, which contrasts
with the literature. As explained earlier, the pack size change may have had an impact on
larger pack formats, which possibly is a factor on the impact of price.
In relation to price and sugar, Research objectives 3 and 4 are included in this section, as
these were factored into the objective, whereby respondents were asked did they notice
the price, which also had no effect on behaviour. Johnson, Herrman and Bauer (1999) in
their empirical results revealed that, when purchasing items in a bundle, mental accounting
affects the decision. A possible explanation to consumers not being aware of price may be
affected by the offers that are available in stores, such as a 2 for €x offer, or as part of a
meal deal offering. When compiled with the factors, including thinking about sugar,
awareness of sugar, and looking at the label, all these factors did not have an influence on
shifting behaviour.
Page 81
70
This study contrasted with the research shows that consumers are shift behaviour from
SSD’s into ASBs to reduce sugar intake (Borges, 2017, Finkelstein, 2016). A possible reason
is the manufacturers’ response to sugar tax by reformulating sugar drinks to either a non-
sugar format or to a drink that would be under the grams per 100ml, to minimise the
increase in price (Borges, 2017; Cobiac, 2017; Gornell, 2015). More research is needed to
better understand Irish consumers shift into ASBs over the last 10 years since manufactures
started to reformulate beverages.
The final objective was to determine if the perceptions of the total sugar content of
beverages are accurate, to see if it can be determined that Irish consumers are aware of
sugar intake when buying beverages. The reason for undertaking this different approach
was due to the gap in the research and the researcher’s interest in consumer behaviour.
The major finding in this objective is that Irish consumers are significantly incorrect
regarding sugar content in beverages. Nearly three quarters (68%) of perceptions of sugar
content were incorrect, and only 28% of answers were correct. It is almost certain that Irish
consumers purchase beverages with an incorrect presumed sugar content. This has major
implications for substitutions in relation to the sugar tax. The sugar tax was introduced to
shift consumers from SSD’s into more healthier beverages, but if consumers do shift
behaviour to a beverage that is not an ASB, they could be consuming more sugar from a
non-taxed product content, thus, it is possible that the sugar tax is failing in its purpose.
Detailed examination of substitutions by Hendrikesn et al. (2011) found that substituting
to ASBs has beneficial effects on BMI and a reduction in health issues. There is a lack of
research into substitution to other beverages. Further investigation and experimentation
into perceptions of sugar content should be undertaken, as this may lead to a broadening
of the sugar tax, or the introduction of traffic light labelling as mentioned earlier. This may
help Irish consumers make a more informed decision as to their consumption of sugar.
Implications and recommendations for Governments
The Government should consider that the tax is a regressive sin tax, with evidence provided
to show that consumers are not making an informed decision about sugar content, thus
the tax may in fact be inappropriate. When introducing a new tax to improve health, more
information should be disseminated to consumers, as this might shift behaviour before the
Page 82
71
tax is implemented. Should the Government decide to effectively challenge the obesity
epidemic in Ireland, there are other areas to consider. There is sugar in cookies, ice cream,
chocolate, sweetened iced tea, jams, jellies, and breakfast cereals and also in peanut
butter, salad dressing, ketchup, barbecue sauces, canned soups, processed meats bacon,
hot gods, crisps, roasted peanuts, pasta sauces, tinned tomatoes and bread. These areas
are not impacted by a sugar tax. The last item, ‘Bread’, has a high amount of sugar and is
purchased by over 70% of Irish consumers each week (Bordbia, 2014). It is possible that
bread has a higher calorific intake than soft drinks, which is only at 3%, therefore, it can be
concluded that the taxation on sugar sweetened tax is a regressive tax on Irish consumers.
Successes and Limitations
Successes
(a) Meeting all the research objectives and sub objectives.
(b) Establishing that ‘price’ is not a significant factor when buying soft drinks.
(c) Establishing that ‘sugar content’ of soft drinks does not affect buying behaviour.
(d) Has provided evidence that Irish consumers’ perceptions on sugar content of
beverages is extremely inaccurate.
(e) The research and findings has set out interesting questions for policy makers to
consider when introducing regressive taxes or health measures to shift behaviour
(f) Has provided reliable and robust evidence on Irish consumer behaviour for the food
and drink industry.
Limitations
There were some limitations to the study that have been highlighted previously,
(a) The sample size was small. The 117 completed surveys did ensure robust and
reliable data, but a larger sample size would be more nationally representative.
(b) Limited respondents in the 18 to 24 age group. This cohort consume a significant
amount of soft drinks, thus, a study of this age group alone requires additional
research.
(c) A more longitudinal study, gathered with scan track data from the leading
supermarkets, could have enriched the findings further.
Page 83
72
(d) Qualtrics software provided an excellent easy to manage online questionnaire
platform, which allowed for easy access and completion by respondents. An issue
occurred when gathering the data, as the account was a trial account, this meant
the data could not be extracted to be analysed in SPSS. Only for the National College
of Ireland having a subscription, the researcher would have been required to collect
data again.
Recommendations for further study
As a result of this study, there are a wide number of areas that can be further explored in
order to increase the knowledge and theory related to consumer behaviour, price,
implementation of taxes on sugar soft drinks, consumers’ perceptions of sugar in
beverages, and substitute products. It is also suggested that the area of substitution of
beverages be considered for future study, as this impacts on how consumers behave if they
are to shift to an alternative beverage, as they could shift to a perceived healthier drink and
consume more calories than expected. It was not expected to get findings to indicate that
Irish consumers had not shifted their buying behaviour regarding soft drinks. Therefore,
further research should be carried out. The most important limitation lies in the fact that
the study did not include 13 to 17-year olds in the study, and that the next age group of 25
to 34 only gathered a small number of respondents, which must be considered, as both age
cohorts disproportionately consume more sugar sweetened beverages than other age
groups. Therefore, further research is needed to account for these age groups and
consumption behaviour. The current investigation was limited by time, thus it is
recommended that further research be undertaken to include longitudinal and a scan track
study of soft drinks to understand behaviour over a longer period, on a national scale, and
with the scan track data from the market supporting the findings.
Page 84
73
Conclusion
In conclusion, a study into the introduction of a tax on sugar sweetened soft drinks is
extensive, diverse, and extremely interesting when all variables are considered. The
research has found that, since the introduction of a tax on sugar sweetened soft drinks,
there has been no shift in behaviour for Irish consumers. Price and sugar content, among
the many variables tested in the research did not have an impact on behaviour. A limitation
to this study is that the tax is still relatively new, having only being introduced in May 2018.
Therefore, it has been highlighted that a broader research project should be undertaken.
The findings from this study make several contributions to the current literature. Firstly,
that Irish consumers are not affected by the tax on sugar sweetened soft drinks, secondly,
that many factors such as and including price and sugar content do not have an influence
on buying behaviour. Finally, Irish consumers are unable to make informed decisions based
on their perceptions of sugar content when it comes to buying beverages. These findings
are extremely important for governments and policy makers, as introductions of taxes to
impact on behaviour need to be fully understood to be effective in their purpose. For the
food and drink industry, these findings may assist as governments battle to overcome the
obesity crisis with new product developments.
Page 85
74
References
Adams, A and Cox, A. L. (2008). Questionnaires, in-depth interviews and focus groups. In:
Cairns, Research Methods for Human Computer Interaction. Cambridge, UK:
Cambridge University Press, pp. 17–34
Adams, G. and Schvaneveldt, J. (1991), Understanding Research Methods (2nd edition).
New York: Longman.
Afshin, A., Penalvo, J.L., Del Gobbo, L., Silva, J., Michaelson, M., O’Flaherty, M., Capewell.,
Spiegelman, D., Danaei, G., Mozaffarian, D. (2017) The prospective impact of food
pricing on improving dietary consumption: A systematic review and meta-
analysis’. PLoS One Vol 12 Issue 3.
Ajzen I. (1991) The theory of planned behavior. Organ Behavior Human Decision Process.
Issue 50: pp. 179–211.
Allender, W. J. and Richards, T. J. (2012) ‘Brand Loyalty and Price Promotion Strategies: An
Empirical Analysis’, Journal of Retailing, Vol 88 Issue 3, pp. 323–342.
American Medical Association Council on Foods and Nutrition. (1942) ‘Some nutritional
aspects of sugar, candy, and sweetened carbonated beverages’. JAMA. 1942; Vol
120 pp. 763–765.
Andreyeva, T., Chaloupka, F. J. and Brownell, K. D. (2011) ‘Estimating the potential of taxes
on sugar-sweetened beverages to reduce consumption and generate revenue’,
Preventive Medicine, Vol 52 Issue 6, pp. 413–416.
Avena, N. M., Rada, P. and Hoebel, B. G. (2008) ‘Evidence for sugar addiction: Behavioral
and neurochemical effects of intermittent, excessive sugar intake’, Neuroscience
and Biobehavioural Reviews, pp. 20–39.
Baker, T.L. (1994), Doing Social research (2nd Edition.), New York: McGraw-Hill Inc.
Basu, S., McKee, M., Galea, G., and Stuckler, D. (2013) ‘Relationship of soft drink
consumption to global overweight, obesity, and diabetes: A cross-national analysis
of 75 countries’, American Journal of Public Health, Vol 103 Issue 11, pp. 2071–
2077.
Page 86
75
Besley, T.J., Rosen., H. S., (1998) ‘Sales Taxes and Prices: An Empirical Analysis’ National Tax
Journal. Vol 52, Issue 2. Pp 157-178
Bird, D.K. (2009), ‘The use of questionnaires for acquiring information on public perception
of natural hazards and risk mitigation – a review of current knowledge and
practice. Natural Hazards and Earth System Sciences. Vol 9, pp 1307-1325.
Blocker Jnr, Jack, S. (2006) ‘Alcohol Prohibition as a Public Health Innovation’, American
Journal of Public Health, 96(2), pp. 233–244
Blumberg, B., Cooper, D. R. and Schindler, S. (2011) ‘Business Research Methods’. 3rd
edition. Berkshire: McGraw-Hill Education.
BordBia, (2018) Category Snapshot: Non-Alcoholic Beverages [Online} Available
at:http://www.bordbiavantage.ie/market-information/sector-
overviews/beverages/non-alcoholic-beverages/ [Accessed 20 June 2018]
Bordbia, (2017), ‘Irish and British Consumers and their Food,’ [Online] Available at;
https://www.bordbia.ie/industry/manufacturers/insight/publications/bbreports/
PERIscope6/PERIscope2017/Bord%20Bia%20Periscope%202017%20-
%20Irish%20and%20British%20Full%20Report.pdf [Accessed 15th Feb 2018]
Bordbia, (2014) [Online] Available at;
https://www.bordbia.ie/industry/manufacturers/insight/publications/bbreports/
Documents/Consumer%20Bakery%20Research.pdf [Accessed 10th August 2018]
Borges, M. C, Louzada, M. M, Herick de Sa, T, Laverty, A. A, Parra, D.C. (2017) ‘Artificially
Sweetened Beverages and the Response to the Global Obesity Crisis’, PLoS
Medicine, Issue 14 Vol 1, pp. 1–10.
Briggs, A. D., Mytton, O. T., Madden, D., O'Shea, D., Rayner, M. and Scarborough, P. (2013)
‘The potential impact on obesity of a 10% tax on sugar-sweetened beverages in
Ireland, an effect assessment modelling study’, BMC public health, Vol 13, p. 860.
Bulmer, M. (2004), Questionnaires. 1st Edition, London, Sage Publications
Central Statistics Office (2017) ‘The wellbeing of the nation’ [Online] Available at:
https://www.cso.ie/en/releasesandpublications/ep/p-
wbn/thewellbeingofthenation2017/hlt/ [Accessed on 4th April 2018]
Page 87
76
Central Statistics Office (2016) ‘Census 2016 Summary Results - Part 1’ [Online] Available
at:https://www.cso.ie/en/media/csoie/newsevents/documents/census2016sum
maryresultspart1/Census2016SummaryPart1.pdf [Accessed on 10th May 2018]
Central Statistics Office (2015) ‘System of Health Accounts’ [Online 2015] Available at:
https://www.cso.ie/en/releasesandpublications/er/sha/systemofhealthaccounts
2015/ [Accessed on 5th July 2018]
CDC (1999) ‘Ten great public health achievements - United States, 1900-1999’, Journal of
the American Medical Association, Vol 60 Issue 19 p.619-623.
Cobiac, L. J., Tam, K., Veerman, L. and Blakely, T. (2017) ‘Taxes and Subsidies for Improving
Diet and Population Health in Australia: A Cost- Effectiveness Modelling Study’,
PLOS Medicine. Vol 14 Issue 2 pp. 1–19.
Colantuoni, F. and Rojas, C. (2015) ‘The Impact of Soda Sales Taxes on Consumption:
Evidence from Scanner Data’, Contemporary Economic Policy, Vol 33 Issue 4, pp.
714–734.
Colchero, M.M, Guerreoro-Lopez, C.M, Molina, M, and Rivera, J.A.(2016) ‘Beverages Sales
in Mexico before and after Implementation of a Sugar Sweetened Beverage Tax’
PLOS ONE. Vol 11 Issue 9.
Connor, A. (2015) ‘Coca-Cola Funds Scientists Who Shift Blame for Obesity Away from Bad
Diets - The New York Times’, New York Times, pp. 1–7. [Online] Available at:
http://well.blogs.nytimes.com/2015/08/09/coca-cola-funds-scientists-who-shift-
blame-for-obesity-away-from-bad-diets/?_r=0. [Accessed on 12th Dec 2017]
Conway, B. N., Han, X., Munro, H. M., Gross, A. L., Shu, X., Hargreaves, M. K., Zheng, W.,
Powers, A. C. and Blot, W. J. (2018) ‘The obesity epidemic and rising diabetes
incidence in a low-income racially diverse southern US cohort’, PLoS ONE, Vol 13
Issue 1.
Costa, (2018) ‘How to read the data’ [Online] Available at: https://www.costa.co.uk/how-
to-read-the-data. [Accessed on 5th Jan 2018]
Couch, K. (2011), ‘Introduction: Health Policy and sugar-sweetened beverages’ Journal of
Policy Analysis and Management. Vol 30 Issue 3, pp. 644-645.
Page 88
77
Creswell, J. W. (2003) Research Design: Qualitative, Quantitative and Mixed Methods
Approaches, 2nd edition, California, Sage Publications,.
Creighton, R. (2010) ‘Fat Taxes: The newest manifestation of the age-old excise tax’,
Journal of Legal Medicine, Vol 31 Issue 1, pp. 123–136.
Cummings M.K, Proctor R, N. The Changing Public Image of Smoking in the United States:
1964–2014. Cancer epidemiology, biomarkers & prevention: a publication of the
American Association for Cancer Research, cosponsored by the American Society
of Preventive Oncology. 2014;23(1):32-36.
Curtin, R., Presser, S., & Singer, E. (2000). ‘The effects of response rate changes on the index
of consumer sentiment.’ Public Opinion Quarterly Vol 64: 413–428.
Degeratu, A. M., Rangaswamy, A. and Wu, J. (2000) ‘Consumer choice behaviour in online
and traditional supermarkets: The effects of brand name, price, and other search
attributes’, International Journal of Research in Marketing, Vol 17 Issue 1, pp. 55–
78.
Dept. of Finance (2017) ‘Sugar sweetened drinks tax – Information note – Budget 2018
[Online] Available at :
http://www.budget.gov.ie/Budgets/2018/Documents/Sugar%20Sweetened%20
Drinks%20Tax.pdf [Accessed 10th August 2018]
Dept. of Finance (2017) Sugar-Sweetened Drinks Tax, Information Note – Budget 2018
[Online] Available at:
http://www.budget.gov.ie/Budgets/2018/Documents/Sugar%20Sweetened% 20
Drinks% 20Tax.pdf [Accessed 22nd March 2018]
Dept. of Finance (2017), ‘SSD Tax. All cost, No Benefit. An Irish Beverage Council response
to the Sugar-Sweetened Drinks Tax Public Consultation’ [Online] Available at:
https://www.finance.gov.ie/wp-content/uploads/2017/09/Irish-Beverage-
Council.pdf [Accessed on 05th June 2018]
Dept. of Health, (2015) ‘A healthy weight for Ireland, Obesity Policy and Action Plan’.
[Online] Available at: https://health.gov.ie/wp-content/uploads/2016/09/A-
Healthy-Weight-for-Ireland-Obesity-Policy-and-Action-Plan-2016-2025.pdf
[Accessed 8th July 2018]
Page 89
78
Dept. of Health, (2013) ‘A framework for Improved health and wellbeing 2013-2025’
[Online] Available at: https://health.gov.ie/blog/publications/healthy-ireland-a-
framework-for-improved-health-and-wellbeing-2013-2025/ [Accessed 4th April
2018]
Dept. of Health, (2009) Report of Inter-sectoral Group on the Implementation of the
Recommendations of the National Task Force on Obesity [Online] Available at:
https://health.gov.ie/blog/publications/report-of-inter-sectoral-group-on-the-
implementation-of-the-recommendations-of-the-national-task-force-on-obesity
[Accessed 8th July 2018]
Dillman, D. A. (2007). Mail and Internet surveys: The total design method for surveys. 2nd
Edition New York, Wiley.
Domegan, C., & Fleming, D. (2007). Marketing Research in Ireland - Theory and Practice,
3rd Ed, Dublin, Gill and MacMillan Ltd.
Drenkard, B. S. (2013) ‘The Evidence on Sugar & Snack Taxes’, Journal of State Taxation,
Vol 2006, pp. 2011–2014.
Escoto, K. H., Laska, M. N., Larson, N., Neumark-Sztainer, D., & Hannan, P. J. (2012). ‘Work
Hours and Perceived Time Barriers to Healthful Eating Among Young Adults’.
American Journal of Health Behaviour, Vol 36 Issue 6, pp 786–796.
Ezzati, M., VanderHoorn, S., Lawes, M.M.C., Leach, R., James, P.J.W., Lopez, A.D., Rogers,
A., Murray, C.J.L. (2005) ‘Rethinking the “diseases of affluence” paradigm: Global
patterns of nutritional risks in relation to economic development’, PLoS Medicine,
Vol 2 Issue 5, pp. 0404–0412.
Falbe, J. and Madsen, K. (2017) ‘Growing momentum for sugar-sweetened beverage
campaigns and policies: Costs and considerations’, American Journal of Public
Health, Vol 107 Issue 6, pp. 835–838.
Fessenden, B. H. (2016) ‘Pricing Vice’, EconFocus Issue 2Q pp. 11–16.
Finkelstein, E. A., Zhen, C., Bilger, M., Nonnemaker, J., Farooqui, A. M., Todd, J. E. (2013)
‘Implications of a sugar-sweetened beverage (SSB) tax when substitutions to non-
Page 90
79
beverage items are considered’, Journal of Health Economics, Vol 32 Issue 1 pp.
219–239.
Fleischer, V. (2015) ‘Curb Your Enthusiasm for Pigovian Taxes.’, Vanderbilt Law Review,
Vol 68 Issue 6, pp. 1673–1713.
Fletcher, J. M., Frisvold, D. and Tefft, N. (2010) ‘Can soft drink taxes reduce population
weight?’, Contemporary Economic Policy, Vol 28 Issue 1, pp. 23–35.
Foddy, W.H. (1994) Constructing Questions for Interviews and Questionnaires: Theory
and Practice in Social Research. New Edition, Cambridge University Press,
Cambridge, UK.
Gearhardt, A. N., Grilo, C.M., Dileone, R.J., Brownell, K. D., Potenza, M. N. (2011) ‘The
addiction potential of hyperpalatable foods.’, Current drug abuse reviews, Vol 4
Issue 3, pp. 140–5.
Globaldata, (2018), ‘Consumer Global Data’ [Online] Available at:
https://consumer.globaldata.com/Analyser?catalog=Soft%20Drinks&cube=Soft%
20Drinks:%20Insights%20-
%20Company%20Volume%20with%201%20year%20Category%20Forecast
[Accessed May 14, 2018]
Godin, G. and Kok, G. (1996) ‘The Theory of Planned Behavior: a review of its application to
health–related behaviors’. American Journal of Health Promotion, Vol 11, pp 87–
98.
Gornall, J. (2015) ‘Sugar: Spinning a web of influence’, BMJ (Online), Vol 350.
Gustavsen, G. W. and Rickertsen, K. (2011) ‘The effects of taxes on purchases of sugar-
sweetened carbonated soft drinks: A quantile regression approach’, Applied
Economics, Vol 43 Issue 6, pp. 707–716.
Hawkes, C. (2006) ‘Uneven dietary development: linking the policies and processes of
globalization with the nutrition transition, obesity and diet-related chronic
diseases’, Globalization and Health, Vol 2 Issue 1, p. 4.
Hendriksen, M. A. and Tijhuis, M. J. (2011) ‘Impact of substituting added sugar in
carbonated soft drinks by intense sweeteners in young adults in the Netherlands:
Page 91
80
example of a benefit – risk approach’, European Journal of Nutrition Vol 50 Issue
1 pp. 41–51.
Hoffer, A., Gvillo, R., Shughart, W. and Thomas, M (2017) ‘Income-expenditure elasticities
of less-healthy consumption goods’, Journal of Entrepreneurship and Public Policy,
Vol. 6 Issue: 1, pp.127-148
Holmes Perkins, R. (2014) ‘Salience and Sin: Designing Taxes in the New Sin Era.’, Brigham
Young University Law Review, 2014(1), pp. 143–184.
Hooley, G.J., Shipley, D., Krieger, N. (1988) ‘A Method for modelling consumer perceptions
of country of origin.’ International Marketing Review. Vol 5, Issue 3 pp 67-76
Jacobson MF. Liquid candy: how soft drinks are harming Americans’ health. [Online]
Available at:
http://www.cspinet.net/new/pdf/liquid_candy_final_w_new_supplement.pdf.
[Accessed June 10, 2018]
Jacobson, M. F. and Brownell, K. D. (2000) ‘Small taxes on soft drinks and snack foods to
promote health’, American Journal of Public Health, pp. 854–857
Jankowicz, A.D. (2005), Business Research Projects, 4th edition., Stamford, Cengage
Learning.
Johnston, A. (2014) "Rigour in research: theory in the research approach", European
Business Review, Vol. 26 Issue: 3, pp.206-217
Johnson, M.D., Hermann, A. and Bauer, H.H. (1999), ‘The effects of Price Bundling on
Consumer Evaluations of Product Offerings’. School of Hotel Administration
Collection Vol 6.
Kassem, N, O., Lee, J. W., Modeste, N. N., Johnston, P. K., Understanding soft drink
consumption among female adolescents using the Theory of Planned Behavior,
Health Education Research, Vol 18, Issue 3, Pages 278–291
Kothari, C. R. (2004) ‘Research Methodology, Methods and Techniques 2nd Edition. New
Delhi, New Age International.
Page 92
81
Labrecque, J. and Charlebois, S. (2011) ‘Functional foods: An empirical study on perceived
health benefits in relation to pre-purchase intentions’, Nutrition & Food Science,
41(5), pp. 308–318.
Lenoir, M., Serre, F., Cantin, L. and Ahmed, S. H. (2007) ‘Intense Sweetness Surpasses
Cocaine Reward’, PLoS One, .Vol 13 Issue 1.
Liu, M., & Wronski, L. (2017). ‘Examining completion rates in web surveys via over 25,000
real-world surveys.’ Social Science Computer Review. Vol 36, Issue 1, pp 116-124
Liu, F., (2018) ‘Sin Taxes; Have Governments gone too far in their efforts to monetize
morality’ Boston College Law Review, Vol 59 Issue 2
Malhotra, N. K., Birks, D. F. and Wills, P. (2012) Marketing Research: An Applied Approach,
Marketing Research. 3rd Edition, Essex, Pearson Education.
Mancini, P., Marotta, G., Nazzaro, C., Simonetti, B (2015) ‘Consumer behaviour, obesity and
social costs. The case of Italy’. International Journal of Business and Society. Vol
15, Issue 2, pp 295 -324
Manyema, M., Veerman, L. J., Chola, L., Tugendhaft, A., Sartorius, B., Labadarios, D. and
Hofman, K. J. (2014) ‘The potential impact of a 20% tax on sugar-sweetened
beverages on obesity in South African adults: A mathematical model’, PLoS ONE,
Vol 9 Issue 8.
Mattoon, R. H., Wetmore, S. and Federation, C. (2015) ‘Sin taxes: The sobering fiscal
reality’, Chicago Fed Letter, Issue 339.
McGivern, Y. (2013) The practice of market research. 3rd edition: Harlow, Prentice Hall
Miljkovic, D. (2006). Obesity: Health and Food Policy Dilemma. Choices, Vol 21, Issue 1. Pp.
37-40
Morse, R. E. (2009) ‘Resisting the Path of Least Resistance: Why the Texas “Pole Tax” and
the New Class of Modern Sin Taxes Are Bad Policy’, Boston College Third World
Law Journal, Vol 29 Issue 1, p. 189.
Nakhimovsky, S. S., Feigl, A. B., Avila, C., O'Sullivan, G., MacGregor-Skinnner, E. and
Spranca, M. (2016) ‘Taxes on sugar-sweetened beverages to reduce overweight
Page 93
82
and obesity in middle-income countries: A systematic review’, PLoS ONE. Vol 11
Issue 1, pp. 1 – 22.
O’ Donoghue, T. and Rabin, M. (2006) ‘Optimal sin taxes’, Journal of Public Economics, Vol
90 (10–11), pp. 1825–1849.
O’Dowd, A. (2015) ‘Health committee backs sugar tax on soft drinks in fight against child
obesity’, BMJ (Clinical research ed.), p. h6453.
O'Reilly, L (2011), 'BEVERAGES: Impulse overtakes multiples in growth of soft drink sales',
Corporate Adviser (Online Edition), p. 5, Business Source Complete, EBSCOhost.
Philipson, T., and R. Posner. (2003) ‘The Long Run Growth of Obesity as a Function of
Technological Change’ Perspectives in Biology and Medicine, Issue 46, Vol 3 PP 87-
108.
Powell, L. M., Chriqui, J.F., Khan, T., Wada, R., Chaloupka, F. J. (2013) ‘Assessing the
potential effectiveness of food and beverage taxes and subsidies for improving
public health: A systematic review of prices, demand and body weight outcomes’,
Obesity Reviews, Vol 14 Issue 2, pp. 110–128
Powell, L. M., Chaloupka, F. J. (2009) ‘Food Prices and Obesity: Evidence and Policy
Implications for Taxes and Subsidies’ Millbank Quarterly Vol 87, Issue 1 pp 229-
257
Pulligadda, S., Kardes, F. R. and Cronley, M. L. (2016) ‘Positive affectivity as a predictor of
consumers’ propensity to be brand loyal’, Journal of Brand Management, Vol 23
Issue 2, pp. 216–228
Polit, D.F., Beck, C.T. and Hungler, B.P. (2001), Essentials of Nursing Research: Methods,
Appraisal and Utilization. 5th Ed., Philadelphia: Lippincott Williams & Wilkins
Porter, S. R. (2004), ‘Raising response rates: What works? New Directions for Institutional
Research’, Issue 121, pp 5-21.
Quinlan, C. (2011), Business Research Methods, Andover, Hampshire, Southwestern
Cengage Learning.
Runge, C. F., Johnson, J and Runge, C. P. (2011) ‘Better Milk than Cola: Soft Drink Taxes
and Substitution Effects’, Choices, Vol 26, Issue 3.
Page 94
83
Safefood, (2018), ‘The facts about sugar drinks’ [Online] Available at:
https://www.safefood.eu/Start/Your-Tools/Sugary-Drinks-Infographic.aspx
[Accessed on 5th Jan 2018]
Saleh, A and Krishna, B (2017), ‘Examining Factors impacting online survey response rates
in educational research; Perceptions of Graduate Students.’ Journal of
Multidisciplinary Evaluation. Vol 13 Issue 29, pp 63-74
Salois, M. J. and Reilly, A. (2014) ‘Consumer response to perceived value and generic
advertising’, Agricultural and Resource Economics Review, Vol 43 Issue 1 , pp. 17–
30.
Saunders, M., Lewis, P. and Thornhill, A. (2015), Research methods for business students,
7th edition., New York, Pearson.
Saunders, M., Lewis, P., & Thornhill, A. (2012), Research methods for business students,
6th edition., UK, Pearson.
Saunders, M., Lewis, P., & Thornhill, A. (2009), Research methods for business students,
5th ed., UK, Pearson.
Scully, M., Morley, B., Niven, P., Crawford, D., Pratt, I., and Wakefield, M. (2017). Factors
associated with high consumption of soft drinks among Australian secondary-
school students. Public Health Nutrition, Vol 20 Issue 13
Serota, K. B., Levine, T. R. and Boster, F. J. (2010) ‘The prevalence of lying in America: Three
studies of self-reported lies’, Human Communication Research, Vol 36 Issue 1, pp.
2–25.
Sharma, A., Hauch, K., Hollingsworth, B and Siciliani, L. (2014) ‘The effects of taxing sugar-
sweetened beverages across different income groups’, Health Economics Journal.
Vol 12, Issue 9. Pp. 1159-84
Shemilt, I., Hollands, G., Marteau, T. M., Nakamura, R., Jebb, S.A and Kelly, M.P.(2013)
‘Economic Instruments for Population Diet and Physical Activity Behaviour
Change: A Systematic Scoping Review’. PLoS ONE Vol 8 Issue 9.
Page 95
84
Shrestha, V. and Markowitz, S. (2016) ‘The Pass-Through of Beer Taxes To Prices:
Evidence From State and Federal Tax Changes’, Economic Inquiry, Vol 54 Issue 4,
pp. 1946–1962.
Singh, G.M., Renata, M., Khatibzadeh, S., Lim, S., Ezzati, M., Mozaffarian, D. (2016)
‘Estimated Global, Regional, and National Disease Burdens Related to Sugar-
Sweetened Beverage Consumption in 2010’, PMC, 132(8), pp. 639–666
Swithers, S. E. (2016) ‘Not-so-healthy sugar substitutes?’, Current Opinion in Behavioral
Sciences, pp. 106–110.
Tandel, K. (2011) ‘Sugar substitutes: Health controversy over perceived benefits’, Journal
of Pharmacology and Pharmacotherapeutics, Vol 2 Issue 4, p. 236.
Taylor, A. L., Parento, E. W. and Schmidt, L. A. (2015) ‘The Increasing Weight of Regulation:
Countries Combat the Global Obesity Epidemic’, Indiana Law Journal. Issue 1, Vol
90.
The Guardian, (2018), [Online] Available at:
https://www.theguardian.com/society/2018/jan/05/coca-cola-to-sell-smaller-
bottles-at-higher-prices-in-response-to-sugar-tax, [Accessed on 12th August
2018]
Trivedi, B. (2010) ‘Junkie food: Addicted to sugar’, New Scientist, 207(2776), pp. 38–41
Westwater, M. L., Fletcher, P. C. and Ziauddeen, H. (2016) ‘Sugar addiction: the state of the
science’, European Journal of Nutrition, pp. 55–69.
World Health Organisation (2018) ‘Obesity and Overweight’ [Online] Available at:
http://www.who.int/news-room/fact-sheets/detail/obesity-and-overweight
[Accessed: 18th March 2018].
World Health Organisation (2017) Obesity and Overweight, Obesity Factsheet. [Online]
Available at: http://www.who.int/mediacentre/factsheets/fs311/en/ [Accessed:
12 January 2018].
World Health Organisation (2015) ‘The challenge of obesity - quick statistics, World Health
Organisation.’ [Online] Available at: http://www.euro.who.int/en/health-
Page 96
85
topics/noncommunicable-diseases/obesity/data-and-statistics [Accessed: 2nd
December 2017].
World Health Organisation (2000) ‘Obesity: preventing and managing the global
epidemic’ [Online] Available at:
http://www.who.int/nutrition/publications/obesity/WHO_TRS_894/en/
[Accessed: 2nd August 2018]
Wright, A., Smith, K. E. and Hellowell, M. (2017) ‘Policy lessons from health taxes: a
systematic review of empirical studies’, BMC Public Health pp. 1–15.
Zheng, M., Allman-Farinelli, M., Heitmann, B. L. and Rangan. A. (2015) ‘Substitution of
Sugar-Sweetened Beverages with Other Beverage Alternatives: A Review of Long-
Term Health Outcomes’, Journal of the Academy of Nutrition and Dietetics, Vol 115
Issue 5, pp. 767–779.
Zoellner, J., Krzeski, E., Harden, S., Cook, E., Allen, K., & Estabrooks, P. A. (2012). Qualitative
Application of the Theory of Planned Behavior to Understand Beverage Behaviors
among Adults. Journal of the Academy of Nutrition and Dietetics, Vol 112 Issue 11,
1774–1784.
Page 97
86
Appendices
Appendix 1 - Online Questionnaire – Word
Page 107
96
Appendix 2 - Online Questionnaire - Qualtrics
Page 108
97
National College of Ireland
Research Students Declaration Form
(Thesis/Author Declaration Form)
Name: Simon O’Connor
Student Number: 16121732
Degree for which thesis is submitted: MSc in Management
Material submitted for award
(a) I declare that the work has been composed by myself.
(b) I declare that all verbatim extracts contained in the thesis have been
distinguished by quotation marks and the sources of information
specifically acknowledged.
(c) My thesis will be included in electronic format in the College
Institutional Repository TRAP (thesis reports and projects)
(d) Either *I declare that no material contained in the thesis has been used
in any other submission for an academic award.
Or *I declare that the following material contained in the thesis formed
part of a submission for the award of
Master of Science in Management
Signature of research student: _______________________________
Date: _____________________
Page 109
98
Submission of Thesis to Norma Smurfit Library, National College of Ireland
Student name: ______________________________
Student number: ____________________________
School: ____________________________________
Course: ____________________________________
Degree to be awarded: MSc. in Management
Title of Thesis: ‘An Investigation into the introduction of a tax on sugar sweetened soft
drinks in Ireland and its impact on consumers buying behaviour.’