California State University, San Bernardino California State University, San Bernardino CSUSB ScholarWorks CSUSB ScholarWorks Electronic Theses, Projects, and Dissertations Office of Graduate Studies 6-2020 ASSESSING STUDENT UNDERSTANDING WHILE SOLVING ASSESSING STUDENT UNDERSTANDING WHILE SOLVING LINEAR EQUATIONS USING FLOWCHARTS AND ALGEBRAIC LINEAR EQUATIONS USING FLOWCHARTS AND ALGEBRAIC METHODS METHODS Edima Umanah Follow this and additional works at: https://scholarworks.lib.csusb.edu/etd Part of the Algebra Commons Recommended Citation Recommended Citation Umanah, Edima, "ASSESSING STUDENT UNDERSTANDING WHILE SOLVING LINEAR EQUATIONS USING FLOWCHARTS AND ALGEBRAIC METHODS" (2020). Electronic Theses, Projects, and Dissertations. 1088. https://scholarworks.lib.csusb.edu/etd/1088 This Thesis is brought to you for free and open access by the Office of Graduate Studies at CSUSB ScholarWorks. It has been accepted for inclusion in Electronic Theses, Projects, and Dissertations by an authorized administrator of CSUSB ScholarWorks. For more information, please contact [email protected].
Transcript
California State University, San Bernardino California State University, San Bernardino
CSUSB ScholarWorks CSUSB ScholarWorks
Electronic Theses, Projects, and Dissertations Office of Graduate Studies
6-2020
ASSESSING STUDENT UNDERSTANDING WHILE SOLVING ASSESSING STUDENT UNDERSTANDING WHILE SOLVING
LINEAR EQUATIONS USING FLOWCHARTS AND ALGEBRAIC LINEAR EQUATIONS USING FLOWCHARTS AND ALGEBRAIC
METHODS METHODS
Edima Umanah
Follow this and additional works at: https://scholarworks.lib.csusb.edu/etd
Part of the Algebra Commons
Recommended Citation Recommended Citation Umanah, Edima, "ASSESSING STUDENT UNDERSTANDING WHILE SOLVING LINEAR EQUATIONS USING FLOWCHARTS AND ALGEBRAIC METHODS" (2020). Electronic Theses, Projects, and Dissertations. 1088. https://scholarworks.lib.csusb.edu/etd/1088
This Thesis is brought to you for free and open access by the Office of Graduate Studies at CSUSB ScholarWorks. It has been accepted for inclusion in Electronic Theses, Projects, and Dissertations by an authorized administrator of CSUSB ScholarWorks. For more information, please contact [email protected].
Table 18. Summary of Post- Assessment Analysis Overview for each Item .……………………….…………………………..31 Table 19. Pre-Test Participant Data for Items 1-4 ……………………………………………………………………...……34
ix
Table 20. Pre-Test Participant Data for Items 5-8 ………………..………………………………………..………….……35
Table 21. Post-Test Participant Data for Items 1-4 …………………………………………………………….……….……36
Table 22. Post-Test Participant Data for Items 5-8 …………………….………………………………………….…………37
Table 23. Change from Pre-Test to Post-Test Participant Data……………………………………….……….…………38
x
LIST OF FIGURES
Figure 1. The DO Strategy ……………………………..……………………………12
Figure 2. The UNDO Strategy .............................................................................12
1
CHAPTER ONE
INTRODUCTION
Background
Multiple representations refer to different ways of describing or
symbolizing a single mathematical idea: verbally, visually, numerically or
symbolically. These representations can be used to develop, communicate, and
understand different aspects or properties of a mathematical solution, object, or
operation. They may include a wide range of thinking tools for problem solving in
mathematics including graphs, diagrams, tables, grids, formulas, symbols, words,
and pictures.
The intent of teaching multiple representations is to improve students’
knowledge and proficiency and flexibility in solving a variety of mathematical
problems. In this paper, we will focus on solving linear equations using diagrams.
In middle schools, teaching with multiple representations can support learning
new ideas. Solving linear equations using multiple representations will help
students to develop a deep understanding of multiple ways to see problems and
their solutions. This, in turn, builds flexible thinking when solving problems or
something like this in mathematics. Symbolic procedures alone are no longer
adequate to meet the demands of higher education. The flowchart method is also
an algebraic method that involves the use of inverse operations. Thus, various
models of teaching are needed in order to support different student learning
styles. In meeting the goals of the common core standards, teachers will need to
2
embrace strategies that will support those standards. In particular the Standards
for Mathematical Practice SMP 7 and SMP 1 require students to “look for and
make use of structure” and suggest that students should be able to represent a
problem in different ways. The use of multiple representations is one way in
which this standard could be supported. This will help learners to identify and
evaluate efficient strategies for a solution. In this case, the teacher might help the
students identify why using a “flowchart” to solve a linear equation is just as valid
as solving the linear equation “algebraically”. Moreover, students may begin to
understand why flowchart representations may be more useful in certain
scenarios.
Goal and Research Questions
The goal of this MAT project is to investigate student learning when
solving linear equations while using flow charts and algebraic representations to
effect positive changes in my teaching and in student learning. In doing so, I will
have the opportunity to extend existing professional development experiences to
meet my individual needs and the needs of my students.
Using multiple representations in solving algebraic linear equations should
enable all students to
• Create and use representations to organize, record, and communicate
mathematical ideas;
3
• Select, apply, and translate among mathematical representations to solve
algebraic problems;
• Use representations to model and interpret physical, social, and
mathematical phenomena (NCTM 2000, p. 67).
By using these representations, students will have the ability to select, apply, and
translate among different representations (Fried and Amit, 2004). Students will
learn how to solve algebraic equations with the use of graphs and diagrams
(flowcharts).
The representations are aimed at having students not only develop
proficiency in solving linear equations, but also develop a conceptual
understanding of the solution process. “The ways in which mathematical ideas
are represented is fundamental to how people can understand and use those
ideas. When students gain access to mathematical representations and the ideas
they represent, they have a set of tools that significantly expand their capacity to
think mathematically” (NCTM, 2000 p.67). The goal of this research is to
encourage students to express their ideas by providing tools that will allow them
to show how the process for solving linear algebraic equations makes sense to
them.
The following questions are addressed in this study:
• Does the introduction of multiple ways to think about linear equations lead
students to flexibly incorporate appropriate representations in solving
problems involving linear equations?
4
• Which representations do students use to solve linear equations and in
what context? How do students use representations when presented with
a specific task?
Significance
It is an instructional challenge for most teachers in middle and high
school to implement strategies for solving linear equations. This foundational
topic is frequently taught procedurally and students along with teachers believe
that this is the only way. It starts out with using the order of operations and then
students are taught either multiply/divide to isolate the variable. This may all
seem so simple for the teachers to teach using the procedural strategy but it has
created frenzy for most students to understand and apply it as a learning tool.
This procedure is presented in textbooks for teachers to replicate over and over
again.
In my experience while observing other teachers, they continue to use this
procedure year after year in the classroom because students may be confused
when they are taught more than one way. Teachers may not know how to show
multiple strategies on solving equations.
The same procedures are taught over and over again to students because
teachers believe that students will become confused and the textbooks teach
procedures that are outlined step by step without conceptual understanding. At
the elementary level, students begin solving equations in this form: n + 6 = 10.
Students are able to understand this equation. As the students progress through
5
the K-5 modules at the elementary level, the circles are replaced with variables
and it is a shift for students to become independent learners. In previous years
observations, some students struggle with when to add and subtract terms and
when they need to undo the operations. They also get stuck when they come to a
solution with a zero. For instance, 3x = 0. They aren’t confident about what to do
afterward. Students do not understand that the sequence of learning
mathematics in previous grades leads to an understanding of future topics in
mathematics unless teachers support them in transferring their learning to new
concepts. It is also essential for teachers to help students gain fluency with
procedures such as eliminating a fraction so that the work does not become
cumbersome in the end and they do not get frustrated. For instance, it helps to
have students read and write out the problem first. Three multiplied by x
decreased by 2 and divided by 4 or multiplied by one-fourth equals negative five.
With the written words, the students can construct a flow chart and solve the
above equation using Do/Undo order of operations. If students could improve
their fluency in working with expressions and equations through strategies like
the DO/UNDO flowcharts, it would greatly improve students’ opportunities to
succeed in secondary mathematics.
6
CHAPTER TWO
LITERATURE REVIEW
Introduction
Students often tend to stick to the standard strategy, even when they have
the freedom to use other strategies. Lack of strategy freedom can prevent
students from exploring alternative strategies on their own. Students that tend to
stick to known methods are less likely to think flexibly and discover more efficient
solution strategies for various situations. The same procedures are taught over
and over again to students because teachers believe that students will become
confused and the textbooks teach procedures that are outlined step by step
without conceptual understanding.
Benefits of Teaching with Multiple Strategies
Star (2005) suggests that there is a possible trade-off in the initial stages
of learning between the goal of the flexible use of multiple strategies and the goal
of mastery of a standard algorithm. Star and Rittle-Johnson (2008) showed that
prompting students to solve the same equation in different ways provides better
results on items measuring students’ strategic flexibility. By “student flexibility” we
refer to the practice of allowing students to pursue multiple solution strategies
within a given problem. (Waalkens, Aleven, and Taatgen 2013) asked the
question, “But does greater freedom mean that students learn more robustly?”
7
They developed three versions of the same Intelligent Tutoring System (ITS) for
solving linear algebraic equations that differed only in the amount of freedom
given to students. The three conditions are (a) strict standard strategy, (b) flexible
standard strategy and multi-strategy. The strict standard strategy adhered to a
specific standard strategy, while the other two versions (flexible and multi)
adhered to minor and major variations, respectively. According to Waalkens,
Aleven, and Taatgen, with both the strict and flexible strategies, all equations had
to be solved with a standard strategy that is widely used in American middle-
school mathematics textbooks. They claimed that this standard strategy can
solve almost all linear equations and is described as follows: First, use the
distributive law to expand any term in parentheses. Second, combine constant
terms and variable terms on each side of the equation. Third, move variable
terms to one side of the equation and constant terms to the other side. And
finally, divide both sides by the coefficient of the variable. The authors go on to
say that students had the most freedom in the multi-strategy method because
they could solve the linear equations with any strategy that progresses towards
the goal of arriving at a solution. For example, in the linear equation 2(x + 1) = 4,
students are allowed to divide both sides of the equation by 2 instead of using
the distributive law to expand the term in parentheses, a step that is required in
the two stricter methods. With the multi-strategy method, students have the most
freedom because they can solve the equations with any strategy that progresses
toward the goal of solving the equation. Waalkens, Aleven, and Taatgen’s study
8
concluded that ITS helped students improve their equation-solving skills.
However, allowing minor or major strategy variations did not make a difference in
learning gain, motivation, or perceived strategy freedom, compared to strictly
enforcing a standard strategy with which students were familiar, without allowing
any variations.
Benefit of Teaching Multiple Representations
Greeno and Hall mentioned
Forms of representation need not be taught as though they are ends in
themselves. Instead, they can be considered as useful tools for
constructing understanding and for communicating information and
understanding. If students simply complete assignments of constructing
representations in forms that are already specified, they do not have
opportunities to learn how to weigh the advantages and disadvantages of
different forms or representations or how to use those representations as
tools with which to build their conceptual understanding. (1997, p. 362)
They go on to say that representations enhance the problem-solving ability and
that students often construct representations in forms that help them see patterns
and perform calculations.
“The use of multiple representations with or without technology, is one of
the major topics in mathematics education that has gained importance in recent
decades” (Ozgun-Koca, 1998). The significance of representing the solution of
9
linear algebraic equations in multiple ways provides the same objective of more
than one form. It is necessary to see how students use these representations. It
is suggested that multiple representations provide an environment for students to
abstract and understand major concepts (McArthur et al.1998, Yerushalmy,
1991) while constructivist theory suggests that we need to understand students’
thinking processes in order to facilitate their learning in more empowering ways
(Stepphe, 1991). Understanding students’ thinking and their preferences while
choosing a representation type for solving algebraic linear algebraic equations
helps mathematics teachers gain insight into student thinking. Representations
such as the do/undo flow chart and algebraic method are tools that provide the
same information in more than one form. The role of these tools in the task
mentioned above is to represent solving linear algebraic equations using multiple
concretizations of a concept, mitigate certain difficulties and to make
mathematics more attractive and interesting (Ozgun-Koca, 98). Dienes’
mentioned that conceptual learning is maximized when children are exposed to a
mathematical concept through a variety of physical contexts or embodiments. In
other words, we should not expect that all students would perceive the same
concept from one representation. Algebraic concepts have become a study of
procedures and rules instead of exploration and concepts, which should lead to
generalizations that justify the rules.
10
The Meaning of the Equal Sign
Early elementary school children … view the equal sign as a symbol that
separates a problem and its answer. (Kieran 1981, p. 324). Students will have
difficulty in solving linear equations if they do not understand what the equal
signs mean. It is important to build on what students might have seen in the
elementary grades such as a problem like this:
8 + 4 = n + 5.
If teachers can build on the above problem to find out what students
understand by it, then the difficulty in solving this linear equation, 3x – 4 = 7x + 8
may be less.
Many studies such as (Austin & Vollrath, 1989 and Star & Ozgun-Koca,
1998) have been carried out emphasizing the use of multiple strategies in
mathematics. Based on such studies, the hypothesis proposed in this paper is
that exposing students to multiple representations/multiple strategies using tools
such as a graphical method and a flow chart will lead to improved flexibility in
problem-solving. For the sake of this action research, both methods are
described below
11
CHAPTER THREE
METHODOLOGY
This action research will be conducted to determine the effectiveness of
teaching that includes using the direct teaching model in the use of flow charts
and algebra to find solutions to linear equations. I will use quantitative and
qualitative methods in this study to compare the results of the two groups that
learned using a flowchart and direct teaching method (experimental/treatment
group) and the other group (control/comparison group) that received only the
direct teaching method in solving linear algebraic equations in one variable.
During the data collection period, I will conduct the interviews for certain
participants. Interview participants will be chosen based on the responses, which
need clarification. The pre-post assessment given to the participants is identical.
However, the interview questions might vary depending on the responses of the
participants.
Solving Linear Equations in One Variable using a Flowchart
This section describes the instructional methods, i.e., the flow chart and
for solving algebraic linear equations. Here is an example of an application of the
flowchart method below.
12
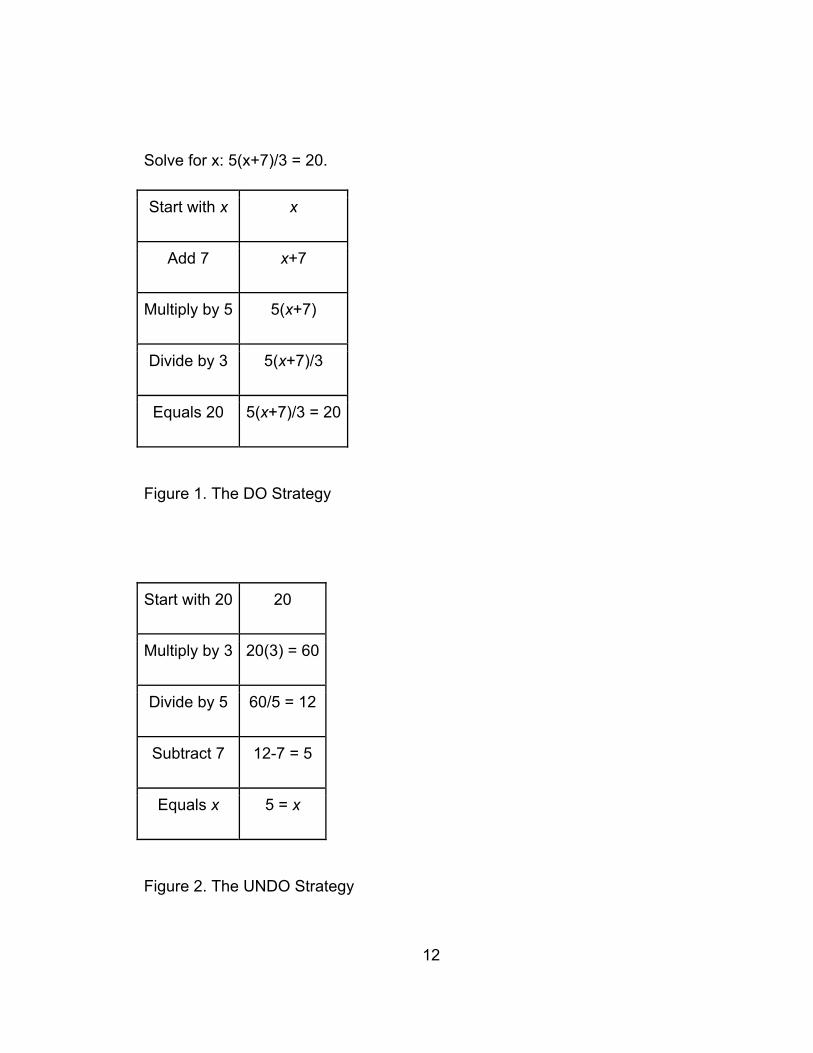
Solve for x: 5(x+7)/3 = 20.
Start with x x
Add 7 x+7
Multiply by 5 5(x+7)
Divide by 3 5(x+7)/3
Equals 20 5(x+7)/3 = 20
Figure 1. The DO Strategy
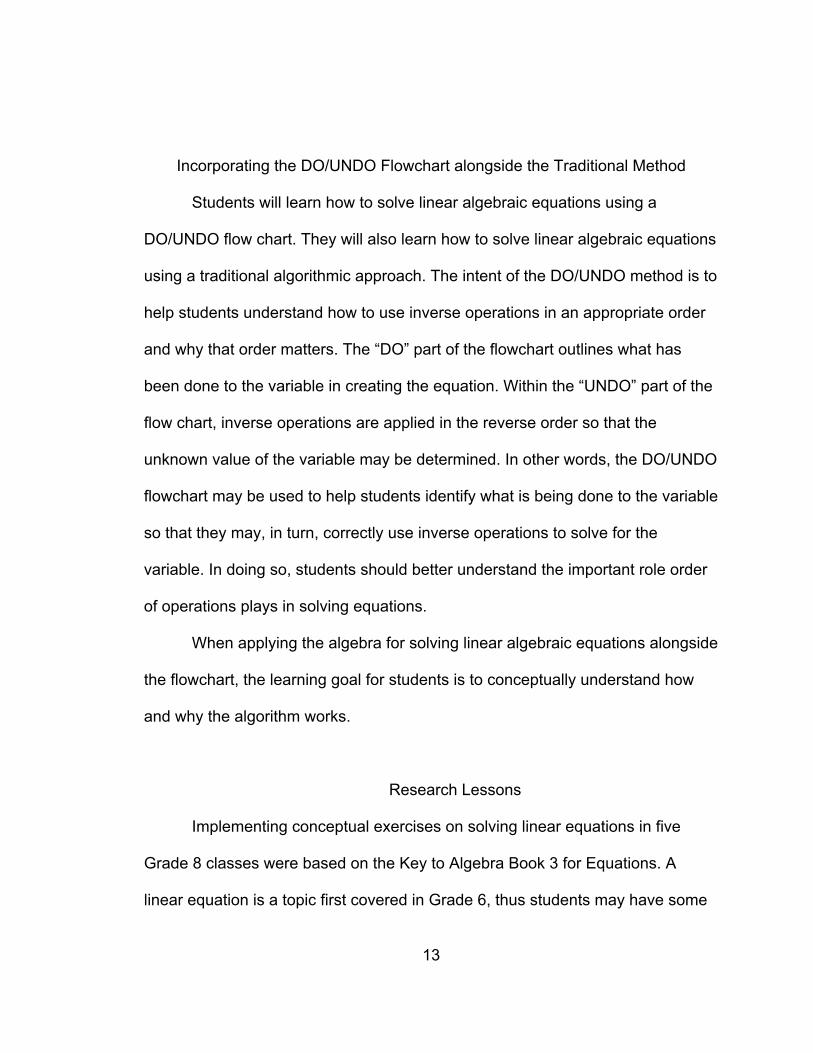
Start with 20 20
Multiply by 3 20(3) = 60
Divide by 5 60/5 = 12
Subtract 7 12-7 = 5
Equals x 5 = x
Figure 2. The UNDO Strategy
13
Incorporating the DO/UNDO Flowchart alongside the Traditional Method
Students will learn how to solve linear algebraic equations using a
DO/UNDO flow chart. They will also learn how to solve linear algebraic equations
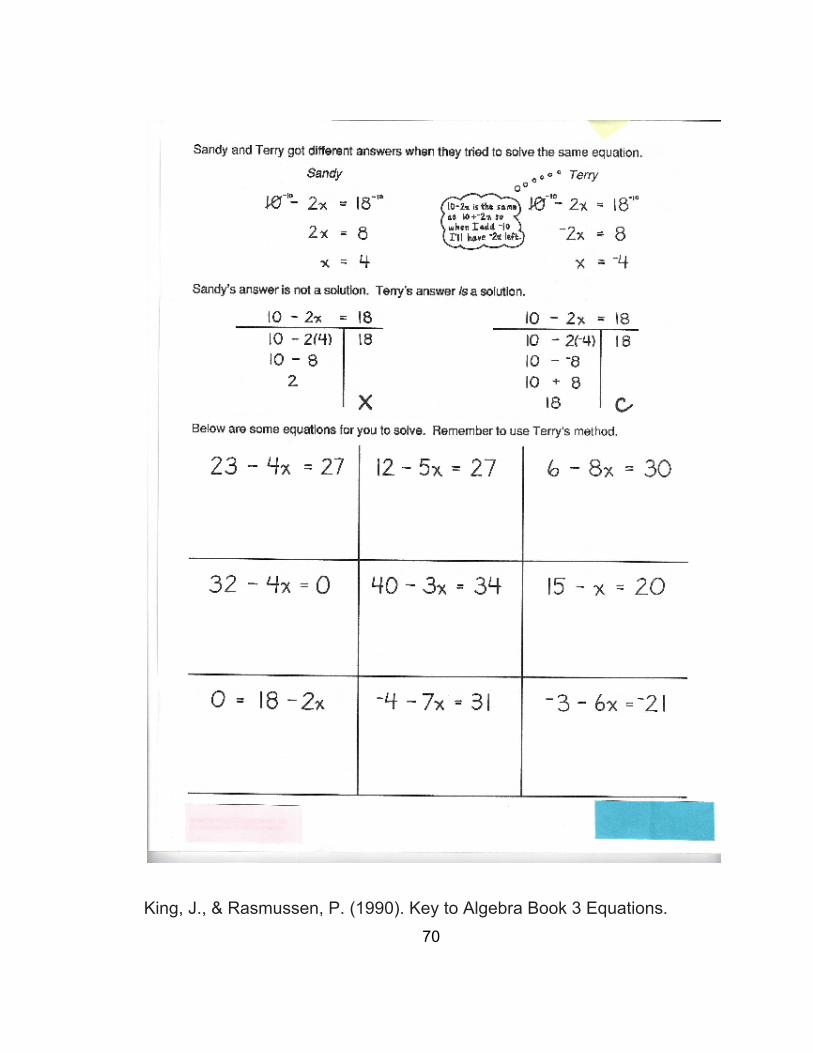
using a traditional algorithmic approach. The intent of the DO/UNDO method is to
help students understand how to use inverse operations in an appropriate order
and why that order matters. The “DO” part of the flowchart outlines what has
been done to the variable in creating the equation. Within the “UNDO” part of the
flow chart, inverse operations are applied in the reverse order so that the
unknown value of the variable may be determined. In other words, the DO/UNDO
flowchart may be used to help students identify what is being done to the variable
so that they may, in turn, correctly use inverse operations to solve for the
variable. In doing so, students should better understand the important role order
of operations plays in solving equations.
When applying the algebra for solving linear algebraic equations alongside
the flowchart, the learning goal for students is to conceptually understand how
and why the algorithm works.
Research Lessons
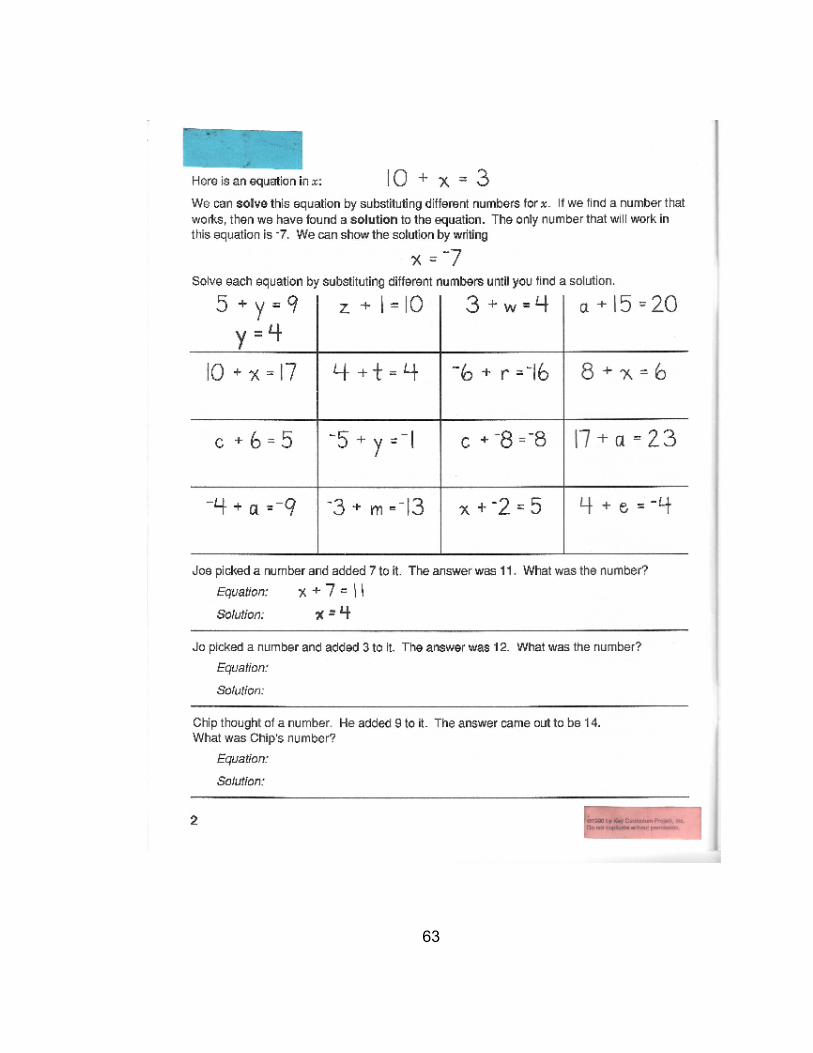
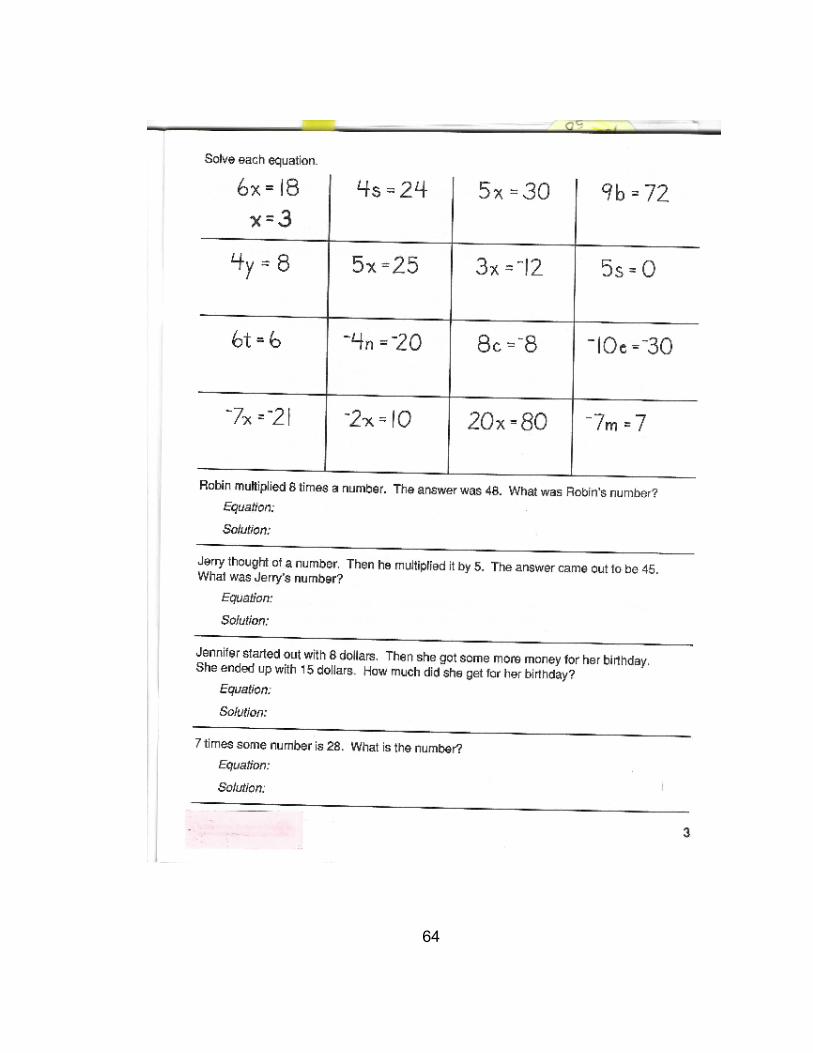
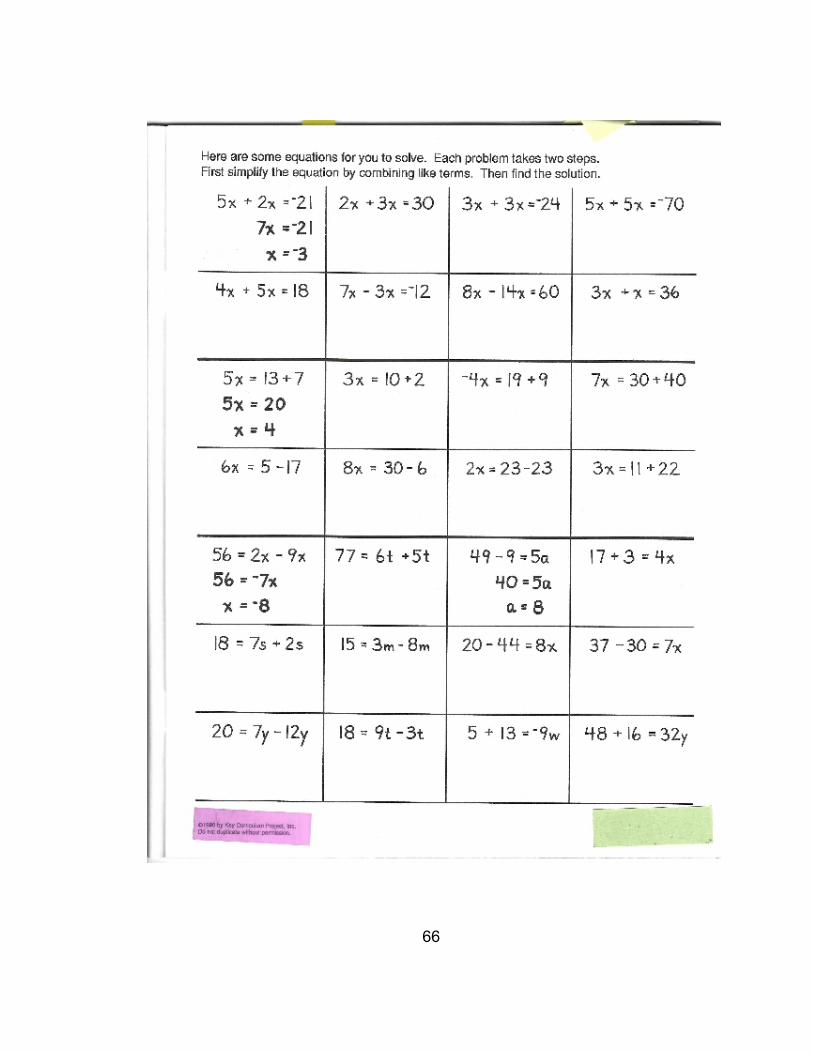
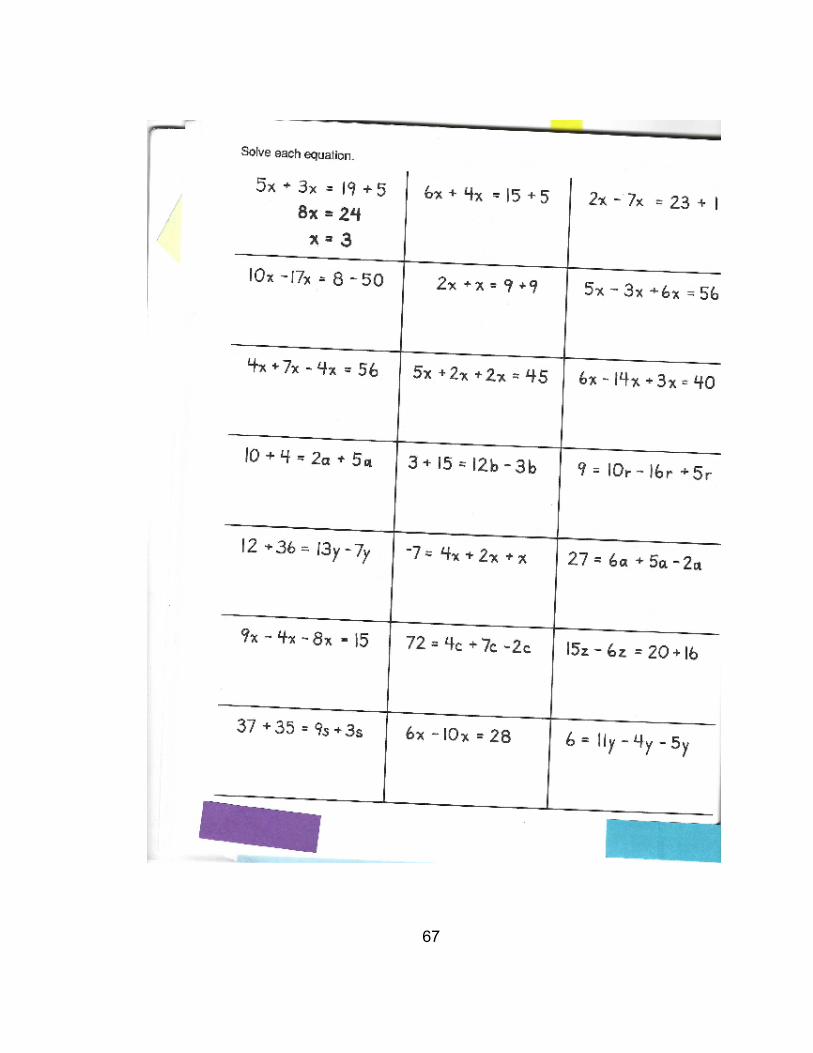
Implementing conceptual exercises on solving linear equations in five
Grade 8 classes were based on the Key to Algebra Book 3 for Equations. A
linear equation is a topic first covered in Grade 6, thus students may have some
14
prior knowledge regarding this concept. Solving linear equations extends the
ability for students to write and solve equations that require more steps. The
students will solve an equation by using the undoing method. Students will have
to focus on operations being applied to the variable and the use of inverse
operations to undo them. The undo method can be classified as a graphic
organizer, which helps to emphasize operations in the reverse order to solve for
the unknown variable in the given equation. Then the algebraic method helps the
student to develop a technique that will be useful in solving other kinds of
equations. I implemented various lessons for two weeks.
• Lesson 1, One-step equations were created for students to think of a
number that would make a true sentence. Conceptually, students will learn
that only one number will work. The flowchart was introduced to the
experimental/treatment group simultaneously with the standard procedure
when solving one-step and two-step equations. Each one-step/two-step
equation was solved using a flowchart before solving the same equation
with the standard procedure strategy side by side.
• Lesson 2, Solving Equations with variables on both sides. Students will
learn quickly that not all equations are simple. Students will learn to collect
like variables on the same side.
• Lesson 3, Solving Multi-Step Equations. Students will have to check to
see whether one or both sides of the equation can be simplified before
they use inverse operations to solve an equation.
15
• Lesson 4, Using Equations to Solve Problems. Students will have to make
up an equation for each problem and then solve the equation to reach a
solution.
• Lesson 5, Age Puzzles. Using Algebra, students will come up with an
about age and follow the same procedure done in lesson 4.
• Lesson 6, The Multiplication Principle for Equations. Students will learn
how to use the Multiplication Principle to solve equations by multiplying
both sides of an equation by the same number.
Pre-and Post-Assessments
A pre-assessment was given to determine students’ prior knowledge of
solving linear equations before the lessons were implemented. Students’
approach to each problem was also taken into consideration. The assessment
consisted of 8 items, and students were given two class periods to complete the
assessment. Having used mental math at some point during their math years to
solve equations, students could think freely without the use of the rules of
algebra on a few of the items. The last two problems were a good example of
how students displayed their conceptual understanding without the use of
algebra methodically. Reached solutions on the pre-test were analyzed to
address misconceptions when solving linear equations. Between concepts and
procedures, their responses were also checked for some procedural fluency and
quality of explanations. The lessons were implemented an hour each every day
16
for two weeks (10 days) with whole group instruction, differentiated instruction in
small groups and mathematical discussions. Making connections between the
daily given tasks and classroom discussions helped with procedural approaches
to increasing student understanding through visual representation/diagrams
(flowcharts). While solving linear equations, the flowchart was a tool used to help
build coherence, perseverance, and reasoning abilities in students.
The post-assessment was implemented in the next part of my research.
The same questions were featured on the post-assessment to illustrate and
document their academic gain. The lessons were taught in a specific sequence
so that they can build on the previous problem. Students were encouraged to
solve each problem one step at a time. With the post-assessment, the goal was
to help students understand how using the flowchart diagram shifts them to
solving the linear equations algebraically to become more independent learners.
To solve linear algebraic equation problems students need help
developing and making sense of the rules they are using to show them how to
employ a variety of strategies. As students are taught how to develop a deeper
understanding of solving equations, they are given an opportunity to solve linear
equation problems in different contexts. The designed pre and post-assessments
for my research engaged students to make solving equations meaningful.
Assessments were collected using standard school practice since all students
took the assessment as part of a regular classroom routine. The data used for
this study only came from students who had parental consent.
17
Interviews
Interviews were conducted with students who had parental consent to
determine their perceptions regarding how their thinking was affected by the
introduction of various representations on the post-assessment. I chose from a
variety of questions I had prepared ahead of time depending on the
circumstances of the students’ response to a specific item on a paper. During the
interview process, I jotted down the students’ responses to my question(s). I
chose students based on their responses to the post-assessment using the
following criteria: written solution using the algebraic method of solving linear
equations and it is correct or incorrect, a written solution with limited
understanding of using the algebraic method, written solution using a different
strategy, written solution using conceptual understanding and written solutions
with just an answer and no explanation.
To determine the effectiveness of teaching, which included using the
direct teaching model along with flowcharts, the student interviews (qualitative)
were analyzed qualitatively. Student assessments were categorized into types of
solution strategies in the charts on page 25 and 31. For example, guess and
check strategy with correct solutions and no explanations, solved equation with
the correct solution and no explanation, solved equation with wrong solution and
no explanation, solved equation with a correct solution with minor mistakes and
no explanation, solved equation with the wrong solution with major errors and no
explanation, solved equation with the correct solution and an explanation, solved
18
equation with wrong solution and an explanation and finally, a blank or an
incomplete solution. Both the pre and post-assessment were compared to the
quality of their solution strategies and development of their conceptual
understanding from the pre to the post-assessment. Student interviews were
conducted to help clear up misconceptions and reshape meaningful learning to
promote conceptual understanding. The primary objective of mathematics
instruction should be to improve students 'reasoning and sense-making
capabilities. In mathematics learning, logic and sense making are important.
Students who truly understand mathematical concepts will apply them to
problem-solving and new circumstances and use them as a basis for future
learning. There is ample evidence that learning is improved by teachers paying
attention to the information and values that learners bring to a learning mission,
using this information as a starting point for new teaching, and tracking the
evolving expectations of students as teaching continues (Bautista, 2017).
19
CHAPTER FOUR
RESULTS
Pre-Assessment Results
The data from the first part of this study came from the pre-assessment
used to evaluate the student's prior knowledge of solving linear equations and
their abstract level of linear equation comprehension.
Table 1: Pre-Assessment Item 1
1. 4n + 10 = 50
Written Response(s):
• “I was thinking to multiply 4x10 but that makes 40 and I thought n=1. I added then multiplied” (Respondent 18, 2017)
• “In my thought, I already knew how to do this so it was pretty easy except #5 that was pretty tricky” (Respondent 22, 2017)
• “What I did is multiply and simplify” (Respondent 16, 2017) • “I was thinking that to get 50 you would have to have 40 so
4n=40” (Respondent 24, 2017) • “I believe 4n represents 40 so if 4n is 40 and you add 10 it will
give you 50” (Respondent 28, 2017) • “The answer is 10 because 4 times 10 + 10 = 50” (Respondent 9,
2017)
On item 1, most students did not explain their thoughts on how they were
thinking. Four students did the guess and check method to find the value of n.
Six students explained their thinking on this question. Thus, 18 out of 27 students
20
taking the assessment gave the correct answer, n = 10. In analyzing several
students’ solutions, it was clear that they were using mental math.
Table 2: Pre-Assessment Item 2
2.
Written Response(s):
• “I subtracted x from 3 and I got 2 and 4-2 = 2” (Respondent 18, 2017) • “I was thinking that scince (since) 2 from 4 and 3 it has zero”
(Respondent 24, 2017) • “The answer is 18 because 3 goes into 18 6 times and 6 - 4 = 2”
(Respondent 9, 2017) • “X = 2 because I subtracted 4 by 2 and got 2” (Respondent 10, 2017) • “What I did was put a 1 under the -4 and turn it into a fraction so then I
can divide” (Respondent 16, 2017) • “X = 18 because 18 3 = 6 and 6 - 4 = 2” (Respondent 13, 2017)
Of the 27 students taking the assessment, 8 students stated correctly that
x = 18. Their methods involved guessing and checking and substituting their
solution into the original equation. Conceptually, these students understood this
problem- solving strategy helped them to come up with a solution that fits the
condition. Other students had solutions such as x = 2 because they solved using
inverse operations and forgot to have the fraction equal 6. Instead, they wrote
21
Table 3: Pre-Assessment Item 3
3. -3n + 12 = -12
Written Response(s):
• “What I did was I put +3 on both sides then subtracted and I ended up with 12n and -9 so I put them into a fraction then divided” (Respondent 16, 2017)
• “If -3n was able to turn 12 into negative 12 I thought that it had to be lower than -12, I thought to get 12 to zero subtract 12 then subtract another 12 to get -12 which means -3n = -24 then to find n divide -24 by -3 which equals 8 so n = 8” (Respondent 15, 2017)
• “I just added the number till I got what the answer was” (Respondent 18, 2017)
• “n = 4 because 4 times -3 is -12” (Respondent 10, 2017) • “I was thinking of how to do the problem to get an answer” (Respondent
24, 2017) • “The answer is 0 because 0 and -0 made the 12 negatives” (Respondent
9, 2017)
Twelve students solved n = 8 for this question. Nine of them solved the
linear equation using the algebraic method while 1 student solved using the
guess and check strategy. In this item, one student wrote -3 + n = -4. -4 +12 = 8.
Table 4: Pre-Assessment Item 4
4.
Written Response(s):
• “x = -30 because -30+5=-6 and -6 + 14 = 8 (Respondent 13, 2017)
22
• “What I did was I turned the equation into a fraction then I multiplied finally and divided” (Respondent 16, 2017)
• “The answer is 3 because 14 - 5 = 11 and 11 - 8 = 3” (Respondent 9, 2017)
In analyzing item 4, 4 students solved x = -30. One student solved using
the guess and check strategy while the other 3 students solved using the
algebraic method. Four students left the question blank. Item 4 involved students
at least conceptually understanding that subtracting a negative integer produces
a positive integer. Even after a few students subtracted negative 14, they were
still confused about how to conceptually interpret this item. One student
subtracted 14 from both sides of the equation and ended up with two equivalent
fractions. Another student multiplied 5 to the first term and 5 to the solution to
receive x = 29.
Table 5: Pre-Assessment Item 5
5.
Written Response(s):
• “ I added the top of the fraction then I divided 2 times -11 which gave me -22” (Respondent 16, 2017)
23
Two students multiplied -22 times 4 to get -44 and then wrote the linear
equation -5x + 6 = -44 to solve for a value of x while 3 other students used the
guess and check strategy. Out of 27 students, 5 students solved for x correctly
while 1 student made an error on the value of x. For further analysis of student
work on this item, please see the post-assessment results on p. 29.
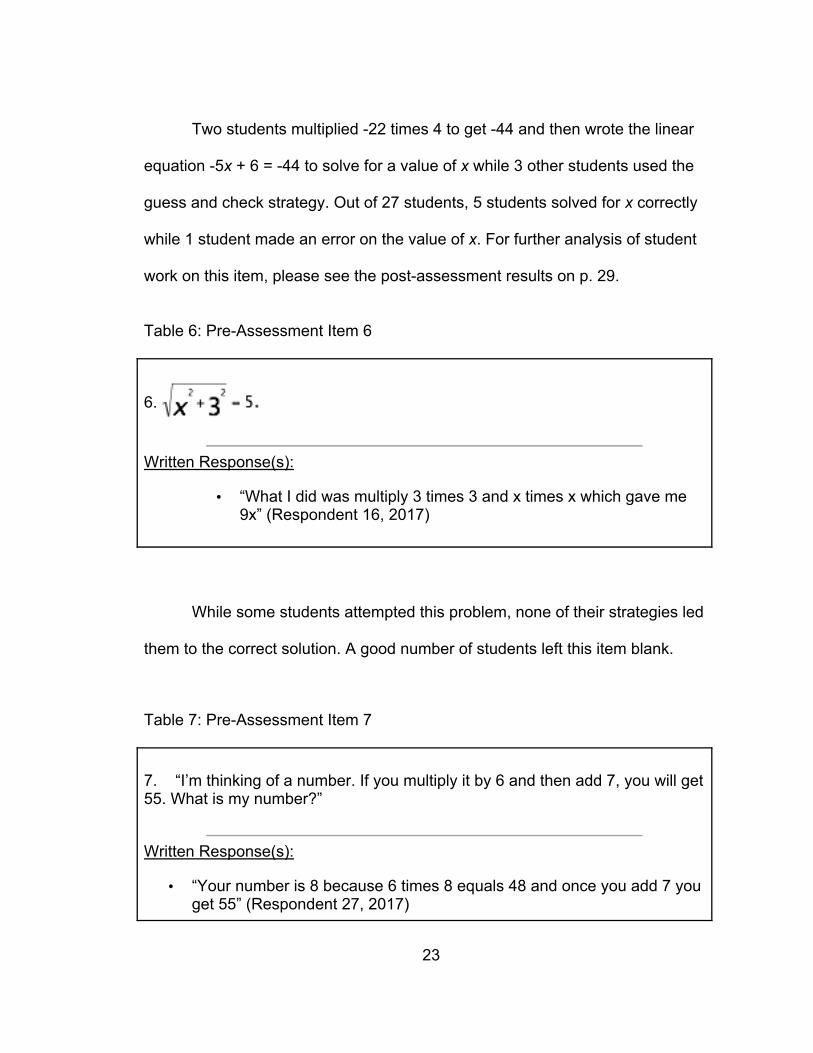
Table 6: Pre-Assessment Item 6
6.
Written Response(s):
• “What I did was multiply 3 times 3 and x times x which gave me 9x” (Respondent 16, 2017)
While some students attempted this problem, none of their strategies led
them to the correct solution. A good number of students left this item blank.
Table 7: Pre-Assessment Item 7
7. “I’m thinking of a number. If you multiply it by 6 and then add 7, you will get 55. What is my number?”
Written Response(s):
• “Your number is 8 because 6 times 8 equals 48 and once you add 7 you get 55” (Respondent 27, 2017)
24
• “The number is 48” (Respondent 22, 2017)
Four students gave substantially the same answer and explanation as
respondent 27 quoted above. A few students wrote the number is 8 without any
explanation. Twelve other students answered this item by writing a linear
equation and solved for the unknown variable using the algebraic strategy. They
were successful. Five students solved this item using the guess and check
strategy. Four students responded to this item by saying, “the number is 48”.
Table 8: Pre-Assessment Item 8
8. A shake at the Shack cost 80 cents and the bill for three burgers and a shake is $4.40. “How much is a burger?”
Written Response(s):
• “A burger is $1.20 each” (Respondent 25, 2017) • “The burger would be 1.20$. Three burgers would be 3.60$”
(Respondent 10, 2017) • “The burgers would be $3.60 because $4.40 - .80 = $ 3.60. The answer
is $3.60” (Respondent 9, 2017) • “A burger costs $3.60” (Respondent 16, 2017) • “The burgers are a dollar” (Respondent 7, 2017) • “ The burger cost $2.00” (Respondent 1, 2017)
For item 8, 10 students wrote a linear algebraic equation to find their
unknown. Two students wrote the correct equation and solved it correctly. One
25
student wrote the equation x + 3 + 80 = 4.40; 3x + 80 = 4.40. Then the equation
was solved until x =1.20. In this case, the student made an error of stating that x
+ 3 = 3x.The wrong equation was written down and the correct solution was
arrived at in the end. Another student wrote the correct equation but arrived at
the incorrect solution. Four students applied the guess and check strategy to
arrive at the correct solution for this problem.
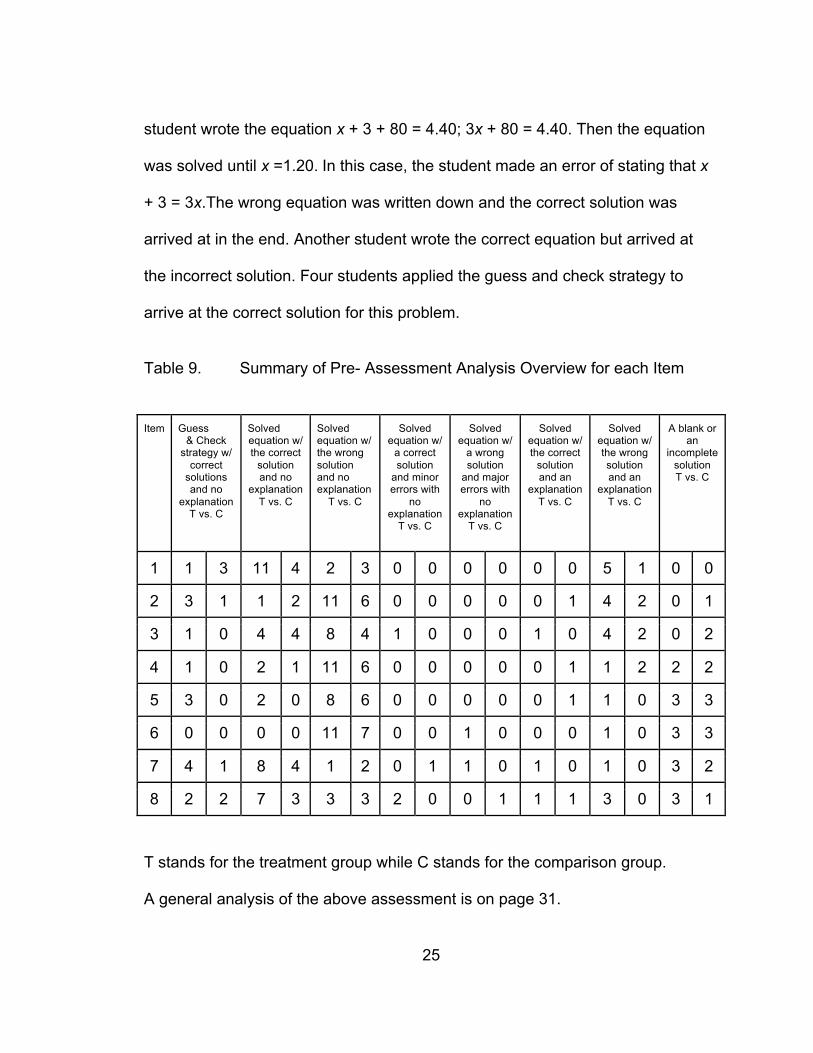
Table 9. Summary of Pre- Assessment Analysis Overview for each Item
Item Guess & Check
strategy w/ correct
solutions and no
explanation T vs. C
Solved equation w/ the correct
solution and no
explanation T vs. C
Solved equation w/ the wrong solution and no explanation
T vs. C
Solved equation w/
a correct solution
and minor errors with
no explanation
T vs. C
Solved equation w/
a wrong solution
and major errors with
no explanation
T vs. C
Solved equation w/ the correct
solution and an
explanation T vs. C
Solved equation w/ the wrong solution and an
explanation T vs. C
A blank or an
incomplete solution T vs. C
1 1 3 11 4 2 3 0 0 0 0 0 0 5 1 0 0
2 3 1 1 2 11 6 0 0 0 0 0 1 4 2 0 1
3 1 0 4 4 8 4 1 0 0 0 1 0 4 2 0 2
4 1 0 2 1 11 6 0 0 0 0 0 1 1 2 2 2
5 3 0 2 0 8 6 0 0 0 0 0 1 1 0 3 3
6 0 0 0 0 11 7 0 0 1 0 0 0 1 0 3 3
7 4 1 8 4 1 2 0 1 1 0 1 0 1 0 3 2
8 2 2 7 3 3 3 2 0 0 1 1 1 3 0 3 1
T stands for the treatment group while C stands for the comparison group.
A general analysis of the above assessment is on page 31.
26
Post - Assessment Results
To determine if their level of conceptual understanding of solving linear
equations improved, the post-assessment will be analyzed. Student flexibility
practice with the use of multiple strategies will be determined on each problem.
In order by the question of the assessment, the results will be discussed.
Although the flow chart was taught to the treatment group alongside the standard
solving equation strategy, no student used the flowchart to solve any of the
equations in the post-assessment.
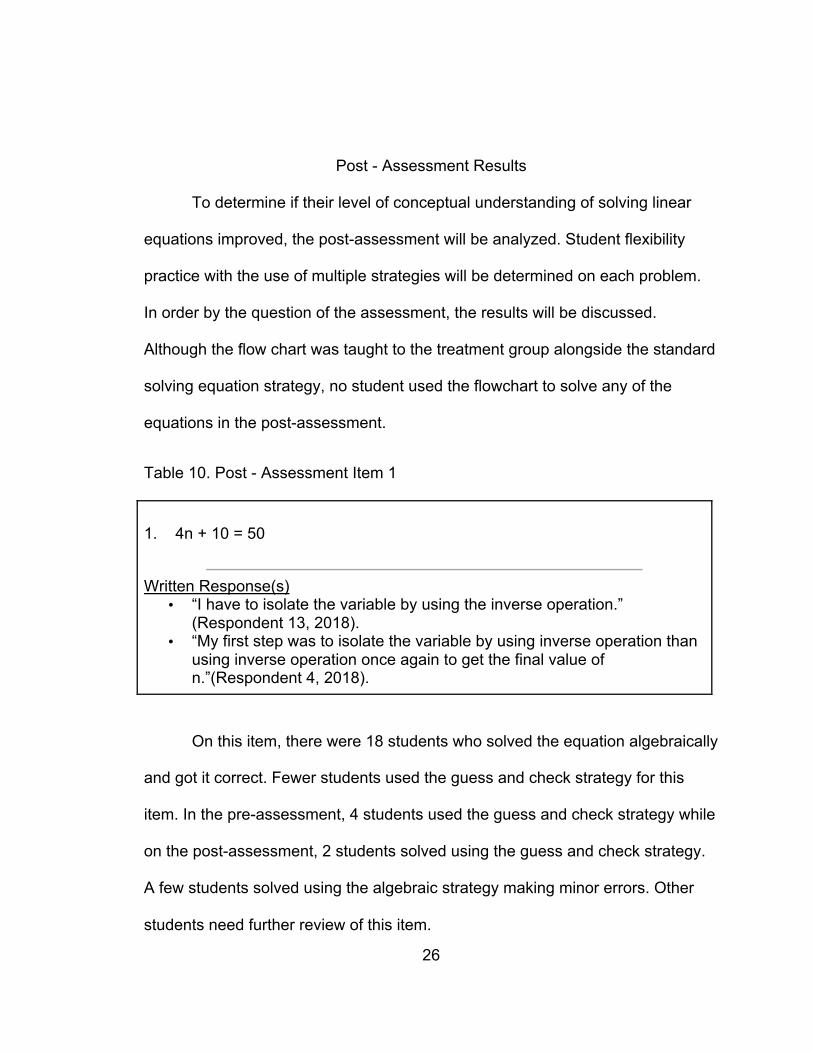
Table 10. Post - Assessment Item 1
1. 4n + 10 = 50
Written Response(s)
• “I have to isolate the variable by using the inverse operation.” (Respondent 13, 2018).
• “My first step was to isolate the variable by using inverse operation than using inverse operation once again to get the final value of n.”(Respondent 4, 2018).
On this item, there were 18 students who solved the equation algebraically
and got it correct. Fewer students used the guess and check strategy for this
item. In the pre-assessment, 4 students used the guess and check strategy while
on the post-assessment, 2 students solved using the guess and check strategy.
A few students solved using the algebraic strategy making minor errors. Other
students need further review of this item.
27
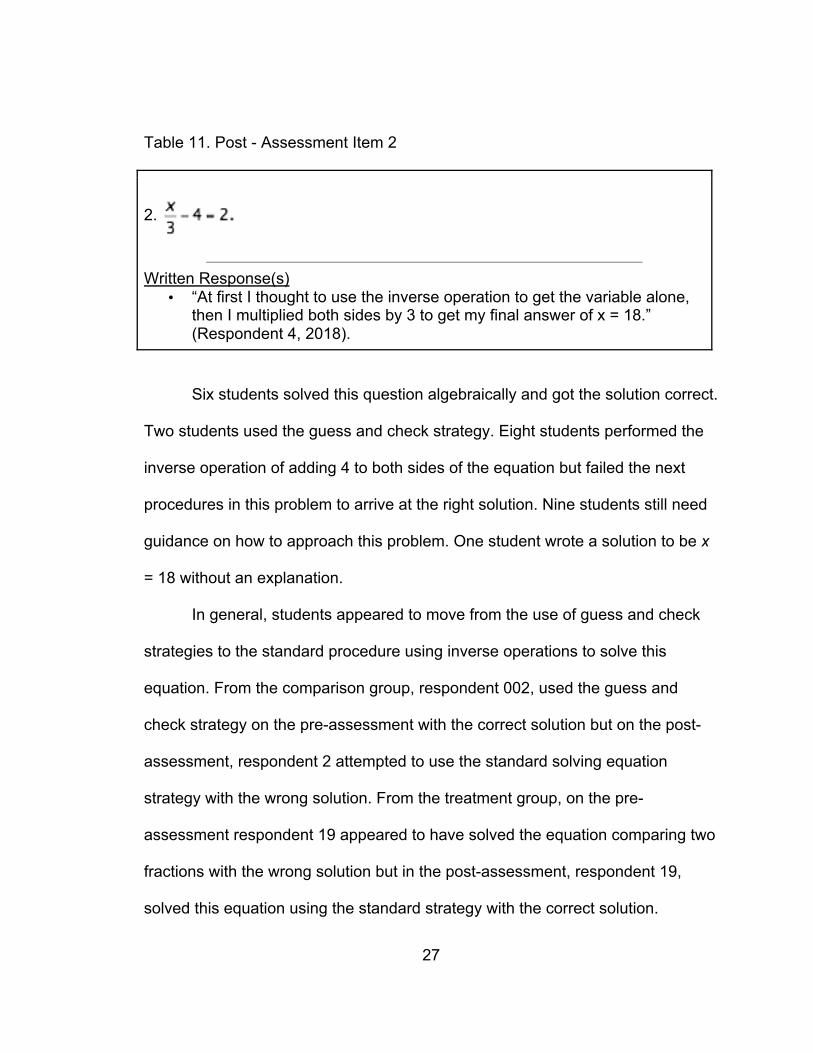
Table 11. Post - Assessment Item 2
2.
Written Response(s)
• “At first I thought to use the inverse operation to get the variable alone, then I multiplied both sides by 3 to get my final answer of x = 18.” (Respondent 4, 2018).
Six students solved this question algebraically and got the solution correct.
Two students used the guess and check strategy. Eight students performed the
inverse operation of adding 4 to both sides of the equation but failed the next
procedures in this problem to arrive at the right solution. Nine students still need
guidance on how to approach this problem. One student wrote a solution to be x
= 18 without an explanation.
In general, students appeared to move from the use of guess and check
strategies to the standard procedure using inverse operations to solve this
equation. From the comparison group, respondent 002, used the guess and
check strategy on the pre-assessment with the correct solution but on the post-
assessment, respondent 2 attempted to use the standard solving equation
strategy with the wrong solution. From the treatment group, on the pre-
assessment respondent 19 appeared to have solved the equation comparing two
fractions with the wrong solution but in the post-assessment, respondent 19,
solved this equation using the standard strategy with the correct solution.
28
Table 12. Post - Assessment Item 3
3. -3n + 12 = -12.
Written Response(s)
• “My first thought was to use the inverse operation to simplify the equation, then using inverse operation to isolate x and getting the final value.” (Respondent 4, 2018).
There were 7 students who applied the algebraic strategy in this item and
arrived at the correct solution while doing so. Nine students incorrectly added two
integers and did not include the negative sign, which led to their final answer
being a negative solution instead of a positive solution. The other students failed
this item because they need a review on adding and subtracting integers.
Table 13. Post - Assessment Item 4
4.
Written Response(s)
• “At first I thought to simplify the equation by inverse operation, then I multiplied both sides by 5 to isolate x and get the final value of x.” (Respondent 4, 2018).
This item contained double negatives. Four students simplified the double
negatives to a positive and applied the algebraic strategy. One student used the
29
guess and check strategy. Other students used the inverse operation first in this
problem and then solved the linear equation for x.
Table 14. Post - Assessment Item 5
5.
For this item, 6 students solved the linear equation algebraically. Although
1 student solved the linear equation algebraically, the solution was wrong. A few
students did not show any work while solving this problem and arrived at the right
solution. One student in particular divided -5x and 6 by 2 to simplify to 2.5x + 3= -
22, then solved the linear equation for x correctly.
Table 15. Post - Assessment Item 6
6.
For this item, one student left the question blank. All other students
attempted the item but were unsuccessful except for two students who attempted
this item using a conceptual understanding of square roots and they were
partially correct.
30
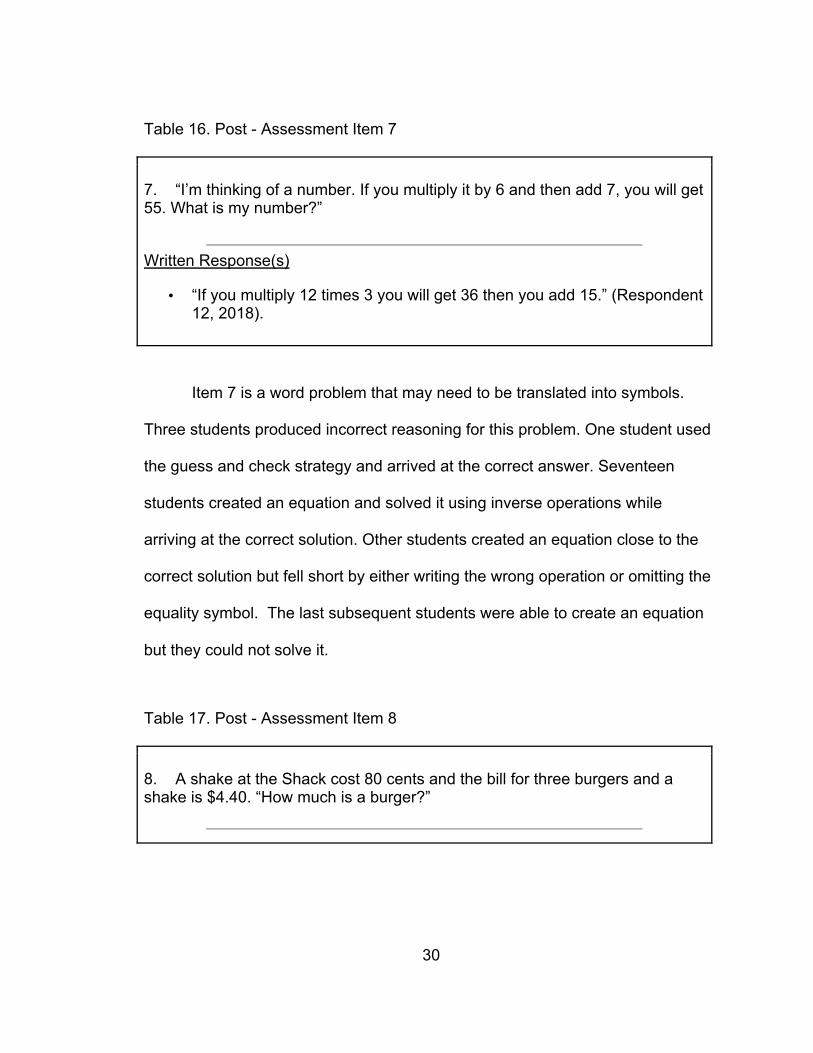
Table 16. Post - Assessment Item 7
7. “I’m thinking of a number. If you multiply it by 6 and then add 7, you will get 55. What is my number?”
Written Response(s)
• “If you multiply 12 times 3 you will get 36 then you add 15.” (Respondent 12, 2018).
Item 7 is a word problem that may need to be translated into symbols.
Three students produced incorrect reasoning for this problem. One student used
the guess and check strategy and arrived at the correct answer. Seventeen
students created an equation and solved it using inverse operations while
arriving at the correct solution. Other students created an equation close to the
correct solution but fell short by either writing the wrong operation or omitting the
equality symbol. The last subsequent students were able to create an equation
but they could not solve it.
Table 17. Post - Assessment Item 8
8. A shake at the Shack cost 80 cents and the bill for three burgers and a shake is $4.40. “How much is a burger?”
31
Thirteen students were able to set up a linear equation and gave the
correct answer, each burger cost $1.20. Three students subtracted 0.80 from
4.40 and then divided by 3 to get the correct answer. Six students tried setting up
an equation but failed along the way. One student did set up the correct equation
but was confused about the use of the order of operations. Other students were
completely incorrect, leaving it blank and or incomplete.
Table 18. Summary Post- Assessment Analysis Overview for each Item
Item Guess
& Check strategy w/
correct solutions and no
explanation T vs. C
Solved
equation w/ the correct
solution and no
explanation T vs. C
Solved equation w/ the wrong solution and no
explanation T vs. C
Solved equation
with a correct solution
and minor errors w/
no explanation
T vs. C
Solved equation w/
a wrong solution
and major errors w/
no explanation
T vs. C
Solved equation w/ the correct
solution and an
explanation T vs. C
Solved equation w/ the wrong solution and an
explanation T vs. C
A blank or an
incomplete solution T vs. C
1 1 1 10 6 3 3 1 0 0 0 0 0 0 0 0 0
2 2 0 4 2 9 6 0 1 0 0 0 0 0 0 0 1
3 0 0 5 2 10 3 0 4 0 0 0 0 0 0 0 1
4 1 0 2 2 11 7 1 0 0 0 0 0 0 0 0 1
5 0 0 5 1 8 9 11 0 0 0 0 0 0 0 0 0
6 0 0 0 0 13 10 0 0 0 0 0 0 0 0 0 1
7 1 0 11 6 2 4 1 0 0 0 0 0 0 0 0 0
8 0 0 7 6 7 4 1 0 0 0 0 0 0 0 1 0
In comparing the summary of the two tables, students from both groups
used the guess and check strategy more during the pre-assessment than the
32
post-assessment. In the pre-assessment, at least one student applied this
strategy for all items except item 6 but in the post-assessment, students applied
this strategy to items 1,2,4, and 7. They gave fewer written responses and fewer
explanations in the post-assessment. Students largely moved from mental math
or guess and check strategies to the standard strategy of solving linear
equations. According to Hiebert, (1999, p.7) and other authors, once students
are taught a procedure, they become less likely to use sense-making methods.
Students provided fewer explanations on the post-assessment, but more correct
answers compared to the pre-assessment, and students used the standard
procedure more often on the post-assessment. In the case of solving equations
with correct solutions and no explanations, students appeared to perform better
on the post-assessment, as evidenced by the increased number of correct
solutions from pre to post. For solved equations with the wrong solution and no
explanation, students received more wrong solutions on the post-assessment
than the pre-assessment.
In the category of the solved equation with the correct solution with minor
errors and no explanation, while students gave fewer correct pre-assessment
responses (to be anticipated because the pre-assessment took place before the
instruction), students who arrived at the correct answers showed more of their
thought compared to their post-assessment work. For example, Respondent 002,
used the guess and check strategy on the pre-assessment, for items 1-4. In the
post-assessment, this respondent used the standard strategy for questions 1 and
33
3 only. Students had difficulty solving equations involving fractions or fractional
expressions, and this was just as true in the post-assessment. Most students had
difficulty applying the standard procedure of solving equations involving a
numerator and denominator, which increased the intensity of the problem. Most
students also moved from methods that worked for them in the pre-assessment
to methods that they were trying to apply such as the standard solving equation
strategy. According to Battista, “students must stay engaged in making personal
sense of mathematical ideas. Furthermore, students must believe-based on their
past experiences-that they are capable of making sense of mathematics” (2017).
For the next three categories, students from both groups did better on the post-
assessment than the pre-assessment. Finally, fewer students left blank answers
during the post-assessment than the pre-assessment.
On the next few pages, the participant data is presented using 0 and 1. 0
represents the control/comparison group and 1 represents the
experimental/treatment group.
34
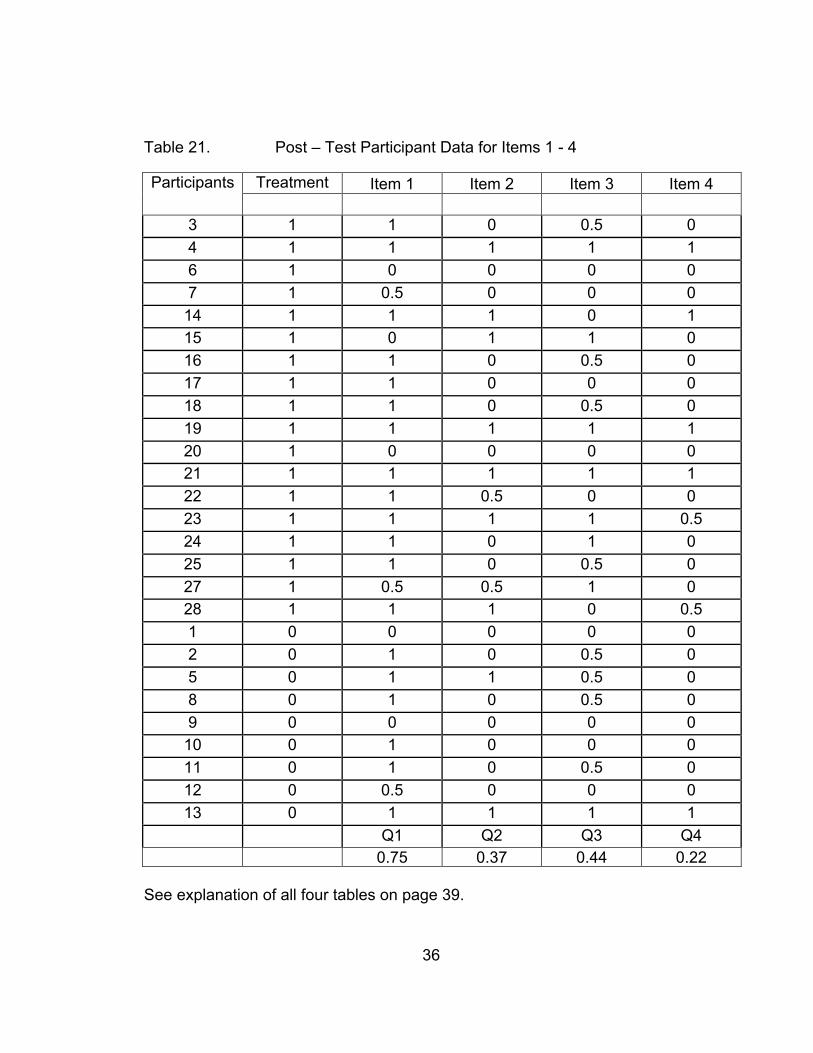
Participant Data Table 19. Pre-Test Participant Data for Items 1 - 4
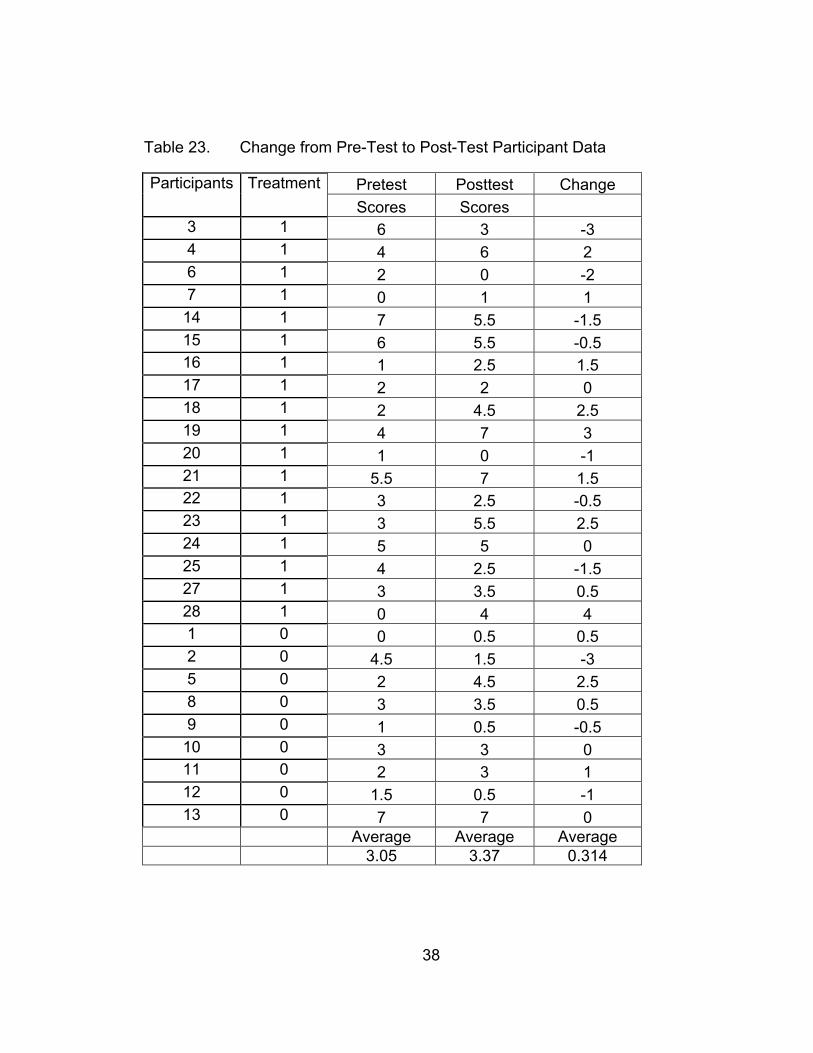
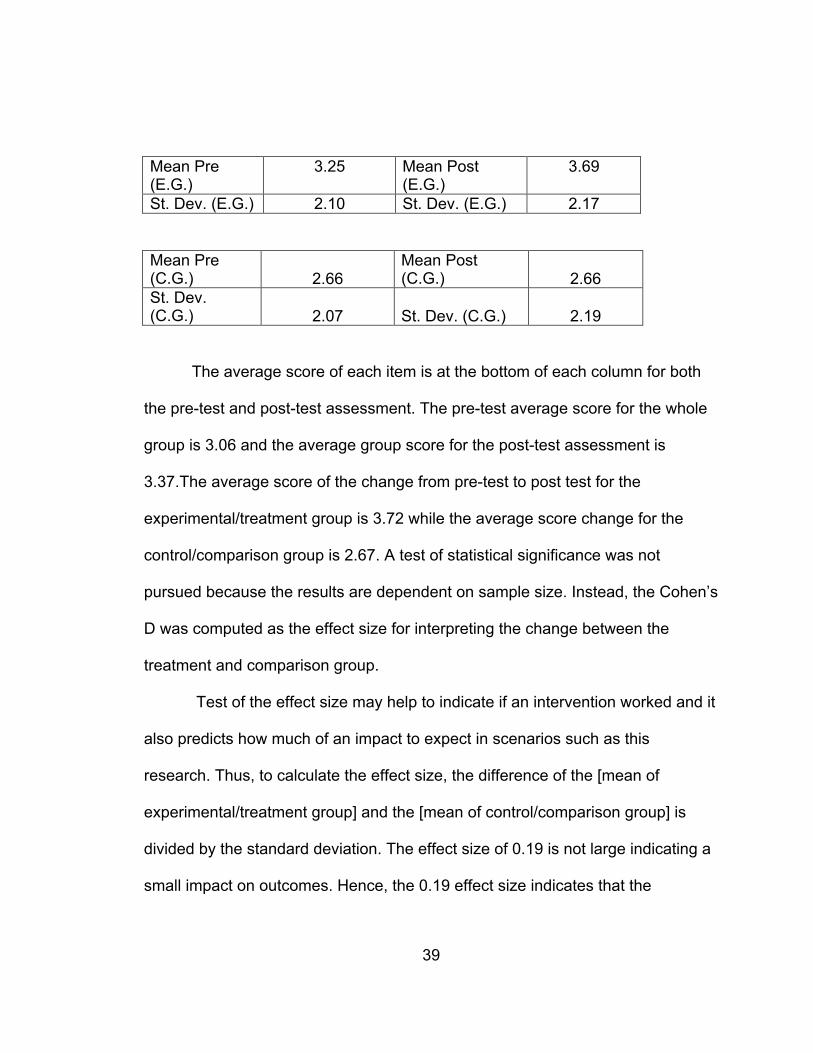
The average score of each item is at the bottom of each column for both
the pre-test and post-test assessment. The pre-test average score for the whole
group is 3.06 and the average group score for the post-test assessment is
3.37.The average score of the change from pre-test to post test for the
experimental/treatment group is 3.72 while the average score change for the
control/comparison group is 2.67. A test of statistical significance was not
pursued because the results are dependent on sample size. Instead, the Cohen’s
D was computed as the effect size for interpreting the change between the
treatment and comparison group.
Test of the effect size may help to indicate if an intervention worked and it
also predicts how much of an impact to expect in scenarios such as this
research. Thus, to calculate the effect size, the difference of the [mean of
experimental/treatment group] and the [mean of control/comparison group] is
divided by the standard deviation. The effect size of 0.19 is not large indicating a
small impact on outcomes. Hence, the 0.19 effect size indicates that the
40
difference between the gains made by two groups of students
(treatment/experimental vs. control/comparison) was 0.19 standard deviations.
Interview Results
In the interview part of this study, there were 18 students who agreed to
participate. Based on the responses to the post-assessment, 4 students were
selected for an interview.
Respondent 019: The student expressed liking the algebraic strategy more than
the flowchart strategy because getting used to what a student should know in
high school was very important. Another added stress for the student was
drawing the bubbles needed for the flowchart was a hassle along with writing
operations and numbers verbally was a headache. This student was determined
to learn how to solve equations algebraically. This student was in the
experimental/treatment group. The first student was chosen because there was a
score increase from a 4 on the pre-assessment and a 7 on the post-assessment.
Here are the interview questions as follows:
1. Which method of solving linear algebraic equations are you most comfortable
with, and why?
Verbal Response: I like solving linear equations algebraically because, with the
flowchart, we are limited to the types of equations, which will work with the
flowchart.
41
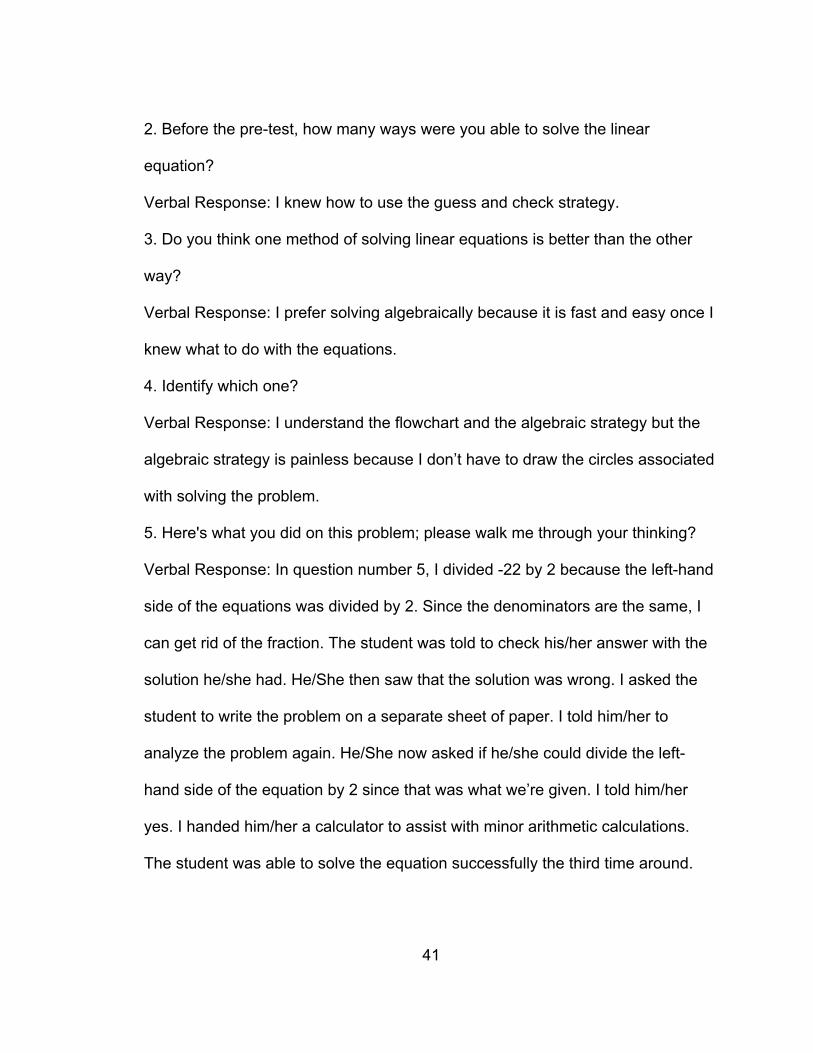
2. Before the pre-test, how many ways were you able to solve the linear
equation?
Verbal Response: I knew how to use the guess and check strategy.
3. Do you think one method of solving linear equations is better than the other
way?
Verbal Response: I prefer solving algebraically because it is fast and easy once I
knew what to do with the equations.
4. Identify which one?
Verbal Response: I understand the flowchart and the algebraic strategy but the
algebraic strategy is painless because I don’t have to draw the circles associated
with solving the problem.
5. Here's what you did on this problem; please walk me through your thinking?
Verbal Response: In question number 5, I divided -22 by 2 because the left-hand
side of the equations was divided by 2. Since the denominators are the same, I
can get rid of the fraction. The student was told to check his/her answer with the
solution he/she had. He/She then saw that the solution was wrong. I asked the
student to write the problem on a separate sheet of paper. I told him/her to
analyze the problem again. He/She now asked if he/she could divide the left-
hand side of the equation by 2 since that was what we’re given. I told him/her
yes. I handed him/her a calculator to assist with minor arithmetic calculations.
The student was able to solve the equation successfully the third time around.
42
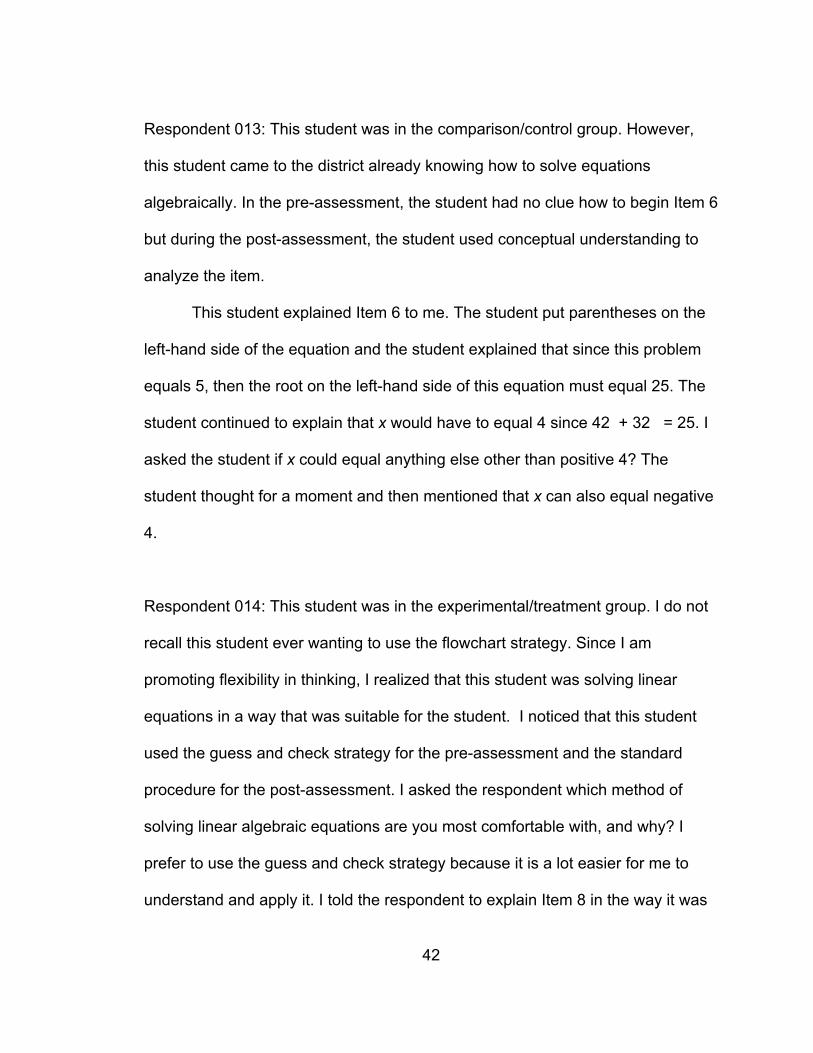
Respondent 013: This student was in the comparison/control group. However,
this student came to the district already knowing how to solve equations
algebraically. In the pre-assessment, the student had no clue how to begin Item 6
but during the post-assessment, the student used conceptual understanding to
analyze the item.
This student explained Item 6 to me. The student put parentheses on the
left-hand side of the equation and the student explained that since this problem
equals 5, then the root on the left-hand side of this equation must equal 25. The
student continued to explain that x would have to equal 4 since 42 + 32 = 25. I
asked the student if x could equal anything else other than positive 4? The
student thought for a moment and then mentioned that x can also equal negative
4.
Respondent 014: This student was in the experimental/treatment group. I do not
recall this student ever wanting to use the flowchart strategy. Since I am
promoting flexibility in thinking, I realized that this student was solving linear
equations in a way that was suitable for the student. I noticed that this student
used the guess and check strategy for the pre-assessment and the standard
procedure for the post-assessment. I asked the respondent which method of
solving linear algebraic equations are you most comfortable with, and why? I
prefer to use the guess and check strategy because it is a lot easier for me to
understand and apply it. I told the respondent to explain Item 8 in the way it was
43
understood conceptually. For Item 8, I knew that the final cost was $4.40. I
subtracted $0.80 since money can be subtracted from money. After subtracting, I
ended up with $3.60 left. I knew that I had already paid for the shake and now I
had to pay for the cost of three burgers. If I divide $3.60 by 3, then each burger
will cost $1.20. This is the undoing method without the diagram. I was able to set
up the equation but I did not solve it systematically using inverse operations.
Respondent 024: Finally, here is another student who was in the
experimental/treatment group. Like the other respondents, this student did not
use the flowchart strategy and started with solving linear equations algebraically.
This student stayed true to using one of the strategies throughout the post-
assessment. I said to the student, “ Here's what you did on this problem, please
walk me through your thinking”? The student replied, “ I wanted to write my
variable x means because I needed to find how much is one variable. I wrote a
division problem so that I could find how much one burger would cost. After
subtracting the numbers and dividing by 3, I knew I would get the cost of one
burger”. I asked, “Is there another way to solve this problem”? The student
replied I don’t know.
In comparison to the four interviews that were done, the students only used
two particular strategies throughout their post-assessment. The algebraic
strategy and the guess and check strategy. Respondent 14 used the reasoning
of the flowchart without the graphic organizer for the burger problem. Three out
44
of the four students used the algebraic strategy while the last student used the
guess and check strategy for at least one item. Three out of the four students
belonged to the treatment group while the last student belonged to the
comparison group.
45
CHAPTER FIVE
CONCLUSION
The significance of representing the solution of linear algebraic equations
in multiple ways provides the same objective of more than one form. It is
necessary to see how students use these representations. It is suggested that
multiple representations provide an environment for students to abstract and
understand major concepts (McArthur et al.1998, Yerushalmy, 1991) while
constructivist theory suggests that we need to understand students’ thinking
processes in order to facilitate their learning in more empowering ways (Stepphe,
1991). Understanding students’ thinking and their preferences while choosing a
representation type for solving algebraic linear algebraic equations help
mathematics teachers gain insight into student thinking. After the last practice
during the study's lesson process, the students went on Christmas break and
other mini-holidays before they took the post-assessment. Representations such
as the do/undo flow chart and algebraic method are tools that provide the same
information in more that one form. The role of these tools in the task mentioned
above is to represent solving linear algebraic equations using multiple
concretizations of a concept, mitigate certain difficulties and to make
mathematics more attractive and interesting (Ozgun-Koca, 98). Dienes’
mentioned that conceptual learning is maximized when children are exposed to a
mathematical concept through a variety of physical contexts or embodiments. In
46
other words, we should not expect that all students would perceive the same
concept from one representation.
Concluding Issues Related to Study
Does the introduction of multiple ways to think about linear equations lead
students to flexibly incorporate appropriate representations/strategies in solving
problems involving linear equations?
Conceptual understanding of solving linear algebraic equations at the
beginning of this analysis did not prove to be absent among students because
several students used the guess and check strategy and mental math strategies
for sense making during the pre-assessment. Rather they lacked knowledge of
the procedural steps for solving equations in one variable. Several students
showed understanding by solving certain problems using mental math or the
guess and checking strategies in the pre-assessment, and after instruction the
students moved to more use of the standard procedure and less use of sense-
making methods. Students were able to use the guess and check strategy and
the algebraic strategy by the time they took the post-assessment. The treatment
group displayed the above strategies during the post-assessment phase and
increased from an average of 3.25 on the pre-assessment to an average of 3.69
on the post-assessment. However, the control groups’ average remained the
same for both assessments, which were 2.67. The need to find ways to promote
comprehension of mathematics is one of the main issues that arise in
47
mathematics education. At the beginning of this study analysis, within the
“UNDO” part of the flow chart, inverse operations are applied in the reverse order
so that the unknown value of the variable may be determined. In other words, the
DO/UNDO flowchart may be used to help students identify what is being done to
the variable so that they may, in turn, correctly use inverse operations to solve for
the variable. In doing so, students should better understand the important role
order of operations plays in solving equations. When applying the algebra for
solving linear algebraic equations alongside the flowchart, the learning goal for
students is to conceptually understand how and why the algorithm works. The
treatment group showed greater average growth than the comparison group,
although the effect size calculation showed the intervention had only a small
effect of 0.19. A handful of students in the control setting understood how to
apply the algebra associated with solving linear equations. A couple of
representations on this concept gave students the ability to generate and connect
flexible mathematical thinking after they attempted the pre-assessment.
According to the 2012 Focus Issue on Fostering Flexible Mathematical Thinking,
NCTM’s Focus in High School Mathematics: Reasoning and Sense-Making
(2009, pp. 9-10), students are able to adapt and expand where possible while
applying previously learned principles to problems that are being presented, they
seek and use connections and different representations, reconcile different
approaches to solve problems including those proposed by others and they
generalize a solution to a broader class of problems. Four students,
48
Respondents 006,023,025,028 were able to display flexibility in their
thinking during the post-assessment phase of this study. Although they were
taught how to use the flowchart and algebraic/standard strategy, these students
also displayed another strategy which is the guess and check strategy.
Respondent 006 and Respondent 025 used the inverse operation strategy for
problem 1 and used the guess and check strategy for problem 7. Respondent
023 displayed the inverse operation strategy for problems 1-3 and 8 while using
the guess and check strategy for problem 7. Respondent 028 used the guess
and check strategy for problem 2 and used the algebraic strategy for problems 1
and 7. The introduction of multiple ways to think about linear equations did not
lead to greater flexibility in this research because the students did not use the
multiple strategies that were introduced to them, which was using the flowchart
and the algebraic strategies during the post-assessment. The guess and check
strategy was used but that was not taught during the intervention of this
assessment.
Which representations do students use to solve linear equations and in what
context? How do students use representations when presented with a specific
task?
“Students frequently use such informal approaches as guess-and-test and
undoing to solve algebra word problems when they are allowed to choose a
solution method”(Nathan and Koedinger, 2000). A guess and check method uses
arithmetic procedures to solve algebra word problems iteratively after the
49
unknown quantity is replaced by a number. In the undoing process, students
work backward through quantitative algebra problem relationships by reversing
mathematical operations and quantity order. Students use their knowledge about
the environment to promote their thinking through alternate approaches to
solutions. The use of informal approaches by students increases their problem-
solving performance about the problems that teachers consider to be the most
challenging.
After administering the pre-assessment to my experimental group, I used
the DO/UNDO flowchart to help my students comprehend when a number was
being added, subtracted, or multiplied in an equation. As we continued to solve
linear equations using a flowchart, I also introduced solving equations
algebraically simultaneously. The control group only learned how to solve linear
equations algebraically without the flowchart. Students mostly used solving linear
equations algebraically in both the experimental and control groups. On the post-
assessment for the experimental group, most students solved the linear
equations using algebra and just a handful of students used the guess and check
strategy to find a solution.
Forward-Looking Guidance and Study
Before the analysis of this study, students had no clue what the alphabets
(variables) were doing with numbers. They could not conceptually understand
how to look at this mathematical sentence. Looking at any variable was too
50
abstract for them. So if I were to look at this analysis in the future, I would teach
students to visually represent a linear equation by transforming the mathematical
problem into words. For example, 3x + 8 = 20(a mathematical problem) to words
is three times x plus eight equals twenty. Then I would have the students write
the inverse operation for operation. Then we could proceed to use the DO/UNDO
flowchart. I consider the advantage of the flowchart approach to be that students
have a better understanding of the standard procedure process and thus by
using the technique more appropriately, they would make sense of the
procedure. A study involving more students could address the research question.
This may help to bridge the learning from primary to secondary. It is also
important for students to be able to explain their thinking process. The majority of
my students did not explain their thinking. I would often say to my students that if
I were to teach the way they explain their mathematical work, then they would be
beyond lost and confused. If students can interpret what the equation is saying
then they would be a lot more successful at problem-solving linear equations.
This is simply getting the students to use mathematical academic language. I
would also be very specific in my instructions on whether the students can use
the flowchart as part of their strategy to solve linear equations. Based on the
learning process that has been conducted I cannot conclude that students can
use the DO/UNDO flowchart to solve linear equations with one variable in a
formal way because every student’s learning is different. For future teaching, it
seems more appropriate to consider the flowchart as a stepping-stone towards
51
the more general procedures that teachers can use to build understanding before
introducing general methods.
52
APPENDIX A
INFORMED CONSENT
53
54
55
56
57
58
APPENDIX B
ASSESSMENTS
59
Pre/Post Test on Solving Linear Equations Name: Date: Period: ID#:
Solve the following equations using any method of your choice. If you solved any of the linear equations by mental math, briefly explain your thoughts on how you were thinking. Calculators are allowed.
1.
2.
3.
4.
5.
6.
7.“I’m thinking of a number. If you multiply it by 6 and then add 7, you will get 55. What is my number?”
60
8. A shake at the Shack cost 80 cents and the bill for three burgers and a shake is $4.40. “How much is a burger?”
King, J., & Rasmussen, P. (1990). Key to Algebra Book 3 Equations.
61
APPENDIX C
LESSONS
62
Solve Linear Equations in One Variable Lessons
TABLE OF CONTENT
Warm-Up ………………………………………………………………………………..2
Exit Card…………………………………………………………………………………3
One Step Equations ..............................................................................................4
Equations with Variables on both sides.................................................................5
Using Equations to Solve Problems ....................................................................24
Warm-Up………………………………………………………………………………..25
Age Puzzles Using Algebra .................................................................................27
The Multiplication Principle for Equations………………...…………………….…..32
Exit Card……………………………………….……………………………………….33
63
64
65
66
67
68
69
70
King, J., & Rasmussen, P. (1990). Key to Algebra Book 3 Equations.
71
APPENDIX D
INTERVIEW QUESTIONS
72
Interview Questions Consent letters with parents agreeing to have their student interview to part in 5-10 minute interview.
1. Which method of solving linear algebraic equations are you most comfortable with, and why?
2. Before the pre-test, how many ways were you able to solve the linear equation? 3. Do you think one method of solving linear equations is better than the other way? 4. Identify which one? 5. Why do you think it is a better method? 6. Here's what you did on this problem, please walk me through your thinking? 7. Is there another way to solve this problem? 8. Why did you use this method for this problem? 9. Would that method always work?
How do you know this/that method is easier? 10. How do you know this/that method is more efficient?
Developed by Edima Umanah
73
REFERENCES
Austin, J., & Vollrath, H. J. (1989). 53. Representing, solving, and using algebraic
equations. The Mathematics Teacher, 82, 608-612.
Battista, Michael T. (2017). Reasoning and sense-making in the elementary
grades, grades 6-8. Reston, VA : The National Council of Teachers of
Mathematics, [2016] (DLC) 2016023431
Caglayan, G., & Olive, J. (2010). Eighth grade students' representations of linear
equations based on a cups and tiles model. Educational Studies In
Mathematics, 74(2), 143-162.
Dienes, Z. P. (1969). Building up mathematics. Hutchinson Educational.
Hiebert, J. (1999). Relationships between research and the NCTM
standards. Journal for Research in Mathematics Education, 30(1), 3-19.
McArthur, D. J., Burdorf, C., Ormseth, T., Robyn, A., & Stasz, C. (1988). Multiple
representations of mathematical reasoning. Proceedings ITS-88 Montréal
485-490.
74
Nathan, M. J., & Koedinger, K. R. (2000). Moving beyond teachers' intuitive
beliefs about algebra learning. Mathematics Teacher-Washington, 93(3),
218-223.
Ozgun-Koca, S. A. (1998). Students' use of representations in mathematics
education. North American Chapter of the International Group for the
Psychology of Mathematics Education, NC: Raleigh.
Panasuk, R. M. (2010). Three-phase ranking framework for assessing
conceptual understanding in algebra using multiple
representations. Education, 131(2).
Waalkens, M., Aleven, V., & Taatgen, N. (2013). Does supporting multiple student
strategies lead to greater learning and motivation? Investigating a source of
complexity in the architecture of intelligent tutoring systems. Computers &