26
Jakarta, May 2015 The Effect of US Dollar Reinforcement to Indonesia Capital Market
| Date post: | 13-Aug-2015 |
| Category: |
Presentations & Public Speaking |
| Upload: | zola-azaria |
| View: | 307 times |
| Download: | 1 times |
Jakarta, May 2015
The Effect of US Dollar Reinforcement to Indonesia Capital Market

IDX Latest Highlights

-
600
1,200
1,800
2,400
3,000
3,600
4,200
4,800
5,400
Jakarta Composite Index and Capital Market Milestones
3
*) 22 May 2015
1992 – 22 May 2015
02-Jan-2013New Trading Hours
4,254.816
1992 1993 1994 19961995 1997 1998 1999 2000 2001 2002 2003 2004 2005 2006 2007 2008 2009
30-Nov-2007Consolidation of the SSX
into JSX to become the IDX2,688.332
6-Oct-2004Launching of Stock Option
856.060
28-Mar-2002Implementation of
Remote Trading481.775
9-Sep-2002T+4 to T+3 Settlement430.271
21-Jul-2000Scriptless Trading
512.617
23-Dec-1997Founding ofKSEI397.031
23-Jul-1997Financial Crisis
718.189
6-Aug-1996Founding of KPEI
554.790
24-Jul-1995 Merging process of SSX into
Bursa Paralel Indonesia509.532
22-May-1995JATS
461.389
13-Jul-1992Privatization of JSX321.544
8-Oct-2008Suspend Trading
1,451.669
7-Apr-2015Highest Index
5,523.290
2-Mar-2009JATS Next G 1,256.109
28-Oct-2008Lowest Index in 2008
1,111.390
2010 2011 2012 2014
06-Jan-2014New Lot Size & Tick Size
4,202.809
2013 2015*
Source: IDX

Jakarta Composite Index : Annual Return
4
Source: IDX
1000.233
1162.635
1805.523
2745.826
1355.408
2,534.356
3,703.512
3821.992
4316.687
4,274.177
5,226.947
5,315.153
-
500
1,000
1,500
2,000
2,500
3,000
3,500
4,000
4,500
5,000
5,500
6,000
55.30% 52.08%
2004 2005 2006 2007 2008 2009
86.98%-50.64%
3.20%
2010 2011
*) 22 May 2015
44.56% 16.24%
2012
46.13% 12.94%
2013
2004 – 22 May 2015
-0.98%
2014
22.29%
2015*
1.69%

5Average Daily Trading and Market Capitalization
*) 22 May 2015
Volume (in Million Share) Value (in IDR Billion)
Frequency (in Times) Market Capitalization ( in IDR Trillion)
3,283
6,090 5,432
4,873 4,284
5,503 5,484 6,491
2008 2009 2010 2011 2012 2013 2014 2015*
4,436 4,046 4,801 4,953 4,537
6,238 6,006 6,633
2008 2009 2010 2011 2012 2013 2014 2015*
55,905 87,040
105,790 113,454 121,712 153,686
212,635 228,146
2008 2009 2010 2011 2012 2013 2014 2015*
1,076
2,019
3,247 3,5374,127 4,219
5,228 5,363
2008 2009 2010 2011 2012 2013 2014 2015*
Source: IDX
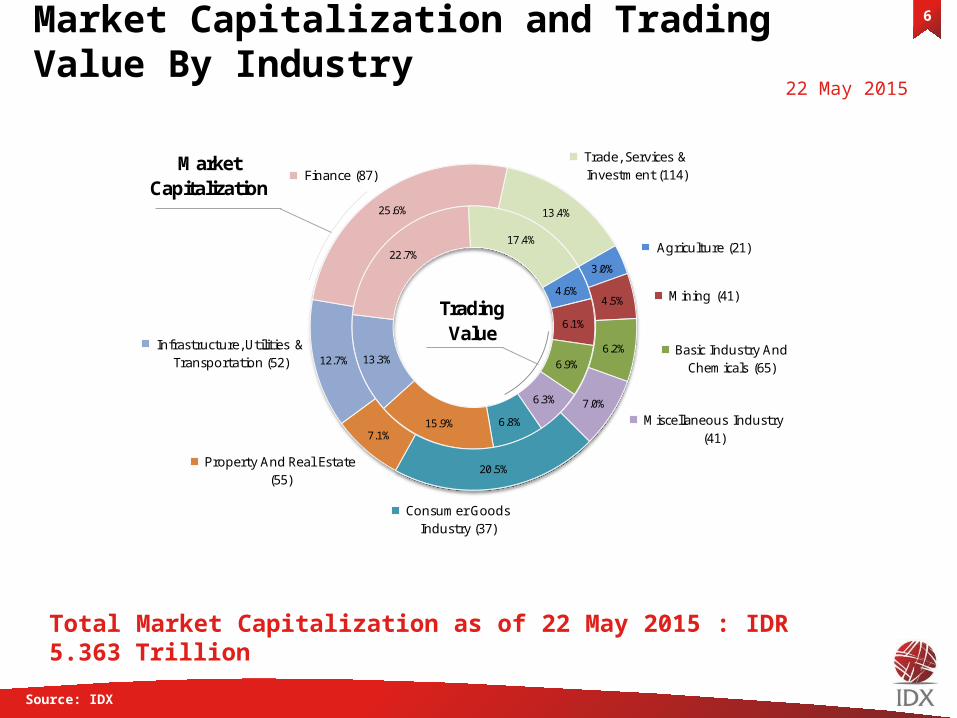
Market Capitalization and Trading Value By Industry
6
Total Market Capitalization as of 22 May 2015 : IDR 5.363 Trillion
Source: IDX
4.6%
6.1%
6.9%
6.3%
6.8%15.9%
13.3%
22.7%17.4%
3.0%
4.5%
6.2%
7.0%
20.5%
7.1%
12.7%
25.6% 13.4%
Agriculture (21)
Mining (41)
Basic Industry And Chemicals (65)
Miscellaneous Industry (41)
Consumer Goods Industry (37)
Property And Real Estate (55)
Infrastructure, Utilities & Transportation (52)
Finance (87)Trade, Services & Investment (114)
MarketCapitalization
TradingValue
22 May 2015

[S] Sharia Compliant Stock
Top 20 in Market Capitalization7
Source: IDX
Market Capitalization
(in Trillion Rp)
1. BBCA Bank Central Asia Tbk. 350.26 6.53
2. UNVR Unilever Indonesia Tbk. [S] 334.00 6.23
3. HMSP HM Sampoerna Tbk. 317.55 5.92
4. BBRI Bank Rakyat Indonesia (Persero) Tbk. 307.72 5.74
5. ASII Astra International Tbk. [S] 306.66 5.72
6. TLKM Telekomunikasi Indonesia (Persero) Tbk. [S] 289.30 5.39
7. BMRI Bank Mandiri (Persero) Tbk. 263.92 4.92
8. BBNI Bank Negara Indonesia (Persero) Tbk. 130.62 2.44
9. PGAS Perusahaan Gas Negara (Persero) Tbk. [S] 101.81 1.90
10. GGRM Gudang Garam Tbk. 90.58 1.69
11. UNTR United Tractors Tbk. [S] 86.82 1.62
12. KLBF Kalbe Farma Tbk. [S] 86.25 1.61
13. INTP Indocement Tunggal Prakarsa Tbk. [S] 82.55 1.54
14. ICBP Indofood CBP Sukses Makmur Tbk. [S] 81.20 1.51
15. SMGR Semen Indonesia (Persero) Tbk. [S] 77.85 1.45
16. EMTK Elang Mahkota Teknologi Tbk. 64.72 1.21
17. INDF Indofood Sukses Makmur Tbk. [S] 60.37 1.13
18. CPIN Charoen Pokphand Indonesia Tbk. [S] 52.56 0.98
19. LPPF Matahari Department Store Tbk. 51.21 0.95
20. JSMR Jasa Marga (Persero) Tbk. 44.71 0.83
3,180.65 59.31
5,363.00
%
Market Capitalization of The 20 Stocks
Total IDX
No. Code Company
22 May 2015
8
Dec-10
May-11
Sep-11
Jan-12
May-12
Sep-12
Jan-13
May-13
Sep-13
Jan-14
May-14
Sep-14
Jan-15
May-15
0
50
100
150
200
250
300
350
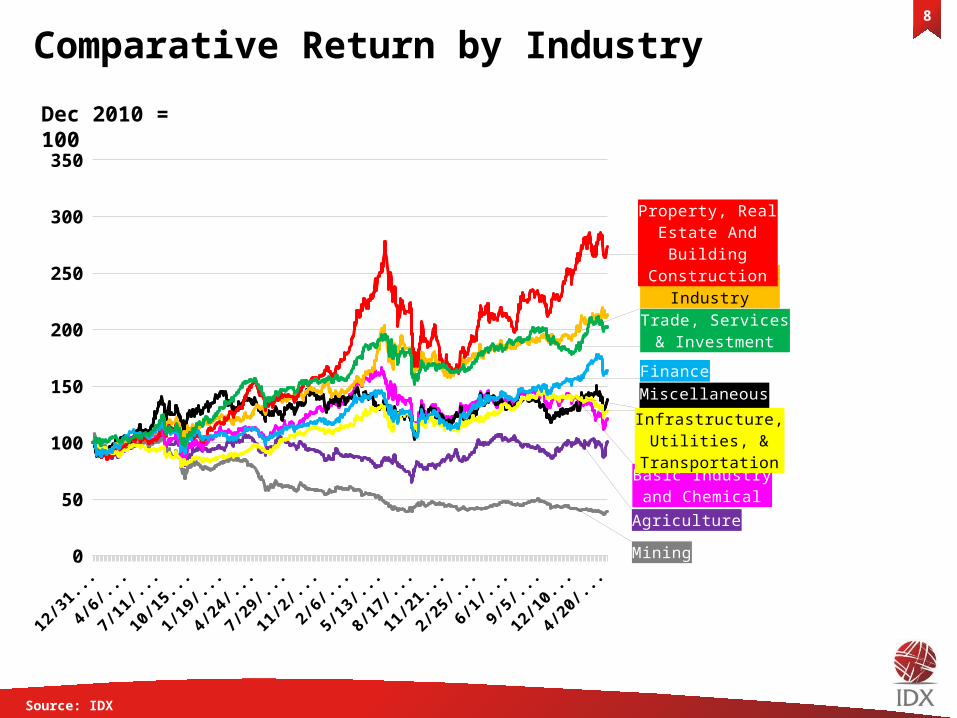
Agriculture
Mining
Miscellaneous Industry
Consumer Goods Industry
Property, Real Estate And Building Construction
Basic Industry and Chem-ical
Infrastructure, Utilities, & Transportation
Finance
Trade, Services & Investment
Comparative Return by Industry
Dec 2010 = 100
Source: IDX
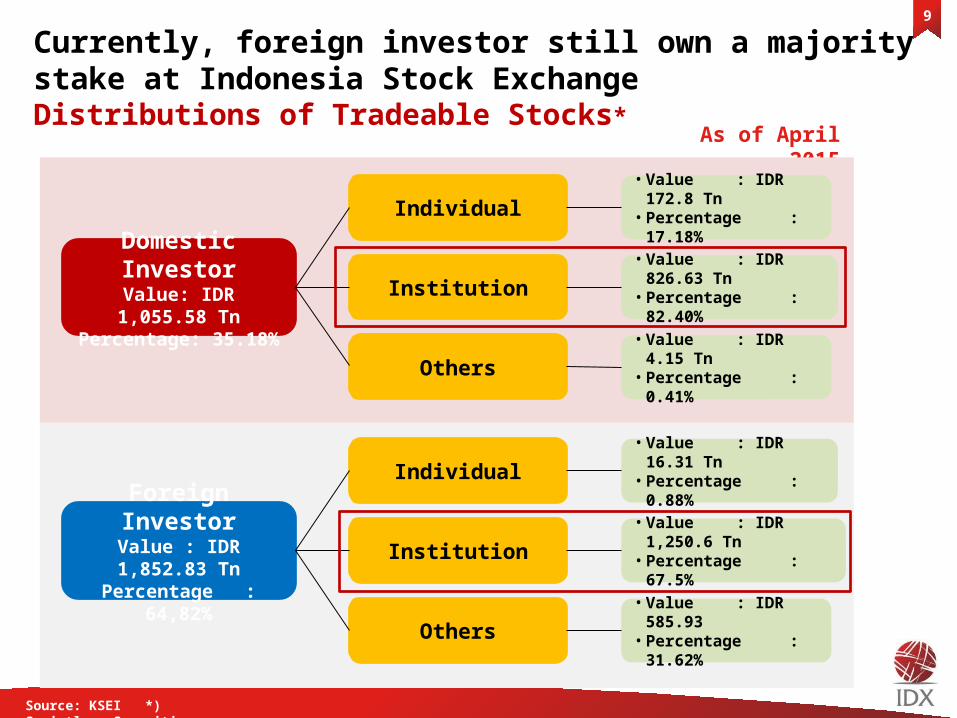
Currently, foreign investor still own a majority stake at Indonesia Stock ExchangeDistributions of Tradeable Stocks*
9
As of April 2015
Source: KSEI *) Scriptless Securities
Domestic InvestorValue: IDR 1,055.58 Tn
Percentage: 35.18%
Foreign InvestorValue : IDR 1,852.83 Tn
Percentage : 64,82%
Individual
Institution
Others
• Value : IDR 172.8 Tn
• Percentage : 17.18%
• Value : IDR 826.63 Tn
• Percentage : 82.40%
• Value : IDR 4.15 Tn
• Percentage : 0.41%
Individual
Institution
Others
• Value : IDR 16.31 Tn
• Percentage : 0.88%
• Value : IDR 1,250.6 Tn
• Percentage : 67.5%
• Value : IDR 585.93• Percentage : 31.62%

The Effect of US Dollar Reinforcement To Indonesia Capital Market

JCI and IDR : Trend Comparison
11
Source: Bloomberg
• The rupiah has fallen by more than 5% this year, a contrasting performance compared to the Jakarta Composite Index (JCI) which achieved highest level in April, 7Th 2015 at 5,523.29.
• Unexpectedly, JCI dropped 7.9% from its highest level to 5,086.43 in the end of April.• Nevertheless, JCI ready to rebound gradually after tumbling 400 points.
2-Ja
n8-
Jan
14-Ja
n20
-Jan
26-Ja
n1-
Feb
7-Fe
b13
-Feb
19-F
eb25
-Feb
3-M
ar9-
Mar
15-M
ar21
-Mar
27-M
ar2-
Apr
8-Ap
r14
-Apr
20-A
pr26
-Apr
2-M
ay8-
May
14-M
ay20
-May
4,6004,7004,8004,9005,0005,1005,2005,3005,4005,5005,600 11,800
12,000
12,200
12,400
12,600
12,800
13,000
13,200
13,400
5,313.21
13,150
IHSG (LHS) IDR/USD (RHS)

What happened to JCI in recent weeks ?Company financial performance was below expectation
12
Q1-2014 Q1-2015 Q1-2014 Q1-2015
BBRI PT Bank Rakyat Indonesia (Persero) Tbk 5.93 6.14 16.7% 3.5%
BMRI PT Bank Mandiri (Persero) Tbk 4.92 5.14 14.4% 4.3%
BBCA PT Bank Central Asia Tbk 3.70 4.10 28.0% 10.8%
ASII PT Astra International Tbk 4.73 3.99 9.7% -15.6%
TLKM PT Telekomunikasi Indonesia (Persero) Tbk 3.65 3.81 4.9% 4.4%
UNVR PT Unilever Indonesia Tbk 1.36 1.59 -4.9% 16.9%
HMSP PT HM Sampoerna Tbk 2.75 2.89 5.4% 5.1%
BBNI PT Bank Negara Indonesia (Persero) Tbk 2.39 2.82 15.6% 17.7%
PGAS PT Perusahaan Gas Negara (Persero) Tbk 2.09 1.40 -18.7% -32.9%
GGRM PT Gudang Garam Tbk 1.42 1.28 35.3% -9.6%
INDF PT Indofood Sukses Makmur Tbk 1.37 0.87 89.8% -36.5%
SMGR PT Semen Indonesia (Persero) Tbk 1.30 1.19 4.8% -8.5%
ICBP PT Indofood CBP Sukses Makmur Tbk 0.69 0.80 7.0% 15.7%
AALI PT Astra Agro Lestari Tbk 0.78 0.16 120% -80.0%
KLBF PT Kalbe Farma Tbk 0.49 0.53 11% 7.1%
* earning growth down, up or slowed compared to previous quarter
CompaniesQuarterly Earning (Rp Trillion) Earning Growth (%)
Code Changes*
Source: IDX

Q1
Q2
Q3
Q4
Q1
Q2
Q3
Q4
Q1
Q2
Q3
Q4
Q1
Q2
Q3
Q4
Q1
Q2
Q3
Q4
Q1
Q2
Q3
Q4
Q1
Q2
Q3
Q4
Q1
Q2
Q3
Q4
Q1
Q2
Q3
Q4
Q1
Q2
Q3
Q4
Q1
2005 2006 2007 2008 2009 2010 2011 2012 2013 2014 2015
0
1
2
3
4
5
6
7
8
5.14
5.03 4.92
5.01
4.71
% YoY
Weak companies performance was also translated into economic slowdown in the Q1-2015
13
Source: Statistics Indonesia
Average Indonesia economic
growth for 10 years is 5.73%
“Indonesia is one of only few countries survive Global Economic Slowdown in 2008-9 without falling into a recession”
Indonesia economy in the first quarter 2015 is recorded 4.71% (yoy) or lower than previous quarter at 5.01% (yoy) and analyst forecast at 4.94%. This is the slowest economic growth since Q3-2009 or during the global financial crisis.
Almost all sectors point to flat-to-lower growth. The main driver was mining sector as it contracted 2.32% yoy in 1Q15 from 2.22% yoy in 4Q14 particularly caused by coal
Other sectors contributing to growth slowdown were wholesale & retail trade, manufacturing, and construction
Furthermore, economic slowdown also contributed by weak government expenditure & investment activities

Brazilian Real
Turkish Lira
Bulgarian Lev
Romanian Leu
Czech Koruna
Indonesian Rupiah
Argentine Peso
Peruvian New Sol
Colombian Peso
Hungarian Forint
Polish Zloty
Malaysian Ringgit
Mexican Peso
South African Rand
Thai Baht
Indian Rupee
Singapore Dollar
South Korean Won
Hong Kong Dollar
Chinese Renminbi
Chilean Peso
Philippine Peso
Taiwanese Dollar
Russian Ruble
-11.49
-8.95
-7.71
-7.04
-6.60
-5.58
-5.55
-5.50
-4.81
-4.65
-3.11
-2.89
-2.55
-1.88
-1.52
-0.96
-0.70
-0.27
0.03
0.14
0.29
0.58
3.62
21.77
Dec-12
Mar-13
May-13
Jul-13
Sep-13
Nov-13
Jan-14
Mar-14
May-14
Jul-14
Sep-14
Nov-14
Jan-15
Mar-15
May-15
78
80
82
84
86
88
90
92
94
96
98
100
102
Indonesia economic slowdown was overshadowed by the trend of US dollar appreciation
14
Source: Bloomberg
Currency changes against US Dollar31 Dec 2014 – 21 May 2015 (%) US Dollar Index* Movement
USD has appreciated around 19.4% against world's major currencies since early 2013
*) The US Dollar Index is an index that measures the relative value of the US dollar against a basket of currencies of major countries includeEuro (EUR), Japanese Yen (JPY), Poundsterling (GBP), Canadian Dollar (CAD), Swedish Krona (SEK), and Swiss Franc (CHF)
Average US Dollar Index Dec 2012-21 May 2015 :
84.2
+19.4%

How is the impact on Indonesia capital market ? (1/2)Rupiah depreciation provides additional risk to foreign investor
15
Source: Bloomberg
60
70
80
90
100
110
120
130
140
150
160143.2
97.56
JCI in IDR (Domestic Investor)
JCI in USD (Foreign Investor)
Dec 2010 = 100

16
Source: IDX
How is the impact on Indonesia capital market ? (2/2)Rupiah depreciation has raised concern on recent capital outflow
Figures in Billion Rupiah
5,695
11,242
1,828 722
(356)
(20,132)
(2,480)
(5,695)
(365)(1,981)
(3,859)(5,266)
2,330
7,817
14,476
8,672 8,089
2,738
13,070
(1,317)
(7,402)
(3,202)
5,281
(7,954)
212
10,608
(5,426)
5,896
(3,018)2011
2012
2013
J an Feb Mar Apr
May Jun Jul Aug Sep Oct Nov Dec20
14 J an Feb Mar Apr May Jun Jul
Aug Sep Oct
Nov
Dec
2015 J an Feb
Mar
Apr
May
24,290
15,881
(20,647)
42,598
8,272

Going forward, volatility in the financial sectors are still in placeMarkets are assessing the Fed policy on potential rate hikes – Fed Fund Rate (timing, size, & pace)
17
Source: Bloomberg, Fed minutes
'00 '01 '02 '03 '04 '05 '06 '07 '08 '09 '10 '11 '12 '13 '14 '150
1
2
3
4
5
6
7
8
Fed Fund Rate
“The Fed had raised FFR up to 400 bps before The U.S. subprime mortgage crisis”
• In the latest FOMC meeting, majority of members has reduced the FFR projection in 2015 to 0.625 %, lower than previous projection of 1.125%.
• Meanwhile, FFR projection in 2016 is also lowered to 1.875% compared to the previous projection of 2.5%.
%

The increase in FFR will lift the short term volatility in the stock market
18
The period in which The Fed start to reduce its assets purchase program and raising the plan to increase FFR
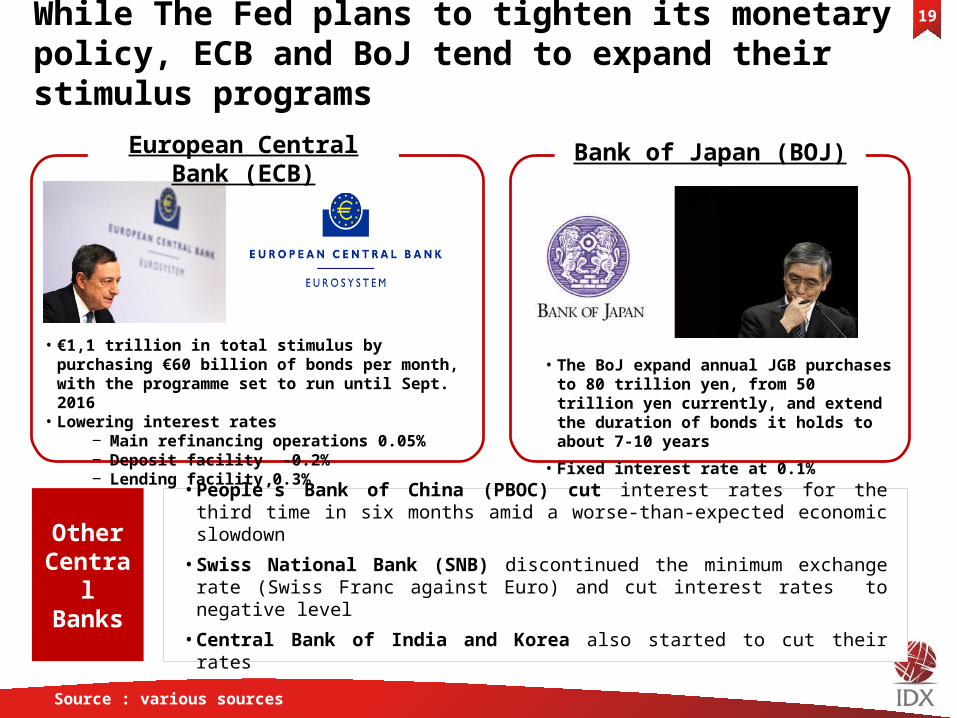
While The Fed plans to tighten its monetary policy, ECB and BoJ tend to expand their stimulus programs
19
Other Central Banks
European Central Bank (ECB) Bank of Japan (BOJ)
• €1,1 trillion in total stimulus by purchasing €60 billion of bonds per month, with the programme set to run until Sept. 2016
• Lowering interest rates ‒ Main refinancing operations 0.05%‒ Deposit facility -0.2%‒ Lending facility 0.3%
• The BoJ expand annual JGB purchases to 80 trillion yen, from 50 trillion yen currently, and extend the duration of bonds it holds to about 7-10 years
• Fixed interest rate at 0.1%
• People’s Bank of China (PBOC) cut interest rates for the third time in six months amid a worse-than-expected economic slowdown
• Swiss National Bank (SNB) discontinued the minimum exchange rate (Swiss Franc against Euro) and cut interest rates to negative level
• Central Bank of India and Korea also started to cut their rates
Source : various sources

As ECB and BoJ move to greater stimulus, increase in global liquidity is expected to drive sentiment higher
20
(Central Bank balance sheet as % of GDP)
2008 2009 2010 2011 2012 2013 2014 20150
10
20
30
40
50
60
70
80
90
Japan
Eurozone
Average
US
BoJ to buy JGBs at an annual rate of ¥80 tn (USD705 bn)
Projection
ECB to start simulus amounting USD1,2 trillion until September 2016
Source : Eastpring Investment, Bloomberg
Global Liquidity Projection in 2015Index Return
(Jan 2015 - 21 May 2015)
India : BSE Sensex 30
Indonesia: IHSG
Thailand : SET Index
Malaysia: FTSE Bursa Malaysia
Singapore: Straits Times
US: Dow Jones
US: S&P500
Australia : All Ordinaries
UK : FT100
Philippines : PSE Index
South Korea: KOSPI
Japan: Nikkei 225
Hong Kong: Hang Seng
France : CAC 40
Germany : DAX
China: Shanghai
1.13%
1.65%
1.91%
1.92%
2.22%
2.60%
3.49%
5.10%
6.81%
8.36%
10.82%
15.77%
16.60%
20.45%
21.00%
40.03%

IDX Future Prospects And Challenges

Despite the potential pressure in the stock market, the prospects for Indonesia economy is predicted to remain solid
22
Consuming Class population estimation by 2030
Million People1
Supported by the fact that most of the population is in the productive age and it is
expected to increase ...... along with the increasing numbers of people that would
join Indonesia’s consuming class
40
2010 20203 2030 in 5-6% GDP Scenario
2030 in 7% GDP Scenario
240 265 280 280
Indonesia Population Pyramid2010 Indonesia Census
1) Rounded to the nearest five million2) Consuming class defined as individuals with an annual net income of above $3.600 at 2005 purchasing power parity (PPP)3) Based on annual GDP growth of between 5 %and 6%
Population Median Age: 29 year
Supported by young and productive ages population
0-45-910-1415-1920-2425-2930-3435-3940-4445-4950-5455-5960-6465-6970-7475-7980-8485-8990-9495+
0-45-910-1415-1920-2425-2930-3435-3940-4445-4950-5455-5960-6465-6970-7475-7980-8485-8990-9495+
12,0
00,0
00
8,00
0,00
0
4,00
0,00
0 0
4,00
0,00
0
8,00
0,00
0
12,0
00,0
00
WomanMan
Pro
du
ctiv
e
Ag
eBelow
Consuming Class
Consuming Class2
Population
Additional people in the consuming class 90 125
Source: McKinsey
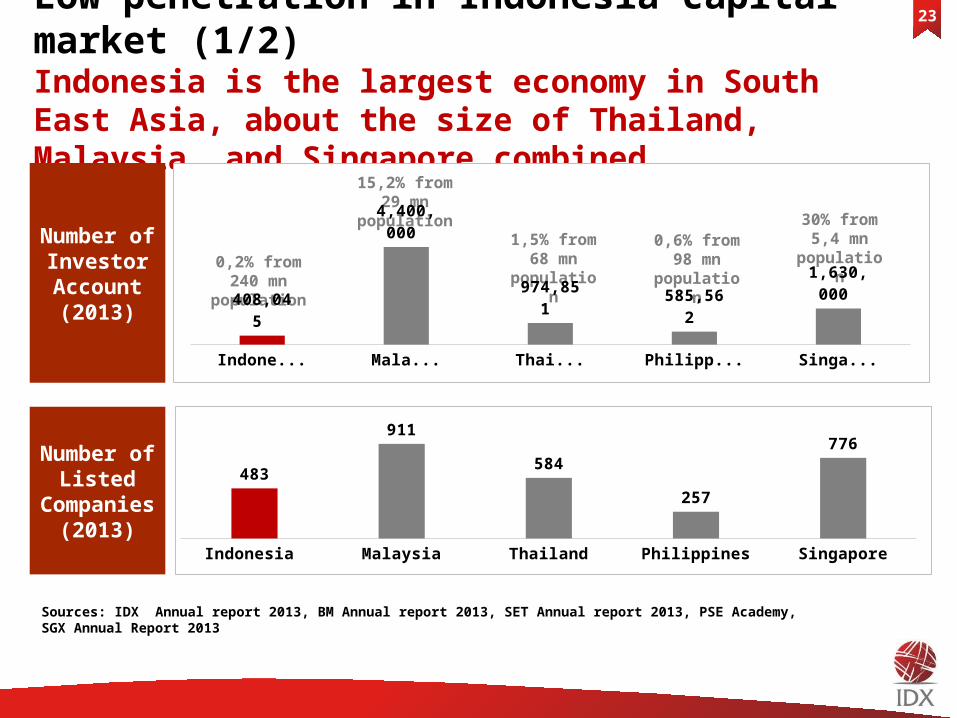
Low penetration in Indonesia capital market (1/2)Indonesia is the largest economy in South East Asia, about the size of Thailand, Malaysia, and Singapore combined
23
Number of Investor Account(2013)
Number of Listed
Companies(2013)
0,2% from 240 mn population
15,2% from 29 mn population
1,5% from 68 mn
population
0,6% from 98 mn
population
30% from 5,4 mn
population
Indonesia Malaysia Thailand Philippines Singapore
408,045
4,400,000
974,851 585,562
1,630,000
Indonesia Malaysia Thailand Philippines Singapore
483
911
584
257
776
Sources: IDX Annual report 2013, BM Annual report 2013, SET Annual report 2013, PSE Academy, SGX Annual Report 2013
24
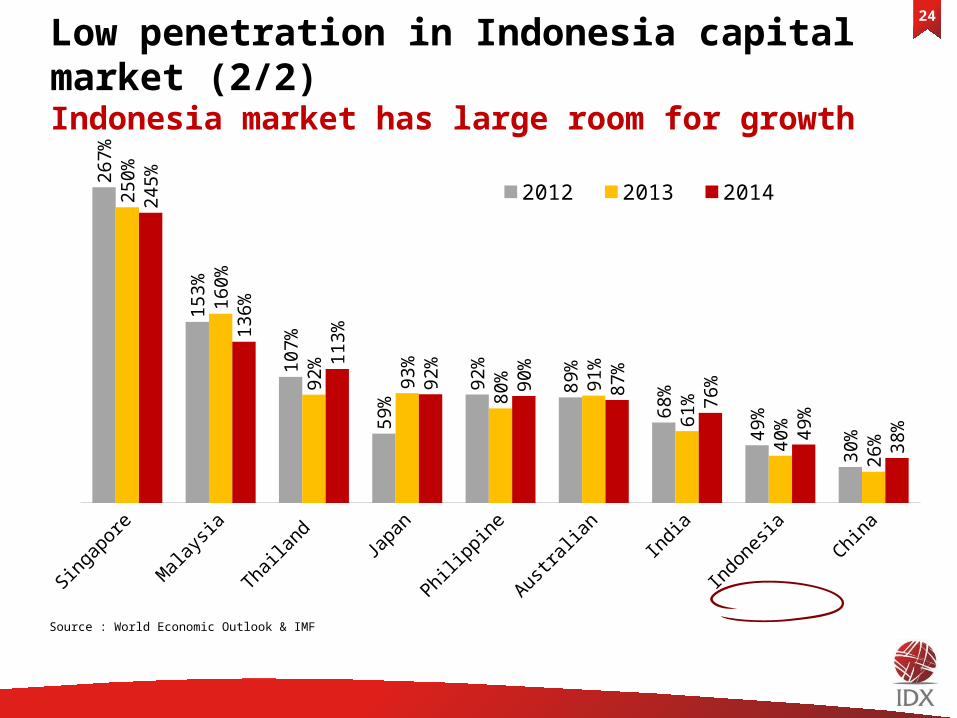
Singapore Malaysia Thailand Japan Philippine Australian India Indonesia China
267%
153%
107%
59%
92%
89%
68%
49%
30%
250%
160%
92%
93%
80% 91
%
61%
40%
26%
245%
136%
113%
92%
90%
87%
76%
49%
38%
2012 2013 2014
Source : World Economic Outlook & IMF
Low penetration in Indonesia capital market (2/2)Indonesia market has large room for growth

25
Potential Challenges for Indonesia Capital Market
• Supply To increase number of issuers Developing new product
• Demand To increase number of domestic investors Improving public awareness about investment in capital
market• Infrastructure & Technology
To provide high capacity of trading and surveillance system
• Increased HR/Professional in Capital Market The Regulatory & Supervision Function (OJK, IDX, KPEI, KSEI) The Capital Market Supporting Profession (Brokerages, Fund
Managers, Underwriters, Auditors, Bank Custody, etc)
1
2
3
4

26
Thank you


![CMPEN 472 Lecture Reference Materialkxc104/class/cmpen472/17s/lec/L02CMPEN472Lec… · imm dir ext rel idx idx idx idx idx idx idxi idx2 [idx2] [d,idx] ... 3905 3909 390b 390e 3910](https://static.documents.pub/doc/80x56/5aa3101d7f8b9a1f6d8e0e86/cmpen-472-lecture-reference-kxc104classcmpen47217slecl02cmpen472lecimm-dir.jpg)


