Wrocław University of Technology Centre of Advanced Materials and Nanotechnology Materials Science Poland International Seminar Nanomaterials - Simulations and Experiments Łódź, Poland, 15-16 April 2005 Guest Editor Jacek Ulański Vol.24 • No. 2/2 • 2006 Oficyna Wydawnicza Politechniki Wrocławskiej
Transcript
Wrocław University of Technology Centre of Advanced Materials and Nanotechnology
Materials Science Poland
International Seminar Nanomaterials - Simulations
and Experiments Łódź, Poland, 15-16 April 2005
Guest Editor Jacek Ulański
Vol.24 • No. 2/2 • 2006
Oficyna Wydawnicza Politechniki Wrocławskiej
reprografia
Wiersz
reprografia
Wiersz
Materials Science is an interdisciplinary journal devoted to experimental and theoretical research into the synthesis, structure, properties and applications of materials.
Among the materials of interest are: • glasses and ceramics • sol-gel materials • photoactive materials (including materials for nonlinear optics) • laser materials • photonic crystals • semiconductor micro- and nanostructures . piezo-, pyro- and ferroelectric materials • high-Tc superconductors • magnetic materials • molecular materials (including polymers) for use in electronics and photonics • novel solid phases • other novel and unconventional materials
The broad spectrum of the areas of interest reflects the interdisciplinary nature of materials research. Papers covering the modelling of materials, their synthesis and characterisation, physicochemical aspects of their fabrication, properties and applications are welcome. In addition to regular papers, the journal features issues containing conference papers, as well as special issues on key topics in materials science.
Materials Science is published under the auspices of the Centre of Advanced Materials and Nanotechnology of the Wrocław University of Technology» in collaboration with the Institute of Low Temperatures and Structural Research of the Polish Academy of Sciences and the Wrocław University of Economics.
All accepted papers are placed on the Web page of the journal and are available at the address: http://MaterialsScience.pwr.wroc.pl
Materials Science is abstracted/indexed in: Chemical Abstracts; Materials Science Citation Index; Science Citation Index Expanded.
Ludwig J. Balk, Wuppertal, Germany Mikhaylo S. Brodyn, Kyiv, Ukraine Maciej Bugajski, Warsaw, Poland Alexander Bulinski, Ottawa, Canada Roberto M. Faria, São Carlos, Brazil Reimund Gerhard-Multhaupt, Potsdam, Germany Paweł Hawrylak, Ottawa, Canada Wacław Kasprzak, Wrocław, Poland Andrzej Kłonkowski, Gdańsk, Poland Seiji Kojima, Tsukuba, Japan Shin-ya Koshihara, Tokyo, Japan Marian Kryszewski, Łódź, Poland Krzysztof J. Kurzydłowski, Warsaw, Poland Janina Legendziewicz, Wrocław, Poland Benedykt Licznerski, Wrocław, Poland
Jerzy Lis, Cracow, Poland Tadeusz Luty, Wrocław, Poland Joop H. van der Maas, Utrecht, The Netherlands Bolesław Mazurek, Wrocław, Poland Jan Misiewicz, Wroclaw, Poland Jerzy Mroziński, Wrocław, Poland Robert W. Munn, Manchester, U.K. Krzysztof Nauka, Palo Alto, CA, U.S.A. Stanislav Nespůrek, Prague. Czech Republic Romek Nowak, San Jose, CA, U.S.A. Marek Samoć, Canberra, Australia Jan Stankowski, Poznań, Poland Jacek Ulański, Łódź, Poland Vladislav Zolin, Moscow, Russia
Drukarnia Oficyny Wydawniczej Politechniki Wrocławskiej Zam. nr 499/2006.
Contents
From the Editors 419 W. M. Bartczak, J. Stawowska, Hydrogen atoms at the palladium surface, at the MgO surface and
at the Pd-MgO metal-support boundary. Towards computer modelling of the spillover effect... 421 B. Kuchta, L. Firlej, Mechanism of adsorption in cylindrical nanopores. The roles of adsorbate-
adsorbate interactions in stabilizing the adsorbed phase 433 L. Firlej, В. Kuchta, Melting transitions of monolayers adsorbed in cylindrical nanopores 443 P. Polanowski, M. Kozanecki, T. Pakula Non-mononotonical behaviour of reaction diffusion
front width. Simulation studies in frame of dynamic lattice liquid (DLL) model 453 P. Ulański, S. Kadłubowski, J.K. Jeszka, Nanogel formation by intrachain radiation-induced
cross-linking. Simulation and experiment 467 S. Kripotou, P. Pissis, E. Kontou, A.M. Fainleib, O. Grygoryeva, I. Bey, Structure-property
relationships in brittle polymer networks modified by flexible cross-links 477 A. Ziabicki, B. Misztal-Faraj, interpretation of light depolarization data in terms of polymer
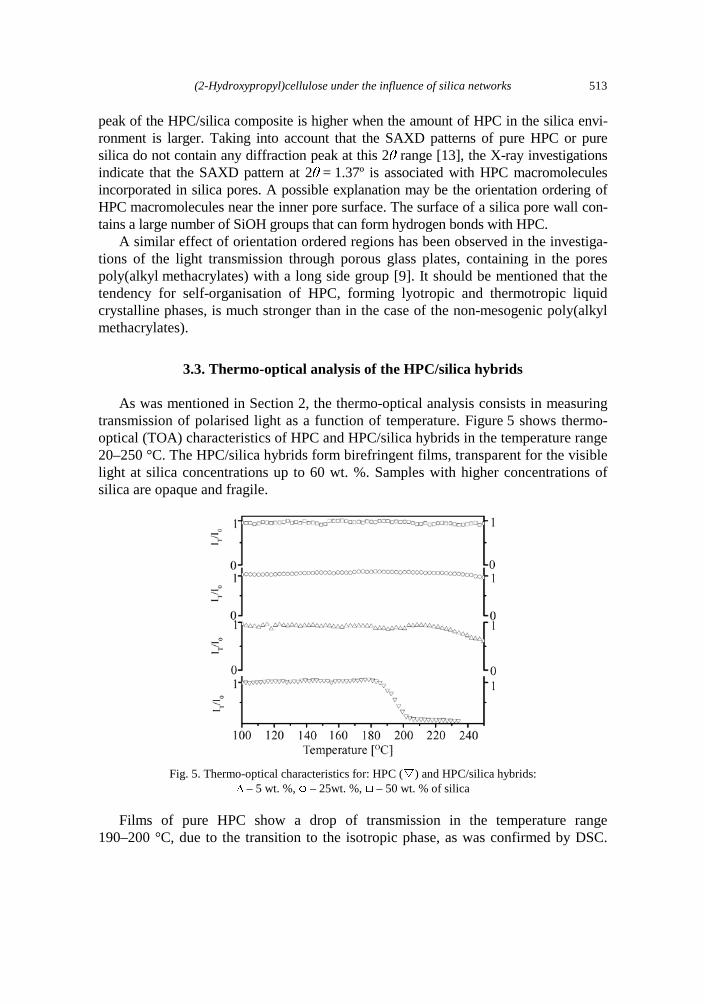
crystallinity 493 P. Wojciechowski, T. Halamus, U. Pietsch, Mesomorphic organisation of (2-hydroxypropyl)-
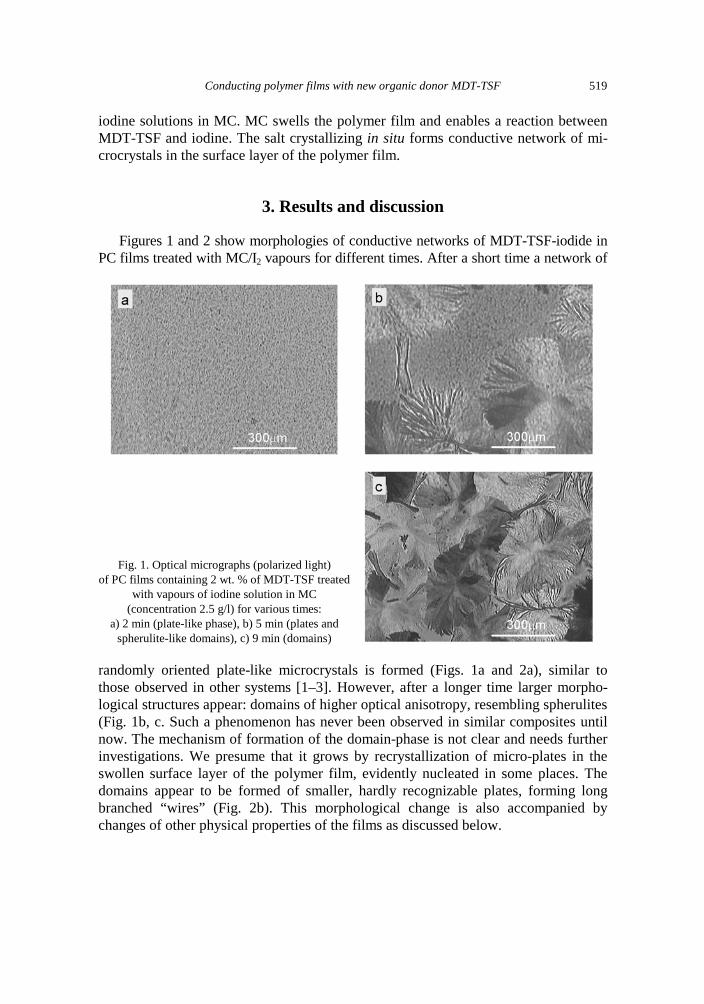
cellulose under the influence of silica networks 507 A. Tracz, A. Mierczyńska, K. Takimiya, T. Otsubo, N. Niihara, J. K. Jeszka, Conducting polymer
films with new organic donor MDT-TSF: preparation and properties 517 A. Rybak, J. Jung, W. Ciesielski, J. Ulanski, Photovoltaic effect in novel polysilane with phe-
nothiazine rings and its blends with fullerene 527
From the Editors
In April 2005, we were celebrating 80th birthday of Professor Marian Kryszewski, prominent scientist in the field of physics and physical chemistry of polymers in Poland and founder of the scientific school of polymers in Łódź. On this occasion, Department of Molecular Physics of the Technical University of Łódź organised the International Seminar Nanomaterials - Simulations and Experiments.
The Seminar was organised under the auspices of the Network of Excellence of 6th Framework Programme of the European Union NANOFUN-POLY (Nanostructured and Functional Polymer-Based Materials and Nanocomposites). Several distinguished scientists, both members of and from outside the Network, delivered lectures to over 100 participants taking part in the sessions and in vivid discussions.
The lecture hall was full when a special session, honouring Professor Marian Kryszewski, was arranged on the first day of the Seminar. The event gathered many representatives of universities and research centres, friends, co-workers and former students from all over Poland and from abroad. The title of honorary professor was conferred on Professor Kryszewski by the Wrocław University of Technology. Professor Marian Kryszewski was accepting the honours, congratulations and wishes with some embarrassment. He was taking active part in the scientific sessions of the Seminar and in the discussions, and it was clear that for him it was the scientific programme that was the main point of the event.
Several participants accepted invitation to submit papers to a special issue of Ma-terials Science-Poland, dedicated to Professor Marian Kryszewski on his 80 birthday. We were not aware that only few months later we would gather again: Professor Marian Kryszewski passed away on 5th October 2005. This special issue is dedicated to his memory .
Jacek Ulański - Guest Editor Juliusz Sworakowski - Editor-in-Chief
A biographical note of Professor Marian Kryszewski was published in Materials Science-Poland, Vol. 23, No. 3 (2005).
Materials Science-Poland, Vol. 24, No. 2/2, 2006
Hydrogen atoms at the palladium surface, at the MgO surface and at the Pd–MgO metal-support boundary.
Towards computer modelling of the spillover effect
W. M. BARTCZAK, J. STAWOWSKA*
Institute of Applied Radiation Chemistry, Technical University of Łódź, ul. Wróblewskiego 15, 93-590 Łódź, Poland
The work is devoted to computer modelling of interactions of atomic hydrogen with palladium and MgO surfaces, and with Pd atoms adsorbed on MgO surface. Quantum calculations were performed using the methods of the Density Functional Theory (DFT) with gradient-corrected functionals for electron exchange and correlation. The potential energy surfaces were calculated for a hydrogen atom interacting with Pd and MgO surfaces. The results indicate an easy (0.17 eV activation barrier) diffusion of hydrogen atoms over the metal surface. A possibility of migration of H atoms from the metal surface onto the MgO support surface (the “spillover effect”) is discussed. It was found that the transfer of a hydrogen atom from the vicinity of a Pd atom to O sites of the MgO surface results in the energy gain of the order of 0.5 eV. The transfer, however, is an activated process with the activation energy about 0.8 eV.
An important model of catalysis is represented by the behaviour of the simplest mole-cule, H2, dissociating on surfaces of transition and noble metals, and their alloys. Subse-quent migration of atomic hydrogen over the metal surface and possible migration to a different phase (support) provide a classical definition of the “spillover effect” [1].
Metal particles supported on oxides make an important group of catalysts in the heterogeneous catalysis. The active phase is composed of a transition or noble metal, simple metal oxides being selected for the support phase. Magnesium oxide is fre-quently selected due to its favourable thermal and mechanical properties.
The literature on catalysis contains a large number of papers on the H atom inter-action with metals, mostly Pd, Pt, Ni, Ag and Cu. The book [2] contains a useful re-view of early theoretical work, and is still worth revisiting, in spite of a large number
of theoretical papers on the topic. Calculations of electronic properties of transition metals performed by traditional ab initio methods were not very successful. Salahub, Morokuma and other authors advocated the use of the density functional theory (DFT) rather than the classical Hartree–Fock scheme. There exists a large number of review papers and compilations on this topic and the proceedings of a recent ACS Sympo-sium [3] can serve as a source of references. A significant progress in the transition- -metal calculations is connected with the “gradient-corrected” density functionals, sometimes referred to as non-local functionals [4].
Recent years brought a continuous stream of papers devoted to the problem of hy-drogen adsorption on metals, in particular on palladium. Numerous references and a detailed treatment of hydrogen interaction with Pd have also been given in the re-cent book by Gross [5] and in the review paper by Efremenko [6]. A number of au-thors applied the DFT method with local density approximation and generalized gra-dient approximation (GGA) and with periodic boundary conditions. For instance Paul and Sautet [7], and Løvvik and Olsen [8] investigated adsorption of atomic hydrogen on the palladium [111] surface. GGA calculations are also presented in the papers by Dong and Hafner [9], Ledentu et al. [10], and Dong et al. [11]. Okuyama et al. [12] performed a detailed experimental investigation of hydrogen adsorption at Pd [100] surface and penetration into the bulk of Pd.
Interaction of metals with the MgO surface was the subject of numerous theoreti-cal and experimental papers [13–19]. Metals like Ni, Pd, Pt, W form relatively strong covalent bonds with the MgO surface with the binding energy of the order of 1 eV per metal atom, oxygen sites of the MgO lattice making preferred metal positions. Calcu-lations of the interaction of Pd with MgO reported in [20] predict the binding energy on top of the O site to be 1.35 eV and the distance from the O site equal to 2.11 Å. The binding energy of Pd on top of the Mg site is only 0.43 eV. Giordano et al. [17] performed calculations of Pd deposit on the MgO surface and found a favourable ad-sorption of Pd over the oxygen vacancies. Vervish and coworkers [18] applied the ab initio quantum chemical calculations and second moment approximation to analyse the development of the structure of larger Pd clusters on MgO surface.
In contrast to numerous studies of metal adsorption on the MgO surface, we are unaware of any recent quantum calculations which consider the transfer of atomic hydrogen to the surface of support which is the basis for the spillover phenomenon. Therefore, the aim of the present work is to investigate interactions of the atomic hy-drogen with the surface of MgO and particularly the interactions with the MgO sur-face containing adsorbed Pd atoms, and to investigate a possibility of the transfer of hydrogen atoms from the metal onto the MgO surface.
2. Method of calculations
The quantum-chemical calculations were performed using the DFT part of the Gaussian98 [21] suite of programs. The gradient-corrected Becke functional for the
Towards computer modelling of the spillover effect
423
exchange [4] has been applied in our calculations. We used the Perdew-1986 correla-tion functional [4] and combined it with the former functional to the form of the B3P86 hybrid functional (the code words for different functionals are commonly ac-cepted and explained, for instance, by Koch and Holthausen [4]). However, in order to check the sensitivity of the calculations to the exchange–correlation functional, we performed calculations of the hydrogen binding energy to metals and to MgO for the B3LYP and B3PW91 hybrid functionals and the standard BP86 functional [4]. We found that various functionals give potential energy surfaces with almost identical geometries, though the energy surfaces are slightly shifted for different methods. As a rule, we obtained the highest energy values for the BP86 functional, and lower val-ues for B3LYP and B3PW91. However, the differences between the highest and low-est energy values for the series of functionals are within the range of 0.1 eV. Slightly lower values (by another 0.1 eV) were obtained for the B3P86 functional. Positive fea-tures of the latter functional were the stability and a relatively fast convergence of the calculations, thus we decided to use it as a standard functional for our calculations.
For all the calculations reported here, the LANL2DZ basis set was used. This is a full double-zeta set [22] which includes the Los Alamos effective core potentials due to Hay and Wadt [23]. The BSSE correction was calculated for the H atom inter-action with the Pd5 cluster (full energy surface) and with the (MgO)8 cluster. We found that the correction leads to a uniform shift of the binding energy surfaces by about 0.1 eV. Differences of the H atom energy for different positions over the cluster are not affected by the BSSE correction. As the computational cost of the calculation of the potential energy surfaces with BSSE is very high, and the correction does not change the potential barrier heights for the H atom movement, we decided to neglect it in the very time-consuming calculations of the H atom transfer from metal to MgO.
In the first part of the calculations, we studied the system composed of a hydrogen atom and a planar Metal5 cluster of the fcc structure ([100] surface). The internuclear distances between the metal atoms were fixed at the positions of the crystal lattice of the metal. The calculations have been performed for a large number of physically different positions (X,Y) of the H atom over the metal cluster. The (X,Y) points were selected inside of the Dirichlet region of the central Pd atom and then the rules of symmetry of the fcc lattice were applied to cover the whole cell. Thus, outside the central Dirichlet region the map does not correspond to a real Pd cluster but rather to an fcc lattice cell of the [100] surface. For a given (X,Y) point we performed calcula-tions of the energy of H–Metal5 system for different heights Z of the H atom above the metal plane and found an optimum value (Zopt) yielding the lowest energy of the system. The calculations were performed for the lowest possible spin states. After subtraction of the energies of the separated Metal5 cluster and H atom we obtain a three-dimensional plot of the H atom binding energy as a function of its (X,Y) posi-tion. The plot of Eb(X,Y,Zopt) forms the potential energy surface (PES).
In the calculations concerning MgO surface, on account of the ionic character of the MgO matrix, we checked very carefully the influence of distant ions on the H atom binding energy. Since calculations employing periodic boundary conditions have
W. M. BARTCZAK, J. STAWOWSKA 424
a strong drawback of replicating adsorbed atoms and also impose an artificial layer structure on the system, we selected another way of calculations. A bound hydrogen atom carries rather small fractional charge: from –0.04e at the Mg sites to about 0.2e in the vicinity of the O sites and the H polarizability is very small, of the order of 6.6×10⁻³¹ m3. This allows us to expect rather small influence of the distant ions on the H atom binding energy. To include the effect of the MgO ionic lattice we surrounded the cluster with the point charges. The calculations repeated for increasing number of point charges show that the system of (12×12 charges in a single layer)×4 layers is large enough to ensure the convergence of the binding energy.
We performed a series of calculations of a large MgO cluster and found the fol-lowing charges on the Mg and O sites for different definitions of the atomic charge: 1) for the Mulliken definition the charges on O sites were between –0.91e and –1.18e, on Mg sites between 0.96e and 1.3e; 2) for the Breneman and Wiberg definition of the charges fitted to electrostatic potential [21] the O sites were charged between –1.24e and –1.44e, the Mg sites between 1.29e and 1.43e; 3) for the Merz–Singh–Kollman definition [21] the O sites had charges between –1.3e and –1.57e and the Mg sites between 1.35e and 1.57e. Hence we assumed the unit values of the point charges, rather than the nominal ±2e. Thus, the total number of point charges included into the (MgO)6 cluster calculations was 564. It appears that for the hydrogen atom the contri-bution is negligible, of the order of 0.01 eV in most of the (X,Y) points. The contribu-tion scales linearly with the assumed site charge and, therefore, it is also negligible for the ±2e charges.
3. Results and discussion
3.1. Interaction of hydrogen with palladium surface
Figure 1 shows results of the calculations for the H–Pd system performed using the B3P86 model. The upper part of the figure shows a three-dimensional plot of the H atom binding energy Eb as a function of the (X,Y) coordinates of the hydrogen atom over the Pd surface cell. The unit X, Y of coordinates is 1.945 Å. On the energy sur-face of Figure 1 we observe a deep valley (marked white and very light grey) where the H atom binding energy is much lower than anywhere else in the cell. The valley is perpendicular to the Pd–Pd bonds and halves the bond. The cross-section of the en-ergy surface along the direction Y = 1 – X perpendicular to the bond is given in Figure 2 together with the plots for different DFT versions and functionals.
The range of the coordinate in the cell is –1 ≤ X ≤ 1. From X = 0.5 (over the Pd–Pd bond centre) up to X = 0.96 (or to 0.04 in the other direction) the energy is practically constant. A slight variation in energy, of the order of 0.01 eV, is certainly below the accuracy of the calculations. Between X = 0.96 and X = 1 (or between X = 0.04 and X = 0) the energy slightly increases, by about 0.17 eV. Crossing this barrier means
Towards computer modelling of the spillover effect
425
that the H atom is transferred to another surface cell. Hence, the barrier along the line Y = 1 – X can be interpreted as the activation barrier for a diffusive movement of the H atoms over the surface of palladium. The activation energy for the H atom diffusive motion at the surface is about 0.17 eV, i.e. 3.9 kcal/mol with the barrier width about 0.08 Å. Both the thermal mechanism and quantum-mechanical tunnelling give very significant probability of the barrier crossing.
Fig. 1. Upper figure: 3-D plot of the binding energy of a single H atom in different positions over the elementary surface cell (fcc [100]) of palladium. Lower figure: a 3-D plot of the
optimized distance of a H atom over the Pd cell, Zopt. The unit on the X and Y axis is 1.945 Å. The coding of the energy and the distance scale is given in the figure.
The calculations have been performed by the DFT/B3P86 method
The optimum distance Z of the H atom from the Pd plane (lower part of Fig. 1) varies quite significantly over the positions in the cell. The „on top” position (X = 0, Y = 0) is characterized by relatively large distance Z = 1.52 Å. The „on bridge” position (X = 0.5, Y = 0.5) shows a shorter distance Z = 0.98 Å. The movement of the H atom from the „on bridge” point along the Y = 1 – X line towards the cell edge is character-ized by a steady decrease of the Z distance. In the vicinity of the cell edge (at the top of the barrier, X = 0, Y = 1) the Z distance falls down to 0 Å. This means that at the
W. M. BARTCZAK, J. STAWOWSKA 426
foot of the barrier the H atom, which is placed very close to the Pd surface plane, can choose one of the two possible paths: either migrate at the surface crossing the barrier of about 4.0 kcal/mol or migrate under the surface with a similar barrier.
Okuyama et al. [12] estimated the barrier for the subsurface diffusion of the H atom to be ca. 1.1 kcal/mol. Paul and Sautet [7], in their calculations of the hydrogen adsorption on the Pd [111] surface, give somewhat different values. They obtained 7.6 kcal/mol for the subsurface penetration and roughly estimate 3.5 kcal/mol for the surface diffusion. Due to very low barriers, both paths are possible. Finally, it is worth mentioning that our result for the activation barrier for surface diffusion is very close to the measured activation energy of the H atom bulk diffusion in Pd which is 5.3 kcal/mol [24].
Fig. 2. Comparison of the H atom binding energy along the direction Y = 1 – X (perpendicular to the Pd–Pd bond) in a unit Pd cell. X axis unit corresponds to 1.945 Å.
The calculations were performed using the DFT method with the exchange-correlation functionals as labelled in the figure
The binding energy for hydrogen atom as predicted by different DFT models is shown in Figure 2. The figure shows the results for the DFT calculations with gradi-ent-corrected hybrid functionals: B3P86, B3PW91 and B3LYP, for gradient-corrected DFT with the “pure” BP86 functional and for the local DFT with the SVWN (combi-nation of the Slater exchange and Vosko–Wilk–Nusair correlation [4]) functional. The values of the binding energy and the geometry of the surface are slightly different for different methods, but for all the PES surfaces we observe a flat valley perpen-dicular to the Pd–Pd bond (Y = 1 – X) ending with low and narrow energy barrier.
In Figure 2 we compare the energy variation along the line Y = 1 – X for different computational models. The different methods result in the shift of the energy plateau at the bottom of the valley but the height of the barrier is roughly the same, of the order of 0.2–0.3 eV. It is interesting to note that the hybrid functionals predict more
Towards computer modelling of the spillover effect
427
narrow barrier than the remaining two functionals. More results are given in [25]. However, the general conclusion holds for all the models: the valley Y = 1 – X and its symmetric counterparts provide an easy diffusion path for atomic hydrogen on the palladium surface, the path ends at the edge of the Pd cell providing channels for the H atom penetration beneath the metal surface.
3.2. Calculations of the energy surface for an H atom interacting with MgO clusters
Figure 3 shows the energy surface for the H atom interacting with the MgO sur-face. A cluster of 8 MgO pairs in the single layer was used in the calculations, its
Fig. 3. Upper figure: a 3-D plot of the binding energy surface of a H atom in different positions over (MgO)8 cluster surrounded by point charges. For a given position (X,Y)
over the MgO cell the distance Z of the H atom from the MgO plane was optimised in order to obtain the highest binding energy. The unit on the X and Y axis is 2.106 Å.
Lower figure: the optimum distance Z of the H atom as a function of (X,Y)
geometry being that of the surface of the MgO crystal (fcc [100] structure). The clus-ter was embedded into the system of four layers of point charges described in the pre-vious section, 560 charges altogether. The calculations have been performed for
W. M. BARTCZAK, J. STAWOWSKA 428
a large number of physically different positions (X,Y) of the H atom over the MgO square and then the rules of symmetry of the fcc lattice were applied to cover the whole cell. For a given (X,Y) point we performed the calculations of the energy of H–(MgO)8 system for several heights Z of the H atom above the MgO plane and found the value of Zopt that yields the lowest energy of the system. The binding energy of H atom was calculated as a difference of the total energy of the H(MgO)8 cluster and and the sum of energies of the separate H atom and (MgO)8 cluster.
The analysis of the surface points to large energy differences between different places in the MgO cell. The energetically favourable place for the H atom is over the O2– ion, the binding energy being about –2.79 eV. It is interesting to note that the re-gion of the lowest energy is near the oxygen site, the energy profile over the remain-ing part of the cell being rather flat. In the central region of the cell, the H binding energy is about –0.7 eV and at the Mg site increases up to –0.47 eV. The shape of the energy surface rules out the possibility of an easy migration of the H atom over the MgO surface. The potential barrier along the oxygen-oxygen line is about 2.11 eV. We cannot exclude, however, jumps to the neighbouring oxygen sites either by the over-barrier mode (catalytic processes frequently proceed at rather high temperatures which makes activated jumps rather easy) or by the under-barrier (tunnelling) mode even at lower temperatures.
The lower part of Figure 1 shows optimized distances of the H atom from the MgO plane. The largest distance corresponds to the H atom over the Mg site (2.1 Å), at the cell centre the distance is about 1.7 Å, the distance at the O sites is only about 1.0 Å. The shortest distance of the adsorbed hydrogen from the MgO plane, 0.7 Å, appears on the diagonal line connecting the O sites, roughly halfway between the O site and the cell centre.
The fractional charge of H is 0.36e directly above the oxygen site and about 0.3e in its vicinity. When the (X,Y) point is removed from the O site by more than 0.3 unit, the fractional charge decreases to almost 0. The small values of the fractional charge prevail over about 80% of the surface of the cell. Directly above the Mg site, the H charge is –0.05e. The small values of the hydrogen charge suggest rather negligible influence of distant ions. The correction to the H atom binding energy that results from the presence of the point charges surrounding the MgO cluster is of the order of 0.01 eV with the exception of the position directly over the O site where the energy increases sharply to about 0.03 eV.
3.3. Calculations of the energy surface for H atom interacting with Pd-MgO clusters
A substantial part of our work was focused on explaining the transport of a hydro-gen atom from metal (Pd, Ni) to the MgO support. The results for Pd are given in Figures 4 and 5. Figure 4 shows the potential energy surface for the H atom interact-ing with the Pd(MgO)6 system. The Pd atom has been placed over one of the O sites,
Towards computer modelling of the spillover effect
429
at a distance of 2.1 Å between the nuclei. This value results from separate optimisa-tion runs in which the Pd atom was placed at different positions over the MgO sur-face. The structure with the lowest energy corresponds to the Pd atom over the O site in the lattice. The geometry of the cluster is shown in the lower part of the figure. Similarly as for the previous calculations of H–MgO, the cluster was surrounded by a system of point charges.
Fig. 4. Left figure: the energy surface for the H atom binding in different positions over the MgO cell with adsorbed Pd atom. The Pd atom is placed over one of the oxygen sites in the MgO lattice at the height of 2.1 Å. The H–Pd(MgO)6 cluster is surrounded by the system of 12×12×4 point charges. The unit on the X and Y axes is 2.106 Å. Right figure: the optimum
distance Z of the hydrogen atom from the MgO plane as a function of the position (X,Y) over the MgO cell. The geometry of the system is shown in the lower part of the figure
The left figure shows the energy surface. It appears that the hydrogen binding en-ergy has a local minimum of –2.5 eV for the position of the H atom directly above the adsorbed Pd atom. The minimum is surrounded by a flat, roughly circular region with the radius of ca. 1 Å and with energy between –2.4 eV and –2.2 eV. When the H atom is shifted along the O(Pd)-O axis from the position on the top of Pd to the nearest O site, it has to cross two potential barriers: the lower one of 0.2 eV and the higher one of 0.6 eV and of 0.4 Å width. The profile of the binding energy along the O-O axis is shown in Figure 4. Beyond the second barrier, we observe a rapid decrease of the H atom energy down to –3 eV as compared with –2.4 eV on the top of Pd and –2.6 eV in the vicinity of Pd. We conclude that the H atom initially adsorbed at the metal site can be transferred to the O site of the MgO lattice with the energy gain of ca. 0.4 eV. The
W. M. BARTCZAK, J. STAWOWSKA 430
right part of the figure shows the optimized distance of the H atom as a function of the position (X,Y) over the MgO cell.
Fig. 5. Upper part: isosurfaces of the electron den-sity (ρ = 0.08 e/Å2) for the H–Pd(MgO)6 cluster
with H atom in different positions along the O(Pd)–O diagonal. The positions of the Mg, O
and Pd, H atoms are marked as small grey spheres. Lower part: the H atom binding energy
to the Pd(MgO)6 cluster along the diagonal in the MgO cell
Figure 5 gives more information about the H atom transfer. The lower part of the figure shows the binding energy profile of a hydrogen atom along the line from the O/Pd site with the adsorbed Pd atom to the nearest O site in the MgO lattice. The en-ergy is shown as a function of the X component of the translation vector (X, Y = X), with X = 1 corresponding to the O/Pd position and X = 0 to the O site. The upper part of the figure shows isosurfaces of the electron density for ρ = 0.08 e/Å2 as the gray shaded regions. The small spheres indicate the positions of the O, Mg and Pd atoms. The plot for X = 1 shows the electron density distribution for the H atom adsorbed on top of Pd atom. The high density bridge (chemical bond) suggests localized, covalent bond between Pd and H. The plot for X = 0.4 shows the density distribution for the base of the high potential barrier. The H atom is directed towards the O site, the H–Pd bond is weaker but not completely broken. The plot for X = 0.3 shows the density distribution for the top of the potential barrier, i.e. the transition state. The H–Pd bond is already broken (energy demand) but the H–O bond is not formed due to a large distance between the reacting centres. The last plot for X = 1 shows the final state with the strong H–O bond (high density bridge between H and O). The plots imply that the energy barrier in the process of the H atom transfer from Pd to the O site re-sults from the necessity of a prior breaking of the H–Pd bond without any energy compensation from the newly forming H–O bond. The H atom transfer results in the
Towards computer modelling of the spillover effect
431
translation by about 4.1 Å: 2.97 Å in the horizontal direction and 2.8 Å in the vertical direction. The distance is very large on the scale of the chemical bonds; this explains why the H–Pd bond must be completely broken first (energy demand) and then, after a further translation the H–O bond can be formed (energy gain). Thus, the transition state may be interpreted as a state in which the H–Pd bond is already broken and the H–O bond is only beginning to form.
Summarizing, our calculations of the H atom transfer from palladium to the MgO support surface result in the conclusion that the H atom transfer is energetically fa-vourable. The excess energy is not very large and can be roughly estimated as 0.5 eV. This finding is essential for the possibility of the inverse spillover effect which has also been observed in experiments – the hydrogen atom comes back to the metal is-land. The existence of potential barriers for the spillover transition makes the phe-nomenon sensitive to temperature. However, in order to arrive at more quantitative conclusions more computational effort is required. This work is currently performed in our laboratory.
The hydrogen atoms are trapped around the metal island, in the vicinity of the O site. This finding is essential for the possibility of the surface reactions: the phase boundary around the metal island collects the H atoms which spillover from the metal catalyst and makes the stage for numerous surface reactions.
References
[1] Spillover of Adsorbed Species G.M. Pajonk, S.J. Teichner, J.E. Germain (Eds.), Elsevier, Amster-dam, 1983.
[2] YOSHIDA S., SAKAKI S., KOBAYASHI H., Electronic Processes in Catalysis, Wiley-VCH, New York, 1994. [3] Transition State Modeling for Catalysis, D.G. Truhlar, K. Morokuma (Eds)., ACS Symposium Se-
ries vol. 215, American Chemical Society, Washington, 1999. [4] KOCH W., HOLTHAUSEN M. C., A Chemist’s Guide to Density Functional Theory, Wiley-VCH, New
York, 2000. [5] GROSS A., Theoretical Surface Science. A Microscopic Perspective, Springer, Berlin, 2003. [6] EFREMENKO I., J. Molecular Catal. A, 173 (2001), 19. [7] PAUL J.-F., SAUTET P., Phys. Rev. B, 53 (1996), 8015. [8] LØVVIK O. M., OLSEN R.A., Phys. Rev. B, 58 (1998), 10890. [9] DONG W., HAFNER J., Phys. Rev. B, 56 (1997), 15396.
[10] LEDENTU V., DONG W., SAUTET P., Surface Sci., 413 (1998), 518. [11] DONG W., KRESSE G., HAFNER J., J. Mol. Catalysis A, 119 (1997), 69. [12] OKUYAMA H., SIGA W., TAKAGI N., NISHIJIMA M., ARUGA T., Surface Sci., 401 (1998), 344. [13] HASS G., MENCK A., BRUNE H., BARTH J. V., VENABLES J.A., KERN K., Phys. Rev. B., 61 (2000),
11105. [14] LOPEZ N., ILLAS F., ROSCH N., PACCHIONI G., J. Chem. Phys., 110 (1999), 4873. [15] MUSOLINO V., SELLONI A., CAR R., J. Chem. Phys., 108 (1998), 5044. [16] PACCHIONI G., ROSCH N., J. Chem. Phys., 104 (1996), 7329. [17] GIORDANO L., GONIAKOWSKI J., PACCHIONI G., Phys. Rev. B, 64 (2001), 075417. [18] VERVISCH W., MOTTET C., GONIAKOWSKI J., Phys. Rev. B, 65 (2002), 245411. [19] RICCI D., PACCHIONI G., SUSHKO P. V., SHLUGER A., J. Chem. Phys., 117 (2002), 2844. [20] NEYMAN K. M., ROSCH N., PACCHIONI G., Appl. Catal. A., 191 (2000), 3.
W. M. BARTCZAK, J. STAWOWSKA 432
[21] Gaussian 98 (Revision A.9), Gaussian Inc., Pittsburgh PA, 1998. [22] DUNNING T.H., HAY P.J., [in:] Modern Theoretical Chemistry; H.F. Schaeffer III (Ed.), Plenum, New
York, 1976, p. 1. [23] HAY P.J., WADT W.R., J. Chem. Phys., 82 (1985), 270; 284; 299. [24] Hydrogen in Metals, Vol. I, II, G. Alefeld, J. Volkl (Eds.), Springer, Berlin, 1978. [25] BARTCZAK W. M., STAWOWSKA J., Struct. Chem., 15 (2004), 451.
Received 30 May 2005 Revised 28 December 2005
Materials Science-Poland, Vol. 24, No. 2/2, 2006
Mechanism of adsorption in cylindrical nanopores. The roles of adsorbate–adsorbate interactions in stabilizing the adsorbed phase
B. KUCHTA1*, L. FIRLEJ
2
1Laboratoire des Matériaux Divisés, Revêtement, Electrocéramiques (MADIREL), Université de Provence, Centre de Saint-Jérôme, 13397 Marseille, France
2Laboratoire des Colloïdes, Verres, Nanomatériaux (LCVN), Université Montpellier II, 34095, Montpellier, France
Mechanism of adsorption in nanometric cylindrical pores has been analysed. Grand canonical Monte Carlo simulations were performed for two model systems: krypton and argon, adsorbed in an ideal (smooth) cylindrical silica pore of diameter 2R = 4 nm. The role of interatomic (adsorbate–adsorbate) interactions and atom–wall (adsorbate–adsorbent) forces in the mechanism of adsorption has been dis-cussed. It has been shown that the correlation between these two energy components plays a crucial role in layering and capillary condensation transitions. The stability of different stages of adsorption has been analysed and discussed taking into consideration fluctuations of energy and number of adsorbed atoms during simulations.
Key words: adsorption mechanism; nanopores; Monte Carlo simulations
1. Introduction
Mechanism of adsorption of atoms and molecules on surfaces is a phenomenon that depends on many parameters such as thermodynamic conditions, the structure of the surface, interaction between adsorbed particles (adsorbate–adsorbate) as well as between the surface and the particles (adsorbate–adsorbent). Early theories of adsorp-tion (e.g., Langmuir theory [1, 2]) and some of the most frequently used models (e.g., BET model [3]) ignored the lateral interaction between particles of adsorbate and explained the adsorption isotherms using only vertical components of the interaction. Although this seems to be rather important constrain that can result in underestimating _________
monolayer adsorption [4], BET isotherms are still the most frequently used in the analysis of experimental adsorption data.
Smooth surfaces are important model systems that help to understand the underly-ing adsorption mechanism. On such surfaces, at relatively low temperatures, step-wise behaviour is observed experimentally. Methane adsorption on MgO [5, 6], (at 87.4 K and at 77 K), on nano-porous graphite [7] (at 77 K ), as well as on exfoliated graphite and graphite foam [8], are the examples. Oxygen adsorbed on graphite exhibits layer-ing transitions, between crystalline layers below 43.8 K and liquid-like layers at higher temperature [9]. Argon exhibits a ‘re-entrant’ layering behaviour [9], in which layerwise transitions disappear near 69 K and then reappear near 74 K. The micro-scopic mechanism of the transitions has been studied using theoretical models [10]
and computer simulation methods. Layering transitions have been found in cylindrical pores of diameter 14σ (σ is the Lennard–Jones parameter) [11], in models of nano-tubes with nitrogen and Ar as adsorbed atoms [12], in slit pores (adsorption of meth-ane [13]) and in argon films on graphite [14]. The interaction models are the most important components of the numerical approaches. Obviously, the atom–wall com-ponent of interaction is necessary for adsorption to take place but it is the inter-atomic, lateral interaction that determines structures of the adsorbed phase.
In this paper, we analyse the role of correlation between the lateral (interatomic) and vertical (atom–wall) components of interaction in the mechanism of adsorption in cylindrical nanopores. We use the Monte Carlo simulations to model a system of amorphous silica pore walls, with Kr or Ar atoms as the adsorbed species. To exclude any possible influence of the wall heterogeneity on the adsorption mechanism, we limited our analysis to a non-corrugated (smooth) wall. The adsorption was simulated at two temperatures: 77 K and 115 K. At 77 K (the temperature that is probably most frequently used in experimental characterization of porous systems) Kr forms solid layers and Ar liquid layers in silica pores. At 115 K, both Kr and Ar layers are liquid. We analyze the amplitude of fluctuations of adsorbed mass and energy to understand the mechanism of adsorption and we show that their character determines the stability of the system and its susceptibility to phase transformations. This information can be exclusively provided by simulation methods.
2. Monte Carlo ensemble and pore model
The simulation conditions were defined in the same way as in the previous papers [15–17]. The adsorbed gases were krypton or argon. We used a smooth cylindrical pore of nanometric size (R = 2 nm). The interaction parameters [18] were chosen to describe interactions of Kr and Ar in the MCM-41 material. MCM-41 structure was modelled as an array of oxygen atoms, each one interacting with adsorptive atoms via a potential based on the Lennard–Jones (LJ ) [6–12] model:
Adsorption in cylindrical nanopores
435
12 6
( ) 4V rr r
σ σε⎛ ⎞⎛ ⎞ ⎛ ⎞= −⎜ ⎟⎜ ⎟ ⎜ ⎟⎜ ⎟⎝ ⎠ ⎝ ⎠⎝ ⎠
(1)
with ε and σ being constants. The skeletal density is assumed to be the same as that proposed by Maddox [20], that is 27 T-sites (Si atoms) per nm3. We have not included inter-pore interaction because fluid–fluid interactions between atoms in adjacent pores proved to be negligibly small for the wall thickness of our system (w = 1 nm).
A conventional grand canonical MC ensemble was applied. The simulation box (5.0 nm long, with periodic boundary conditions along the axis of the pore) was as-sumed to be in equilibrium with the bulk gas obeying the ideal gas law. This allowed us to use the external gas pressure as the thermodynamic parameter instead of the chemical potential [19]. Trial moves included translations of atoms, insertion of new atoms and removal of existing ones. The system typically contained 1000–1300 ad-sorbed atoms in the MC box. Typical runs consisted of ~106 MC steps per atom. The main results were extracted from the previously equilibrated runs.
3. Results and discussion
We started the analysis of adsorption in our model pore assuming a hard-core in-teratomic interaction and a LJ potential describing the atom–wall interactions. Such situation may be considered as a Langmuir-like model with physical adsorption, with all adsorption sites having the same energy and with no activation energy for the ad-sorption process. Once a site is occupied, the hard-core potential excludes other atoms from this site. The first layer completed, the adsorption is stopped unless the wall interaction is strong enough to initiate adsorption of atoms in the next layer.
Fig. 1. Krypton adsorption at 115 K in a cylindrical pore of the radius R = 2 nm. “Effective’’ hard-core means the effective atom–wall interaction that gives the average energy per atom comparable
with the LJ interaction model: a) isotherms, b) fluctuations of the number of adsorbed atoms
B. KUCHTA, L. FIRLEJ 436
Figure 1 shows isotherms of adsorption of krypton at T = 115 K, the simulated us-ing hard core and LJ intermolecular potentials. A simple comparison proves that the intermolecular interaction plays a crucial role in the mechanism of adsorption and, on the microscopic level, it is impossible to substitute intermolecular interaction by ef-fective vertical forces. The difference between the hard-core and the soft LJ interac-tion models becomes even more pronounced at lower temperatures (T = 77 K) where the adsorbed layers are solid (Fig. 2). In this case, the layers are formed in a very abrupt way. Such a behaviour could never be observed when only atom–wall interac-tion were taken into account because, obviously, it is induced by the interatomic en-ergy, responsible for the collective adsorption phenomenon. Therefore, such a mecha-nism cannot be deduced from classical Langmuir nor BET adsorption theoretical models. As could be expected, the lower the temperature, the more important are dif-ferences between isotherms generated with soft and hard type interaction models. These differences are easily seen when fluctuations of the adsorbed amount are com-pared. Contrary to the hard-core model, the system modelled with the LJ interaction exhibits enormous fluctuations when krypton undergoes the layering transition at 77 K (Fig. 2b). At a higher temperature (Fig. 1b), the fluctuations are smaller but still there exist maxima around the pressure of the first layer formation and when the cap-illary condensation is initiated. The magnitude of the latter fluctuations suggests that the increasing number of the adsorbed atoms (Fig. 1a) above the first layer cannot be stabilized in the layered structure (even as a metastable phase) hence the capillary condensation occurs.
Fig. 2. Krypton adsorption at 77 K in a cylindrical pore, R = 2 nm: a) isotherms, b) fluctuations of the number of adsorbed atoms. The insert in (a) shows details
of the isotherm near the layering transition. The symbols as in Fig. 1
An analysis of energies and of their fluctuations provides an additional insight into the role of the inter-atomic interaction. At a higher temperature (115 K, Fig. 3), the adsorption starts at a relatively low pressure. Increasing pressure stabilizes the ad-sorbed layer: the total energy fluctuations decrease, being lower in the LJ model than in the hard-core model (Fig. 3a). At the same time, the fluctuations of two components
Adsorption in cylindrical nanopores
437
of the total energy in the LJ model behave in a non-monotonic way (Fig. 3b). The fluctua-tions of the interatomic energy show a stabilizing character when the first layer is formed and destabilizing before the initiation of the capillary condensation. At pressures corre-sponding to the first layer formation (p ~ 100–150 mbar, Fig. 3b) the fluctuations of the atom–wall component of the energy also exhibit a minimum indicating its stabilizing influence on the layer structures. This shows that there is a correlation between intera-tomic and atom–wall interactions leading to a compensation between both compo-nents of the total energy. At a lower temperature (77 K, Fig. 4), the compensating effect is weaker. Here, fluctuations of the interatomic energy are so strong that they suppress the fluctuations of the other component. As a result, the total energy fluctua-tions increase when the layering transition is approaching. These results indicate that the mechanism of layering depends on the state of the adsorbed layer. For solid layers the layering has a character of a sharp transition whereas it is rather continuous in liquid layers.
Fig. 3. Krypton adsorption at 115 K: a) total energy fluctuations, b) its components (wall and interaction) fluctuations in LJ model
Fig. 4. Krypton adsorption at 77 K (LJ model): a) energies, b) energy fluctuations
B. KUCHTA, L. FIRLEJ 438
The energy fluctuations give an important insight into the energy landscape of the system. Statistical thermodynamics shows that the square of the amplitude of the en-ergy fluctuations defines the specific heat of the system, i.e., the amplitude of energy fluctuations characterizes the stability of the system. In other words, it indicates a susceptibility of a system to make a transition into another (meta)stable state. Fig-ure 5a presents the energy fluctuations of the system near the layering transition. There is a dramatic decrease of the fluctuations when the system transforms from the 2D gas state into a solid monolayer structure because the system is stabilized by the interatomic energy. Such a transition is not possible when only vertical interactions are present (Fig. 5b) because there is no driving force which could rearrange the ran-domly distributed adsorbed atoms into another more stable structure.
Fig. 5. Fluctuations of the interatomic and atom–wall energies during GCMC runs (p = 0.379 mbar, T = 77 K): a) LJ model, the transition between 2D gas phase and the first layer stabilizes the system,
b) hard-core model, no transition is observed; ΔE values represent the mean amplitudes of fluctuations
The crucial role of the interatomic interaction can also be seen from our simulation of the Kr adsorption isotherm at 77 K. At pressures corresponding to formation of the first layer from the 2D gas (p ~0.37–0.38 mbar, see insert in Fig. 2a), the system exhibits enor-mous fluctuations between gas-like and solid phases. Figure 6 shows two examples of typical MC runs observed at these conditions. Clearly, the system exhibits a bimodal be-haviour: it jumps between two coexisting states being unable to stabilize any intermediate situation. Such a behaviour is a direct consequence of properties of the adsorbent model we used: smooth cylindrical walls and strong interatomic interactions. In these conditions, one can stabilize a full layer structure but not a partially adsorbed one. However, the tem-perature can modify the character of this step-wise behaviour: the higher the temperature, the more important is the entropy factor stabilizing the adsorbed structure and intermediate states between complete layer structures. The adsorption occurs in a more gradual way, although its general step-wise characteristic is always preserved. The isotherm at 115 K (Fig. 1a) shows such a characteristics. It is important to emphasize that an ideal smooth surface of the walls always prefers a step-wise adsorption in nanometric pores. As has already been discussed in our previous paper [15], a heterogeneous wall is necessary to observe more steady and gradual isotherms of adsorption.
Adsorption in cylindrical nanopores
439
Fig. 6. Examples of fluctuations of the number of atoms at pressures where a layering transition is observed in krypton at 77 K
Fig. 7. The pressure of the layering transition (first layer formation) and capillary condensation
of krypton as a function of the strength parameter s (s defines the effective parameter εeff of the LJ
atom–wall potential (Eq. (1)): εeff = sε
Evidently, the pressure and the character of the layering transition depend on the atom–wall interaction. A stronger atom–wall interaction makes the layering transition sharper [17], at the same time lowering both the capillary condensation pressure and the layering pressure (Fig. 7). This general tendency is directly seen in Fig. 8 which presents a simulated isotherm of Ar adsorption at 77 K. The simulations performed for various strengths of the atom–wall interaction show that the vertical interaction affects all observed transitions: first layer formation (2D gas – solid layer), first-second layer transition and the capillary condensation pressure. All of them are shifted towards lower pressures when the atom–wall interaction becomes more attrac-tive. This effect is well understood in the case of the first layer formation because stronger attractive forces facilitate the adsorption and allow the system to be adsorbed at a lower pressure. The influence of the atom–wall interaction strength on the second layer is not so obvious. Generally, from the structural and energetic point of view, the higher layer can be formed when: (i) the atom–wall interaction is still important at the second layer position or/and (ii) the structure of the previous layer is very different from the average liquid configuration. In the case of Kr, at 77 K, the second layer was observed only when the atom–wall interaction is sufficiently strong. Otherwise, the capillary condensation occurred directly, without a second layer formation (see
B. KUCHTA, L. FIRLEJ 440
Fig. 7). In this case, the second (or any higher) layer is not stabilized but is followed by an immediate higher layers adsorption, up to a complete filling of the pore.
Fig. 8. The isotherms of adsorption of Ar in the pore (T = 77 K) for various strengths
of the atom–wall interaction
Fig. 9. The energies and energy fluctuations corresponding to the isotherm of adsorption of Ar atoms (see Fig. 8, s = 1.0)
Figure 9 shows the energies and their fluctuations along the argon adsorption iso-therm at 77 K. The energies do not exhibit any singular behaviour. The interatomic energy stabilizes the monolayer system. When the second layer starts to be adsorbed, the mean wall energy (per atom) becomes smaller (in absolute value) because the atoms are located farther from the surface. During the adsorption process the fluctua-tions of energies show very interesting features: the inter-atomic energy fluctuations show a maximum every time when a new layer is formed and when the capillary con-densation approaches. At the same time, the wall energy fluctuates in a cooperative way to compensate the interatomic energy fluctuations, showing a minimum when the first layer is formed but exhibiting maxima when a higher layer is formed or capillary condensation is observed. As a consequence, total energy fluctuations decrease with increasing pressure.
Adsorption in cylindrical nanopores
441
4. Conclusions
Obviously, the analysis of both interatomic and atom–wall interactions is crucial for understanding the microscopic mechanism of adsorption, especially in a confined geometry. There exists a strong correlation between them leading to collective effects that are important for the mechanism of formation of the adsorbed system. We have shown that although the increasing pressure stabilizes the total system, the two com-ponents of energy may exhibit destabilizing behaviour, compensated by each other, but in fine facilitating the adsorption. It is a competition (but also a correlation) be-tween intermolecular and atom–wall interactions that leads to transitions in adsorbed systems.
We found that the mechanism of the layering transition depends on the state of the adsorbed layer. A solid layer is formed as a sharp transition from a 2D adsorbed gas phase, at a well defined pressure. A liquid layer is formed in a continuous way, pass-ing through intermediate stages of adsorption. It is a consequence of the interatomic interaction energy that determines the stable structure and usually prefers more or-dered situations at lower temperatures. At higher temperatures, where the entropy contribution becomes more important, the intermediate situations become also more stable, although always exhibiting much larger fluctuations than the full monolayer structure. Obviously, fluid complete layers are always more stable than the intermedi-ate structures.
We have shown that the fluctuation-based analysis provides new information al-lowing one to better understand the layer formation and phase properties in confined systems. Evidently, the free energy calculations would be desired to complement this approach.
References
[1] LANGMUIR I., J. Am. Chem. Soc., 38 (1916), 2221. [2] LANGMUIR I., J. Am. Chem. Soc., 40 (1918), 1361. [3] BRUNAUER S., EMMET P.H., TELLER E., J. Am. Chem. Soc., 60 (1938), 309. [4] SERI-LEVY A., AVNIR D., Langmuir, 9 (1993), 2523. [5] GAY J.M., SUZANNE J., COULOMB J.P., Phys. Rev., B41 (1990), 11346. [6] MADIH K., CROSET B., COULOMB J.P, LAUTER H.J., Europhys. Lett., 8 (1989), 459. [7] LARESE J.Z., HARADA M., PASSEL L., KRIM J., SATIJA S., Phys. Rev., B37 (1988), 4735. [8] BIENFAIT M., ZAPPENFELD P., GAY J.M., PALMARI J.P., Surface Sci., 226 (1990), 327. [9] YOUN H.S., HESS G.B., Phys. Rev. Lett., 64 (1990), 443.
[18] SIPERSTEIN F.R., GUBBINS K.E., [in:] F. Rodrigues-Reinoso, B. McEnaney, J. Rouquerol, K. Unger (Eds.), Characterisation of Porous Solids VI, Elsevier, 2002, p. 647.
Melting transitions of monolayers adsorbed in cylindrical nanopores
L. FIRLEJ1*, B. KUCHTA
2
1Laboratoire des Colloïdes, Verres, Nanomatériaux (LCVN), Université Montpellier II, 34095, Montpellier, France
2Laboratoire des Matériaux Divisés, Revêtement, Electrocéramiques (MADIREL), Université de Provence, Centre de Saint-Jérôme, 13397 Marseille, France
Melting of krypton layers adsorbed in models of MCM-41 porous silica and of carbon nanotubes has been simulated using Monte Carlo methods. We have shown that the melting mechanism depends on the strength of the atom–wall interaction and on the number of layers adsorbed in the pore. Every new layer stabilizes the layers already present in the system. In the carbon nanotubes we found that adsorption of the second layer leads to a freezing of the first one at constant temperature.
Key words: porous material; melting; freezing; Monte Carlo simulations
1. Introduction
Studies of melting and freezing in confined geometry are of practical relevance to such areas as weathering of rocks, frost heaving, oil industry, properties of porous media and many others. A number of developments resulted in finding the field inter-esting from a fundamental point of view. Many novel structures with quasi-ideal, iso-lated cylindrical or slit-shaped pores of nanometric size are now available. Experi-ments performed on these model porous materials show a melting point elevation in narrow pores, in contrast to the almost universally observed depression of transition temperature in larger pores. In some cases the mechanism of transitions appears to be fundamentally different from those observed in bulk materials.
The influence of the confinement on the solid-liquid transition follows directly from the fact that if a liquid wets the walls in the presence of the solid phase, the liq-uid will be thermodynamically favoured in confinement. As a consequence, a lower-
ing of the melting temperature will be observed. The quantitative dependence of melt-ing (freezing) point depression ΔT = Tb – Tp resulting from the Clausius–Clapeyron equation has the form [1]:
[ ]2Δ
bl l s s
TT V V
H rγ γ
Δ= − − (1)
where Tb is the bulk melting temperature, Tp – melting temperature in a pore of a ra-dius r, ΔH is the enthalpy of melting, Vl and Vs – molar volumes of liquid and solid phases, respectively, and γl and γs the corresponding surface energies.
The above model of capillary melting is based on simple thermodynamics, without any reference to the molecular nature of the phase. Interactions between the pore wall and the confined particles are taken into account only as surface energy terms γl and γs. Such a simplification is obviously very restrictive and neglects many important factors that may affect the mechanism of melting [2–8]: various possible structures of the bulk solid, explicit structure of the pore walls, or more complex aspects such as epitaxy, lattice mismatch, crystalline defects, etc. The smaller the pore size, the more serious will be consequences of neglecting the detailed structure of the solid-surface interface. In fact, the structure of a confined solid phase may be different from that of the corresponding bulk phase existing at the same temperature, even for relatively large pore diameters. Additionally, the structure of the solid may vary with the dis-tance from the wall. In other words, the confined phase may be heterogeneous in the vicinity of pore walls. In nanometric pores this effect may concern the whole pore volume.
In this paper, we analyse the mechanism of melting of layers adsorbed in cylindri-cal nanopores. Our interest has been focused on two factors which may modify the character of melting: the strength of the atom–wall interaction and a corrugation of the wall. The model system is an isolated pore of the diameter of d = 4 nm with kryp-ton gas as the adsorbate. Two situations are analysed. The first one consists of a pore with only one layer adsorbed before the capillary condensation occurs. In this case, the adsorbent–pore wall interaction parameters have been chosen to mimic MCM-41 porous silica. The second situation represents a hypothetical carbon nanotube. In this case, for the same Kr adsorbate, one finds that two Kr layers can be adsorbed before the capillary condensation takes place. This fact is a consequence of stronger adsor-bate atom–wall interactions in carbon nanotubes than those in the silica based mate-rial. In real systems, the walls of both silica and carbon pores are corrugated. In the case of silica pores, however, the structure of the walls is amorphous, whereas in car-bon nanotubes the graphite-like wall is regular and ordered. This difference results in a distribution of adsorption sites which is random and quasi-continuous in silica pores, and regular and discrete in carbon nanotubes. As a consequence, at least to a first approximation, a silica pore can be modelled by a smooth cylinder with an azi-muthally non-resolved strength of atom–wall interaction; we used this approach in
Monolayers adsorbed in cylindrical nanopores
445
this paper. On the contrary, carbon nanotubes were represented by their explicit atomic structure.
In Monte Carlo simulations presented here, the grand canonical ensemble (GCMC) has been used. When atoms have been confined in closed pores, the canoni-cal ensemble (CMC) has been used. The simulation box, containing one pore (with periodic boundary conditions along the tube axis) was assumed to be in equilibrium with the bulk gas obeying the ideal gas law. Trial moves included translations of at-oms, insertion of new atoms and removal of existing ones. The system typically con-tained from 600 to 1300 adsorbed atoms in the box. Typical runs consisted of at least 106 MC steps per atom. The main results were extracted from previously equilibrated runs.
The Kr–Kr interaction was modelled by the Lennard–Jones (LJ) potential
12 6
( ) 4V rr r
σ σε⎛ ⎞⎛ ⎞ ⎛ ⎞= −⎜ ⎟⎜ ⎟ ⎜ ⎟⎜ ⎟⎝ ⎠ ⎝ ⎠⎝ ⎠
(2)
with the standard interaction parameters: εKr–Kr/k = 171.0 K, σKr–Kr = 0.360 nm. The Kr–nanotube wall interaction was computed by a pair-wise summation of LJ potential (with the LJ parameters for Kr–C interaction obtained from Lorentz–Berthelot mixing rules taking εC–C/k = 28.0 K, σC–C = 0.34 nm). All interactions were calculated within a cutoff radius of 15 Å. Details of the Kr–silica wall interaction are given in [9].
2. Melting of a layer on a curved smooth surface
Figure 1 presents four isotherms of krypton adsorption in a smooth silica-like pore. Obviously, their character changes with temperature. Only at the lowest tem-perature presented here (77 K), the isotherm exhibits a very sharp formation of the first layer. As the temperature increases, the adsorption becomes more continuous, i.e., situations intermediate between a 2D gas and a monolayer are stabilized in the system. Thermodynamically, this is a consequence of increasing entropy of the ad-sorbed atoms stabilizing these disordered structures. One may speculate, however, that the evolution of the isotherm may also involve some structural changes. To fol-low this evolution in function of temperature we analyzed the structure of the ad-sorbed layer along a path corresponding to a constant reduced pressure p/pcond = 0.70 (pcond is the condensation pressure at a given temperature). This choice corresponds to thermodynamic conditions at which the first layer is already well defined and the cap-illary condensation is not expected yet. It is important to remember that the constant reduced pressure defines different real pressures at different temperatures because the condensation pressure is strongly temperature dependent.
Structural properties of a planar atomic layer are usually represented by parame-ters sensitive to the deformation of the ideal triangular plane structure. The calcula-
L. FIRLEJ, B. KUCHTA 446
tion of such a parameter in the case of cylindrical surface requires its unfolding into a plane layer. Then, one can apply the order parameter Φ6 defined by Mermin [10]:
61
1exp( 6 )
bN
kkb
iN
Φ θ=
= ∑ (3)
Φ6 measures the average bond order within a plane triangular atomic layer. Each nearest neighbouring bond has a particular orientation in the plane that can be de-scribed by the polar coordinate θk. The index k runs over the total number of nearest neighbour bonds Nb in the adsorbed layer. One expects that Φ6 = 1 in an ideal solid 2D hexagonal crystal and Φ6 = 0 when the state of adsorbed layer corresponds to a two-dimensional fluid.
Fig. 1. Adsorption isotherms of Kr in MCM-41 model system. The mean number of adsorbed atoms is drawn as a function of the reduced pressure p/pcond, where pcond is the capillary condensation
pressure at a given temperature. In our case, pcond(77 K) = 0.93 mbar, pcond(85 K) = 5 mbar, pcond(100 K) = 50 mbar, pcond(115 K) = 265 mbar. For clarity, each higher temperature
isotherm is shifted by 5 atoms/nm2 with respect to the previous one
Figure 2 shows the parameter Φ6 as a function of temperature, calculated along two thermodynamic paths. First, using the GCMC simulations we followed the path defined by the pressures corresponding to adsorbed and stable monolayer (p/pcond ≈ 0.7, as described above). This path corresponds to melting in an open system, where the pore is in equilibrium with the external gas. We also followed another path, corre-sponding to a closed pore. This simulation was performed in the NVT canonical en-
Monolayers adsorbed in cylindrical nanopores
447
semble. The number of atoms N was set to be equal to their mean atom number in a monolayer adsorbed at 77 K. A comparison of these two results emphasizes a differ-ent mechanism of transformations at each thermodynamic condition.
Fig. 2. Order parameter Φ6 of Kr monolayer in an open (grand canonical MC simulations along the P–T path, see text) and in closed (canonical MC simulations) MCM-41 pore
Fig. 3. Phase diagram of krypton adsorbed in a smooth silica-like pore. The equilibrium line between solid and liquid monolayer phase is indicated
First of all, the transition between solid and liquid layer is much more continuous in the closed pore system than in the open one. This difference results from the fact that atoms in the closed system are not allowed to desorb and leave the pore. Thus melting is initiated by promoting the adsorbed atoms to the second layer. As a conse-quence, vacancies are formed in the first layer. The melting starts around them and progresses until the number of vacancies is large enough to make the whole layer
L. FIRLEJ, B. KUCHTA 448
melted. This observation proves the importance of the vacancy formation in the melt-ing mechanism in pores, similar to melting on plane surfaces [11, 12]. Another impor-tant observation was that the melting of the monolayer did not show any sign of hys-teresis. This means that the mechanism of melting in confined geometries is different from that in 3D systems where it is expected to be of the first order type because of the important symmetry difference between crystal and liquid phase.
The GCMC simulation repeated along several isotherms allowed us to calculate a phase diagram of the krypton adsorbed in smooth wall cylindrical pore (Fig. 3). This phase diagram includes a 2D gas phase, monolayer phase and solid 3D phase (above the capillary condensation pressure). The melting transition within monolayer is ob-served in the range of a few degrees (~75–80 K), depending on the pressure of the external gas. This value is much lower than the melting temperature in a totally filled pore, above the capillary condensation (~90 K [13]). This indicates that the mecha-nism of melting is different in both situations. Obviously, the existence of the neighbouring layers may modify the thermodynamic properties of the confined sys-tem. Some aspects of this effect are discussed below in the case of Kr adsorption in carbon nanotube.
3. Melting of a layer in corrugated pores
Figure 4 presents characteristic isotherms of krypton in carbon nanopores, at tem-peratures ranging between 90 K and 130 K. Although the overall character of adsorp-tion changes with temperature, the adsorption isotherms remain of a stepwise type up to 130 K. There is always the first and the second layer formation before the pore is filled in the process of capillary condensation. This situation allowed us to study melt-ing properties of the first layer as a function of the total loading in the pore, up to the capillary condensation. As will be seen below, the second layer adsorption has a pro-nounced influence on the properties of the first one.
Figure 5 presents the evolution of the order parameter within the first adsorbed layer along the same isotherms as on Figure 4. At 90 K the adsorbed krypton layer is solid over the whole range of pressures. There is a small increase of the order parame-ter when the second layer is adsorbed and then when the pore is completely filled due to the capillary condensation. Such an evolution seems quite natural: each next layer stabilizes the previous ones hence the total stability of the confined system increases.
Above ~95 K the first layer is fluid. However, its state depends strongly on the ex-ternal pressure, i.e., on the loading of atoms in the pore. The variation of the order parameter suggests a continuous solidification of the first layer as a function of the external gas pressure. This very peculiar ‘re-entrant’ transition is observed between ca. 95 K and 110 K. At these temperatures the first layer (solid at 90 K) melts but it solidifies when the second layer is adsorbed. Above 130 K the situation changes once again: the second layer does not induce any solidification of the first layer, and only the capillary condensation makes it solid again.
Monolayers adsorbed in cylindrical nanopores
449
Fig. 4. Adsorption isotherms of Kr in a carbon nanotube. The mean number of adsorbed atoms is drawn as a function of the reduced pressure p/pcond, as in Fig. 1. The pressures
Fig. 5. Order parameter Φ6 of Kr monolayer in open-ended carbon nanotube (grand canonical MC simulations)
L. FIRLEJ, B. KUCHTA 450
It is worth remembering that the bulk 3D triple point for Kr atoms appears at ca. 118 K. The results presented above prove that the melting temperature may be either decreased or increased in a confined system. The key factor that determines the tem-perature and the mechanism of transformation is the strength of the wall–atom inter-action. However, geometrical constraints play an important (albeit more subtle) role as well. An interesting illustration of this conclusion can be observed in Figure 5 for T = 100 K. In this case the order parameter in the first layer reaches its maximum in the absence of the second one. However, when the second layer begins to be adsorbed, the order in the first layer slightly decreases. This subtle effect is a consequence of the ge-ometry (size and form) of the pore which defines the mean interatomic distance, i.e., the structure in each layer. A priori, if there is a mismatch between the mean interatomic distance imposed by the pore and the interatomic distance in the bulk solid, adsorption of the second layer may impose a slight deformation of the first one. The whole ad-sorbed system reaches a more stable configuration when the first layer structure is dif-ferent from the one that could be expected from the atom–wall interaction only. This is the case of Kr adsorbed in a graphitic nanotube of 4 nm diameter, at 100 K. At higher temperatures, due to the entropy factor, the first layer is already more disordered and a small influence of the second layer is not seen in the order parameter.
4. Conclusions
The simulations of Kr in two types of nanometric cylindrical pores showed that the confined geometry modifies the thermodynamic and structural properties of the adsorbed layers. The shape of the pore and its volume impose geometrical constraints which destabilize the adsorbed system with respect to the 3D bulk material. As a con-sequence, the effect generally leads to a lower melting temperature in confinement than in the bulk.
The system remains always very heterogeneous: the properties of each adsorbed layer depend on its distance from the pore wall. In particular, the mechanism of melt-ing transition is different in each layer and, additionally, it varies with the amount of atoms adsorbed in the pore. This observation, very interesting from the point of view of basic science, has also important practical consequences in the case of nanopores where only few layers are adsorbed.
Another important factor is the strength of the atom–wall interaction. As could be clearly seen from the presented results, it affects particularly the properties of the first few layers next to the pore wall. When only one layer is adsorbed, its melting tem-perature is even lower than that in a totally filled pore. When the following layer is built, its presence affects the mechanism of melting of the first one. Depending on the strength and corrugation of the atom–wall interaction the influence of the interface between the adsorbed system and the walls may be extended up to the layers more distant from the pore wall. Consequently, melting is a complicated succession of tran-sitions where different layers melt at different temperatures.
(1999), 1573. [3] SLIWINSKA-BARTKOWIAK M., DUDZIAK G., SIKORSKI R., GRAS R., RADHAKRISHNAN R., GUBBINS K.E.,
J. Chem. Phys., 114 (2001), 950. [4] MADDOX M.W., GUBBINS K.E., J. Chem. Phys., 107 (1997), 9659. [5] MIYAHARA M., GUBBINS K.E., J. Chem. Phys., 106 (1997), 2865. [6] RADHAKRISHNAN R., GUBBINS K.E., SLIWINSKA-BARTKOWIAK M., J. Chem. Phys., 112 (2000), 11048. [7] DOMINGUEZ H., ALLEN M.P., EVANS R., Mol. Phys., 96 (1999), 209. [8] RADHAKRISHNAN R., GUBBINS K.E., Phys. Rev. Lett., 79 (1997), 2847. [9] MERMIN N.D., Phys. Rev., 176 (1968), 250.
[10] KUCHTA B., LLEWELLYN P., DENOYEL R., FIRLEJ L., Coll. Surfaces A, 241 (2004), 137. [11] FIRLEJ L., KUCHTA B., ETTERS R., PRZYDRÓŻNY W., FLENNER E., J. Low Temp. Phys., 122 (2001), 171. [12] ETTERS R., FLENNER E., KUCHTA B., FIRLEJ L., PRZYDROZNY W., J. Low Temp. Phys., 122 (2001), 121. [13] KUCHTA B., LLEWELLYN P., DENOYEL R., FIRLEJ L., Coll. Surfaces, A241 (2004), 137.
Received 15 April 2005 Revised 6 December 2005
Materials Science-Poland, Vol. 24, No. 2/2, 2006
Non-mononotonical behaviour of reaction diffusion front width. Simulation studies
in frame of dynamic lattice liquid (DLL) model
P. POLANOWSKI1*, M. KOZANECKI
1, T. PAKULA1,2
1Department of Molecular Physics, Technical University of Łódź, Żeromskiego 116, 90-924 Łódź, Poland
2Max-Planck-Institute for Polymer Research, Postfach 3148, 55021 Mainz, Germany
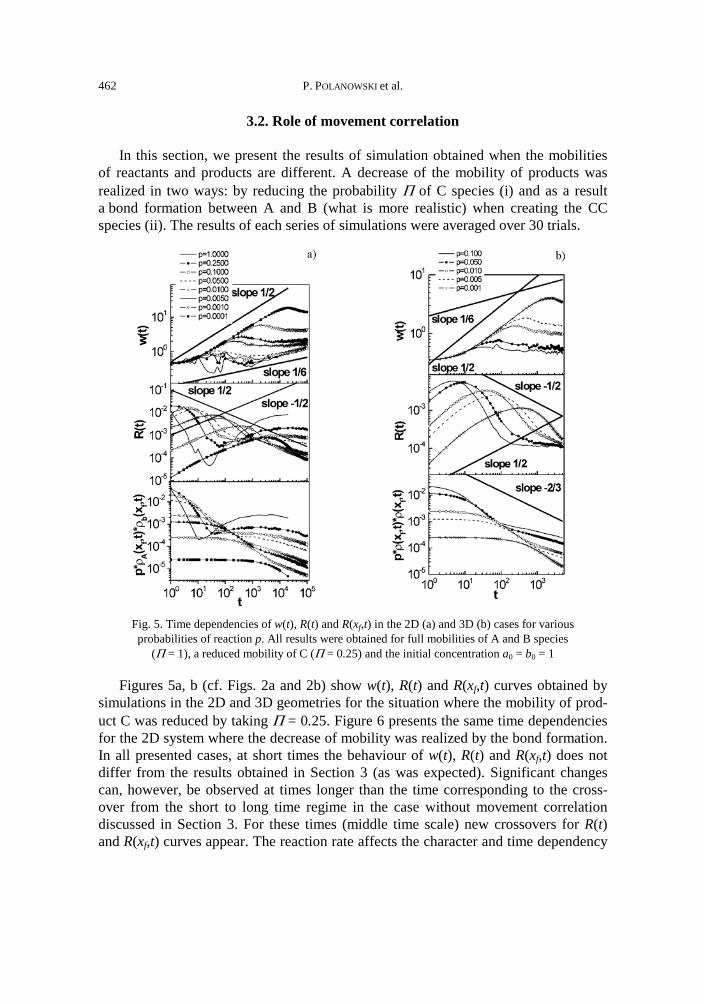
Investigations of anomalous behaviour of the reaction diffusion front for A + B → 2C (inert) and A + B → CC processes are presented. Computer simulation studies were performed using the model of dynamic lattice liquid (DLL) for both two- and three-dimensional cases. Special attention was paid to situations when the mobility of products C and CC significantly differs from the mobilities of reactants. Under such conditions, new kinds of dynamical behaviour were detected. The results obtained indicate that it is necessary to re-formulate the classical description of reaction diffusion front problem. The gen-eralized formalism suggested in the paper should allow a proper description of dynamics of the reaction front over the whole time range including the case when the mobilities of reactants and products are different.
1. Introduction
Reactions at phase boundaries play an important role in many industrial as well as biological processes. The main problem of such reactions is knowledge about forma-tion of so called reaction front between initially separated reactants [1-5]. This phe-nomenon usually controls the reaction kinetics and can be explained in the following simple way: Initially, two kinds of species (let us denote them A and B) are separated by an impenetrable barrier. The barrier is removed at time t = 0 and the reactants start to form a reaction front. The reactant species mix before they react if their mobility is high enough in comparison with their reactivity. This leads to a series of various ki-netic regimes between the initial and an asymptotic long time behaviour. To describe an irreversible reaction diffusion process (A + B → 2C, where C is an inert product)
the following mean-field type equations for the concentration profiles ρA(x,t) and ρB(x,t) have been used [6]:
2
2A A
A A BD kt x
ρ ρ ρ ρ∂ ∂= −∂ ∂
(1a)
2
2B B
B A BD kt x
ρ ρ ρ ρ∂ ∂= −∂ ∂
(1b)
where DA and DB are diffusion constants, and k is the microscopic reaction rate con-stant. These equations must satisfy the initial separation condition along the separa-tion axis x:
( ) ( )( ) ( )
0
0
,0
,0 1
A
B
x a H x
x b H x
ρ
ρ
=
⎡ ⎤= −⎣ ⎦ (1c)
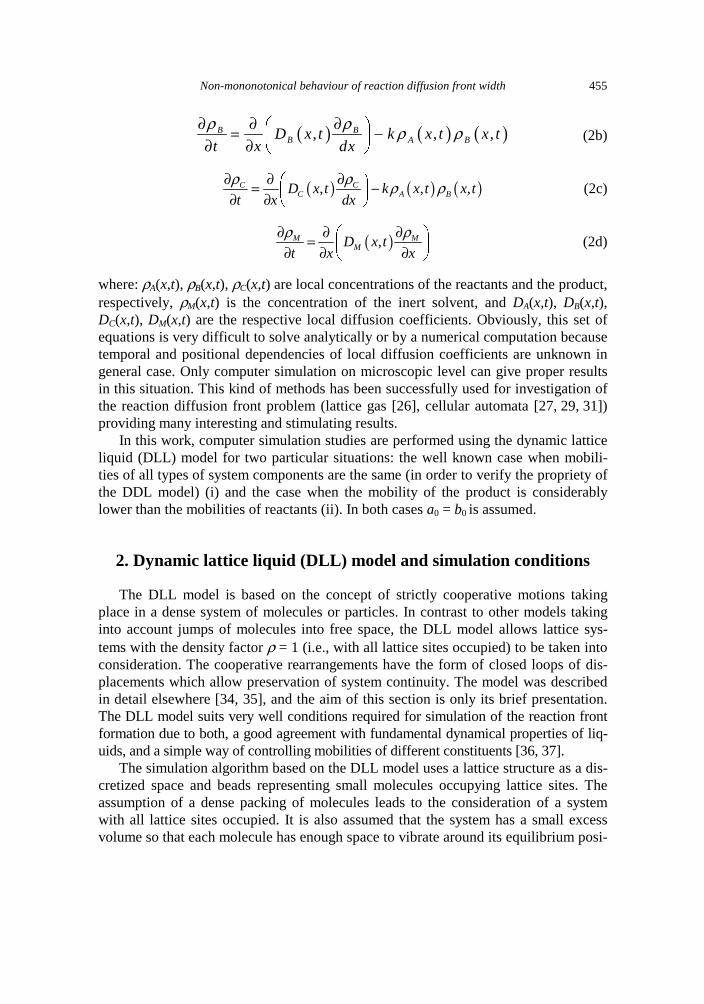
where a0 and b0 are initial concentrations and H(x) is the Heaviside step function. The problem formulated in Eqs. (1) was investigated using various methods: scaling the-ory [6–14], experiment [15–17], dimensional analysis [18–20], perturbation theory [21–24], renormalization group technique [25], computer simulation and numerical computation [26–33]. It is necessary to stress that the above description assumes the diffusion as a sole transport mechanism and strictly constant values of the diffusion coefficients of all species (independently of spatial location and concentrations of reactants and products). It means that correlation of movement between A, B (reac-tants) and C (product) species is neglected. Such treatment seems to be appropriate only in three cases: if the considered time range is short enough (compared to the inverse of the reaction rate) (i), if concentrations of species A and B are low enough (i.e. a correlation between movements of reactants and product species is very weak) (ii) and when the mobilities of all particles are the same (iii). These conditions, how-ever, are satisfied only in some exceptional systems. In general, the mobilities of components are different and the correlation between their movements cannot be ne-glected, especially for high concentrations of A and B species. A correlation between motions of the species results in a variation of the diffusion coefficients within the reaction zone leading to the kinetic behaviour out of range of the applicability of Eqs. (1). This means that in order to consider more general cases the problem has to be reformulated.
In order to take into consideration a correlation between the movements of A, B and C species and the presence of an inert solvent M, the formula (1) should be ex-tended to the following form:
( ) ( ) ( ), , ,A AA A BD x t k x t x t
t x x
ρ ρ ρ ρ∂ ∂ ∂⎛ ⎞= −⎜ ⎟∂ ∂ ∂⎝ ⎠ (2a)
Non-mononotonical behaviour of reaction diffusion front width
455
( ) ( ) ( ), , ,B BB A BD x t k x t x t
t x dx
ρ ρ ρ ρ∂ ∂ ∂⎛ ⎞= −⎜ ⎟∂ ∂ ⎝ ⎠ (2b)
( ) ( ) ( ), , ,C CC A BD x t k x t x t
t x dx
ρ ρ ρ ρ∂ ∂ ∂⎛ ⎞= −⎜ ⎟∂ ∂ ⎝ ⎠ (2c)
( ),M MMD x t
t x x
ρ ρ∂ ∂ ∂⎛ ⎞= ⎜ ⎟∂ ∂ ∂⎝ ⎠ (2d)
where: ρA(x,t), ρB(x,t), ρC(x,t) are local concentrations of the reactants and the product, respectively, ρM(x,t) is the concentration of the inert solvent, and DA(x,t), DB(x,t), DC(x,t), DM(x,t) are the respective local diffusion coefficients. Obviously, this set of equations is very difficult to solve analytically or by a numerical computation because temporal and positional dependencies of local diffusion coefficients are unknown in general case. Only computer simulation on microscopic level can give proper results in this situation. This kind of methods has been successfully used for investigation of the reaction diffusion front problem (lattice gas [26], cellular automata [27, 29, 31]) providing many interesting and stimulating results.
In this work, computer simulation studies are performed using the dynamic lattice liquid (DLL) model for two particular situations: the well known case when mobili-ties of all types of system components are the same (in order to verify the propriety of the DDL model) (i) and the case when the mobility of the product is considerably lower than the mobilities of reactants (ii). In both cases a0 = b0 is assumed.
2. Dynamic lattice liquid (DLL) model and simulation conditions
The DLL model is based on the concept of strictly cooperative motions taking place in a dense system of molecules or particles. In contrast to other models taking into account jumps of molecules into free space, the DLL model allows lattice sys-tems with the density factor ρ = 1 (i.e., with all lattice sites occupied) to be taken into consideration. The cooperative rearrangements have the form of closed loops of dis-placements which allow preservation of system continuity. The model was described in detail elsewhere [34, 35], and the aim of this section is only its brief presentation. The DLL model suits very well conditions required for simulation of the reaction front formation due to both, a good agreement with fundamental dynamical properties of liq-uids, and a simple way of controlling mobilities of different constituents [36, 37].
The simulation algorithm based on the DLL model uses a lattice structure as a dis-cretized space and beads representing small molecules occupying lattice sites. The assumption of a dense packing of molecules leads to the consideration of a system with all lattice sites occupied. It is also assumed that the system has a small excess volume so that each molecule has enough space to vibrate around its equilibrium posi-
P. POLANOWSKI et al. 456
tion defined by the lattice site. However, the molecules cannot easily move over a larger distance because all neighbouring lattice sites are occupied by similar ele-ments. Nevertheless, the DLL model ensures conditions for molecular translation over distances exceeding the vibrational range (long-range mobility). Each large enough displacement of a molecule from its mean position is considered as an attempt of movement to a neighbouring lattice site. For simplicity, directions of the attempts are assumed only along the lattice coordination lines but are independent and randomly distributed among q directions, where q is the lattice coordination number. Only those attempts can be successful which coincide in such a way that along a path including more than two molecules, the sum of displacements is equal to zero (condition of continuity). This results in displacements of beads along self-avoiding closed paths as is illustrated in Figure 1 (case 5) for a simple 2D liquid on a triangular lattice. Beads which do not contribute to correlated sequences (circuits) are immobilized. This oc-curs in cases 1–4 illustrated in Table 1. For an athermal system, all possible rear-rangements are performed by shifting beads along the closed loop traces, each bead to a neighbouring lattice site. Thus, the following steps can be distinguished in the ele-mentary period (time unit) of the simulation procedure: random generation of the vector field representing attempts of movement (i), elimination of non-successful attempts (ii) and replacing beads within closed loop paths (iii).
Fig. 1. An illustration of the vector field representing attempts of molecular displacements towards neighbouring sites in the DLL model
Molecular systems treated in this way can be regarded as provided with the dy-namics consisting of local vibrations and occasional diffusion steps resulting from coincidence of attempts of neighbouring elements to displace beyond the occupied positions. Within a longer time interval, this kind of dynamics leads to displacements of individual beads along random walk trajectories with steps distributed randomly in time.
Non-mononotonical behaviour of reaction diffusion front width
457
Table 1. Special cases of movement towards neighbouring lattice sites
Nr Variant of movement Description
1
two neighbouring beads try to move in opposite directions
2
an attempt of motion starts from a lattice site towards which at the same time no other beads are attempting to move
3
attempted movement would lead to a break of a bond in the polymer chain
4
a solvent particle would jump through a bond
5
a cooperative rearrangement along a closed loop
In simulations performed in this study, Nx×Ny triangular and the Nx×Ny×Nz fcc lat-
tices were used for two- and three-dimensional cases, respectively. Each model sys-tem had been initially divided into two equal parts in which the reactants A and B were distributed with concentrations a0 and b0 in such a way as they would be sepa-rated by an impenetrable barrier. At time t = 0 the barrier was removed and the inter-diffusion began allowing AB contacts and the reactions between the species A and B according to one of the two following schemes: A + B = 2C (i) or A + B = CC (ii). In the former case, the reaction resulted in two non-bonded C species, whereas, in the
P. POLANOWSKI et al. 458
latter case, bonded two bead species were created. The reactions were performed be-fore each DLL motion step according to the following procedure: for each A (B), a neighbouring site was randomly chosen (i); if the chosen site was occupied by B (A), the reaction occurred with an assumed probability p (ii). Mobilities of species C in the first type of reaction were modified with respect to the mobilities of reactants by a reduction of motion probability by a factor Π. The influence of the probability Π on the self-diffusion constant for the triangular and fcc lattices was analyzed in our earlier paper [36]. In the second type of reaction, the mobilities of CC species were reduced with respect to mobilities of A and B as a result of the size change. Periodic boundary conditions were applied for the y direction in the two-dimensional case and for the y and z directions in the three-dimensional case. In the x direction, the systems were confined between two neutral impenetrable walls.
In order to characterize the dynamic behaviour of the investigated systems at mi-croscopic and macroscopic levels, the following quantities are considered: local pro-duction rate R(x,t), global reaction rate R(t), position of the centre of reaction front xf (t), width of the front w(t), and height of the front R(xf,t).
The local production rate of the product C for the A + B → C reaction can be ex-pressed as follows:
( ) ( ) ( ), , ,A BR x t k x t x tρ ρ= (3)
This function characterizes the local kinetics but it is a basis for dynamic behav-iour of the whole system. The result of a spatial integration over R(x,t)
( ) ( , )x
R t R x t=∑ (4)
is called global reaction rate R(t) and describes the reaction rate at the macroscopic level. The position of the centre of reaction front xf (t) is defined as a position where the
R(x,t) function attains maximum
( ) ( ) ( )
( )( )( ) ( )( )
0
0 ,
,
f f
fx
f
x
x t x x t
x x R x tx t
R x t
δ
δ
= +
−=∑
∑
(5)
where xf (0) represents position of the front at the moment t = 0, δxf (t) corresponds to a displacement of the front centre after time t. The width of the front w(t)
( )( )( ) ( )( )
2
2
,
,
fx
x
x x t R x tw t
R x t
−=∑
∑ (6)
Non-mononotonical behaviour of reaction diffusion front width
459
and the height of the front (local rate at xf – R(xf,t)) are the last important quantities describing the diffusion reaction front.
3. Results and discussion
3.1. Reaction fronts in well known cases
In this section, representative results of simulation based on the DLL are presented for the reaction A + B → C under condition of equal mobilities of all particles (i.e., the move-ment taking place without correlation) and a0 = b0. This well known case is used here to verify the applicability of the DLL model for description of such a problem. The width of the reaction front w(t), global production rate R(t) and reaction height R(xf,t) were deter-mined for the system where ρA(x,t) + ρB(x,t) + ρc(x,t) + ρM(x,t) = 1 (i.e., all lattice sites were occupied by the reactants, the product or the inert solvent), and all elements had a full mobility (i.e. Π = 1). In a 2D simulation, the triangular lattice was used (size: Nx = 400 and Ny = 400) while in the 3D case the fcc lattice was employed (size: Nx = 60, Ny = 60 and Nz = 60). The results of each simulation were averaged over 30 trials.
For the case when mobilities of all particles are the same and a0 = b0, Galfi and Racz [6] found, using scaling arguments, that the width of the reaction front scales with time as w(t) ∝ tα with a surprisingly small value of the exponent α = 1/6, and the reaction rate at the centre of the front (so called reaction height) scales as R(xf,t) ∝ t–β with β = 2/3. For relatively short times, when a small amount of species react before they become effectively mixed, this system was also studied in the framework of the perturbation theory [30]. A series of crossovers from an initial to an asymptotic time behaviour in the dynamic properties of the reaction front was found. These crossovers depend on the microscopic reaction rate constant k. Basic time dependencies for w(t), R(t) and R(xf,t) for this case are presented in Table 2.
Table 2. A summary of the cross-over behaviour of the reaction front properties in an initially separated A + B → C reaction-diffusion system
Quantity Short-time behaviour Long-time behaviour
R(t) t1/2 t–1/2
W(t) t1/2 t1/6
R(xf,t) const t–2/3
This picture of reaction diffusion front time behaviour was completed by Vilensky et
al. [38] who introduced momentum effects which provide to additional early-time regime where the global reaction rate R(t) can increase approximately linearly with time. The re-sults presented in Figures 2 and 3 exhibit a good agreement with the state of the art de-scribed above, especially for low values of p (when the influence of fluctuation is low).
P. POLANOWSKI et al. 460
Fig. 2. Time dependencies of w(t), R(t) and R(xf,t) in the 2D (a) and 3D (b) cases for various probabilities of reaction p. All results were obtained for full mobilities
in the system (Π = 1), and the initial concentration a0 = b0 = 1
Figures 2a, b show the results obtained for various probabilities of reaction p for the 2D and 3D cases, respectively. In both cases, for high p (i.e., for high reaction rate and influence of fluctuation) characteristic quantities w(t), R(t), R(xf,,t) deviate from the behaviour predicted by Eqs. (1). At higher ratios of mobility to production rate, however, the agreement of the simulation and theoretical results (calculations based on Eq. (1)) becomes better.
One can see that, in a short time regime for both 2D and 3D cases, R(t) curves increase faster than t1/2. This is in agreement with theoretical predictions made by Vilensky et al. [38]. We have to stress that in the 2D case, for small enough probabilities of reaction (i.e., when the species can penetrate each other) we did observe no significant deviation of the w(t) function exponent from the value 1/6 in any case. This contradicts the results of Chopard and Droz [29] who reported significant deviation from this value. A decrease of the initial concentrations (a0 = b0) leads to a displacement of crossovers towards longer due to a lower effective probability of reaction.
Taitelbaum et al. [30] predicted that crossovers depend on the microscopic reac-tion constant k, and initial concentrations of both reactants. Moreover, changes of R(t) from initial increases to a final decrease take place at time proportional to k–1 (in our case, to p–1). Figure 3 presents w(t), R(t), R(xf,t) for various initial concentrations in 2D case (probability of reaction p = 0.01). Figure 4 shows the results representing
Non-mononotonical behaviour of reaction diffusion front width
461
times corresponding to crossovers for the total production rate R(t) for different initial concentrations (a0, b0). One can observe a good agreement of the results obtained by using the DLL model with theoretical predictions.
Fig. 3. Time dependencies of w(t), R(t) and R(xf,t) in the 2D case for various initial concentrations and the same reaction
probability p = 0.01. All results were obtained for full mobilities in the system (Π = 1)
Fig. 4. Position of crossovers for R(t) as a function of p for various initial concentrations
In the situation considered above, one can observe good agreement between the results obtained from the simulation and theoretical predictions when fluctuations can be neglected.
P. POLANOWSKI et al. 462
3.2. Role of movement correlation
In this section, we present the results of simulation obtained when the mobilities of reactants and products are different. A decrease of the mobility of products was realized in two ways: by reducing the probability Π of C species (i) and as a result a bond formation between A and B (what is more realistic) when creating the CC species (ii). The results of each series of simulations were averaged over 30 trials.
Fig. 5. Time dependencies of w(t), R(t) and R(xf,t) in the 2D (a) and 3D (b) cases for various probabilities of reaction p. All results were obtained for full mobilities of A and B species
(Π = 1), a reduced mobility of C (Π = 0.25) and the initial concentration a0 = b0 = 1
Figures 5a, b (cf. Figs. 2a and 2b) show w(t), R(t) and R(xf,t) curves obtained by simulations in the 2D and 3D geometries for the situation where the mobility of prod-uct C was reduced by taking Π = 0.25. Figure 6 presents the same time dependencies for the 2D system where the decrease of mobility was realized by the bond formation. In all presented cases, at short times the behaviour of w(t), R(t) and R(xf,t) does not differ from the results obtained in Section 3 (as was expected). Significant changes can, however, be observed at times longer than the time corresponding to the cross-over from the short to long time regime in the case without movement correlation discussed in Section 3. For these times (middle time scale) new crossovers for R(t) and R(xf,t) curves appear. The reaction rate affects the character and time dependency
Non-mononotonical behaviour of reaction diffusion front width
463
of these new crossovers, i.e. at higher reaction rates the changes are more dramatic and appear earlier. The behaviour of the width of reaction front w(t) seems to be par-ticularly interesting: after a time corresponding to short time regime the front becomes narrower.
Fig. 6. Time dependencies of w(t), R(t) and R(xf,t) in the 2D case for various probabilities
of reaction p. All results were obtained for full mobilities of A and B (Π = 1), C species
connected by bond and the initial concentration a0 = b0 = 1
Fig. 7. Time dependencies of w(t), R(t) and R(xf,t) in the 2D case for various initial concentrations
a0 = b0 and a constant probability of reaction p = 0.01. All results were obtained for full
mobilities of A and B species (Π = 1) and a reduced mobility of C (Π = 0.25)
This behaviour of the reaction diffusion front can be rationalized in the following way: product species formed due to the reaction modify dynamical properties of the reaction diffusion front area making the reactants diffuse slower into this region. This results in a faster decrease of R(t) and R(xf,t) compared to the case without correla-tion, a decrease of reactant concentration, and hence in a narrowing of the reaction front width. Within the DLL model it means that the probability of the participation of reactant molecules in a cooperative loop decreases as a consequence of the reduced mobility of the product (lower probability of participation of product molecules in cooperative loops) – see also section 2. Additionally, for longer times the slopes of the R(t) and R(xf,t) functions change significantly due to a further mixing (this effect strongly depends on the reaction rate).
P. POLANOWSKI et al. 464
Fig. 8. Time dependencies of w(t), R(t) and R(xf,t) in the 2D case for various values of Π and a constant probability of reaction
p = 0.01. All results were obtained for full mobilities of A and B species (Π = 1) and the initial concentration a0 = b0 = 1
Fig. 9. Position of crossovers in middle time range of R(t) as function of p
for the initial concentration a0 = b0 = 1 and reduced mobilities of C species (Π = 0.25, Π = 0.50 and bonded)
Another interesting question is how the effect observed above depends on the ini-tial densities (a0, b0) and on the product mobility. Figure 7 shows w(t), R(t) and R(xf,t) for various initial concentrations (production rate p = 0.01). A decrease of the initial concentrations of the reactants leads to a weaker modification of dynamical properties of the reaction diffusion front area. The same behaviour can be observed on lowering
Non-mononotonical behaviour of reaction diffusion front width
465
the difference between the mobilities of the product and the reactants. Figure 8 pre-sents a comparison between the results obtained for equal or reduced product and reactant mobilities.
Figure 9 shows times corresponding to the crossover discussed above for various Π and the bonded product in 2D. One can infer form the presented results that times at which new crossovers occur are proportional to k–1 (in our case, to p–1) similar to changes from short time to long time behaviour in the case without correlation. It is worth to remark that the crossover time is independent of the product mobility for all cases under consideration.
4. Conclusions
The results obtained by simulation based on the DLL model point to a necessity of a reformulation of the description of reaction diffusion front for real systems (systems with different mobilities of reactants and products). In this paper, we propose to re-place the commonly used formula (1) by a generalized formula (2) giving a proper picture of the behaviour of the reaction diffusion front over the entire time domain. Taking under consideration dynamical changes of mobility results in this case in a new kinetic behaviour which manifests itself in the appearance of crossovers for the global production rate R(t), reaction height R(xf,t) and in a non-monotonical behaviour of the width of the reaction front w(t) in the middle time regime. Moreover, the ob-tained results indicate that it is necessary to adopt a new view on the reaction diffu-sion front in other systems where observed effects can influence their dynamical be-haviour. In particular, this can become important for: non-symmetrical systems (a0≠b0, A and B species have different mobilities) where whole reaction zone can move (i), systems with reversible reactions (ii) and systems with competing reac-tions (iii). The results presented confirm a large potential of the simulation technique used for getting insight into details of phenomena which are too difficult for analytical theories and which cannot easily be obtained by other simulation methods.
Acknowledgements
The authors would like to thank dr. Z. Koza for helpful discussions. This work was partially sup-ported by KBN (Poland) within the grant projects No. 3 T08A 018 26 and No. 4 T09A 156 2.
References
[1] AVNIR D., KAGAN M., Nature, 307 (1984), 717. [2] DEE G.T., Phys. Rev. Lett. 57 (1986), 275. [3] HENISCH H.K., Periodic Precipitation, Pergamon, Oxford, 1991. [4] RICE S.A., Diffusion Limited Reactions, Elsevier, Amsterdam, 1985. [5] BEN AVRAHAM D., HAVLIN S., Diffusion and Reactions in Fractals and Disordered Systems, Cam-
bridge University Press, Cambridge, 2000.
P. POLANOWSKI et al. 466
[6] GALFI L., RACZ Z., Phys. Rev., A. 38 (1988), 3151. [7] KOZA Z., J. Stat. Phys., 85 (1996), 179. [8] HAVLIN S., ARAUJO M., LARRALDE H., SHEHTER A., STANLEY H.E., Chaos, Solitons Fractals,
6 (1995), 157. [9] ARAUJO M., Physica A., 219 (1995), 239.
[10] LEE B.P., CARDY J., Phys. Rev. E, 50 (1994), R3287. [11] ARAUJO M., LARRALDE H., HAVLIN S., Stanley H. E., Phys. Rev. Lett., 71 (1993), 3592. [12] LARRALDE H., ARAUJO M., HAVLIN S., STANLEY H.E., Phys. Rev. A, 46 (1992), R6121. [13] BAZANT M.Z., STONE H.A., Physica D, 147, 95 (2000). [14] LARRALDE H., ARAUJO M., HAVLIN S., STANLEY H.E., Phys. Rev. A, 46 (1992), 855. [15] TAITELBAUM H., VILENSKY B., LIN A.L., YEN A., KOO Y.L., KOPELMAN R., Phys. Rev. Lett., 77
(1996), 1640. [16] YEN A., LIN A.L., KOO Y.L., VILENSKY B., TAITELBAUM H., KOPELMAN R., J. Phys. Chem., 101
(1997), 2819. [17] YEN A., KOPELMAN R., Phys. Rev. E, 56 (1997), 3694. [18] CORNELL S., DROZ M., CHOPARD B., Phys. Rev. A, 44 (1991), 4826. [19] CORNELL S., DROZ M., Phys. Rev. Lett., 70 (1993), 3824. [20] KRAPIVSKY P.L., Phys. Rev. E, 51 (1995), 4774. [21] TAITELBAUM H., KOZA Z., Phil. Mag. B, 77 (1998), 1389. [22] TAITELBAUM H., KOO Y.L., HAVLIN S., KOPELMAN R., WEISS G.H., Phys. Rev. A, 46 (1992), 2151. [23] TAITELBAUM H., KOZA Z., Physica A, 285 (2000), 166. [24] TAITELBAUM H., YEN A., KOPELMAN R., HAVLIN S., WEISS G.H., Phys. Rev. E, 54 (1996), 5942. [25] HOWARD M., CARDY J., J. Phys. A, 28 (1995), 3599. [26] JIANG Z., EBNER C., Phys. Rev. A, 42 (1990), 7483. [27] CORNELL S., DROZ M., Physica D, 103 (1997), 348. [28] CORNELL S.J., Phys. Rev. E, 51, 4055, (1995). [29] CHOPARD B., DROZ M..Europhys. Lett., 15, 459, (1991). [30] TAITELBAUM H., HAVLIN S., KIEFER J.E., B. Trus, G. H. Waiss, J. Stat. Phys., 65 (1991), 873. [31] LAMARCHAND A., LESNE A., PERERA A., MOREAU M., MARESCHAL M., Phys. Rev. E, 48 (1993), 1568. [32] KOZA Z., TAITELBAUM H., Phys. Rev. E, 54 (1996), R1040. [33] KOZA Z., TAITELBAUM H., Phys. Rev. E, 56, 6387, (1997). [34] PAKULA T.AND TEICHMANN J., Mat. Res. Soc. Symp. Proc., 455, 211 (1997); PAKULA T., J. Mol.
Nanogel formation by intrachain radiation-induced cross-linking. Simulation and experiment
P. ULAŃSKI1, S. KADŁUBOWSKI
1, J. K. JESZKA2, 3*
1Institute of Applied Radiation Chemistry, Technical University of Łódź, ul. Wróblewskiego 15, 93-590 Łódź, Poland
2Centre of Molecular and Macromolecular Studies, Polish Academy of Sciences, ul. Sienkiewicza 112, 90-363 Łódź, Poland
3Department of Molecular Physics, Technical University of Łódź, ul. Żwirki 36, 90-924 Łódź, Poland
Nanogel formation by intrachain radiation-induced cross-linking is described. The origin of dispersive kinetics observed in pulse radiolysis experiments and the influence of cross-linking method on nanogel structure are studied by the Monte-Carlo simulation. The simulations have been performed on an fcc lattice using the cooperative motion algorithm. The recombination kinetics is studied as a function of the chain length (20–1068 beads) and of the number of radicals generated per chain. It is shown that the radical recom-bination rate coefficients are time-dependent (dispersive kinetics) and the simulation results can be fitted using single “stretched exponential” (KWW) function for two radicals per chain and a sum of two KWW functions for a larger number of radicals. The nanogel structure (radius of gyration and loop lengths, related to the resistance of nanogels to scissions) has also been studied. It is found that in the case of instant radical generation, the increasing number of radicals leads to formation of smaller and smaller loops. Results of the simulations are compared with the pulse radiolysis experiment on poly(ethylene oxide) using a suitable scaling of MC time and unit length, and a good agreement is obtained.
Nanogels are sub-micron-size water-swollen particles composed of three-dimen- sional network of hydrophilic polymer chains linked by permanent, covalent bonds. Since their size and shape resemble single linear macromolecules in a coiled confor-mation, nanogels can be regarded as internally cross-linked individual polymer chains. This combination of structure and size makes them unique and interesting for polymer
physicists and chemists, and allows them to be incorporated as a new item in the usual classification of polymer architectures, besides branched, star-like, dendritic etc. mac-romolecules. Nanogels, along with their larger analogues – microgels – have a broad range of actual and prospective applications. The most promising seem to be the ap-plications in medicine and pharmacy, e.g. as polymeric drugs, stimuli-sensitive drug-delivery systems, cell markers and vectors [1, 2].
The most common way to synthesize nanogels and microgels is polymerization with cross-linking agents, usually in emulsion or microemulsion. Nanogels may also be obtained by the chemical intrachain cross-linking within single macromolecules [3]. Some time ago we have proposed an alternative method, based on intramolecular cross-linking induced by ionizing radiation [4]. In this method, a dilute aqueous solu-tion of a polymer, free of any additives, is exposed to a high-dose pulse of fast elec-trons from an accelerator. As a result, several tens or even over a hundred radicals are generated almost instantaneously (typically within a microsecond) on each polymer chain. Since the distance between the chains is relatively high and their mutual diffu-sion is slow, most of the generated radicals undergo recombination with their neighbours within the same macromolecule. This method has been tested on a number of hydrophilic polymers [5–7].
In parallel to the synthetic aspects of this technique, we have studied the mecha-nism and kinetics of intramolecular recombination of polymer-derived mid-chain radicals [8, 9]. It has been found that the decay of radicals in these processes does not follow a classical, homogeneous second-order kinetics, typical of intermolecular re-combination of radical pairs. When analyzed in these classical terms, the rate constant of intrachain recombination k decreases in the course of reaction. This indicates that we deal with a dispersion of reactivity, and the dispersion changes in time. Therefore, we found it more appropriate to describe the intramolecular recombination by disper-sive kinetics models, e.g. the one developed by Plonka [10].
( ) ( ) ( )1
0
, exp /ta
ck t Bt Bt
cα α−= = − (1)
In fact, this model allowed us to obtain much better fits to experimental data, and parameter α could be very useful in assessing the width of the reactivity distribution. Nevertheless, application of the model still did not allow us to answer two important questions: (i) what is the main physical parameter governing the overall rate of in-tramolecular recombination, and (ii) what is the main origin of the non-classical kinet-ics, i.e. of the reactivity changes in time.
The objective of the current work is to perform more detailed studies of nanogel formation employing Monte Carlo simulations: to understand how the cross-linking proceeds, in particular what is the reason of the dispersive kinetics. This information can be used as a guideline, indicating how one can optimize the process of synthesis to obtain the best materials with predetermined properties.
In experiments one has to deal simultaneously with too many distributions (chain length, number of radicals generated per chain, distances between the radicals). It is
Nanogel formation by intrachain radiation-induced cross-linking
469
also impossible to exclude side reactions such as interchain recombination, radical transfer or chain scission. The ratio between the yields of recombination and the par-allel reaction of disproportionation is set by chemical properties of the system and cannot be easily influenced. There are also technical and physical limitations: for instance one must use appropriate polymer concentrations and pulse intensities to get a sufficiently strong signal. One cannot therefore measure precisely enough small numbers of radicals per chain in very dilute solutions, especially in the final stages of the recombination process. The simulations give us a possibility to analyze the influ-ence of various factors, eliminating the interference of others.
2. Pulse radiolysis studies on radical recombination
For experimental studies on the kinetics of intramolecular radical recombination we decided to use poly(ethylene oxide) (PEO) since, in contrast to most other simple water-soluble polymers, irradiation of this compound leads to the formation of only one kind of radicals. This allows to avoid potential problems that may result from a too complex reaction mechanism when many different radicals (of different absorp-tion spectra, reactivity etc.) are present in the system.
Polymer standards of PEO (Polymer Laboratories, Mp = 94 kDa and Mp = 276 kDa, Mw/Mn < 1.1) were used to assure well defined chain length of relatively narrow distri-bution. We used 0.044 wt. % aqueous solutions of PEO (10 mM of monomer units), well below critical concentrations for coil overlap which were estimated as 0.26% and 0.15% respectively. The solutions were saturated with N2O to remove oxygen and to double the radiation-chemical yield of hydroxyl radicals, and then pulse-irradiated in quartz cells with 6 MeV electrons from a linear accelerator (electron path 7 mm, transverse optical path 10 mm). Electron pulses were of 0.5 μs duration and the dose per pulse could be varied from 100 to 400 Gy. Hydroxyl radicals resulting from the radiolysis of water reacted with PEO by hydrogen abstraction, generating mid-chain PEO radicals [11]. This reaction was essentially complete within the duration of the pulse. The decay of PEO radicals was followed by fast spectrophotometry at λ = 270 nm. In order to obtain a reasonable signal-to-noise ratio, each recorded kinetic trace was an average of at least 16 individual shots. In calculations, the molar absorbance of PEO radicals at λ = 270 nm has been assumed equal to 570 dm3·mol–1·cm–1, based on data from Ref. [11], and a small correction has been applied to compensate for a (very low) absorbance of stable final irradiation products.
3. Monte Carlo simulations
The nanogel formation process was simulated using the Monte-Carlo (MC) method on an fcc lattice, where the bonds have the same length. The possible bond angles are equal to 60, 90, 120 and 180° with the degeneracy 4, 2, 4 and 1, respec-
P. ULAŃSKI et al. 470
tively. Macromolecules are represented by ensembles of beads located on lattice sites, connected by non-breakable bonds. The number of beads in these simulations varied form 20 to over 1000, although most of the simulations were performed on 160 and 320 chains for which we can have sufficient statistics in a reasonable time. Move-ments of the polymer chains were simulated using the cooperative motion algorithm (CMA) [12–14], as a series of random displacements of segments on the lattice, ob-serving integrity of the chains. MC time unit correspond to one attempt-to-move per bead. Radicals were simulated by ascribing to a bead the property of being able to form an additional bond with another “radical”. If the distance between them was equal to the bond length, they could “react” (with some probability), i.e. they could form a bond (recombination and cross-linking) or disappear (the bead is no longer a “radical” – disproportionation). Thus the reaction rate was controlled by the chain dynamics. In each simulation cycle, one chain in a random conformation, with Z0 radi-cals on it, was generated and surrounding beads imitated a good solvent. Thus the interchain recombination was not possible.
Fig. 1. Screenshot of a chain N = 1280 with Z0 = 16 radicals during simulations. Grey circles mark radicals which have not recombined yet
and black circles are the beads on which a radical has recombined forming cross-linking bonds and loops
Decay kinetics were averaged over at least 400 radical pairs (except for some simulation for very long chains and long times). We analysed time evolutions of the average number of radicals, length of loops, radius of gyration, and end-to-end and bond vector R autocorrelation functions
( ) (0) ( )1
1 n
t i i ti
R Rn
ρ=
= ∑ (2)
In the above equation, Ri(0) denotes the R vector of a chain (or a bond) i at the be-ginning of the simulation (t = 0) and Ri(t) the vector at a time t. By fitting ρ(t) to so -called stretched exponential (Kohlrausch–Williams–Watts) function
Nanogel formation by intrachain radiation-induced cross-linking
471
( ) expt
tβ
ρτ
⎡ ⎤⎛ ⎞= −⎢ ⎥⎜ ⎟⎝ ⎠⎢ ⎥⎣ ⎦
(3)
we can determine the relaxation time τ and dispersion parameter β. This function is equivalent to the first order dispersive kinetics and was also used in the analysis of radical decays.
The loop length is defined as the number of bonds between the radicals that re-combined. Thus in the case of Z > 2 the same bead may belong to more than one loop. The total loop length L is a sum of lengths of successively formed (Z0 – Z)/2 loops. Figure 1 shows a snapshot of a chain on which a part of the radicals recombined.
4. Results and discussion
Experiments and simulations show that the factors influencing the radical decay kinetics are the initial number of radicals per chain, and the chain length. This is illus-trated in Figure 2 showing the evolution of average number of radicals in the simula-tions in which four radicals are generated at random on chains of different length, and in Figure 3 showing normalised radical decays on chains of different length if the ratio of chain length N to the number of initially generated radicals Z0 is constant.
Fig. 2. Radical decay kinetics for four radicals generated on chains of different lengths. Solid lines show fits using sums of two stretched exponential
functions (Eq. (4)); C = 0.65 in all cases
P. ULAŃSKI et al. 472
Fig. 3. Radical decay on chains of different lengths when the initial radical density on the chain N/Z0 = 40
In Figure 2, one can see that the radical recombination strongly depends on the chain length, the radical decay half time t1/2 being proportional to N2.3. Similar de-pendences were found for other numbers of radicals. However, in the simulations presented in Figure 2, both the chain length and average distance between the radicals (measured along the chain contour) increase. It is therefore not clear which factor dominates. The results shown in Figure 3 clearly demonstrate, however, that the aver-age distance is the most important parameter controlling the decay rate. It can be seen that if the ratio N/Z0 (related to the average distance between the radicals), is constant, then the decay half time is only slightly dependent on N. At short times (shorter than ca. 5t1/2) the time dependence is practically independent of the chain length for longer chains. However, it changes qualitatively at longer times where the effect of chain length becomes very important. This result can be explained taking into account that at first radicals recombine mostly with the nearest neighbours hence this process is weakly dependent on the chain length if N/Z0 is constant. By contrast, at the last stage the average distance between the remaining radicals is the larger the longer is the chain, thus the recombination kinetics becomes strongly dependent on the chain length. The process cannot therefore be adequately described by a single kinetic equation.
The decay kinetics was found to be practically identical in simulations in which no cross-linking took place (disproportionation), although one could expect formation of loops to give rise to sterical obstacles making recombination slower. This effect will be addressed in more detail in a forthcoming paper [15].
Results of simulations for Z0 = 2 can be fitted using a single stretched exponential function (Eq. (4)) but for Z0 > 2 a sum of at least two stretched exponentials must be used to achieve satisfactory fits (shown as lines in Fig. 2).
Nanogel formation by intrachain radiation-induced cross-linking
Systematic simulations for constant Z and variable N make possible determination of trends in N or Z0 dependences of the parameters τ, β and C, and interpola-tions/extrapolations [15] allowing comparison with the experiments using high mo-lecular weight polymers for which a direct simulation would be extremely time-consuming. Evolution of other parameters which change during the radical recombi-nation is presented in Figure 4.
Fig. 4. Time dependences of normalised parameters of the nanogel during recombination of eight radicals (N = 160). Circles – radical number Z/Z0,
filled squares – total loop length L/Lf, triangles – radius of gyration 2 20/ .g gR R
The solid line shows the decay of the end-to-end (ρEE) and the dotted line – bond (ρB) autocorrelation functions
One can see that the average total loop length L (related to the resistance of nano-gels to chain scissions) increases during the cross-linking process and attains its final value Lf when all the radicals have recombined. This increase is, however, slower than the radical decay (the total loop length attains half of its final value at a time ca. ten times longer than the radical decay half-time). The decrease of the radius of gyration Rg due to cross-linking is even slower than the increase of loop length, which can be explained taking into account that attaining equilibrium Rg needs some additional time of the order of the end-to-end vector relaxation time to reach equilibrium chain con-formation after the cross-linking event.
Simulations carried out for different Z0 show that Lf increases sub-linearly with in-creasing number of generated radicals (Lf ~ Z0
0.5). This effect is related to the fact that when Z0 increases, the average distance between the radicals decreases, hence shorter
P. ULAŃSKI et al. 474
and shorter loops are formed. Based on these simulations, we can predict that this limitation can be suppressed by generation of a smaller number of radicals in suitable time intervals, e.g. using sequences of short pulses. This effect, however, has not yet been confirmed experimentally.
5. Comparison with experiment
Figure 5 presents a comparison of experimental results obtained on monodisperse samples of molecular weight 94 and 276 kDa (2140 and 6290 monomer units). One can see that these results are in a qualitative agreement with the simulations: if the average concentrations of radicals on a chain are the same, the decay half times are very similar and the experimental time dependence corresponds well to simulations of multiple randomly distributed radicals on long chains. The obtained results can be directly compared with the simulations performed assuming that two monomer units correspond to one MC segment, and an MC time unit is taken equal to 5×10⁻⁹ s (small symbols). Such a time scaling is justified not only by the correspondence of the ex-perimental and simulation results but also by a correspondence of the orientation re-laxation times. From the simulations we can also obtain the relaxation time of an MC
Fig. 5. A comparison of experimental and simulated radical decays. In the experiment, N2O-saturated aqueous 10 mM PEO solutions were pulse-irradiated with an average dose of
330 Gy per pulse. Full symbols: Mp = 276 kDa (<Z0> ≅ 60), empty symbols: Mp = 94 kDa (<Z0> ≅ 20), diamonds: simulation for N = 1068, Z0 = 20.
The solid line shows simulation results corrected for odd numbers of radicals. The Monte Carlo scaling method is described in the text
segment equal to 2 MC time units. The relaxation time for the Kuhn segment of PEO (6 atomic bonds) in water, determined by molecular dynamics simulations, is ca. 3×10⁻¹⁰ s
Nanogel formation by intrachain radiation-induced cross-linking
475
[16]. Thus taking into account that only some contacts between beads in the simula-tions correspond to configuration for which the radicals can recombine, we can con-clude that such a time scaling is reasonable. Some additional correction should be made taking into account that in the simulations an even number of radicals per chain was assumed. In a real system we generate odd and even number of radicals thus some of the radicals cannot recombine by intrachain recombination mechanism. The result of simulations corrected for this factor is shown in Fig. 5 as a solid line. One can see that the results of simulations and experiment are in a good agreement con-firming that the intrachain radical recombination is governed by chain dynamics.
6. Conclusions
A good agreement between of the results of pulse radiolysis experiments and MC simulations of the chain dynamics-controlled radical recombination indicate that the assumed simulation model can be used to gain insight into behaviour of real systems. Simulations of intrachain cross-linking provide information on the role of different parameters and phenomena in nanogel formation. Because of the strong dependence of the recombination rate on the distance between the radicals (t1/2 ~ R2.3), the recom-bination of nearest neighbours is strongly favoured. In the case of a statistical genera-tion of radicals, the average distance between nearest neighbour radicals is the most important factor controlling the reaction rate constant. Distribution of nearest-neighbour distances seems to be the main reason of dispersive kinetics.
The simulations provide also an information on the effect of various parameters on the structure of the nanogel, strongly related to the kinetics of the process. If the num-ber of generated radicals is increased, mostly shorter, less efficient loops are formed. It can be predicted how the nanogel structure and related properties can be controlled by a modification of the radical generation procedure.
Acknowledgements
The authors thank Professor Tadeusz Pakula (Max-Planck Institute for Polymer Research, Mainz, Germany) for making available the basic code of chain motion and valuable discussions, and the LINAC staff headed by dr. Krzysztof Hodyr (TU Lodz) for their valuable technical assistance. This work has been supported in part by the International Atomic Energy Agency (TCP POL/6/007) and NATO (PST.MEM.CLG 980622).
References
[1] FUNKE W., OKAY O., JOOS-MÜLLER B., Adv. Polym. Sci., 136 (1998), 139. [2] ULANSKI P., ROSIAK J.M., Polymeric Nano- and Microgels, [in:] H.S. Nalwa (Ed.), Encyclopedia of
Nanoscience and Nanotechnology, American Scientific Publishers, Stevenson Ranch, CA, 2004, Vol. 8, p. 845.
Structure–property relationships in brittle polymer networks modified by flexible cross-links
S. KRIPOTOU1, P. PISSIS
1,*, E. KONTOU2, A.M. FAINLEIB
3, O. GRYGORYEVA3, I. BEY
3
1Department of Physics, National Technical University of Athens, Zografou Campus, 15780 Athens, Greece
2Department of Mechanics, National Technical University of Athens, Zografou Campus, 157 80 Athens, Greece
3Institute of Macromolecular Chemistry of the National Academy of Sciences of Ukraine, 02160 Kyiv, Ukraine
Hybrid polycyanurate/polyoxytetramethylene glycol (PCN/PTMG) networks were prepared from PCN and PTMG (molar mass 1.000 g/mol) with 10, 20, 30 and 40 wt. % PTMG. The degree of incorpo-ration of PTMG into the PCN network was determined by gel fraction measurements. Earlier morpho-logical and thermal transition studies indicated a non-crystalline structure, considerable nanostructural heterogeneity and a wide dispersion of glass transition temperatures of the hybrid networks. The present paper reports on a continued investigation of structure-property relationships and employ dielectric tech-niques to focus on molecular dynamics. Two secondary relaxations of PCN, one secondary relaxation of PTMG and a single, broad α relaxation (dynamic glass transition) were detected in the hybrids. The α relaxation was studied in detail over wide ranges of temperature and frequency. The results were system-atically analyzed in terms of time scale, relaxation strength and shape of the response, and are discussed in terms of plasticization, presence of nanostructural heterogeneities (composition fluctuations) and hy-bridization. A distinctly different behaviour, observed for the hybrid with 30% PTMG, is explained in terms of a more pronounced nanoheterogeneous structure. Finally, stress-strain measurements were per-formed and their results are discussed in terms of structure and molecular dynamics.
Polycyanurate (PCN) networks, typically synthesized by cyclotrimerization reac-tion of dicyanic ester of bisphenol A (DCBA) [1, 2], are characterized by high glass
transition temperature (Tg) and high thermal stability, good mechanical properties, excellent adhesion to various substrates, chemical resistance, low electric permittivity and loss values, and low water uptakes. These and other good properties make them suitable for applications in high performance technologies, in particular as matrices for glass and aramid fiber-reinforced plastics in electronic and aerospace industries. A primary drawback of PCNs, restricting their more extensive applications, is, next to high prices, low room temperature toughness [1, 2].
PCNs may be toughened by (i) physical modification through the addition of thermoplastics and the formation of so-called semi-interpenetrating polymer networks (IPNs) [3]; (ii) chemical modification by co-reaction with monomers or oligomers containing active hydrogens, such as phenols, diamines, diepoxides, ethers and esters [1, 2, 4–7]; (iii) combination of physical and chemical modification by use of a reac-tive co-monomer and a non-reactive rubber or a thermoplastic or a rubber or a ther-moplastic containing reactive chain ends [8–12].
Much attention has been recently paid to modification of PCNs by hydroxyl-terminated polyethers. PCNs were synthesized in the presence of different contents of polyoxypropylene glycol (PPG) and polyoxytetramethylene glycol (PTMG), and the effect of the type of the oligomeric modifier, initially miscible with DCBA, on the chemical structure, glass transition behaviour, phase morphology and mechanical properties of the modified PCN was studied [4–6]. The results indicated the formation of very finely divided morphologies with three highly interpenetrated phases, a PCN -rich, a PPG-rich and a mixed PCN/PPG one, in the case of PCN/PPG network [4, 5]. On the other hand, PCN/PTMG cure compositions proved to be more homogeneous, exhibiting a single broad glass transition in dynamic mechanical analysis (DMA) measurements [6]. Miscibility in multicomponent polymeric systems is, however, an intriguing subject and experimental results may depend on the technique used [13]. Dynamic techniques, such as dielectric relaxation spectroscopy (DRS), nuclear mag-netic resonance (NMR) and depolarized light scattering (DLS), have proved sensitive to dynamic and spatial heterogeneities in macroscopically homogeneous polymeric systems [12].
In an attempt to further investigate the effect of PTMG modifier on the phase structure, molecular dynamics and final properties of PCNs, several series of PCN/PTMG cure compositions with varying molar mass and content of PTMG were synthesized and studied. By employing a variety of experimental techniques, the re-sults provide information on structure–property relationships which is essential for optimizing composition and processing (cure) conditions to meet specific end-use re-quirements. In the first paper of this series, next to FIR and sol-gel analysis, wide- and small-angle X-ray scattering (WAXS and SAXS, respectively), DSC and laser-interferometric creep rate spectroscopy (CRS) were employed to investigate nanostruc-ture and segmental dynamics of PCN/PTMG compositions [14]. The results revealed a non-crystalline structure, considerable nanostructural heterogeneity and a wide disper-sion of glass transition temperatures of the hybrid networks. In the present paper, we continue that study. We employ broadband dielectric relaxation spectroscopy (DRS)
Brittle polymer networks modified by flexible cross-links
479
and thermally stimulated depolarization currents (TSDC) techniques to investigate details of molecular dynamics. Mechanical properties are investigated by stress–strain measurements and discussed in correlation with the results of structural and dynamic studies.
2. Experimental
Materials. The cyanate monomer used in the present work was dicyanate ester of bisphenol A (DCBA, >98% purity). Triethylamine (99% purity) was used as cure catalyst (1 mol %). DCBA and triethylamine were used as received. Poly(oxytetrame-thylene) glycol (PTMG) with the molar mass Mn = 1000 g/mol was used as the modi-fier. PTMG was dried at 80 ºC under vacuum for 6h. The materials used in this study are summarized in Table 1. Samples with weight ratios of PCN/PTMG 90/10, 80/20, 70/30, 60/40 and pure PCN were prepared and studied. The cyanate ester, catalyst and polyether were first mixed together, degassed at 80 ºC for 0.5 h and then poured into a PTFE-coated mould. The curing cycle consisted of three stages: 10 h at 150 ºC, 8 h at 180 ºC and 3 h at 210 ºC.
Table 1. Chemical structures and characteristics of the materials used
Hybridization of the networks was confirmed by FTIR spectroscopy, which indi-
cated practically full conversion of OCN groups, in particular due to their high reac-tivity towards OH end groups of PTMG. Similar to the co-reaction of dicyanates with phenols [15], we would propose a scheme [4], where the fragment O–[(CH2)4–O]14– is incorporated into a network chain and all substituents on the triazine rings which are not network chains are hydroxyl terminated (Scheme 1).
The sol-gel analysis (compare ref. [4] for details) was used to determine the frac-tion of PTMG incorporated into the PCN network. This can be calculated by compari-son of experimental and theoretical values of the gel fraction, as the whole of DCBA participates into the network formation (FTIR results) [4]. In Table 2, the composi-tions and their gel fractions, as well as the incorporated PTMG content (degree of incorporation) in the gel fraction and PTMG conversion at incorporation are shown. It follows that PTMG conversion by incorporation into the PCN network decreases from
S. KRIPOTOU et al. 480
97% to 78.8% when the PTMG content in the initial composition increases from 10 to 40 wt. %. As a result, the hybrid networks studied include different contents of rigid triazine ring-aryl junctions and relatively flexible junctions, where triazine rings are chemically connected with flexible PTMG chains (Scheme 1).
Table 2. Gel fraction results (wt. %) for the pure PCN and the hybrid networks PCN/PTMG
Brittle polymer networks modified by flexible cross-links
481
Techniques. A Novocontrol sample cell (for TSDC measurements) in combination with the Novocontrol Quatro cryosystem and a 617 Keithley electrometer were used for thermally stimulated depolarazation currents (TSDC) [16]. Broadband dielectric relaxation spectroscopy (DRS) measurements [17] were carried out by means of an Alpha Novocontrol analyzer, in combination with the Novocontrol Quatro cryosys-tem. Stress–strain measurements were performed at room temperature with an Instron 1121 tester (High Wycombe, Bucks, England).
3. Results and discussion
3.1. Overall dielectric behaviour
Figure 1 shows TSDC thermograms obtained with pure PCN and the hybrid net-works. The TSDC method corresponds to measuring dielectric losses as a function of temperature at a constant low frequency (10–2–10–4 Hz), and provides an overview of the dielectric behaviour of the material under investigation.
Fig. 1. TSDC thermograms measured on pure PCN and the hybrid networks. The depolarization current is normalized to the electric field applied and the surface area of the sample
For pure PCN we observe four peaks. The peaks located at 143 and 256 K are asso-ciated with secondary relaxations, attributed to short range motions of PCN chains, as they are detected at temperatures lower than that of the main α relaxation associated with the glass transition, while the double peak at higher temperatures is associated with the glass transition of regions with different crosslinking density. For comparison, Geor-jon et al. observed by dynamic mechanical analysis (DMA) measurements at 1 Hz two
S. KRIPOTOU et al. 482
sub-glass relaxations in pure PCN networks, located at 168 K (γ relaxation) and 267 K (β relaxation), respectively [18]. The γ relaxation was ascribed to the motion of phenylene groups present in the links between the planar six-membered three-arm cyanurate structures. The β relaxation was attributed to motions of chain fragments between the network junctions. DMA measurements on the PCN network of the pre-sent study give three loss peaks [4]: two sub-glass loss peaks located (at 10 Hz) at 198 K and 373 K, γ and β relaxation, respectively, and a single one, the main α relaxa-tion, located at 554 K. The secondary relaxations were ascribed to the same motions as those described by Georjon et al. [18].
Bearing in mind a lower equivalent frequency of TSDC measurements, as com-pared to DMA, the location (on the time scale) of the γ PCN relaxation detected by TSDC is in a good agreement with that observed by DMA. Thus, we adopt the same interpretation as for DMA measurements for the molecular motions responsible for the dielectric γ PCN relaxation. Results are less clear with respect to the β relaxation: intercomparison of dielectric results ([12] and present work) with DMA ones [4, 18] on various pure PCN networks indicate that the temperature location of this relaxation depends on both the experimental technique used and the structure of the network. Nevertheless, the molecular assignment of the β relaxation in all these studies to rota-tional motions of chain fragments between the network junctions is adopted here also for the TSDC β relaxation.
The two high-temperature peaks in the TSDC thermogram of pure PCN at 503 and 553 K are attributed to the main α relaxation, associated with the glass transition of regions with different crosslinking density, in consistency with the results of DSC and CRS obtained on the same samples [14]. Note that the magnitude of the peak at 503 K, which is a measure of the number of relaxing units contributing to the peak, is by about one order of magnitude lower than that of the peak at 553 K. Thus, the TSDC peak at 553 K corresponds to the α relaxation of the main part of the PCN network, in agreement with the results of DMA measurements [4].
In TSDC thermograms obtained for the hybrid networks, an additional secondary relaxation appears located at 125 K. This relaxation is attributed to local motions of the modifier PTMG as it cannot be detected in the pure PCN network. More specifi-cally, this relaxation is attributed to damped oscillations of ether segments around their equilibrium positions (local mode [19]). The other two peaks observed in the hybrid networks at sub-glass temperatures are attributed to the modified γ and β re-laxation of the PCN network, the latter being detected only in the thermograms of the hybrids with 30 and 40% PTMG. It should be noted that all the hybrid networks show a single peak at higher temperatures shifting to lower temperatures (towards the glass transition temperature of pure PTMG (188 K)) with increasing PTMG content, in agreement with the results of DMA [4], DSC and CRS (creep rate spectroscopy) [14] and DRS (to be reported later). The presence of a single α peak in the hybrid networks indicates miscibility of the two components at the molecular level. This apparent mis-cibility might be attributed to the participation of PTMG in PCN formation. One can assume that the incorporation of PTMG will improve the miscibility of the compo-
Brittle polymer networks modified by flexible cross-links
483
nents due to increased affinity of the modified PCN/PTMG network to non-incorporated PTMG.
Fig. 2. Frequency dependences of the real part of dielectric function ε′, measured at 298 K. The compositions of the samples are indicated in the plot
Figure 2 shows the results of DRS measurements at room temperature (298 K): frequency dependences of the real part of dielectric function ε′( f ). At the temperature of measurements all the samples are in the glassy state, as is indicated by the TSDC results of Figure 1, and only secondary relaxations contribute to the spectra. For the pure PCN network ε′ is low and practically independent of frequency, indicating a suitability of PCN for applications in microelectronics [1, 2]. The increase of ε′( f ) on addition of PTMG has probably contributions arising from both the polar PTMG component and the increased flexibility of the PCN network. This point can be further followed by systematic investigation of various polarization (relaxation) mechanisms contributing to ε′( f ). It is striking in Figure 2 that for the PCN/PTMG (70/30) net-work ε′( f ) does not further increase with respect to the PCN/PTMG (80/20) network. This composition shows a distinguished behaviour also in other respects, to be dis-cussed later, indicating non-monotonous changes of properties with PTMG content, in agreement with the results of morphological characterization [14]. Finally, a large dispersion of ε′( f ) is observed for the PCN/PTMG (60/40) network, indicating, in agreement with dielectric loss ε″( f ) and ac conductivity σac( f ) plots (not shown here) a long-range connectivity of PTMG-rich regions [12]. Future measurements at high frequencies would help to separate the contribution to the increase of ε′( f ) in the PCN/PTMG (60/40) network dipolar from the space charge/conductivity contribution.
S. KRIPOTOU et al. 484
Fig. 3. Temperature dependences of dielectric loss ε′′, measured at 100 kHz for pure PCN and the hybrid PCN/PTMG networks indicated in the plot
The relaxations detected by TSDC (Fig. 1) were studied in detail by means of DRS measurements over broad temperature and frequency ranges. Temperature de-pendences of dielectric loss, ε″(T), at a constant frequency of 100 kHz are presented in Figure 3, in order to show an overall dielectric behaviour of the samples under in-vestigation and make a comparison with the TSDC thermograms (Fig. 1). The results have been recorded isothermally and replotted as a function of temperature at a con-stant frequency. The latter is selected rather high, in order to avoid the contribution of conductivity (dominating at low frequencies), as will be shown later. We observe the same peaks as in the TSDC thermograms, shifted towards higher temperatures due to a higher frequency of DRS measurements. In the following we shall focus on the in-vestigation of the main α relaxation.
3.2. The main α relaxation
Figure 4 shows dielectric loss ε″( f ) spectra in the PCN/PTMG (90/10) network at selected temperatures, measured in order to follow the α relaxation associated with the glass transition. The spectra are typical of PCN and the hybrid networks. The in-crease of ε″ with decreasing frequency, observed at low frequencies, is related to con-ductivity phenomena [12], while the α relaxation is observed as a peak at higher fre-quencies. The α relaxation in pure PCN and the hybrid networks was analyzed with respect to time scale, relaxation strength and shape of the dielectric response. The following expression, consisting of a sum of the Havriliak–Negami (HN) model func-tion and a conductivity term [12, 17], was fitted to the experimental ε″( f ) data
Brittle polymer networks modified by flexible cross-links
485
Fig. 4. Frequency dependences of dielectric loss ε′′ in the region of the main α relaxation (from 443 to 533 K, in steps of 10 K) in the hybrid PCN/PTMG (90/10) network
( )( )( )Δ
Im1
sKi
βα
εε ω ε ωωτ
−∞
⎛ ⎞⎜ ⎟′′ = + +⎜ ⎟⎜ ⎟+⎝ ⎠
(1)
where Δε = εs – ε∝ is the dielectric relaxation strength with εs and ε∝ being the limits of ε′(ω) for ωτ << 1 and ωτ >> 1, respectively. The relaxation time τ is related to the position of loss maximum by the equation 2πfmax = 1/τ. The parameters α and β de-scribe the symmetric and asymmetric broadening of the dielectric response, K and s are constants. The shape parameters α and β are related to the limiting behaviour of the dielectric response at low and high frequencies, the corresponding slopes in log-log plots being m = α and n = αβ, respectively [12, 17].
Figure 5 shows the Arrhenius plot of the α relaxation in pure PCN and the hybrid networks. TSDC data determined by the peak temperature of the corresponding TSDC peak and the equivalent frequency of 1.6 mHz, corresponding to the relaxation time of 100 s [12], are also included. For each sample we observe an α relaxation which, at each frequency, systematically shifts to lower temperatures with increasing PTMG content, towards the glass transition temperature of pure PTMG (188 K). These re-sults confirm the previous ones obtained with DMA [12] and DSC and CRS [14] at a single frequency with similar PCN/PTMG networks and allow to extend them to a broad frequency range. A single Vogel–Tammann–Fulcher (VTF) equation, charac-teristic of the main α relaxation in polymeric systems [20]
max 00
expB
f fT T
⎛ ⎞= −⎜ ⎟−⎝ ⎠
(2)
S. KRIPOTOU et al. 486
with temperature-independent empirical parameters f0, B and T0 (Vogel temperature), was fitted to the data, except for the PCN/PTMG (70/30) hybrid, which will be dis-cussed later. Following common praxis for reducing the number of free parameters and improving the quality and reliability of fits [21], the parameter f0 was fixed at 1013 Hz, the frequency of the order of lattice vibration frequencies. Reasonable values were obtained for the fitting parameters, with the pseudo-energy B increasing with increasing amount of PTMG and the Vogel temperature T0 being located 50–70 K below the glass transition temperature determined by TSDC.
Fig. 5. Arrhenius plot of the α relaxation in pure PCN and in the hybrid networks indicated in the plot. TSDC data are included at the equivalent frequency of 1.6 mHz. The lines
are fittings to the DRS data with the Arrhenius equation (Eq. (3)) for the hybrid network PCN/PTMG(70/30), and with the VTF equation (Eq. (2)) for other compositions
The data for the PCN/PTMG (70/30) network in Figure 5 cannot be fitted with a single VTF equation. This can be done, however, for the high tempera-ture/frequency data, with reasonable values for the fitting parameters which follow the trends described above for the other samples. The temperature dependence of the data at lower temperatures/frequencies is satisfactorily described by the Arrhenius equation
actmax 0 exp
Ef f
kT⎛ ⎞= −⎜ ⎟⎝ ⎠
(3)
The values of the fitting parameters obtained are 0.95 eV for the activation energy, Eact, 1014 Hz for the pre-exponential factor, f0. These results suggest a change of the dynamics from a cooperative α relaxation at higher temperatures to a Goldstein –Johari β relaxation [22] at lower temperatures. It should be stressed that only a single
Brittle polymer networks modified by flexible cross-links
487
HN expression was fitted to the data at each temperature, although the results in Fig-ure 5 would suggest, at least in a middle temperature/frequency range, the contribu-tion of both α and Goldstein–Johari β relaxation to the dielectric spectra [23, 24]. The results indicate that the main contribution to the dielectric response comes from the α relaxation at higher temperatures/frequencies and the Goldstein–Johari β relaxation at lower temperatures/frequencies. It is interesting to note, however, that two well-separated relaxations have been detected for the PCN/PTMG (70/30) network by TSDC and that the higher temperature TSDC point is in good agreement with the DRS data for the α relaxation (Fig. 5) and that at lower temperatures (not shown in Fig. 5) to the DRS data for the Goldstein–Johari β relaxation. These results can be discussed in terms of the Adam–Gibbs theory for the glass transition [25], the in-crease of the cooperativity length, i.e. the characteristic length of the glass transition, with decreasing temperature [20] and the influence of a second component on the mobility of the polymer chains [26]. At high temperatures the relaxation occurs through a co-operative rearrangement of the polymeric chains. At lower temperatures, the cooperativity is suppressed and the relaxation occurs partly through cooperative rearrangements and partly through motions of isolated chains in regions of large free volume (islands of mobility) [20].
Results similar to those reported here for the PCN/PTMG (70/30) network have been obtained before with highly crosslinked sequential interpenetrating polymer networks (IPNs) of poly(ethyl acrylate) (PEA) and poly(ethyl methacrylate) (PEMA) [24]. A splitting of the α relaxation and the Goldstein–Johari β relaxation was ob-served in the PEMA networks, a single α relaxation in PEA-rich compositions and Arrhenius behaviour in middle compositions. The latter was explained by a suppres-sion of cooperativity due to incorporation of PEA chains to the cooperative motions of the PEMA network shifting the α and Goldstein–Johari β relaxations to different extents, and hence resulting in changes in the shape of the spectrum in the merging zone. Thus, the distinct behaviour of the PCN/PTMG (70/30) network with respect to the other hybrids indicates a higher degree of heterogeneity of that network, which is consistent with the results of SAXS measurements on the same hybrids [14].
Figure 6 shows the results for the dependence of the dielectric strength Δε on the frequency of the α loss peak. The latter allows for comparison of samples with differ-ent glass transition temperatures. We observe in Figure 6 that Δε (which is a measure of the number of relaxing units contributing to the loss peak) increases significantly in the hybrids, as compared to the pure PCN network. Interestingly, Δε is lower in the PCN/PTMG (70/30) than in the PCN/PTMG (80/20) network, indicating constraints imposed on the motion of the polymer chains in the former network. DRS measure-ments in semi-interpenetrating polymer networks of linear polyurethane and PCN network with chemical crosslinks between the components showed an increase of Δε of the α relaxation with respect to that in pure polyurethane. These results suggest that the reason for the increase of Δε of the α relaxation in both systems is the hybridiza-tion effect resulting in loosened molecular packing of the chains and in an increase of free volume. Δε increases with decreasing loss peak frequency (i.e., with temperature)
S. KRIPOTOU et al. 488
decreasing towards the glass transition temperature, which is the behaviour typically observed for the α relaxation [17, 20]. The dependence is approximately linear, in agreement with results obtained previously with both polymers and glass-forming liquids [27]. A different behaviour is observed for the PCN/PTMG (70/30) network, where Δε starts decreasing with decreasing loss peak frequency below ca. 100 Hz. This behaviour is in agreement with the results shown in Figure 5 (change of slope at approximately 100 Hz), and with the common observation that the relaxation strength of the Goldstein–Johari β relaxation decreases with decreasing temperature [20, 26], providing an additional support for the interpretation given above for the distinct be-haviour of the PCN/PTMG (70/30) network.
Fig. 6. Dielectric strength Δε against logarithm of maximum frequency logfmax of the α relaxation in pure PCN and the hybrid networks indicated in the plot
Results for the shape of the α loss peak are given in Figure 7. The peak is asym-metric in the pure PCN network, whereas it is symmetric (m = n) in all the hybrids, in agreement with the results showing that constraints imposed by crystallites, increase of crosslinking density and geometrical confinement render the α relaxation more symmetric [28]. We observe in Figure 7 that m is practically independent of tempera-ture (frequency) of the loss peak in pure PCN, whereas it systematically increases with increasing temperature in the hybrid networks, reflecting a decreasing influence of intermolecular interactions due to decrease of the cooperativity length, i.e. the size of the cooperatively rearranging regions within the Adam–Gibbs theory [25]. The parameter m is significantly smaller in the hybrids as compared to its value in the pure PCN network, reflecting the increasing influence of intermolecular interactions due to the existence of regions with compositions different from the mean composition. The composition fluctuations in the hybrids under investigation are due to the existence of regions with different density of rigid crosslinks, similar to those of the pure PCN
Brittle polymer networks modified by flexible cross-links
489
network, resulting from the incorporation of PTMG into the network. The PCN/PTMG (70/30) network shows again a distinct behaviour, with m values compa-rable to those of the PCN/PTMG (60/40) network, suggesting a more nanoheteroge-neous structure. The shape parameter n shows the same temperature dependence in the pure and the hybrid networks, increasing with increasing temperature (frequency) of loss peak, as is commonly observed in polymers and glass-forming liquids [17]. Interestingly, the PCN/PTMG (90/10) network shows the highest n values, even higher than in pure PCN, indicating a reduction of constraints in that network, in agreement with the results of SAXS measurements [14].
3.3. Mechanical measurements
Figure 8 shows the results of stress-strain measurements at room temperature. The values of elastic (Young) modulus, tensile strength, elongation at break and toughness
Fig. 7. Shape parameters m and n against the logarithm of maximum frequency logfmax of the α relaxation in pure PCN and the hybrid networks indicated in the plot
Table 3. Stress–strain results for the pure PCN and the hybrid networks PCN/PTMG
Fig. 8. Stress strain curves for pure PCN and the hybrid networks indicated in the plot. The inset shows details at low strain values
can be determined from these measurements, results for the first three parameters being shown in Table 3. The PTMG conversion by incorporation into the PCN network has also been included in Table 3. The results show that both the elastic modulus and the tensile strength decrease with increasing amount of PTMG, whereas the maximum elon-gation at break increases. Incorporating 10% of PTMG into the network does not practi-cally affect the elastic modulus nor the elongation at break, whereas the tensile strength increases significantly. These results can be explained by microplasticity, detected by CRS on the same hybrids [14]. A change of the behaviour is observed in Figure 8 and Table 3 from a brittle material (pure PCN and hybrids with 10 and 20% PTMG) to a ductile material (hybrids with 30 and 40% PTMG). The behaviour of the PCN/PTMG (60/40) network is distinctly different from that of the other networks in Figure 8, show-ing a pronounced yield point, hardening and elongation at break. This behaviour can be due to a proximity of the temperature of measurements to the glass transition tempera-ture of that network (TSDC, Figure 1). Future stress-strain measurements at variable temperature would be helpful to further clarify this point.
4. Final remarks
Molecular dynamics of hybrid polycyanurate/polyoxytetramethylene glycol (PCN/PTMG) networks was studied in detail by broadband dielectric relaxation spec-troscopy (DRS) and thermally stimulated depolarization currents (TSDC) measure-ments, in an attempt to contribute to a better understanding of the structure-property relationships in these complex systems. The hybrids were prepared from PCN and PTMG (molar mass 1.000 g/mol) with 10, 20, 30 and 40 wt. % PTMG. The degree of
Brittle polymer networks modified by flexible cross-links
491
incorporation of PTMG into the PCN network was determined by gel fraction meas-urements. Morphological and thermal transition studies in a previous work had indi-cated non-crystalline structure, considerable nanostructural heterogeneity and a wide dispersion of glass transition temperatures of the hybrid networks.
Two secondary relaxations of PCN (γ and β, in the order of increasing tempera-ture), one secondary (γ) relaxation of PTMG and a single, broad α relaxation (dy-namic glass transition) were detected in the hybrids. The α relaxation was studied in detail over wide ranges of temperature and frequency. By fitting appropriate model functions to experimental data, the results were systematically analyzed in terms of time scale, relaxation strength and shape of the response.
The time scale of the α relaxation is discussed on the basis of the Arrhenius plots and Vogel–Tammann–Fulcher fits to data. The relaxation shifts systematically to lower temperatures/higher frequencies with increasing amount of PTMG, indicating a miscibility of the two components and plasticization by PTMG. The relaxation strength increases in the hybrids. A comparison with the latter system indicates that this is a hybridization effect, which results in loosened molecular packing of the chains and an increase of free volume. The α loss peaks become symmetric and broader in the hybrids, reflecting an increasing influence of intermolecular interac-tions due to the existence of regions with compositions different from the mean com-position (different density of rigid crosslinks, similar to those of the pure PCN net-work, resulting from the incorporation of PTMG into the network). A distinct behaviour is observed for the hybrid with 30% PTMG with respect to time scale (splitting of the α relaxation into an α relaxation and a Goldstein–Johari β relaxation), relaxation strength and shape of the response, and explained in terms of a more pro-nounced nanoheterogeneous structure. Finally, stress-strain measurements indicate a change from brittle behaviour at low PCN contents (PCN and hybrids with 10 and 20% PTMG) to ductile behaviour at 30 and 40% PTMG.
Several questions arise or are left open for further work, such as separation of the contributions of incorporated and non-incorporated PTMG to the effects described above and a possible influence of the molar mass of the PTMG used (here 1.000 g/mol). Also, stress-strain measurements at various temperatures would help to separate effects of morphology from effects of temperature of measurements with respect to glass transi-tion temperature on mechanical properties.
Acknowledgement
S. Kripotou acknowledges the project Pythagoras I for financial support of this work. The project is co-funded by the European Social Fund (75%) and Greek National Resources (25%).
References
[1] HAMERTON I., Chemistry and Technology of Cyanate Ester Resins, Chapman & Hall, Glasgow, 1994. [2] NAIR C.P.R., MATHEW D., NINAN K.N., Adv. Polym. Sci., 155 (2000), 1. [3] PASCAULT J.P., Macromol. Chem., Macromol. Symp., 93 (1995), 43.
S. KRIPOTOU et al. 492
[4] FAINLEIB A., HOURSTON D., GRIGORYEVA O., SHANTALII T., SERGEEVA L., Polymer, 42 (2001), 8361. [5] FAINLEIB A., GRIGORYEVA O., HOURSTON D., Macromol. Symp., 164 (2001), 429. [6] FAINLEIB A., GRIGORYEVA O., HOURSTON D., Int. J. Polym. Mat., 51 (2001), 57. [7] FAINLEIB A., GRENET J., GARDA M.R., SAITER J.M., GRIGORYEVA O., GRYTSENKO V., POPESCU N.,
PISSIS P., J. Macromol. Sci. Phys., B40 (2001), 105. [11] BARTOLOTTA A., DIMARCO G., LANZA M., CARINI G., ANGELO G.D., TRIPODO G., FAINLEIB A.,
SLINCHENKO E.A., SHTOMPEL V.I., PRIVALKO V.P., Polym. Eng. Sci., 39 (1999), 549. [12] GEORGOUSSIS G., KYRITSIS A., BERSHTEIN V.A., FAINLEIB A., PISSIS P., J. Polym. Sci. B, Polym.
Phys., 38 (2000), 3070. [13] KUMAR S.K., COLBY R.H., ANASTASIADIS S.H., FYTAS G., J. Chem. Phys., 105 (1996), 3777. [14] BERSHTEIN V.A., DAVID L., EGOROV V.M., FAINLEIB A., GRIGORYEVA O., BEY I., YAKUSHEV P.N.,
J. Polym. Sci. Polym. Phys., 43 (2005), 3261. [15] HAMERTON I., HAY J.N., High Perform. Polym., 10 (1998), 163. [16] VAN TURNHOUT J., Electrets, [in:] G.M. Sessler (Ed.), Topics in Applied Physics. 33, Springer, Ber-
lin, 1980, p. 81. [17] KREMER F., SCHOENHALS A., BROADBAND DIELECTRIC SPECTROSCOPY, Springer, Berlin, 2003. [18] GEORJON O., SCHWACH G., GERARD J.F., GALY J., J. Polym. Engin. Sci., 37 (1997), 1606. [19] WETTON R., WILLIAMS G., Trans. Faraday Soc., 61 (1965), 2132. [20] DONTH E., The Glass Transition. Relaxation Dynamics in Liquids and Disordered Materials,
Springer, 2001. [21] RICHERT R., ANGELL C.A., J. Chem. Phys., 108 (1998), 9016. [22] JOHARI G.P., GOLDSTEIN M.J., J. Chem. Phys., 53 (1970), 2372. [23] PISSIS P., KYRITSIS A., MESEGUER DUENAS J.M., MONLEON PRADAS M., TORRES ESCURIOLA D.,
GALLEGO FERRER G., GOMEZ RIBELLES J. L., Macromol. Symp., 171 (2001), 151. [24] KYRITSIS A., GOMEZ RIBELLES J. L., MESEGUER DUENAS J. M., SOLER CAMPILLO N., GALLEGO FERRER G.,
MONLEON PRADAS M., Macromolecules, 37 (2004) 446. [25] ADAM G., GIBBS J. H., J. Chem. Phys., 43(1965), 139. [26] BEINER M., Macromol. Rapid Commun., 22 (2001), 869. [27] SCHOENHALS A., [in:] M. Giordono, M.P. Leporini (Eds.), Non Equillibrium-Phenomena in Super-
cooled Fluids, Glasses and Amorphous Materials, World Scientific, Singapore, 1996. [28] DAOUKAKI D., BARUT G., PELSTER R., NIMTZ G., KYRITSIS A., PISSIS P., Phys. Rev. B, 58 (1998),
5336.
Received 19 May 2005 Revised 8 December 2005
Materials Science-Poland, Vol. 24, No. 2/2, 2006
Interpretation of light depolarization data in terms of polymer crystallinity
A. ZIABICKI*, B. MISZTAL-FARAJ
Institute of Fundamental Technological Research, Polish Academy of Sciences, ul. Świętokrzyska 21, 00-049 Warsaw, Poland
Theoretical principles of light depolarization technique (LDT) have been analysed. It has been shown that the traditional way of interpretation assuming a linear relationship between depolarization ratio, average optical retardation of a single birefringent plate, D, and volume fraction of crystalline material (crystallinity) is incorrect. An exact non-linear relationship between depolarization ratio and the product DE (E is average number of plates in the light path) has been derived. The parameter DE has been shown to be proportional not to the crystallinity alone but to the product of crystallinity and average crystal thickness, (x<d>). A method of decoupling light depolarization data, based on measurements at different sample orientations and different wavelengths, has been outlined.
Key words: optical retardation; theory of compensators; depolarization; depolarization ratio; polymer crystallization; degree of crystallinity; degree of crystal orientation
1. Introduction
Physical properties of polymer materials are very sensitive to their supramolecular structure. Two chemically identical polymer samples can exhibit very different prop-erties depending on the fraction of crystalline phase, composition of crystal modifica-tions, etc. Different crystallographic structures and textures can be developed by vary-ing processing conditions [1]. Variation of temperature, cooling rate, stress or flow fields can result in a change of crystallization rate by many orders of magnitude af-fecting final structure and properties of the material.
Traditional techniques used for measuring the polymer crystallinity – DSC, dila-tometry, WAXS – are all limited to slow processes (sampling frequency less than 1 Hz), whereas in industrial conditions the crystallization proceeds in a fraction of a second, when a stress or flow is applied. When cooling rates are very high as is the
case in fibre spinning or film formation, the entire process is completed in millisec-onds. Application of an optical method seems a natural solution. Light depolarization technique (LDT) has been introduced for studying crystallization and melting of poly-mers by Fischer and Schram [2] and Magill [3–6] in late fifties and sixties. In spite of its controversial interpretation [7–9], the method is widely used at present [10–13]. An experimental setup for LDT measurements is presented in Figure 1. A parallel light beam is passed through a polarizer (P), film sample containing anisotropic crys-tals (S), analyser (A) and its intensity is measured by a detector (D).
Fig. 1. Light depolarization setup: P – polarizer, S – sample, A – analyser, D – detector
A theoretical basis for interpretation of light intensity data is based on the Fresnel formula [14] describing intensity of polarized light transmitted through an optically retardant (birefringent) object
2
0
( )cos sin 2 sin 2( )
ID
I
ϕ ϕ α ϕ α= + − (1)
where I0 is incident intensity, ϕ – the angle between optical axes of the polarizer and analyser, D = sin2(δ/2) – optical retardation function, and α – the angle between the optical axis of the birefringent plate and the polarizer. The relative retardation is pro-portional to the plate thickness, d, and birefringence, Δn, and inversely proportional to the wavelength, λ
2πΔn dδ
λ= (2)
The presence of a retardant element converts a linearly polarized light beam into elliptically polarized one. A quantitative characterization of the depolarization effect
Light depolarization data in terms of polymer crystallinity
495
requires that scattering and absorption effects leading to intensity loss, IS, be taken into account. This can be done by replacing the incident intensity I0 in Eq. (1) by a sum of intensities at parallel and crossed polarizers [2]
0 0 ||
1( π) ( 0)
2SI I I I I I Iϕ ϕ ⊥→ − = = + = = + (3)
The ratio of intensity transmitted through the system with crossed polarizers, I⊥, to the incident intensity corrected for scattering, is a quantitative measure of the depo-larization effect
2
||
22sin 2 (0,1)
ID
I Iα⊥
⊥
= ∈+
(4)
In the absence of any retardant elements between the polarizer and analyser no light is transmitted through crossed polarizers
2
||
22sin 2 0 : 0
ID
I Iα ⊥
⊥
= =+
(5)
while an anisotropic element with maximum retardation effect yields a complete de-polarization, i.e. a conversion into the state of circular polarization
2
||
22sin 2 1: 1
ID
I Iα ⊥
⊥
→ →+
(6)
The single-plate formula (Eq. (1)), yielding linear relation between the plate retar-dation and the depolarization ratio, has been used in experimental studies [2–6, 9–13]. The depolarization ratio and the average plate retardation have been (explicitly or implicitly) identified with the degree of crystallinity, x
||
2const const
ID x
I I⊥
⊥
′= =+
(7)
In real crystallizing systems, there appear many birefringent plates. It is natural to expect that the higher degree of crystallinity the higher will be the degree of depolari-zation. This does not imply a linear relationship between the depolarization ratio and the retardation function D. A proportionality between these two parameters seems reasonable only in very dilute systems in which the light beam does not meet more than one plate on its path (Fig. 2). Analysing structure of crystallizing polymers [15], we found the number of plates in the light path to be rather high (102–104) making inapplicable the single-plate formula (Eq. (1)). One has to analyse optical behaviour of many-plate “stacks” appearing in the light path (Fig. 3), the intensity of depolarized light being affected by optical interactions within the stack.
A. ZIABICKI, B. MISZTAL-FARAJ 496
Fig. 2. Distribution of birefringent plates in a dilute system: a) projection on the XY plane
normal to the light beam, b) projection on the ZX plane
Fig. 3. Distribution of birefringent plates in a concentrated system: a) projection on the XY
plane normal to the light beam, b) projection on the ZX plane
There is also no obvious reason to assume that relation between the retardation and crystallinity should be unique or (the more so) linear. A more thorough theoretical analysis is needed.
2. Depolarization of light on a statistical system of birefringent plates
Optical behaviour of a stack of parallel birefringent elements is described by the theory of compensators [16–18]. Hsü, Richartz and Liang [17] arrived at the expres-sion of light intensity transmitted through a stack of exactly n birefringent elements
[ ]1 2 1 2||
( ), , ..., , , ,...,n
n n
IF D D D
I I
ϕ β β β⊥
=+
(8)
where D1, D2, ..., Dn are optical retardation functions of individual elements and β1, β2,..., βn – orientations of optical axes with respect to the sample axis.
In the situation of interest for polymer crystallization, the number of plates appear-ing serially in a stack is large which justifies averaging over the variables Di and βi. The averaging described in detail elsewhere [19] takes into account two properties of the function F(Di, βi): linearity with respect to each variable Di, and symmetry of the orientation distribution, eliminating all odd moments of sin2βi. Consequently, the average intensity ratio reduces to a function of two moments of the function F(Di, βi)
Light depolarization data in terms of polymer crystallinity
497
( ) [ ]||
, , ; ,nID S
I Iϕ ϑ Φ ϕ ϑ
⊥
=+
(9)
2; sin 2i iD D S β= < > = < > (10)
where ϕ is an angle between the polarizer and analyser, and ϑ – angle between the sample axis and the polarizer. It can be shown [19] that averaging of the expressions given by Hsü, Richartz and Liang [17] yields
( ) ( )
( ) ( )
2
||
1; cos cos2 ½cos2 1 2
2
1sin 2 sin 2( ) 1 2 1 2 2
2
nn
n n
IDS
I I
DS D DS
ϕ ϑ ϕ ϕ ϕ
ϑ ϑ ϕ
⊥
= − + −+
⎡ ⎤− − − − − +⎣ ⎦
(11)
It is evident that the average intensity transmitted through an s-plate stack is an n-degree polynomial of the two averaged material variables – D and S. In the field of view, many stacks appear in parallel. We assume that the distribution of stack sizes is random and can be described with the Poisson distribution
e
( )!
E nEP n
n
−
= (12)
where n is the number of plates in the light path. The intensity of light transmitted through a statistical system of many parallel
stacks is given by the equation [19]
( ) ( )trans 2 2
0|| ||
2 2 (1 )
||
2 2 2 2 (1 )
; ; 1 1( ) cos cos2 cos2 e
2 2
1 2sin 2 sin 2( ) e e
2
(1 e ) sin 2 e e
n DES
n
DES DE S
DES DES DE S
I IP n
I I I I
I
I I
ϕ ϑ ϕ ϑϕ ϕ ϕ
ϑ ϑ ϕ
ϑ
∞−
=⊥ ⊥
− − − ⊥
⊥
− − − −
= = − ++ +
⎡ ⎤− − −⎣ ⎦ +
⎡ ⎤= − − −⎣ ⎦
∑
(13)
In the case of a random distribution of plate orientations, the transmitted intensity reduces to a function of a single variable DE
2trans
|| ||
( ) 1 2cos cos2 1 e , 1 e
2DE DEI I
I I I I
ϕ ϕ ϕ − −⊥
⊥ ⊥
⎡ ⎤= − − = −⎣ ⎦+ + (14)
A. ZIABICKI, B. MISZTAL-FARAJ 498
In the range of infinitely small values of DE, the single-plate (linear) formula is re-turned
2trans
|| ||
( ; ) 1 20 : cos cos2 ,
2
I IDE DE DE
I I I I
ϕ ϑ ϕ ϕ ⊥
⊥ ⊥
→ → − →+ +
(15)
On the other hand, in the range of very large DE, the depolarization ratio asymp-totically approaches unity
2trans
|| ||
( ; ) 1 2: cos cos2 , 1
2
I IDE
I I I I
ϕ ϑ ϕ ϕ ⊥
⊥ ⊥
→ ∞ → − →+ +
(16)
which corresponds to a complete depolarization of the transmitted light (cf. Fig. 4). Obviously, depolarization ratios larger than unity lack physical sense.
Fig. 4. Depolarization ratio 2 I⊥/( I⊥ + I||) calculated from Eq. (14). Linear approximation
corresponds to single-plate formula
Fig. 5. Light intensity for crystallizing polyethylene transmitted through crossed polarizers, I⊥
Fig. 6. Light intensity for crystallizing polyethylene transmitted through parallel polarizers, I||
Light depolarization data in terms of polymer crystallinity
499
Fig. 7. Depolarization ratio 2 I⊥/( I⊥ + I||) and the variable DE for crystallizing polyethylene obtained from intensity measurements switched from ϕ = 0 to ϕ = π/2 (Fig. 4)
To check the magnitude of depolarization effects during crystallization of polyeth-ylene, we recorded intensities of light transmitted through crossed (I⊥, Fig. 5) and parallel polarizers (I|| , Fig. 6). The depolarization ratio, 2I⊥/( I⊥ + I||) was calculated from a separate experiment in which the analyser was switched from ϕ = 0 to ϕ = π/2 and back (Fig. 7). The intensity of light transmitted through crossed polarizers, I⊥, monotonically increases with crystallization time while the parallel component, I|| , decreases, reaches a minimum and then increases. A similar behaviour of the total transmitted intensity, I0, observed by Ding and Spruiell [11] seems to be result of scat-tering on isotropic objects formed at the beginning of crystallization. The depolariza-tion effect corrected for scattering, 2I⊥/( I⊥ + I||), monotonically increases with time, its magnitude extending far beyond the linear region (DE = 0.4–0.8).
3. Degree of crystallinity
To analyse the relationship between the depolarization ratio and crystallinity, let us consider a plane-parallel sample of thickness B and surface area F, containing N birefringent crystal plates. The face area of a single plate is fi, and its thickness – di. The volume fraction of the crystalline material, i.e. degree of crystallinity reads
1
N
i ii
f dN fd
xFB FB
= < >= =∑
(17)
and the average number of plates in a stack E
1
N
ii
fN f
E nF F
= < >= < > = =∑
(18)
A. ZIABICKI, B. MISZTAL-FARAJ 500
representing ratio of the total area of plate faces to the area of the sample, appears as a parameter in the Poisson distribution (Eq. (12)). In contrast to the volume fraction, E can be much larger than unity: many-plate stacks may appear in the light path. At full crystallinity, the maximum number of plates in a stack is equal to the ratio of sample-to-crystal thicknesses
max >> 1B
Ed
=< >
(19)
Comparing Eqs. (17) and (18) one finds relationship between the crystallinity, x, and the parameter E
[ ]( , )B f x
E x B w f dfd d
Ξ< >= =< > < >
(20)
where
[ ]( , )f d
w f df d
Ξ < >< >=< ⋅ >
(21)
is a functional of crystal size distribution function. In the case of a monodisperse dis-tribution, Ξ reduces to unity. Consequently, the light depolarization parameter DE
2
||
||
π Δln const
I I n d xDE B x d
I I dλ⊥
⊥
+ < >⎛ ⎞= ≅ = < >⎜ ⎟− < >⎝ ⎠ (22)
is proportional to the crystallinity but also to the average plate thickness, <d>. The crystallization involves nucleation and growth, crystal growth rates being (in general), different in different crystallographic directions. Thus, the interpretation of light de-polarization as a measure of volume fraction of crystalline phase is incorrect. Follow-ing the crystallization with LDT is justified only when an independent measurement of the crystal thickness is performed. A possible decoupling procedure will be dis-cussed in Section 6.
4. Degree of crystal orientation, S
Basic assumptions underlying the original light depolarization technique required that optical axes of crystal plates be oriented randomly and no axis of the entire sys-tem (sample) could be specified. Analysis of systems with a non-random orientation distribution requires a more general description. Orientation of sample axis is defined and the intensity of the transmitted light becomes a function of the orientation of the sample with respect to the polarizer, ϑ (Eqs. (13)). On changing the sample orienta-tion, one can obtain two independent equations for DE and DES. Putting ϑ = 0 (the sample axis parallel to the polarizer) results in
Light depolarization data in terms of polymer crystallinity
501
( ) ( )20
|| || 0
2 0 2 01 1 11 e , ln 1 ln
2 2 1DESI I
J DESI I I I J
ϑ ϑ⊥ ⊥−
⊥ ⊥
⎡ ⎤= =≡ = − = − − =⎢ ⎥
+ + −⎢ ⎥⎣ ⎦
(23)
J0 is depolarization ratio identical with that used for a characterization of unoriented systems (Eq. (14)). Another measurement made on the sample oriented at the angle ϑ = π/4 with respect to the polarizer yields
( )
( )
2 (1 )π/4
||
|| π/4
2 π/41 e
2 π/41 1(1 ) ln 1 ½ln
2 1
DE SIJ
I I
IDE S
I I J
ϑ
ϑ
⊥ − −
⊥
⊥
⊥
=≡ = −
+
⎡ ⎤=− = − − =⎢ ⎥
+ −⎢ ⎥⎣ ⎦
(24)
A combination of Eqs. (23) and (24) yields a partial decoupling of the variable DES
( )( ) ( )
( ) ( )
( )
π/42
π/4 0
π/4 0π/4
0
ln 1sin 2
ln 1 ln 1
1½ ln ln 1 ln 1
1
ln 1
JS
J J
J JJ
DEJ
β−
≡ < > =− + −
⎡ ⎤− + −⎣ ⎦−=−
(25)
and can be used for determining the crystal orientation characteristic, S.
5. Decoupling of the characteristic DE. Independent characterization of crystallinity and crystal thickness
We will present the way of decoupling the product DE into D and E based on ap-plication of two different wavelengths, λ1 and λ2. Consider three depolarization ratios. The first two, J0(λ1) and Jπ/4(λ1) defined by Eqs. (23), (24) use monochromatic light of the wavelength λ1. The third one, J0(λ2), an analogue to J0(λ1), is measured at a wave-length λ2 different from λ1. From Eq. (23) we obtain
[ ]
[ ]
[ ][ ]
1 0 1
2 0 2
0 11 1
2 2 0 2
1( ) ln 1 ( )
2
1( ) ln 1 ( )
2
ln 1 ( )( ) ( )
( ) ( ) ln 1 ( )
DES J
DES J
JDES D
DES D J
λ λ
λ λ
λλ λλ λ λ
= − −
= − −
−= =
−
(26)
A. ZIABICKI, B. MISZTAL-FARAJ 502
Neither the number of plates in the light path, E, nor the orientation characteristic, S, are affected by the wavelength. What changes is the optical retardation of individ-ual plates, δi, and the average retardation characteristic, D
2 2
( ) 2 ( )
1( ) sin ( ) sin ( )
2
π Δ ( )( )
d
D d
n
δ λ Λ λ
λ δ λ Λ
λΛ λλ
=
≡< > = < >
=
(27)
D can be expanded in power series with respect to the plate thickness, d. Averaging of the sine-square function introduces various moments of the plate thickness distribution. For the sake of simplicity, we will consider a monodisperse distribution leading to
( )2 2 nnd d< > = < > (28)
which yields
2 2 4 6 8 10
2 2 21
1 2 1 2( ) sin ( ) ...
3 45 315 14175i iD d
d
λ Λ Δ Δ Δ Δ Δ
Δ Λ
=< > = − + − + −
≡ < >
(29)
where Δ is a reduced plate thickness. Introducing the ratio of optical coefficients
2 21 12 22 2
( )
( )
Λ Λ λξΛ Λ λ
≡ =
we obtain
( ) ( )
( ) ( ) ( )
( ) ( ) ( ) ( )
2
2 41
2
3 2 2
6
4 3 2 2 3
8
2 1 5 1( ) 11
( ) 3 45
3 1 14 1 21 1
945
2 1 15 1 42 1 50 1...
14175
D
D
ξ ξ ξλ ξξ Δ Δλ
ξ ξ ξ ξ ξΔ
ξ ξ ξ ξ ξ ξ ξΔ
⎡ − − −−⎢= − +⎢⎣
− − − + −−
⎤− − − + − − −⎥+ +⎥⎦
(30)
We also introduce a new variable, Z, obtainable directly from depolarization ratios measured at two different wavelengths λ1 and λ2
2 2
0 11 2 12 2 2
1 2 1 2 0 2
ln[1 ( )]3 ( ) 31 1
( ) 1 ln[1 ( )]
JDZ
D J
λΛ Λ λ ξΛ Λ Λ λ ξ λ
⎡ ⎤⎡ ⎤ −≡ − = −⎢ ⎥⎢ ⎥− − −⎣ ⎦ ⎣ ⎦
(31)
Light depolarization data in terms of polymer crystallinity
503
The details of calculations are described elsewhere [19]. Z can be expressed as a power series of the reduced thickness Δ
Now, all physical characteristics of the system are expressed as functions of Z and the parameter ξ. The retardation characteristic D1 is obtained in the form
2 2 3
2 31 1
1 29 97 76 4 87 3 60( ) 1 ...
5 1575 4725D D Z Z Z Z
ξ ξ ξ ξ ξ ξλ⎡ ⎤+ − − + + −= = − − + +⎢ ⎥⎣ ⎦
(34)
To calculate the average number of plates in the light path, E, we go back to Eqs. (25) and obtain
[ ][ ]
0 11
1 0 1 / 4 1
2 2 22 3
ln 1 ( )( ) 1 1ln 1
( ) 2Z 1 ( ) ln 1 ( )
1 92 29 13 35 1410 1620 3451 ...
5 1575 23625
JDEE
D J J
Z Z Z
π
λλλ λ λ
ξ ξ ξ ξ ξ ξ
⎡ ⎤−⎛ ⎞= = +⎢ ⎥⎜ ⎟− −⎢ ⎥⎝ ⎠ ⎣ ⎦
⎡ ⎤+ + − + + +× + + − +⎢ ⎥⎣ ⎦
(35)
Equations. (25), (34) and (35) present solutions for three basic characteristics de-rivable from the light depolarization: average plate orientation, S = <sin22β>, average retardation function of a single plate, D(λ1), and average number of plates in the light path, E. These three characteristics, combined with reduced plate thickness Δ, and parameters ξ, Λ1, Λ2 , may be used for estimation of other material characteristics. In the range of a monodisperse distribution of plate dimensions and not too thick plates, average plate thickness is found in the form
2 22 2
21 1
2 33
2 3 136 368 241
30 12600
1012 3954 5076 2133...
378000
Zd d Z Z
Z
Δ ξ ξ ξΛ Λ
ξ ξ ξ
⎡ ⎛ ⎞− − +⎛ ⎞< > ≅ < > = = + +⎢ ⎜ ⎟⎜ ⎟⎝ ⎠ ⎝ ⎠⎣
⎤⎛ ⎞− + −+ + ⎥⎜ ⎟⎝ ⎠ ⎦
(36)
A. ZIABICKI, B. MISZTAL-FARAJ 504
and the degree of crystallinity
[ ][ ]
0 1
0 1 / 4 1
0 11
0 2
22
ln 1 ( )1ln 1
1 ( ) ln 1 ( )
3 ln[1 ( )]2 1
1 ln[1 ( )]
8 3 1040 220 3321 ...
30 12600
J
J JE dx
B JB
J
Z Z
π
λλ λ
ξ λΛξ λ
ξ ξ ξ
⎡ ⎤−⎛ ⎞+⎢ ⎥⎜ ⎟− −< > ⎢ ⎥⎝ ⎠ ⎣ ⎦≅ =
⎡ ⎤−−⎢ ⎥− −⎣ ⎦
⎡ ⎤+ − −× + + +⎢ ⎥⎣ ⎦
(37)
7. Final remarks
It has been demonstrated that the light depolarization technique, as it is currently used for following polymer crystallization, does not yield reliable information about the degree of crystallinity or crystallization rate. First, the depolarization ratio is not proportional to the average retardation function of a single crystal plate, D. An exact non-linear relation derived in ref. [19]
( )2
0||
2 11 e ....
2DEI
J DE DEI I
−⊥
⊥
= = − = − ++
(38)
reduces to the linear expression only in the limit of infinitely small DE. There is enough experimental evidence (see Figs, 5–7) proving that actually observed depo-larization ratios often exceed the linear range. Second, depolarization variable, DE, is not a unique function of the crystallinity but depends also on the average crystal thickness and crystal size distribution. In the limit of monodisperse plate size distribu-tion and thin enough plates, DE reduces to the product of crystallinity and average plate thickness
0 : constDE DE x d→ ≅ < > (39)
Table 1. Measurement conditions and structural characteristics
Angle ϕ
Angle ϑ
Wave-length
λ
Intensity measure-
ment Depolarization ratio
Structural characteristics
π/2 0 λ1 I⊥(0, λ1)
0 0 λ1 I||(0, λ1) 1
0 11 1
2 (0, )( )
(0, ) (0, )
IJ
I I
λλλ λ
=+
⊥
⊥ ||
DES(λ1)
π/2 π/4 λ1 I⊥(π/4, λ1)
0 π/4 λ1 I||(π/4, λ1) 1
π/4 11
2 (π/4, )( )
(π/4, ) (π/4, )
IJ
I I
λλλ λ
=+
⊥
⊥ 1 ||
DE, S
π/2 0 λ2 I⊥(0, λ2)
0 0 λ2 I||(0, λ2) 2
0 22 2
2 (0, )( )
(0, ) (0, )
IJ
I I
λλλ λ
=+
⊥
⊥ ||
DES(λ2), D, E, <d>, x
Light depolarization data in terms of polymer crystallinity
505
An extension of the theory of compensators onto statistical systems [19] provides a tool for studying the material structure. Variation of sample orientation with respect to the axis of the polarizer (angle ϑ) makes possible analysing samples with non-random crystal orientation distribution. Depolarization measurements performed at two different wavelengths may be used for decoupling of the variable DE and obtain-ing independent information about the average retardation function, D(λ1), average number of plates in the light path, E, average plate thickness, <d>, and the degree of crystallinity, x.
Six intensities presented in Table 1 enable a complete decoupling of the character-istic DES. The measurements require application of two different wavelengths and two different sample orientations.
References
[1] ZIABICKI A., Macromol. Symposia, 175 (2001), 225. [2] FISCHER K., SCHRAM A., Angew. Chem., 68 (1956), 406. [3] MAGILL J.H., Nature, 187 (1960), 770. [4] MAGILL J.H., Polymer, 2 (1961), 221. [5] MAGILL J.H., Polymer, 3 (1962), 35. [6] MAGILL J.H., Brit. J. Appl. Phys., 12 (1961), 618. [7] ZIABICKI A., Kolloid Z. Z. f. Polymere, 219 (1967), 2. [8] BINSBERGEN F.L., J. Macromol. Sci. (Phys), B4 (1970), 837. [9] BINSBERGEN F.L., DE LANGE B.G.M., Polymer 11 (1970), 309.
[10] DING Z., SPRUIELL J.E., SPE ANTEC, 52 (1994),1485. [11] DING Z., SPRUIELL J.E., J. Polymer Sci. (Phys), 34 (1996), 2783. [12] DING Z., SPRUIELL J.E., J. Polymer Sci. (Phys), 35 (1997), 1077. [13] SUPAPHOL P., SPRUIELL, J.E., J. Appl. Polymer Sci., 86 (2002),1009. [14] FRESNEL A., Ann. Chem. Phys. 17 (1822), 172. [15] ZIABICKI A., MISZTAL-FARAJ B., Polymer, 46 (2005), 2395. [16] SZIVESSY G., HERZOG W., Z. f. Instrumentenkunde, 57 (1937), 53. [17] HSÜ H.Y., RICHARTZ M., LIANG Y.K., J. Opt. Soc. Am., 37 (1947), 99. [18] JERRARD H.G., J. Opt. Soc. Am., 38 (1948), 35. [19] ZIABICKI A., J. Opt. A.: Pure Appl. Opt. 7 (2005), 774.
Received 13 May 2005 Revised 16 December 2005
Materials Science-Poland, Vol. 24, No. 2/2, 2006
Mesomorphic organisation of (2-hydroxypropyl)cellulose
under the influence of silica networks
P. WOJCIECHOWSKI1, T. HALAMUS
1*, U. PIETSCH2
1Department of Molecular Physics, Technical University of Łódź, ul. Żeromskiego 116, 90-924 Łódź, Poland
Mesomorphic behaviour of (2-hydroxypropyl)cellulose (HPC) within organic–inorganic hybrid materi-als was investigated. Hybrid materials HPC/silica were prepared by means of the sol-gel process, with hy-drolysis and condensation of (tetraethoxy)silane taking place in the mesomorphic environment of HPC. Solid films of HPC/silica were investigated using the Raman spectroscopy, differential scanning calorimetry, thermo-optical analysis, and small angle X-ray scattering. Additionally, swelling by water was tested. The analysis of the results leads to the following conclusions: (i) silica has a strong stabilisation effect on the mesomorphic organisation of HPC: the glass transition temperature and isotropisation temperature of HPC are shifted to higher values; (ii) X-ray measurements reveal a nano-scale organisation of the HPC/silica hybrids with d-spacing equal to 65Ǻ; a long-range organisation within HPC/silica hybrids seems to be related to a surface induced ordering; (iii) curing of HPC/silica hybrids affects the swelling behaviour.
In the past 20 years, research on the mesomorphic behaviour of cellulose deriva-tives has been focused on cholesteric liquid-crystalline phases after discovery of cho-lesteric phases of (2-hydroxypropyl)cellulose (HPC) in concentrated aqueous solu-tions by Werbowyj and Gray [1]. HPC forms thermotropic as well as lyotropic liquid crystalline phases in many solvents. The investigations were not limited to the cellu-lose derivatives alone but studies of the molecular structure of composites based on the cellulose derivatives with hydrophilic polymers have also been carried out. They have shown an effect of the hydrophilic polymers on the phase transitions of the me-somorphic cellulose derivatives [2–5]. Hybrid composite systems of the cellulose _________
derivatives with an inorganic component were also investigated, albeit to much smaller extent [6, 7]. Organic-inorganic hybrids of polysaccharides occur in nature: in the rice plant, for example, amorphous silica is supplied, transferred, and precipitated in the polysaccharide matrix. Generally, an inorganic phase in biocomposites is regu-larly and highly organised in a polymer matrix. These sophisticated biomineralization processes are difficult to be repeated and carried out in artificial systems [8].
A hybrid material based on HPC and silica was obtained ca. 10 years ago by Yano [6], who investigated the influence of silica network on the molecular motion of HPC analysing the dynamic viscoelasticity. The tanδ curve of HPC shows a high, sharp peak at 110 ºC (α1 relaxation) and two smaller peaks at 25 ºC (α2 relaxation) and at –45 ºC (β relaxation). The α1 peak of the micro-hybrids broadens and its height decreases as the silica content increases. Mechanical properties of the HPC/silica hybrids are improved in comparison with HPC: for example the ultimate strength of HPC is 5 MPa, whereas the strength of the hybrid composites is up to 18 MPa. Microphase-separation processes in the HPC/silica hybrids were recently investigated by Thomas and Antonietti [7]. Their studies revealed that the suprastructure of HPC in the HPC/silica system is essen-tially preserved. The HPC/silica hybrids resemble the microporous silicate glasses im-pregnated by low molar mass liquid crystals [9]. Investigations of the condensed matter in porous matrices have revealed various novel properties and effects not observed in the same substances when studied as bulky samples. In this paper, we analyse an influence of the silica network on the mesomorphic organisation and properties of HPC. We per-formed the Raman spectroscopy (RS), differential scanning calorimetry (DSC), X-ray, thermo-optical analysis (TOA), as well as swelling experiments.
2. Experimental
Sample preparation. (2-Hydroxypropyl)cellulose (HPC) (MW = 100 000) and (tet-raethoxy)silan (98%) (TEOS) were supplied by the Aldrich Chemical Company and used without further purification. Hybrid materials of HPC/silica were prepared ac-cording to the sol-gel process: appropriate amounts of HPC (e.g., 2.0 g) were mixed in the flask with 1.2 g TEOS, 1.0 g aqueous hydrochloric acid (pH = 1) and 15.8 g ethyl alcohol. Calculated values of silica content were estimated from the initial amount of TEOS assuming that TEOS was completely converted to silica, and all volatile liquids have evaporated. All the samples were homogenised by stirring for 4 h and stored for 48 h. The viscous liquid was then poured out on a Teflon plate. The mesophase or-ganisation of HPC occurred during the solvent evaporation. The HPC/silica films (thickness 0.5 mm) were then dried during 8 h in the temperature of 80 °C under vac-uum. Reference HPC films were obtained by casting from ethanol solution.
The HPC/silica round samples with the diameter of 1.5×10⁻² m, and the thickness of 3×10⁻⁴ m were investigated in terms of their swelling abilities in water at pH = 5.5 by a weighing method with an accuracy of 1×10⁻⁴ g. The water uptake (h) is ex-pressed as the ratio of the mass of water in a sample to the mass of the dry sample.
(2-Hydroxypropyl)cellulose under the influence of silica networks
509
Material characterisation. Differential scanning calorimetry (DSC) measurements were carried out by using a DuPont Instruments 910DSC, employing the heating rate of 10 ºC/min. The thermo-optical analysis (TOA) was carried out using a Mettler Toledo FP-84 hot stage and a polarised microscope. The TOA analysis consists in measuring the relative intensity of light, IT/I0, transmitted through a sample placed under a micro-scope between crossed polarisers as a function of linearly increasing temperature (IT and I0 are the intensity of the transmitted light at temperature T and at the room temperature, respectively). The heating rate in our experiments amounted to 2 ºC/min. The Raman investigations were performed using a dispersive spectrometer Jobin–Yvon T64000 equipped with a confocal microscope. The Raman spectra were obtained at 293 K using the argon ion laser (λ = 514 nm). The X-ray diffraction patterns of HPC/silica hybrids were measured in the Institute of Physics, University of Potsdam.
3. Results and discussion
3.1. Raman scattering
The analysis of silica in the HPC/silica hybrids was performed using Raman spectros-copy. The reference sample (100% SiO2) was obtained by the sol-gel process of TEOS similar to the HPC/silica hybrids. Figure 1 shows Raman spectra of silica, pure HPC and of the HPC/silica hybrids containing 25 wt. %, 50 wt. % and 80 wt. % of silica.
Fig. 1. Raman spectra of silica in the HPC/silica hybrids (upwards), Raman scattering of HPC (bottom)
P. WOJCIECHOWSKI et al. 510
The main Raman scattering of silica is detected in the frequency range of 250–650 cm–1 with maximum at 489 cm–1 [10]. The Raman spectrum of pure HPC in this range shows two bands at 472 cm–1 and at 859 cm–1. The spectra for the hybrid composites are normalised with respect to the 859 cm–1 band of HPC. The silica scat-tering band observed around 489 cm–1 is also detected in the hybrids systems, how-ever with a lower intensity, due to a lower concentration of silica network in the HPC/silica hybrids. The width as well as position of the 489 cm–1 line are characteris-tic of the three-dimension inorganic network of silica [10].
3.2. DSC and X-ray scattering measurements of HPC/silica systems
The complex morphological order of HPC in films cast from solvent was de-scribed by Samuels [11] and by Rials and Glasser [12]. Thermal and dynamic mechanical analysis (DMTA) of HPC shows that the material consists of three dis-tinct phases in the bulk: a crystalline phase, an amorphous phase and a phase exhibit-
Fig. 2. DSC heating curves for HPC and HPC/silica hybrids (first scan)
Fig. 3. DSC heating curves for HPC and HPC/silica hybrids (second scan)
(2-Hydroxypropyl)cellulose under the influence of silica networks
511
ing an intermediate level of order (intermediate phase). The contribution of the inter-mediate phase is strongly enhanced in HPC films cast from solvents in which HPC forms a lyotropic liquid crystalline phase.
Figures 2 and 3 show the first and second scans of DSC thermograms of HPC and HPC/silica films. The glass transition of HPC, expected at ca. 10 ºC, is not visible in the first scan because it is overlapped by a very broad endothermic effect, connected with the presence of the intermediate phase of HPC. It should be mentioned that HPC is a hydrophilic polymer containing about 2 wt. % of water when stored in air in nor-mal conditions. The broad endothermic peak around 100 ºC observed during the first DSC scan is related to the presence of water in the intermediate phase of HPC. The enthalpy of this transition is equal to ΔH = 40 J/g.
The thermogram of HPC during the second scan reveals the glass transition at 10 ºC, because the endothermic transition of intermediate phase dominating during the first heating is strongly suppressed and moved to a slightly lower temperature. The endothermic peak detected at 200 ºC in the first as well as in the second scan (the transition enthalpy ΔH = 2.8 J/g) corresponds to the transition of HPC from the ther-motropic phase to the isotropic phase, appearing in HPC at high temperatures [2]. The results of the investigations of phase transitions in HPC by means of DSC are consis-tent with the results presented in the literature derived from mechanical methods [12].
Figure 2 shows the first scans of DSC thermograms not only for HPC but also for the hybrid systems of the HPC/silica with different contents of silica. The values of ΔH and the transition temperatures are listed in Table 1. It can be seen that the phase transition of the intermediate phase of HPC is shifted to higher temperatures (from 108 ºC to 124 ºC) and the transition enthalpy increases from ΔH = 29 J/g in the sam-ple containing 5% of silica to ΔH = 134 J/g at 50 wt. % of the silica content.
Table 1. Transition temperatures (T100 , T200), corresponding enthalpies (ΔH) and glass transition temperatures (Tg) for HPC and HPC/silica hybrids
The results presented above strongly suggest that silica or its intermediate com-
pounds affect the thermal behaviour of HPC. The hydrolysis of TEOS and, in particu-lar, condensation of the silanol (SiOH) groups takes place in the lyotropic liquid crys-talline phase of HPC. Hence products of the hydrolysis of TEOS can interact with HPC macromolecules by hydrogen bonds enhancing the stability of the intermediate phase of HPC. At the same time the isotropisation transition of the thermotropic phase
P. WOJCIECHOWSKI et al. 512
appearing at 200 ºC in HPC, disappears in the composite HPC/silica. Instead, an endo-thermic effect shows up at a higher temperature (Table 1). This transition implies processes occurring inside silica associated with the condensation of free silanol groups. Hence, the second stage of solidification of the HPC/silica hybrid occurs probably in the temperature range 200–240 ºC. This process has a major influence on the thermal stability of the HPC/silica hybrids.
Figure 3 shows second DSC scans in the investigated systems. At low tempera-tures, the thermograms show a glass transition at about 10 ºC for HPC, and at 38 ºC and 53 ºC for HPC/silica containing 25 wt. % and 50 wt. % of silica, respectively (Table 1). No other thermal transitions can be detected in the hybrid HPC/silica sys-tems. In particular, the effect associated with the isotropisation, observed at 200 ºC in HPC, disappears in the hybrids.
An increase of the glass transition temperature with increasing silica contents sug-gests a cross-linking of HPC or/and an orientation ordering of HPC in the silica mi-cropores. It is known that the polymer characteristics and structure may substantially change in silica microporous glasses [9]. The thermal stability of polymers in micro-pores is higher than that of the respective bulk polymers. The effect can be explained using the concepts of surface-induced ordering effects. In order to confirm this as-sumption, small angle diffraction X-ray patterns (SAXD) of HPC/silica hybrids were investigated.
Fig. 4. X-ray diffraction patterns of HPC/silica hybrids: a) 25 wt. % of silica, b) 50 wt. % of silica
Figure 4 shows small-angle X-ray (SAXD) diffraction patterns for two HPC/silica hybrids with different concentrations of silica. SAXD peak position was found insen-sitive to the weight ratio of HPC to silica: the SAXD patterns of the investigated sam-ples show the diffraction at 2θ = 1.37º for both concentrations of silica with the d-spacing of 6.5 nm. The diffraction intensities are, however, different: the SAXD
(2-Hydroxypropyl)cellulose under the influence of silica networks
513
peak of the HPC/silica composite is higher when the amount of HPC in the silica envi-ronment is larger. Taking into account that the SAXD patterns of pure HPC or pure silica do not contain any diffraction peak at this 2θ range [13], the X-ray investigations indicate that the SAXD pattern at 2θ = 1.37º is associated with HPC macromolecules incorporated in silica pores. A possible explanation may be the orientation ordering of HPC macromolecules near the inner pore surface. The surface of a silica pore wall con-tains a large number of SiOH groups that can form hydrogen bonds with HPC.
A similar effect of orientation ordered regions has been observed in the investiga-tions of the light transmission through porous glass plates, containing in the pores poly(alkyl methacrylates) with a long side group [9]. It should be mentioned that the tendency for self-organisation of HPC, forming lyotropic and thermotropic liquid crystalline phases, is much stronger than in the case of the non-mesogenic poly(alkyl methacrylates).
3.3. Thermo-optical analysis of the HPC/silica hybrids
As was mentioned in Section 2, the thermo-optical analysis consists in measuring transmission of polarised light as a function of temperature. Figure 5 shows thermo-optical (TOA) characteristics of HPC and HPC/silica hybrids in the temperature range 20–250 °C. The HPC/silica hybrids form birefringent films, transparent for the visible light at silica concentrations up to 60 wt. %. Samples with higher concentrations of silica are opaque and fragile.
Films of pure HPC show a drop of transmission in the temperature range 190–200 °C, due to the transition to the isotropic phase, as was confirmed by DSC.
P. WOJCIECHOWSKI et al. 514
All the investigated HPC/silica hybrids show birefringence and a high transmission of the polarised light above the isotropisation temperature of pure HPC. The content of the silica as low as 5 wt. % was found to stabilise very effectively the birefringence of the HPC/silica hybrids: the polarised light transmission at 250 °C is equal to 50% of its initial value. For the HPC/silica hybrids containing 25 wt. % or 50 wt. % of silica the transmission of polarised is constant up to 250 °C.
The results of the TOA measurements are consistent with the DSC experiments for the HPC/silica hybrids. Both methods demonstrate that silica in the hybrids hin-ders the isotropisation process of HPC. On the other hand, the results of dynamic me-chanical investigations [6] as well as recently published structural investigations [7] reveal that the suprastructure of HPC in the HPC/silica system is essentially pre-served. The ordered state of the HPC/silica system detected above of the isotropisa-tion temperature of HPC is probably associated with the surface effect typical of two-component heterogeneous media.
3.4. Swelling of HPC/silica hybrids
The main objective of our research was the swelling behaviour of the HPC/silica hybrids in water as well as the status of water after the swelling. The HPC/silica hy-brids in water immersion are able to form birefringent gels of the organic-inorganic network with water filling the interstitial spaces of the network.
Fig. 6. Water uptake of HPC/silica hybrids vs. time: open symbols – sample I, closed symbols – sample II
Figure 6 shows a temporal dependence of the water uptake (h) of HPC/silica hy-brids in the immersion of water for two kinds of samples. Samples I were cured at 80 ºC during 8 h in vacuum and samples II were additionally cured during 10 minutes at 230 ºC. DSC of the HPC/silica hybrids suggested an additional curing effect of
(2-Hydroxypropyl)cellulose under the influence of silica networks
515
silica at 240 ºC (see Fig. 2). The results presented in Figure 6 show that water uptake of the HPC/silica hybrids is strongly related to the concentration of silica as well as to its curing temperature. The increase of the concentration of silica from 5 wt. % to 25 wt. % decreases the swelling ability. A similar effect is obtained by an additional curing at 230 ºC.
The status of water filling the interstitial space of HPC/silica hybrids was esti-mated analysing the Raman spectra of the bulk water and water within HPC/silica hybrids after swelling. The Raman bands for the liquid water in the range 2800 –3800 cm–1 consist of four overlapping components peaking at 3247 cm–1, 3435 cm–1, 3535 cm–1and 3622 cm–1. Walrafen [14] has shown that these components exhibits different temperature dependencies: the intensities of the 3247 cm–1 and 3435 cm–1 components decrease on increasing temperature, while the two other components, at 3535 cm–1 and at 3622 cm–1, increase in intensity. There is an isosbestic point near 3460 cm–1. The integrated intensity ratio of the two former components (I3400/I3200) reflects the orientation order of H–bonds of water molecules [15]. A deviation of the integrated intensity ratio I3400/I3200 from the value of 0.86 characteristic of liquid water can be taken as a measure of changes in the water structure.
Fig. 7. Deconvolution of the O–H stretching Raman band for water within the HPC/silica
hybrids (5 wt. % of silica, h = 1.5)
Fig. 8. Deconvolution of the O–H stretching Raman band for water within the HPC/silica
hybrids (25 wt. % of silica, h = 0.67)
Figures 7 and 8 show a deconvolution of the OH stretching Raman band of water within the HPC/silica hybrids containing 5 wt. % and 25 wt. % of silica after swell-ing. The integrated intensity ratios I3400/I3200 of the two investigated samples are equal to 0.86 and 0.87, respectively. This means that water in the HPC/silica hybrids has the same microstructure as liquid water in bulk samples.
P. WOJCIECHOWSKI et al. 516
4. Conclusions
Phase transitions of (2-hydroxypropyl)cellulose (HPC) are sensitive to the pres-ence of silica within the HPC/silica hybrids. The glass transition of HPC in the hy-brids is moved to higher temperatures in comparison with bulk HPC. The HPC/silica hybrids maintain the birefringence to temperatures much higher than the isotropisa-tion temperature of bulk HPC. The X-ray measurements reveal a microstructure with d-spacing equal to 6.5 nm. It seems that the long range organisation in HPC/silica hybrids is related to surface-induced ordering of HPC in the silica pores.
Curing of the HPC/silica hybrids at elevated temperature affects their swelling be-haviour. The curing at the 200 °C strongly suppresses the swelling ability of HPC/silica hybrids, probably due to temperature induced crosslinking.
Acknowledgement
This research has been financially supported by the State Committee for Scientific Research (KBN) under the contract No. PBZ-KBN 095/ T08.
Conducting polymer films with new organic donor MDT-TSF: preparation and properties
A. TRACZ1*, A. MIERCZYŃSKA
2, K. TAKIMIYA3,
T. OTSUBO3, N. NIIHARA
3, J. K. JESZKA1, 2
1Centre of Molecular and Macromolecular Studies, Polish Academy of Sciences, 90-363 Łódź, Poland
2Department of Molecular Physics, Technical University of Łódź, 90-924 Łódź, Poland
3Department of Applied Chemistry, Graduate School of Engineering, Hiroshima University, Higashi-Hiroshima 739-8527, Japan
Preparation and properties of surface-conductive polymer composites based on a recently synthesized electron-donor, methylenedithio-tetraselenefulvalene (MDT-TSF) are described. Polycarbonate and bio-degradable polyester polylactide are used as polymer matrices. The obtained surface-conductive materials with MDT-TSF polyiodides show high, metal-like conductivities, indicating that MDT-TSF is one of the best donors for conductive composites.
1. Introduction
Conductive polymeric materials, including composites, are interesting from the viewpoint of many applications. Rendering conventional insulating polymers conduc-tive can be achieved by preparing composite materials in which networks of various conductive materials are formed within polymeric matrices. One possibility is to use organic conductors, in particular highly conducting CT complexes and salts (organic metals). Solubility of these materials makes possible use of solution processing tech-niques, and several very efficient methods for growing in situ conducting networks in polymer matrix have been elaborated [1–3].
In particular, using the so-called two-step reticulate doping method [2] one can ob-tain well-formed nanocrystals (20–100 nm thick) in the surface layer of polymer films [1–6]. Due to a very high degree of orientation of the crystals (conducting plane in the plane of the film) and good contacts between them, properties of such polycrystalline layers are close to those of single crystals. Although conductive systems have been
obtained using many different organic conductors including those showing metal-like temperature dependence of conductivity as single crystals, composites containing these materials are usually semiconductors. Only three systems have been found which are metallic in a broad temperature range [1, 3–7].
In this paper, we describe preparation and properties of composites based on a re-cently synthesized electron-donor methylenedithio-tetraselenefulvalene (MDT-TSF) [8–10]. By contrast to other donors used so far, MDT-TSF is asymmetric, metallic and even superconductive salts have been obtained by electrocrystallization [8]. Those materials show electronic and structural characteristics quite different from bis(ethylenedithio)–tetrathiafulvalene (ET) salts and constitute a new class of organic superconductors. In the present study, we employed polycarbonate and biodegradable polyester polylactide as polymer matrices and found that the obtained surface-conductive materials with MDT-TSF polyiodides show high, metal-like conductivities, indicating that MDT-TSF is one of the best donors that can be used to prepare conduct-ing composites.
2. Experimental
MDT-TSF (scheme 1) was synthesized as described in [8, 11]. Poly(bisphenol A-carbonate) (Lexane) (PC) was provided by Goodfellow. L-Polylactide (PLA) was supplied by Cargill-Dow (Minnetoka MN). Electrical conductivities were determined using the four-point method with a Keithley 195A multimeter. UV-Vis spectra were recorded using a Specord UV-Vis spectrophotometer. The morphology was studied with a Nikkon Eclipse E400 Pol polarizing microscope and a Jeol JSM-5500 scanning electron microscope (SEM). Reagent-grade solvents (methylene chloride (MC) and chlorobenzene (CB)) and iodine were used as received. X-ray diffraction (XRD) was measured with a Siemens diffractometer using Cu (Kα) radiation. Raman spectra were recorded using a Jobin–Yvon T6400 apparatus equipped with a confocal microscope. The excitation wavelength was 514.5 nm.
SSe
Se Se
Se
S
Scheme 1. Chemical formula of MDT-TSF
To prepare conductive composites, so-called modified two-step method of reticu-late doping has been used [1–3]. In the first step, polymer films containing 2 wt. % of MDT-TSF were obtained by casting a common solution in CB at 360 K. The additive was molecularly dispersed in the polymer matrix and the films so obtained were non-conductive. PC films cast in such conditions were amorphous while those of PLA were semicrystalline. One surface of these films was then treated with vapours of
Conducting polymer films with new organic donor MDT-TSF
519
iodine solutions in MC. MC swells the polymer film and enables a reaction between MDT-TSF and iodine. The salt crystallizing in situ forms conductive network of mi-crocrystals in the surface layer of the polymer film.
3. Results and discussion
Figures 1 and 2 show morphologies of conductive networks of MDT-TSF-iodide in PC films treated with MC/I2 vapours for different times. After a short time a network of
Fig. 1. Optical micrographs (polarized light) of PC films containing 2 wt. % of MDT-TSF treated
with vapours of iodine solution in MC (concentration 2.5 g/l) for various times:
a) 2 min (plate-like phase), b) 5 min (plates and spherulite-like domains), c) 9 min (domains)
randomly oriented plate-like microcrystals is formed (Figs. 1a and 2a), similar to those observed in other systems [1–3]. However, after a longer time larger morpho-logical structures appear: domains of higher optical anisotropy, resembling spherulites (Fig. 1b, c. Such a phenomenon has never been observed in similar composites until now. The mechanism of formation of the domain-phase is not clear and needs further investigations. We presume that it grows by recrystallization of micro-plates in the swollen surface layer of the polymer film, evidently nucleated in some places. The domains appear to be formed of smaller, hardly recognizable plates, forming long branched “wires” (Fig. 2b). This morphological change is also accompanied by changes of other physical properties of the films as discussed below.
A. TRACZ et al. 520
On increasing the vapour treatment time (or the iodine concentration) the colour of the vapour-treated films changes from brown (random platelets) to olive (domains). It should be pointed out that (MDT-TSF)I1.27 crystals obtained by electrocrystallization are also gold-olive [8]. Absorption spectra of the films with plates and with domain
Fig. 2. SEM images showing plate-like phase (a) and domain (spherulite-like) phase (b) in PC films containing 2 wt. % of MDT-TSF treated with vapours of iodine solution
in MC (concentration 2.5 g/l) for 5 min. Scale bar 5 µm
structures and of films before vapour treatment are compared in Figure 3. Formation of MDT-TSF salt results in a decrease of the absorption at 32 000 cm–1 related to neutral MDT-TSF (but not as pronounced as in other systems [2, 3]) and to a build-up of the ab-sorption in the visible range related to 3I
− and MDT-TSF cation. The absorption bands strongly overlap (more than for surface conducting films with bis-(ethylenedioxy) -tetrathiafulvalene (BO) or ET polyiodides) and therefore it is not possible to identify peaks of 3I
− (in the range 16 000–21 000 cm–1) and of donor radical cations. One can also see an increase of the base line due to light scattering by the microcrystals.
Fig. 3. Absorption spectra of PC film containing 2 wt. % of MDT-TSF: a) before treatment, b) after treatment with vapours of 2.5 g/l solution of iodine
in MC for 2 min (plate-like phase), c) after treatment with vapours of 5 g/l solution of iodine in MC for 5 min (domain structures)
Conducting polymer films with new organic donor MDT-TSF
521
The surface conductivity of the films is strongly dependent on the composition of pristine films, on the kind of polymer matrix and on the vapour treatment conditions (iodine concentration, time, etc.). For a given iodine concentration, after some time the conductivity strongly increases and reaches a maximum (Fig. 4). This increase is related to formation of a conducting network. In the case of higher iodine concentra-tion (e.g. 12 g/l), the conductivity decreases after reaching a maximum. This behav-iour, which can be explained by formation of less conducting salts of higher iodine content, has also been observed in surface conducting reticulate doped systems with other donors, e.g. BO [6]. For lower iodine concentrations, the over-doping with ex-cessive amounts of iodine does not occur and highly conducting films can be obtained in broad range of the vapour treatment time.
Fig. 4. Surface conductivity vs. vapour treatment time of PLA and PC films with 2 wt. % of MDT-TSF after treatment with vapours of MC solutions
with various iodine concentrations (in g/l)
Although the plates formed after a short time of treatment seem to contact each other and form a continuous network (as can be seen in the SEM image in Fig. 2a), the conductivities of these films are poor. Only films containing the domain phase (like those shown in Fig. 2b) exhibit high conductivities (and also XRD maxima are clearly seen – vide infra).
Under appropriate vapour-treatment conditions, we obtained the surface conduc-tivities of the order of 10–4 S/□ (percolation of the domain phase) in the case of PC matrix and even 10–3 S/□ in the case of PLA. However, the conductivities are still by at least two orders of magnitude smaller than those one could expect assuming that the thickness of the salt layer is ca. 200 nm (as estimated from the volume ratio of the salt and the polymer) and taking the value of specific conductivity for single crystals of the only known highly conducting MDT-TSF polyiodide, namely (MDT-TSF) I1.27.
Highly conducting films obtained from both polymers show metal-like tempera-ture dependence of conductivity in a broad temperature range, as is shown in Figure 5.
A. TRACZ et al. 522
At the lowest temperatures a levelling of conductivity is observed. Such a behaviour has been observed in most composite systems obtained by this method and has been attributed to grain boundaries and temperature expansion coefficients. The tempera-ture coefficient of conductivity is higher for the PLA films showing better conductiv-ity at room temperature than the PC films (Fig. 5). For less conducting PC films, es-pecially those in which the plate-like phase dominates, the temperature dependence of resistivity is semiconductor-like.
Fig. 5. Temperature dependence of relative surface conductivity for PC and PLA films with 2 wt. % MDT-TSF after treatment with vapours
of iodine solution in MC (5g/l) for 6 min
Biodegradable polylactide used in this work is very good as a polymer matrix, forming films of very high conductivity, being, however, less suitable for investiga-tions of properties of the conductive network because it is semicrystalline. The work on optimization of PLA composites and explaining the role of its crystallinity is in progress.
X-ray diffractograms of the PC films are presented in Figure 6, showing the for-mation of a crystalline phase of MDT-TSF salt after the vapour treatment. It is worth noting that in case of poorly conducting “brown films” obtained after short vapour treatment time (e.g., 2 min) and containing only plates, no pronounced X-ray diffrac-tion peaks are observed. This can be explained by a small size (thickness) of crystal-lites and/or their poor perfection. The diffraction peaks can be seen only in films ob-tained after a longer vapour treatment (e.g., 3 min) and containing some domain structures (even isolated ones). One can see that the same family of peaks is observed independent on the vapour-treatment time. The intensity of the peaks increases with the vapour treatment time, i.e., with increasing amount of the domain phase (Fig. 6). The presence of only one family of peaks indicates a good orientation of the micro-crystals in the film plane. On the other hand, a comparison of the structure of micro-crystals in the conductive films and electrochemically grown (MDT-TSF)I1.27 single crystals can be made using only one parameter – the interlayer spacing. In other simi-
Conducting polymer films with new organic donor MDT-TSF
523
lar systems, the observed diffraction peaks correspond to (00l) spacing in the c* direc-tion [3, 4, 6, 7, 12]. In the investigated MDT-TSF iodide composites, however, this is not the case. Single crystals obtained by electrocrystallization are orthorhombic, space group Pnma, with a = 4.013 Å, b = 12.539 Å and c = 25.620 Å, ab plane being the plane of high conductivity.
Fig. 6. X-ray diffraction patterns of PC with 2 wt. % of MDT-TSF after vapour treatment with iodine solution in MC (5 g/l) for various times: 1 – 3 min, 2 – 5 min, 3 – 8 min (a); a part of the diffractogram (3) displayed in a smaller 2θ range; the vertical bars represent
the positions of all diffraction peaks expected in this 2θ range for (MDT-TSF) I1.27, i.e. (001), (002), (010), (011), (012), (003), (013), (020), (004) (b)
In Figure 6b positions of peaks expected from random orientation of the (MDT -TSF)I1.27 crystals (vertical bars) are compared with positions of the peaks obtained for a highly conducting film. In order to facilitate the comparison, the angular range in Figure 6b is limited to small values of 2θ. The positions of experimental and of all calculated reflexes are significantly different. This result indicates that the reaction of the neutral donor with I2 in a swollen polymer surface yields crystals not only of dif-ferent morphology but also of a different structure from those obtained in solution. The stoichiometry of the new salt in the polymer matrix is not known yet.
In order to check the actual iodine species in the conducting film, we performed Raman spectroscopy studies. This technique is a powerful tool for identification of
3I ,− both in single crystals of different highly conducting salts [13, 14] and in polymer composites [6, 15, 16]. An instrument equipped with confocal microscope was used in our studies. It was therefore possible to detect independently the Raman scattering from plate microcrystals and domains even though they were present in the same film (as in the case shown in Fig. 1b).
Resonant Raman scattering spectra of surface conducting PC and PLA films con-taining MDT-TSF iodide salts are shown in Figure 7. One can notice that each spec-trum exhibits a strong band around 110 cm–1 and its overtones. The presence of a Ra-man scattering peak was observed in this range for various single crystals and for
A. TRACZ et al. 524
microcrystals in surface conductive composites with various donors [6, 13–16]. It has been unambiguously ascribed to the symmetric stretching vibrations of 3I .− A closer
Fig. 7. Raman spectra of PC and PLA films with 2 wt. % of (MDT-TSF) treated with vapours of iodine solution in MC (2.5 g/l) for 5 min
inspection of the spectra in Figure 7 reveals, however, slight differences between the Raman scattering from the plates and from the domains. In the case of plates (curve 1) the maximum is at 108 cm–1. In the case of the domain phase both in PC and in PLA films the maximum is observed at 105 cm–1. In the domain phase, the Raman peak is only slightly asymmetric while in the plate-like microcrystals a shoulder is clearly seen at higher wave numbers. Such an asymmetry was observed for microcrystals of (BO)2.4I3 in polymer films (max. at 107 cm–1 [6]) and for single crystals of MDT-ST(I3)0.417 (max. at 104 cm–1) [17]. The asymmetry could be explained by different molecular environments of 3I
− anions because 3I− and BO or MDT-ST lattices are
incommensurate. Although there are no structural evidences yet, the Raman spectra seem to indicate that also in the case of microcrystals in surface conducting PC and PLA films the donor and acceptor lattices are incommensurate.
4. Conclusions
Recently obtained asymmetric MDT-TSF donor is very well suited for fabrication of conductive composites using the two-step reticulate doping method. The reaction of the neutral donor with I2 in swollen surface of PC or PLA films yields highly con-
Conducting polymer films with new organic donor MDT-TSF
525
ductive microcrystals. Two morphological forms of conductive networks are ob-tained: random plate-like and spherulite-like domains. The percolation of the domains is a condition for high conductivity and its metallic temperature dependence. X-ray diffraction studies show that the structure of microcrystals in highly conducting do-mains is different from that of electrochemically grown single crystals of metallic (MDT-TSF)I1.27.
The acceptor lattice in the new salts has been confirmed to be chains of I3- as evi-denced by the Raman studies. The two morphological forms of conducting networks have slightly different positions of the maxima ascribed to symmetric stretching vibra-tions of the triiodide anion. This indicates that the reaction of I2 with MDT-TSF leads to formation of salts with various structures and stoichiometries as was found for other TTF derivatives. An unambiguous explanation of the crystal structure and prop-erties of the networks of MDT-TSF salt forms needs further studies.
Biodegradable polylactide used in this work is very good as a polymer matrix, forming films of very high conductivity but, being semicrystalline, is less suitable for investigations of properties of the conductive network. The work on optimization of PLA composites and explaining the role of its crystallinity is in progress.
Acknowledgements
Financial support from the Ministry of Scientific Research And Information Technology (Poland) under project PBZ-KBN070/T09/2001 is gratefully acknowledged. One of the authors (K. T.) is indebted for a financial support from Industrial Technology Research Grant Program in 2003 from the New Energy and Industrial Technology Development Organization (NEDO) of Japan.
References
[1] JESZKA J.K., Polish J. Chem., 76 (2002), 201. [2] JESZKA J.K., TRACZ A., Polym. Adv. Technol., 3 (1992), 139. [3] JESZKA J.K., TRACZ A., SROCZYNSKA A., KRYSZEWSKI M., YAMOCHI H., HORIUCHI S., SAITO G.,
Edit., 40 (2001), 1122. [11] TAKIMIYA K., KATAOKA Y., NIIHARA N., ASO Y., OTSUBO T., J. Org. Chem., 68 (2003), 5217. [12] TRACZ A., Synth. Met., 109 (2000), 267. [13] SUGAI S., SAITO G., Solid State Commun., 58 (1986), 759. [14] SWIETLIK R., SCHWEITZER D., KELNER H.J., Phys. Rev. B, 369 (1987), 6881.
A. TRACZ et al. 526
[15] WOJCIECHOWSKI R., ULANSKI J., KRYSZEWSKI M., TRACZ A., JESZKA J.K., MULLER H., LEFRANT S., FAULQUES E., Synth. Met., 94 (1998), 27.
[16] WOJCIECHOWSKI R., ULANSKI J., LEFRANT S., FAULQUES E., LAUKHINA E., TKACHEVA V., J. Chem. Phys., 112 (2000), 7634.
[17] TAKIMIYA K., TAKAMORI A., ASO Y., OTSUBO T., KAWAMOTO T., MORI T., Chem. Mater., 15 (2003), 1225.
Received 9 December 2005 Revised 19 December 2006
Materials Science-Poland, Vol. 24, No. 2/2, 2006
Photovoltaic effect in novel polysilane with phenothiazine rings and its blends with fullerene
A. RYBAK*, J. JUNG, W. CIESIELSKI, J. ULANSKI
Department of Molecular Physics, Technical University of Łódź, 90-924 Łódź, Poland
Investigations of the photogeneration process and photovoltaic effect in recently synthesized polysi-lane and its mixtures with fullerene (C60) are reported. Dependencies of the photogeneration quantum yield on the wavelength of the exciting radiation and on electric field were determined by the surface potential decay technique. It was found that addition of C60 improves the photogeneration efficiency. The Onsager model was used to analyse the obtained results. To check potential application properties of the investigated material, the photovoltaic effect was investigated in devices with an active layer made of mixtures of polysilane and C60. It was found that the power conversion efficiency of the device is depend-ent on the C60 concentration, the photovoltaic effect was observed, however, even if the amount of C60 was low (5 wt. %).
Silicon-backbone oligomers and polymers – polysilanes – are functional polymer materials exhibiting interesting photophysical properties. Polysilanes are also attrac-tive photoconductive materials due to a relatively high mobility of charge carriers. A substitution of side groups by chromophores and doping are required, however, in order to enhance their sensitivity in the visible range [1–6]. For this reason, a novel polysilane copolymer was synthesised, with N-phenothiazine moiety attached to the main chain with an n-propyl spacer (hereafter referred to as PSi–Phth, see Fig. 1) was synthesised. The main purpose for introducing the phenothiazine side groups was to facilitate the ability of C60 fullerene to be attached to the polysilane chain, and there-fore to create a donor–acceptor system. Because of a non-planar structure of phe-nothiazine, the fullerene molecule is better connected. The mixture PSi–Phth/C60 was used as active layer in photovoltaic cells. It is well known that addition of fullerene _________
(which is a strong electron acceptor) to semiconducting polymers increases the photo-conductivity [7–9].
Fundamental processes in photoconduction and photovoltaic effect are: photogen-eration of charge carrier pairs, their separation and then transport of electrons and holes. Preparation of a suitable donor and acceptor mixture can organize the mole-cules into phase-separated, interpenetrating and continuous donor and acceptor net-work. The large effective interface can be reached by photo-excitons and increases probability of the charge carriers photogeneration. One can use such a mixture for fabricating efficient photovoltaic devices [10–15].
Fig. 1. Molecular structure of PSi–Phth copolymer
Dependencies of the photogeneration quantum yield on photon flux, on light wave-length and on electric field in the copolymer/fullerene mixtures were determined using the surface potential discharge (SPD) technique [15–17]. The influence of fullerene addition on the performance of the photovoltaic devices was also investigated.
2. Experimental
Materials. Newly synthesized N-phenothiazine-substituted polysilane: poly[[3-(N -phenothiazinyl)propyl]methylsilane-co-methylphenylsilane] containing phenothiaz-ine moieties connected to the main polysilane chain via a short n-propyl spacer (Fig. 1) was investigated. The copolymer was synthesized by the Wurtz coupling reac-tion of corresponding monomers, ie. [3-(N-phenothiazinyl)propyl]methyldichlorosi- lane and dichloromethylphenylsilane. All reagents and starting materials were pur-chased from Sigma -Aldrich and were used without further purification. C60 was used as electron acceptor and electron transport material in the blend devices. UV-Vis ab-sorption spectra of the investigated materials and of their blend are shown in Figure 2. The spectra of the individual components are additive, i.e., the spectrum of a mixture is a weighted sum of the spectra of pure components. This feature means that no dis-tinct charge transfer (CT) band was detected.
Preparation of samples for surface potential decay technique and evaluation of the photogeneration quantum yield. Samples for the SPD measurements were prepared on stainless steel substrates by drop casting from toluene solution (20 mg/ml) of pure
Photovoltaic effect in novel polysilane with phenothiazine rings and its blends with fullerene
529
PSi–Phth and its mixture with 5 wt. % of C60. A slow, limited evaporation rate yields homogeneous films of 2 μm in thickness. The thicknesses of the investigated samples were determined with an AFM microscope (NT-MDT Solver Pro).
The SPD technique is described in details elsewhere [15–17]. Briefly, it consists in charging the sample surface in the dark to an initial potential VS by the corona dis-charge (the ions form a blocking electrode on the sample surface) and monitoring the surface potential decay, first in the dark, and then under illumination with a selected wavelength. Because the concentration of trapped charge carriers and recombination centres increases during the steady-state illumination, and it is difficult to take these processes into consideration, only the initial photo-induced discharge is analysed, i.e. the surface potential derivative at the moment t0 (start of the illumination) is deter-mined and used for further analysis [16].
For the emission-limited discharge, the photogeneration quantum yield φ is given by the equation [17]:
0
0
ph t
S dV
en d dt
εεφ ⎛ ⎞= ⎜ ⎟⎝ ⎠
(1)
where: ε is the relative electric permittivity of the material; ε0 – permittivity of free space, S – the surface area, e – the unit charge, nph – the number of the absorbed pho-tons per unit time, d – the thickness of the sample, (dV/dt) is the rate of decay of the surface potential; t0 indicates the initial moment of the irradiation of the sample.
The SPD measurements were performed with the continuous monochromatic inci-dent radiation. A PTI power arc mercury-xenon lamp with various band-pass and grey filters was used as a light source. To check if the emission-limited condition is ful-filled, the discharge measurements were performed with different photon flux densities nph in the range 1016–1019 photons/(m2·s). The quantum yield was calculated from the measured photodecays taking into account corrections for the light source perform-ance, spectral characteristic of the optical path and absorption by the active area of the sample. All the measurements were carried out at room temperature under ambient con-ditions.
Preparation of the photovoltaic devices and the photovoltaic effect measurements. The photovoltaic effect was measured on samples prepared in ambient conditions by spin casting toluene solutions of the investigated material (20 mg/ml) onto indium –tin–oxide (ITO) coated glass substrates at room temperature. The ITO electrode had been earlier covered with a 20 nm film of poly(ethylenedioxythiophene) doped with polystyrene sulfonic acid (PEDOT-PSS). Different concentrations (0–80 wt. %) of fullerene in the mixture with PSi–Phth were used. On top of the film, a 150 nm thick aluminium electrode was evaporated.
The devices were illuminated through the ITO electrode with light whose intensity amounted 1 mW/cm2 using a xenon lamp with monochromatic filters (at λ = 340, 405, 500 nm). Current–voltage characteristics were measured in air using a computer con-
A. RYBAK et al. 530
trolled source-measure unit (Keithley 2410). The power conversion efficiency η was calculated as the ratio of the maximal electrical power generated in the cell (Pmax) to the power of incident light (Pin):
max OC SC
in
P U JFF
P LAη = = (2)
where A is equal to the illuminated surface area (ca. 0.06 cm2), L is the intensity of the incident light (not corrected for absorption-reflection processes at the ITO-covered surface), and FF is the fill factor (FF = (UI)max / (UOCISC)), UOC being the open circuit voltage, and ISC – the short circuit current.
3. Results and discussion
3.1. Photogeneration in PSi–Phth and its mixture with C60
Figure 2 shows spectral dependencies of the photogeneration quantum yield φ for the PSi–Phth and PSi–Phth/C60 samples, and their UV-Vis absorption spectra for the whole investigated wavelength range, from 270 nm to 680 nm. One can observe a coincidence of the maximum of φ with the optical absorption maximum at ca 340 nm. The photogeneration efficiency decreases at the long wavelength absorption tail. This symbatic dependence indicates that there is no photoinjection of charge carriers from the substrate electrode by the weakly absorbed light.
Fig. 2. UV-Vis absorption spectra (left axis) for PSi–Phth (n = 1, m = 6.5) copolymer, fullerene and their mixture (5 wt. % of C60) in solutions in toluene and spectral dependencies
of the photogeneration quantum yield φ (right axis) measured for PSi–Phth and for PSi–Phth/C60 blend layers obtained by drop casting; E = 1.2×10⁸ V/m, nph = 1019 photons/m2s,
d = 2 μm, S = 3.14×10⁻⁴ m2, ε = 3 was taken for the calculations
Photovoltaic effect in novel polysilane with phenothiazine rings and its blends with fullerene
531
Photogeneration in the PSi–Phth layer is enhanced in the spectral range between 320 nm and 430 nm by doping with C60, as is shown in Figure 2. As no CT band was detected in the absorption spectrum of the blend, the improvement of photogeneration should there-fore be due to a superposition of photogeneration processes of individual components. The increase of the photogeneration efficiency in the steady state photoconductivity measure-ments in fullerene samples was described in terms of the intermolecular charge transfer states within the fullerene aggregates [18–21]. Figure 3 presents the electric-field depend-encies of φ in PSi–Phth (a) and in its mixture with 5 wt. % of C60 (b).
Fig. 3. The electric-field dependence of the photogeneration quantum yield φ for various wavelengths in: a) the pure PSi–Phth layer, b) for PSi–Phth + 5 wt. % C60 layer.
The photon flux nph = 1019 photons/m2s, the samples thickness d = 2 μm. The dashed lines were obtained by fitting the experimental data with the Onsager model assuming
a delta distribution of the thermalization length r0 and ε = 3
The field dependencies of the photogeneration quantum yield in both samples can be well described by the model based on the Onsager theory of geminate recombina-tion [22, 23]. One can get the primary photogeneration quantum yield φ0 and the ther-malization length r0 by fitting the experimental data. The values of φ0 and r0 were obtained assuming a delta distribution of r0. One should nevertheless note that a lim-ited range of electric fields available in the SPD experiment does not allow us to ex-clude other distributions. It was shown that when a CT complex is involved in the photogeneration, the data cannot be fitted by the Onsager model and the kinetic model proposed by Braun is more suitable [24, 25]. A good matching with the Onsager model points to the absence of a CT complex in the PSi–Phth/C60 mixtures. The fit-ting parameters are collected in Table 1. One can see that for all the investigated wavelengths of exciting light r0 is almost constant, while φ0 considerably decreases at longer wavelengths. It is interesting to note that the thermalization length r0 in PSi –Phth/C60 is comparable with the diameter of C60 molecule (0.7 nm).
On comparing φ values obtained for the PSi–Phth and PSi–Phth/C60 samples at the same electric field one finds that the photogeneration quantum yield is higher for the system with C60 and this effect is stronger at low electric fields (Fig. 3).
A. RYBAK et al. 532
Table 1. Primary photogeneration quantum yield φ0 and thermalization length r0 in PSi–Phth copolymer (pure and with 5 wt. % of C60, for various excitation wavelengths) calculated
using the Onsager theory of geminate recombination with assumed delta distribution of r0
Copolymer λ [nm] 340 405 500
φ0 3.5×10⁻³ 2.5×10⁻⁴ 4.7×10⁻⁵ PSi–Phth
r0 [nm] 2.3 2.9 2.8 φ0 1.6×10⁻² 4.7×10⁻³ 5.5×10⁻³
PSi–Phth + 5 wt. % C60 r0 [nm] 0.6 0.5 0.4
3.2. Photovoltaic effect in PSi–Phth/C60
Figure 4 shows I–U characteristics obtained for different wavelengths of exciting light in a device with PSi–Phth containing 50 wt. % of C60. The determined values of short circuit current density (JSC), open circuit voltage (UOC), fill factor (FF), and power conversion efficiency (η) are listed in Table 2. The best photovoltaic parame-ters are achieved for the illumination with λ = 405 nm. This result is inconsistent with the spectral dependence of the photogeneration quantum yield φ, indicating that it is not only photogeneration that contributes to the generation of charges but also photoinjection from the illuminated organic material-metal electrode junction plays a significant role.
Fig. 4. I–U characteristics of the photovoltaic devices made of PSi–Phth + 50 wt. % C60 for various wavelengths. Active area was ca. 0.06 cm2
,, thickness d = 140 nm, and the light intensity L ≈ 1.0 mW/cm2
Figure 5 shows I–U characteristics obtained for various mass fractions of fullerene in PSi–Phth/C60 devices illuminated with λ = 405 nm. It is clearly seen that there is no photovoltaic effect in pure PSi–Phth, while the performance of the device improves
Photovoltaic effect in novel polysilane with phenothiazine rings and its blends with fullerene
533
Table 2. The short circuit current JSC, open circuit voltage UOC, fill factor FF, the energy conversion efficiency η for various wavelengths λ in PSi–Phth + 50 wt. % C60 photovoltaic devices
Fig. 5. I–U characteristics of the photovoltaic devices with various contents of fullerene. Active area ca. 0.06 cm2, thickness d = 140 nm, excitation at λ = 405 nm,
light intensity L = 0.7 mW/cm2
with increased fullerene fraction. Because photogeneration occurs both in pure PSi –Phth and in PSi–Phth/C60 (Figs. 2 and 3), this effect demonstrates that fullerene im-proves the transport of photogenerated electrons to the anode (holes are transported by polysilane chain to the cathode). However, as is shown in Fig. 5, the amount of the fullerene should not be too high: the performance of the PSi–Phth/C60 device with 80 wt. % of C60 is worse than that is the system with 50 wt. % of C60, probably due to a worse connectivity of the polymer network.
4. Conclusions
The photogeneration quantum yield in polysilane copolymer with phenothiazine side groups increases upon addition of fullerene acceptor, although no CT complex is formed and the photogeneration mechanism can be described by the Onsager model. The decrease of r0 with increasing amount of fullerene indicates that in PSi–Phth/C60 mixtures the photogeneration proceeds rather within the fullerene aggregates than in polysilane copolymer.
A. RYBAK et al. 534
The photovoltaic effect appears after introducing even small amounts of C60 to the polysilane copolymer with phenothiazine moieties. One can conclude that the pres-ence of C60 facilitates the separation of the photogenerated electron/hole pairs and also creates transport channels for electrons.
Acknowledgements
This work was supported by the NAIMO Integrated Project No NMP4-CT-2004-500355.
References
[1] NESPUREK S., SWORAKOWSKI J., Thin Solid Films, 396 (2001), 168. [2] NESPUREK S., TOMAN P., SWORAKOWSKI J., LIPINSKI J., Curr. Appl. Phys., 2 (2002), 299. [3] NESPUREK S., Czech. J. Phys., 49 (1999), 859. [4] NESPUREK S., PFLEGER J., BRYNDA E., KMINEK I., KADASHCHUK A., VAKHNIN A., SWORAKOWSKI J.,