Page 1
MATHEMATICAL MODELING OF MICROWAVE ASSISTED FLUIDIZED BED DRYING
OF HAZELNUTS
Narjes Malekjani(a), Zahra Emam-Djomeh(b), Seyed Hassan Hashemabadi(c), Gholam Reza Askari(d)
(a), (b), (d) Department of Food Science, Technology and Engineering, University College of Agriculture and Natural
Resources, University of Tehran, Iran. (c) School of Chemical Engineering, Iran University of Science and Technology, Tehran, Iran.
(a) [email protected] , (b) [email protected] , (c) [email protected] , (d)[email protected]
ABSTRACT
Microwave assisted fluidized bed drying is a novel
drying technique which reduces drying time and yields
higher quality products. In this study the effect of this
method on drying kinetics of hazelnuts was studied.
Drying experiments were conducted in three
temperatures (40,50 and 60) and microwave power levels
(0, 450 and 900W). The results showed that the effect of
microwave power was more dominant than drying air
temperature. Mathematical modeling was performed in
order to predict the moisture changes during drying
process. It was concluded that two term thin layer drying
model was the best model to predict the drying kinetics
of hazelnut with coefficient of determination and mean
square of deviation as 0.999 and 0.02096 respectively.
Keywords: hazelnut, modeling, thin layer models,
microwave, fluidized bed dryer
1. INTRODUCTION
Hazelnuts (Corylus avellana L.) are very important raw
materials to the confectionary and chocolate industries
(Kibar and Öztürk, 2009). High quality hazelnut varieties
are cultivated in Northern parts of Iran. Iran is the 6th
producer of hazelnut in the world (Hosseinpour et al.,
2013). Hazelnuts are enriched of essential minerals,
sterols, tannins, free phenolic acids, sugars, organic acids
and phenolic compounds which make its unique sensory
properties. High polyphenol content, makes hazelnuts an
excellent source of natural antioxidants also high content
of unsaturated fatty acids, α-tocopherol and carotenoids
in hazelnuts have important health benefits (Ciarmiello
et al., 2013).
Post-harvest storage of hazelnuts with high moisture
content results in considerable qualitative and
quantitative losses and drying process is required to
inhibit the growth of various mycotoxins and to preserve
the product (Demirtas et al., 1998). On the other hand,
due to climate changes in the season of hazelnut harvest,
the hazelnuts cannot be naturally dried on the tree and the
nuts would be harvested with a moisture content about
25 % accordingly it should be processed to lower its
moisture content to a safe level for storage. The best
moisture content to prevent the microbial growth is 7 to
8 % for unshelled hazelnuts and 4 to 5 % for shelled
hazelnuts (Lopez et al., 1997). Using Conventional
drying methods may have negative biochemical,
chemical and organoleptic effects which decline
products quality and reduce consumer acceptance
(Askari et al., 2013; Demirhan and Özbek, 2015; Nadian
et al., 2015).
Dipolar interaction of water molecules inside the food
material causes heat generation in microwave ovens. The
polar water molecules align themselves with changing
electric field and the friction between oscillating
molecules results in heat. This accelerated volumetric
heat generation causes the pressure build up and results
in rapid evaporation of water (Kumar et al., 2014).
Microwave drying has various benefits such as less
startup time, operation speed, energy consumption
efficiency, space savings, precise process control,
selective heating and for some products, superior quality
of dried products (Wu and Mao, 2008). Aside from this
beneficial features, microwave drying also can
deteriorate product's quality if it is not used properly. The
combination of microwave power with hot air convective
drying has recently been proposed to overcome some
limitations of single microwave processing such as
possible damage to textural, color and nutritional
properties, uneven heat distribution and limited
penetration of the microwave radiation inside the product
(Reyes et al., 2007; Askari et al., 2008).
Accurate prediction of drying process of food and
agricultural products is critical to decline quality loss
along with the energy consumption, and increasing the
drying capacity. Thin-layer mathematical models are
useful tools in designing and improvement of drying
systems and analysis of mass transfer changes with time
during drying process (Malekjani et al., 2013; Belghith
et al., 2015). Due to complicated phenomenon and
various factors required, in this study the drying kinetics
have been investigated using a mathematical model.
Although many attempts have been made to
mathematically investigate the drying kinetic of foods
during microwave and fluidized bed drying treatments
Proceedings of the International Food Operations and Processing Simulation Workshop 978-88-97999-83-6; Bruzzone, Longo, Piera and Vignali Eds.
19
Page 2
such as tomato (Belghith et al., 2015), paddy (Golpour
et al., 2015), canola (Malekjani et al., 2013), pistachio
(Kouchakzadeh and Shafeei, 2010), macadamia nut
(Silva et al., 2006) and many other food and agricultural
products, efficient models are still needed to predict the
drying behavior in the microwave assisted fluidized bed
drying of nuts especially hazelnut. The objective of this
work is to study the effect of temperature and microwave
power variations in microwave assisted fluidized bed
drying on drying kinetics of hazelnuts and proposing the
best model for prediction of nut moisture content with
drying time.
2. MATERIAL AND METHODS
2.1. Sample Preparation
Freshly harvested hazelnut was used in this study. The
hazelnuts were obtained from a local garden in
Eshkevarat, Guilan, Iran and kept at 4°C refrigerator
until beginning the experiments. Before the experiments
hazelnut samples were unshelled manually, the poor
quality hazelnuts were also removed and classified as
11–13 mm kernels using a digital micrometer.
2.2. Drying Experiments
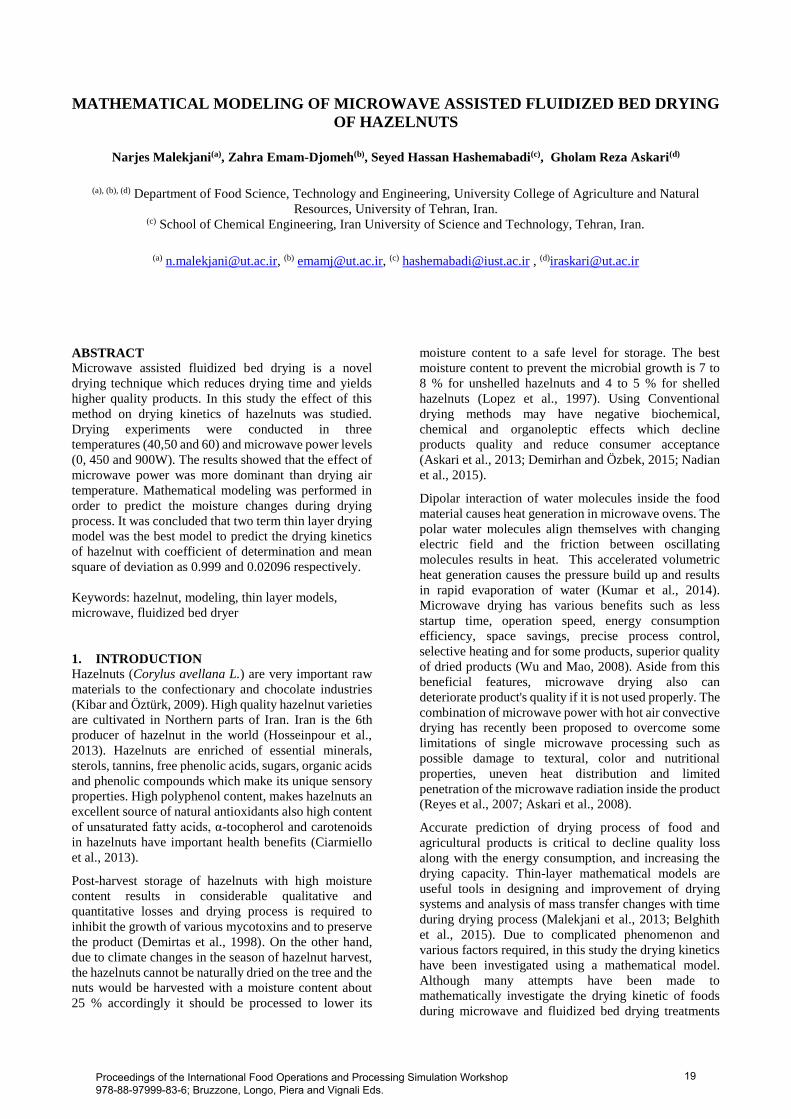
A laboratory scale microwave assisted fluidized bed
dryer was used for drying experiments (Fig. 1.). The
drying air velocity, temperature and microwave power
were accurately controlled in the dryer. The drying
chamber consisted of a Plexiglas cylinder (10 cm
diameter and 35 cm height). For all experiments, air
velocity was maintained constant. For stabilization the
drying parameters in the drying chamber, the dryer was
run without the samples for 30 min before each
experiment. Drying chamber was positioned on a digital
balance with accuracy of 0.01 g (Fig. 1) and the samples
were weighted when the blowing air was switched off,
instead of the less reliable method of removing the
sample from the drying chamber.
The drying experiments were conducted at three hot air
temperature levels (40, 50 and 60 ͦ C) combined with
three microwave power levels (0, 450 and 900 W). The
initial moisture content of the samples was measured
before the experiments and it was 24-25% (d.b). 100 gr
raw unshelled hazelnut was utilized for each run. The
drying experiments were continued until the moisture
content of the samples reached 5-6 % which was
determined by weighting the samples during drying.
Fig 1. Drying apparatus (picture adapted by (Askari et
al., 2013))
2.3. Mathematical Modeling
Moisture ratio estimated from Eq. (1):
𝑀𝑜𝑖𝑠𝑡𝑢𝑟𝑒 𝑟𝑎𝑡𝑖𝑜 (𝑀𝑅) = 𝑀− 𝑀𝑒
𝑀0− 𝑀𝑒 (1)
Where MR, M, 𝑀0, 𝑀𝑒are the moisture ratio, moisture
content at any time, initial moisture content and
equilibrium moisture content respectively.
As the value of equilibrium moisture content Me is much
smaller than M and M0, so, the moisture ratio may be
simplified to M/M0 (Kouchakzadeh and Shafeei, 2010).
Seven popular thin layer drying models were used to
describe the drying behavior of hazelnuts in different
drying conditions in the microwave assisted fluidized
bed dryer as table 1.
Table 1. thin layer drying models
Model name Model
Newton 𝑀𝑅 = exp (−𝑘𝑡)
Page 𝑀𝑅 = exp (−𝑘𝑡𝑛)
Henderson
Pabis 𝑀𝑅 = 𝑎𝑒𝑥𝑝(−𝑘𝑡)
Logarithmic 𝑀𝑅 = 𝑎𝑒𝑥𝑝(−𝑘𝑡) + 𝑐
two term 𝑀𝑅 = 𝑎𝑒𝑥𝑝(−𝑘0𝑡)
+ 𝑏𝑒𝑥𝑝(−𝑘1𝑡)
two-term
exponential
𝑀𝑅= 𝑎𝑒𝑥𝑝(−𝑘𝑡) + (1− 𝑎)𝑒𝑥𝑝(−𝑘𝑎𝑡)
Midilli et al. 𝑀𝑅 = 𝑎𝑒𝑥𝑝(−𝑘𝑡𝑛) + 𝑏𝑡
Proceedings of the International Food Operations and Processing Simulation Workshop 978-88-97999-83-6; Bruzzone, Longo, Piera and Vignali Eds.
20
Page 3
The models were evaluated and compared with
experimental data using the coefficient of determination
(R2); root mean square error (RMSE) and reduced chi-
square (χ2) based on the following relationships:
𝑅2 = 1 −∑ (𝑀𝑅𝑝𝑟𝑒.𝑖 − 𝑀𝑅𝑒𝑥𝑝.𝑖)
2𝑁𝑖=1
∑ (𝑀𝑅̅̅ ̅̅̅𝑝𝑟𝑒.𝑖 − 𝑀𝑅𝑒𝑥𝑝.𝑖)
2𝑁𝑖=1
𝜒2 =∑ (𝑀𝑅𝑒𝑥𝑝.𝑖 − 𝑀𝑅𝑝𝑟𝑒.𝑖)
2𝑁𝑖=1
𝑁 − 𝑛
𝑅𝑀𝑆𝐸 = ( ∑ (𝑀𝑅𝑝𝑟𝑒.𝑖 − 𝑀𝑅𝑒𝑥𝑝.𝑖)
2𝑁𝑖=1
𝑁 )
12
where MRexp,i is the experimental moisture ratio, MRpre,i
is predicted moisture ratio, N is number of observation,
and n is number of constants. Non-linear regression
analyses were down by using statistical computer
program. The model with the highest R2 value and lowest
𝜒2 and RMSE was chosen as the best model.
3. RESULTS AND DISCUSSION
The microwave assisted fluidized bed drying
experiments were conducted with variations of
microwave power and hot-air temperature. The initial
moisture content decreased until reaching the 5-6%
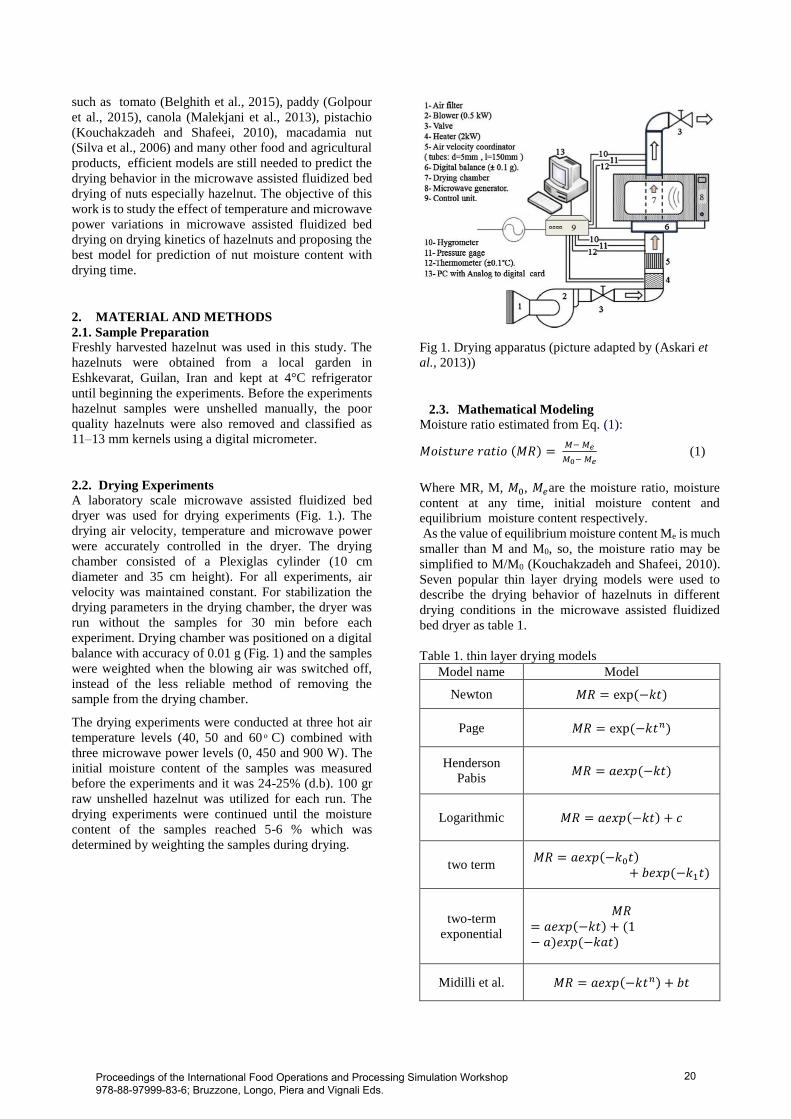
moisture content. Figure 2 shows the effect of drying air
temperature on drying kinetics. As it is shown in Fig 2a,
in the treatments without microwave power, the drying
time decrease with increasing the temperature. Elevating
the temperature from 40 to 50 C decreased the total
drying time about 40% and further increasing of the
temperature to 60 C decreased it about 62%. As it is
illustrated in figure 2 b and 2c, there are not significant
differences between drying curves at different
temperatures. This findings were expected because of
high internal heat generated in treatments with
microwave power which diminished the effects of higher
temperatures (Silva et al., 2006).
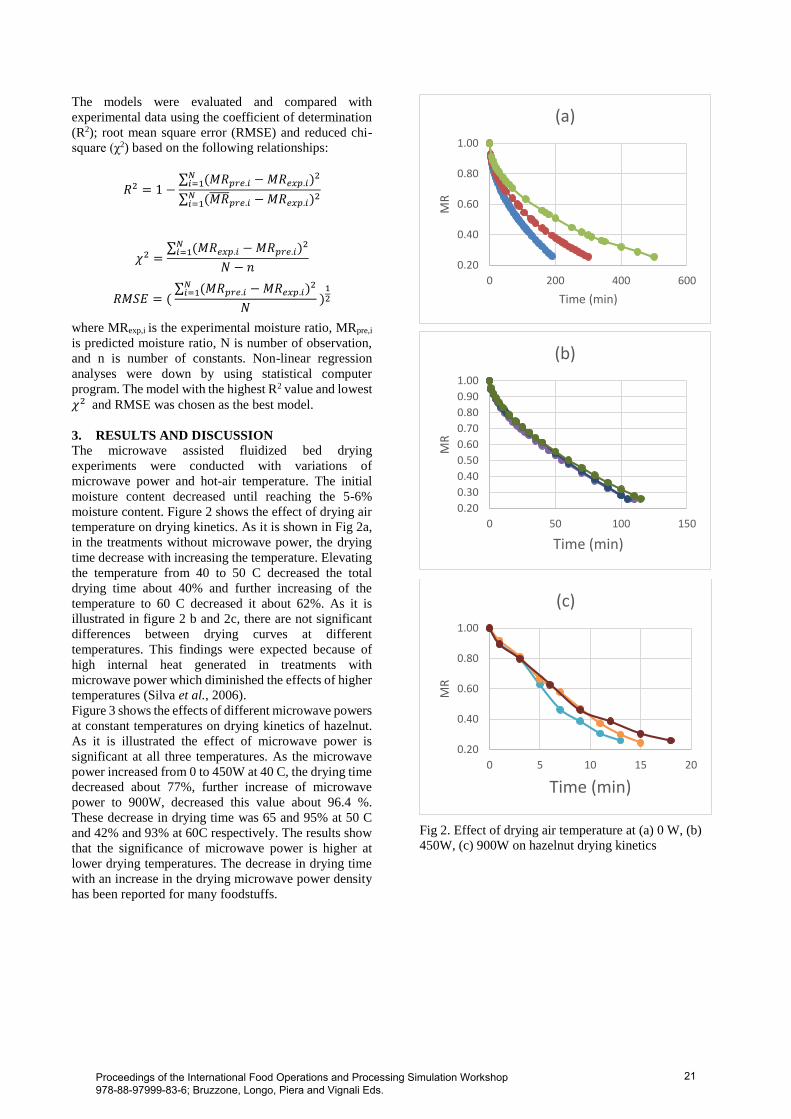
Figure 3 shows the effects of different microwave powers
at constant temperatures on drying kinetics of hazelnut.
As it is illustrated the effect of microwave power is
significant at all three temperatures. As the microwave
power increased from 0 to 450W at 40 C, the drying time
decreased about 77%, further increase of microwave
power to 900W, decreased this value about 96.4 %.
These decrease in drying time was 65 and 95% at 50 C
and 42% and 93% at 60C respectively. The results show
that the significance of microwave power is higher at
lower drying temperatures. The decrease in drying time
with an increase in the drying microwave power density
has been reported for many foodstuffs.
Fig 2. Effect of drying air temperature at (a) 0 W, (b)
450W, (c) 900W on hazelnut drying kinetics
0.20
0.40
0.60
0.80
1.00
0 200 400 600
MR
Time (min)
(a)
0.20
0.30
0.40
0.50
0.60
0.70
0.80
0.90
1.00
0 50 100 150
MR
Time (min)
(b)
0.20
0.40
0.60
0.80
1.00
0 5 10 15 20
MR
Time (min)
(c)
Proceedings of the International Food Operations and Processing Simulation Workshop 978-88-97999-83-6; Bruzzone, Longo, Piera and Vignali Eds.
21
Page 4
Fig 3. Effect of microwave power at (a) 40 C, (b) 50 C,
(c) 60 C on hazelnut drying kinetics
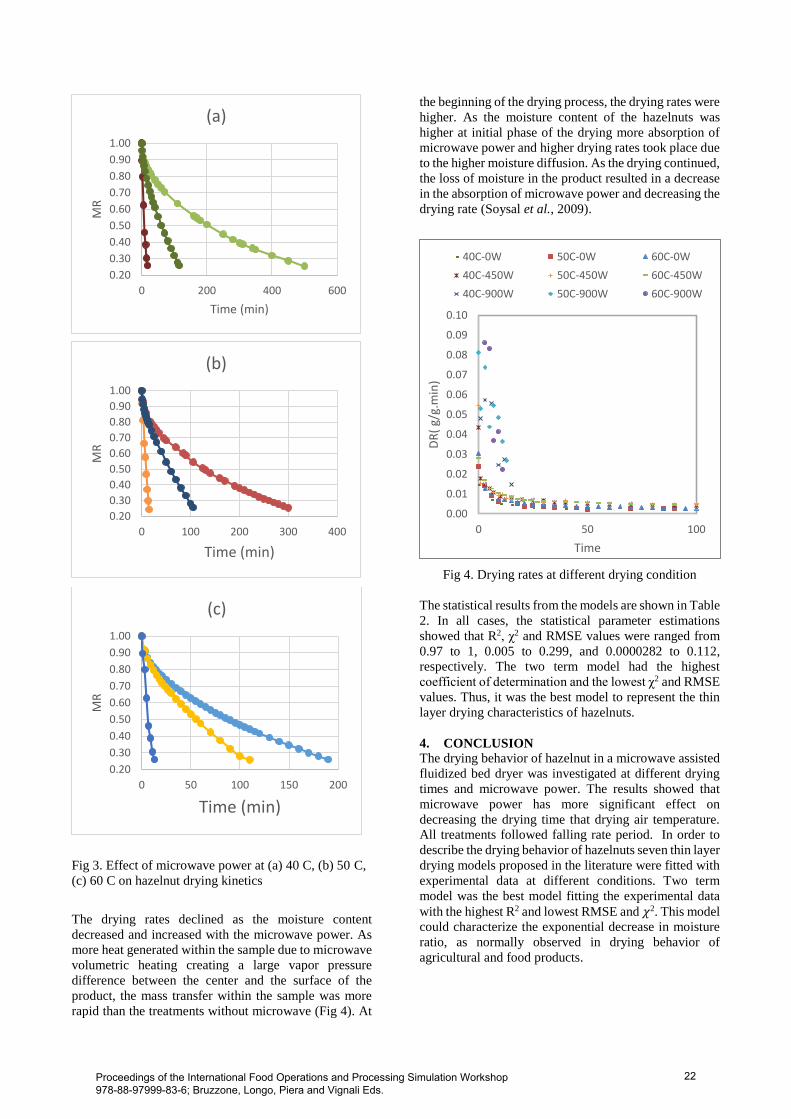
The drying rates declined as the moisture content
decreased and increased with the microwave power. As
more heat generated within the sample due to microwave
volumetric heating creating a large vapor pressure
difference between the center and the surface of the
product, the mass transfer within the sample was more
rapid than the treatments without microwave (Fig 4). At
the beginning of the drying process, the drying rates were
higher. As the moisture content of the hazelnuts was
higher at initial phase of the drying more absorption of
microwave power and higher drying rates took place due
to the higher moisture diffusion. As the drying continued,
the loss of moisture in the product resulted in a decrease
in the absorption of microwave power and decreasing the
drying rate (Soysal et al., 2009).
Fig 4. Drying rates at different drying condition
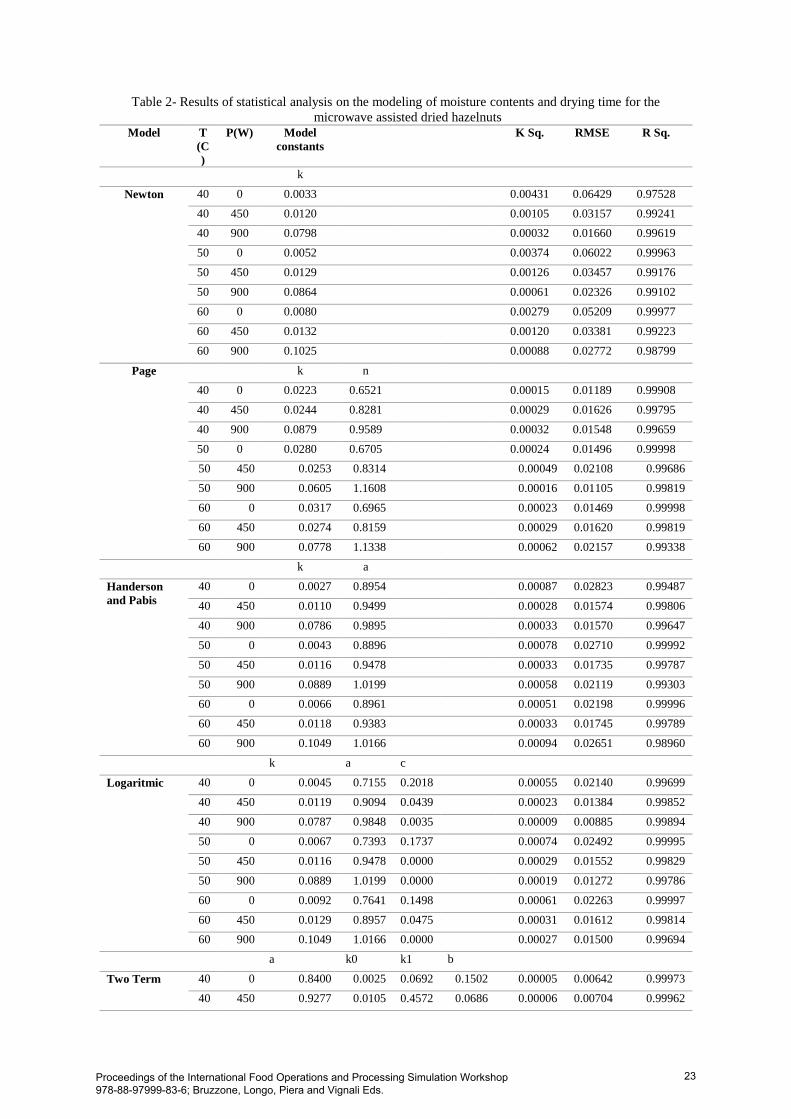
The statistical results from the models are shown in Table
2. In all cases, the statistical parameter estimations
showed that R2, χ2 and RMSE values were ranged from
0.97 to 1, 0.005 to 0.299, and 0.0000282 to 0.112,
respectively. The two term model had the highest
coefficient of determination and the lowest χ2 and RMSE
values. Thus, it was the best model to represent the thin
layer drying characteristics of hazelnuts.
4. CONCLUSION
The drying behavior of hazelnut in a microwave assisted
fluidized bed dryer was investigated at different drying
times and microwave power. The results showed that
microwave power has more significant effect on
decreasing the drying time that drying air temperature.
All treatments followed falling rate period. In order to
describe the drying behavior of hazelnuts seven thin layer
drying models proposed in the literature were fitted with
experimental data at different conditions. Two term
model was the best model fitting the experimental data
with the highest R2 and lowest RMSE and 𝜒2. This model
could characterize the exponential decrease in moisture
ratio, as normally observed in drying behavior of
agricultural and food products.
0.20
0.30
0.40
0.50
0.60
0.70
0.80
0.90
1.00
0 200 400 600
MR
Time (min)
(a)
0.20
0.30
0.40
0.50
0.60
0.70
0.80
0.90
1.00
0 100 200 300 400
MR
Time (min)
(b)
0.20
0.30
0.40
0.50
0.60
0.70
0.80
0.90
1.00
0 50 100 150 200
MR
Time (min)
(c)
0.00
0.01
0.02
0.03
0.04
0.05
0.06
0.07
0.08
0.09
0.10
0 50 100
DR
( g/
g.m
in)
Time
40C-0W 50C-0W 60C-0W
40C-450W 50C-450W 60C-450W
40C-900W 50C-900W 60C-900W
Proceedings of the International Food Operations and Processing Simulation Workshop 978-88-97999-83-6; Bruzzone, Longo, Piera and Vignali Eds.
22
Page 5
Table 2- Results of statistical analysis on the modeling of moisture contents and drying time for the
microwave assisted dried hazelnuts
Model T
(C
)
P(W) Model
constants
K Sq. RMSE R Sq.
k
Newton
40 0 0.0033 0.00431 0.06429 0.97528
40 450 0.0120 0.00105 0.03157 0.99241
40 900 0.0798 0.00032 0.01660 0.99619
50 0 0.0052 0.00374 0.06022 0.99963
50 450 0.0129 0.00126 0.03457 0.99176
50 900 0.0864 0.00061 0.02326 0.99102
60 0 0.0080 0.00279 0.05209 0.99977
60 450 0.0132 0.00120 0.03381 0.99223
60 900 0.1025 0.00088 0.02772 0.98799
Page
k n
40 0 0.0223 0.6521 0.00015 0.01189 0.99908
40 450 0.0244 0.8281 0.00029 0.01626 0.99795
40 900 0.0879 0.9589 0.00032 0.01548 0.99659
50 0 0.0280 0.6705 0.00024 0.01496 0.99998
50 450 0.0253 0.8314 0.00049 0.02108 0.99686
50 900 0.0605 1.1608 0.00016 0.01105 0.99819
60 0 0.0317 0.6965 0.00023 0.01469 0.99998
60 450 0.0274 0.8159 0.00029 0.01620 0.99819
60 900 0.0778 1.1338 0.00062 0.02157 0.99338
k a
Handerson
and Pabis
40 0 0.0027 0.8954 0.00087 0.02823 0.99487
40 450 0.0110 0.9499 0.00028 0.01574 0.99806
40 900 0.0786 0.9895 0.00033 0.01570 0.99647
50 0 0.0043 0.8896 0.00078 0.02710 0.99992
50 450 0.0116 0.9478 0.00033 0.01735 0.99787
50 900 0.0889 1.0199 0.00058 0.02119 0.99303
60 0 0.0066 0.8961 0.00051 0.02198 0.99996
60 450 0.0118 0.9383 0.00033 0.01745 0.99789
60 900 0.1049 1.0166 0.00094 0.02651 0.98960
k a c
Logaritmic
40 0 0.0045 0.7155 0.2018 0.00055 0.02140 0.99699
40 450 0.0119 0.9094 0.0439 0.00023 0.01384 0.99852
40 900 0.0787 0.9848 0.0035 0.00009 0.00885 0.99894
50 0 0.0067 0.7393 0.1737 0.00074 0.02492 0.99995
50 450 0.0116 0.9478 0.0000 0.00029 0.01552 0.99829
50 900 0.0889 1.0199 0.0000 0.00019 0.01272 0.99786
60 0 0.0092 0.7641 0.1498 0.00061 0.02263 0.99997
60 450 0.0129 0.8957 0.0475 0.00031 0.01612 0.99814
60 900 0.1049 1.0166 0.0000 0.00027 0.01500 0.99694
a k0 k1 b
Two Term
40 0 0.8400 0.0025 0.0692 0.1502 0.00005 0.00642 0.99973
40 450 0.9277 0.0105 0.4572 0.0686 0.00006 0.00704 0.99962
Proceedings of the International Food Operations and Processing Simulation Workshop 978-88-97999-83-6; Bruzzone, Longo, Piera and Vignali Eds.
23
Page 6
40 900 0.9398 0.0874 0.0000 0.0548 0.00011 0.00937 0.99887
50 0 0.8412 0.0040 0.1338 0.1542 0.00003 0.00475 1.00000
50 450 0.9340 0.0113 0.9568 0.0652 0.00015 0.01100 0.99915
50 900 0.6553 0.0889 0.0888 0.3646 0.00025 0.01422 0.99739
60 0 0.8585 0.0061 0.1955 0.1370 0.00003 0.00501 1.00000
60 450 0.9135 0.0112 0.3564 0.0872 0.00008 0.00776 0.99960
60 900 0.5004 0.1049 0.1049 0.5161 0.00035 0.01677 0.99638
k a
Two Term
Exponential
40 0 0.0239 0.1169 0.00174 0.03998 0.99002
40 450 0.1424 0.0745 0.00021 0.01390 0.99851
40 900 0.1132 0.4962 0.00031 0.01532 0.99667
50 0 0.0352 0.1246 0.00138 0.03603 0.99986
50 450 0.1727 0.0663 0.00036 0.01789 0.99776
50 900 0.1209 1.6976 0.00012 0.00975 0.99858
60 0 0.0568 0.1171 0.00088 0.02874 0.99993
60 450 0.1341 0.0847 0.00021 0.01397 0.99866
60 900 0.1404 1.6702 0.00060 0.02124 0.99359
a k n b
Midilli et al.
40 0 0.9737 0.0159 0.7075 0.0000 0.00016 0.01120 0.99924
40 450 0.9697 0.0170 0.9034 0.0000 0.00021 0.01287 0.99871
40 900 1.0139 0.1133 0.8587 0.0000 0.00021 0.01295 0.99783
50 0 0.6442 0.1015 0.1042 0.0000 0.08314 0.25790 0.99553
50 450 0.9593 0.0150 0.9427 0.0000 0.00035 0.01666 0.99803
50 900 1.0000 0.0687 1.1012 0.0000 0.00010 0.00895 0.99897
60 0 0.5137 0.1040 0.1048 0.0000 0.11167 0.29890 0.99229
60 450 0.9691 0.0200 0.8818 0.0000 0.00028 0.01486 0.99852
60 900 0.9947 0.0784 1.1271 0.0000 0.00023 0.01362 0.99761
REFERENCES
Askari, G., Emam-Djomeh, Z., and Mousavi, S. 2008.
Investigation of the effects of microwave
treatment on the optical properties of apple
slices during drying. Drying Technology 26,
1362-1368.
Askari, G., Emam-Djomeh, Z., and Mousavi, S. 2013.
Heat and mass transfer in apple cubes in a
microwave-assisted fluidized bed drier. Food
and Bioproducts Processing 91, 207-215.
Belghith, A., Azzouz, S., and Elcafsi, A. 2015.
Desorption isotherms and mathematical
modeling of thin layer drying kinetics of
tomato. Heat and Mass Transfer, 1-13.
Ciarmiello, L.F., Piccirillo, P., Gerardi, C., Piro, F., De
Luca, A., D'imperio, F., Rosito, V., Poltronieri,
P., and Santino, A. 2013. Microwave irradiation
for dry-roasting of hazelnuts and evaluation of
microwave treatment on hazelnuts peeling and
fatty acid oxidation. Journal of Food Research
2, 22.
Demirhan, E., and Özbek, B. 2015. Color Change
Kinetics of Tea Leaves During Microwave
Drying. International Journal of Food
Engineering 11, 255-263.
Demirtas, C., Ayhan, T., and Kaygusuz, K. 1998. Drying
behaviour of hazelnuts. Journal of the Science
of Food and Agriculture 76, 559-564.
Golpour, I., Amiri Chayjan, R., Amiri Parian, J., and
Khazaei, J. 2015. Prediction of Paddy Moisture
Content during Thin Layer Drying Using
Machine Vision and Artificial Neural
Networks. Journal of Agricultural Science and
Technology 17, 287-298.
Hosseinpour, A., Seifi, E., Javadi, D., Ramezanpour,
S.S., and Molnar, T.J. 2013. Nut and kernel
characteristics of twelve hazelnut cultivars
grown in Iran. Scientia Horticulturae 150, 410-
413.
Kibar, H., and Özturk, T. 2009. The effect of moisture
content on the physico-mechanical properties of
some hazelnut varieties. Journal of Stored
Products Research 45, 14-18.
Kouchakzadeh, A., and Shafeei, S. 2010 .Modeling of
microwave-convective drying of pistachios.
Energy conversion and management 51, 2012-
2015.
Proceedings of the International Food Operations and Processing Simulation Workshop 978-88-97999-83-6; Bruzzone, Longo, Piera and Vignali Eds.
24
Page 7
Kumar, D., Prasad, S., and Murthy, G.S. 2014.
Optimization of microwave-assisted hot air
drying conditions of okra using response
surface methodology .Journal of food science
and technology 51, 221-232.
Lopez, A., Pique, M., Boatella, J., Parcerisa, J., Romero,
A., Ferrá, A., and Garcí, J. 1997. Influence of
drying conditions on the hazelnut quality. I.
Lipid oxidation. Drying technology 15, 965-
977.
Malekjani, N., Jafari, S.M., Rahmati, M.H., Zadeh, E.E.,
and Mirzaee, H. 2013. Evaluation of thin-layer
drying models and artificial neural networks for
describing drying kinetics of canola seed in a
heat pump assisted fluidized bed dryer.
International Journal of Food Engineering 9,
375-384.
Nadian, M.H., Rafiee, S., Aghbashlo, M., Hosseinpour,
S., and Mohtasebi, S.S. 2015. Continuous real-
time monitoring and neural network modeling
of apple slices color changes during hot air
drying. Food and Bioproducts Processing 94,
263-274.
Reyes, A., Ceron, S., Zuniga, R., and Moyano, P. 2007.
A comparative study of microwave-assisted air
drying of potato slices. Biosystems Engineering
98, 310-318.
Silva, F., Marsaioli, A., Maximo, G., Silva, M., and
Goncalves, L. 2006. Microwave assisted drying
of macadamia nuts. Journal of Food
Engineering 77, 550-558.
Soysal, Y., Ayhan, Z., Eşturk, O., and Arıkan, M. 2009.
Intermittent microwave–convective drying of
red pepper: Drying kinetics, physical (colour
and texture) and sensory quality. Biosystems
Engineering 103, 455-463.
Wu, T., and Mao, L. 2008. Influences of hot air drying
and microwave drying on nutritional and
odorous properties of grass carp
(Ctenopharyngodon idellus) fillets. Food
Chemistry 110, 647-653.
Proceedings of the International Food Operations and Processing Simulation Workshop 978-88-97999-83-6; Bruzzone, Longo, Piera and Vignali Eds.
25