Page 1
14th Annual Meeting – European Refining Technology Conference 11th November 2009 – Session A
www.quadrisefuels.com Page 1 of 19
Maximising distillate yields and refinery economics – An alternative solution to conventional fuel oil production or residue conversion
Jason Miles C.Eng (MIChemE) MBA
Business Development Director Quadrise Fuels International plc E: [email protected]
T: +44 20 7550 4930
Abstract For the past two decades refiners have adjusted, at considerable expense, to an increasingly
demanding legislative regime regarding specifications for transportation fuels. This wave of
unproductive capital expenditure may continue as refiners gear up over the next decade to
handle similar requirements for environmentally driven expenditure associated with fuel oil.
A new low-capital cost means of processing heavy, viscous residues was demonstrated on a
commercial scale at the 200,000BPD Orlen Lietuva Refinery in Mazeikiai during the latter
half of 2008. Production of over 20,000MT of oil-in-water emulsion fuel from visbreaker
residue using MSAR® technology resulted in an alternative liquid fuel available for sale at a
discount to conventional heavy fuel oil (HFO), and competitive with natural gas. The price
advantage enables long-term off-take contracts for emulsion fuel to be obtained from major
energy consumers, whilst generating a price for the refiner’s residue in excess of its intrinsic
value in HFO.
Future applications include lower cost bunker fuel, which could subsidise on-board sulphur
dioxide scrubbing to meet new maritime regulations, whilst avoiding major hydro-processing
expenditure to produce low sulphur HFO.
The paper provides an overview of the technology application and its relative economics, its
fit with refinery operations including upgrading plans, examples of emulsion properties from
a variety of global refinery residues and summary results of the commercial scale Lithuanian
demonstration.
Page 2
14th Annual Meeting – European Refining Technology Conference 11th November 2009 – Session A
www.quadrisefuels.com Page 2 of 19
MSAR® refinery technology development
Commencing 1990 British Petroleum (BP) and Petroleos de Venezuela (PDVSA) successfully
established a 6.5 million tonne per annum market for their proprietary emulsion fuel
Orimulsion® consisting of 70% 8° API Orinoco bitumen and 30% water. Orimulsion® was
exported as a boiler fuel for power generation and by 2006 over 60 million tonnes had been
shipped to customers worldwide. Demand outstripped supply by over 300% (please refer to
Appendix 1 for further details).
In parallel to the Orimulsion® progress, a group of former BP experts were developing an
alternative low-capex emulsion technology MSAR® (Multi-phase Superfine Atomised
Residue) in conjunction with AkzoNobel. This modular technology, based primarily on
refinery residue feedstock was ideally placed to fill the void created by the politically
motivated decision to cease Orimulsion production in 2006.
The MSAR® solution differs from Orimulsion® in that it is scalable to lower throughputs (as
low as 4,000BPD versus 100,000BPD) making on-site refinery emulsion fuel manufacture a
reality utilising viscous low-value residues.
The technology is available to refiners from Quadrise Fuels International (QFI) under sub-
licence from AkzoNobel. Alternatively QFI will procure refinery residue at a price above its
intrinsic fuel oil blending value and process this into MSAR® emulsion fuel on a BOO basis
for sale to energy consumers.
Refinery integration of MSAR®
From a refiner’s perspective, MSAR®
offers a solution to the dilemma
surrounding conventional heavy fuel oil
(HFO) production: HFO is sold at a
discount to crude, generally consuming
valuable diluents and reducing the
refinery profitability (Figure 1).
Figure 1. – The refiner’s dilemma
0%
20%
40%
60%
80%
100%
120%
140%
HFO LPG NAPHTHA GASOLINE DIESEL JET
NWE Prod
uct V
alue
vs Bren
t
Historic (Platts last 36m) Forward (Morgan Stanley 8‐Oct‐09)
Valuable distillates are needed to dilute refinery residue to meet HFO specs
0%
20%
40%
60%
80%
100%
120%
140%
HFO LPG NAPHTHA GASOLINE DIESEL JET
NWE Prod
uct V
alue
vs Bren
t
Historic (Platts last 36m) Forward (Morgan Stanley 8‐Oct‐09)
Valuable distillates are needed to dilute refinery residue to meet HFO specs
Valuable distillates are needed to dilute refinery residue to meet HFO specs
Page 3
14th Annual Meeting – European Refining Technology Conference 11th November 2009 – Session A
www.quadrisefuels.com Page 3 of 19
MSAR® technology blends the refinery residue
directly with water and a surfactant package under
pressure in a colloid mill to produce a stable
emulsion fuel that behaves like heavy fuel oil (Fig 2).
The MSAR® solution can be integrated into existing
refinery and HFO infrastructure (Figure 3). Hot
refinery residue is slip-streamed (or the whole stream is diverted) from the residue run-down
system after maximum process heat has
been recovered, but before high value cutter
stock is added (Figure 4). Residue
viscosities of up to 100,000cSt (standard
unit) and 60,000,000cSt (high-temperature
unit) measured at 100°C can be handled,
without impacting the quality of the
emulsion fuel.
Water for the emulsification process can be
derived from a number of sources including
natural reserves, standard utility water, oil-
contaminated waste water or stripped sour
water streams. The MSAR® systems can
either be supplied as skid-built modules (typically 4,000BPD residue each) or as components
for stick-assembly.
The ‘value add’ of MSAR® over HFO production is that no diluents are needed to produce a
transportable product. Therefore providing the resulting emulsion fuel can be sold at a price
in excess of the net-back1 residue value in HFO (Figure 5 overleaf) plus the MSAR®
production cost, the refinery profitability can be significantly enhanced. To illustrate an
example2, assuming a 200,000BPD refinery displaces 1 million tonnes of HFO sales (~50% of
1 The residue value is a function of the HFO value less the value of distillate products needed to meet viscosity specifications. Higher % distillates in HFO or a greater Gasoil-HFO $ spread, result in a lower residue value and a greater margin available for MSAR® production. 2 Assuming 35%wt cutter in the HFO, with HFO at $400/MT and Cutter at $600/MT respectively. Capex estimate includes MSAR® production system and allowance for tie-ins, assuming shared use of HFO handling facilities.
HotResidue
Cooling HFOStorage
Process Unit
Diluent (Cutter)
HFO run‐downHFO
StorageHFOStorage
HotResidue
Cooling HFOStorage
Process Unit
Diluent (Cutter)
HFO run‐downHFO
StorageHFOStorage
HotResidue
Cooling HFOStorage
Process Unit
Diluent (Cutter)
HFO run‐downHFO
StorageHFOStorage
Figure 3. – Conventional HFO production
HotResidue
Cooling HFOStorage
Process Unit
Diluent (Cutter)
HFO run‐down HFOStorageMSAR®
StorageUndilutedResidue
ProcessWater
Power
Chemicals
20ft iso‐sizedprocess units
HotResidue
Cooling HFOStorage
Process Unit
Diluent (Cutter)
HFO run‐down HFOStorageMSAR®
StorageUndilutedResidue
ProcessWater
Power
Chemicals
20ft iso‐sizedprocess units
Figure 4. – MSAR® system integration
Residue droplet diameter ~0.005mmResidue droplet diameter ~0.005mm
Figure 2. – MSAR® overview
Page 4
14th Annual Meeting – European Refining Technology Conference 11th November 2009 – Session A
www.quadrisefuels.com Page 4 of 19
the total available HFO) with MSAR®, the uplift potential is $50 million per year or
$0.75/BBL crude processed for an estimated capital expenditure of $15 million. This uplift
potential may need to be shared with the consumer to guarantee regular off-take.
Figure 5 – MSAR® uplift potential over HFO
The profit potential increases when
heavier crudes are processed or refining
process conditions are more severe
(Figure 6), due to the higher spread
between the residue value and the energy
equivalent value as a fuel. Further
enhancements to refinery operations can
therefore be considered when producing
MSAR®.
Figure 6 – Residue netback value in HFO
Based on average prices from Jan 2004 to end May 2008 for 0.2%S gasoil (less 5%) as cutter (BI=10) and 3.5%S Fuel Oil (BI=33) when fuel oil price averaged 48% of the cutter
price (less 5%). Sulphur correction based on 1% change in S content = 3% of the HSFO price
‐50%
‐25%
0%
25%
50%
75%
40 45 50 55 60
Viscosity Blending Index
% of Fue
l Oil Price
525+ VacRes565+ VacResHi‐Sev VisResVacFlash VisRes
Type of Residue:
Urals
Crude Source:
Maya
Standard MSAR® System High‐Temp MSAR® System
Based on average prices from Jan 2004 to end May 2008 for 0.2%S gasoil (less 5%) as cutter (BI=10) and 3.5%S Fuel Oil (BI=33) when fuel oil price averaged 48% of the cutter
price (less 5%). Sulphur correction based on 1% change in S content = 3% of the HSFO price
‐50%
‐25%
0%
25%
50%
75%
40 45 50 55 60
Viscosity Blending Index
% of Fue
l Oil Price
525+ VacRes525+ VacRes565+ VacRes565+ VacResHi‐Sev VisResHi‐Sev VisResVacFlash VisResVacFlash VisRes
Type of Residue:
Urals
Crude Source:
Maya
Urals
Crude Source:
Maya
Standard MSAR® System High‐Temp MSAR® System
Potential Refinery MSAR® Margin vs HFO(assuming $45/mt HFO equivalent MSAR® costs)
‐100$/t
0$/t
100$/t
200$/t
300$/t
400$/t
500$/t
100$/t 150$/t 200$/t 250$/t 300$/t 350$/t 400$/t 450$/t 500$/t 550$/t
GasOil‐HFO Spread ($/mt)
MSA
R® m
argin, $/m
t HFO
equ
iv. 25%wt cutter in HFO
35%wt cutter in HFO
50%wt cutter in HFO
2009 2004‐2008Historic NWE spread range @ $400/mt HFO
Page 5
14th Annual Meeting – European Refining Technology Conference 11th November 2009 – Session A
www.quadrisefuels.com Page 5 of 19
Operational enhancements applicable with MSAR®
The MSAR® process is relatively insensitive to increased residue viscosity/density (e.g. from
increased severity operations) or stability issues experienced during conventional fuel oil
blending. Therefore during MSAR® production, conventional enhancements to operations
that were previously uneconomic or operationally problematic during HFO production can be
re-evaluated as follows:
Process Enhancement Overview
Vacuum
distillation
Increasing
vacuum
distillation unit
VGO/residue cut-
points
During HFO production, marginal vacuum gasoil (VGO) is a relatively
economic fuel oil blending component. The economic incentive to cut
deeper and recover marginal VGO drops off significantly as the VGO
quality diminishes. During MSAR® production no viscosity blend-
stock is required and marginal VGO can therefore be diverted to
secondary processing to realise a higher return.
Visbreaking Recovery of
visbreaker light-
ends to the
distillate pool
Where visbreaker distillates are currently routed to HFO production for
viscosity control, these products can potentially be diverted to
secondary distillate processing. The undiluted visbreaker residue can
be sent to MSAR® production.
Increasing
visbreaker
severity
Severity of visbreaker operation is generally limited by the stability
requirement of the blended fuel oil and the extent of fouling and coke
lay-down in the visbreaker heater. The former requirement means that
the stability of the residue must be sufficient to ensure that the finished
fuel resulting from blending with diluents (that are less aromatic than
the residue) is stable and that asphaltene flocculation does not occur.
Where the residue is made into MSAR®, blend stability is not an issue
and severity may be increased, subject to acceptable levels of heater
fouling and coke deposition. In the absence of any other constraint, a
limit on residue stability is recommended (equivalent to a p-value of
1.05 using the Shell methodology). Some operational modifications,
such as increasing steam injection or re-cycling heavy distillates from
the visbreaker fractionator, may help mitigate coking tendency and
enhance yield while some relatively low-cost options to increase heater
capacity might be implemented in certain instances.
Page 6
14th Annual Meeting – European Refining Technology Conference 11th November 2009 – Session A
www.quadrisefuels.com Page 6 of 19
Process Enhancement Overview
Visbreaking
(Cont’d)
Vacuum-recovery
of visbreaker
VGO
A vacuum flasher is a relatively low capital cost addition to a refinery
with a visbreaker. This recovers a major part of the visbroken vacuum
gasoil (VVGO) to be used as additional cracker feed. Just as the
economics of deep-cut VDU (in the absence of a visbreaker) are
enhanced by routing the residue to MSAR® manufacture, so are the
economics of vacuum flashing visbreaker residue. Although marginal
VVGO is of poorer quality than marginal VGO, during MSAR®
manufacture it becomes economic to dig deeper, as the distillates and
VVGO has a higher intrinsic value than HFO.
Solvent de-
asphalting
Production of
MSAR® rather
than HFO using
SDA residue
The precipitated asphalt product from SDA is generally a difficult
stream to blend to HFO because of its extremely high viscosity.
Processing to MSAR® (using a high temperature unit), either using
100% SDA residue or a partial blend (to provide 10-20% volatile
components to enhance combustion) yields an extremely competitive
and readily transportable fuel.
MSAR® technology leverages
equipment perfected over 20 years
for road emulsion applications.
MSAR® systems can be installed
within 6-12 months, when utilising
existing fuel oil supply
infrastructure. Over 100 emulsion
production units have been supplied
worldwide by AkzoNobel to date.
The refiner is thus provided with a modular, low-capex, short lead-time uplift pathway. The
MSAR® option is especially relevant in today’s climate of high project costs and extended
delivery schedules which increase risk and negatively impact conventional upgrading process
economics. The potential capital payback period is low enough for MSAR® also to be
considered as an interim value adding residue disposal solution pending the planning,
approval, financing and implementation of major upgrading schemes that may have been
suspended in the current economic climate.
Figure 7 – The MSAR® manufacturing module
Page 7
14th Annual Meeting – European Refining Technology Conference 11th November 2009 – Session A
www.quadrisefuels.com Page 7 of 19
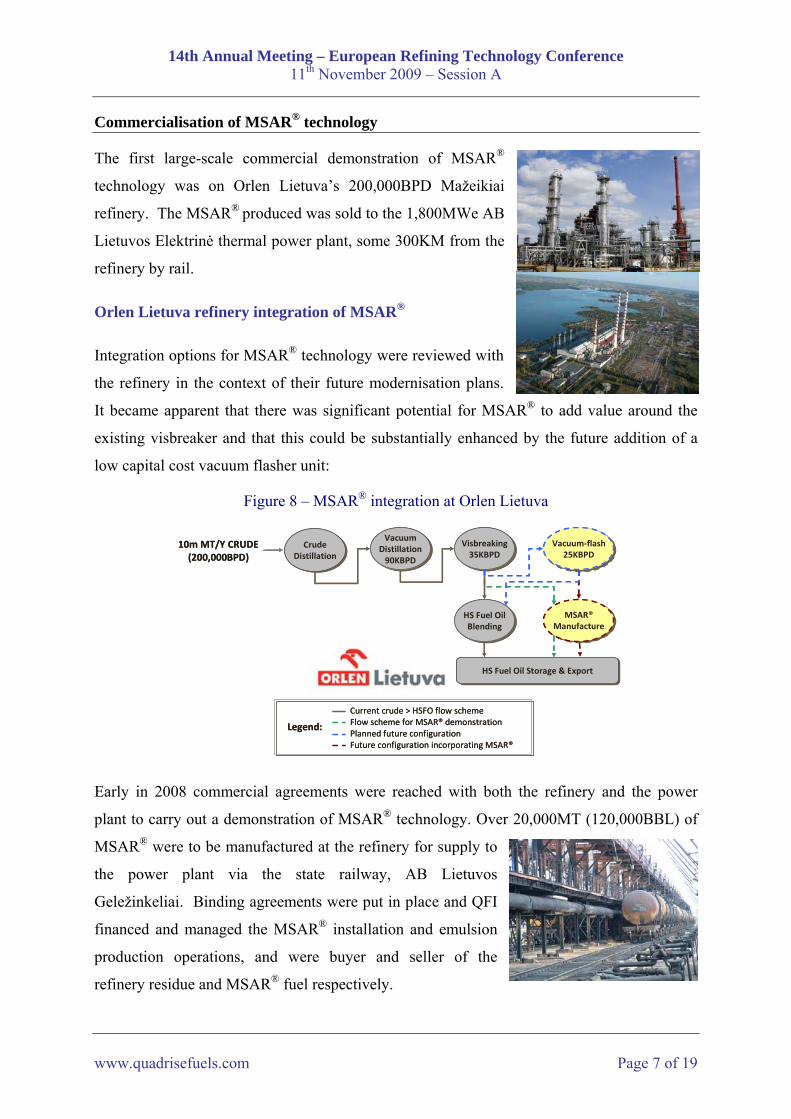
Commercialisation of MSAR® technology
The first large-scale commercial demonstration of MSAR®
technology was on Orlen Lietuva’s 200,000BPD Mažeikiai
refinery. The MSAR® produced was sold to the 1,800MWe AB
Lietuvos Elektrinė thermal power plant, some 300KM from the
refinery by rail.
Orlen Lietuva refinery integration of MSAR®
Integration options for MSAR® technology were reviewed with
the refinery in the context of their future modernisation plans.
It became apparent that there was significant potential for MSAR® to add value around the
existing visbreaker and that this could be substantially enhanced by the future addition of a
low capital cost vacuum flasher unit:
Figure 8 – MSAR® integration at Orlen Lietuva
CrudeDistillationCrude
Distillation
MSAR®ManufactureMSAR®
Manufacture
10m MT/Y CRUDE(200,000BPD)
VacuumDistillation90KBPD
VacuumDistillation90KBPD
Visbreaking35KBPD
Visbreaking35KBPD
HS Fuel OilBlending
HS Fuel OilBlending
Vacuum‐flash25KBPD
Vacuum‐flash25KBPD
HS Fuel Oil Storage & ExportHS Fuel Oil Storage & Export
Legend:
Current crude > HSFO flow schemeFlow scheme for MSAR® demonstrationPlanned future configurationFuture configuration incorporating MSAR®
Early in 2008 commercial agreements were reached with both the refinery and the power
plant to carry out a demonstration of MSAR® technology. Over 20,000MT (120,000BBL) of
MSAR® were to be manufactured at the refinery for supply to
the power plant via the state railway, AB Lietuvos
Geležinkeliai. Binding agreements were put in place and QFI
financed and managed the MSAR® installation and emulsion
production operations, and were buyer and seller of the
refinery residue and MSAR® fuel respectively.
Page 8
14th Annual Meeting – European Refining Technology Conference 11th November 2009 – Session A
www.quadrisefuels.com Page 8 of 19
A temporary MSAR® production facility was installed within the refinery compound, using
an existing non-hazardous plot area of less than 250m². Utilities for the manufacture of
MSAR® were supplied from the refinery systems.
MSAR® product was pumped to an existing HFO tank and stored before being exported by
rail. MSAR® export utilised the existing refinery HFO rail loading system, batching MSAR®
along with conventional HFO dispatch. In total 8 block trains (50 x 60MT wagons) were
loaded and over 20,000MT of MSAR® exported from the refinery to the power plant.
MSAR® product was formulated to replicate Orimulsion® where possible and to maintain
detailed fuel quality specifications during recommended storage and handling for 3 months.
Figure 9 – Comparable specifications of Orimulsion® and MSAR® in Lithuania (Saybolt)
During the demonstration the viscosity of the supplied visbreaker residue varied by up to
500cSt (at 100°C), with the refinery processing predominantly
Urals-derived crude or 50/50 blends of Urals with heavy North
Sea crudes. It was observed that variations in MSAR®
production viscosity due to operational variations upstream could
be readily compensated for by minor adjustments in the MSAR®
manufacturing system parameters.
Besides these adjustments for viscosity control, all other parameters (in terms of MSAR®
droplet size characteristics, determined stability, etc) remained within expectations and
specification, demonstrating the stability and reliability of the process and resulting fuel. The
quality of MSAR® in storage was closely monitored (Figure 10 overleaf). Through
Characteristics: Orimulsion® MSAR® Analytical Method or Equipment(400 Spec.) (Urals VBR)
Water Content, % w/w 30 30 ASTM D-4006Mean droplet Size, Microns 20 9 Malvern Particle Sizer Droplets > 150 Microns, % w/w 0.5 1.0 Sieve Test Apparent Viscosity @ 20s?¹ , cP 200 @ 30°C 200 @ 50°C Coaxial Cylinder ViscometerGross Calorific Value, MJ/Kg 30 30 ASTM D-240 Net Calorific Value, MJ/Kg 28 28 ASTM D-240, CalculatedSulphur, % w/w 2.8 1.9 ASTM D-1552Sodium, ppm 10 30 Atomic Absorption Vanadium, ppm 320 180 Atomic Absorption Nickel, ppm 70 50 Atomic Absorption Magnesium, ppm 5 111 Atomic Absorption Ash, % w/w 0.10 0.12 ASTM D-482
Typical (Average) Specifications for Orimulsion® and MSAR®
Page 9
14th Annual Meeting – European Refining Technology Conference 11th November 2009 – Session A
www.quadrisefuels.com Page 9 of 19
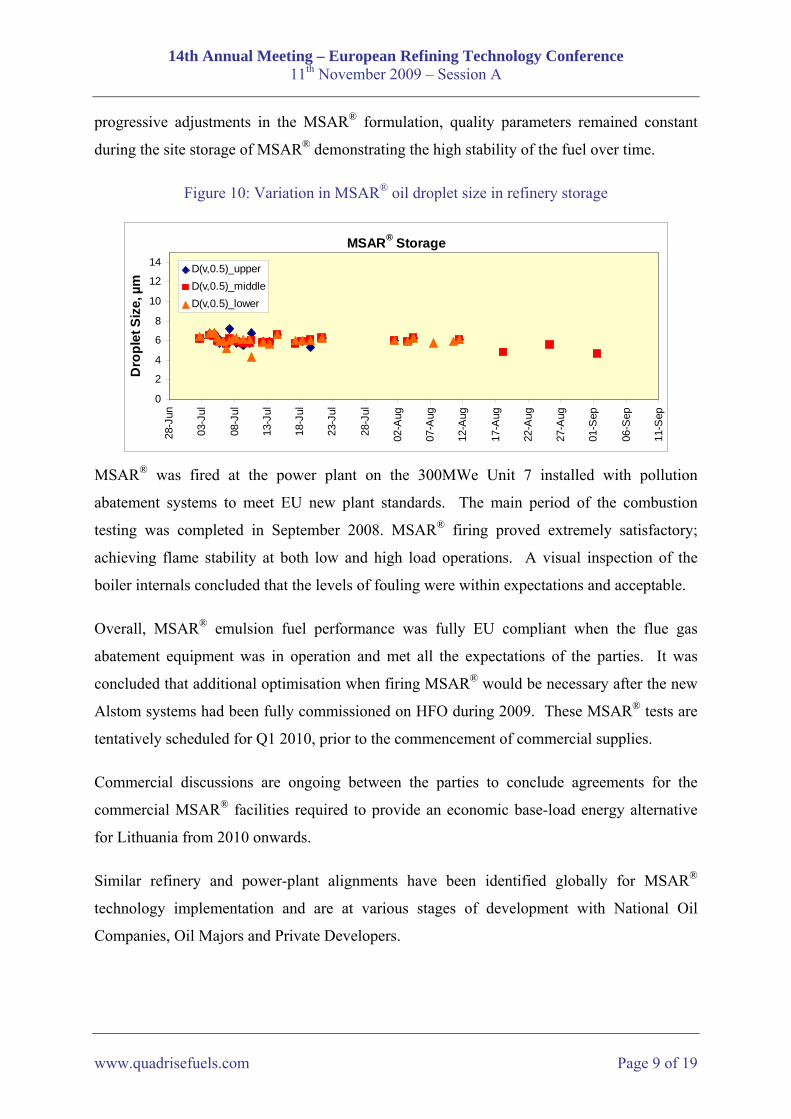
progressive adjustments in the MSAR® formulation, quality parameters remained constant
during the site storage of MSAR® demonstrating the high stability of the fuel over time.
Figure 10: Variation in MSAR® oil droplet size in refinery storage
MSAR® Storage
0
2
4
6
8
10
12
14
28-J
un
03-J
ul
08-J
ul
13-J
ul
18-J
ul
23-J
ul
28-J
ul
02-A
ug
07-A
ug
12-A
ug
17-A
ug
22-A
ug
27-A
ug
01-S
ep
06-S
ep
11-S
ep
Dro
plet
Siz
e, µ
m
D(v,0.5)_upperD(v,0.5)_middleD(v,0.5)_lower
MSAR® was fired at the power plant on the 300MWe Unit 7 installed with pollution
abatement systems to meet EU new plant standards. The main period of the combustion
testing was completed in September 2008. MSAR® firing proved extremely satisfactory;
achieving flame stability at both low and high load operations. A visual inspection of the
boiler internals concluded that the levels of fouling were within expectations and acceptable.
Overall, MSAR® emulsion fuel performance was fully EU compliant when the flue gas
abatement equipment was in operation and met all the expectations of the parties. It was
concluded that additional optimisation when firing MSAR® would be necessary after the new
Alstom systems had been fully commissioned on HFO during 2009. These MSAR® tests are
tentatively scheduled for Q1 2010, prior to the commencement of commercial supplies.
Commercial discussions are ongoing between the parties to conclude agreements for the
commercial MSAR® facilities required to provide an economic base-load energy alternative
for Lithuania from 2010 onwards.
Similar refinery and power-plant alignments have been identified globally for MSAR®
technology implementation and are at various stages of development with National Oil
Companies, Oil Majors and Private Developers.
Page 10
14th Annual Meeting – European Refining Technology Conference 11th November 2009 – Session A
www.quadrisefuels.com Page 10 of 19
MSAR® and future HFO market issues
The existing marine sink for high sulphur HFO is set to disappear in terms of new sulphur
specifications issued by the IMO. Refiners face the difficult choice of revamping their
facilities to meet HFO specifications, opting out of the HFO market altogether by installation
of residue destruction facilities, or relying on consumers to solve the sulphur issue.
MSAR® for some may be an innovative value adding solution which can be implemented at a
relatively low cost. To appreciate the MSAR® potential it is necessary to have an
understanding of the bulk fuel oil markets and where and how MSAR® might be a viable
substitute. Emulsion fuel cannot (as yet) be treated as a tradable commodity and therefore
potential energy consumers need to be aligned with the candidate producer, in much the same
way as the initiation of the LNG and Orimulsion® supply chains.
For an MSAR® project to be viable, the following mutual interests need to be served:
For the refinery:
- sustainable profitability (net of new costs) over current HFO production and sales
- potentially an anchor customer for emulsion off-take to justify the initial investment
For the consumer:
- sustainable fuel savings over other primary energy sources (net of new costs)
- secure and reliable supplies
- negligible impact to current plant performance (e.g. maximum load, efficiency)
- reliable operations on emulsion fuel (boiler and flue gas clean-up equipment)
- environmental compliance to stringent standards with respect to emissions
MSAR® boiler fuel substitution
Applicable markets for potential HFO/crude substitution include Central and South America,
the Middle East and Asia where oil use is still predominant (over 180 million tonnes per
annum in 2007 according to the IEA) and where even a 5% energy saving could equate to $20
million per annum for a 600MWe base-load power plant (consuming 1 million tonnes of HFO
equivalent annually) at current HFO market prices.
A less obvious application for MSAR® is the potential substitution of natural gas in units
designed for dual or multiple fuels. This is applicable in regions where the formula price for
Page 11
14th Annual Meeting – European Refining Technology Conference 11th November 2009 – Session A
www.quadrisefuels.com Page 11 of 19
natural gas or LNG is linked to oil products. Furthermore the increased environmental burden
from MSAR® use needs to be accounted for, as it does with HFO. Where circumstances
allow (e.g. use of low-sulphur hydrocarbons or selection of units equipped with flue gas
desulphurisation) then the price advantage of a residue-based HFO-replacement offers an
interesting alternative to natural gas, even accounting for the incremental cost of oil-based
operations, flue gas desulphurisation (FGD) and carbon dioxide. Using the example below
(Figure 11) for HFO or MSAR® consumption in a NWE-based thermal boiler versus Russian
gas the net energy savings versus gas for the period equate to $65 million per annum for
MSAR® (assuming a sales price at 80% of HFO), compared with $10 million for HFO (i.e. a
$55 million annual MSAR® consumer benefit over HFO). The price advantage with MSAR®
could potentially subsidise the installation of new flue gas abatement systems.
Figure 11 – Potential variable cost savings using MSAR® and HFO versus Natural Gas
NWE HFO and MSAR® (@80% HFO) consumer costs/benefits vs Russian Gas(1 million mt/year HFO basis inc FGD/CO2, Platts monthly averages 4Q04 to 2Q09)
‐200
‐100
0
100
200
300
400
500
Oct‐04
Jan‐05
Apr‐05
Jul‐0
5
Oct‐05
Jan‐06
Apr‐06
Jul‐0
6
Oct‐06
Jan‐07
Apr‐07
Jul‐0
7
Oct‐07
Jan‐08
Apr‐08
Jul‐0
8
Oct‐08
Jan‐09
Apr‐09
energy savings (m
illion US$/year e
quivalen
t)
HFO Saving vs Gas
MSAR Saving vs Gas
MSAR Saving vs HFO
With respect to general base-load boiler and flue-gas cleanup operations with MSAR® there is
a wealth of experience available from the 60 million tonnes of Orimulsion® consumed in
boilers ranging from 50MWth to over 700MWe (please refer to Appendix 2 for further details
and Appendix 3 for general recommendations for consumers looking to switch to MSAR®).
Page 12
14th Annual Meeting – European Refining Technology Conference 11th November 2009 – Session A
www.quadrisefuels.com Page 12 of 19
HFO/bunker fuel substitution by MSAR® in diesel engines (power and marine)
Orimulsion® was specifically precluded from being supplied to the bunker market by BP and
PDVSA to avoid internal conflict with oil trading divisions, hence the principle application of
emulsion fuel in diesel engines to date has been for power generation, predominantly using
Wärtsilä medium speed 4-stroke engines. As a result of the successful testing programme, a
150MWe Wärtsilä Orimulsion®-fuelled power plant complete with FGD was installed in
Guatemala in 2004, financed by the World Bank.
Figure 12 – Emulsion fuel development on diesel engines
Preliminary testing with MANN and MITSUI
Laboratory Combustion Bomband Single Cylinder Test
Laboratory evaluation tests 40h 6L46 Wartsila engine
Endurance Test (Fuel, ESPBoiler) 531h 4L32 engine
Function / Endurance Test (newinj. System) 6L46 engine
Full Pilot tests (7,000 tnes) 6L46 engine, Guatemala
WPPP test (14,600 tnes) 12V64 + 12V46 engines (+FGD)
Commercial operation of 150MW Planta Arizona (ca.150,000h)
Further testing of MSAR® 4L32LN engine
Development of MSAR® specific for engine applications
Further testing of MSAR® 4L32LN engine, VTT
2009 20102005 2006 2007 20082001 2002 2003 20041990's 1995 1996 1997 1998 1999 2000
Since commencement of the MSAR® business, the Wärtsilä research and development has
been repeated using different hydrocarbon types on their pilot engine in Finland. The
performance of MSAR® in Wärtsilä tests has been similar to Orimulsion® (e.g. lower NOx
versus HFO), and further improvements to the fuel pre-treatment system operations have been
experienced with MSAR® reducing retrofit and operating costs.
Development work continues on a new formulation of MSAR® with a reduced water content
that will enable existing Wärtsilä engines to be converted from HFO to MSAR® without any
significant modifications to the fuel feed design, negating the 90% maximum load constraint
previously experienced with 70:30 oil-in-water emulsions (such as Orimulsion®).
The design and operation of modern flue-gas abatement systems has also been fully tested by
Wärtsilä, their associated OEMs and the World Bank who have all concluded that emulsion
fuel operations are similar to, or better than operations when using HFO.
Page 13
14th Annual Meeting – European Refining Technology Conference 11th November 2009 – Session A
www.quadrisefuels.com Page 13 of 19
Given the successful testing of MSAR® in diesel power plants, opportunity exists to apply this
experience to the marine sector where >170 million tonnes/year of bunker fuel is consumed.
The proposed IMO specifications for bunker fuel and the expansion of the Special Emissions
Control Areas (SECAs) are subjects of considerable debate within the refining and maritime
communities as is the future use of bunker fuel oil or marine distillates to meet prospective
IMO and SECA standards. The application of ship-borne scrubbing equipment is (in our
view) a technically and economically viable alternative to distillate substitution to meet the
forthcoming sulphur
standards. The
introduction of a lower-
cost bunker fuel
alternative could provide
a means of subsidising
the scrubbing equipment
and simultaneously
increasing the owner’s
profitability.
However the introduction of emulsion fuel to this market segment is not without its
challenges, namely:
Performance testing on marine diesels and scrubbing equipment with MSAR® is required,
at pilot and commercial scale
Bunker fuel segregation is required (HFO and MSAR® should not be mixed),
complicating logistics
MSAR® energy content is lower than HFO, hence the vessel range or cargo capacity of
existing vessels is reduced
Potential environmental impact with MSAR® needs to be fully assessed (updating existing
spill contingency plans)
However, given the proven record of emulsion fuel in the boiler and diesel engine power
sectors we believe that a parallel techno-economic solution will be compelling for refiners and
consumers alike over the longer term. In the meantime QFI is actively seeking OEM and
industry partners for a joint development and implementation plan commencing in 2010.
Fuel Region/ Process Oil %S SO2 Scrubber %S HFOSupplier content Efficiency equiv.
Orimulsion® Canada Wet‐limestone 4.0% 93% 0.28%Orimulsion® Wet‐limestone 4.0% 95% 0.20%
Emulsion Orimulsion® Wet‐limestone 4.0% 94% 0.24%Fuelled Orimulsion® Wet‐limestone 4.0% 93% 0.28%Power Orimulsion® Wet‐limestone 4.0% 96% 0.16%Plants Orimulsion® Wet‐limestone 4.0% 95% 0.20%
Orimulsion® Guatemala Wet‐limestone 4.0% >90% <0.41%(examples) Orimulsion® Denmark Wet‐limestone 4.0% >99% <0.04%
MSAR® Lithuania Wet‐limestone 3.0% >97% <0.08%
Marine HFO Wärtsilä NaOH 3.4% >99% <0.03%Scrubbers HFO EcoSpec Sea‐water 2.0% 93% 0.14%
HFO Krystallon Sea‐water 3.5% >99% <0.04%
Japan
Italy
Figure 13 – Scrubber performance (emulsion & marine)
Page 14
14th Annual Meeting – European Refining Technology Conference 11th November 2009 – Session A
www.quadrisefuels.com Page 14 of 19
Emulsion feedstock and fuel characteristics
Experience with MSAR® technology has shown that a different solution is required for
residue emulsions when compared with asphalt, extra-heavy crude or fuel oil emulsions. This
is due to the more stringent standards required for fuel consumption and long-term
static/dynamic stability - requirements that were the cornerstone of the global Orimulsion®
business.
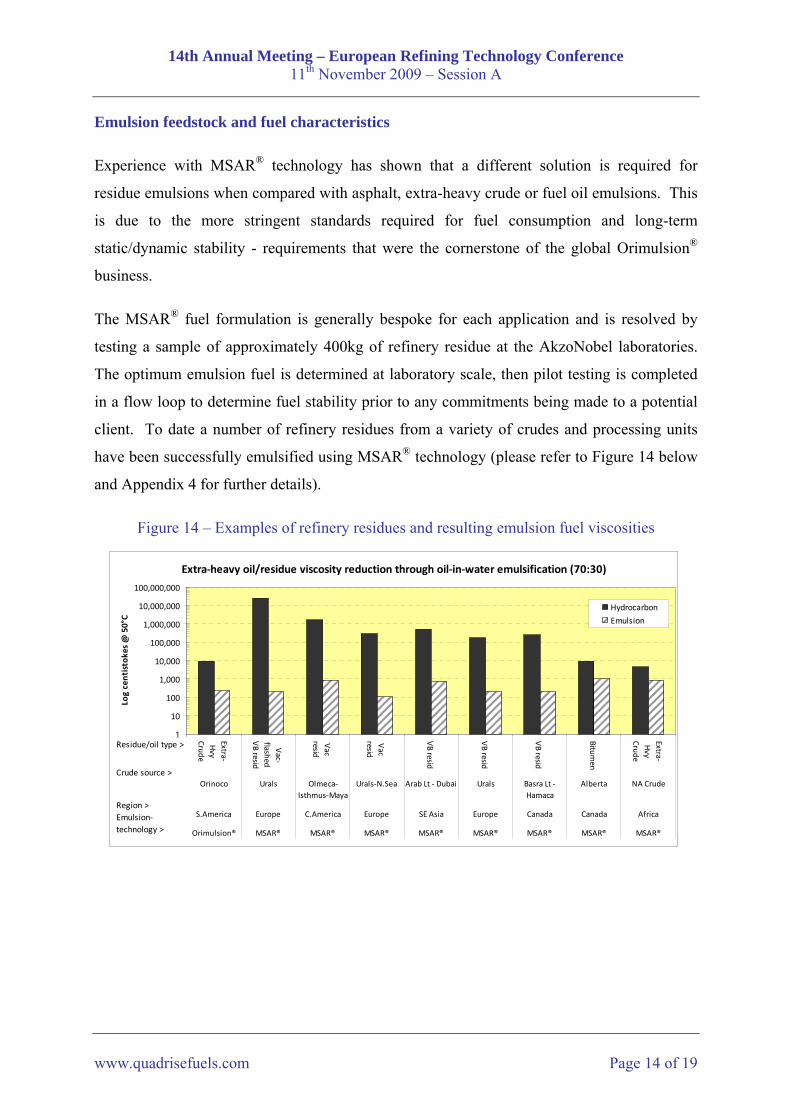
The MSAR® fuel formulation is generally bespoke for each application and is resolved by
testing a sample of approximately 400kg of refinery residue at the AkzoNobel laboratories.
The optimum emulsion fuel is determined at laboratory scale, then pilot testing is completed
in a flow loop to determine fuel stability prior to any commitments being made to a potential
client. To date a number of refinery residues from a variety of crudes and processing units
have been successfully emulsified using MSAR® technology (please refer to Figure 14 below
and Appendix 4 for further details).
Figure 14 – Examples of refinery residues and resulting emulsion fuel viscosities
Extra‐heavy oil/residue viscosity reduction through oil‐in‐water emulsification (70:30)
1
10
100
1,000
10,000
100,000
1,000,000
10,000,000
100,000,000
Extra‐Hvy
Crude
Vac‐
flashedVB resid
Vac
resid
Vac
resid
VB resid
VB resid
VB resid
Bitumen
Extra‐Hvy
Crude
Orinoco Urals Olmeca‐Isthmus‐Maya
Urals‐N.Sea Arab Lt ‐ Dubai Urals Basra Lt ‐Hamaca
Alberta NA Crude
S.America Europe C.America Europe SE Asia Europe Canada Canada Africa
Orimulsion® MSAR® MSAR® MSAR® MSAR® MSAR® MSAR® MSAR® MSAR®
Log centistokes @ 50°C
Hydrocarbon
Emulsion
Residue/oil type >
Crude source >
Region >Emulsion‐technology >
Page 15
14th Annual Meeting – European Refining Technology Conference 11th November 2009 – Session A
www.quadrisefuels.com Page 15 of 19
Appendix 1 – Orimulsion®
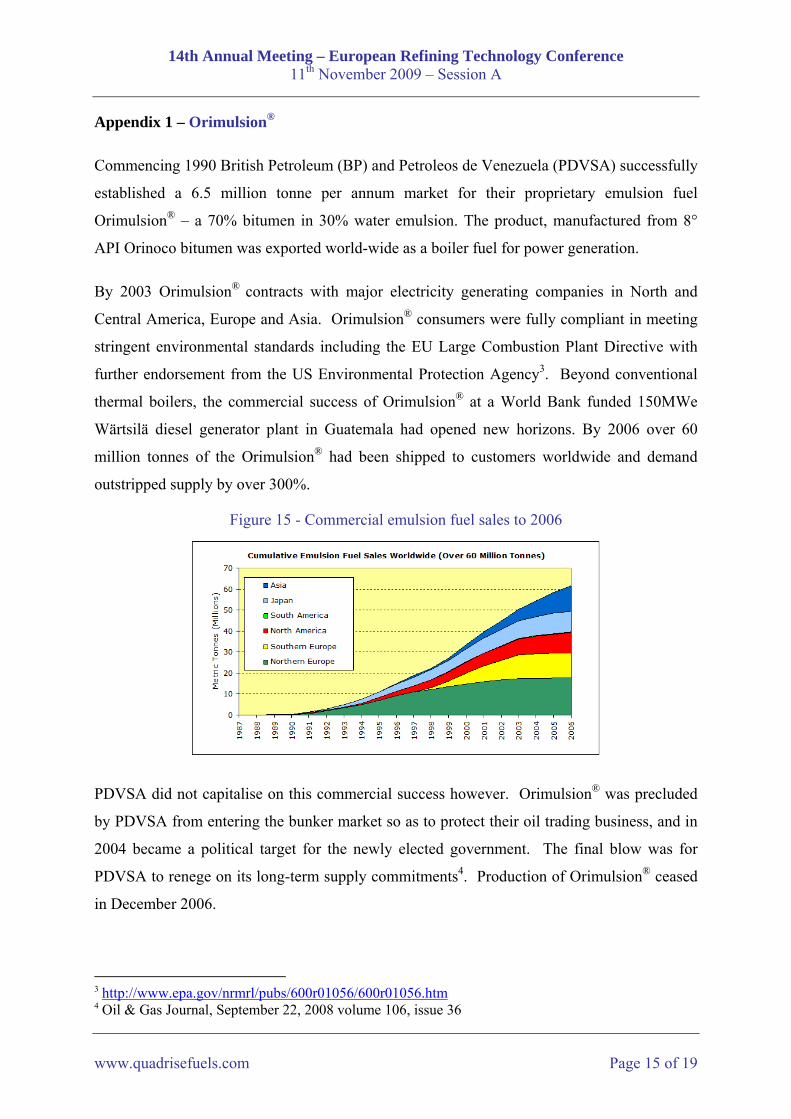
Commencing 1990 British Petroleum (BP) and Petroleos de Venezuela (PDVSA) successfully
established a 6.5 million tonne per annum market for their proprietary emulsion fuel
Orimulsion® – a 70% bitumen in 30% water emulsion. The product, manufactured from 8°
API Orinoco bitumen was exported world-wide as a boiler fuel for power generation.
By 2003 Orimulsion® contracts with major electricity generating companies in North and
Central America, Europe and Asia. Orimulsion® consumers were fully compliant in meeting
stringent environmental standards including the EU Large Combustion Plant Directive with
further endorsement from the US Environmental Protection Agency3. Beyond conventional
thermal boilers, the commercial success of Orimulsion® at a World Bank funded 150MWe
Wärtsilä diesel generator plant in Guatemala had opened new horizons. By 2006 over 60
million tonnes of the Orimulsion® had been shipped to customers worldwide and demand
outstripped supply by over 300%.
Figure 15 - Commercial emulsion fuel sales to 2006
PDVSA did not capitalise on this commercial success however. Orimulsion® was precluded
by PDVSA from entering the bunker market so as to protect their oil trading business, and in
2004 became a political target for the newly elected government. The final blow was for
PDVSA to renege on its long-term supply commitments4. Production of Orimulsion® ceased
in December 2006.
3 http://www.epa.gov/nrmrl/pubs/600r01056/600r01056.htm 4 Oil & Gas Journal, September 22, 2008 volume 106, issue 36
Page 16
14th Annual Meeting – European Refining Technology Conference 11th November 2009 – Session A
www.quadrisefuels.com Page 16 of 19
Appendix 2 – Major Emulsion Fuel Consumers
Baseload Orimulsion® Consumers Installed with Flue Gas Desulphurisation Equipment
Country Plant Name Dates
Start-End
Boiler Design Fuel
Boiler Rating
MWe
Orimulsion® [million tonnes]
Per year Total
Kashima-Kita 1 91-06 HFO 95+Steam Kashima-Kita 2 94-06 HFO 125+Steam
0,4 6,0
Kansai Electric Osaka 4 94-05 HFO 156 0,2 1,4 Japan
Hokaido Electric Shiriuchi 97-06 Ori® 350 0,2 0,8 Canada NB Power Dalhousie 1/2 94-06 HFO/Coal 105/215 0,8 7,0
Denmark SK Power Asnæs 5 95-03 Coal, HFO 640 1,4 6,1
Guatemala Constellation Energy, P.Arizona 04-06 HFO 150 Diesel 0,3 1.0
Germany RWE Ibbenbueren (1) 98-02 Coal, HFO 770 0,03 0,2 ENEL Brindisi Sud
1,2,3,4 (3) 98-05 Coal, HFO 2x660 1,4 8,0 Italy
ENEL Fiume Santo 3, 4 99-04 Coal, HFO 2x320 1,1 4,0 South Korea KOSPO Youngnam 03-06 HFO 2x200 1,0 2,0
Singapore Power Seraya Stage I 04-06 HFO 3x250 1,5 2,5 GEPB Nanhai A (2) 01-06 HFO 400 0,5 3,0 GEPB Nanhai B (2) 01-06 HFO 100 0,1 0,6 GEPB Heng Yun (2) 01-06 HFO 200 0,15 0,9
China
GEPB Huang Pu (2) 01-06 HFO 500 0,1 0,6 Notes: (1) Orimulsion® was used as a start-up and combustion support fuel for coal
(2) Orimulsion® was co-fired with HFO (3) Orimulsion® was co-fired with coal
Page 17
14th Annual Meeting – European Refining Technology Conference 11th November 2009 – Session A
www.quadrisefuels.com Page 17 of 19
Appendix 3 – MSAR® conversion overview for consumers
Only minor modifications are required to convert an HFO system to MSAR®. The fuel can be
stored and handled at ambient conditions and normally combusted with only minimal preheat
(50-60°C versus 80-120°C for HFO).
Heating of storage tanks will not typically be required, except in very cold regions. Only
coarse (~ 740µm) suction filters are required and it is generally recommended that high
pressure pumps are retrofitted with variable speed drives for flow control. Steam to heat
exchangers should be low pressure (<4 bar) and desuperheated to minimise localised over-
heating. When operating with MSAR®, significant mixing with other oil-based products
should be avoided, as should freezing or over-heating (>80°C). Excessive shear (such as the
potential turbulence from a instantaneous pressure drop of >6 bar over orifices or control
valves) should also be avoided. As a direct HFO substitute it may be used locally or
transported by road, rail, pipeline or sea.
Burner nozzles will need to be re-sized, due to the higher emulsion fuel flow required
(resulting from the lower calorific value versus HFO).
Typical MSAR® conversion recommendations:
Pipeline pressure drops assessed for revised fuel properties and flow rates
Fuel heating systems (where needed) converted to hot-water (e.g. storage tank coils), low-
pressure steam (e.g. fuel pre-heaters) or electrical self-limiting (e.g. pipe steam tracing)
Fuel pumping systems evaluated for required capacity and (where needed) converted to
variable speed drive from high-pressure spill-back control. Suction filter baskets are
evaluated
Fuel flow measurements systems evaluated and (where needed) replaced with non-
intrusive flow metering (e.g. Coriolis meters)
Burner nozzles replaced with appropriate and larger capacity designs
Boiler configurations and fan capacities assessed for change in flue gas properties
Flue gas treatment systems reviewed using revised fuel properties versus environment
limits
Page 18
14th Annual Meeting – European Refining Technology Conference 11th November 2009 – Session A
www.quadrisefuels.com Page 18 of 19
Figure 17 – Emulsion fuel SO2 emissions versus limits
MSAR® environmental impact
MSAR® is pre-atomised (~5
microns) and can be burned at
very low-levels of excess oxygen
whilst achieving virtually
complete carbon burnout and
reduced NOx emissions.
Emissions of sulphur dioxides
will be similar to direct firing of
the residue, i.e. marginally higher
than the equivalent HFO due to
the absence of diluents.
Conventional abatement
equipment designed for HFO
combustion is generally suitable
for MSAR®.
MSAR® environmental summary:
CO2 emissions comparable with HFO and lower than direct-residue, coal and pet-coke use
SO2 emissions marginally higher than HFO, captured using conventional flue gas
scrubbing processes
SO3 emissions lower than residue firing and similar to, or lower than HFO
Reduced NOx (by typically >20%) versus HFO due to water content and efficient
combustion
Reduced particulate emissions (complete carbon burnout versus HFO and hot residue)
Reduced mass of combustion ash produced (near-zero carbon)
Ash is suitable for treatment / metals recovery
Global experience with major OEM suppliers (e.g. Alstom, MHI, IHI, Babcock etc)
0 100 200 300 400 500 600 700 800
Canada ‐ Dalhousie
Denmark ‐ Asnæs
Italy ‐ Brindisi Sud
Italy ‐ Fiume Santo
Japan ‐ Kansai Electric
European Plant Standards
World Bank Standards ‐ Gas
World Bank Standards ‐ Oil
World Bank Standards ‐ Coal
NOx, mg/Nm³ (3% O2 dry basis)
Emulsion Performance
Plant Standards
Emulsion Performance
Plant Standards
Figure 16 – Emulsion fuel NOx emissions versus limits
0 250 500 750 1000 1250 1500
Canada - DalhousieChina - Guangdong Electric Power
Denmark - Asnæs
Italy - Brindisi SudItaly - Fiume Santo
Japan - Kansai ElectricJapan - Hokkaido Electric
Japan - Kashima Kita
US EPAUS Clear Skies
European New Plant Standards
mg/Nm³ (3% O2 dry)
0.00 0.25 0.50 0.75 1.00
lb/mmBtu
Page 19
14th Annual Meeting – European Refining Technology Conference 11th November 2009 – Session A
www.quadrisefuels.com Page 19 of 19
Appendix 4 – Extra-Heavy Oils & Residues and Resulting Emulsion Fuel Properties Product Orimulsion® MSAR® MSAR® MSAR®Source S.America Europe C.America EuropeCrude diet Orinoco Urals Olmeca‐Isthmus‐Maya Urals‐N.SeaResidue Extra‐Hvy Crude Vac‐flashed VB resid Vac resid Vac resid
Hydrocarbon Properties Units
Density at 15 degC kg/m 3 1018 1060 1021 1033
Viscosity (100 degC) cSt 250 30,500 5900 2070
Viscosity (50 degC) cSt 9181 25,490,869 1,690,917 299,930Shell V50 blending index 39.2 48.3 45.8 43.9Ash % (mass) 0.12 0.15 0.10 0.05
Sulphur % (mass) 4.04 3.00 4.10 1.77
Emulsion Fuel Properties
Density at 15 degC kg/m 3 1009 N/D N/D 1023
Water content % (mass) 29.0 29.6 29.4 29.6
Viscosity (50 degC / 20 s‐1) cSt 230 200 865 107Shell V50 blending index 31.7 31.3 34.9 29.5Droplet Size microns 15 7 4 4
Ash % (mass) 0.07 N/D N/D 0.05
Sulphur % (mass) 2.85 N/D N/D 1.18
LHV MJ/kg 27.8 N/D N/D 27.7 Product MSAR® MSAR® MSAR® MSAR®Source SE Asia Europe Canada CanadaCrude diet Arab Lt ‐ Dubai Urals Basra Lt ‐ Hamaca AlbertaResidue VB resid VB resid VB resid Bitumen
Hydrocarbon Properties Units
Density at 15 degC kg/m 3 1040 1046 1060 1013
Viscosity (100 degC) cSt 2900 1500 1,877 250
Viscosity (50 degC) cSt 523,335 176,240 255,113 9,181Shell V50 blending index 44.6 43.3 43.8 39.2Ash % (mass) N/D 0.07 0.10 0.05
Sulphur % (mass) 5.00 2.67 4.98 4.28
Emulsion Fuel Properties
Density at 15 degC kg/m 3 N/D 1030 1041 1008
Water content % (mass) 29.6 29.8 30.0 29.6
Viscosity (50 degC / 20 s‐1) cSt 757 201 200 970Shell V50 blending index 34.6 31.3 31.3 35.1Droplet Size microns 6 10 7 4
Ash % (mass) N/D 0.11 N/D 0.05
Sulphur % (mass) N/D 1.92 N/D 3.07
LHV MJ/kg N/D 28.9 N/D 26.9