Page 1
May 21-27, 2020
National Voter Insights Study
TargetSmart + Dynata
2-3-2 Party 3-1-3 Party Ideology Party ID/Ideology
Total Dem Ind Rep Dem Ind Rep Lib Mod ConsLib
Dem
Mod / Cons Dem
Mod / Lib Rep
Cons Rep
Party ID Difference...2-3-2 PARTY ID Dem-Rep 4 100 - -100 73 - -75 68 6 -52 100 100 -100 -1003-1-3 PARTY ID Dem-Rep 7 100 8 -100 100 - -100 85 10 -63 100 100 -100 -100
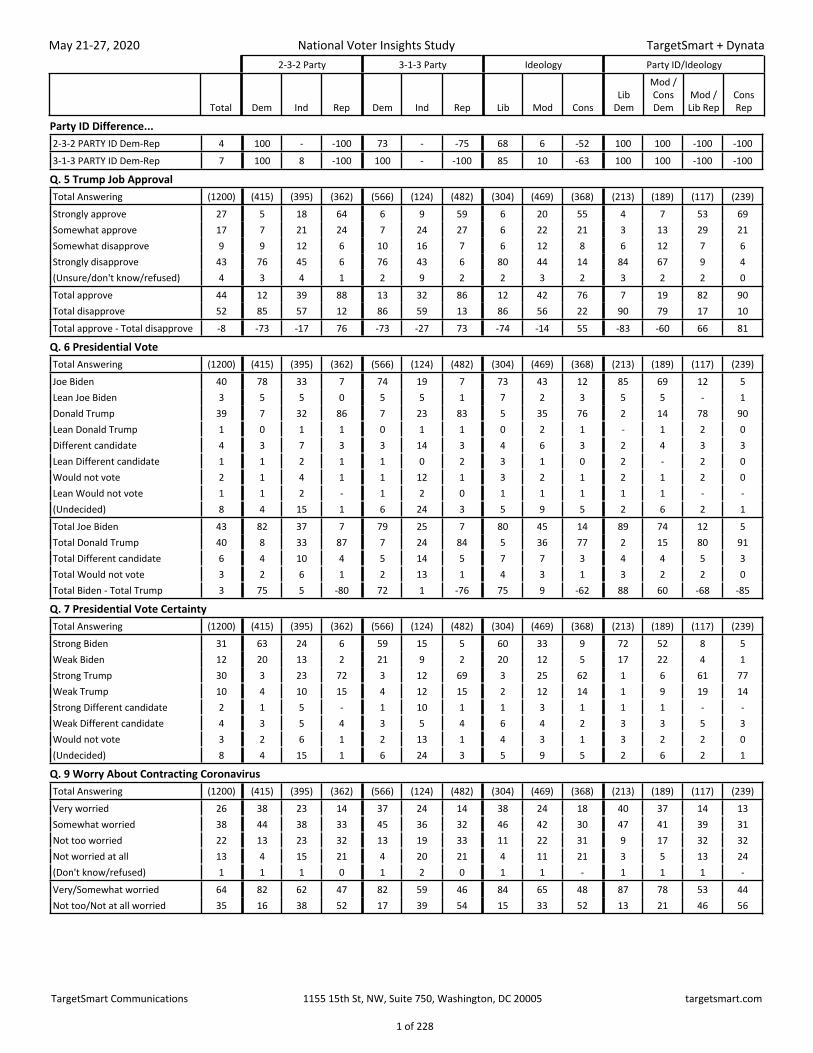
Q. 5 Trump Job ApprovalTotal Answering (1200) (415) (395) (362) (566) (124) (482) (304) (469) (368) (213) (189) (117) (239)Strongly approve 27 5 18 64 6 9 59 6 20 55 4 7 53 69Somewhat approve 17 7 21 24 7 24 27 6 22 21 3 13 29 21Somewhat disapprove 9 9 12 6 10 16 7 6 12 8 6 12 7 6Strongly disapprove 43 76 45 6 76 43 6 80 44 14 84 67 9 4(Unsure/don't know/refused) 4 3 4 1 2 9 2 2 3 2 3 2 2 0Total approve 44 12 39 88 13 32 86 12 42 76 7 19 82 90Total disapprove 52 85 57 12 86 59 13 86 56 22 90 79 17 10Total approve - Total disapprove -8 -73 -17 76 -73 -27 73 -74 -14 55 -83 -60 66 81
Q. 6 Presidential VoteTotal Answering (1200) (415) (395) (362) (566) (124) (482) (304) (469) (368) (213) (189) (117) (239)Joe Biden 40 78 33 7 74 19 7 73 43 12 85 69 12 5Lean Joe Biden 3 5 5 0 5 5 1 7 2 3 5 5 - 1Donald Trump 39 7 32 86 7 23 83 5 35 76 2 14 78 90Lean Donald Trump 1 0 1 1 0 1 1 0 2 1 - 1 2 0Different candidate 4 3 7 3 3 14 3 4 6 3 2 4 3 3Lean Different candidate 1 1 2 1 1 0 2 3 1 0 2 - 2 0Would not vote 2 1 4 1 1 12 1 3 2 1 2 1 2 0Lean Would not vote 1 1 2 - 1 2 0 1 1 1 1 1 - -(Undecided) 8 4 15 1 6 24 3 5 9 5 2 6 2 1Total Joe Biden 43 82 37 7 79 25 7 80 45 14 89 74 12 5Total Donald Trump 40 8 33 87 7 24 84 5 36 77 2 15 80 91Total Different candidate 6 4 10 4 5 14 5 7 7 3 4 4 5 3Total Would not vote 3 2 6 1 2 13 1 4 3 1 3 2 2 0Total Biden - Total Trump 3 75 5 -80 72 1 -76 75 9 -62 88 60 -68 -85
Q. 7 Presidential Vote CertaintyTotal Answering (1200) (415) (395) (362) (566) (124) (482) (304) (469) (368) (213) (189) (117) (239)Strong Biden 31 63 24 6 59 15 5 60 33 9 72 52 8 5Weak Biden 12 20 13 2 21 9 2 20 12 5 17 22 4 1Strong Trump 30 3 23 72 3 12 69 3 25 62 1 6 61 77Weak Trump 10 4 10 15 4 12 15 2 12 14 1 9 19 14Strong Different candidate 2 1 5 - 1 10 1 1 3 1 1 1 - -Weak Different candidate 4 3 5 4 3 5 4 6 4 2 3 3 5 3Would not vote 3 2 6 1 2 13 1 4 3 1 3 2 2 0(Undecided) 8 4 15 1 6 24 3 5 9 5 2 6 2 1
Q. 9 Worry About Contracting CoronavirusTotal Answering (1200) (415) (395) (362) (566) (124) (482) (304) (469) (368) (213) (189) (117) (239)Very worried 26 38 23 14 37 24 14 38 24 18 40 37 14 13Somewhat worried 38 44 38 33 45 36 32 46 42 30 47 41 39 31Not too worried 22 13 23 32 13 19 33 11 22 31 9 17 32 32Not worried at all 13 4 15 21 4 20 21 4 11 21 3 5 13 24(Don't know/refused) 1 1 1 0 1 2 0 1 1 - 1 1 1 -Very/Somewhat worried 64 82 62 47 82 59 46 84 65 48 87 78 53 44Not too/Not at all worried 35 16 38 52 17 39 54 15 33 52 13 21 46 56
TargetSmart Communications 1155 15th St, NW, Suite 750, Washington, DC 20005 targetsmart.com
1 of 228
Page 2
May 21-27, 2020
National Voter Insights Study
TargetSmart + Dynata
Party ID/Gender
Total Dem MenDem
Women Ind MenInd
Women Rep MenRep
Women
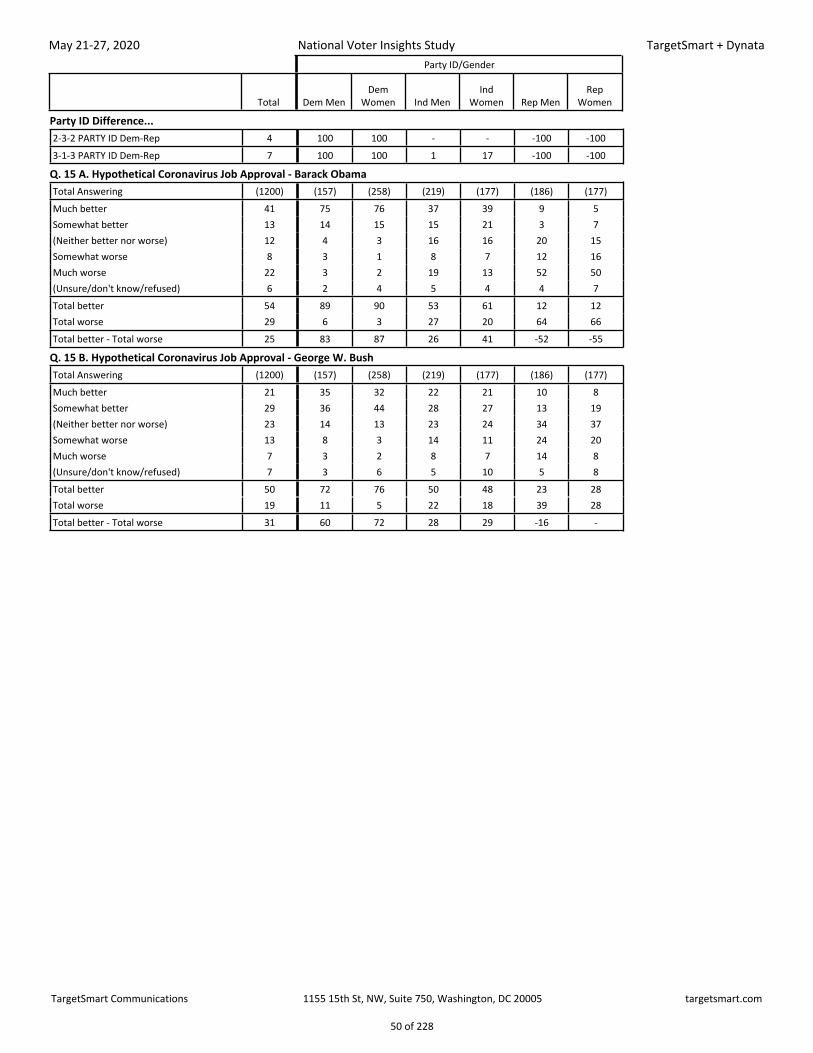
Party ID Difference...2-3-2 PARTY ID Dem-Rep 4 100 100 - - -100 -1003-1-3 PARTY ID Dem-Rep 7 100 100 1 17 -100 -100
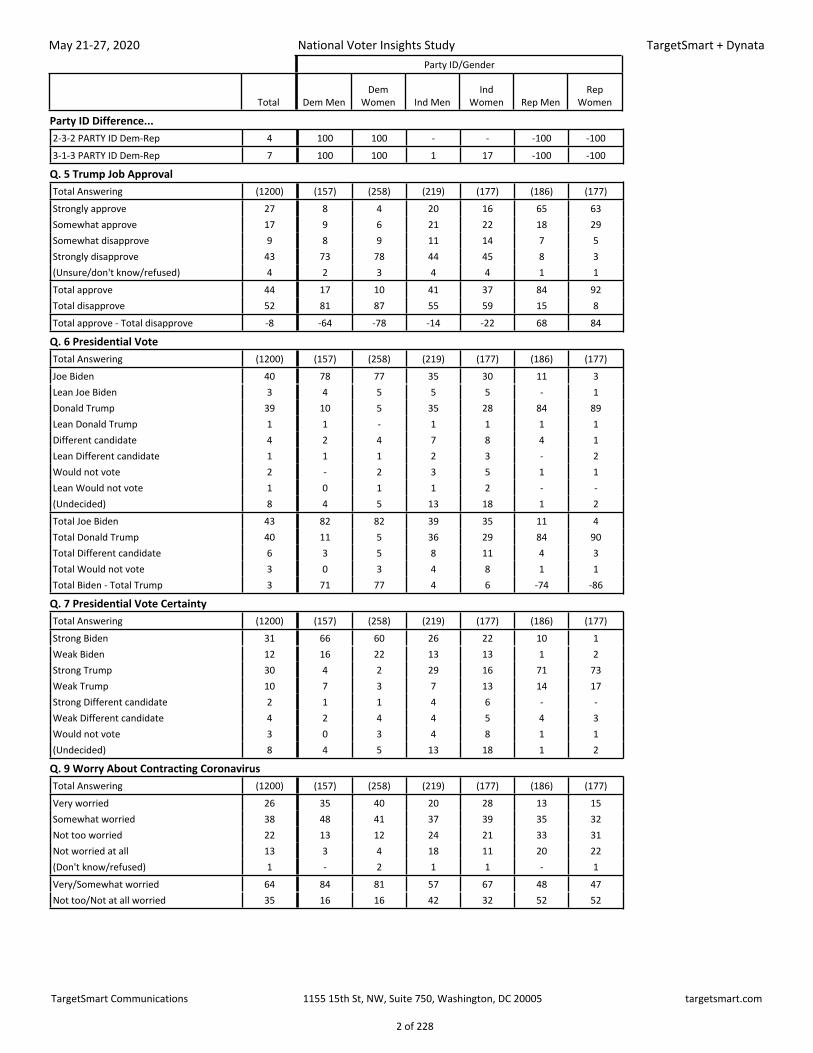
Q. 5 Trump Job ApprovalTotal Answering (1200) (157) (258) (219) (177) (186) (177)Strongly approve 27 8 4 20 16 65 63Somewhat approve 17 9 6 21 22 18 29Somewhat disapprove 9 8 9 11 14 7 5Strongly disapprove 43 73 78 44 45 8 3(Unsure/don't know/refused) 4 2 3 4 4 1 1Total approve 44 17 10 41 37 84 92Total disapprove 52 81 87 55 59 15 8Total approve - Total disapprove -8 -64 -78 -14 -22 68 84
Q. 6 Presidential VoteTotal Answering (1200) (157) (258) (219) (177) (186) (177)Joe Biden 40 78 77 35 30 11 3Lean Joe Biden 3 4 5 5 5 - 1Donald Trump 39 10 5 35 28 84 89Lean Donald Trump 1 1 - 1 1 1 1Different candidate 4 2 4 7 8 4 1Lean Different candidate 1 1 1 2 3 - 2Would not vote 2 - 2 3 5 1 1Lean Would not vote 1 0 1 1 2 - -(Undecided) 8 4 5 13 18 1 2Total Joe Biden 43 82 82 39 35 11 4Total Donald Trump 40 11 5 36 29 84 90Total Different candidate 6 3 5 8 11 4 3Total Would not vote 3 0 3 4 8 1 1Total Biden - Total Trump 3 71 77 4 6 -74 -86
Q. 7 Presidential Vote CertaintyTotal Answering (1200) (157) (258) (219) (177) (186) (177)Strong Biden 31 66 60 26 22 10 1Weak Biden 12 16 22 13 13 1 2Strong Trump 30 4 2 29 16 71 73Weak Trump 10 7 3 7 13 14 17Strong Different candidate 2 1 1 4 6 - -Weak Different candidate 4 2 4 4 5 4 3Would not vote 3 0 3 4 8 1 1(Undecided) 8 4 5 13 18 1 2
Q. 9 Worry About Contracting CoronavirusTotal Answering (1200) (157) (258) (219) (177) (186) (177)Very worried 26 35 40 20 28 13 15Somewhat worried 38 48 41 37 39 35 32Not too worried 22 13 12 24 21 33 31Not worried at all 13 3 4 18 11 20 22(Don't know/refused) 1 - 2 1 1 - 1Very/Somewhat worried 64 84 81 57 67 48 47Not too/Not at all worried 35 16 16 42 32 52 52
TargetSmart Communications 1155 15th St, NW, Suite 750, Washington, DC 20005 targetsmart.com
2 of 228
Page 3
May 21-27, 2020
National Voter Insights Study
TargetSmart + Dynata
Urbanicity
Total R1 R2 S3 S4 U5 U6 Rural Subu rban Urban
Party ID Difference...2-3-2 PARTY ID Dem-Rep 4 -23 -15 -2 9 22 42 -19 4 283-1-3 PARTY ID Dem-Rep 7 -23 -17 -1 12 26 52 -20 7 33
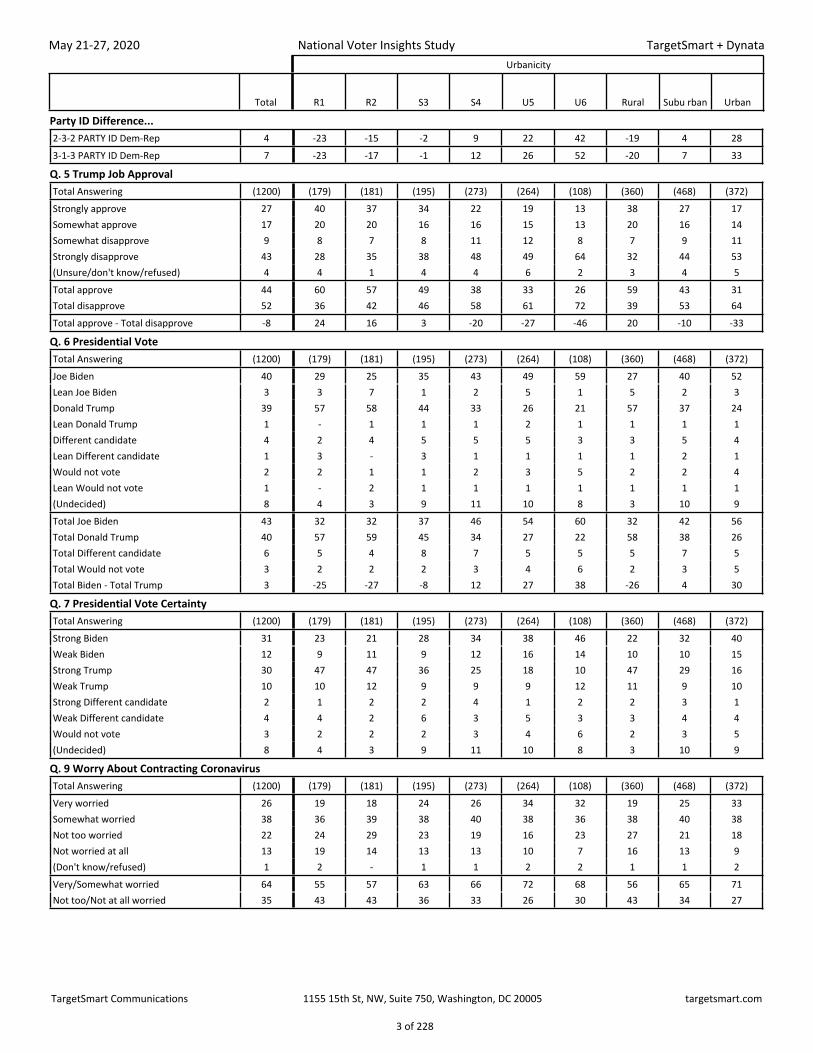
Q. 5 Trump Job ApprovalTotal Answering (1200) (179) (181) (195) (273) (264) (108) (360) (468) (372)Strongly approve 27 40 37 34 22 19 13 38 27 17Somewhat approve 17 20 20 16 16 15 13 20 16 14Somewhat disapprove 9 8 7 8 11 12 8 7 9 11Strongly disapprove 43 28 35 38 48 49 64 32 44 53(Unsure/don't know/refused) 4 4 1 4 4 6 2 3 4 5Total approve 44 60 57 49 38 33 26 59 43 31Total disapprove 52 36 42 46 58 61 72 39 53 64Total approve - Total disapprove -8 24 16 3 -20 -27 -46 20 -10 -33
Q. 6 Presidential VoteTotal Answering (1200) (179) (181) (195) (273) (264) (108) (360) (468) (372)Joe Biden 40 29 25 35 43 49 59 27 40 52Lean Joe Biden 3 3 7 1 2 5 1 5 2 3Donald Trump 39 57 58 44 33 26 21 57 37 24Lean Donald Trump 1 - 1 1 1 2 1 1 1 1Different candidate 4 2 4 5 5 5 3 3 5 4Lean Different candidate 1 3 - 3 1 1 1 1 2 1Would not vote 2 2 1 1 2 3 5 2 2 4Lean Would not vote 1 - 2 1 1 1 1 1 1 1(Undecided) 8 4 3 9 11 10 8 3 10 9Total Joe Biden 43 32 32 37 46 54 60 32 42 56Total Donald Trump 40 57 59 45 34 27 22 58 38 26Total Different candidate 6 5 4 8 7 5 5 5 7 5Total Would not vote 3 2 2 2 3 4 6 2 3 5Total Biden - Total Trump 3 -25 -27 -8 12 27 38 -26 4 30
Q. 7 Presidential Vote CertaintyTotal Answering (1200) (179) (181) (195) (273) (264) (108) (360) (468) (372)Strong Biden 31 23 21 28 34 38 46 22 32 40Weak Biden 12 9 11 9 12 16 14 10 10 15Strong Trump 30 47 47 36 25 18 10 47 29 16Weak Trump 10 10 12 9 9 9 12 11 9 10Strong Different candidate 2 1 2 2 4 1 2 2 3 1Weak Different candidate 4 4 2 6 3 5 3 3 4 4Would not vote 3 2 2 2 3 4 6 2 3 5(Undecided) 8 4 3 9 11 10 8 3 10 9
Q. 9 Worry About Contracting CoronavirusTotal Answering (1200) (179) (181) (195) (273) (264) (108) (360) (468) (372)Very worried 26 19 18 24 26 34 32 19 25 33Somewhat worried 38 36 39 38 40 38 36 38 40 38Not too worried 22 24 29 23 19 16 23 27 21 18Not worried at all 13 19 14 13 13 10 7 16 13 9(Don't know/refused) 1 2 - 1 1 2 2 1 1 2Very/Somewhat worried 64 55 57 63 66 72 68 56 65 71Not too/Not at all worried 35 43 43 36 33 26 30 43 34 27
TargetSmart Communications 1155 15th St, NW, Suite 750, Washington, DC 20005 targetsmart.com
3 of 228
Page 4
May 21-27, 2020
National Voter Insights Study
TargetSmart + Dynata
Urbanicity/Gender
Total Rural MenRural
WomenSubu rban
MenSubu rban Women Urban Men
Urban Women
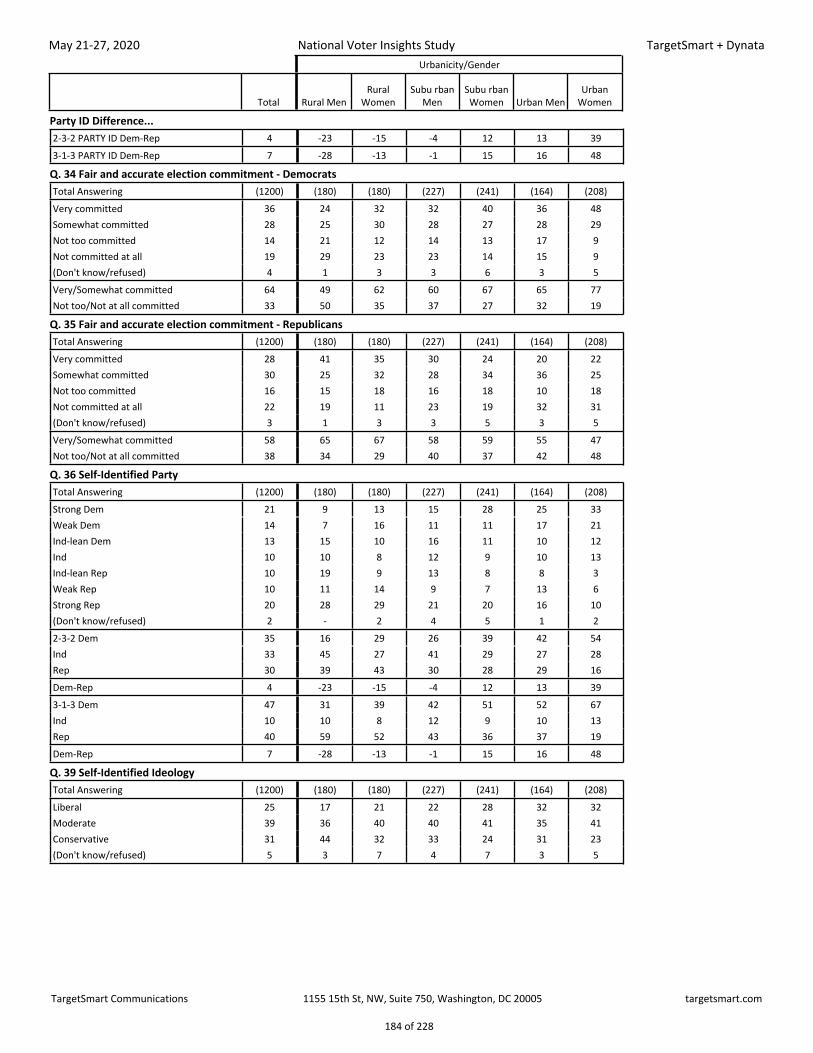
Party ID Difference...2-3-2 PARTY ID Dem-Rep 4 -23 -15 -4 12 13 393-1-3 PARTY ID Dem-Rep 7 -28 -13 -1 15 16 48
Q. 5 Trump Job ApprovalTotal Answering (1200) (180) (180) (227) (241) (164) (208)Strongly approve 27 40 36 32 23 21 14Somewhat approve 17 17 23 16 16 17 12Somewhat disapprove 9 7 8 8 11 12 9Strongly disapprove 43 34 30 42 46 44 61(Unsure/don't know/refused) 4 2 3 3 5 5 5Total approve 44 57 60 48 38 38 25Total disapprove 52 41 37 49 57 57 70Total approve - Total disapprove -8 17 23 -2 -18 -18 -44
Q. 6 Presidential VoteTotal Answering (1200) (180) (180) (227) (241) (164) (208)Joe Biden 40 32 23 40 40 44 58Lean Joe Biden 3 4 5 2 2 3 4Donald Trump 39 56 59 41 34 34 17Lean Donald Trump 1 - 1 1 1 3 0Different candidate 4 3 4 5 6 5 3Lean Different candidate 1 1 1 1 3 - 1Would not vote 2 2 2 1 2 3 4Lean Would not vote 1 1 1 1 1 0 2(Undecided) 8 2 5 9 11 8 11Total Joe Biden 43 36 28 42 42 47 62Total Donald Trump 40 56 60 42 35 37 17Total Different candidate 6 4 5 6 9 5 5Total Would not vote 3 2 3 2 3 4 6Total Biden - Total Trump 3 -20 -32 -1 7 11 45
Q. 7 Presidential Vote CertaintyTotal Answering (1200) (180) (180) (227) (241) (164) (208)Strong Biden 31 27 17 32 32 37 43Weak Biden 12 9 11 10 11 11 19Strong Trump 30 52 42 34 25 20 13Weak Trump 10 4 18 8 10 17 4Strong Different candidate 2 2 1 2 4 1 1Weak Different candidate 4 2 4 3 5 4 4Would not vote 3 2 3 2 3 4 6(Undecided) 8 2 5 9 11 8 11
Q. 9 Worry About Contracting CoronavirusTotal Answering (1200) (180) (180) (227) (241) (164) (208)Very worried 26 16 21 19 31 33 33Somewhat worried 38 35 40 44 35 38 37Not too worried 22 32 22 21 20 18 18Not worried at all 13 18 15 16 11 10 9(Don't know/refused) 1 - 2 1 2 1 3Very/Somewhat worried 64 50 62 63 67 71 71Not too/Not at all worried 35 50 36 37 32 28 27
TargetSmart Communications 1155 15th St, NW, Suite 750, Washington, DC 20005 targetsmart.com
4 of 228
Page 5
May 21-27, 2020
National Voter Insights Study
TargetSmart + Dynata
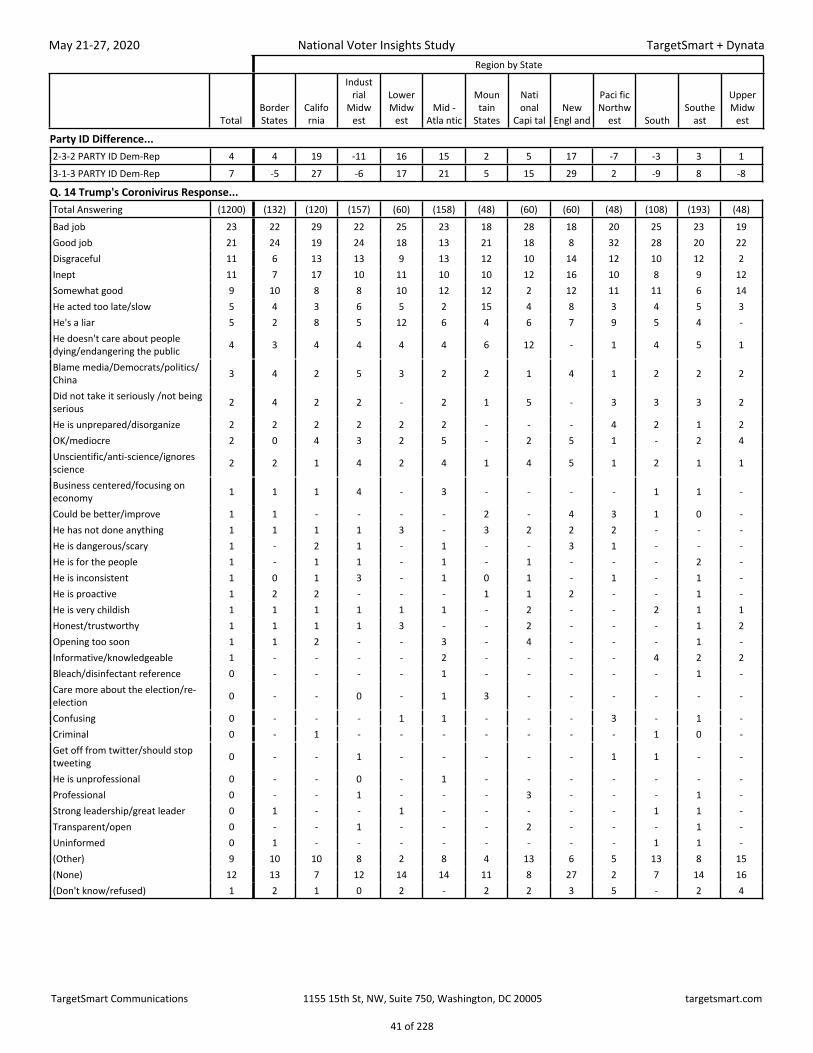
Region by State
TotalBorder States
Califo rnia
Indust rial
Midw est
Lower Midw
estMid -
Atla ntic
Moun tain
States
Nati onal
Capi talNew
Engl and
Paci fic Northw
est SouthSouthe
ast
Upper Midw
est
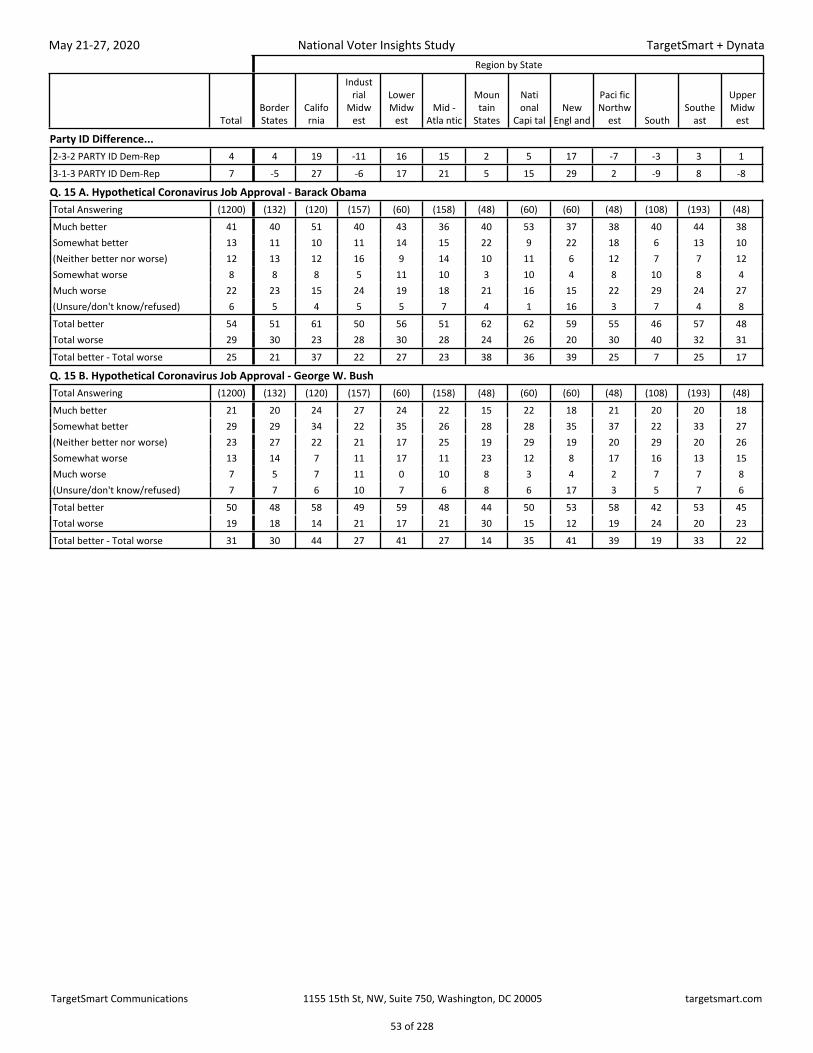
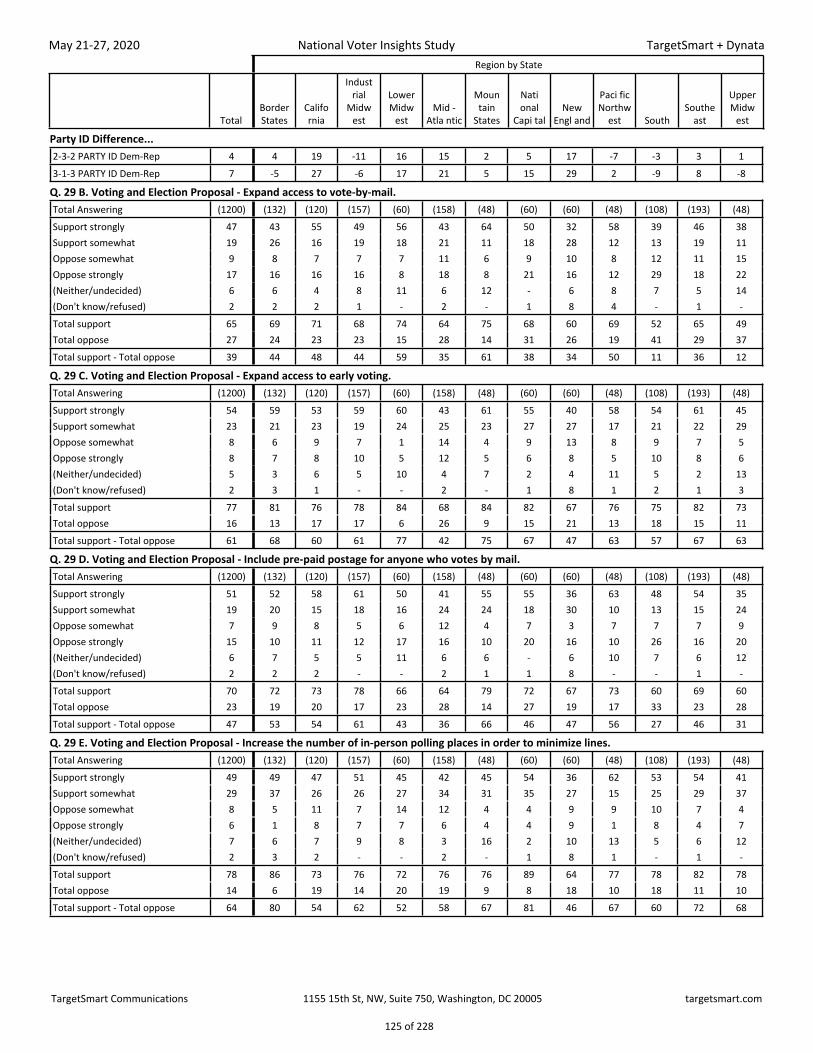
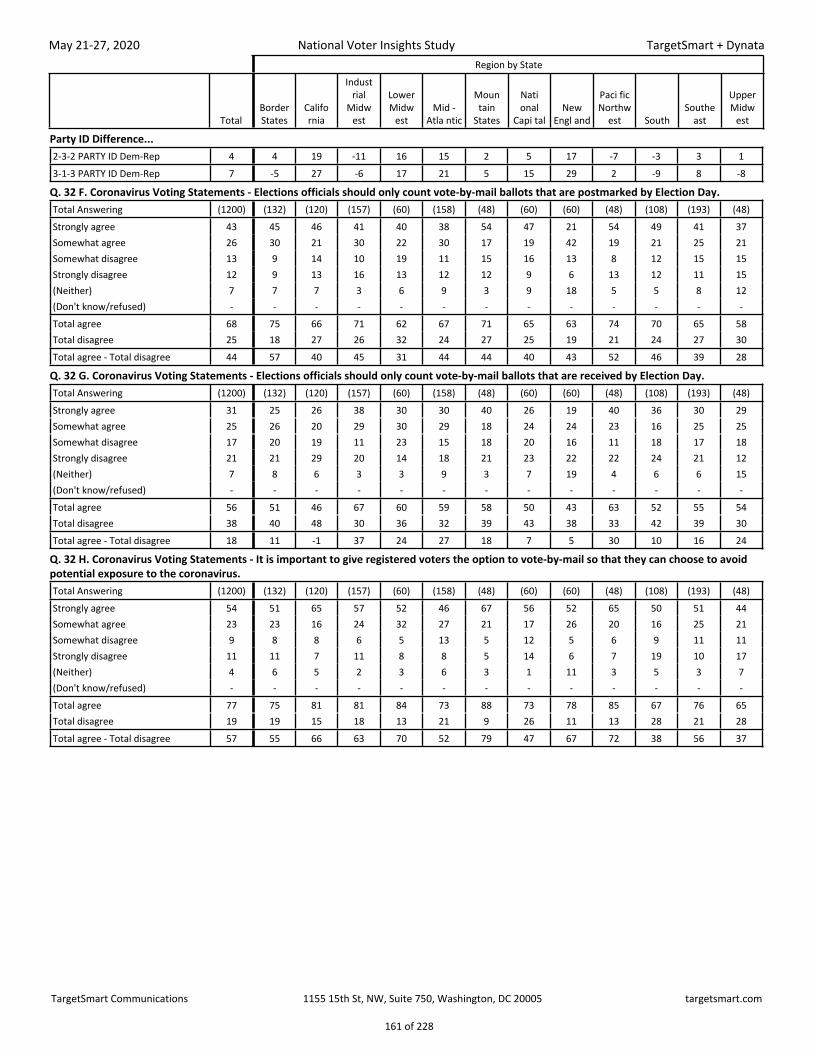
Party ID Difference...2-3-2 PARTY ID Dem-Rep 4 4 19 -11 16 15 2 5 17 -7 -3 3 13-1-3 PARTY ID Dem-Rep 7 -5 27 -6 17 21 5 15 29 2 -9 8 -8
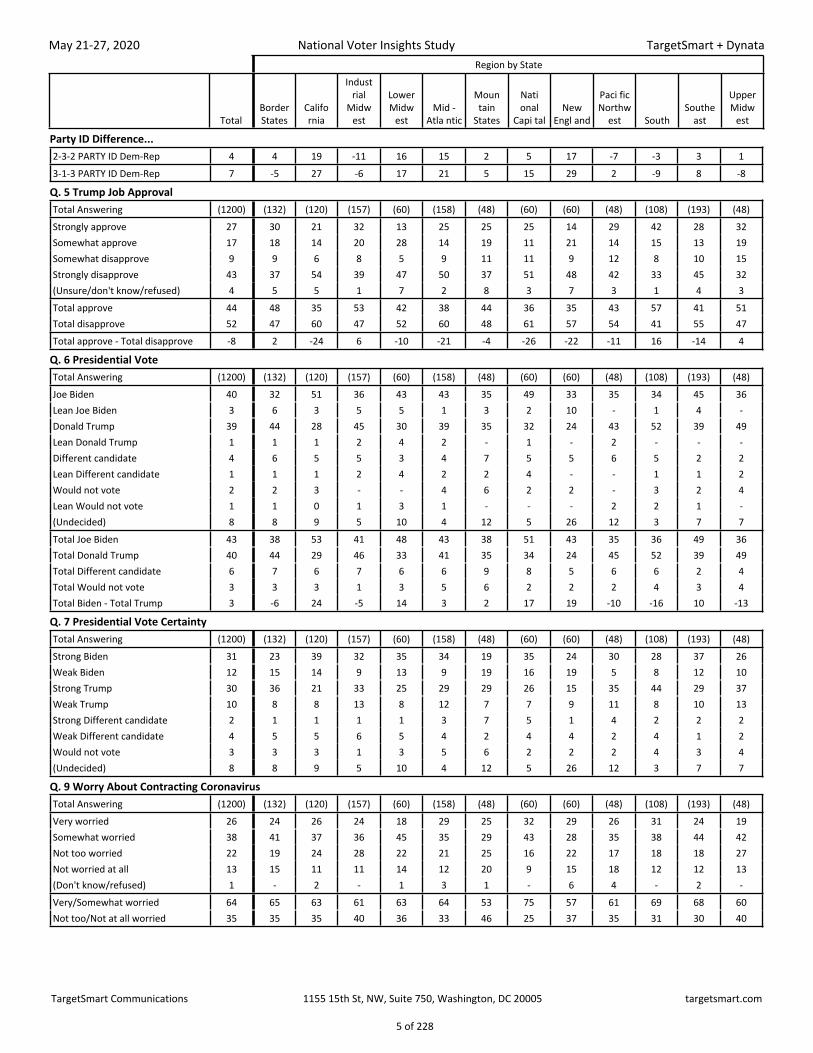
Q. 5 Trump Job ApprovalTotal Answering (1200) (132) (120) (157) (60) (158) (48) (60) (60) (48) (108) (193) (48)Strongly approve 27 30 21 32 13 25 25 25 14 29 42 28 32Somewhat approve 17 18 14 20 28 14 19 11 21 14 15 13 19Somewhat disapprove 9 9 6 8 5 9 11 11 9 12 8 10 15Strongly disapprove 43 37 54 39 47 50 37 51 48 42 33 45 32(Unsure/don't know/refused) 4 5 5 1 7 2 8 3 7 3 1 4 3Total approve 44 48 35 53 42 38 44 36 35 43 57 41 51Total disapprove 52 47 60 47 52 60 48 61 57 54 41 55 47Total approve - Total disapprove -8 2 -24 6 -10 -21 -4 -26 -22 -11 16 -14 4
Q. 6 Presidential VoteTotal Answering (1200) (132) (120) (157) (60) (158) (48) (60) (60) (48) (108) (193) (48)Joe Biden 40 32 51 36 43 43 35 49 33 35 34 45 36Lean Joe Biden 3 6 3 5 5 1 3 2 10 - 1 4 -Donald Trump 39 44 28 45 30 39 35 32 24 43 52 39 49Lean Donald Trump 1 1 1 2 4 2 - 1 - 2 - - -Different candidate 4 6 5 5 3 4 7 5 5 6 5 2 2Lean Different candidate 1 1 1 2 4 2 2 4 - - 1 1 2Would not vote 2 2 3 - - 4 6 2 2 - 3 2 4Lean Would not vote 1 1 0 1 3 1 - - - 2 2 1 -(Undecided) 8 8 9 5 10 4 12 5 26 12 3 7 7Total Joe Biden 43 38 53 41 48 43 38 51 43 35 36 49 36Total Donald Trump 40 44 29 46 33 41 35 34 24 45 52 39 49Total Different candidate 6 7 6 7 6 6 9 8 5 6 6 2 4Total Would not vote 3 3 3 1 3 5 6 2 2 2 4 3 4Total Biden - Total Trump 3 -6 24 -5 14 3 2 17 19 -10 -16 10 -13
Q. 7 Presidential Vote CertaintyTotal Answering (1200) (132) (120) (157) (60) (158) (48) (60) (60) (48) (108) (193) (48)Strong Biden 31 23 39 32 35 34 19 35 24 30 28 37 26Weak Biden 12 15 14 9 13 9 19 16 19 5 8 12 10Strong Trump 30 36 21 33 25 29 29 26 15 35 44 29 37Weak Trump 10 8 8 13 8 12 7 7 9 11 8 10 13Strong Different candidate 2 1 1 1 1 3 7 5 1 4 2 2 2Weak Different candidate 4 5 5 6 5 4 2 4 4 2 4 1 2Would not vote 3 3 3 1 3 5 6 2 2 2 4 3 4(Undecided) 8 8 9 5 10 4 12 5 26 12 3 7 7
Q. 9 Worry About Contracting CoronavirusTotal Answering (1200) (132) (120) (157) (60) (158) (48) (60) (60) (48) (108) (193) (48)Very worried 26 24 26 24 18 29 25 32 29 26 31 24 19Somewhat worried 38 41 37 36 45 35 29 43 28 35 38 44 42Not too worried 22 19 24 28 22 21 25 16 22 17 18 18 27Not worried at all 13 15 11 11 14 12 20 9 15 18 12 12 13(Don't know/refused) 1 - 2 - 1 3 1 - 6 4 - 2 -Very/Somewhat worried 64 65 63 61 63 64 53 75 57 61 69 68 60Not too/Not at all worried 35 35 35 40 36 33 46 25 37 35 31 30 40
TargetSmart Communications 1155 15th St, NW, Suite 750, Washington, DC 20005 targetsmart.com
5 of 228
Page 6
May 21-27, 2020
National Voter Insights Study
TargetSmart + Dynata
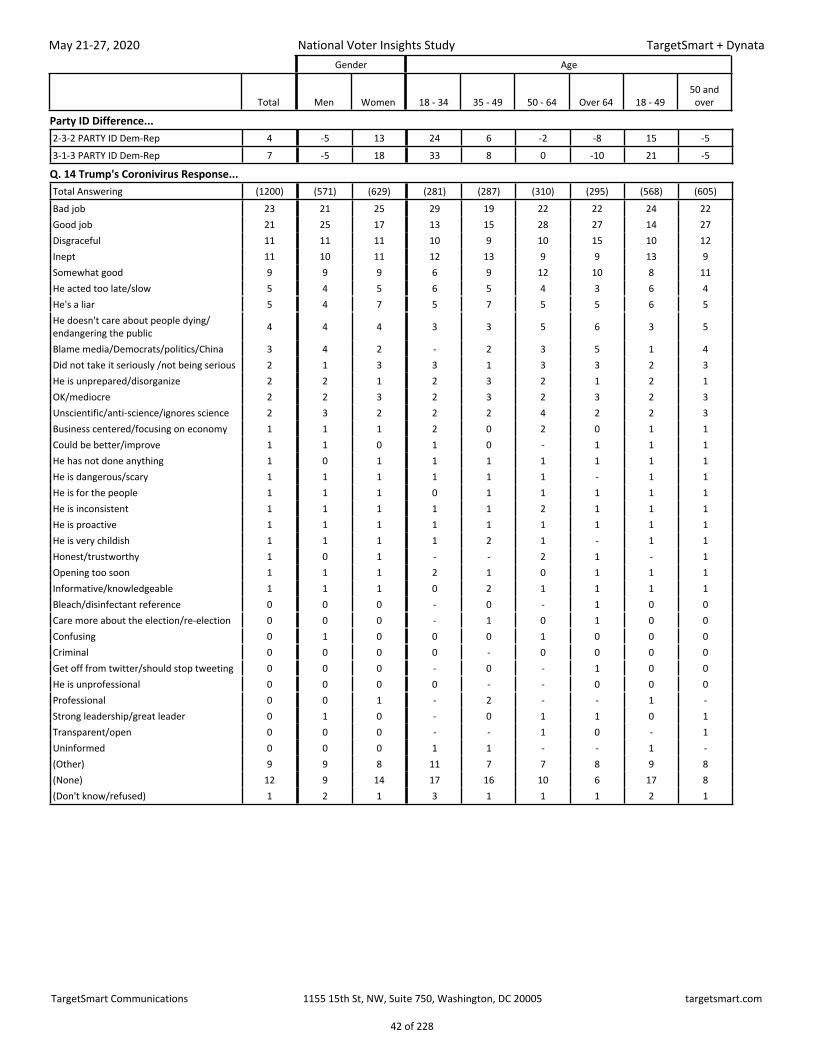
Gender Age
Total Men Women 18 - 34 35 - 49 50 - 64 Over 64 18 - 4950 and
over
Party ID Difference...2-3-2 PARTY ID Dem-Rep 4 -5 13 24 6 -2 -8 15 -53-1-3 PARTY ID Dem-Rep 7 -5 18 33 8 0 -10 21 -5
Q. 5 Trump Job ApprovalTotal Answering (1200) (571) (629) (281) (287) (310) (295) (568) (605)Strongly approve 27 32 24 17 27 33 31 22 32Somewhat approve 17 17 17 21 14 15 16 18 16Somewhat disapprove 9 9 9 11 10 9 6 11 8Strongly disapprove 43 40 46 46 43 40 44 45 42(Unsure/don't know/refused) 4 3 5 5 5 2 3 5 2Total approve 44 48 40 38 42 48 48 40 48Total disapprove 52 49 55 58 53 49 50 55 50Total approve - Total disapprove -8 -1 -15 -20 -12 -1 -2 -16 -1
Q. 6 Presidential VoteTotal Answering (1200) (571) (629) (281) (287) (310) (295) (568) (605)Joe Biden 40 39 41 39 41 38 43 40 40Lean Joe Biden 3 3 4 6 3 2 1 5 2Donald Trump 39 44 35 28 37 46 45 33 46Lean Donald Trump 1 1 1 1 1 1 1 1 1Different candidate 4 4 4 7 5 3 3 6 3Lean Different candidate 1 1 2 3 1 1 1 2 1Would not vote 2 2 3 5 2 1 1 3 1Lean Would not vote 1 1 1 1 1 1 0 1 1(Undecided) 8 6 9 10 9 7 4 10 6Total Joe Biden 43 42 45 45 45 40 45 45 42Total Donald Trump 40 45 36 29 38 47 46 34 47Total Different candidate 6 5 6 9 6 4 3 8 3Total Would not vote 3 3 4 6 2 3 2 4 2Total Biden - Total Trump 3 -3 9 16 6 -7 -2 11 -5
Q. 7 Presidential Vote CertaintyTotal Answering (1200) (571) (629) (281) (287) (310) (295) (568) (605)Strong Biden 31 32 31 25 30 32 39 28 35Weak Biden 12 10 14 20 15 8 6 17 7Strong Trump 30 35 26 16 29 37 39 22 38Weak Trump 10 9 10 13 9 10 7 11 9Strong Different candidate 2 2 2 2 3 1 1 2 1Weak Different candidate 4 3 4 7 4 2 2 5 2Would not vote 3 3 4 6 2 3 2 4 2(Undecided) 8 6 9 10 9 7 4 10 6
Q. 9 Worry About Contracting CoronavirusTotal Answering (1200) (571) (629) (281) (287) (310) (295) (568) (605)Very worried 26 22 29 25 27 27 23 26 25Somewhat worried 38 39 37 43 36 34 40 40 37Not too worried 22 24 20 22 22 19 24 22 22Not worried at all 13 15 12 8 14 17 13 11 15(Don't know/refused) 1 1 2 1 2 2 1 2 2Very/Somewhat worried 64 61 66 69 62 61 62 66 62Not too/Not at all worried 35 38 31 31 36 36 37 33 37
TargetSmart Communications 1155 15th St, NW, Suite 750, Washington, DC 20005 targetsmart.com
6 of 228
Page 7
May 21-27, 2020
National Voter Insights Study
TargetSmart + Dynata
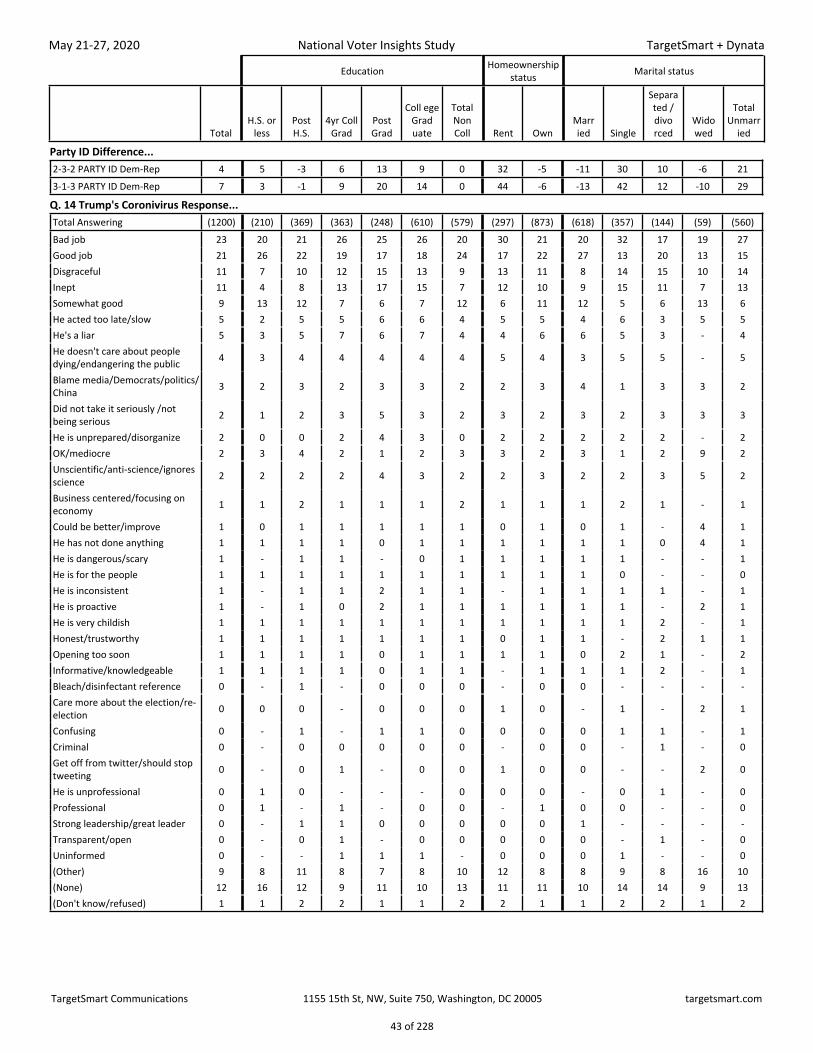
Education Homeownership status Marital status
TotalH.S. or
lessPost H.S.
4yr Coll Grad
Post Grad
Coll ege Grad uate
Total Non Coll Rent Own
Marr ied Single
Separa ted / divo rced
Wido wed
Total Unmarr
ied
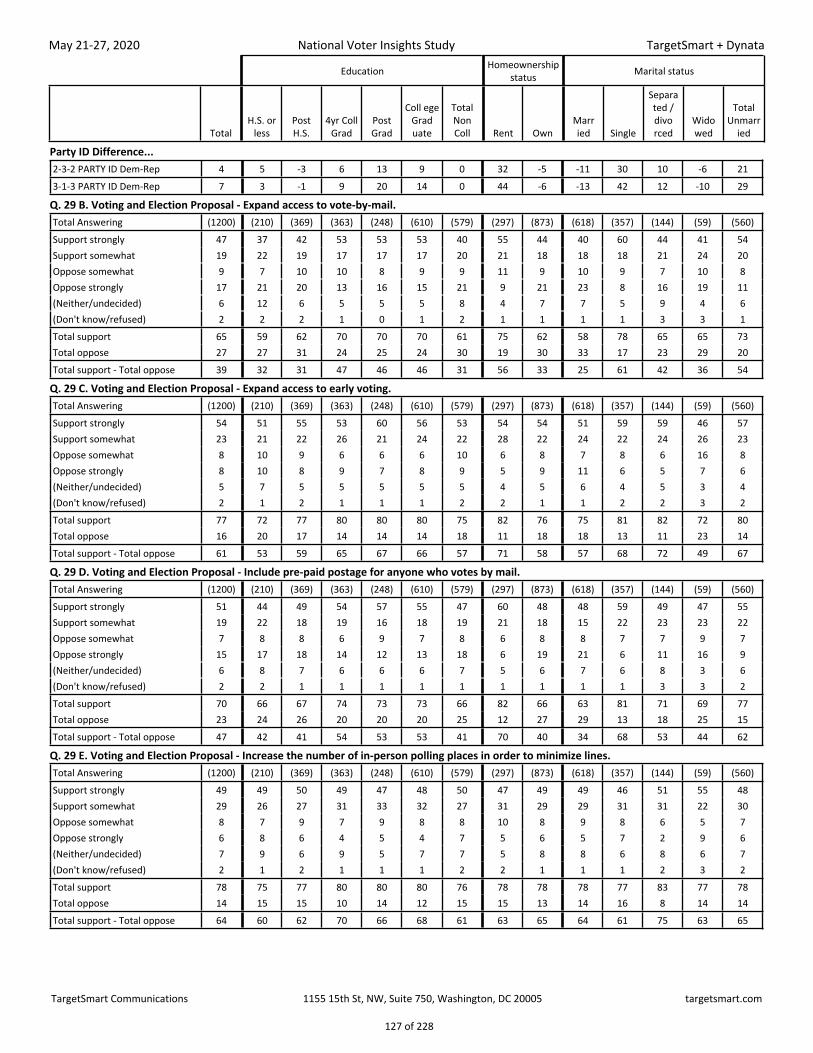
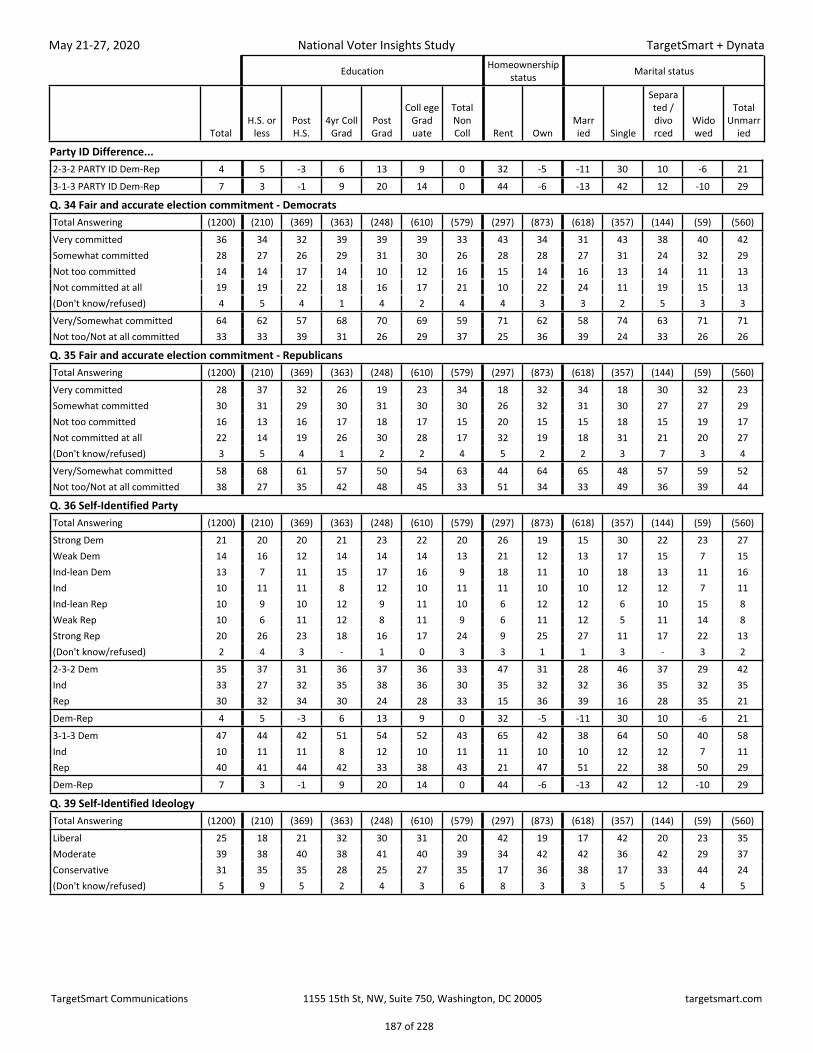
Party ID Difference...2-3-2 PARTY ID Dem-Rep 4 5 -3 6 13 9 0 32 -5 -11 30 10 -6 213-1-3 PARTY ID Dem-Rep 7 3 -1 9 20 14 0 44 -6 -13 42 12 -10 29
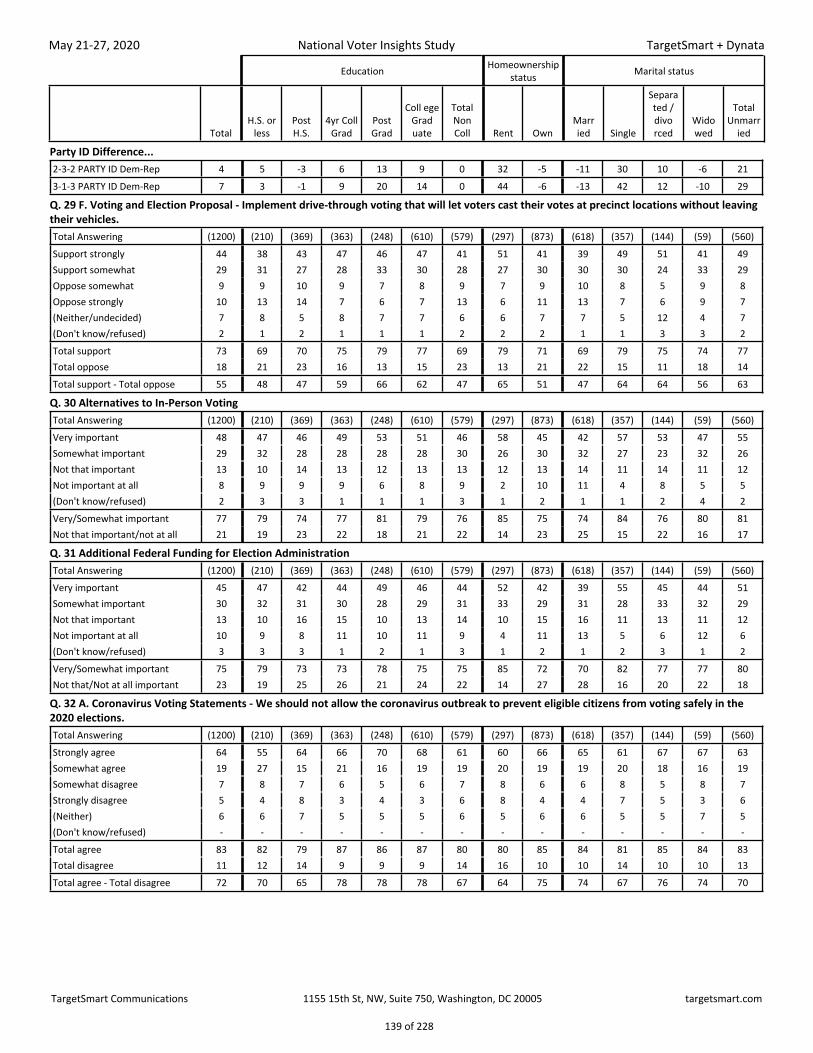
Q. 5 Trump Job ApprovalTotal Answering (1200) (210) (369) (363) (248) (610) (579) (297) (873) (618) (357) (144) (59) (560)Strongly approve 27 36 31 24 20 22 33 15 32 35 16 25 27 19Somewhat approve 17 15 17 20 14 17 16 16 17 17 16 14 27 17Somewhat disapprove 9 11 10 7 9 8 11 8 10 9 9 11 6 9Strongly disapprove 43 33 38 47 55 50 36 56 39 35 55 48 39 52(Unsure/don't know/refused) 4 5 5 2 2 2 5 4 3 3 3 2 1 3Total approve 44 51 48 44 34 40 49 32 49 52 32 39 54 36Total disapprove 52 44 48 54 64 58 46 64 48 45 65 59 45 61Total approve - Total disapprove -8 7 0 -11 -30 -19 2 -32 0 8 -33 -21 9 -25
Q. 6 Presidential VoteTotal Answering (1200) (210) (369) (363) (248) (610) (579) (297) (873) (618) (357) (144) (59) (560)Joe Biden 40 30 33 44 54 48 32 47 38 34 50 46 31 47Lean Joe Biden 3 4 4 3 3 3 4 6 3 2 6 2 5 5Donald Trump 39 45 45 37 31 35 45 24 45 49 23 38 48 29Lean Donald Trump 1 1 0 2 0 1 1 1 1 1 1 1 1 1Different candidate 4 4 6 3 4 3 5 4 4 4 5 6 - 5Lean Different candidate 1 1 2 2 1 2 1 3 1 1 2 1 2 2Would not vote 2 3 2 1 2 2 3 4 1 2 3 2 4 2Lean Would not vote 1 2 1 1 0 1 1 2 1 1 1 1 5 1(Undecided) 8 10 8 7 5 6 8 10 7 7 9 4 5 8Total Joe Biden 43 34 36 47 57 51 35 53 40 36 56 48 36 52Total Donald Trump 40 46 45 39 31 36 45 25 46 50 24 39 49 30Total Different candidate 6 5 8 5 5 5 7 7 6 5 8 7 2 7Total Would not vote 3 5 3 2 2 2 4 6 2 2 3 3 9 4Total Biden - Total Trump 3 -13 -9 8 26 15 -10 27 -6 -14 32 9 -13 21
Q. 7 Presidential Vote CertaintyTotal Answering (1200) (210) (369) (363) (248) (610) (579) (297) (873) (618) (357) (144) (59) (560)Strong Biden 31 22 26 34 44 38 25 33 31 27 37 36 29 36Weak Biden 12 11 11 13 13 13 11 19 9 9 19 11 7 16Strong Trump 30 38 36 27 22 25 37 13 37 40 14 32 37 21Weak Trump 10 9 9 12 10 11 9 12 9 10 10 7 12 9Strong Different candidate 2 3 3 1 1 1 3 2 2 2 2 3 - 2Weak Different candidate 4 2 5 4 4 4 4 4 4 3 6 4 2 5Would not vote 3 5 3 2 2 2 4 6 2 2 3 3 9 4(Undecided) 8 10 8 7 5 6 8 10 7 7 9 4 5 8
Q. 9 Worry About Contracting CoronavirusTotal Answering (1200) (210) (369) (363) (248) (610) (579) (297) (873) (618) (357) (144) (59) (560)Very worried 26 31 25 21 30 25 27 35 23 23 28 31 32 29Somewhat worried 38 31 39 41 42 41 36 38 39 35 44 40 32 42Not too worried 22 21 21 25 20 23 21 19 23 26 19 11 23 18Not worried at all 13 16 15 13 8 11 15 7 15 15 9 15 12 11(Don't know/refused) 1 2 1 1 0 1 1 1 1 1 0 2 1 1Very/Somewhat worried 64 62 63 62 72 66 63 73 62 58 72 72 64 71Not too/Not at all worried 35 36 36 37 28 34 36 26 38 41 28 26 34 28
TargetSmart Communications 1155 15th St, NW, Suite 750, Washington, DC 20005 targetsmart.com
7 of 228
Page 8
May 21-27, 2020
National Voter Insights Study
TargetSmart + Dynata
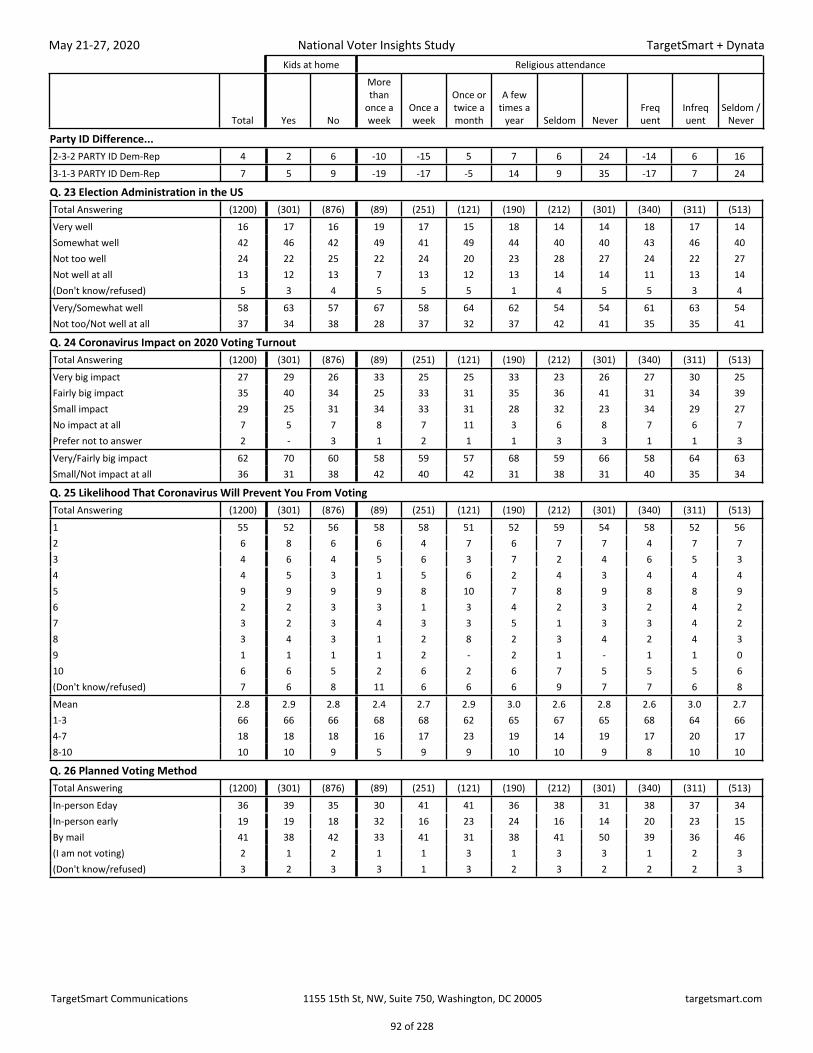
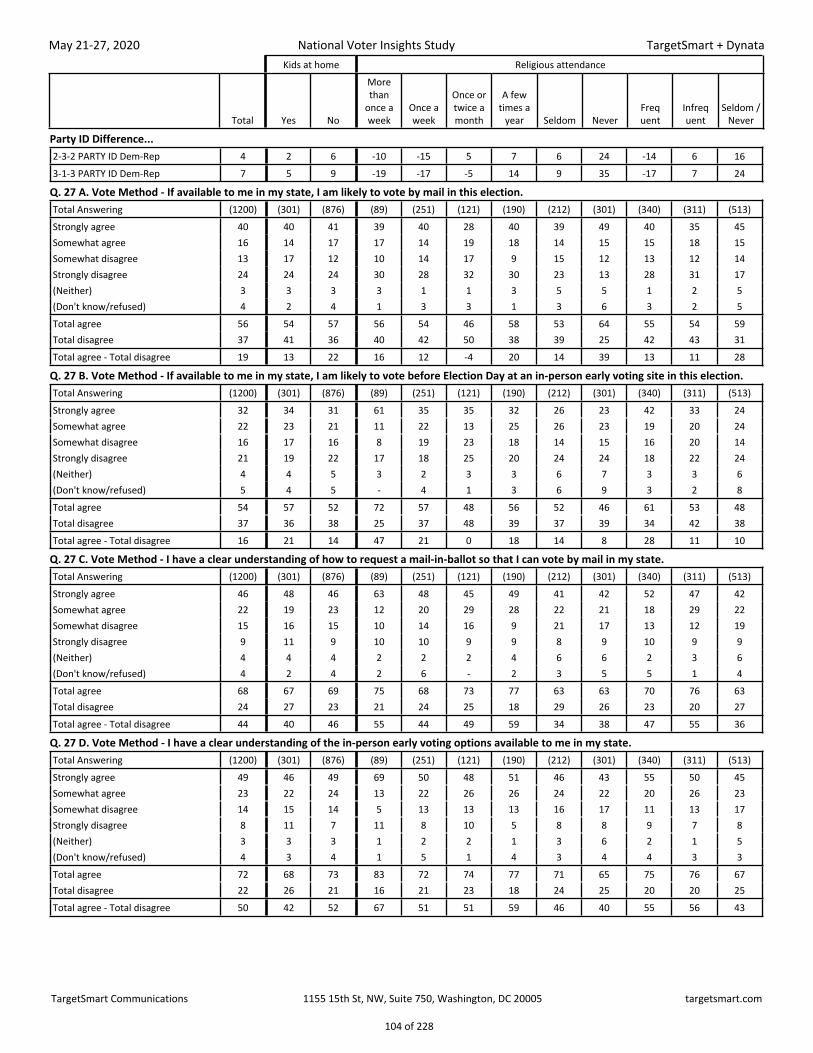
Kids at home Religious attendance
Total Yes No
More than
once a week
Once a week
Once or twice a month
A few times a
year Seldom NeverFreq uent
Infreq uent
Seldom / Never
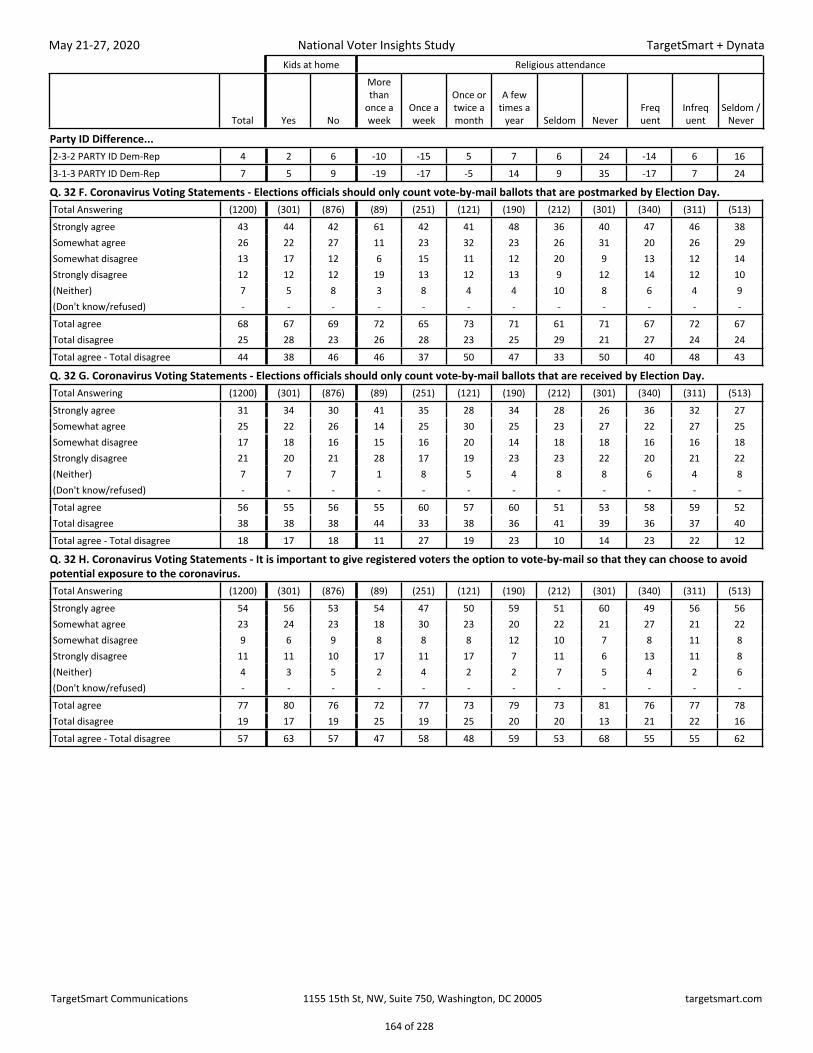
Party ID Difference...2-3-2 PARTY ID Dem-Rep 4 2 6 -10 -15 5 7 6 24 -14 6 163-1-3 PARTY ID Dem-Rep 7 5 9 -19 -17 -5 14 9 35 -17 7 24
Q. 5 Trump Job ApprovalTotal Answering (1200) (301) (876) (89) (251) (121) (190) (212) (301) (340) (311) (513)Strongly approve 27 28 27 36 33 29 27 31 17 34 28 23Somewhat approve 17 18 17 17 20 25 14 17 12 19 18 14Somewhat disapprove 9 12 8 7 5 11 13 7 13 6 12 10Strongly disapprove 43 38 45 35 39 31 44 43 55 38 39 50(Unsure/don't know/refused) 4 4 3 4 4 4 3 3 3 4 3 3Total approve 44 46 44 54 53 54 41 48 30 53 46 37Total disapprove 52 50 54 42 44 42 57 50 67 43 51 60Total approve - Total disapprove -8 -5 -10 12 9 12 -16 -2 -38 10 -5 -23
Q. 6 Presidential VoteTotal Answering (1200) (301) (876) (89) (251) (121) (190) (212) (301) (340) (311) (513)Joe Biden 40 35 42 26 32 29 44 43 52 30 38 49Lean Joe Biden 3 4 3 3 3 5 4 4 2 3 4 3Donald Trump 39 41 39 47 49 44 37 41 27 49 40 33Lean Donald Trump 1 1 1 2 1 5 0 0 - 1 2 0Different candidate 4 6 4 6 5 6 2 2 5 5 4 4Lean Different candidate 1 1 2 2 1 2 2 2 1 1 2 1Would not vote 2 1 2 3 2 - 3 1 3 3 2 2Lean Would not vote 1 2 1 3 0 2 1 0 1 1 1 1(Undecided) 8 9 7 8 7 7 8 6 9 7 7 8Total Joe Biden 43 40 45 29 35 34 47 47 54 33 42 51Total Donald Trump 40 41 40 49 50 49 37 42 27 50 42 33Total Different candidate 6 7 5 7 6 8 5 4 6 6 6 5Total Would not vote 3 2 3 7 3 2 3 2 4 4 3 3Total Biden - Total Trump 3 -2 5 -20 -15 -15 10 6 27 -17 0 18
Q. 7 Presidential Vote CertaintyTotal Answering (1200) (301) (876) (89) (251) (121) (190) (212) (301) (340) (311) (513)Strong Biden 31 25 34 23 26 20 33 33 43 25 28 39Weak Biden 12 15 11 6 9 14 14 14 11 8 14 12Strong Trump 30 29 31 41 38 28 29 34 20 39 29 26Weak Trump 10 12 9 8 13 21 8 8 7 11 13 7Strong Different candidate 2 3 2 2 2 2 2 2 2 2 2 2Weak Different candidate 4 5 3 5 4 6 3 2 4 4 4 3Would not vote 3 2 3 7 3 2 3 2 4 4 3 3(Undecided) 8 9 7 8 7 7 8 6 9 7 7 8
Q. 9 Worry About Contracting CoronavirusTotal Answering (1200) (301) (876) (89) (251) (121) (190) (212) (301) (340) (311) (513)Very worried 26 29 25 29 20 20 36 27 25 22 30 26Somewhat worried 38 36 39 27 41 42 38 37 41 37 39 40Not too worried 22 21 22 24 24 18 21 23 21 24 20 22Not worried at all 13 13 13 20 15 19 6 12 12 16 11 12(Don't know/refused) 1 0 1 - 2 1 - 2 - 1 0 1Very/Somewhat worried 64 65 64 56 60 62 73 64 67 59 69 65Not too/Not at all worried 35 34 35 44 39 37 27 34 33 40 31 34
TargetSmart Communications 1155 15th St, NW, Suite 750, Washington, DC 20005 targetsmart.com
8 of 228
Page 9
May 21-27, 2020
National Voter Insights Study
TargetSmart + Dynata
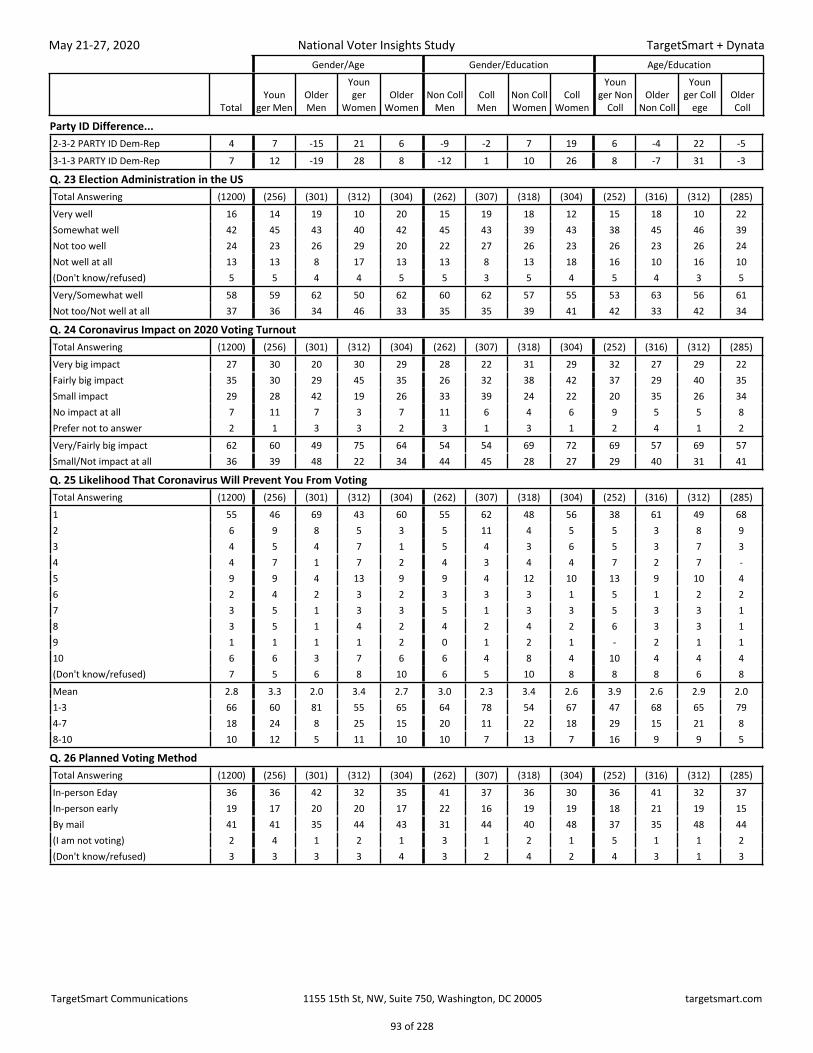
Gender/Age Gender/Education Age/Education
TotalYoun
ger MenOlder Men
Youn ger
WomenOlder
WomenNon Coll
MenColl Men
Non Coll Women
Coll Women
Youn ger Non
CollOlder
Non Coll
Youn ger Coll
egeOlder Coll
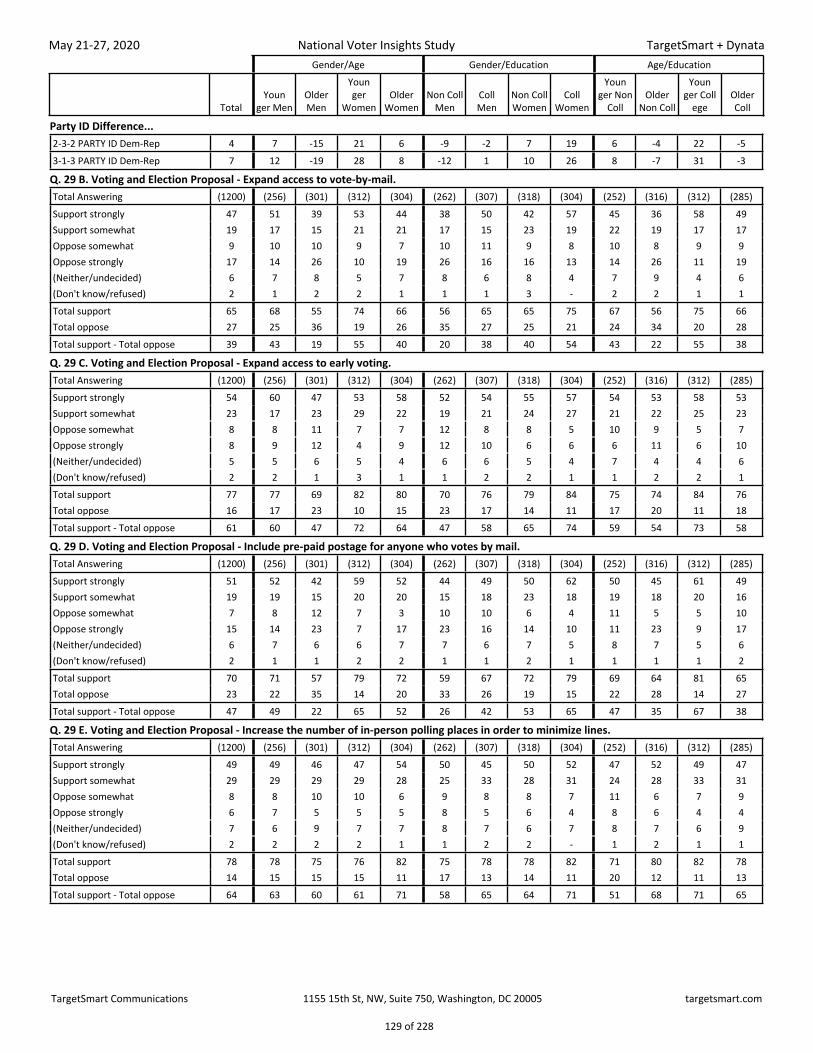
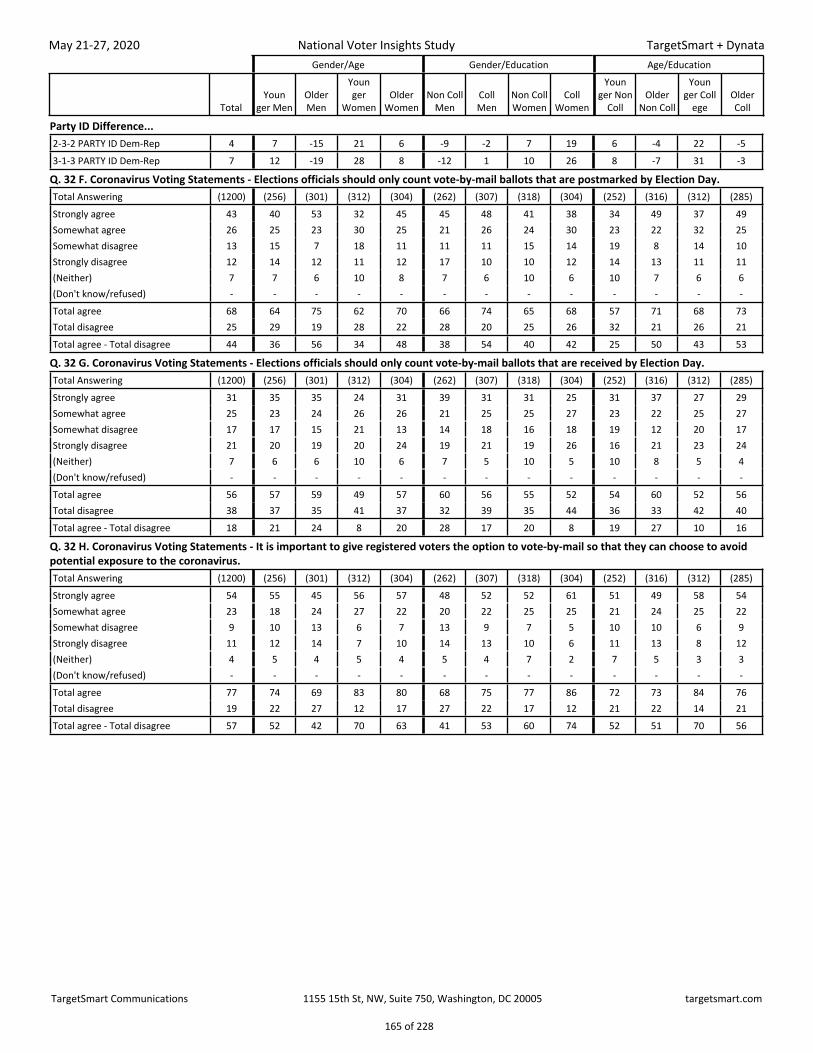
Party ID Difference...2-3-2 PARTY ID Dem-Rep 4 7 -15 21 6 -9 -2 7 19 6 -4 22 -53-1-3 PARTY ID Dem-Rep 7 12 -19 28 8 -12 1 10 26 8 -7 31 -3
Q. 5 Trump Job ApprovalTotal Answering (1200) (256) (301) (312) (304) (262) (307) (318) (304) (252) (316) (312) (285)Strongly approve 27 26 36 19 29 38 26 29 19 27 38 18 26Somewhat approve 17 17 17 18 15 16 17 16 18 17 15 18 17Somewhat disapprove 9 10 8 11 8 9 8 12 8 15 8 8 8Strongly disapprove 43 42 38 47 45 33 46 39 55 34 37 54 47(Unsure/don't know/refused) 4 4 2 6 3 4 2 6 2 7 2 2 2Total approve 44 43 52 37 44 54 43 44 36 44 53 37 43Total disapprove 52 52 46 58 53 42 55 50 62 49 45 61 55Total approve - Total disapprove -8 -9 6 -21 -9 12 -12 -6 -26 -5 8 -25 -13
Q. 6 Presidential VoteTotal Answering (1200) (256) (301) (312) (304) (262) (307) (318) (304) (252) (316) (312) (285)Joe Biden 40 40 38 40 43 31 45 32 51 29 35 50 47Lean Joe Biden 3 5 1 5 2 3 3 4 3 5 3 5 1Donald Trump 39 35 52 32 39 49 39 41 30 39 50 28 41Lean Donald Trump 1 2 1 - 2 0 2 1 1 - 1 1 1Different candidate 4 6 2 6 3 5 4 6 3 9 2 4 3Lean Different candidate 1 2 - 2 1 1 1 2 2 2 1 2 1Would not vote 2 2 2 5 1 2 1 3 2 5 1 2 2Lean Would not vote 1 1 1 1 1 2 - 1 1 1 1 1 0(Undecided) 8 9 4 10 8 7 6 10 7 11 6 8 5Total Joe Biden 43 45 39 45 45 34 48 36 54 34 38 55 48Total Donald Trump 40 36 53 32 41 50 41 42 31 39 51 30 42Total Different candidate 6 8 2 8 5 5 5 8 5 10 3 6 4Total Would not vote 3 3 2 6 2 4 1 5 3 6 2 2 2Total Biden - Total Trump 3 9 -13 13 4 -15 7 -6 24 -6 -13 25 6
Q. 7 Presidential Vote CertaintyTotal Answering (1200) (256) (301) (312) (304) (262) (307) (318) (304) (252) (316) (312) (285)Strong Biden 31 29 35 27 36 26 36 23 40 19 30 35 42Weak Biden 12 16 5 18 9 8 11 13 15 15 8 20 6Strong Trump 30 26 43 19 33 43 29 31 21 29 43 17 33Weak Trump 10 10 9 12 8 6 12 11 10 10 8 12 10Strong Different candidate 2 2 1 2 2 2 1 4 1 4 2 1 1Weak Different candidate 4 5 2 5 3 3 4 4 4 6 2 5 3Would not vote 3 3 2 6 2 4 1 5 3 6 2 2 2(Undecided) 8 9 4 10 8 7 6 10 7 11 6 8 5
Q. 9 Worry About Contracting CoronavirusTotal Answering (1200) (256) (301) (312) (304) (262) (307) (318) (304) (252) (316) (312) (285)Very worried 26 23 21 28 30 23 21 31 28 27 27 25 24Somewhat worried 38 38 40 41 34 37 41 35 41 36 35 43 39Not too worried 22 24 24 21 19 21 27 21 19 21 21 23 23Not worried at all 13 13 16 9 15 19 11 12 11 14 16 8 14(Don't know/refused) 1 1 - 2 3 0 0 2 1 1 2 1 1Very/Somewhat worried 64 61 61 69 63 60 63 65 69 64 62 68 63Not too/Not at all worried 35 38 40 30 34 40 37 33 30 36 37 32 36
TargetSmart Communications 1155 15th St, NW, Suite 750, Washington, DC 20005 targetsmart.com
9 of 228
Page 10
May 21-27, 2020
National Voter Insights Study
TargetSmart + Dynata
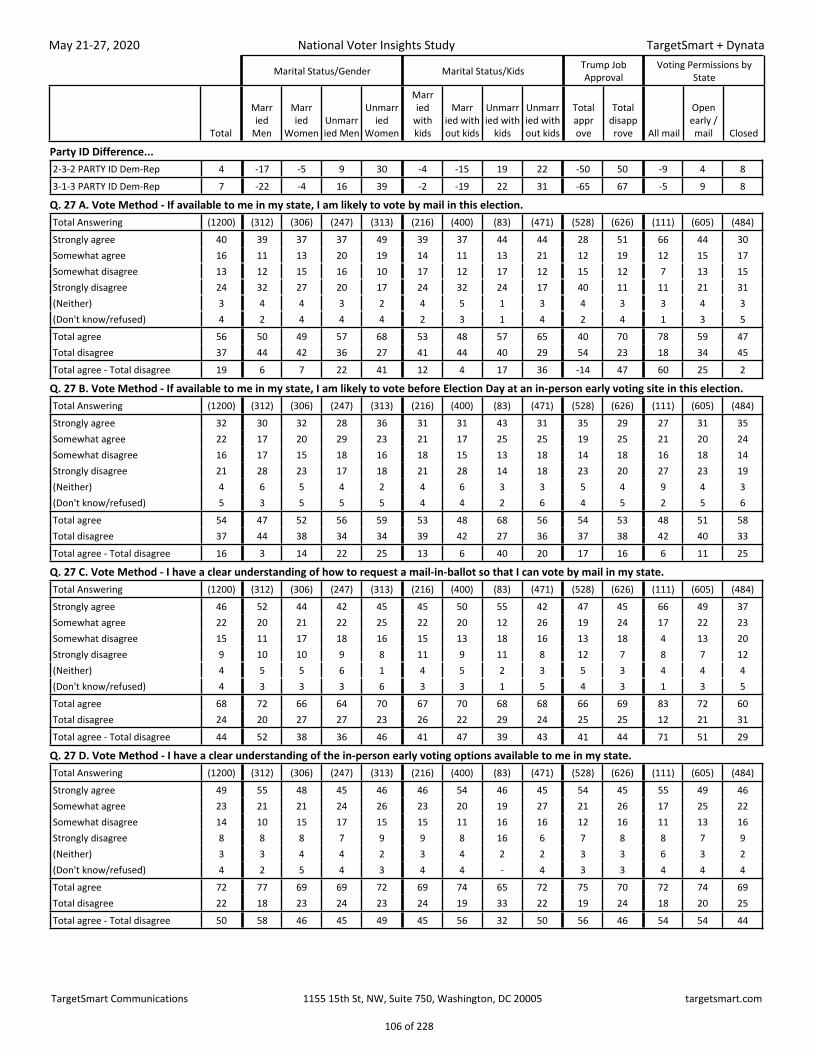
Marital Status/Gender Marital Status/Kids Trump Job Approval
Voting Permissions by State
Total
Marr ied
Men
Marr ied
WomenUnmarr ied Men
Unmarr ied
Women
Marr ied
with kids
Marr ied with out kids
Unmarr ied with
kids
Unmarr ied with out kids
Total appr ove
Total disapp rove All mail
Open early / mail Closed
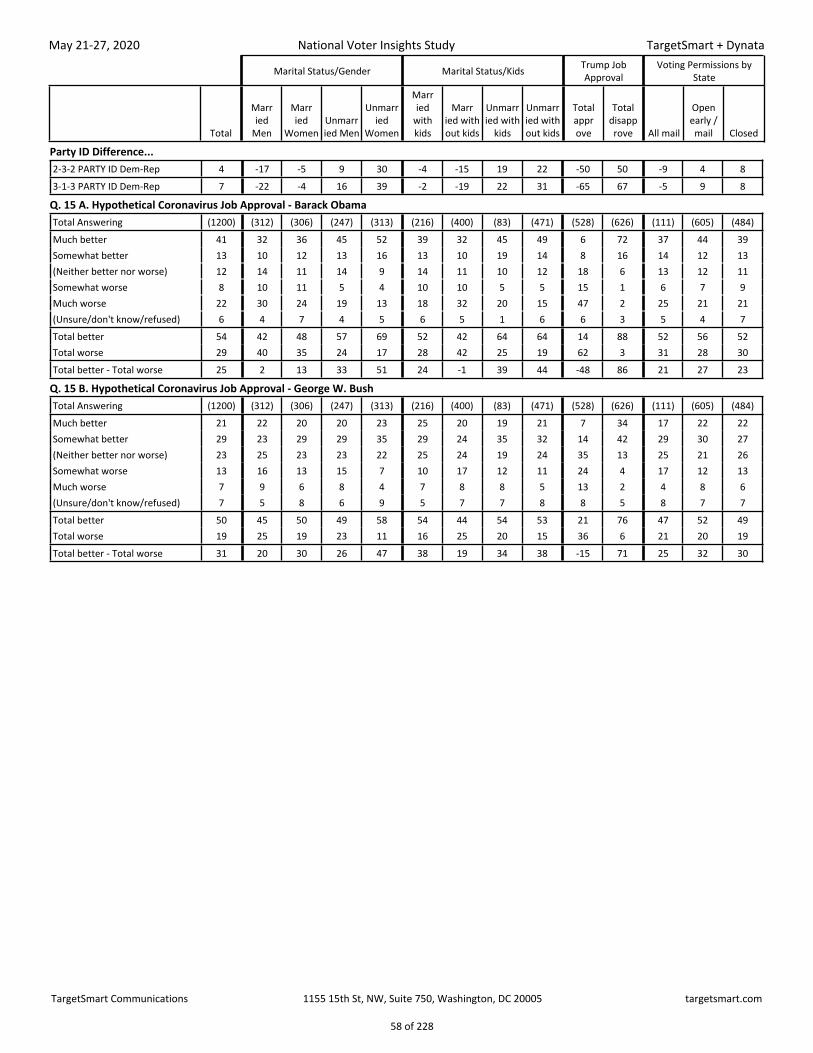
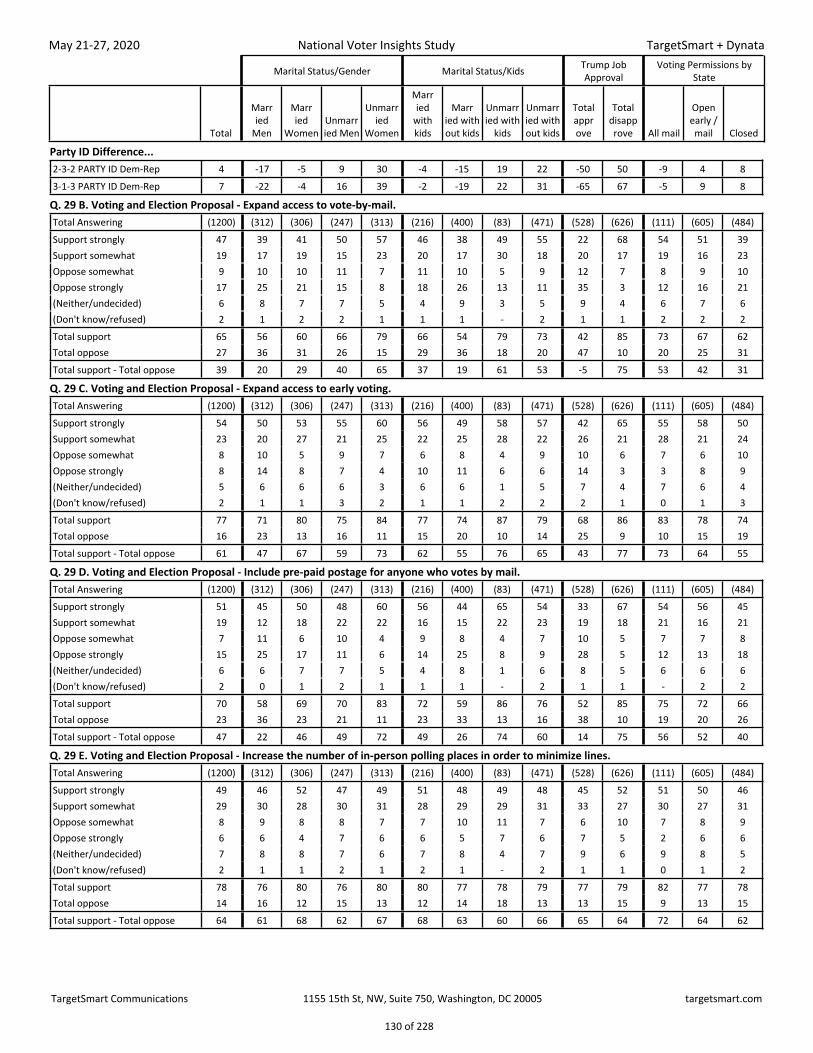
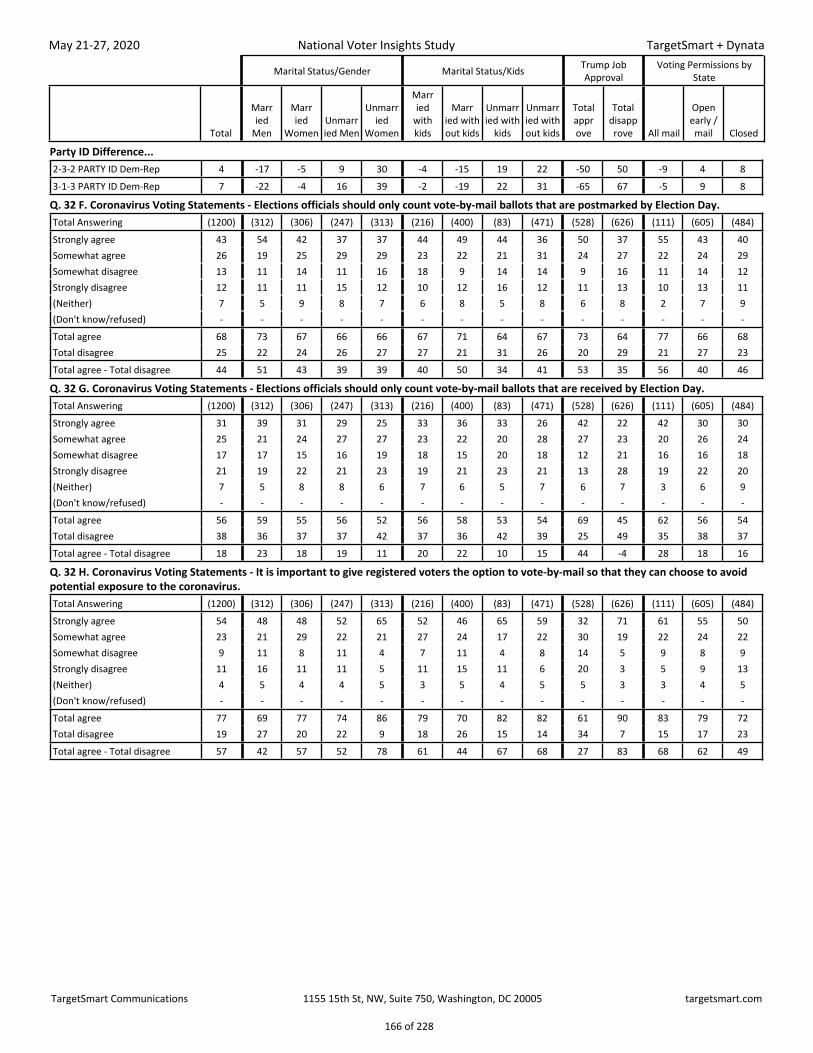
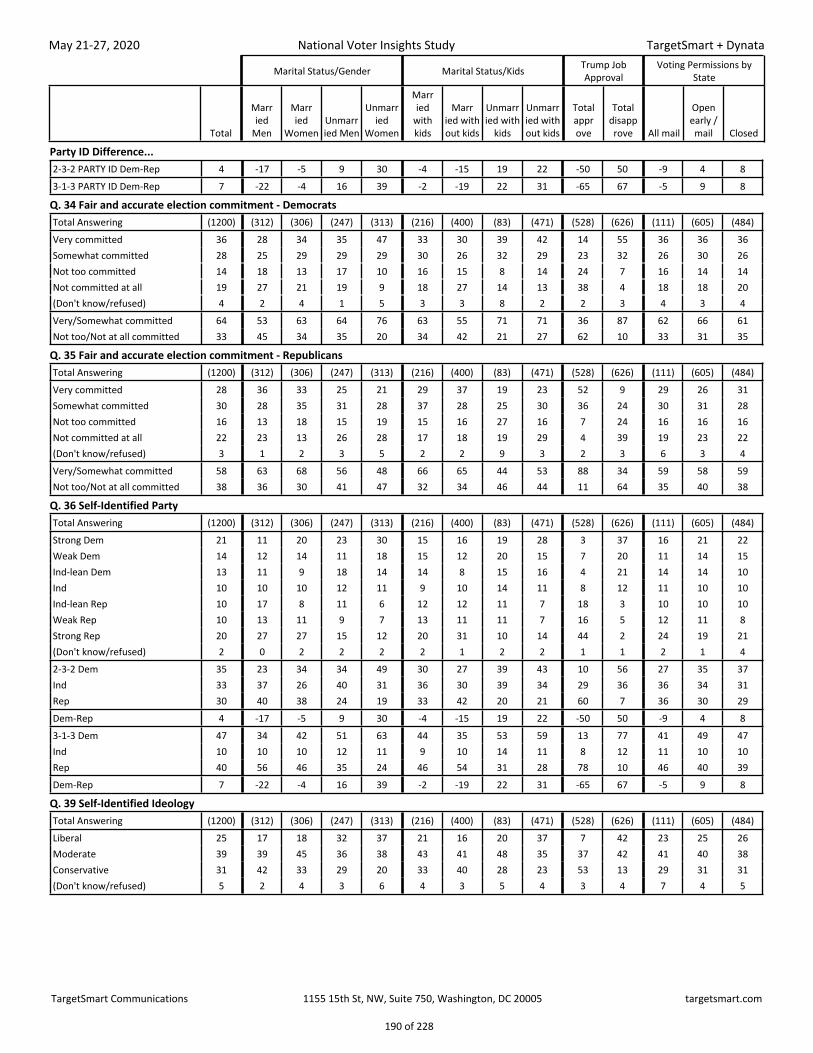
Party ID Difference...2-3-2 PARTY ID Dem-Rep 4 -17 -5 9 30 -4 -15 19 22 -50 50 -9 4 83-1-3 PARTY ID Dem-Rep 7 -22 -4 16 39 -2 -19 22 31 -65 67 -5 9 8
Q. 5 Trump Job ApprovalTotal Answering (1200) (312) (306) (247) (313) (216) (400) (83) (471) (528) (626) (111) (605) (484)Strongly approve 27 38 32 24 16 29 38 26 18 62 - 28 26 29Somewhat approve 17 15 19 19 15 21 15 11 18 38 - 15 18 15Somewhat disapprove 9 10 9 8 10 11 8 15 8 - 17 13 8 9Strongly disapprove 43 34 37 47 56 35 36 46 53 - 83 38 44 43(Unsure/don't know/refused) 4 3 4 2 3 4 3 2 3 - - 7 3 4Total approve 44 54 51 43 31 49 54 37 36 100 - 43 45 44Total disapprove 52 44 46 55 66 46 44 61 62 - 100 51 52 52Total approve - Total disapprove -8 10 5 -13 -35 3 10 -24 -26 100 -100 -8 -8 -9
Q. 6 Presidential VoteTotal Answering (1200) (312) (306) (247) (313) (216) (400) (83) (471) (528) (626) (111) (605) (484)Joe Biden 40 35 32 43 50 34 34 40 49 4 72 35 43 37Lean Joe Biden 3 2 2 4 5 4 1 4 5 1 5 1 3 4Donald Trump 39 52 46 34 26 44 52 33 28 86 3 41 39 39Lean Donald Trump 1 0 1 2 1 1 1 - 1 1 0 1 1 1Different candidate 4 3 4 5 5 6 3 8 4 1 7 7 3 6Lean Different candidate 1 - 2 2 2 2 1 0 2 1 2 1 1 2Would not vote 2 2 2 2 3 1 2 2 2 1 3 1 2 3Lean Would not vote 1 1 0 1 2 1 1 3 1 1 1 1 1 1(Undecided) 8 5 10 8 7 9 6 10 7 4 8 13 7 8Total Joe Biden 43 37 35 48 55 38 35 44 53 5 78 36 46 41Total Donald Trump 40 53 47 36 26 45 53 33 30 87 3 41 40 40Total Different candidate 6 3 6 7 7 7 4 8 7 2 8 8 4 7Total Would not vote 3 2 2 2 5 1 3 5 3 1 4 2 3 4Total Biden - Total Trump 3 -16 -12 12 29 -7 -18 11 24 -82 75 -6 6 1
Q. 7 Presidential Vote CertaintyTotal Answering (1200) (312) (306) (247) (313) (216) (400) (83) (471) (528) (626) (111) (605) (484)Strong Biden 31 30 24 34 38 24 29 27 38 2 58 26 35 28Weak Biden 12 7 10 14 17 14 6 17 16 3 20 10 11 13Strong Trump 30 44 35 26 17 30 45 27 20 69 1 32 29 32Weak Trump 10 9 12 10 9 15 8 7 10 18 2 9 11 8Strong Different candidate 2 2 2 2 3 2 2 5 2 0 3 5 1 2Weak Different candidate 4 2 4 5 4 5 2 3 5 2 5 3 3 5Would not vote 3 2 2 2 5 1 3 5 3 1 4 2 3 4(Undecided) 8 5 10 8 7 9 6 10 7 4 8 13 7 8
Q. 9 Worry About Contracting CoronavirusTotal Answering (1200) (312) (306) (247) (313) (216) (400) (83) (471) (528) (626) (111) (605) (484)Very worried 26 22 24 22 35 24 22 44 26 12 38 21 25 27Somewhat worried 38 37 34 42 42 39 34 30 44 32 45 38 40 37Not too worried 22 26 26 22 14 25 27 13 19 33 12 20 23 20Not worried at all 13 15 16 14 8 13 16 14 10 23 4 19 11 14(Don't know/refused) 1 - 1 1 1 0 1 - 1 0 1 2 1 2Very/Somewhat worried 64 59 57 64 77 62 56 74 71 44 83 59 65 64Not too/Not at all worried 35 41 42 36 22 38 43 27 28 56 16 39 35 34
TargetSmart Communications 1155 15th St, NW, Suite 750, Washington, DC 20005 targetsmart.com
10 of 228
Page 11
May 21-27, 2020
National Voter Insights Study
TargetSmart + Dynata
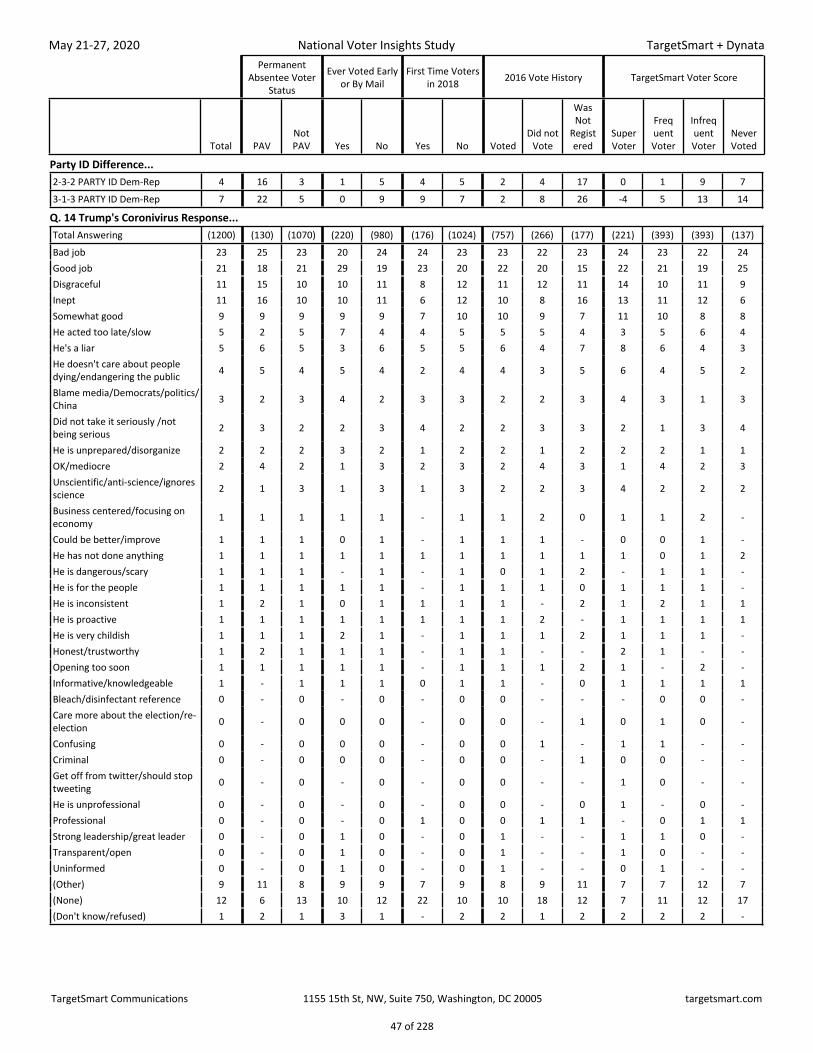
Permanent Absentee Voter
Status
Ever Voted Early or By Mail
First Time Voters in 2018 2016 Vote History TargetSmart Voter Score
Total PAVNot PAV Yes No Yes No Voted
Did not Vote
Was Not
Regist ered
Super Voter
Freq uent Voter
Infreq uent Voter
Never Voted
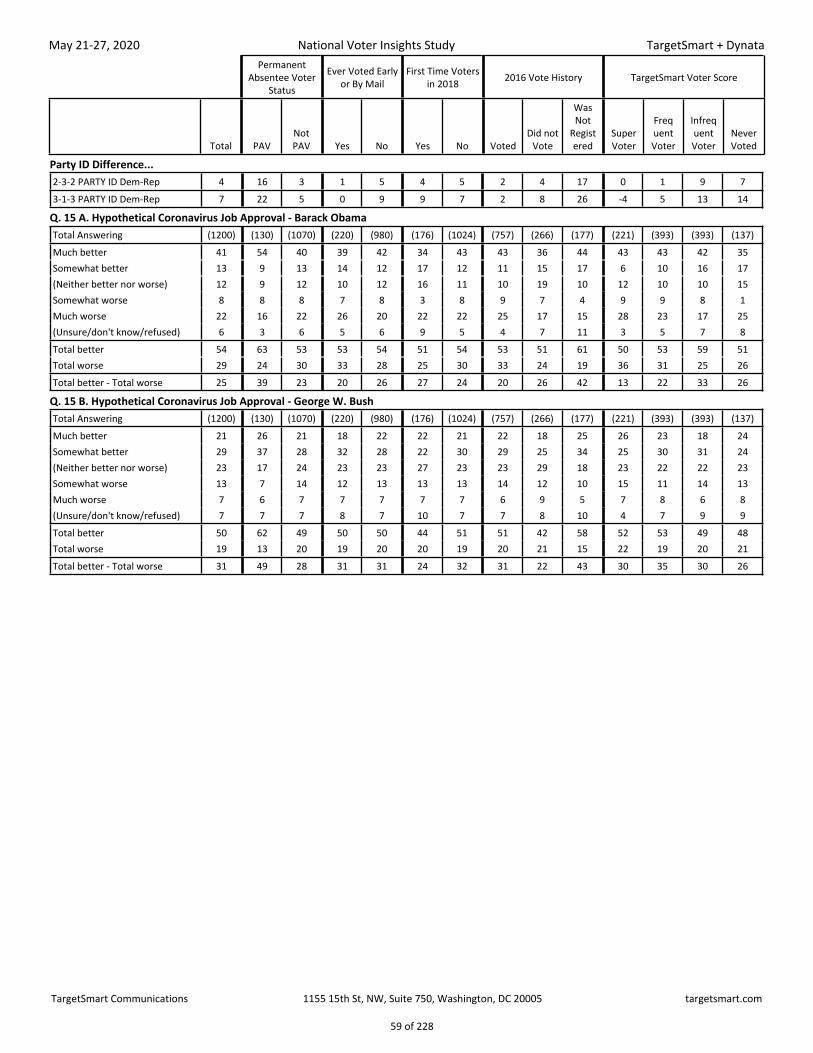
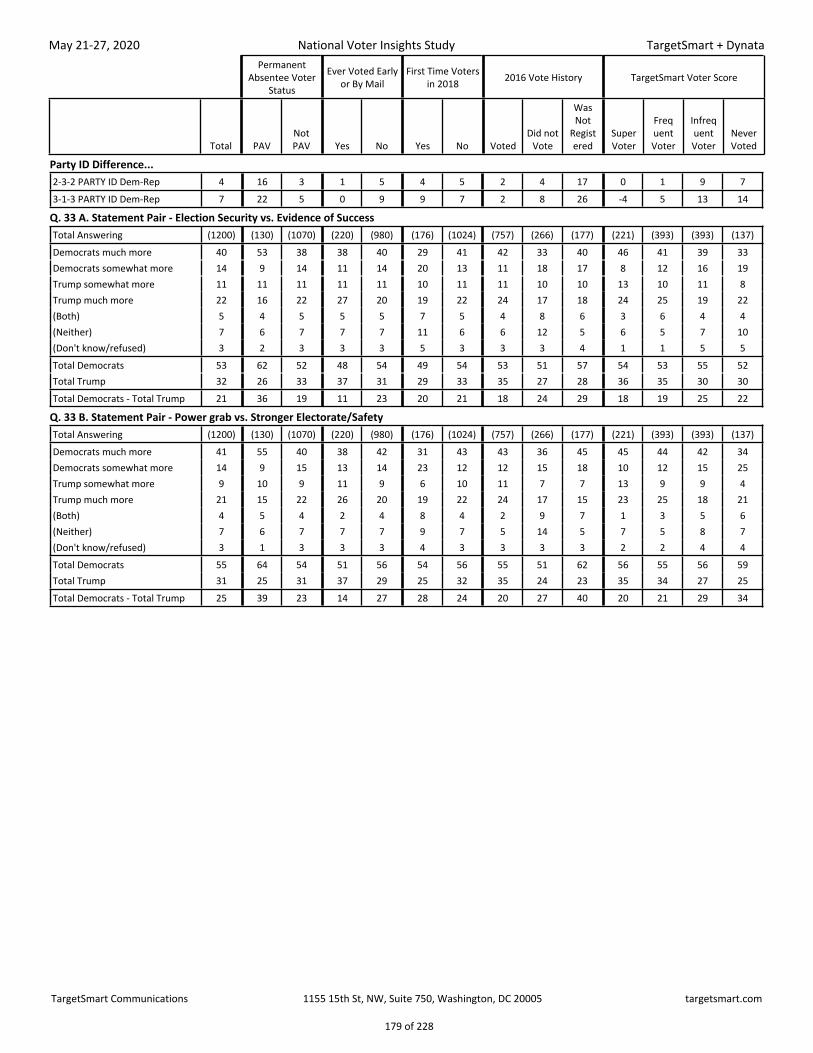
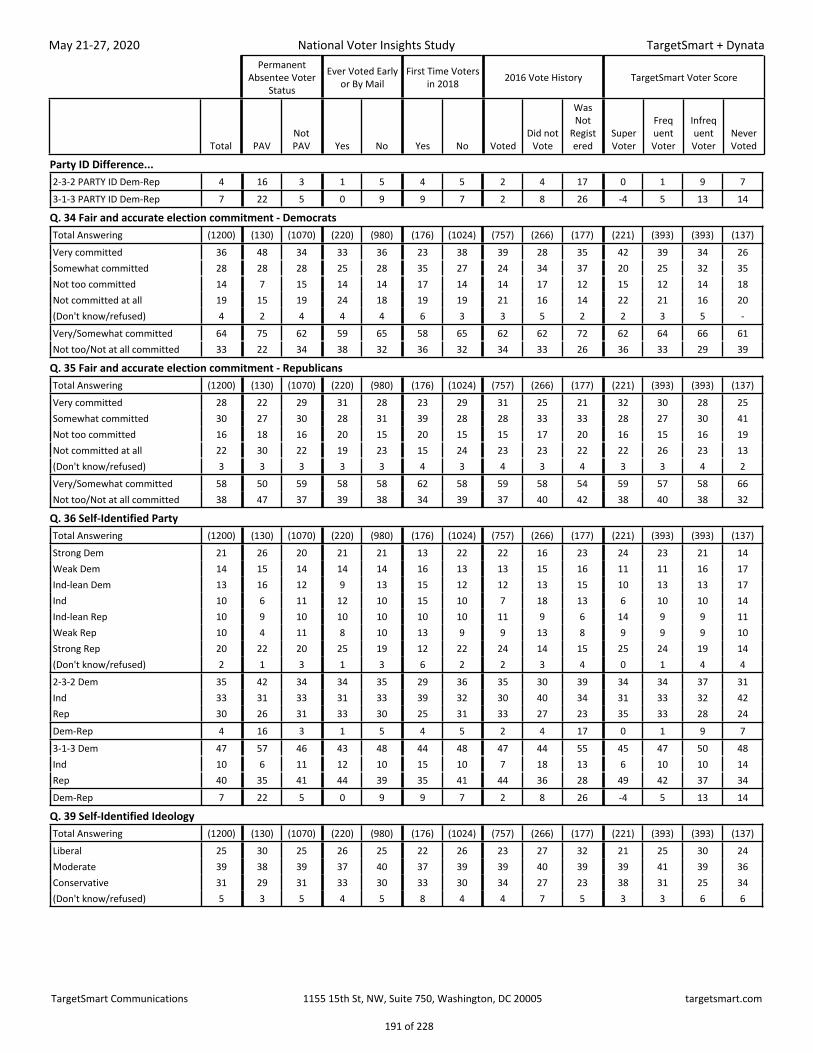
Party ID Difference...2-3-2 PARTY ID Dem-Rep 4 16 3 1 5 4 5 2 4 17 0 1 9 73-1-3 PARTY ID Dem-Rep 7 22 5 0 9 9 7 2 8 26 -4 5 13 14
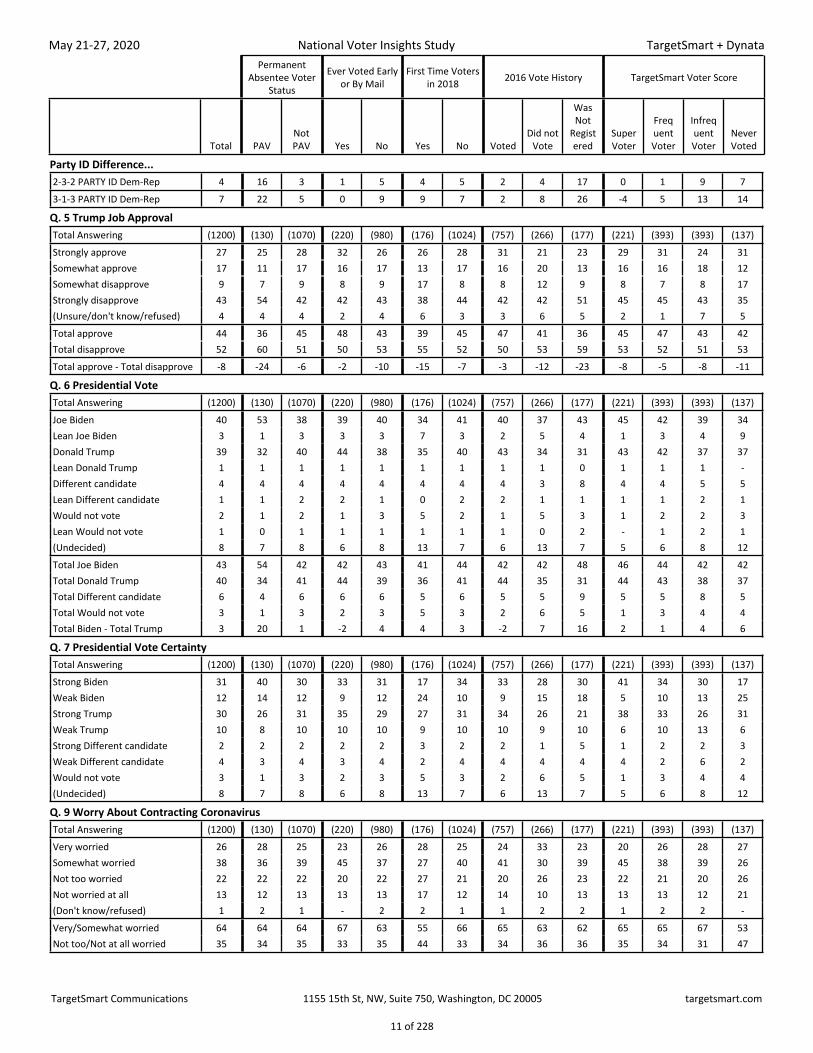
Q. 5 Trump Job ApprovalTotal Answering (1200) (130) (1070) (220) (980) (176) (1024) (757) (266) (177) (221) (393) (393) (137)Strongly approve 27 25 28 32 26 26 28 31 21 23 29 31 24 31Somewhat approve 17 11 17 16 17 13 17 16 20 13 16 16 18 12Somewhat disapprove 9 7 9 8 9 17 8 8 12 9 8 7 8 17Strongly disapprove 43 54 42 42 43 38 44 42 42 51 45 45 43 35(Unsure/don't know/refused) 4 4 4 2 4 6 3 3 6 5 2 1 7 5Total approve 44 36 45 48 43 39 45 47 41 36 45 47 43 42Total disapprove 52 60 51 50 53 55 52 50 53 59 53 52 51 53Total approve - Total disapprove -8 -24 -6 -2 -10 -15 -7 -3 -12 -23 -8 -5 -8 -11
Q. 6 Presidential VoteTotal Answering (1200) (130) (1070) (220) (980) (176) (1024) (757) (266) (177) (221) (393) (393) (137)Joe Biden 40 53 38 39 40 34 41 40 37 43 45 42 39 34Lean Joe Biden 3 1 3 3 3 7 3 2 5 4 1 3 4 9Donald Trump 39 32 40 44 38 35 40 43 34 31 43 42 37 37Lean Donald Trump 1 1 1 1 1 1 1 1 1 0 1 1 1 -Different candidate 4 4 4 4 4 4 4 4 3 8 4 4 5 5Lean Different candidate 1 1 2 2 1 0 2 2 1 1 1 1 2 1Would not vote 2 1 2 1 3 5 2 1 5 3 1 2 2 3Lean Would not vote 1 0 1 1 1 1 1 1 0 2 - 1 2 1(Undecided) 8 7 8 6 8 13 7 6 13 7 5 6 8 12Total Joe Biden 43 54 42 42 43 41 44 42 42 48 46 44 42 42Total Donald Trump 40 34 41 44 39 36 41 44 35 31 44 43 38 37Total Different candidate 6 4 6 6 6 5 6 5 5 9 5 5 8 5Total Would not vote 3 1 3 2 3 5 3 2 6 5 1 3 4 4Total Biden - Total Trump 3 20 1 -2 4 4 3 -2 7 16 2 1 4 6
Q. 7 Presidential Vote CertaintyTotal Answering (1200) (130) (1070) (220) (980) (176) (1024) (757) (266) (177) (221) (393) (393) (137)Strong Biden 31 40 30 33 31 17 34 33 28 30 41 34 30 17Weak Biden 12 14 12 9 12 24 10 9 15 18 5 10 13 25Strong Trump 30 26 31 35 29 27 31 34 26 21 38 33 26 31Weak Trump 10 8 10 10 10 9 10 10 9 10 6 10 13 6Strong Different candidate 2 2 2 2 2 3 2 2 1 5 1 2 2 3Weak Different candidate 4 3 4 3 4 2 4 4 4 4 4 2 6 2Would not vote 3 1 3 2 3 5 3 2 6 5 1 3 4 4(Undecided) 8 7 8 6 8 13 7 6 13 7 5 6 8 12
Q. 9 Worry About Contracting CoronavirusTotal Answering (1200) (130) (1070) (220) (980) (176) (1024) (757) (266) (177) (221) (393) (393) (137)Very worried 26 28 25 23 26 28 25 24 33 23 20 26 28 27Somewhat worried 38 36 39 45 37 27 40 41 30 39 45 38 39 26Not too worried 22 22 22 20 22 27 21 20 26 23 22 21 20 26Not worried at all 13 12 13 13 13 17 12 14 10 13 13 13 12 21(Don't know/refused) 1 2 1 - 2 2 1 1 2 2 1 2 2 -Very/Somewhat worried 64 64 64 67 63 55 66 65 63 62 65 65 67 53Not too/Not at all worried 35 34 35 33 35 44 33 34 36 36 35 34 31 47
TargetSmart Communications 1155 15th St, NW, Suite 750, Washington, DC 20005 targetsmart.com
11 of 228
Page 12
May 21-27, 2020
National Voter Insights Study
TargetSmart + Dynata
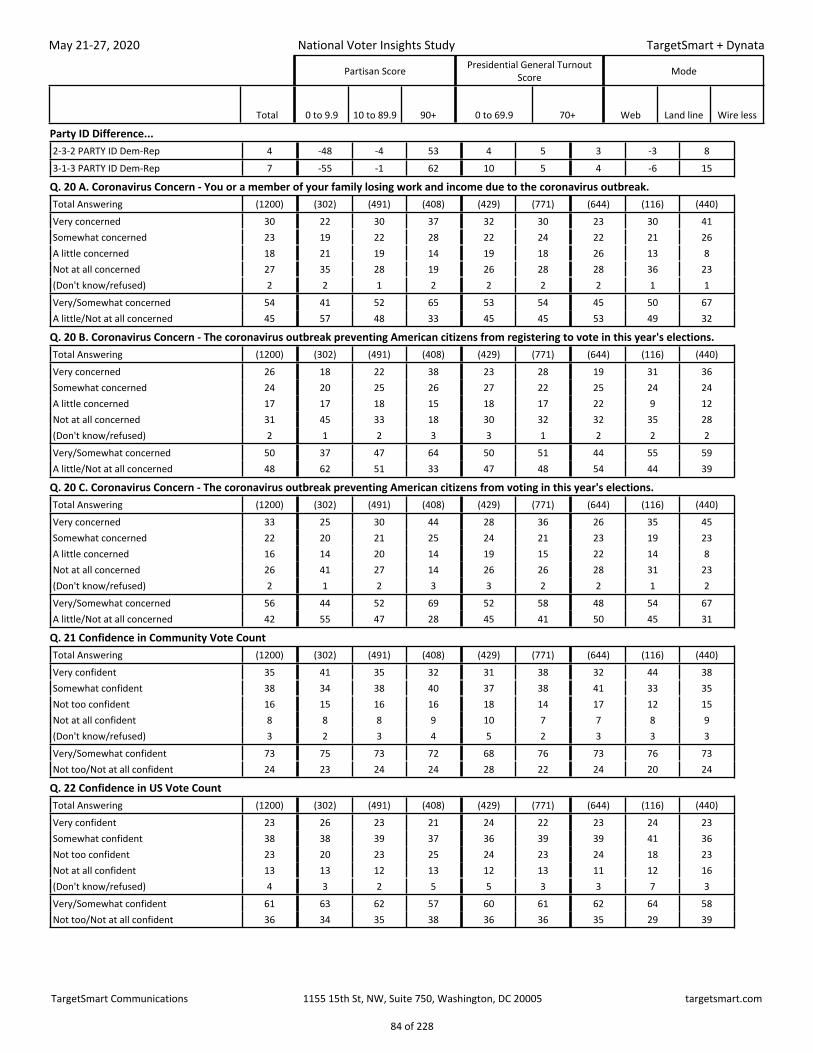
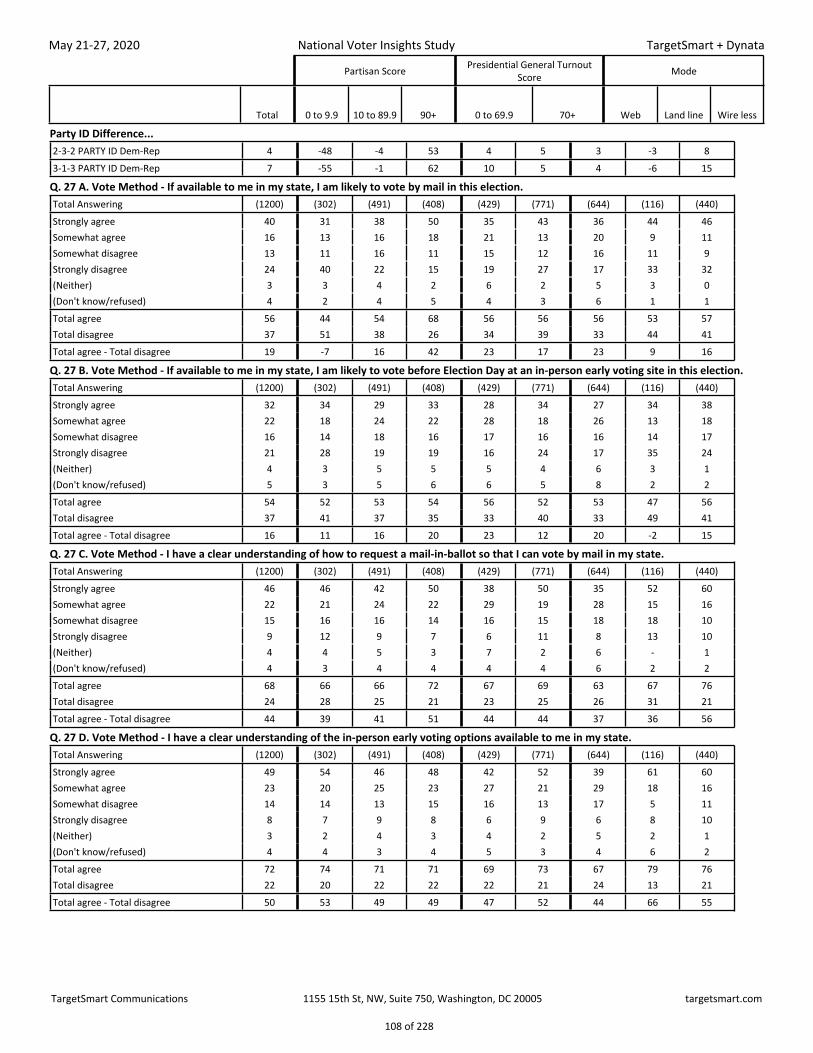
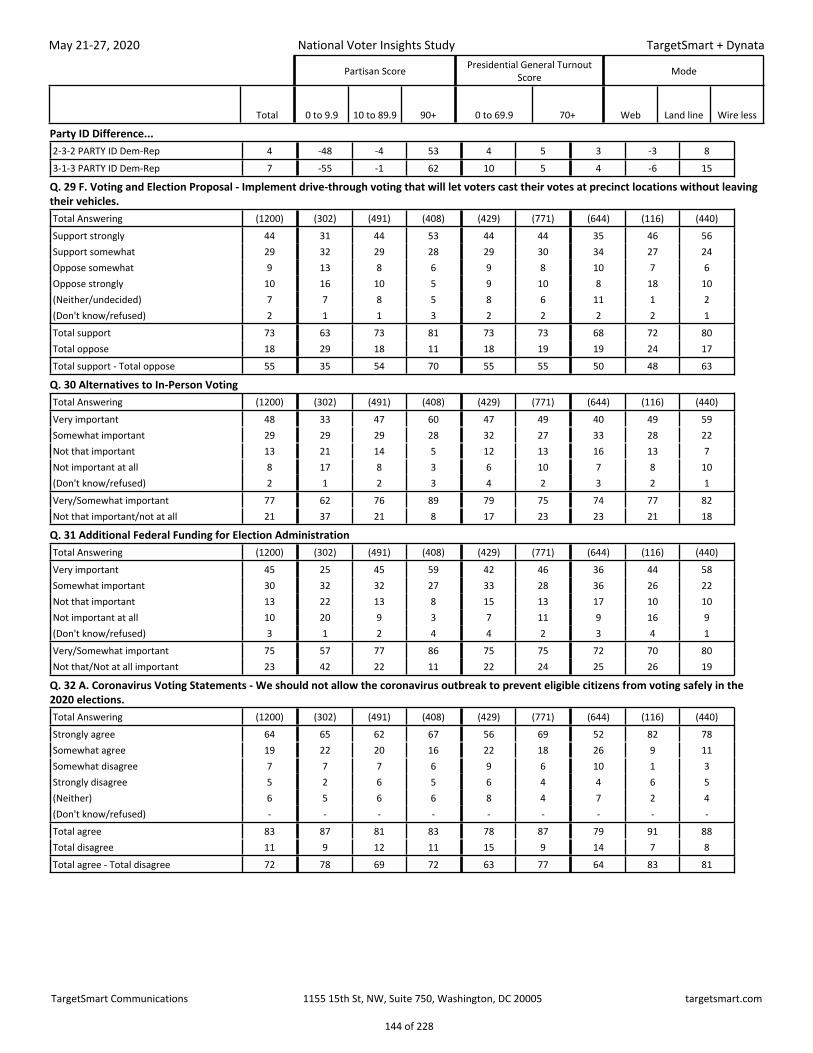
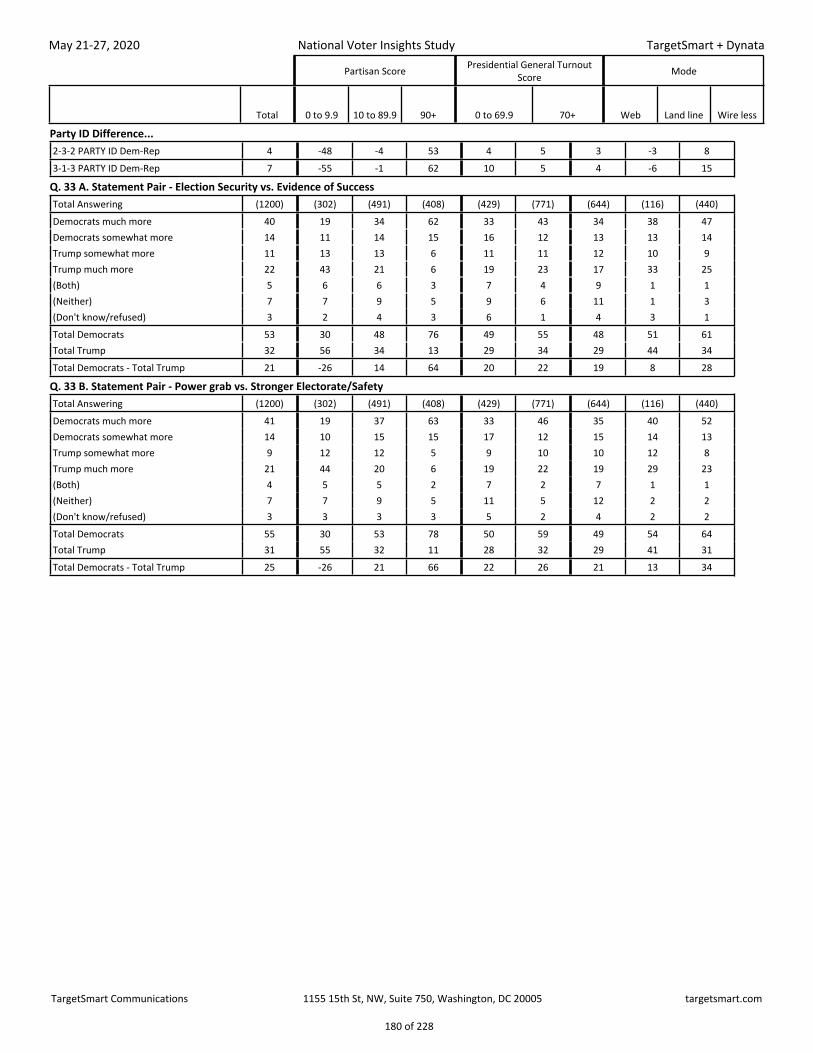
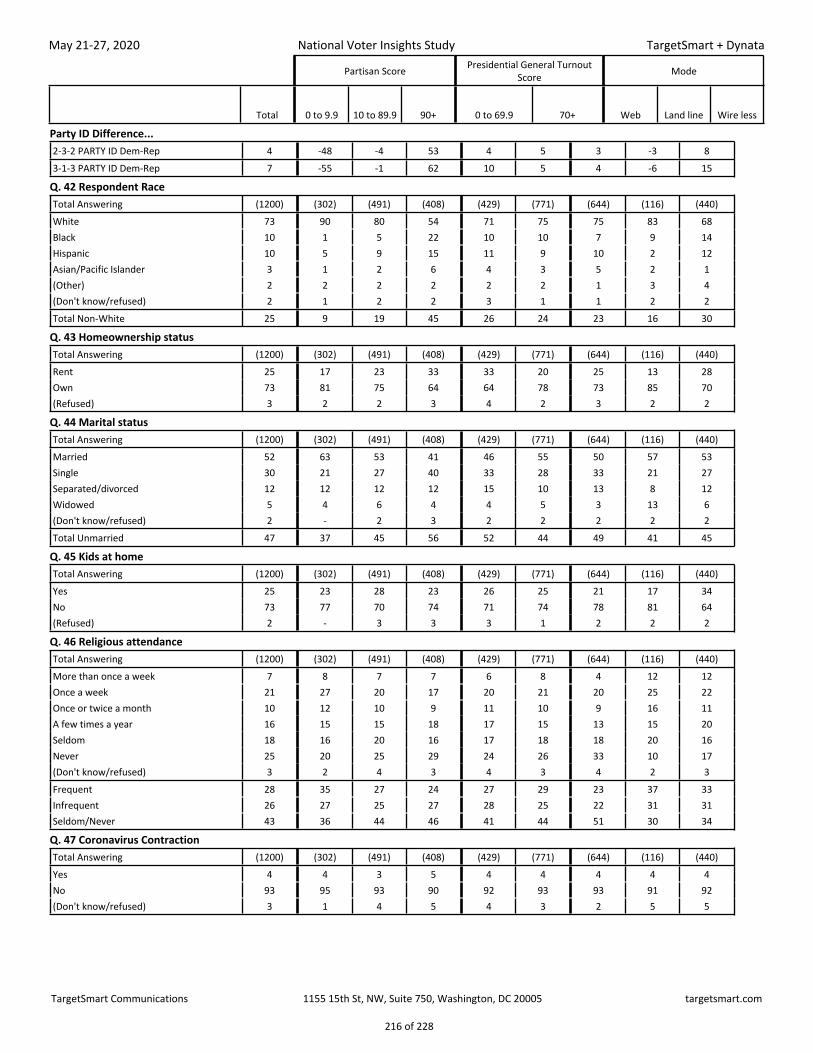
Partisan Score Presidential General Turnout Score Mode
Total 0 to 9.9 10 to 89.9 90+ 0 to 69.9 70+ Web Land line Wire less
Party ID Difference...2-3-2 PARTY ID Dem-Rep 4 -48 -4 53 4 5 3 -3 83-1-3 PARTY ID Dem-Rep 7 -55 -1 62 10 5 4 -6 15
Q. 5 Trump Job ApprovalTotal Answering (1200) (302) (491) (408) (429) (771) (644) (116) (440)Strongly approve 27 49 27 12 26 28 24 43 28Somewhat approve 17 20 20 10 19 15 21 10 12Somewhat disapprove 9 10 8 10 12 8 12 7 6Strongly disapprove 43 20 41 63 38 46 41 38 48(Unsure/don't know/refused) 4 1 4 5 6 3 2 2 7Total approve 44 69 47 22 45 44 45 53 40Total disapprove 52 30 49 72 49 54 53 45 54Total approve - Total disapprove -8 39 -2 -50 -5 -10 -8 9 -14
Q. 6 Presidential VoteTotal Answering (1200) (302) (491) (408) (429) (771) (644) (116) (440)Joe Biden 40 16 35 64 35 43 41 36 39Lean Joe Biden 3 3 4 3 5 2 2 3 6Donald Trump 39 68 42 15 38 40 41 51 33Lean Donald Trump 1 1 1 1 1 1 1 - 2Different candidate 4 5 5 4 3 5 5 1 5Lean Different candidate 1 2 1 2 2 1 1 1 2Would not vote 2 1 3 2 4 1 3 1 2Lean Would not vote 1 0 1 2 1 1 0 1 2(Undecided) 8 5 9 9 13 5 7 8 10Total Joe Biden 43 18 39 66 40 45 43 38 45Total Donald Trump 40 69 43 16 39 41 42 51 35Total Different candidate 6 6 6 6 4 7 6 2 7Total Would not vote 3 1 4 4 4 3 3 2 4Total Biden - Total Trump 3 -51 -4 51 1 4 1 -13 10
Q. 7 Presidential Vote CertaintyTotal Answering (1200) (302) (491) (408) (429) (771) (644) (116) (440)Strong Biden 31 14 27 50 24 36 32 31 31Weak Biden 12 5 13 16 16 9 12 7 13Strong Trump 30 55 33 10 28 32 29 44 29Weak Trump 10 14 10 6 11 9 13 7 6Strong Different candidate 2 2 3 1 1 3 1 1 4Weak Different candidate 4 5 3 4 4 4 5 1 3Would not vote 3 1 4 4 4 3 3 2 4(Undecided) 8 5 9 9 13 5 7 8 10
Q. 9 Worry About Contracting CoronavirusTotal Answering (1200) (302) (491) (408) (429) (771) (644) (116) (440)Very worried 26 15 24 35 29 24 26 22 26Somewhat worried 38 39 35 42 32 42 40 38 37Not too worried 22 25 26 14 24 20 22 19 21Not worried at all 13 22 13 6 14 13 10 20 16(Don't know/refused) 1 0 1 3 2 1 2 2 1Very/Somewhat worried 64 54 60 77 60 66 66 60 62Not too/Not at all worried 35 46 39 21 38 33 32 39 37
TargetSmart Communications 1155 15th St, NW, Suite 750, Washington, DC 20005 targetsmart.com
12 of 228
Page 13
May 21-27, 2020
National Voter Insights Study
TargetSmart + Dynata
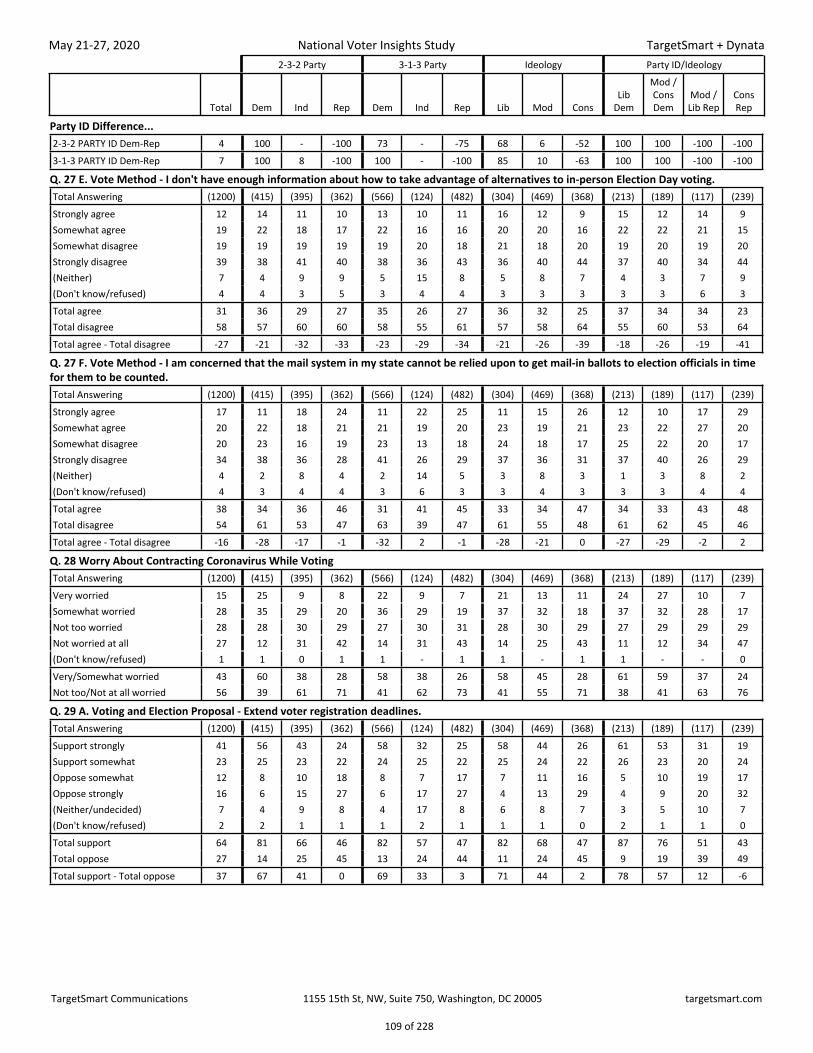
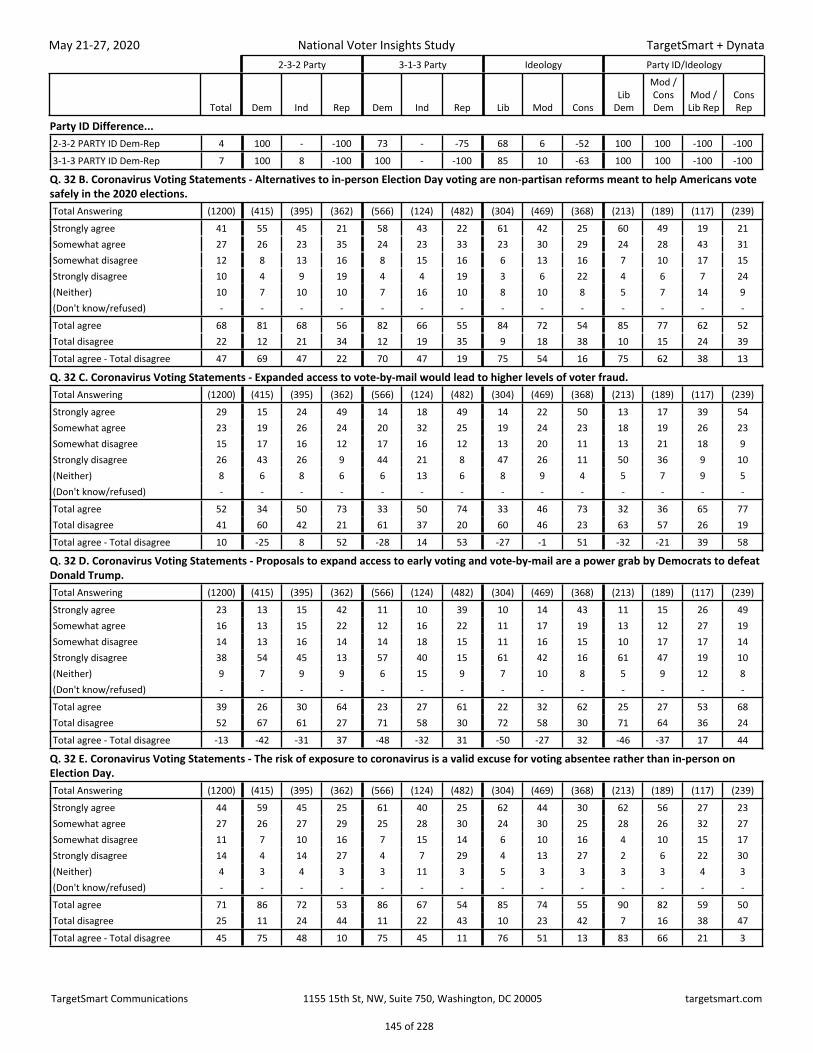
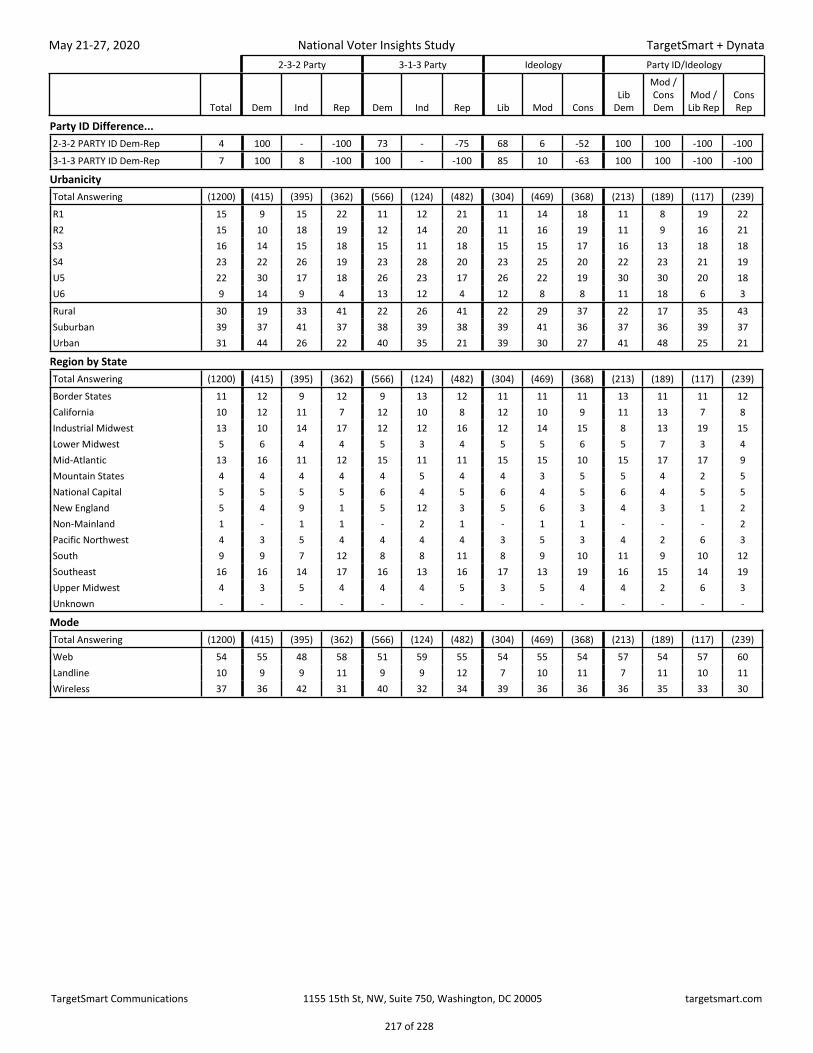
2-3-2 Party 3-1-3 Party Ideology Party ID/Ideology
Total Dem Ind Rep Dem Ind Rep Lib Mod ConsLib
Dem
Mod / Cons Dem
Mod / Lib Rep
Cons Rep
Party ID Difference...2-3-2 PARTY ID Dem-Rep 4 100 - -100 73 - -75 68 6 -52 100 100 -100 -1003-1-3 PARTY ID Dem-Rep 7 100 8 -100 100 - -100 85 10 -63 100 100 -100 -100
Q. 10 Public Health Problem in Local CommunityTotal Answering (1200) (415) (395) (362) (566) (124) (482) (304) (469) (368) (213) (189) (117) (239)Extremely large problem 18 28 15 10 27 14 10 29 17 11 32 24 12 9Large problem 36 42 41 25 44 41 26 47 39 26 44 40 31 23Small problem 35 24 33 50 22 34 50 18 37 48 18 31 47 52Not a problem at all 9 4 11 13 5 11 13 4 7 15 4 3 9 15(Don't know/refused) 2 3 0 1 2 - 1 2 1 1 2 2 2 1Extremely large/Large problem 54 70 56 36 71 55 36 76 55 37 77 64 43 32Small/Not a problem at all 44 27 44 63 27 45 64 23 44 63 22 34 55 68
Q. 11 Economic Problem in Local CommunityTotal Answering (1200) (415) (395) (362) (566) (124) (482) (304) (469) (368) (213) (189) (117) (239)Extremely large problem 31 36 32 26 35 25 29 34 31 30 38 33 23 28Large problem 44 44 46 42 47 41 42 47 45 40 43 45 47 39Small problem 19 16 15 26 14 19 24 14 19 23 15 19 24 26Not a problem at all 5 3 6 5 3 13 5 3 4 6 3 3 5 5(Don't know/refused) 2 2 1 2 2 2 1 2 1 1 2 1 2 1Extremely large/Large problem 75 79 78 68 81 66 71 81 76 70 81 78 69 67Small/Not a problem at all 23 19 21 31 17 32 28 17 23 29 18 22 29 32
Q. 12 When the Country Will Resume Normal ActivityTotal Answering (1200) (415) (395) (362) (566) (124) (482) (304) (469) (368) (213) (189) (117) (239)Today or the next few days 1 0 0 1 0 1 1 0 0 1 1 0 0 2A week or two 2 1 3 4 1 3 3 1 2 3 1 0 5 3Two weeks to a month 5 5 3 6 4 2 6 4 4 6 5 5 5 7One to two months 8 5 7 13 4 8 12 4 8 12 5 5 10 14Two to four months 13 11 13 14 10 17 14 11 12 15 10 13 10 16Four to six months 18 17 17 21 17 14 21 18 17 20 16 19 22 21More than six months 50 59 55 37 61 53 38 59 53 39 62 54 43 33(Don't know/refused) 4 3 3 5 3 3 5 2 3 5 2 4 5 4
Q. 13 A. Coronavirus Job Approval - President Donald TrumpTotal Answering (1200) (415) (395) (362) (566) (124) (482) (304) (469) (368) (213) (189) (117) (239)Approve strongly 24 5 17 55 5 11 50 6 16 50 4 6 42 62Approve somewhat 20 11 20 31 10 17 33 7 25 26 8 16 40 27Disapprove somewhat 11 12 12 8 11 18 9 6 15 9 6 18 8 7Disapprove strongly 42 71 47 6 72 45 7 79 42 14 81 59 10 5(Unsure/don't know/refused) 3 2 4 0 2 10 1 3 2 2 2 1 - 0Total approve 44 16 37 86 15 28 83 13 41 76 12 22 82 88Total disapprove 53 82 59 14 83 63 16 85 57 23 87 77 18 12Total approve - Total disapprove -9 -66 -22 72 -68 -35 67 -72 -16 53 -75 -55 64 76
TargetSmart Communications 1155 15th St, NW, Suite 750, Washington, DC 20005 targetsmart.com
13 of 228
Page 14
May 21-27, 2020
National Voter Insights Study
TargetSmart + Dynata
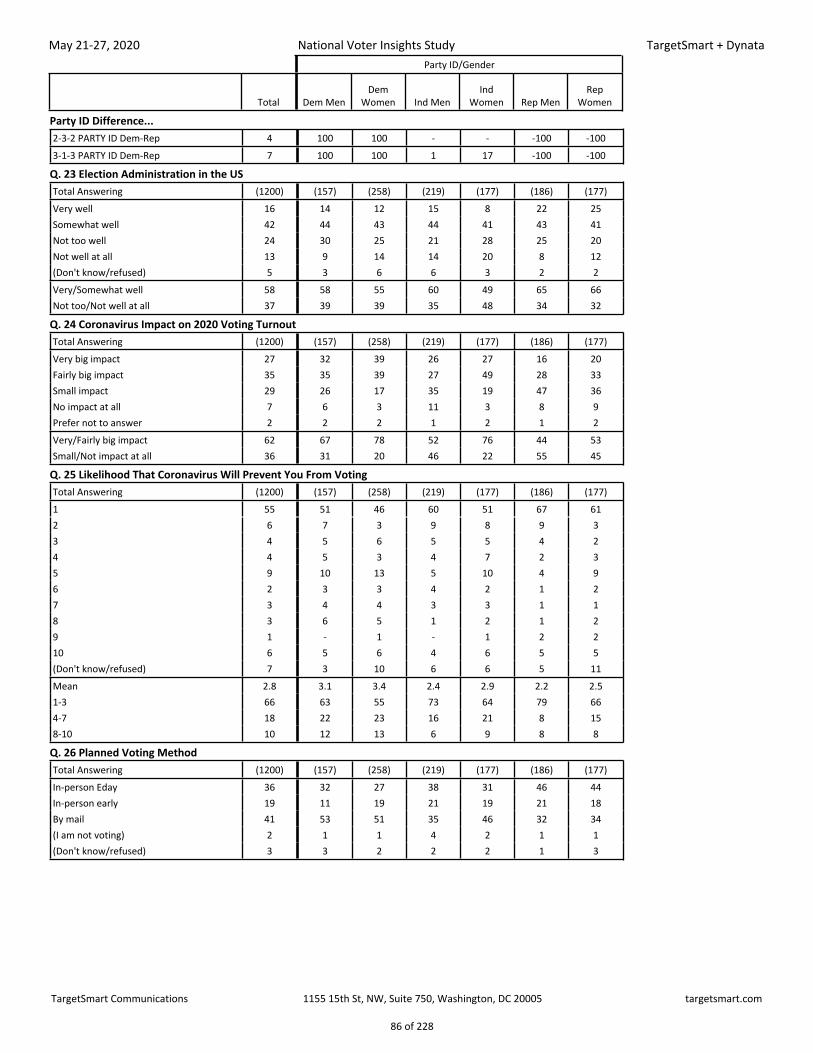
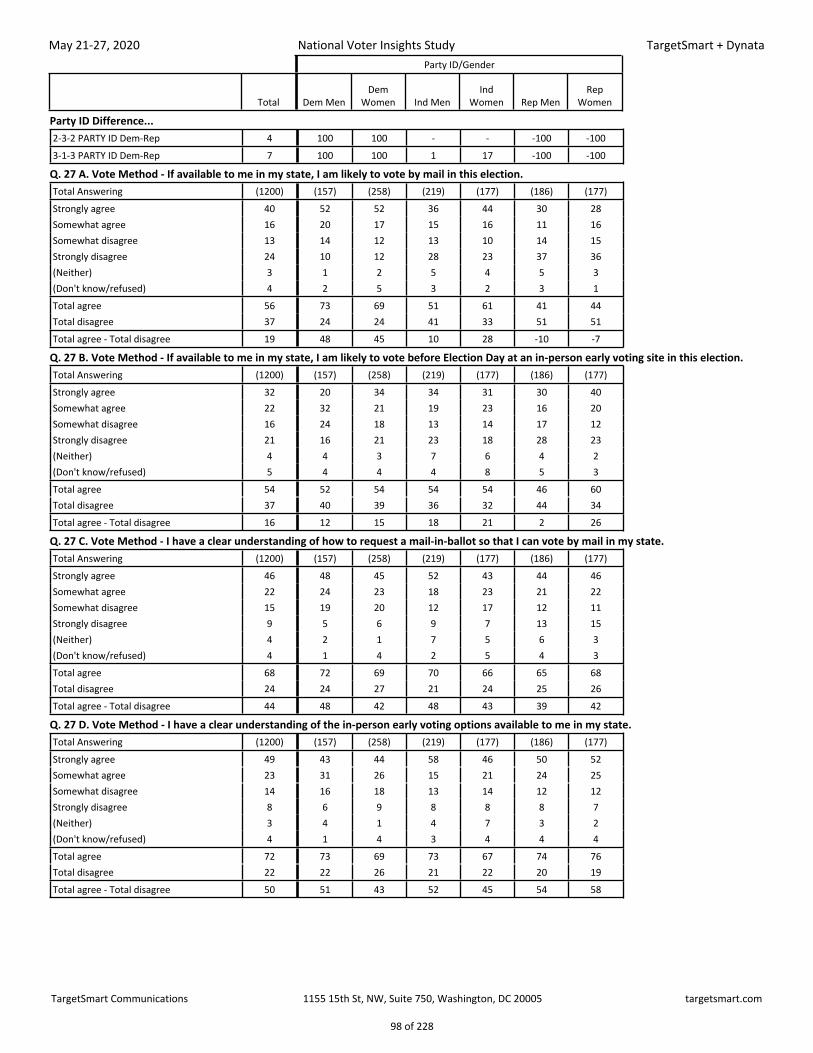
Party ID/Gender
Total Dem MenDem
Women Ind MenInd
Women Rep MenRep
Women
Party ID Difference...2-3-2 PARTY ID Dem-Rep 4 100 100 - - -100 -1003-1-3 PARTY ID Dem-Rep 7 100 100 1 17 -100 -100
Q. 10 Public Health Problem in Local CommunityTotal Answering (1200) (157) (258) (219) (177) (186) (177)Extremely large problem 18 29 28 16 15 12 9Large problem 36 41 42 37 47 23 28Small problem 35 23 24 34 31 49 51Not a problem at all 9 6 2 13 7 16 11(Don't know/refused) 2 1 4 0 - 1 2Extremely large/Large problem 54 70 70 52 61 35 36Small/Not a problem at all 44 29 26 48 39 64 62
Q. 11 Economic Problem in Local CommunityTotal Answering (1200) (157) (258) (219) (177) (186) (177)Extremely large problem 31 37 35 32 31 29 22Large problem 44 44 44 46 46 35 50Small problem 19 15 17 15 15 30 21Not a problem at all 5 3 2 6 7 7 4(Don't know/refused) 2 1 2 2 1 - 3Extremely large/Large problem 75 81 79 78 77 63 72Small/Not a problem at all 23 18 20 21 22 37 25
Q. 12 When the Country Will Resume Normal ActivityTotal Answering (1200) (157) (258) (219) (177) (186) (177)Today or the next few days 1 - 1 - 0 1 1A week or two 2 1 0 3 1 5 2Two weeks to a month 5 6 5 4 2 6 6One to two months 8 4 6 7 6 15 10Two to four months 13 17 7 12 15 16 12Four to six months 18 14 19 19 15 20 23More than six months 50 56 60 53 58 33 41(Don't know/refused) 4 3 4 2 3 5 6
Q. 13 A. Coronavirus Job Approval - President Donald TrumpTotal Answering (1200) (157) (258) (219) (177) (186) (177)Approve strongly 24 6 4 20 12 57 53Approve somewhat 20 11 12 18 23 25 36Disapprove somewhat 11 10 13 12 12 9 6Disapprove strongly 42 71 70 46 48 9 4(Unsure/don't know/refused) 3 2 2 4 5 - 1Total approve 44 17 15 38 36 82 89Total disapprove 53 81 83 59 60 18 10Total approve - Total disapprove -9 -65 -67 -21 -24 65 79
TargetSmart Communications 1155 15th St, NW, Suite 750, Washington, DC 20005 targetsmart.com
14 of 228
Page 15
May 21-27, 2020
National Voter Insights Study
TargetSmart + Dynata
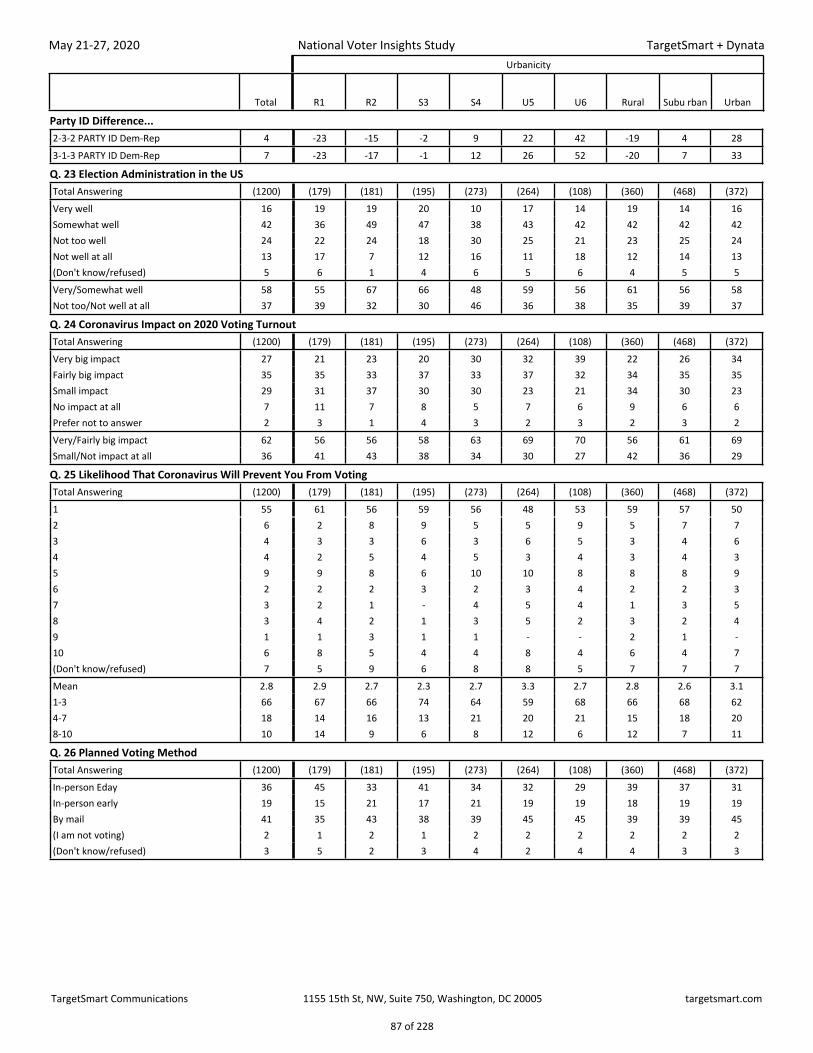
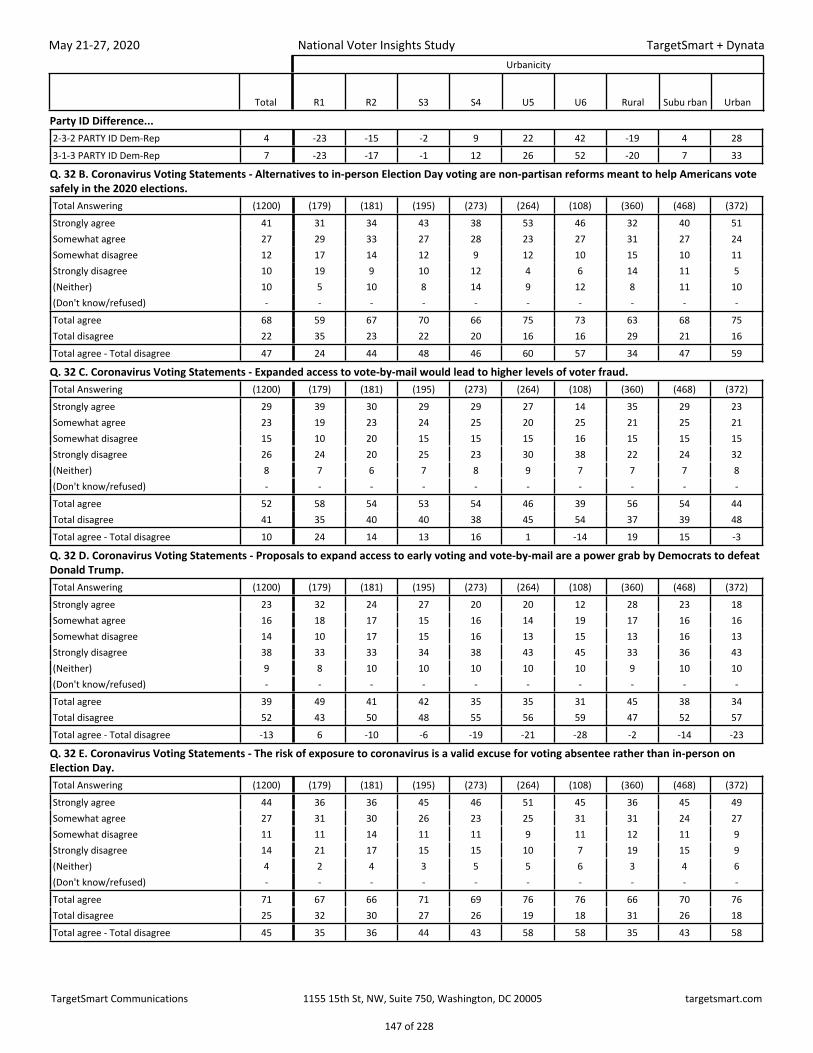
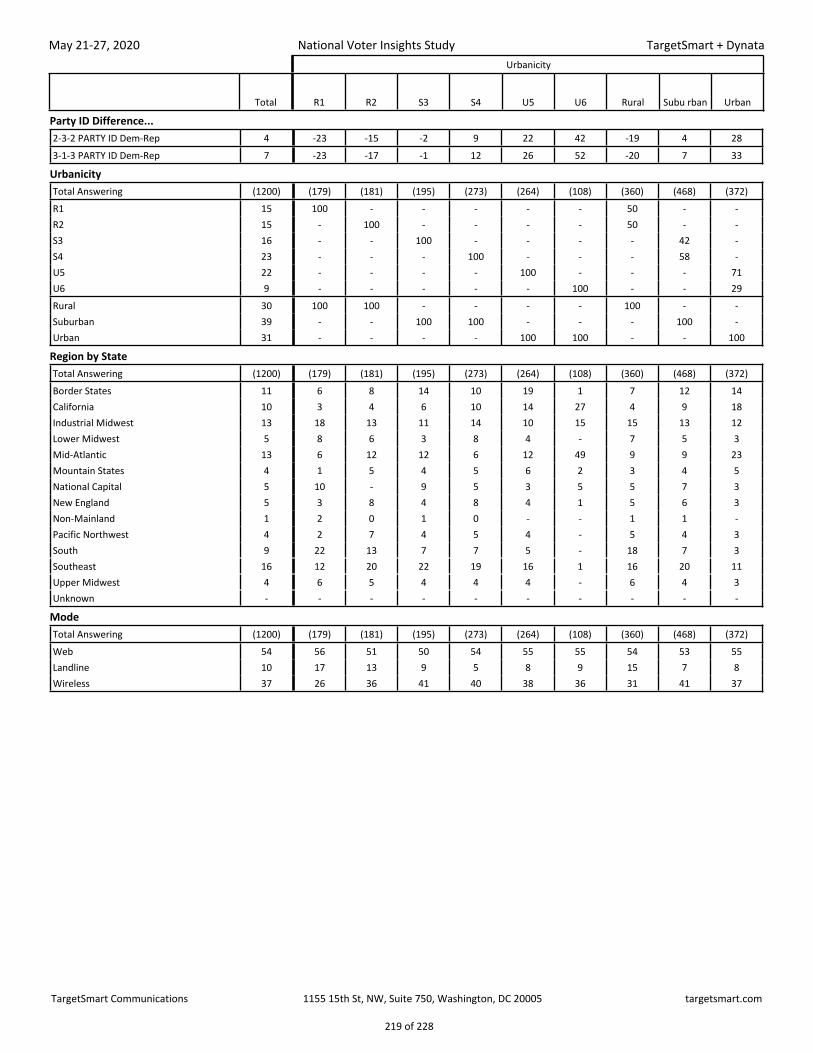
Urbanicity
Total R1 R2 S3 S4 U5 U6 Rural Subu rban Urban
Party ID Difference...2-3-2 PARTY ID Dem-Rep 4 -23 -15 -2 9 22 42 -19 4 283-1-3 PARTY ID Dem-Rep 7 -23 -17 -1 12 26 52 -20 7 33
Q. 10 Public Health Problem in Local CommunityTotal Answering (1200) (179) (181) (195) (273) (264) (108) (360) (468) (372)Extremely large problem 18 8 12 22 19 20 31 10 20 23Large problem 36 31 31 29 42 44 35 31 36 41Small problem 35 45 47 37 27 30 27 46 31 29Not a problem at all 9 13 10 11 9 6 5 11 10 5(Don't know/refused) 2 3 0 2 4 1 2 2 3 2Extremely large/Large problem 54 39 44 50 61 64 66 41 56 64Small/Not a problem at all 44 58 56 48 36 35 32 57 41 34
Q. 11 Economic Problem in Local CommunityTotal Answering (1200) (179) (181) (195) (273) (264) (108) (360) (468) (372)Extremely large problem 31 24 24 31 32 34 44 24 31 37Large problem 44 44 44 45 45 45 33 44 45 42Small problem 19 21 27 16 16 16 16 24 16 16Not a problem at all 5 8 5 6 5 2 3 7 5 3(Don't know/refused) 2 4 0 2 2 2 3 2 2 2Extremely large/Large problem 75 67 68 76 77 80 78 68 77 79Small/Not a problem at all 23 29 32 22 21 18 19 31 22 19
Q. 12 When the Country Will Resume Normal ActivityTotal Answering (1200) (179) (181) (195) (273) (264) (108) (360) (468) (372)Today or the next few days 1 1 0 1 0 1 1 1 1 1A week or two 2 1 3 1 3 2 2 2 2 2Two weeks to a month 5 5 9 4 4 3 4 7 4 3One to two months 8 9 8 9 7 6 9 8 8 7Two to four months 13 13 14 15 11 16 5 13 13 13Four to six months 18 16 23 21 19 14 15 20 20 14More than six months 50 48 41 49 51 55 56 45 50 55(Don't know/refused) 4 8 2 2 5 3 8 5 3 5
Q. 13 A. Coronavirus Job Approval - President Donald TrumpTotal Answering (1200) (179) (181) (195) (273) (264) (108) (360) (468) (372)Approve strongly 24 36 31 28 19 19 9 34 23 16Approve somewhat 20 21 28 19 18 15 24 25 19 17Disapprove somewhat 11 11 7 12 13 13 6 9 12 11Disapprove strongly 42 29 32 39 46 50 59 30 43 52(Unsure/don't know/refused) 3 3 3 2 4 4 3 3 3 4Total approve 44 58 59 47 37 34 33 58 41 33Total disapprove 53 40 39 51 59 62 65 39 56 63Total approve - Total disapprove -9 18 20 -4 -21 -29 -32 19 -14 -30
TargetSmart Communications 1155 15th St, NW, Suite 750, Washington, DC 20005 targetsmart.com
15 of 228
Page 16
May 21-27, 2020
National Voter Insights Study
TargetSmart + Dynata
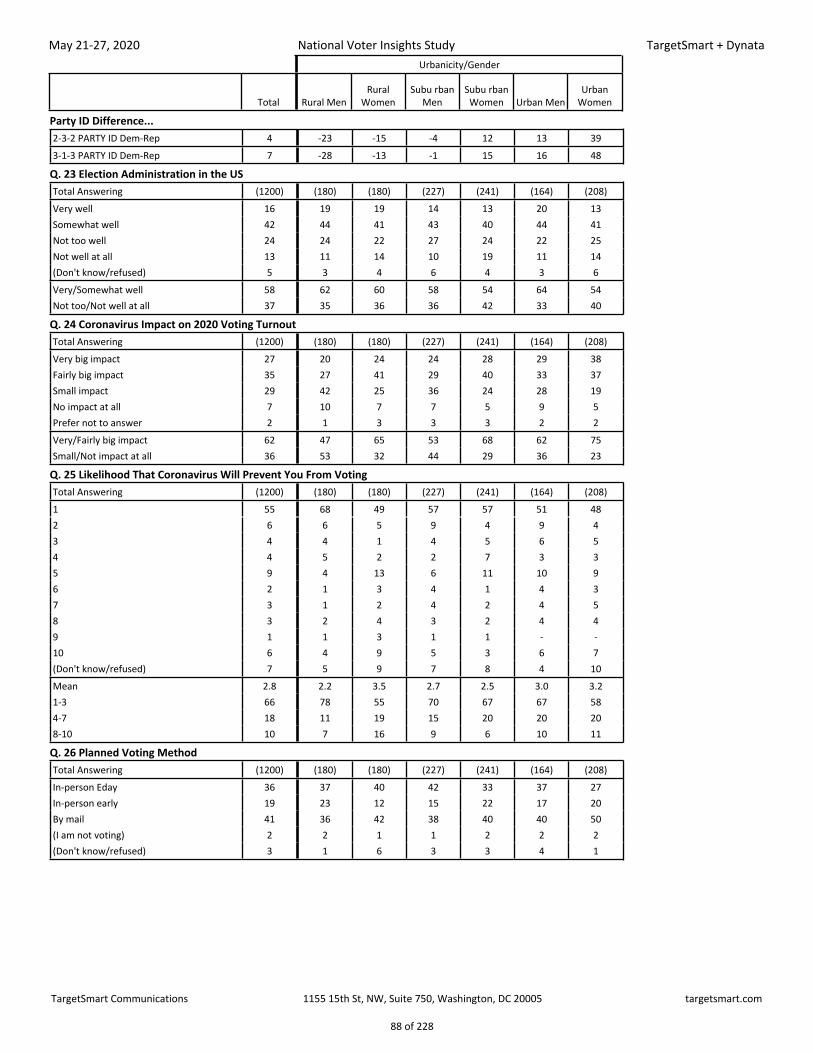
Urbanicity/Gender
Total Rural MenRural
WomenSubu rban
MenSubu rban Women Urban Men
Urban Women
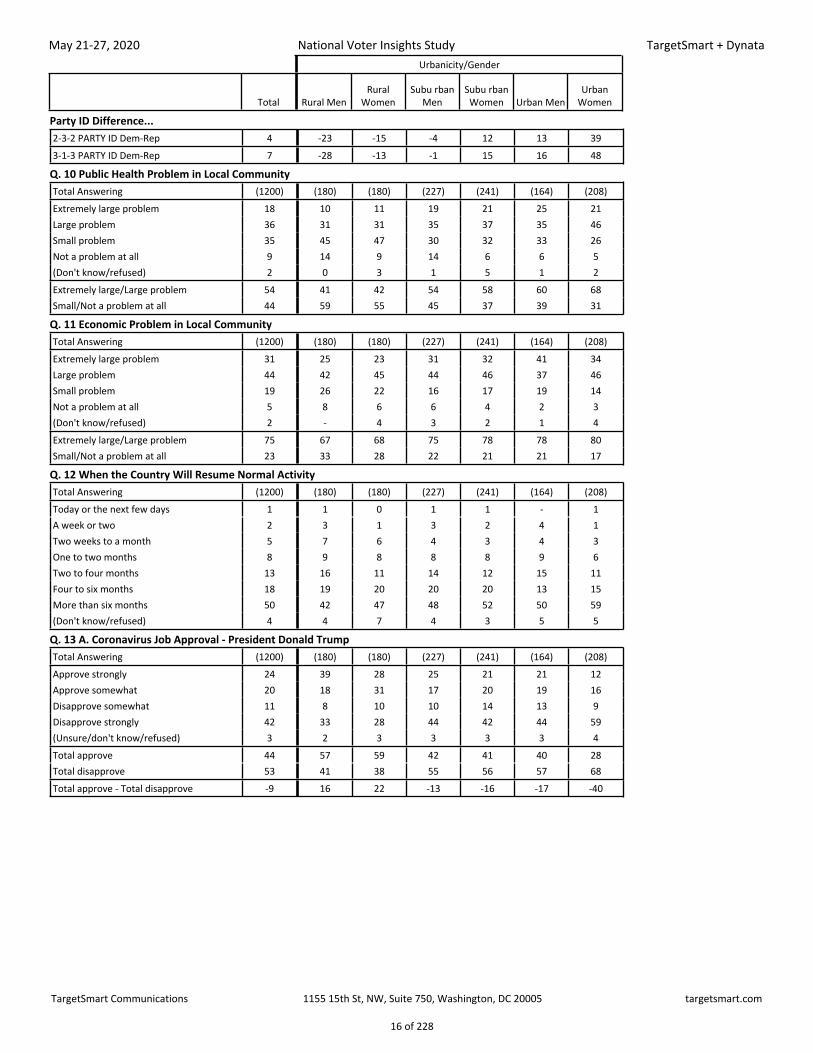
Party ID Difference...2-3-2 PARTY ID Dem-Rep 4 -23 -15 -4 12 13 393-1-3 PARTY ID Dem-Rep 7 -28 -13 -1 15 16 48
Q. 10 Public Health Problem in Local CommunityTotal Answering (1200) (180) (180) (227) (241) (164) (208)Extremely large problem 18 10 11 19 21 25 21Large problem 36 31 31 35 37 35 46Small problem 35 45 47 30 32 33 26Not a problem at all 9 14 9 14 6 6 5(Don't know/refused) 2 0 3 1 5 1 2Extremely large/Large problem 54 41 42 54 58 60 68Small/Not a problem at all 44 59 55 45 37 39 31
Q. 11 Economic Problem in Local CommunityTotal Answering (1200) (180) (180) (227) (241) (164) (208)Extremely large problem 31 25 23 31 32 41 34Large problem 44 42 45 44 46 37 46Small problem 19 26 22 16 17 19 14Not a problem at all 5 8 6 6 4 2 3(Don't know/refused) 2 - 4 3 2 1 4Extremely large/Large problem 75 67 68 75 78 78 80Small/Not a problem at all 23 33 28 22 21 21 17
Q. 12 When the Country Will Resume Normal ActivityTotal Answering (1200) (180) (180) (227) (241) (164) (208)Today or the next few days 1 1 0 1 1 - 1A week or two 2 3 1 3 2 4 1Two weeks to a month 5 7 6 4 3 4 3One to two months 8 9 8 8 8 9 6Two to four months 13 16 11 14 12 15 11Four to six months 18 19 20 20 20 13 15More than six months 50 42 47 48 52 50 59(Don't know/refused) 4 4 7 4 3 5 5
Q. 13 A. Coronavirus Job Approval - President Donald TrumpTotal Answering (1200) (180) (180) (227) (241) (164) (208)Approve strongly 24 39 28 25 21 21 12Approve somewhat 20 18 31 17 20 19 16Disapprove somewhat 11 8 10 10 14 13 9Disapprove strongly 42 33 28 44 42 44 59(Unsure/don't know/refused) 3 2 3 3 3 3 4Total approve 44 57 59 42 41 40 28Total disapprove 53 41 38 55 56 57 68Total approve - Total disapprove -9 16 22 -13 -16 -17 -40
TargetSmart Communications 1155 15th St, NW, Suite 750, Washington, DC 20005 targetsmart.com
16 of 228
Page 17
May 21-27, 2020
National Voter Insights Study
TargetSmart + Dynata
Region by State
TotalBorder States
Califo rnia
Indust rial
Midw est
Lower Midw
estMid -
Atla ntic
Moun tain
States
Nati onal
Capi talNew
Engl and
Paci fic Northw
est SouthSouthe
ast
Upper Midw
est
Party ID Difference...2-3-2 PARTY ID Dem-Rep 4 4 19 -11 16 15 2 5 17 -7 -3 3 13-1-3 PARTY ID Dem-Rep 7 -5 27 -6 17 21 5 15 29 2 -9 8 -8
Q. 10 Public Health Problem in Local CommunityTotal Answering (1200) (132) (120) (157) (60) (158) (48) (60) (60) (48) (108) (193) (48)Extremely large problem 18 11 17 15 13 29 9 27 10 25 24 17 14Large problem 36 46 34 36 31 36 46 39 39 31 35 33 30Small problem 35 35 39 34 50 27 30 27 30 40 28 38 44Not a problem at all 9 8 9 14 4 5 15 5 14 3 11 7 13(Don't know/refused) 2 1 1 1 3 3 - 2 6 - 2 4 -Extremely large/Large problem 54 57 51 51 43 65 54 66 50 57 59 51 44Small/Not a problem at all 44 42 48 48 54 32 46 32 44 43 39 45 56
Q. 11 Economic Problem in Local CommunityTotal Answering (1200) (132) (120) (157) (60) (158) (48) (60) (60) (48) (108) (193) (48)Extremely large problem 31 24 39 27 20 38 35 30 24 47 36 25 33Large problem 44 44 40 46 54 40 47 45 41 38 41 47 42Small problem 19 25 16 22 18 19 15 25 12 10 11 21 17Not a problem at all 5 7 3 4 5 2 2 1 15 5 10 3 5(Don't know/refused) 2 0 2 1 4 2 - - 8 - 2 4 3Extremely large/Large problem 75 69 79 73 74 78 82 75 65 85 77 72 76Small/Not a problem at all 23 31 20 26 23 21 18 26 27 15 21 24 22
Q. 12 When the Country Will Resume Normal ActivityTotal Answering (1200) (132) (120) (157) (60) (158) (48) (60) (60) (48) (108) (193) (48)Today or the next few days 1 1 1 - - 1 2 - 0 - 2 - -A week or two 2 1 3 3 - 2 2 1 - 2 6 2 -Two weeks to a month 5 6 5 5 5 5 14 - 8 - 5 3 1One to two months 8 7 11 7 8 7 4 7 10 9 8 6 9Two to four months 13 18 11 12 22 12 14 9 19 4 7 15 9Four to six months 18 17 17 21 16 20 12 19 11 14 15 22 18More than six months 50 48 51 48 49 50 47 58 45 62 51 47 63(Don't know/refused) 4 2 2 4 - 4 5 6 8 9 8 6 -
Q. 13 A. Coronavirus Job Approval - President Donald TrumpTotal Answering (1200) (132) (120) (157) (60) (158) (48) (60) (60) (48) (108) (193) (48)Approve strongly 24 28 17 25 17 22 20 21 13 16 36 26 33Approve somewhat 20 17 17 23 27 22 27 11 18 29 17 19 18Disapprove somewhat 11 11 9 9 11 13 10 13 4 13 12 11 15Disapprove strongly 42 40 55 42 44 40 43 49 45 41 34 43 32(Unsure/don't know/refused) 3 5 2 1 2 3 - 7 20 1 1 2 3Total approve 44 45 34 48 44 44 47 31 31 46 53 45 51Total disapprove 53 50 64 51 54 54 53 62 49 54 46 54 47Total approve - Total disapprove -9 -5 -30 -3 -10 -10 -6 -31 -18 -8 7 -9 4
TargetSmart Communications 1155 15th St, NW, Suite 750, Washington, DC 20005 targetsmart.com
17 of 228
Page 18
May 21-27, 2020
National Voter Insights Study
TargetSmart + Dynata
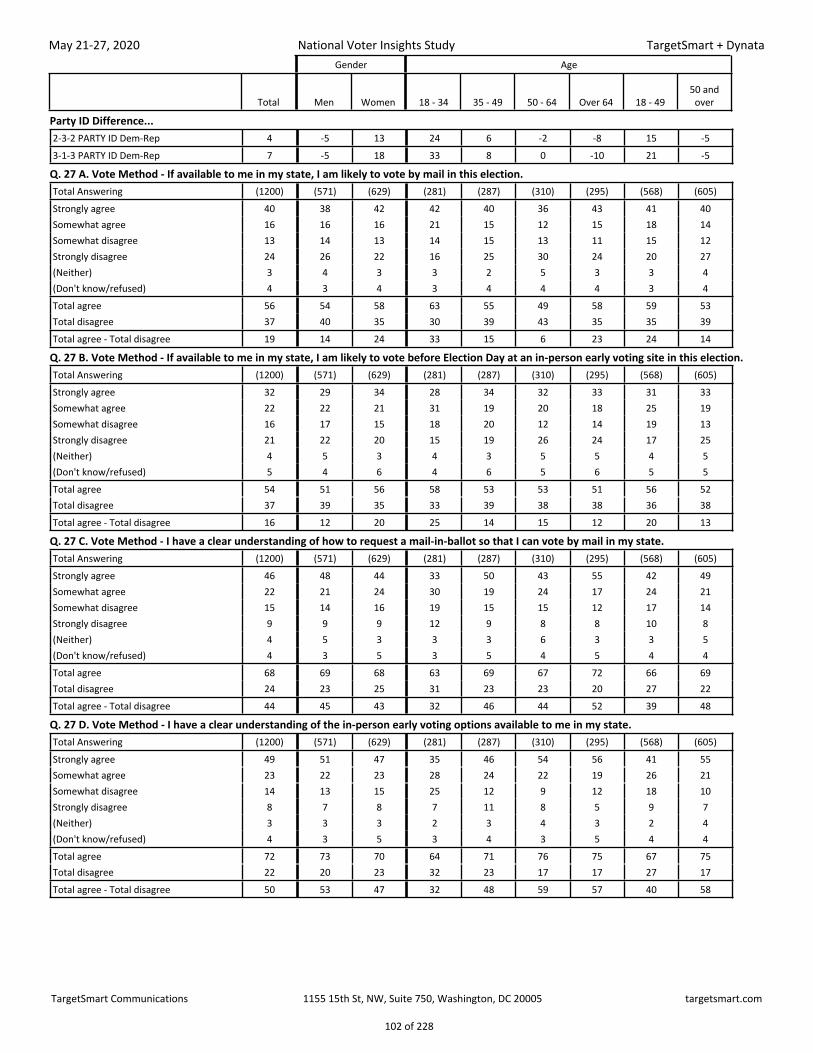
Gender Age
Total Men Women 18 - 34 35 - 49 50 - 64 Over 64 18 - 4950 and
over
Party ID Difference...2-3-2 PARTY ID Dem-Rep 4 -5 13 24 6 -2 -8 15 -53-1-3 PARTY ID Dem-Rep 7 -5 18 33 8 0 -10 21 -5
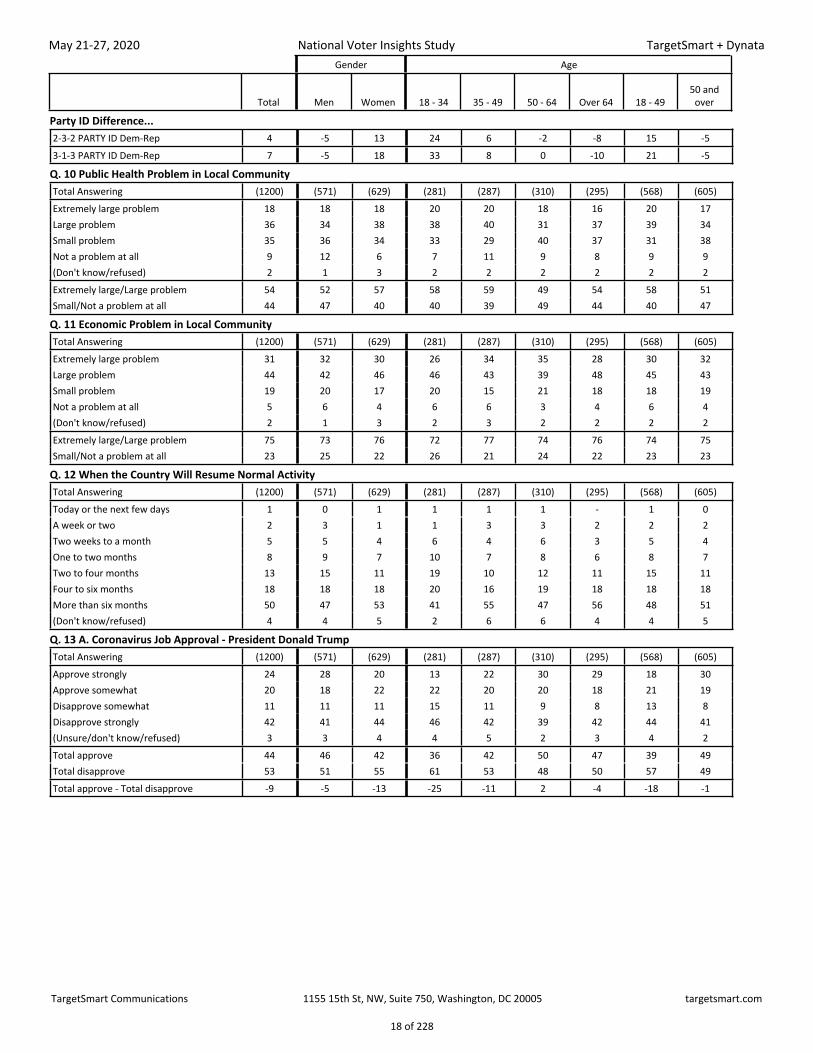
Q. 10 Public Health Problem in Local CommunityTotal Answering (1200) (571) (629) (281) (287) (310) (295) (568) (605)Extremely large problem 18 18 18 20 20 18 16 20 17Large problem 36 34 38 38 40 31 37 39 34Small problem 35 36 34 33 29 40 37 31 38Not a problem at all 9 12 6 7 11 9 8 9 9(Don't know/refused) 2 1 3 2 2 2 2 2 2Extremely large/Large problem 54 52 57 58 59 49 54 58 51Small/Not a problem at all 44 47 40 40 39 49 44 40 47
Q. 11 Economic Problem in Local CommunityTotal Answering (1200) (571) (629) (281) (287) (310) (295) (568) (605)Extremely large problem 31 32 30 26 34 35 28 30 32Large problem 44 42 46 46 43 39 48 45 43Small problem 19 20 17 20 15 21 18 18 19Not a problem at all 5 6 4 6 6 3 4 6 4(Don't know/refused) 2 1 3 2 3 2 2 2 2Extremely large/Large problem 75 73 76 72 77 74 76 74 75Small/Not a problem at all 23 25 22 26 21 24 22 23 23
Q. 12 When the Country Will Resume Normal ActivityTotal Answering (1200) (571) (629) (281) (287) (310) (295) (568) (605)Today or the next few days 1 0 1 1 1 1 - 1 0A week or two 2 3 1 1 3 3 2 2 2Two weeks to a month 5 5 4 6 4 6 3 5 4One to two months 8 9 7 10 7 8 6 8 7Two to four months 13 15 11 19 10 12 11 15 11Four to six months 18 18 18 20 16 19 18 18 18More than six months 50 47 53 41 55 47 56 48 51(Don't know/refused) 4 4 5 2 6 6 4 4 5
Q. 13 A. Coronavirus Job Approval - President Donald TrumpTotal Answering (1200) (571) (629) (281) (287) (310) (295) (568) (605)Approve strongly 24 28 20 13 22 30 29 18 30Approve somewhat 20 18 22 22 20 20 18 21 19Disapprove somewhat 11 11 11 15 11 9 8 13 8Disapprove strongly 42 41 44 46 42 39 42 44 41(Unsure/don't know/refused) 3 3 4 4 5 2 3 4 2Total approve 44 46 42 36 42 50 47 39 49Total disapprove 53 51 55 61 53 48 50 57 49Total approve - Total disapprove -9 -5 -13 -25 -11 2 -4 -18 -1
TargetSmart Communications 1155 15th St, NW, Suite 750, Washington, DC 20005 targetsmart.com
18 of 228
Page 19
May 21-27, 2020
National Voter Insights Study
TargetSmart + Dynata
Education Homeownership status Marital status
TotalH.S. or
lessPost H.S.
4yr Coll Grad
Post Grad
Coll ege Grad uate
Total Non Coll Rent Own
Marr ied Single
Separa ted / divo rced
Wido wed
Total Unmarr
ied
Party ID Difference...2-3-2 PARTY ID Dem-Rep 4 5 -3 6 13 9 0 32 -5 -11 30 10 -6 213-1-3 PARTY ID Dem-Rep 7 3 -1 9 20 14 0 44 -6 -13 42 12 -10 29
Q. 10 Public Health Problem in Local CommunityTotal Answering (1200) (210) (369) (363) (248) (610) (579) (297) (873) (618) (357) (144) (59) (560)Extremely large problem 18 17 15 20 22 20 16 23 17 16 23 19 11 21Large problem 36 27 39 35 43 38 35 42 35 33 40 45 38 41Small problem 35 37 34 37 31 35 35 27 38 41 28 26 44 29Not a problem at all 9 15 11 8 3 6 12 7 9 10 9 9 3 8(Don't know/refused) 2 4 1 0 1 1 2 2 1 1 1 2 5 1Extremely large/Large problem 54 44 54 55 65 59 50 65 51 49 63 64 48 62Small/Not a problem at all 44 52 45 45 34 41 47 34 47 50 36 35 47 37
Q. 11 Economic Problem in Local CommunityTotal Answering (1200) (210) (369) (363) (248) (610) (579) (297) (873) (618) (357) (144) (59) (560)Extremely large problem 31 32 29 31 33 32 30 30 31 31 33 31 24 31Large problem 44 36 44 44 50 47 41 46 44 44 42 51 41 44Small problem 19 21 22 18 13 16 21 16 20 19 18 14 25 18Not a problem at all 5 8 3 5 3 5 5 7 4 5 6 1 5 4(Don't know/refused) 2 3 2 2 1 1 2 2 2 1 1 2 6 2Extremely large/Large problem 75 68 73 76 83 78 72 76 75 75 75 82 65 76Small/Not a problem at all 23 29 25 23 17 21 26 22 24 25 24 16 29 22
Q. 12 When the Country Will Resume Normal ActivityTotal Answering (1200) (210) (369) (363) (248) (610) (579) (297) (873) (618) (357) (144) (59) (560)Today or the next few days 1 1 - 1 - 1 0 0 1 0 1 1 - 1A week or two 2 2 3 2 1 2 3 1 2 2 2 2 3 2Two weeks to a month 5 7 4 4 4 4 5 4 5 5 4 4 3 4One to two months 8 6 7 11 6 9 7 5 9 9 7 8 4 7Two to four months 13 12 14 15 8 13 13 11 14 14 15 9 3 13Four to six months 18 15 19 19 18 19 18 22 17 18 18 16 23 18More than six months 50 49 50 45 60 51 50 53 50 49 50 56 59 52(Don't know/refused) 4 7 4 2 3 3 5 3 4 3 3 4 6 4
Q. 13 A. Coronavirus Job Approval - President Donald TrumpTotal Answering (1200) (210) (369) (363) (248) (610) (579) (297) (873) (618) (357) (144) (59) (560)Approve strongly 24 33 25 23 17 21 28 13 28 30 15 24 27 18Approve somewhat 20 21 24 20 14 18 23 18 21 23 17 17 22 17Disapprove somewhat 11 9 14 8 10 9 12 13 10 9 13 13 8 13Disapprove strongly 42 32 35 47 56 51 33 50 39 36 53 43 36 49(Unsure/don't know/refused) 3 6 3 2 2 2 4 6 2 2 3 2 7 3Total approve 44 54 49 43 32 38 50 31 49 52 31 41 49 36Total disapprove 53 41 48 56 67 60 46 63 49 45 66 57 44 61Total approve - Total disapprove -9 13 0 -13 -35 -22 5 -32 0 7 -35 -15 5 -25
TargetSmart Communications 1155 15th St, NW, Suite 750, Washington, DC 20005 targetsmart.com
19 of 228
Page 20
May 21-27, 2020
National Voter Insights Study
TargetSmart + Dynata
Kids at home Religious attendance
Total Yes No
More than
once a week
Once a week
Once or twice a month
A few times a
year Seldom NeverFreq uent
Infreq uent
Seldom / Never
Party ID Difference...2-3-2 PARTY ID Dem-Rep 4 2 6 -10 -15 5 7 6 24 -14 6 163-1-3 PARTY ID Dem-Rep 7 5 9 -19 -17 -5 14 9 35 -17 7 24
Q. 10 Public Health Problem in Local CommunityTotal Answering (1200) (301) (876) (89) (251) (121) (190) (212) (301) (340) (311) (513)Extremely large problem 18 19 18 16 15 12 22 22 20 15 18 21Large problem 36 35 37 34 39 34 38 35 36 38 37 36Small problem 35 36 35 37 37 40 31 34 36 37 35 35Not a problem at all 9 9 9 12 8 15 7 8 8 9 10 8(Don't know/refused) 2 1 2 1 2 - 2 1 1 2 1 1Extremely large/Large problem 54 54 55 49 54 45 61 57 56 53 55 56Small/Not a problem at all 44 45 44 49 44 55 38 42 44 46 44 43
Q. 11 Economic Problem in Local CommunityTotal Answering (1200) (301) (876) (89) (251) (121) (190) (212) (301) (340) (311) (513)Extremely large problem 31 37 29 29 33 28 31 34 30 32 30 32Large problem 44 43 45 43 44 38 51 46 42 44 46 44Small problem 19 15 20 19 16 28 15 15 21 17 20 19Not a problem at all 5 4 5 7 5 6 3 3 6 5 4 5(Don't know/refused) 2 1 2 2 2 - 1 2 1 2 0 1Extremely large/Large problem 75 80 74 72 77 66 82 80 72 76 76 76Small/Not a problem at all 23 20 25 26 21 34 18 18 27 22 24 23
Q. 12 When the Country Will Resume Normal ActivityTotal Answering (1200) (301) (876) (89) (251) (121) (190) (212) (301) (340) (311) (513)Today or the next few days 1 1 0 3 0 0 - 0 1 1 0 1A week or two 2 1 2 2 2 2 1 4 1 2 2 3Two weeks to a month 5 6 4 5 6 10 2 5 2 6 5 4One to two months 8 8 8 6 8 15 7 7 7 7 10 7Two to four months 13 12 13 9 13 12 19 11 13 12 16 12Four to six months 18 16 19 12 21 12 19 23 16 19 16 19More than six months 50 53 50 57 45 46 51 48 57 48 49 53(Don't know/refused) 4 3 4 6 6 2 2 2 3 6 2 2
Q. 13 A. Coronavirus Job Approval - President Donald TrumpTotal Answering (1200) (301) (876) (89) (251) (121) (190) (212) (301) (340) (311) (513)Approve strongly 24 21 25 33 28 32 21 26 15 30 26 20Approve somewhat 20 24 19 21 25 27 18 20 15 24 21 17Disapprove somewhat 11 14 10 8 9 13 15 9 11 8 14 10Disapprove strongly 42 37 44 35 35 24 45 43 56 35 37 50(Unsure/don't know/refused) 3 4 2 3 4 5 1 2 3 3 2 3Total approve 44 45 44 54 54 59 39 46 30 54 47 36Total disapprove 53 51 54 43 43 36 60 52 67 43 51 61Total approve - Total disapprove -9 -6 -10 11 11 23 -21 -6 -37 11 -4 -25
TargetSmart Communications 1155 15th St, NW, Suite 750, Washington, DC 20005 targetsmart.com
20 of 228
Page 21
May 21-27, 2020
National Voter Insights Study
TargetSmart + Dynata
Gender/Age Gender/Education Age/Education
TotalYoun
ger MenOlder Men
Youn ger
WomenOlder
WomenNon Coll
MenColl Men
Non Coll Women
Coll Women
Youn ger Non
CollOlder
Non Coll
Youn ger Coll
egeOlder Coll
Party ID Difference...2-3-2 PARTY ID Dem-Rep 4 7 -15 21 6 -9 -2 7 19 6 -4 22 -53-1-3 PARTY ID Dem-Rep 7 12 -19 28 8 -12 1 10 26 8 -7 31 -3
Q. 10 Public Health Problem in Local CommunityTotal Answering (1200) (256) (301) (312) (304) (262) (307) (318) (304) (252) (316) (312) (285)Extremely large problem 18 21 16 19 18 16 20 16 21 17 16 22 18Large problem 36 35 34 42 35 30 37 38 40 38 32 40 38Small problem 35 30 39 31 37 36 35 34 34 30 39 32 37Not a problem at all 9 14 11 5 7 18 7 8 4 14 11 5 6(Don't know/refused) 2 1 1 3 3 0 1 4 1 2 3 1 1Extremely large/Large problem 54 55 50 61 53 46 57 54 61 54 47 63 56Small/Not a problem at all 44 44 50 36 44 54 42 42 39 44 50 37 43
Q. 11 Economic Problem in Local CommunityTotal Answering (1200) (256) (301) (312) (304) (262) (307) (318) (304) (252) (316) (312) (285)Extremely large problem 31 30 34 30 30 32 32 29 32 30 30 30 34Large problem 44 44 40 45 47 39 44 44 49 41 41 48 46Small problem 19 18 21 17 17 23 17 20 15 19 23 16 15Not a problem at all 5 7 4 5 3 6 5 4 4 7 4 5 3(Don't know/refused) 2 2 1 3 3 1 1 3 1 3 2 1 1Extremely large/Large problem 75 74 74 75 77 70 76 72 81 71 71 78 80Small/Not a problem at all 23 24 25 22 21 29 22 24 19 26 27 21 19
Q. 12 When the Country Will Resume Normal ActivityTotal Answering (1200) (256) (301) (312) (304) (262) (307) (318) (304) (252) (316) (312) (285)Today or the next few days 1 0 0 1 1 0 0 0 1 1 - 1 1A week or two 2 3 3 1 1 4 3 2 1 3 2 1 2Two weeks to a month 5 5 5 4 4 7 4 4 4 5 5 5 4One to two months 8 9 8 8 6 7 10 6 8 5 8 11 6Two to four months 13 16 14 14 9 15 14 12 11 18 10 13 13Four to six months 18 18 18 18 19 16 19 19 18 14 21 21 16More than six months 50 46 47 49 56 45 49 53 54 49 50 48 54(Don't know/refused) 4 3 5 5 5 5 2 5 3 5 5 2 3
Q. 13 A. Coronavirus Job Approval - President Donald TrumpTotal Answering (1200) (256) (301) (312) (304) (262) (307) (318) (304) (252) (316) (312) (285)Approve strongly 24 23 33 14 27 34 24 23 17 21 33 15 26Approve somewhat 20 18 18 24 20 21 15 24 20 26 20 18 18Disapprove somewhat 11 13 8 13 9 11 10 13 8 16 9 11 7Disapprove strongly 42 44 38 44 43 31 49 36 53 31 35 55 48(Unsure/don't know/refused) 3 3 3 5 2 3 2 5 2 6 3 2 2Total approve 44 40 51 38 46 55 39 47 38 47 53 33 44Total disapprove 53 57 47 57 52 42 59 49 61 47 44 66 55Total approve - Total disapprove -9 -16 5 -19 -6 13 -21 -2 -24 0 10 -33 -11
TargetSmart Communications 1155 15th St, NW, Suite 750, Washington, DC 20005 targetsmart.com
21 of 228
Page 22
May 21-27, 2020
National Voter Insights Study
TargetSmart + Dynata
Marital Status/Gender Marital Status/Kids Trump Job Approval
Voting Permissions by State
Total
Marr ied
Men
Marr ied
WomenUnmarr ied Men
Unmarr ied
Women
Marr ied
with kids
Marr ied with out kids
Unmarr ied with
kids
Unmarr ied with out kids
Total appr ove
Total disapp rove All mail
Open early / mail Closed
Party ID Difference...2-3-2 PARTY ID Dem-Rep 4 -17 -5 9 30 -4 -15 19 22 -50 50 -9 4 83-1-3 PARTY ID Dem-Rep 7 -22 -4 16 39 -2 -19 22 31 -65 67 -5 9 8
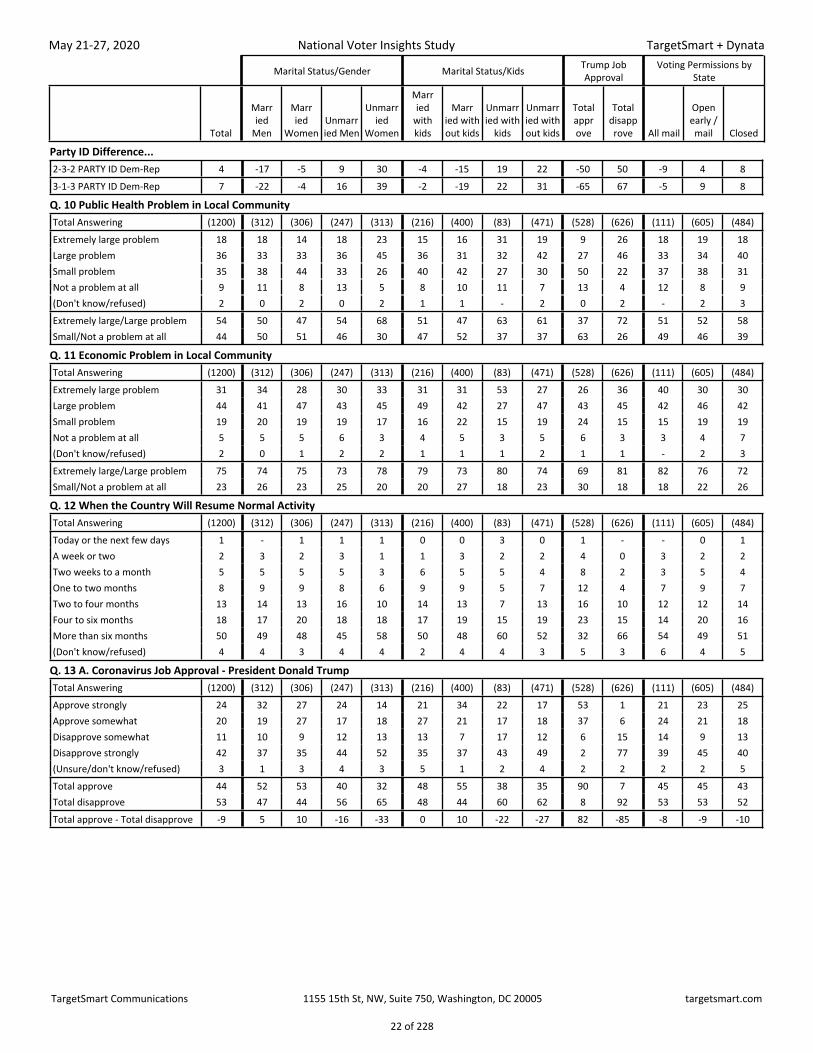
Q. 10 Public Health Problem in Local CommunityTotal Answering (1200) (312) (306) (247) (313) (216) (400) (83) (471) (528) (626) (111) (605) (484)Extremely large problem 18 18 14 18 23 15 16 31 19 9 26 18 19 18Large problem 36 33 33 36 45 36 31 32 42 27 46 33 34 40Small problem 35 38 44 33 26 40 42 27 30 50 22 37 38 31Not a problem at all 9 11 8 13 5 8 10 11 7 13 4 12 8 9(Don't know/refused) 2 0 2 0 2 1 1 - 2 0 2 - 2 3Extremely large/Large problem 54 50 47 54 68 51 47 63 61 37 72 51 52 58Small/Not a problem at all 44 50 51 46 30 47 52 37 37 63 26 49 46 39
Q. 11 Economic Problem in Local CommunityTotal Answering (1200) (312) (306) (247) (313) (216) (400) (83) (471) (528) (626) (111) (605) (484)Extremely large problem 31 34 28 30 33 31 31 53 27 26 36 40 30 30Large problem 44 41 47 43 45 49 42 27 47 43 45 42 46 42Small problem 19 20 19 19 17 16 22 15 19 24 15 15 19 19Not a problem at all 5 5 5 6 3 4 5 3 5 6 3 3 4 7(Don't know/refused) 2 0 1 2 2 1 1 1 2 1 1 - 2 3Extremely large/Large problem 75 74 75 73 78 79 73 80 74 69 81 82 76 72Small/Not a problem at all 23 26 23 25 20 20 27 18 23 30 18 18 22 26
Q. 12 When the Country Will Resume Normal ActivityTotal Answering (1200) (312) (306) (247) (313) (216) (400) (83) (471) (528) (626) (111) (605) (484)Today or the next few days 1 - 1 1 1 0 0 3 0 1 - - 0 1A week or two 2 3 2 3 1 1 3 2 2 4 0 3 2 2Two weeks to a month 5 5 5 5 3 6 5 5 4 8 2 3 5 4One to two months 8 9 9 8 6 9 9 5 7 12 4 7 9 7Two to four months 13 14 13 16 10 14 13 7 13 16 10 12 12 14Four to six months 18 17 20 18 18 17 19 15 19 23 15 14 20 16More than six months 50 49 48 45 58 50 48 60 52 32 66 54 49 51(Don't know/refused) 4 4 3 4 4 2 4 4 3 5 3 6 4 5
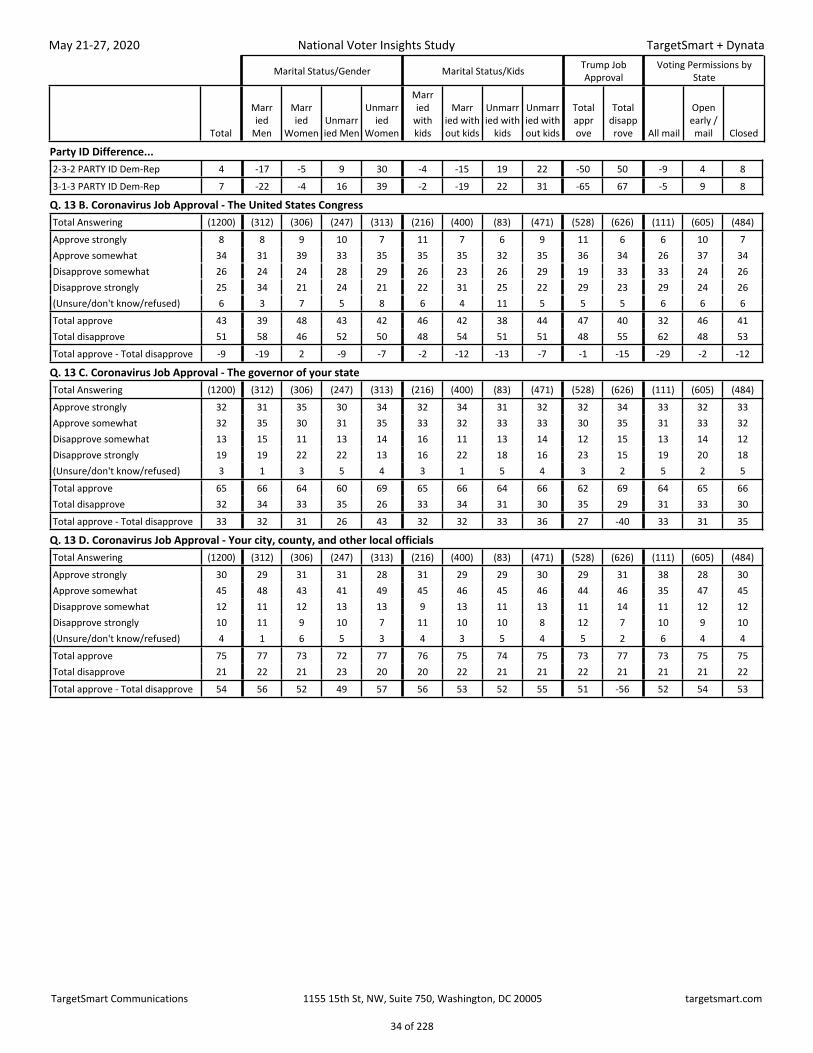
Q. 13 A. Coronavirus Job Approval - President Donald TrumpTotal Answering (1200) (312) (306) (247) (313) (216) (400) (83) (471) (528) (626) (111) (605) (484)Approve strongly 24 32 27 24 14 21 34 22 17 53 1 21 23 25Approve somewhat 20 19 27 17 18 27 21 17 18 37 6 24 21 18Disapprove somewhat 11 10 9 12 13 13 7 17 12 6 15 14 9 13Disapprove strongly 42 37 35 44 52 35 37 43 49 2 77 39 45 40(Unsure/don't know/refused) 3 1 3 4 3 5 1 2 4 2 2 2 2 5Total approve 44 52 53 40 32 48 55 38 35 90 7 45 45 43Total disapprove 53 47 44 56 65 48 44 60 62 8 92 53 53 52Total approve - Total disapprove -9 5 10 -16 -33 0 10 -22 -27 82 -85 -8 -9 -10
TargetSmart Communications 1155 15th St, NW, Suite 750, Washington, DC 20005 targetsmart.com
22 of 228
Page 23
May 21-27, 2020
National Voter Insights Study
TargetSmart + Dynata
Permanent Absentee Voter
Status
Ever Voted Early or By Mail
First Time Voters in 2018 2016 Vote History TargetSmart Voter Score
Total PAVNot PAV Yes No Yes No Voted
Did not Vote
Was Not
Regist ered
Super Voter
Freq uent Voter
Infreq uent Voter
Never Voted
Party ID Difference...2-3-2 PARTY ID Dem-Rep 4 16 3 1 5 4 5 2 4 17 0 1 9 73-1-3 PARTY ID Dem-Rep 7 22 5 0 9 9 7 2 8 26 -4 5 13 14
Q. 10 Public Health Problem in Local CommunityTotal Answering (1200) (130) (1070) (220) (980) (176) (1024) (757) (266) (177) (221) (393) (393) (137)Extremely large problem 18 21 18 16 19 13 19 17 20 20 17 18 21 14Large problem 36 31 37 37 36 37 36 35 38 38 35 36 37 38Small problem 35 39 34 38 34 37 34 36 33 32 37 35 31 36Not a problem at all 9 8 9 8 9 9 9 10 7 7 9 9 9 10(Don't know/refused) 2 1 2 1 2 4 2 2 2 3 3 1 2 2Extremely large/Large problem 54 52 55 53 55 50 55 52 58 58 51 54 58 52Small/Not a problem at all 44 47 43 46 43 46 43 46 40 39 46 44 40 46
Q. 11 Economic Problem in Local CommunityTotal Answering (1200) (130) (1070) (220) (980) (176) (1024) (757) (266) (177) (221) (393) (393) (137)Extremely large problem 31 40 30 32 31 21 33 32 25 35 35 31 33 23Large problem 44 41 44 45 43 47 43 44 45 41 46 42 42 48Small problem 19 14 19 18 19 22 18 19 20 16 16 19 18 19Not a problem at all 5 3 5 5 5 7 4 4 6 4 2 6 4 9(Don't know/refused) 2 2 2 1 2 2 2 2 3 4 2 2 3 1Extremely large/Large problem 75 81 74 77 74 68 76 76 70 77 80 73 75 71Small/Not a problem at all 23 17 24 22 24 30 22 23 27 20 18 25 22 28
Q. 12 When the Country Will Resume Normal ActivityTotal Answering (1200) (130) (1070) (220) (980) (176) (1024) (757) (266) (177) (221) (393) (393) (137)Today or the next few days 1 1 0 1 1 - 1 1 0 1 0 1 1 -A week or two 2 3 2 2 2 1 2 2 1 2 1 2 3 2Two weeks to a month 5 3 5 4 5 6 4 5 5 4 4 5 4 7One to two months 8 9 8 9 7 8 8 8 9 7 7 9 7 7Two to four months 13 14 13 13 13 15 13 13 14 11 14 12 12 12Four to six months 18 14 18 20 18 19 18 17 19 21 18 18 18 19More than six months 50 52 50 48 51 46 51 51 47 51 51 49 53 50(Don't know/refused) 4 2 5 4 5 5 4 4 5 3 6 4 3 5
Q. 13 A. Coronavirus Job Approval - President Donald TrumpTotal Answering (1200) (130) (1070) (220) (980) (176) (1024) (757) (266) (177) (221) (393) (393) (137)Approve strongly 24 20 25 31 22 27 24 26 22 20 25 28 20 28Approve somewhat 20 16 20 16 21 18 20 21 21 16 19 18 23 19Disapprove somewhat 11 9 11 9 11 17 10 10 12 12 8 10 10 16Disapprove strongly 42 54 41 43 42 37 43 42 41 46 46 43 42 35(Unsure/don't know/refused) 3 2 3 1 4 2 3 2 4 6 2 2 6 2Total approve 44 36 45 47 43 44 44 46 43 36 44 46 42 47Total disapprove 53 62 52 52 53 54 53 52 53 58 55 53 52 52Total approve - Total disapprove -9 -27 -7 -5 -10 -10 -9 -6 -10 -22 -11 -7 -9 -5
TargetSmart Communications 1155 15th St, NW, Suite 750, Washington, DC 20005 targetsmart.com
23 of 228
Page 24
May 21-27, 2020
National Voter Insights Study
TargetSmart + Dynata
Partisan Score Presidential General Turnout Score Mode
Total 0 to 9.9 10 to 89.9 90+ 0 to 69.9 70+ Web Land line Wire less
Party ID Difference...2-3-2 PARTY ID Dem-Rep 4 -48 -4 53 4 5 3 -3 83-1-3 PARTY ID Dem-Rep 7 -55 -1 62 10 5 4 -6 15
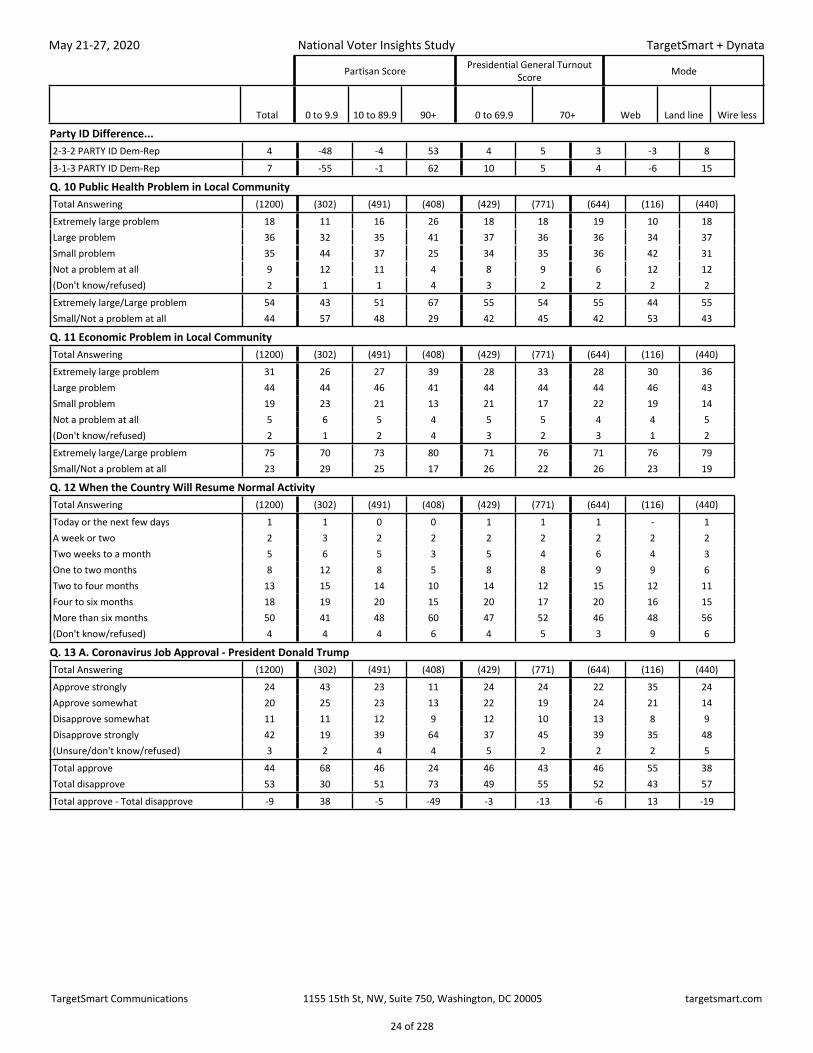
Q. 10 Public Health Problem in Local CommunityTotal Answering (1200) (302) (491) (408) (429) (771) (644) (116) (440)Extremely large problem 18 11 16 26 18 18 19 10 18Large problem 36 32 35 41 37 36 36 34 37Small problem 35 44 37 25 34 35 36 42 31Not a problem at all 9 12 11 4 8 9 6 12 12(Don't know/refused) 2 1 1 4 3 2 2 2 2Extremely large/Large problem 54 43 51 67 55 54 55 44 55Small/Not a problem at all 44 57 48 29 42 45 42 53 43
Q. 11 Economic Problem in Local CommunityTotal Answering (1200) (302) (491) (408) (429) (771) (644) (116) (440)Extremely large problem 31 26 27 39 28 33 28 30 36Large problem 44 44 46 41 44 44 44 46 43Small problem 19 23 21 13 21 17 22 19 14Not a problem at all 5 6 5 4 5 5 4 4 5(Don't know/refused) 2 1 2 4 3 2 3 1 2Extremely large/Large problem 75 70 73 80 71 76 71 76 79Small/Not a problem at all 23 29 25 17 26 22 26 23 19
Q. 12 When the Country Will Resume Normal ActivityTotal Answering (1200) (302) (491) (408) (429) (771) (644) (116) (440)Today or the next few days 1 1 0 0 1 1 1 - 1A week or two 2 3 2 2 2 2 2 2 2Two weeks to a month 5 6 5 3 5 4 6 4 3One to two months 8 12 8 5 8 8 9 9 6Two to four months 13 15 14 10 14 12 15 12 11Four to six months 18 19 20 15 20 17 20 16 15More than six months 50 41 48 60 47 52 46 48 56(Don't know/refused) 4 4 4 6 4 5 3 9 6
Q. 13 A. Coronavirus Job Approval - President Donald TrumpTotal Answering (1200) (302) (491) (408) (429) (771) (644) (116) (440)Approve strongly 24 43 23 11 24 24 22 35 24Approve somewhat 20 25 23 13 22 19 24 21 14Disapprove somewhat 11 11 12 9 12 10 13 8 9Disapprove strongly 42 19 39 64 37 45 39 35 48(Unsure/don't know/refused) 3 2 4 4 5 2 2 2 5Total approve 44 68 46 24 46 43 46 55 38Total disapprove 53 30 51 73 49 55 52 43 57Total approve - Total disapprove -9 38 -5 -49 -3 -13 -6 13 -19
TargetSmart Communications 1155 15th St, NW, Suite 750, Washington, DC 20005 targetsmart.com
24 of 228
Page 25
May 21-27, 2020
National Voter Insights Study
TargetSmart + Dynata
2-3-2 Party 3-1-3 Party Ideology Party ID/Ideology
Total Dem Ind Rep Dem Ind Rep Lib Mod ConsLib
Dem
Mod / Cons Dem
Mod / Lib Rep
Cons Rep
Party ID Difference...2-3-2 PARTY ID Dem-Rep 4 100 - -100 73 - -75 68 6 -52 100 100 -100 -1003-1-3 PARTY ID Dem-Rep 7 100 8 -100 100 - -100 85 10 -63 100 100 -100 -100
Q. 13 B. Coronavirus Job Approval - The United States CongressTotal Answering (1200) (415) (395) (362) (566) (124) (482) (304) (469) (368) (213) (189) (117) (239)Approve strongly 8 9 5 11 8 9 8 7 9 9 7 10 12 10Approve somewhat 34 40 27 38 36 27 35 34 38 33 38 43 47 33Disapprove somewhat 26 28 29 21 30 27 21 33 28 19 32 25 25 19Disapprove strongly 25 17 34 27 20 31 31 20 22 34 16 16 13 33(Unsure/don't know/refused) 6 6 6 4 6 7 4 7 4 5 7 5 3 5Total approve 43 49 32 48 44 35 44 41 46 42 45 54 59 43Total disapprove 51 45 63 48 50 58 52 53 50 52 48 41 38 53Total approve - Total disapprove -9 4 -31 0 -6 -23 -9 -12 -4 -10 -3 12 22 -10
Q. 13 C. Coronavirus Job Approval - The governor of your stateTotal Answering (1200) (415) (395) (362) (566) (124) (482) (304) (469) (368) (213) (189) (117) (239)Approve strongly 32 35 31 32 38 24 29 36 33 30 35 36 33 30Approve somewhat 32 35 28 35 34 26 33 31 37 29 34 36 44 32Disapprove somewhat 13 12 17 11 12 22 12 11 15 13 9 16 9 12Disapprove strongly 19 16 19 21 14 19 23 19 13 25 21 10 14 25(Unsure/don't know/refused) 3 3 5 1 2 9 3 3 2 3 2 3 - 1Total approve 65 70 59 67 72 50 62 67 70 59 69 72 77 62Total disapprove 32 28 36 32 27 41 35 30 28 38 30 26 23 37Total approve - Total disapprove 33 43 23 35 45 9 27 36 42 21 39 46 54 25
Q. 13 D. Coronavirus Job Approval - Your city, county, and other local officialsTotal Answering (1200) (415) (395) (362) (566) (124) (482) (304) (469) (368) (213) (189) (117) (239)Approve strongly 30 33 27 31 32 30 29 27 31 31 31 34 30 31Approve somewhat 45 47 44 45 47 37 46 50 46 42 49 45 47 45Disapprove somewhat 12 10 15 10 11 15 11 11 13 11 9 12 11 10Disapprove strongly 10 8 11 9 8 10 11 9 7 12 10 6 7 10(Unsure/don't know/refused) 4 2 4 4 3 8 3 3 3 4 2 2 5 4Total approve 75 79 71 76 78 67 74 77 77 73 80 80 77 76Total disapprove 21 18 26 20 19 25 22 21 20 23 18 18 18 20Total approve - Total disapprove 54 61 45 57 59 41 52 56 57 49 62 61 58 56
TargetSmart Communications 1155 15th St, NW, Suite 750, Washington, DC 20005 targetsmart.com
25 of 228
Page 26
May 21-27, 2020
National Voter Insights Study
TargetSmart + Dynata
Party ID/Gender
Total Dem MenDem
Women Ind MenInd
Women Rep MenRep
Women
Party ID Difference...2-3-2 PARTY ID Dem-Rep 4 100 100 - - -100 -1003-1-3 PARTY ID Dem-Rep 7 100 100 1 17 -100 -100
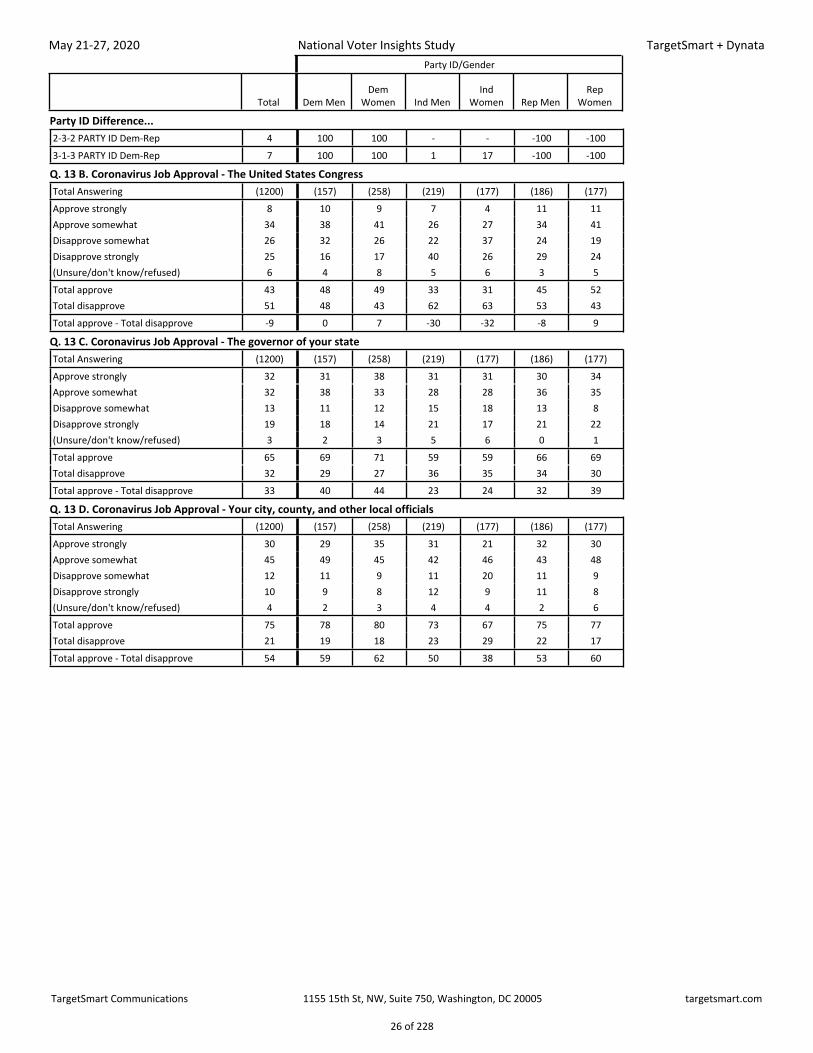
Q. 13 B. Coronavirus Job Approval - The United States CongressTotal Answering (1200) (157) (258) (219) (177) (186) (177)Approve strongly 8 10 9 7 4 11 11Approve somewhat 34 38 41 26 27 34 41Disapprove somewhat 26 32 26 22 37 24 19Disapprove strongly 25 16 17 40 26 29 24(Unsure/don't know/refused) 6 4 8 5 6 3 5Total approve 43 48 49 33 31 45 52Total disapprove 51 48 43 62 63 53 43Total approve - Total disapprove -9 0 7 -30 -32 -8 9
Q. 13 C. Coronavirus Job Approval - The governor of your stateTotal Answering (1200) (157) (258) (219) (177) (186) (177)Approve strongly 32 31 38 31 31 30 34Approve somewhat 32 38 33 28 28 36 35Disapprove somewhat 13 11 12 15 18 13 8Disapprove strongly 19 18 14 21 17 21 22(Unsure/don't know/refused) 3 2 3 5 6 0 1Total approve 65 69 71 59 59 66 69Total disapprove 32 29 27 36 35 34 30Total approve - Total disapprove 33 40 44 23 24 32 39
Q. 13 D. Coronavirus Job Approval - Your city, county, and other local officialsTotal Answering (1200) (157) (258) (219) (177) (186) (177)Approve strongly 30 29 35 31 21 32 30Approve somewhat 45 49 45 42 46 43 48Disapprove somewhat 12 11 9 11 20 11 9Disapprove strongly 10 9 8 12 9 11 8(Unsure/don't know/refused) 4 2 3 4 4 2 6Total approve 75 78 80 73 67 75 77Total disapprove 21 19 18 23 29 22 17Total approve - Total disapprove 54 59 62 50 38 53 60
TargetSmart Communications 1155 15th St, NW, Suite 750, Washington, DC 20005 targetsmart.com
26 of 228
Page 27
May 21-27, 2020
National Voter Insights Study
TargetSmart + Dynata
Urbanicity
Total R1 R2 S3 S4 U5 U6 Rural Subu rban Urban
Party ID Difference...2-3-2 PARTY ID Dem-Rep 4 -23 -15 -2 9 22 42 -19 4 283-1-3 PARTY ID Dem-Rep 7 -23 -17 -1 12 26 52 -20 7 33
Q. 13 B. Coronavirus Job Approval - The United States CongressTotal Answering (1200) (179) (181) (195) (273) (264) (108) (360) (468) (372)Approve strongly 8 10 7 11 6 9 8 8 8 9Approve somewhat 34 34 37 36 31 35 35 36 33 35Disapprove somewhat 26 21 27 22 29 28 26 24 26 28Disapprove strongly 25 31 26 22 25 23 29 29 23 25(Unsure/don't know/refused) 6 4 4 9 9 5 3 4 9 5Total approve 43 44 44 48 37 44 43 44 42 43Total disapprove 51 52 53 44 54 51 55 52 50 52Total approve - Total disapprove -9 -8 -9 4 -17 -8 -12 -8 -8 -9
Q. 13 C. Coronavirus Job Approval - The governor of your stateTotal Answering (1200) (179) (181) (195) (273) (264) (108) (360) (468) (372)Approve strongly 32 35 30 37 26 35 35 32 31 35Approve somewhat 32 33 35 25 34 31 38 34 30 33Disapprove somewhat 13 9 14 16 14 13 11 12 15 13Disapprove strongly 19 21 19 19 21 17 13 20 20 16(Unsure/don't know/refused) 3 1 2 3 6 3 4 2 4 3Total approve 65 68 65 63 60 66 73 67 61 68Total disapprove 32 30 33 34 35 30 24 32 35 28Total approve - Total disapprove 33 38 32 29 25 36 49 35 26 40
Q. 13 D. Coronavirus Job Approval - Your city, county, and other local officialsTotal Answering (1200) (179) (181) (195) (273) (264) (108) (360) (468) (372)Approve strongly 30 35 29 30 27 29 33 32 28 30Approve somewhat 45 45 50 49 39 46 45 48 43 46Disapprove somewhat 12 10 12 11 17 10 9 11 14 9Disapprove strongly 10 7 9 6 12 11 11 8 10 11(Unsure/don't know/refused) 4 3 1 4 6 5 2 2 5 4Total approve 75 80 78 79 66 74 78 79 71 75Total disapprove 21 17 21 18 29 21 20 19 24 20Total approve - Total disapprove 54 63 57 61 37 54 58 60 47 55
TargetSmart Communications 1155 15th St, NW, Suite 750, Washington, DC 20005 targetsmart.com
27 of 228
Page 28
May 21-27, 2020
National Voter Insights Study
TargetSmart + Dynata
Urbanicity/Gender
Total Rural MenRural
WomenSubu rban
MenSubu rban Women Urban Men
Urban Women
Party ID Difference...2-3-2 PARTY ID Dem-Rep 4 -23 -15 -4 12 13 393-1-3 PARTY ID Dem-Rep 7 -28 -13 -1 15 16 48
Q. 13 B. Coronavirus Job Approval - The United States CongressTotal Answering (1200) (180) (180) (227) (241) (164) (208)Approve strongly 8 8 9 8 9 11 6Approve somewhat 34 32 39 32 35 33 37Disapprove somewhat 26 24 24 27 26 25 29Disapprove strongly 25 33 24 28 20 28 22(Unsure/don't know/refused) 6 3 5 6 11 3 6Total approve 43 40 48 39 43 44 43Total disapprove 51 57 48 54 46 53 51Total approve - Total disapprove -9 -17 0 -15 -2 -10 -8
Q. 13 C. Coronavirus Job Approval - The governor of your stateTotal Answering (1200) (180) (180) (227) (241) (164) (208)Approve strongly 32 32 33 30 31 31 38Approve somewhat 32 33 36 29 32 39 29Disapprove somewhat 13 13 10 16 13 11 14Disapprove strongly 19 22 18 21 20 17 15(Unsure/don't know/refused) 3 1 3 5 4 2 4Total approve 65 65 68 58 63 70 67Total disapprove 32 35 29 37 33 28 29Total approve - Total disapprove 33 30 40 22 31 42 38
Q. 13 D. Coronavirus Job Approval - Your city, county, and other local officialsTotal Answering (1200) (180) (180) (227) (241) (164) (208)Approve strongly 30 33 30 27 29 33 28Approve somewhat 45 45 50 44 42 44 47Disapprove somewhat 12 11 12 14 15 9 10Disapprove strongly 10 10 6 10 9 13 10(Unsure/don't know/refused) 4 1 2 5 5 2 6Total approve 75 78 80 71 71 77 74Total disapprove 21 21 17 24 24 21 20Total approve - Total disapprove 54 57 63 47 47 56 55
TargetSmart Communications 1155 15th St, NW, Suite 750, Washington, DC 20005 targetsmart.com
28 of 228
Page 29
May 21-27, 2020
National Voter Insights Study
TargetSmart + Dynata
Region by State
TotalBorder States
Califo rnia
Indust rial
Midw est
Lower Midw
estMid -
Atla ntic
Moun tain
States
Nati onal
Capi talNew
Engl and
Paci fic Northw
est SouthSouthe
ast
Upper Midw
est
Party ID Difference...2-3-2 PARTY ID Dem-Rep 4 4 19 -11 16 15 2 5 17 -7 -3 3 13-1-3 PARTY ID Dem-Rep 7 -5 27 -6 17 21 5 15 29 2 -9 8 -8
Q. 13 B. Coronavirus Job Approval - The United States CongressTotal Answering (1200) (132) (120) (157) (60) (158) (48) (60) (60) (48) (108) (193) (48)Approve strongly 8 8 7 8 5 10 14 10 - 10 7 10 11Approve somewhat 34 38 29 39 47 31 21 33 37 26 32 39 32Disapprove somewhat 26 31 26 17 25 31 27 19 31 34 24 25 24Disapprove strongly 25 15 28 31 20 23 34 32 20 26 34 21 28(Unsure/don't know/refused) 6 8 10 5 3 6 5 6 13 4 4 4 5Total approve 43 46 36 47 53 40 34 43 37 36 39 49 43Total disapprove 51 46 54 48 45 54 61 51 50 60 57 47 52Total approve - Total disapprove -9 0 -18 -1 8 -14 -27 -8 -13 -24 -19 2 -9
Q. 13 C. Coronavirus Job Approval - The governor of your stateTotal Answering (1200) (132) (120) (157) (60) (158) (48) (60) (60) (48) (108) (193) (48)Approve strongly 32 39 32 43 23 30 36 36 24 33 31 24 38Approve somewhat 32 24 38 30 43 34 33 21 48 28 40 31 24Disapprove somewhat 13 16 9 7 19 13 14 15 11 9 12 17 15Disapprove strongly 19 17 18 16 16 19 16 25 7 27 15 27 21(Unsure/don't know/refused) 3 5 2 4 - 5 1 3 11 3 3 1 3Total approve 65 63 70 73 66 64 69 57 72 61 70 55 62Total disapprove 32 33 28 23 34 31 30 40 17 36 27 44 36Total approve - Total disapprove 33 30 42 50 31 33 39 17 55 25 43 12 26
Q. 13 D. Coronavirus Job Approval - Your city, county, and other local officialsTotal Answering (1200) (132) (120) (157) (60) (158) (48) (60) (60) (48) (108) (193) (48)Approve strongly 30 36 28 32 33 28 31 25 17 40 37 23 32Approve somewhat 45 44 44 45 36 45 43 49 57 35 41 52 42Disapprove somewhat 12 11 13 10 21 11 16 15 13 7 9 12 10Disapprove strongly 10 7 12 9 6 12 8 7 0 12 12 10 12(Unsure/don't know/refused) 4 3 2 4 5 5 3 5 13 6 1 3 4Total approve 75 80 72 77 69 73 73 73 74 75 78 75 74Total disapprove 21 17 25 19 26 23 24 22 13 19 22 22 22Total approve - Total disapprove 54 63 47 58 43 50 49 52 61 57 56 53 52
TargetSmart Communications 1155 15th St, NW, Suite 750, Washington, DC 20005 targetsmart.com
29 of 228
Page 30
May 21-27, 2020
National Voter Insights Study
TargetSmart + Dynata
Gender Age
Total Men Women 18 - 34 35 - 49 50 - 64 Over 64 18 - 4950 and
over
Party ID Difference...2-3-2 PARTY ID Dem-Rep 4 -5 13 24 6 -2 -8 15 -53-1-3 PARTY ID Dem-Rep 7 -5 18 33 8 0 -10 21 -5
Q. 13 B. Coronavirus Job Approval - The United States CongressTotal Answering (1200) (571) (629) (281) (287) (310) (295) (568) (605)Approve strongly 8 9 8 8 8 10 7 8 8Approve somewhat 34 32 37 40 35 31 33 37 32Disapprove somewhat 26 25 27 28 27 26 24 28 25Disapprove strongly 25 30 22 17 22 28 32 20 30(Unsure/don't know/refused) 6 4 8 7 7 4 5 7 5Total approve 43 41 44 48 43 41 40 46 41Total disapprove 51 55 48 45 50 54 55 47 55Total approve - Total disapprove -9 -14 -4 3 -7 -13 -15 -2 -14
Q. 13 C. Coronavirus Job Approval - The governor of your stateTotal Answering (1200) (571) (629) (281) (287) (310) (295) (568) (605)Approve strongly 32 31 34 23 29 35 42 26 38Approve somewhat 32 33 32 38 30 34 28 34 31Disapprove somewhat 13 14 13 17 14 10 12 16 11Disapprove strongly 19 20 18 18 20 20 17 19 19(Unsure/don't know/refused) 3 3 4 4 6 1 2 5 1Total approve 65 64 66 61 60 69 70 61 69Total disapprove 32 34 30 35 34 30 29 35 29Total approve - Total disapprove 33 30 36 26 26 38 41 26 40
Q. 13 D. Coronavirus Job Approval - Your city, county, and other local officialsTotal Answering (1200) (571) (629) (281) (287) (310) (295) (568) (605)Approve strongly 30 31 29 24 26 32 35 25 34Approve somewhat 45 44 46 45 47 45 45 46 45Disapprove somewhat 12 11 12 19 10 11 9 14 10Disapprove strongly 10 11 8 8 13 10 8 10 9(Unsure/don't know/refused) 4 3 5 5 4 3 3 4 3Total approve 75 75 75 69 73 76 81 71 78Total disapprove 21 22 21 27 23 21 16 25 18Total approve - Total disapprove 54 53 54 42 50 56 65 46 60
TargetSmart Communications 1155 15th St, NW, Suite 750, Washington, DC 20005 targetsmart.com
30 of 228
Page 31
May 21-27, 2020
National Voter Insights Study
TargetSmart + Dynata
Education Homeownership status Marital status
TotalH.S. or
lessPost H.S.
4yr Coll Grad
Post Grad
Coll ege Grad uate
Total Non Coll Rent Own
Marr ied Single
Separa ted / divo rced
Wido wed
Total Unmarr
ied
Party ID Difference...2-3-2 PARTY ID Dem-Rep 4 5 -3 6 13 9 0 32 -5 -11 30 10 -6 213-1-3 PARTY ID Dem-Rep 7 3 -1 9 20 14 0 44 -6 -13 42 12 -10 29
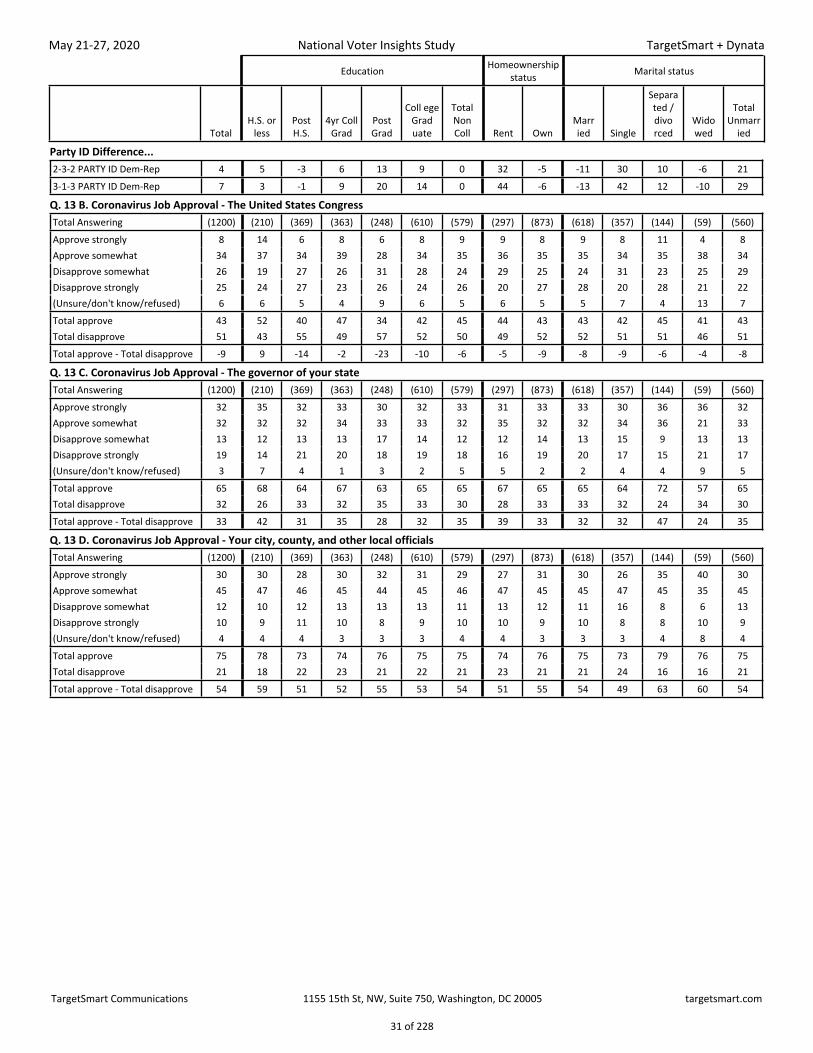
Q. 13 B. Coronavirus Job Approval - The United States CongressTotal Answering (1200) (210) (369) (363) (248) (610) (579) (297) (873) (618) (357) (144) (59) (560)Approve strongly 8 14 6 8 6 8 9 9 8 9 8 11 4 8Approve somewhat 34 37 34 39 28 34 35 36 35 35 34 35 38 34Disapprove somewhat 26 19 27 26 31 28 24 29 25 24 31 23 25 29Disapprove strongly 25 24 27 23 26 24 26 20 27 28 20 28 21 22(Unsure/don't know/refused) 6 6 5 4 9 6 5 6 5 5 7 4 13 7Total approve 43 52 40 47 34 42 45 44 43 43 42 45 41 43Total disapprove 51 43 55 49 57 52 50 49 52 52 51 51 46 51Total approve - Total disapprove -9 9 -14 -2 -23 -10 -6 -5 -9 -8 -9 -6 -4 -8
Q. 13 C. Coronavirus Job Approval - The governor of your stateTotal Answering (1200) (210) (369) (363) (248) (610) (579) (297) (873) (618) (357) (144) (59) (560)Approve strongly 32 35 32 33 30 32 33 31 33 33 30 36 36 32Approve somewhat 32 32 32 34 33 33 32 35 32 32 34 36 21 33Disapprove somewhat 13 12 13 13 17 14 12 12 14 13 15 9 13 13Disapprove strongly 19 14 21 20 18 19 18 16 19 20 17 15 21 17(Unsure/don't know/refused) 3 7 4 1 3 2 5 5 2 2 4 4 9 5Total approve 65 68 64 67 63 65 65 67 65 65 64 72 57 65Total disapprove 32 26 33 32 35 33 30 28 33 33 32 24 34 30Total approve - Total disapprove 33 42 31 35 28 32 35 39 33 32 32 47 24 35
Q. 13 D. Coronavirus Job Approval - Your city, county, and other local officialsTotal Answering (1200) (210) (369) (363) (248) (610) (579) (297) (873) (618) (357) (144) (59) (560)Approve strongly 30 30 28 30 32 31 29 27 31 30 26 35 40 30Approve somewhat 45 47 46 45 44 45 46 47 45 45 47 45 35 45Disapprove somewhat 12 10 12 13 13 13 11 13 12 11 16 8 6 13Disapprove strongly 10 9 11 10 8 9 10 10 9 10 8 8 10 9(Unsure/don't know/refused) 4 4 4 3 3 3 4 4 3 3 3 4 8 4Total approve 75 78 73 74 76 75 75 74 76 75 73 79 76 75Total disapprove 21 18 22 23 21 22 21 23 21 21 24 16 16 21Total approve - Total disapprove 54 59 51 52 55 53 54 51 55 54 49 63 60 54
TargetSmart Communications 1155 15th St, NW, Suite 750, Washington, DC 20005 targetsmart.com
31 of 228
Page 32
May 21-27, 2020
National Voter Insights Study
TargetSmart + Dynata
Kids at home Religious attendance
Total Yes No
More than
once a week
Once a week
Once or twice a month
A few times a
year Seldom NeverFreq uent
Infreq uent
Seldom / Never
Party ID Difference...2-3-2 PARTY ID Dem-Rep 4 2 6 -10 -15 5 7 6 24 -14 6 163-1-3 PARTY ID Dem-Rep 7 5 9 -19 -17 -5 14 9 35 -17 7 24
Q. 13 B. Coronavirus Job Approval - The United States CongressTotal Answering (1200) (301) (876) (89) (251) (121) (190) (212) (301) (340) (311) (513)Approve strongly 8 10 8 13 9 10 10 6 7 10 10 7Approve somewhat 34 34 35 23 33 35 39 34 36 30 37 35Disapprove somewhat 26 26 26 22 24 24 26 27 29 24 25 28Disapprove strongly 25 23 26 38 26 27 22 26 23 29 24 24(Unsure/don't know/refused) 6 8 5 3 9 3 4 7 5 7 4 6Total approve 43 44 43 37 42 46 48 40 43 40 47 42Total disapprove 51 49 52 60 50 51 48 53 52 52 49 52Total approve - Total disapprove -9 -5 -10 -24 -8 -5 0 -13 -9 -12 -2 -10
Q. 13 C. Coronavirus Job Approval - The governor of your stateTotal Answering (1200) (301) (876) (89) (251) (121) (190) (212) (301) (340) (311) (513)Approve strongly 32 31 33 39 31 25 36 36 33 33 32 34Approve somewhat 32 34 33 23 33 40 32 34 32 31 35 33Disapprove somewhat 13 15 13 12 15 14 10 10 15 14 12 13Disapprove strongly 19 17 19 21 18 18 21 18 17 19 20 17(Unsure/don't know/refused) 3 3 3 5 3 3 1 3 4 3 2 3Total approve 65 65 66 63 64 65 69 70 65 64 67 67Total disapprove 32 32 32 33 34 32 31 28 32 33 31 30Total approve - Total disapprove 33 33 34 30 30 33 38 42 33 30 36 37
Q. 13 D. Coronavirus Job Approval - Your city, county, and other local officialsTotal Answering (1200) (301) (876) (89) (251) (121) (190) (212) (301) (340) (311) (513)Approve strongly 30 30 29 45 33 24 32 33 22 36 29 27Approve somewhat 45 45 46 29 42 50 49 44 51 38 49 48Disapprove somewhat 12 10 13 10 13 10 8 12 14 12 9 13Disapprove strongly 10 11 9 14 9 13 10 8 7 10 11 7(Unsure/don't know/refused) 4 5 3 2 4 3 1 3 6 3 2 5Total approve 75 75 75 73 75 74 81 77 73 74 79 75Total disapprove 21 20 21 25 22 23 18 21 21 22 20 21Total approve - Total disapprove 54 55 54 49 53 51 64 56 52 52 59 54
TargetSmart Communications 1155 15th St, NW, Suite 750, Washington, DC 20005 targetsmart.com
32 of 228
Page 33
May 21-27, 2020
National Voter Insights Study
TargetSmart + Dynata
Gender/Age Gender/Education Age/Education
TotalYoun
ger MenOlder Men
Youn ger
WomenOlder
WomenNon Coll
MenColl Men
Non Coll Women
Coll Women
Youn ger Non
CollOlder
Non Coll
Youn ger Coll
egeOlder Coll
Party ID Difference...2-3-2 PARTY ID Dem-Rep 4 7 -15 21 6 -9 -2 7 19 6 -4 22 -53-1-3 PARTY ID Dem-Rep 7 12 -19 28 8 -12 1 10 26 8 -7 31 -3
Q. 13 B. Coronavirus Job Approval - The United States CongressTotal Answering (1200) (256) (301) (312) (304) (262) (307) (318) (304) (252) (316) (312) (285)Approve strongly 8 10 7 6 10 9 9 10 7 9 10 7 7Approve somewhat 34 35 30 39 34 35 30 36 38 38 33 37 31Disapprove somewhat 26 27 25 28 25 21 29 27 27 25 24 30 26Disapprove strongly 25 22 35 18 25 30 29 23 20 20 31 20 28(Unsure/don't know/refused) 6 5 3 9 6 5 4 6 9 8 3 6 7Total approve 43 46 37 45 44 44 39 45 45 47 43 45 39Total disapprove 51 49 60 46 50 52 58 49 47 46 55 50 54Total approve - Total disapprove -9 -4 -22 -1 -6 -8 -19 -4 -2 1 -11 -5 -16
Q. 13 C. Coronavirus Job Approval - The governor of your stateTotal Answering (1200) (256) (301) (312) (304) (262) (307) (318) (304) (252) (316) (312) (285)Approve strongly 32 28 33 25 43 29 32 36 32 25 39 27 38Approve somewhat 32 33 33 35 29 31 35 33 31 33 31 35 31Disapprove somewhat 13 14 13 17 9 12 15 12 13 17 9 15 13Disapprove strongly 19 21 19 17 18 24 17 14 21 17 19 20 17(Unsure/don't know/refused) 3 4 1 6 2 4 1 5 2 8 2 2 1Total approve 65 61 67 60 72 60 67 69 64 59 70 63 69Total disapprove 32 35 32 34 27 36 32 26 35 34 28 35 30Total approve - Total disapprove 33 26 35 26 45 24 35 43 29 25 42 27 39
Q. 13 D. Coronavirus Job Approval - Your city, county, and other local officialsTotal Answering (1200) (256) (301) (312) (304) (262) (307) (318) (304) (252) (316) (312) (285)Approve strongly 30 30 30 21 37 27 33 30 28 26 31 25 36Approve somewhat 45 41 47 50 42 47 43 45 47 45 47 47 42Disapprove somewhat 12 13 10 15 9 10 13 12 13 14 9 15 11Disapprove strongly 10 12 10 9 7 12 10 8 9 11 10 11 7(Unsure/don't know/refused) 4 4 2 4 5 3 3 5 4 4 4 3 3Total approve 75 71 78 71 79 75 76 75 75 71 78 72 79Total disapprove 21 25 20 25 17 22 22 20 22 25 19 25 18Total approve - Total disapprove 54 45 58 47 62 52 53 55 53 46 60 47 60
TargetSmart Communications 1155 15th St, NW, Suite 750, Washington, DC 20005 targetsmart.com
33 of 228
Page 34
May 21-27, 2020
National Voter Insights Study
TargetSmart + Dynata
Marital Status/Gender Marital Status/Kids Trump Job Approval
Voting Permissions by State
Total
Marr ied
Men
Marr ied
WomenUnmarr ied Men
Unmarr ied
Women
Marr ied
with kids
Marr ied with out kids
Unmarr ied with
kids
Unmarr ied with out kids
Total appr ove
Total disapp rove All mail
Open early / mail Closed
Party ID Difference...2-3-2 PARTY ID Dem-Rep 4 -17 -5 9 30 -4 -15 19 22 -50 50 -9 4 83-1-3 PARTY ID Dem-Rep 7 -22 -4 16 39 -2 -19 22 31 -65 67 -5 9 8
Q. 13 B. Coronavirus Job Approval - The United States CongressTotal Answering (1200) (312) (306) (247) (313) (216) (400) (83) (471) (528) (626) (111) (605) (484)Approve strongly 8 8 9 10 7 11 7 6 9 11 6 6 10 7Approve somewhat 34 31 39 33 35 35 35 32 35 36 34 26 37 34Disapprove somewhat 26 24 24 28 29 26 23 26 29 19 33 33 24 26Disapprove strongly 25 34 21 24 21 22 31 25 22 29 23 29 24 26(Unsure/don't know/refused) 6 3 7 5 8 6 4 11 5 5 5 6 6 6Total approve 43 39 48 43 42 46 42 38 44 47 40 32 46 41Total disapprove 51 58 46 52 50 48 54 51 51 48 55 62 48 53Total approve - Total disapprove -9 -19 2 -9 -7 -2 -12 -13 -7 -1 -15 -29 -2 -12
Q. 13 C. Coronavirus Job Approval - The governor of your stateTotal Answering (1200) (312) (306) (247) (313) (216) (400) (83) (471) (528) (626) (111) (605) (484)Approve strongly 32 31 35 30 34 32 34 31 32 32 34 33 32 33Approve somewhat 32 35 30 31 35 33 32 33 33 30 35 31 33 32Disapprove somewhat 13 15 11 13 14 16 11 13 14 12 15 13 14 12Disapprove strongly 19 19 22 22 13 16 22 18 16 23 15 19 20 18(Unsure/don't know/refused) 3 1 3 5 4 3 1 5 4 3 2 5 2 5Total approve 65 66 64 60 69 65 66 64 66 62 69 64 65 66Total disapprove 32 34 33 35 26 33 34 31 30 35 29 31 33 30Total approve - Total disapprove 33 32 31 26 43 32 32 33 36 27 -40 33 31 35
Q. 13 D. Coronavirus Job Approval - Your city, county, and other local officialsTotal Answering (1200) (312) (306) (247) (313) (216) (400) (83) (471) (528) (626) (111) (605) (484)Approve strongly 30 29 31 31 28 31 29 29 30 29 31 38 28 30Approve somewhat 45 48 43 41 49 45 46 45 46 44 46 35 47 45Disapprove somewhat 12 11 12 13 13 9 13 11 13 11 14 11 12 12Disapprove strongly 10 11 9 10 7 11 10 10 8 12 7 10 9 10(Unsure/don't know/refused) 4 1 6 5 3 4 3 5 4 5 2 6 4 4Total approve 75 77 73 72 77 76 75 74 75 73 77 73 75 75Total disapprove 21 22 21 23 20 20 22 21 21 22 21 21 21 22Total approve - Total disapprove 54 56 52 49 57 56 53 52 55 51 -56 52 54 53
TargetSmart Communications 1155 15th St, NW, Suite 750, Washington, DC 20005 targetsmart.com
34 of 228
Page 35
May 21-27, 2020
National Voter Insights Study
TargetSmart + Dynata
Permanent Absentee Voter
Status
Ever Voted Early or By Mail
First Time Voters in 2018 2016 Vote History TargetSmart Voter Score
Total PAVNot PAV Yes No Yes No Voted
Did not Vote
Was Not
Regist ered
Super Voter
Freq uent Voter
Infreq uent Voter
Never Voted
Party ID Difference...2-3-2 PARTY ID Dem-Rep 4 16 3 1 5 4 5 2 4 17 0 1 9 73-1-3 PARTY ID Dem-Rep 7 22 5 0 9 9 7 2 8 26 -4 5 13 14
Q. 13 B. Coronavirus Job Approval - The United States CongressTotal Answering (1200) (130) (1070) (220) (980) (176) (1024) (757) (266) (177) (221) (393) (393) (137)Approve strongly 8 7 9 11 8 7 9 8 10 5 6 10 8 8Approve somewhat 34 33 35 31 35 46 32 33 37 36 29 30 36 45Disapprove somewhat 26 23 26 29 25 17 28 27 23 26 31 27 25 15Disapprove strongly 25 28 25 25 25 21 26 27 23 22 30 27 23 22(Unsure/don't know/refused) 6 10 6 4 6 9 6 5 7 10 4 5 7 10Total approve 43 40 43 42 43 54 41 42 47 42 35 41 45 53Total disapprove 51 51 51 54 51 38 54 54 46 48 61 54 49 38Total approve - Total disapprove -9 -11 -8 -11 -8 16 -13 -12 0 -7 -26 -13 -4 15
Q. 13 C. Coronavirus Job Approval - The governor of your stateTotal Answering (1200) (130) (1070) (220) (980) (176) (1024) (757) (266) (177) (221) (393) (393) (137)Approve strongly 32 36 32 34 32 26 34 34 32 27 38 37 28 30Approve somewhat 32 33 32 27 34 41 31 30 35 39 30 30 33 37Disapprove somewhat 13 10 13 19 12 12 13 14 12 11 14 11 15 12Disapprove strongly 19 19 19 18 19 18 19 19 18 19 16 20 20 18(Unsure/don't know/refused) 3 2 4 3 4 3 4 3 3 4 2 3 5 3Total approve 65 69 64 61 66 67 64 64 67 66 67 67 61 67Total disapprove 32 29 32 37 31 30 32 33 30 30 30 30 34 31Total approve - Total disapprove 33 40 32 24 35 37 32 31 37 36 37 37 27 36
Q. 13 D. Coronavirus Job Approval - Your city, county, and other local officialsTotal Answering (1200) (130) (1070) (220) (980) (176) (1024) (757) (266) (177) (221) (393) (393) (137)Approve strongly 30 30 30 29 30 28 30 31 27 29 34 32 26 30Approve somewhat 45 44 45 45 45 45 45 46 46 43 47 45 45 43Disapprove somewhat 12 11 12 14 11 14 12 11 13 15 9 11 13 12Disapprove strongly 10 12 9 8 10 11 9 9 11 7 6 9 11 13(Unsure/don't know/refused) 4 3 4 4 4 3 4 4 4 6 3 3 6 3Total approve 75 73 75 74 75 72 75 76 73 73 81 77 71 72Total disapprove 21 24 21 22 21 25 21 20 24 22 16 20 24 25Total approve - Total disapprove 54 50 54 52 54 47 55 56 49 50 66 57 47 47
TargetSmart Communications 1155 15th St, NW, Suite 750, Washington, DC 20005 targetsmart.com
35 of 228
Page 36
May 21-27, 2020
National Voter Insights Study
TargetSmart + Dynata
Partisan Score Presidential General Turnout Score Mode
Total 0 to 9.9 10 to 89.9 90+ 0 to 69.9 70+ Web Land line Wire less
Party ID Difference...2-3-2 PARTY ID Dem-Rep 4 -48 -4 53 4 5 3 -3 83-1-3 PARTY ID Dem-Rep 7 -55 -1 62 10 5 4 -6 15
Q. 13 B. Coronavirus Job Approval - The United States CongressTotal Answering (1200) (302) (491) (408) (429) (771) (644) (116) (440)Approve strongly 8 8 7 10 10 7 9 8 8Approve somewhat 34 34 36 33 40 31 36 38 31Disapprove somewhat 26 22 26 29 22 28 30 20 22Disapprove strongly 25 31 24 22 21 28 22 25 31(Unsure/don't know/refused) 6 5 6 7 7 5 4 10 9Total approve 43 42 44 42 50 39 45 46 39Total disapprove 51 53 50 51 43 56 51 45 53Total approve - Total disapprove -9 -11 -7 -9 8 -18 -6 1 -14
Q. 13 C. Coronavirus Job Approval - The governor of your stateTotal Answering (1200) (302) (491) (408) (429) (771) (644) (116) (440)Approve strongly 32 29 32 35 32 33 30 41 35Approve somewhat 32 31 34 32 33 32 36 28 28Disapprove somewhat 13 16 12 12 13 13 16 6 11Disapprove strongly 19 23 18 17 17 20 15 23 23(Unsure/don't know/refused) 3 1 4 4 4 3 3 3 4Total approve 65 60 66 67 65 65 66 69 63Total disapprove 32 39 30 29 31 33 31 29 34Total approve - Total disapprove 33 20 36 38 35 32 35 40 29
Q. 13 D. Coronavirus Job Approval - Your city, county, and other local officialsTotal Answering (1200) (302) (491) (408) (429) (771) (644) (116) (440)Approve strongly 30 28 30 31 30 30 23 47 35Approve somewhat 45 45 47 43 44 46 51 33 40Disapprove somewhat 12 16 11 10 11 12 16 5 8Disapprove strongly 10 10 8 11 11 9 8 7 13(Unsure/don't know/refused) 4 3 4 4 5 3 3 8 4Total approve 75 72 77 74 74 75 73 80 75Total disapprove 21 25 19 21 21 21 24 12 21Total approve - Total disapprove 54 47 58 53 53 54 50 68 55
TargetSmart Communications 1155 15th St, NW, Suite 750, Washington, DC 20005 targetsmart.com
36 of 228
Page 37
May 21-27, 2020
National Voter Insights Study
TargetSmart + Dynata
2-3-2 Party 3-1-3 Party Ideology Party ID/Ideology
Total Dem Ind Rep Dem Ind Rep Lib Mod ConsLib
Dem
Mod / Cons Dem
Mod / Lib Rep
Cons Rep
Party ID Difference...2-3-2 PARTY ID Dem-Rep 4 100 - -100 73 - -75 68 6 -52 100 100 -100 -1003-1-3 PARTY ID Dem-Rep 7 100 8 -100 100 - -100 85 10 -63 100 100 -100 -100
Q. 14 Trump's Coronivirus Response...Total Answering (1200) (415) (395) (362) (566) (124) (482) (304) (469) (368) (213) (189) (117) (239)Bad job 23 39 24 5 38 23 6 38 24 10 42 35 4 5Good job 21 6 16 43 5 11 42 4 17 39 2 10 36 46Disgraceful 11 17 13 4 17 13 4 19 11 5 20 13 4 3Inept 11 16 14 3 18 12 2 19 12 3 17 15 6 1Somewhat good 9 3 7 19 3 5 18 3 7 17 3 3 13 21He acted too late/slow 5 4 7 2 6 5 3 4 6 2 4 4 4 2He's a liar 5 8 5 2 8 2 3 11 5 3 11 6 3 2He doesn't care about people dying/endangering the public 4 7 4 1 7 2 1 7 4 2 5 8 1 0
Blame media/Democrats/politics/China 3 2 2 4 2 1 4 2 2 4 2 2 2 4
Did not take it seriously /not being serious 2 3 3 1 3 3 1 5 2 1 5 2 3 1
He is unprepared/disorganize 2 2 3 1 2 2 1 3 2 0 3 1 1 0OK/mediocre 2 2 3 2 2 3 3 3 2 3 2 3 3 2Unscientific/anti-science/ignores science 2 3 3 1 4 2 1 4 3 1 3 3 2 0
Business centered/focusing on economy 1 2 1 1 1 2 1 1 2 1 2 2 2 1
Could be better/improve 1 0 1 1 1 - 1 - 1 1 - 0 1 1He has not done anything 1 1 1 1 1 1 1 1 1 1 1 1 - 1He is dangerous/scary 1 1 0 - 1 1 - 2 0 - 2 0 - -He is for the people 1 1 0 2 0 1 1 1 1 1 1 - 1 2He is inconsistent 1 1 1 1 1 2 1 1 1 0 2 0 2 0He is proactive 1 1 1 1 0 - 2 1 - 2 1 0 - 2He is very childish 1 1 2 - 1 4 - 1 1 0 1 - - -Honest/trustworthy 1 0 0 2 0 - 2 - 1 2 - 1 2 2Opening too soon 1 1 2 1 1 2 1 - 1 1 - 1 - 1Informative/knowledgeable 1 1 - 2 1 - 2 1 0 2 1 1 1 3Bleach/disinfectant reference 0 1 0 - 1 - - 0 0 - 1 1 - -Care more about the election/re-election 0 1 - - 1 - - 0 0 - 1 1 - -
Confusing 0 1 0 0 0 1 0 1 0 0 1 1 - 0Criminal 0 0 0 0 0 - 0 0 0 0 0 - - 0Get off from twitter/should stop tweeting 0 - 0 0 - - 1 - 0 0 - - 0 0
He is unprofessional 0 0 - - 0 - - 0 0 - 0 1 - -Professional 0 - 0 1 - 1 1 - 1 0 - - 2 0Strong leadership/great leader 0 - 1 0 - - 1 - 0 1 - - 1 -Transparent/open 0 - 1 0 - 1 0 - - 1 - - - 0Uninformed 0 1 - - 1 - - 1 0 - 1 1 - -(Other) 9 6 10 10 7 10 10 9 7 11 7 5 6 11(None) 12 11 9 12 10 18 11 12 12 9 11 12 19 9(Don't know/refused) 1 2 1 2 1 2 1 2 2 1 3 1 3 1
TargetSmart Communications 1155 15th St, NW, Suite 750, Washington, DC 20005 targetsmart.com
37 of 228
Page 38
May 21-27, 2020
National Voter Insights Study
TargetSmart + Dynata
Party ID/Gender
Total Dem MenDem
Women Ind MenInd
Women Rep MenRep
Women
Party ID Difference...2-3-2 PARTY ID Dem-Rep 4 100 100 - - -100 -1003-1-3 PARTY ID Dem-Rep 7 100 100 1 17 -100 -100
Q. 14 Trump's Coronivirus Response...Total Answering (1200) (157) (258) (219) (177) (186) (177)Bad job 23 35 42 25 22 5 6Good job 21 10 3 21 11 44 42Disgraceful 11 16 17 12 14 6 1Inept 11 18 15 11 16 3 2Somewhat good 9 4 3 8 7 16 22He acted too late/slow 5 3 6 7 7 2 3He's a liar 5 5 10 3 8 3 1He doesn't care about people dying/endangering the public 4 5 9 5 3 1 -
Blame media/Democrats/politics/China 3 1 2 3 2 7 1Did not take it seriously /not being serious 2 2 4 1 4 1 2He is unprepared/disorganize 2 3 1 3 3 1 -OK/mediocre 2 3 2 3 4 1 3Unscientific/anti-science/ignores science 2 3 3 3 4 2 -Business centered/focusing on economy 1 - 3 1 - 2 1Could be better/improve 1 - 0 2 - 1 1He has not done anything 1 0 2 1 1 0 1He is dangerous/scary 1 2 1 - 1 - -He is for the people 1 - 1 0 - 2 2He is inconsistent 1 2 1 1 2 1 1He is proactive 1 1 - 1 - 1 2He is very childish 1 1 1 2 3 - -Honest/trustworthy 1 - 1 - 0 1 3Opening too soon 1 1 0 2 2 - 1Informative/knowledgeable 1 2 - - - 3 2Bleach/disinfectant reference 0 1 1 0 - - -Care more about the election/re-election 0 1 1 - - - -Confusing 0 2 - - 1 0 -Criminal 0 - 0 0 - 1 -Get off from twitter/should stop tweeting 0 - - 1 - 1 0He is unprofessional 0 0 0 - - - -Professional 0 - - - 1 1 1Strong leadership/great leader 0 - - 2 - - 0Transparent/open 0 - - 1 - - 1Uninformed 0 1 1 - - - -(Other) 9 5 6 12 8 9 10(None) 12 11 12 7 13 9 16(Don't know/refused) 1 3 1 1 1 2 1
TargetSmart Communications 1155 15th St, NW, Suite 750, Washington, DC 20005 targetsmart.com
38 of 228
Page 39
May 21-27, 2020
National Voter Insights Study
TargetSmart + Dynata
Urbanicity
Total R1 R2 S3 S4 U5 U6 Rural Subu rban Urban
Party ID Difference...2-3-2 PARTY ID Dem-Rep 4 -23 -15 -2 9 22 42 -19 4 283-1-3 PARTY ID Dem-Rep 7 -23 -17 -1 12 26 52 -20 7 33
Q. 14 Trump's Coronivirus Response...Total Answering (1200) (179) (181) (195) (273) (264) (108) (360) (468) (372)Bad job 23 17 16 25 25 27 26 17 25 27Good job 21 20 31 26 19 16 11 26 22 15Disgraceful 11 8 8 10 12 12 20 8 11 14Inept 11 7 6 6 13 13 21 7 10 15Somewhat good 9 14 12 7 7 8 10 13 7 9He acted too late/slow 5 6 2 5 4 7 3 4 4 5He's a liar 5 7 3 2 6 5 10 5 4 7He doesn't care about people dying/endangering the public 4 4 3 2 4 4 7 4 3 5
Blame media/Democrats/politics/China 3 3 5 1 4 1 1 4 3 1Did not take it seriously /not being serious 2 3 1 2 3 3 4 2 2 3He is unprepared/disorganize 2 1 1 2 2 1 2 1 2 2OK/mediocre 2 1 3 3 4 2 3 2 3 2Unscientific/anti-science/ignores science 2 2 1 5 3 2 2 2 4 2Business centered/focusing on economy 1 4 1 0 0 1 2 2 0 2Could be better/improve 1 1 1 0 1 1 - 1 1 0He has not done anything 1 1 1 - 1 2 1 1 0 2He is dangerous/scary 1 - 1 2 0 - 2 0 1 1He is for the people 1 1 1 1 1 1 2 1 1 1He is inconsistent 1 0 1 2 0 2 - 1 1 1He is proactive 1 - 1 1 0 2 1 0 0 2He is very childish 1 - 2 1 1 0 4 1 1 1Honest/trustworthy 1 1 1 1 1 0 - 1 1 0Opening too soon 1 2 1 2 0 0 1 1 1 1Informative/knowledgeable 1 1 1 2 1 1 - 1 1 1Bleach/disinfectant reference 0 1 - 1 - 0 - 0 0 0Care more about the election/re-election 0 - 0 - - 1 1 0 - 1Confusing 0 - 1 - 1 0 - 0 1 0Criminal 0 - - 0 1 - - - 1 -Get off from twitter/should stop tweeting 0 1 1 - - - - 1 - -He is unprofessional 0 - - 1 0 - - - 0 -Professional 0 1 1 - - 1 - 1 - 0Strong leadership/great leader 0 1 1 0 - 0 - 1 0 0Transparent/open 0 1 1 - - - - 1 - -Uninformed 0 1 - - - 1 - 0 - 1(Other) 9 8 9 12 7 9 6 8 9 8(None) 12 15 11 13 13 10 10 13 13 10(Don't know/refused) 1 - 3 2 1 2 - 2 2 1
TargetSmart Communications 1155 15th St, NW, Suite 750, Washington, DC 20005 targetsmart.com
39 of 228
Page 40
May 21-27, 2020
National Voter Insights Study
TargetSmart + Dynata
Urbanicity/Gender
Total Rural MenRural
WomenSubu rban
MenSubu rban Women Urban Men
Urban Women
Party ID Difference...2-3-2 PARTY ID Dem-Rep 4 -23 -15 -4 12 13 393-1-3 PARTY ID Dem-Rep 7 -28 -13 -1 15 16 48
Q. 14 Trump's Coronivirus Response...Total Answering (1200) (180) (180) (227) (241) (164) (208)Bad job 23 19 14 22 28 21 31Good job 21 32 19 23 21 20 10Disgraceful 11 7 9 12 9 12 15Inept 11 6 7 10 10 15 16Somewhat good 9 12 14 6 7 10 7He acted too late/slow 5 4 4 3 6 6 5He's a liar 5 3 7 3 6 5 8He doesn't care about people dying/endangering the public 4 5 3 3 4 4 6
Blame media/Democrats/politics/China 3 6 2 4 2 1 1Did not take it seriously /not being serious 2 1 3 1 4 2 4He is unprepared/disorganize 2 2 1 3 1 1 2OK/mediocre 2 3 1 3 4 1 3Unscientific/anti-science/ignores science 2 2 1 3 4 3 1Business centered/focusing on economy 1 2 2 0 0 1 2Could be better/improve 1 1 1 1 - 1 0He has not done anything 1 0 1 0 0 1 2He is dangerous/scary 1 - 1 1 1 1 1He is for the people 1 1 1 1 1 1 1He is inconsistent 1 0 1 2 0 1 1He is proactive 1 - 1 0 0 3 0He is very childish 1 1 1 1 0 1 2Honest/trustworthy 1 1 2 1 1 - 0Opening too soon 1 1 2 1 1 - 1Informative/knowledgeable 1 1 1 1 1 2 -Bleach/disinfectant reference 0 - 1 0 - 0 -Care more about the election/re-election 0 - 0 - - 1 1Confusing 0 1 - 1 1 0 -Criminal 0 - - 1 0 - -Get off from twitter/should stop tweeting 0 1 0 - - - -He is unprofessional 0 - - 0 0 - -Professional 0 1 1 - - - 1Strong leadership/great leader 0 1 0 0 - 1 -Transparent/open 0 1 1 - - - -Uninformed 0 - 1 - - 1 1(Other) 9 8 9 12 6 7 9(None) 12 7 18 10 15 10 10(Don't know/refused) 1 1 2 2 1 2 1
TargetSmart Communications 1155 15th St, NW, Suite 750, Washington, DC 20005 targetsmart.com
40 of 228
Page 41
May 21-27, 2020
National Voter Insights Study
TargetSmart + Dynata
Region by State
TotalBorder States
Califo rnia
Indust rial
Midw est
Lower Midw
estMid -
Atla ntic
Moun tain
States
Nati onal
Capi talNew
Engl and
Paci fic Northw
est SouthSouthe
ast
Upper Midw
est
Party ID Difference...2-3-2 PARTY ID Dem-Rep 4 4 19 -11 16 15 2 5 17 -7 -3 3 13-1-3 PARTY ID Dem-Rep 7 -5 27 -6 17 21 5 15 29 2 -9 8 -8
Q. 14 Trump's Coronivirus Response...Total Answering (1200) (132) (120) (157) (60) (158) (48) (60) (60) (48) (108) (193) (48)Bad job 23 22 29 22 25 23 18 28 18 20 25 23 19Good job 21 24 19 24 18 13 21 18 8 32 28 20 22Disgraceful 11 6 13 13 9 13 12 10 14 12 10 12 2Inept 11 7 17 10 11 10 10 12 16 10 8 9 12Somewhat good 9 10 8 8 10 12 12 2 12 11 11 6 14He acted too late/slow 5 4 3 6 5 2 15 4 8 3 4 5 3He's a liar 5 2 8 5 12 6 4 6 7 9 5 4 -He doesn't care about people dying/endangering the public 4 3 4 4 4 4 6 12 - 1 4 5 1
Blame media/Democrats/politics/China 3 4 2 5 3 2 2 1 4 1 2 2 2
Did not take it seriously /not being serious 2 4 2 2 - 2 1 5 - 3 3 3 2
He is unprepared/disorganize 2 2 2 2 2 2 - - - 4 2 1 2OK/mediocre 2 0 4 3 2 5 - 2 5 1 - 2 4Unscientific/anti-science/ignores science 2 2 1 4 2 4 1 4 5 1 2 1 1
Business centered/focusing on economy 1 1 1 4 - 3 - - - - 1 1 -
Could be better/improve 1 1 - - - - 2 - 4 3 1 0 -He has not done anything 1 1 1 1 3 - 3 2 2 2 - - -He is dangerous/scary 1 - 2 1 - 1 - - 3 1 - - -He is for the people 1 - 1 1 - 1 - 1 - - - 2 -He is inconsistent 1 0 1 3 - 1 0 1 - 1 - 1 -He is proactive 1 2 2 - - - 1 1 2 - - 1 -He is very childish 1 1 1 1 1 1 - 2 - - 2 1 1Honest/trustworthy 1 1 1 1 3 - - 2 - - - 1 2Opening too soon 1 1 2 - - 3 - 4 - - - 1 -Informative/knowledgeable 1 - - - - 2 - - - - 4 2 2Bleach/disinfectant reference 0 - - - - 1 - - - - - 1 -Care more about the election/re-election 0 - - 0 - 1 3 - - - - - -
Confusing 0 - - - 1 1 - - - 3 - 1 -Criminal 0 - 1 - - - - - - - 1 0 -Get off from twitter/should stop tweeting 0 - - 1 - - - - - 1 1 - -
He is unprofessional 0 - - 0 - 1 - - - - - - -Professional 0 - - 1 - - - 3 - - - 1 -Strong leadership/great leader 0 1 - - 1 - - - - - 1 1 -Transparent/open 0 - - 1 - - - 2 - - - 1 -Uninformed 0 1 - - - - - - - - 1 1 -(Other) 9 10 10 8 2 8 4 13 6 5 13 8 15(None) 12 13 7 12 14 14 11 8 27 2 7 14 16(Don't know/refused) 1 2 1 0 2 - 2 2 3 5 - 2 4
TargetSmart Communications 1155 15th St, NW, Suite 750, Washington, DC 20005 targetsmart.com
41 of 228
Page 42
May 21-27, 2020
National Voter Insights Study
TargetSmart + Dynata
Gender Age
Total Men Women 18 - 34 35 - 49 50 - 64 Over 64 18 - 4950 and
over
Party ID Difference...2-3-2 PARTY ID Dem-Rep 4 -5 13 24 6 -2 -8 15 -53-1-3 PARTY ID Dem-Rep 7 -5 18 33 8 0 -10 21 -5
Q. 14 Trump's Coronivirus Response...Total Answering (1200) (571) (629) (281) (287) (310) (295) (568) (605)Bad job 23 21 25 29 19 22 22 24 22Good job 21 25 17 13 15 28 27 14 27Disgraceful 11 11 11 10 9 10 15 10 12Inept 11 10 11 12 13 9 9 13 9Somewhat good 9 9 9 6 9 12 10 8 11He acted too late/slow 5 4 5 6 5 4 3 6 4He's a liar 5 4 7 5 7 5 5 6 5He doesn't care about people dying/endangering the public 4 4 4 3 3 5 6 3 5
Blame media/Democrats/politics/China 3 4 2 - 2 3 5 1 4Did not take it seriously /not being serious 2 1 3 3 1 3 3 2 3He is unprepared/disorganize 2 2 1 2 3 2 1 2 1OK/mediocre 2 2 3 2 3 2 3 2 3Unscientific/anti-science/ignores science 2 3 2 2 2 4 2 2 3Business centered/focusing on economy 1 1 1 2 0 2 0 1 1Could be better/improve 1 1 0 1 0 - 1 1 1He has not done anything 1 0 1 1 1 1 1 1 1He is dangerous/scary 1 1 1 1 1 1 - 1 1He is for the people 1 1 1 0 1 1 1 1 1He is inconsistent 1 1 1 1 1 2 1 1 1He is proactive 1 1 1 1 1 1 1 1 1He is very childish 1 1 1 1 2 1 - 1 1Honest/trustworthy 1 0 1 - - 2 1 - 1Opening too soon 1 1 1 2 1 0 1 1 1Informative/knowledgeable 1 1 1 0 2 1 1 1 1Bleach/disinfectant reference 0 0 0 - 0 - 1 0 0Care more about the election/re-election 0 0 0 - 1 0 1 0 0Confusing 0 1 0 0 0 1 0 0 0Criminal 0 0 0 0 - 0 0 0 0Get off from twitter/should stop tweeting 0 0 0 - 0 - 1 0 0He is unprofessional 0 0 0 0 - - 0 0 0Professional 0 0 1 - 2 - - 1 -Strong leadership/great leader 0 1 0 - 0 1 1 0 1Transparent/open 0 0 0 - - 1 0 - 1Uninformed 0 0 0 1 1 - - 1 -(Other) 9 9 8 11 7 7 8 9 8(None) 12 9 14 17 16 10 6 17 8(Don't know/refused) 1 2 1 3 1 1 1 2 1
TargetSmart Communications 1155 15th St, NW, Suite 750, Washington, DC 20005 targetsmart.com
42 of 228
Page 43
May 21-27, 2020
National Voter Insights Study
TargetSmart + Dynata
Education Homeownership status Marital status
TotalH.S. or
lessPost H.S.
4yr Coll Grad
Post Grad
Coll ege Grad uate
Total Non Coll Rent Own
Marr ied Single
Separa ted / divo rced
Wido wed
Total Unmarr
ied
Party ID Difference...2-3-2 PARTY ID Dem-Rep 4 5 -3 6 13 9 0 32 -5 -11 30 10 -6 213-1-3 PARTY ID Dem-Rep 7 3 -1 9 20 14 0 44 -6 -13 42 12 -10 29
Q. 14 Trump's Coronivirus Response...Total Answering (1200) (210) (369) (363) (248) (610) (579) (297) (873) (618) (357) (144) (59) (560)Bad job 23 20 21 26 25 26 20 30 21 20 32 17 19 27Good job 21 26 22 19 17 18 24 17 22 27 13 20 13 15Disgraceful 11 7 10 12 15 13 9 13 11 8 14 15 10 14Inept 11 4 8 13 17 15 7 12 10 9 15 11 7 13Somewhat good 9 13 12 7 6 7 12 6 11 12 5 6 13 6He acted too late/slow 5 2 5 5 6 6 4 5 5 4 6 3 5 5He's a liar 5 3 5 7 6 7 4 4 6 6 5 3 - 4He doesn't care about people dying/endangering the public 4 3 4 4 4 4 4 5 4 3 5 5 - 5
Blame media/Democrats/politics/China 3 2 3 2 3 3 2 2 3 4 1 3 3 2
Did not take it seriously /not being serious 2 1 2 3 5 3 2 3 2 3 2 3 3 3
He is unprepared/disorganize 2 0 0 2 4 3 0 2 2 2 2 2 - 2OK/mediocre 2 3 4 2 1 2 3 3 2 3 1 2 9 2Unscientific/anti-science/ignores science 2 2 2 2 4 3 2 2 3 2 2 3 5 2
Business centered/focusing on economy 1 1 2 1 1 1 2 1 1 1 2 1 - 1
Could be better/improve 1 0 1 1 1 1 1 0 1 0 1 - 4 1He has not done anything 1 1 1 1 0 1 1 1 1 1 1 0 4 1He is dangerous/scary 1 - 1 1 - 0 1 1 1 1 1 - - 1He is for the people 1 1 1 1 1 1 1 1 1 1 0 - - 0He is inconsistent 1 - 1 1 2 1 1 - 1 1 1 1 - 1He is proactive 1 - 1 0 2 1 1 1 1 1 1 - 2 1He is very childish 1 1 1 1 1 1 1 1 1 1 1 2 - 1Honest/trustworthy 1 1 1 1 1 1 1 0 1 1 - 2 1 1Opening too soon 1 1 1 1 0 1 1 1 1 0 2 1 - 2Informative/knowledgeable 1 1 1 1 0 1 1 - 1 1 1 2 - 1Bleach/disinfectant reference 0 - 1 - 0 0 0 - 0 0 - - - -Care more about the election/re-election 0 0 0 - 0 0 0 1 0 - 1 - 2 1
Confusing 0 - 1 - 1 1 0 0 0 0 1 1 - 1Criminal 0 - 0 0 0 0 0 - 0 0 - 1 - 0Get off from twitter/should stop tweeting 0 - 0 1 - 0 0 1 0 0 - - 2 0
He is unprofessional 0 1 0 - - - 0 0 0 - 0 1 - 0Professional 0 1 - 1 - 0 0 - 1 0 0 - - 0Strong leadership/great leader 0 - 1 1 0 0 0 0 0 1 - - - -Transparent/open 0 - 0 1 - 0 0 0 0 0 - 1 - 0Uninformed 0 - - 1 1 1 - 0 0 0 1 - - 0(Other) 9 8 11 8 7 8 10 12 8 8 9 8 16 10(None) 12 16 12 9 11 10 13 11 11 10 14 14 9 13(Don't know/refused) 1 1 2 2 1 1 2 2 1 1 2 2 1 2
TargetSmart Communications 1155 15th St, NW, Suite 750, Washington, DC 20005 targetsmart.com
43 of 228
Page 44
May 21-27, 2020
National Voter Insights Study
TargetSmart + Dynata
Kids at home Religious attendance
Total Yes No
More than
once a week
Once a week
Once or twice a month
A few times a
year Seldom NeverFreq uent
Infreq uent
Seldom / Never
Party ID Difference...2-3-2 PARTY ID Dem-Rep 4 2 6 -10 -15 5 7 6 24 -14 6 163-1-3 PARTY ID Dem-Rep 7 5 9 -19 -17 -5 14 9 35 -17 7 24
Q. 14 Trump's Coronivirus Response...Total Answering (1200) (301) (876) (89) (251) (121) (190) (212) (301) (340) (311) (513)Bad job 23 18 25 18 21 18 29 18 29 20 25 25Good job 21 16 22 33 24 24 24 21 12 26 24 16Disgraceful 11 10 11 8 7 12 12 13 13 7 12 13Inept 11 13 10 11 7 9 13 12 12 8 12 12Somewhat good 9 12 8 9 16 9 7 11 5 14 8 7He acted too late/slow 5 4 5 2 5 3 6 4 5 4 5 5He's a liar 5 7 5 1 7 1 4 5 8 6 3 7He doesn't care about people dying/endangering the public 4 2 5 4 3 3 6 4 4 3 5 4
Blame media/Democrats/politics/China 3 1 3 3 3 3 3 2 2 3 3 2
Did not take it seriously /not being serious 2 2 3 - 2 2 2 6 2 2 2 4
He is unprepared/disorganize 2 3 2 - 2 1 2 1 2 1 2 2OK/mediocre 2 3 2 2 2 2 4 3 2 2 3 2Unscientific/anti-science/ignores science 2 2 3 4 2 2 2 4 3 2 2 3
Business centered/focusing on economy 1 1 1 - 1 1 2 1 2 1 2 1
Could be better/improve 1 - 1 - 0 - 0 1 1 0 0 1He has not done anything 1 0 1 1 0 2 0 - 1 0 1 1He is dangerous/scary 1 - 1 - - - 1 0 2 - 1 1He is for the people 1 2 1 - 1 1 2 1 - 1 1 1He is inconsistent 1 2 1 - 2 1 - 0 1 2 0 1He is proactive 1 1 1 - - 1 2 1 0 - 2 1He is very childish 1 1 1 4 0 1 0 1 1 1 0 1Honest/trustworthy 1 - 1 3 0 - 2 1 - 1 1 1Opening too soon 1 1 1 3 1 - 1 0 1 1 1 1Informative/knowledgeable 1 1 1 4 1 - 1 1 0 2 0 1Bleach/disinfectant reference 0 0 0 - 0 - - 1 - 0 - 0Care more about the election/re-election 0 0 0 1 - - 0 0 0 0 0 0
Confusing 0 0 0 - - - - 1 1 - - 1Criminal 0 - 0 - 0 - - - 1 0 - 0Get off from twitter/should stop tweeting 0 - 0 - 0 1 - - 0 0 0 0
He is unprofessional 0 - 0 - - 1 - 1 - - 0 0Professional 0 1 - - - - 1 0 1 - 1 1Strong leadership/great leader 0 0 0 - 1 2 - - - 1 1 -Transparent/open 0 - 0 - 0 - - 1 - 0 - 1Uninformed 0 0 0 - - - 1 - 1 - 0 0(Other) 9 6 10 8 8 10 9 5 11 8 10 9(None) 12 12 11 3 10 11 6 13 15 8 8 14(Don't know/refused) 1 2 1 1 2 2 1 2 1 2 1 1
TargetSmart Communications 1155 15th St, NW, Suite 750, Washington, DC 20005 targetsmart.com
44 of 228
Page 45
May 21-27, 2020
National Voter Insights Study
TargetSmart + Dynata
Gender/Age Gender/Education Age/Education
TotalYoun
ger MenOlder Men
Youn ger
WomenOlder
WomenNon Coll
MenColl Men
Non Coll Women
Coll Women
Youn ger Non
CollOlder
Non Coll
Youn ger Coll
egeOlder Coll
Party ID Difference...2-3-2 PARTY ID Dem-Rep 4 7 -15 21 6 -9 -2 7 19 6 -4 22 -53-1-3 PARTY ID Dem-Rep 7 12 -19 28 8 -12 1 10 26 8 -7 31 -3
Q. 14 Trump's Coronivirus Response...Total Answering (1200) (256) (301) (312) (304) (262) (307) (318) (304) (252) (316) (312) (285)Bad job 23 21 21 27 23 20 21 21 30 22 19 26 26Good job 21 19 31 10 23 29 23 19 14 15 31 13 23Disgraceful 11 10 11 9 13 8 13 10 13 6 11 13 13Inept 11 12 9 13 10 6 14 8 15 8 6 16 13Somewhat good 9 9 10 7 12 12 6 12 7 13 11 3 10He acted too late/slow 5 4 4 6 4 3 5 4 7 4 3 7 5He's a liar 5 5 3 7 6 3 5 5 8 3 5 9 5He doesn't care about people dying/endangering the public 4 2 5 3 6 4 3 3 6 3 5 3 6
Blame media/Democrats/politics/China 3 1 6 1 2 4 3 1 2 1 4 1 4
Did not take it seriously /not being serious 2 2 2 2 4 1 2 2 5 2 1 2 5
He is unprepared/disorganize 2 3 1 1 1 1 4 0 2 0 1 4 2OK/mediocre 2 2 3 3 2 3 2 3 2 3 4 2 2Unscientific/anti-science/ignores science 2 3 2 1 4 1 4 3 1 1 3 2 3
Business centered/focusing on economy 1 1 1 1 2 1 1 2 1 1 2 1 1
Could be better/improve 1 1 1 1 0 1 1 1 0 1 0 1 1He has not done anything 1 1 0 1 2 - 1 1 1 0 1 1 1He is dangerous/scary 1 0 1 1 0 1 0 1 1 1 1 1 -He is for the people 1 0 1 1 1 0 1 1 0 1 1 0 1He is inconsistent 1 2 0 - 2 1 2 1 1 1 1 1 2He is proactive 1 1 1 0 1 0 2 1 0 - 1 1 1He is very childish 1 2 - 1 1 1 1 1 1 1 1 1 1Honest/trustworthy 1 - 1 - 2 0 0 1 2 - 1 - 2Opening too soon 1 1 0 1 1 1 1 1 1 2 0 1 1Informative/knowledgeable 1 1 2 1 - 2 1 0 1 1 1 1 1Bleach/disinfectant reference 0 0 0 - 0 0 0 0 - - 1 0 -Care more about the election/re-election 0 - 0 0 0 1 - 0 0 0 1 0 -
Confusing 0 0 1 0 - 1 1 - 0 - 1 1 0Criminal 0 0 0 - 0 - 1 0 - - 0 0 0Get off from twitter/should stop tweeting 0 0 0 - 0 - 1 0 - - 0 0 0
He is unprofessional 0 0 - - 0 0 - 0 - 0 0 - -Professional 0 0 - 1 - 0 - 1 1 1 - 1 -Strong leadership/great leader 0 0 1 - 0 1 1 - 0 - 1 0 1Transparent/open 0 - 1 - 0 1 0 - 0 - 1 - 1Uninformed 0 0 - 1 - - 0 - 1 - - 1 -(Other) 9 11 7 8 8 9 9 10 6 10 9 9 7(None) 12 13 7 20 9 10 8 16 11 18 10 14 5(Don't know/refused) 1 2 1 2 0 2 1 1 1 3 1 2 0
TargetSmart Communications 1155 15th St, NW, Suite 750, Washington, DC 20005 targetsmart.com
45 of 228
Page 46
May 21-27, 2020
National Voter Insights Study
TargetSmart + Dynata
Marital Status/Gender Marital Status/Kids Trump Job Approval
Voting Permissions by State
Total
Marr ied
Men
Marr ied
WomenUnmarr ied Men
Unmarr ied
Women
Marr ied
with kids
Marr ied with out kids
Unmarr ied with
kids
Unmarr ied with out kids
Total appr ove
Total disapp rove All mail
Open early / mail Closed
Party ID Difference...2-3-2 PARTY ID Dem-Rep 4 -17 -5 9 30 -4 -15 19 22 -50 50 -9 4 83-1-3 PARTY ID Dem-Rep 7 -22 -4 16 39 -2 -19 22 31 -65 67 -5 9 8
Q. 14 Trump's Coronivirus Response...Total Answering (1200) (312) (306) (247) (313) (216) (400) (83) (471) (528) (626) (111) (605) (484)Bad job 23 18 22 24 29 19 20 15 29 5 39 14 24 23Good job 21 30 23 20 11 17 31 11 15 44 2 27 20 20Disgraceful 11 10 7 11 16 9 8 14 14 1 20 15 11 9Inept 11 9 9 12 13 12 7 16 12 2 19 11 11 10Somewhat good 9 11 13 8 5 14 11 8 6 19 1 9 9 9He acted too late/slow 5 5 3 3 7 4 4 4 5 2 7 4 5 4He's a liar 5 5 8 2 6 8 6 4 4 1 9 5 5 6He doesn't care about people dying/endangering the public 4 3 4 4 5 2 4 3 5 0 7 5 4 4
Blame media/Democrats/politics/China 3 5 2 2 1 1 5 2 1 3 3 2 3 2
Did not take it seriously /not being serious 2 2 3 1 4 1 3 4 2 1 4 3 2 3
He is unprepared/disorganize 2 2 1 3 1 3 1 1 2 0 3 2 2 2OK/mediocre 2 2 4 3 2 3 3 2 2 4 1 2 3 2Unscientific/anti-science/ignores science 2 3 2 2 3 2 3 2 3 1 3 1 2 4
Business centered/focusing on economy 1 1 2 2 1 0 1 2 1 1 2 - 2 1
Could be better/improve 1 0 - 1 1 - 0 - 1 1 1 3 0 1He has not done anything 1 0 1 1 1 0 1 - 1 1 1 3 1 0He is dangerous/scary 1 0 1 1 1 - 1 - 1 0 1 0 1 1He is for the people 1 1 2 1 - 2 1 - 0 1 0 - 1 0He is inconsistent 1 2 1 0 1 3 1 1 1 1 1 1 1 1He is proactive 1 1 1 1 - 1 1 1 0 2 0 - 1 1He is very childish 1 1 1 1 2 1 1 3 1 0 1 - 1 1Honest/trustworthy 1 0 2 1 1 - 2 - 1 2 - 1 1 1Opening too soon 1 - 0 1 2 - 0 3 1 1 1 - 1 1Informative/knowledgeable 1 1 1 2 0 1 1 2 1 2 - - 1 2Bleach/disinfectant reference 0 1 0 - - 0 1 - - - 0 - 0 0Care more about the election/re-election 0 - 0 1 1 0 - - 1 - 1 - 1 -
Confusing 0 1 - 1 0 - 0 1 0 - 1 1 0 0Criminal 0 0 0 0 - - 0 - 0 0 0 - 0 0Get off from twitter/should stop tweeting 0 0 0 0 - - 0 - 0 0 0 0 - 0
He is unprofessional 0 - - 0 0 - - - 0 - 0 - 0 0Professional 0 0 1 - 1 1 - 2 - 1 - - 1 -Strong leadership/great leader 0 1 0 - - 0 1 - - 1 - - 0 1Transparent/open 0 0 0 1 - - 1 - 0 1 - - 0 0Uninformed 0 - 0 0 0 1 - - 0 - 1 - 0 1(Other) 9 9 7 10 9 6 9 7 10 10 7 6 8 11(None) 12 7 12 11 15 12 8 12 13 12 10 6 12 14(Don't know/refused) 1 1 1 2 1 2 1 4 2 2 1 3 2 1
TargetSmart Communications 1155 15th St, NW, Suite 750, Washington, DC 20005 targetsmart.com
46 of 228
Page 47
May 21-27, 2020
National Voter Insights Study
TargetSmart + Dynata
Permanent Absentee Voter
Status
Ever Voted Early or By Mail
First Time Voters in 2018 2016 Vote History TargetSmart Voter Score
Total PAVNot PAV Yes No Yes No Voted
Did not Vote
Was Not
Regist ered
Super Voter
Freq uent Voter
Infreq uent Voter
Never Voted
Party ID Difference...2-3-2 PARTY ID Dem-Rep 4 16 3 1 5 4 5 2 4 17 0 1 9 73-1-3 PARTY ID Dem-Rep 7 22 5 0 9 9 7 2 8 26 -4 5 13 14
Q. 14 Trump's Coronivirus Response...Total Answering (1200) (130) (1070) (220) (980) (176) (1024) (757) (266) (177) (221) (393) (393) (137)Bad job 23 25 23 20 24 24 23 23 22 23 24 23 22 24Good job 21 18 21 29 19 23 20 22 20 15 22 21 19 25Disgraceful 11 15 10 10 11 8 12 11 12 11 14 10 11 9Inept 11 16 10 10 11 6 12 10 8 16 13 11 12 6Somewhat good 9 9 9 9 9 7 10 10 9 7 11 10 8 8He acted too late/slow 5 2 5 7 4 4 5 5 5 4 3 5 6 4He's a liar 5 6 5 3 6 5 5 6 4 7 8 6 4 3He doesn't care about people dying/endangering the public 4 5 4 5 4 2 4 4 3 5 6 4 5 2
Blame media/Democrats/politics/China 3 2 3 4 2 3 3 2 2 3 4 3 1 3
Did not take it seriously /not being serious 2 3 2 2 3 4 2 2 3 3 2 1 3 4
He is unprepared/disorganize 2 2 2 3 2 1 2 2 1 2 2 2 1 1OK/mediocre 2 4 2 1 3 2 3 2 4 3 1 4 2 3Unscientific/anti-science/ignores science 2 1 3 1 3 1 3 2 2 3 4 2 2 2
Business centered/focusing on economy 1 1 1 1 1 - 1 1 2 0 1 1 2 -
Could be better/improve 1 1 1 0 1 - 1 1 1 - 0 0 1 -He has not done anything 1 1 1 1 1 1 1 1 1 1 1 0 1 2He is dangerous/scary 1 1 1 - 1 - 1 0 1 2 - 1 1 -He is for the people 1 1 1 1 1 - 1 1 1 0 1 1 1 -He is inconsistent 1 2 1 0 1 1 1 1 - 2 1 2 1 1He is proactive 1 1 1 1 1 1 1 1 2 - 1 1 1 1He is very childish 1 1 1 2 1 - 1 1 1 2 1 1 1 -Honest/trustworthy 1 2 1 1 1 - 1 1 - - 2 1 - -Opening too soon 1 1 1 1 1 - 1 1 1 2 1 - 2 -Informative/knowledgeable 1 - 1 1 1 0 1 1 - 0 1 1 1 1Bleach/disinfectant reference 0 - 0 - 0 - 0 0 - - - 0 0 -Care more about the election/re-election 0 - 0 0 0 - 0 0 - 1 0 1 0 -
Confusing 0 - 0 0 0 - 0 0 1 - 1 1 - -Criminal 0 - 0 0 0 - 0 0 - 1 0 0 - -Get off from twitter/should stop tweeting 0 - 0 - 0 - 0 0 - - 1 0 - -
He is unprofessional 0 - 0 - 0 - 0 0 - 0 1 - 0 -Professional 0 - 0 - 0 1 0 0 1 1 - 0 1 1Strong leadership/great leader 0 - 0 1 0 - 0 1 - - 1 1 0 -Transparent/open 0 - 0 1 0 - 0 1 - - 1 0 - -Uninformed 0 - 0 1 0 - 0 1 - - 0 1 - -(Other) 9 11 8 9 9 7 9 8 9 11 7 7 12 7(None) 12 6 13 10 12 22 10 10 18 12 7 11 12 17(Don't know/refused) 1 2 1 3 1 - 2 2 1 2 2 2 2 -
TargetSmart Communications 1155 15th St, NW, Suite 750, Washington, DC 20005 targetsmart.com
47 of 228
Page 48
May 21-27, 2020
National Voter Insights Study
TargetSmart + Dynata
Partisan Score Presidential General Turnout Score Mode
Total 0 to 9.9 10 to 89.9 90+ 0 to 69.9 70+ Web Land line Wire less
Party ID Difference...2-3-2 PARTY ID Dem-Rep 4 -48 -4 53 4 5 3 -3 83-1-3 PARTY ID Dem-Rep 7 -55 -1 62 10 5 4 -6 15
Q. 14 Trump's Coronivirus Response...Total Answering (1200) (302) (491) (408) (429) (771) (644) (116) (440)Bad job 23 13 21 34 22 24 19 26 28Good job 21 31 21 13 23 20 17 31 23Disgraceful 11 6 9 17 10 12 12 7 11Inept 11 7 8 17 7 13 9 9 14Somewhat good 9 15 9 5 8 10 6 16 12He acted too late/slow 5 5 5 4 5 4 5 2 5He's a liar 5 5 4 7 4 6 5 5 6He doesn't care about people dying/endangering the public 4 2 3 7 3 5 3 6 5
Blame media/Democrats/politics/China 3 3 4 1 2 3 3 3 2Did not take it seriously /not being serious 2 3 2 3 3 2 4 3 1He is unprepared/disorganize 2 2 2 2 1 2 1 2 3OK/mediocre 2 1 3 3 3 2 3 1 3Unscientific/anti-science/ignores science 2 2 1 4 2 3 2 2 3Business centered/focusing on economy 1 2 1 1 2 1 1 2 1Could be better/improve 1 1 1 0 1 0 1 - 1He has not done anything 1 0 1 1 1 1 0 4 1He is dangerous/scary 1 - 0 1 1 1 1 - 1He is for the people 1 2 1 0 1 1 0 1 1He is inconsistent 1 1 2 - 1 1 0 2 2He is proactive 1 1 1 0 1 1 1 - 0He is very childish 1 - 1 1 0 1 0 1 2Honest/trustworthy 1 2 0 0 - 1 1 1 1Opening too soon 1 0 1 1 1 1 1 - 1Informative/knowledgeable 1 1 1 0 1 1 1 1 1Bleach/disinfectant reference 0 - 0 0 0 0 0 - 0Care more about the election/re-election 0 - 1 0 - 0 0 - 0Confusing 0 0 0 0 0 0 1 - 0Criminal 0 - 0 0 - 0 0 - 0Get off from twitter/should stop tweeting 0 0 0 0 0 0 0 - 1He is unprofessional 0 0 - 0 - 0 - - 0Professional 0 0 0 0 0 0 1 - 0Strong leadership/great leader 0 1 0 - - 1 0 1 0Transparent/open 0 1 0 - - 1 0 - 0Uninformed 0 - 0 1 - 0 - - 1(Other) 9 9 10 7 11 7 9 6 9(None) 12 11 14 10 16 10 22 1 1(Don't know/refused) 1 2 1 1 1 2 2 2 1
TargetSmart Communications 1155 15th St, NW, Suite 750, Washington, DC 20005 targetsmart.com
48 of 228
Page 49
May 21-27, 2020
National Voter Insights Study
TargetSmart + Dynata
2-3-2 Party 3-1-3 Party Ideology Party ID/Ideology
Total Dem Ind Rep Dem Ind Rep Lib Mod ConsLib
Dem
Mod / Cons Dem
Mod / Lib Rep
Cons Rep
Party ID Difference...2-3-2 PARTY ID Dem-Rep 4 100 - -100 73 - -75 68 6 -52 100 100 -100 -1003-1-3 PARTY ID Dem-Rep 7 100 8 -100 100 - -100 85 10 -63 100 100 -100 -100
Q. 15 A. Hypothetical Coronavirus Job Approval - Barack ObamaTotal Answering (1200) (415) (395) (362) (566) (124) (482) (304) (469) (368) (213) (189) (117) (239)Much better 41 75 38 7 72 35 8 76 40 15 83 66 10 5Somewhat better 13 14 18 5 16 22 6 14 17 7 12 18 8 4(Neither better nor worse) 12 3 16 17 4 21 19 5 16 13 1 5 27 13Somewhat worse 8 2 8 14 2 1 16 2 8 12 1 3 17 13Much worse 22 2 16 51 2 13 47 2 14 49 2 3 29 60(Unsure/don't know/refused) 6 3 5 6 3 9 5 2 5 5 1 6 9 4Total better 54 90 56 12 89 57 13 89 57 22 95 84 18 9Total worse 29 4 24 65 4 14 63 4 22 61 2 6 47 73Total better - Total worse 25 86 32 -53 84 43 -50 86 36 -39 93 77 -29 -64
Q. 15 B. Hypothetical Coronavirus Job Approval - George W. BushTotal Answering (1200) (415) (395) (362) (566) (124) (482) (304) (469) (368) (213) (189) (117) (239)Much better 21 34 21 9 32 26 9 27 24 13 30 35 9 9Somewhat better 29 41 27 16 42 18 15 45 30 17 48 35 21 14(Neither better nor worse) 23 14 24 35 13 30 35 15 25 30 13 15 37 36Somewhat worse 13 5 13 22 6 6 23 6 10 23 4 7 18 24Much worse 7 2 8 11 2 10 12 3 5 11 3 1 8 12(Unsure/don't know/refused) 7 5 8 6 5 10 6 5 7 6 3 7 9 5Total better 50 74 49 25 74 44 24 72 54 30 78 70 30 23Total worse 19 7 20 33 8 16 35 8 15 34 7 8 25 36Total better - Total worse 31 67 29 -8 67 28 -10 64 39 -4 71 62 5 -13
TargetSmart Communications 1155 15th St, NW, Suite 750, Washington, DC 20005 targetsmart.com
49 of 228
Page 50
May 21-27, 2020
National Voter Insights Study
TargetSmart + Dynata
Party ID/Gender
Total Dem MenDem
Women Ind MenInd
Women Rep MenRep
Women
Party ID Difference...2-3-2 PARTY ID Dem-Rep 4 100 100 - - -100 -1003-1-3 PARTY ID Dem-Rep 7 100 100 1 17 -100 -100
Q. 15 A. Hypothetical Coronavirus Job Approval - Barack ObamaTotal Answering (1200) (157) (258) (219) (177) (186) (177)Much better 41 75 76 37 39 9 5Somewhat better 13 14 15 15 21 3 7(Neither better nor worse) 12 4 3 16 16 20 15Somewhat worse 8 3 1 8 7 12 16Much worse 22 3 2 19 13 52 50(Unsure/don't know/refused) 6 2 4 5 4 4 7Total better 54 89 90 53 61 12 12Total worse 29 6 3 27 20 64 66Total better - Total worse 25 83 87 26 41 -52 -55
Q. 15 B. Hypothetical Coronavirus Job Approval - George W. BushTotal Answering (1200) (157) (258) (219) (177) (186) (177)Much better 21 35 32 22 21 10 8Somewhat better 29 36 44 28 27 13 19(Neither better nor worse) 23 14 13 23 24 34 37Somewhat worse 13 8 3 14 11 24 20Much worse 7 3 2 8 7 14 8(Unsure/don't know/refused) 7 3 6 5 10 5 8Total better 50 72 76 50 48 23 28Total worse 19 11 5 22 18 39 28Total better - Total worse 31 60 72 28 29 -16 -
TargetSmart Communications 1155 15th St, NW, Suite 750, Washington, DC 20005 targetsmart.com
50 of 228
Page 51
May 21-27, 2020
National Voter Insights Study
TargetSmart + Dynata
Urbanicity
Total R1 R2 S3 S4 U5 U6 Rural Subu rban Urban
Party ID Difference...2-3-2 PARTY ID Dem-Rep 4 -23 -15 -2 9 22 42 -19 4 283-1-3 PARTY ID Dem-Rep 7 -23 -17 -1 12 26 52 -20 7 33
Q. 15 A. Hypothetical Coronavirus Job Approval - Barack ObamaTotal Answering (1200) (179) (181) (195) (273) (264) (108) (360) (468) (372)Much better 41 27 30 40 45 50 56 29 43 52Somewhat better 13 9 13 12 13 15 13 11 13 14(Neither better nor worse) 12 12 9 13 12 11 13 11 12 11Somewhat worse 8 6 14 7 7 6 7 10 7 6Much worse 22 37 29 23 17 15 8 33 20 13(Unsure/don't know/refused) 6 9 6 5 6 5 3 8 5 4Total better 54 36 43 53 58 64 69 39 56 66Total worse 29 43 42 31 24 20 15 43 27 19Total better - Total worse 25 -7 0 22 33 44 54 -3 29 47
Q. 15 B. Hypothetical Coronavirus Job Approval - George W. BushTotal Answering (1200) (179) (181) (195) (273) (264) (108) (360) (468) (372)Much better 21 17 19 18 25 22 31 18 22 25Somewhat better 29 19 30 28 32 31 31 24 30 31(Neither better nor worse) 23 32 23 22 21 24 17 27 21 22Somewhat worse 13 14 18 17 12 9 8 16 14 9Much worse 7 6 7 8 4 8 7 7 6 8(Unsure/don't know/refused) 7 12 4 8 8 5 7 8 8 6Total better 50 36 49 46 56 53 61 42 52 56Total worse 19 20 25 24 16 18 15 22 19 17Total better - Total worse 31 16 24 21 41 35 46 20 33 39
TargetSmart Communications 1155 15th St, NW, Suite 750, Washington, DC 20005 targetsmart.com
51 of 228
Page 52
May 21-27, 2020
National Voter Insights Study
TargetSmart + Dynata
Urbanicity/Gender
Total Rural MenRural
WomenSubu rban
MenSubu rban Women Urban Men
Urban Women
Party ID Difference...2-3-2 PARTY ID Dem-Rep 4 -23 -15 -4 12 13 393-1-3 PARTY ID Dem-Rep 7 -28 -13 -1 15 16 48
Q. 15 A. Hypothetical Coronavirus Job Approval - Barack ObamaTotal Answering (1200) (180) (180) (227) (241) (164) (208)Much better 41 29 28 40 46 45 57Somewhat better 13 9 12 12 14 12 16(Neither better nor worse) 12 11 10 15 10 14 9Somewhat worse 8 11 9 5 10 10 3Much worse 22 34 32 24 16 16 10(Unsure/don't know/refused) 6 6 9 5 6 3 5Total better 54 39 40 52 59 57 73Total worse 29 44 41 29 25 26 13Total better - Total worse 25 -6 0 23 34 31 59
Q. 15 B. Hypothetical Coronavirus Job Approval - George W. BushTotal Answering (1200) (180) (180) (227) (241) (164) (208)Much better 21 19 17 21 22 25 24Somewhat better 29 23 26 27 33 26 35(Neither better nor worse) 23 25 30 21 22 26 19Somewhat worse 13 19 12 17 10 10 8Much worse 7 10 3 7 4 9 7(Unsure/don't know/refused) 7 5 11 6 9 4 7Total better 50 41 43 48 55 51 59Total worse 19 29 16 24 14 19 15Total better - Total worse 31 13 28 24 41 32 44
TargetSmart Communications 1155 15th St, NW, Suite 750, Washington, DC 20005 targetsmart.com
52 of 228
Page 53
May 21-27, 2020
National Voter Insights Study
TargetSmart + Dynata
Region by State
TotalBorder States
Califo rnia
Indust rial
Midw est
Lower Midw
estMid -
Atla ntic
Moun tain
States
Nati onal
Capi talNew
Engl and
Paci fic Northw
est SouthSouthe
ast
Upper Midw
est
Party ID Difference...2-3-2 PARTY ID Dem-Rep 4 4 19 -11 16 15 2 5 17 -7 -3 3 13-1-3 PARTY ID Dem-Rep 7 -5 27 -6 17 21 5 15 29 2 -9 8 -8
Q. 15 A. Hypothetical Coronavirus Job Approval - Barack ObamaTotal Answering (1200) (132) (120) (157) (60) (158) (48) (60) (60) (48) (108) (193) (48)Much better 41 40 51 40 43 36 40 53 37 38 40 44 38Somewhat better 13 11 10 11 14 15 22 9 22 18 6 13 10(Neither better nor worse) 12 13 12 16 9 14 10 11 6 12 7 7 12Somewhat worse 8 8 8 5 11 10 3 10 4 8 10 8 4Much worse 22 23 15 24 19 18 21 16 15 22 29 24 27(Unsure/don't know/refused) 6 5 4 5 5 7 4 1 16 3 7 4 8Total better 54 51 61 50 56 51 62 62 59 55 46 57 48Total worse 29 30 23 28 30 28 24 26 20 30 40 32 31Total better - Total worse 25 21 37 22 27 23 38 36 39 25 7 25 17
Q. 15 B. Hypothetical Coronavirus Job Approval - George W. BushTotal Answering (1200) (132) (120) (157) (60) (158) (48) (60) (60) (48) (108) (193) (48)Much better 21 20 24 27 24 22 15 22 18 21 20 20 18Somewhat better 29 29 34 22 35 26 28 28 35 37 22 33 27(Neither better nor worse) 23 27 22 21 17 25 19 29 19 20 29 20 26Somewhat worse 13 14 7 11 17 11 23 12 8 17 16 13 15Much worse 7 5 7 11 0 10 8 3 4 2 7 7 8(Unsure/don't know/refused) 7 7 6 10 7 6 8 6 17 3 5 7 6Total better 50 48 58 49 59 48 44 50 53 58 42 53 45Total worse 19 18 14 21 17 21 30 15 12 19 24 20 23Total better - Total worse 31 30 44 27 41 27 14 35 41 39 19 33 22
TargetSmart Communications 1155 15th St, NW, Suite 750, Washington, DC 20005 targetsmart.com
53 of 228
Page 54
May 21-27, 2020
National Voter Insights Study
TargetSmart + Dynata
Gender Age
Total Men Women 18 - 34 35 - 49 50 - 64 Over 64 18 - 4950 and
over
Party ID Difference...2-3-2 PARTY ID Dem-Rep 4 -5 13 24 6 -2 -8 15 -53-1-3 PARTY ID Dem-Rep 7 -5 18 33 8 0 -10 21 -5
Q. 15 A. Hypothetical Coronavirus Job Approval - Barack ObamaTotal Answering (1200) (571) (629) (281) (287) (310) (295) (568) (605)Much better 41 38 44 44 42 39 42 43 41Somewhat better 13 11 14 25 13 7 7 19 7(Neither better nor worse) 12 14 10 9 14 11 11 12 11Somewhat worse 8 8 7 7 7 9 8 7 8Much worse 22 25 19 11 19 29 27 15 28(Unsure/don't know/refused) 6 5 6 4 5 5 6 5 6Total better 54 49 58 69 55 47 48 62 47Total worse 29 33 26 18 26 37 35 22 36Total better - Total worse 25 16 33 51 29 9 14 40 11
Q. 15 B. Hypothetical Coronavirus Job Approval - George W. BushTotal Answering (1200) (571) (629) (281) (287) (310) (295) (568) (605)Much better 21 21 21 14 20 26 26 17 26Somewhat better 29 25 32 37 34 21 24 36 23(Neither better nor worse) 23 24 23 21 25 24 22 23 23Somewhat worse 13 16 10 13 10 14 14 12 14Much worse 7 9 5 6 5 9 6 6 8(Unsure/don't know/refused) 7 5 9 9 6 5 8 7 7Total better 50 47 53 51 54 48 50 52 49Total worse 19 24 15 19 16 23 20 17 22Total better - Total worse 31 23 38 32 38 25 29 35 27
TargetSmart Communications 1155 15th St, NW, Suite 750, Washington, DC 20005 targetsmart.com
54 of 228
Page 55
May 21-27, 2020
National Voter Insights Study
TargetSmart + Dynata
Education Homeownership status Marital status
TotalH.S. or
lessPost H.S.
4yr Coll Grad
Post Grad
Coll ege Grad uate
Total Non Coll Rent Own
Marr ied Single
Separa ted / divo rced
Wido wed
Total Unmarr
ied
Party ID Difference...2-3-2 PARTY ID Dem-Rep 4 5 -3 6 13 9 0 32 -5 -11 30 10 -6 213-1-3 PARTY ID Dem-Rep 7 3 -1 9 20 14 0 44 -6 -13 42 12 -10 29
Q. 15 A. Hypothetical Coronavirus Job Approval - Barack ObamaTotal Answering (1200) (210) (369) (363) (248) (610) (579) (297) (873) (618) (357) (144) (59) (560)Much better 41 33 37 43 52 47 36 50 38 34 52 45 37 49Somewhat better 13 12 11 15 12 14 12 17 11 11 18 10 9 15(Neither better nor worse) 12 12 12 12 10 11 12 9 13 12 10 10 18 11Somewhat worse 8 9 10 6 7 6 9 4 9 10 3 7 8 5Much worse 22 24 24 20 17 19 24 12 25 27 11 23 23 16(Unsure/don't know/refused) 6 9 6 5 2 4 7 7 5 5 5 4 5 5Total better 54 45 49 58 64 60 47 68 49 45 70 55 46 64Total worse 29 33 34 26 24 25 34 16 34 38 14 31 32 20Total better - Total worse 25 12 15 32 40 35 14 51 16 8 56 25 14 43
Q. 15 B. Hypothetical Coronavirus Job Approval - George W. BushTotal Answering (1200) (210) (369) (363) (248) (610) (579) (297) (873) (618) (357) (144) (59) (560)Much better 21 21 16 24 26 25 18 21 22 21 19 25 26 21Somewhat better 29 19 28 32 35 33 24 33 27 26 36 27 24 32(Neither better nor worse) 23 24 26 21 22 22 25 20 25 24 22 26 19 23Somewhat worse 13 14 16 12 7 10 16 11 14 15 10 10 18 11Much worse 7 12 7 5 5 5 9 5 7 8 5 9 4 6(Unsure/don't know/refused) 7 10 7 6 5 6 8 10 6 6 9 4 10 8Total better 50 40 44 56 61 58 42 54 49 47 55 52 50 54Total worse 19 27 23 17 12 15 24 16 21 22 14 18 21 16Total better - Total worse 31 13 21 39 49 43 18 38 28 25 41 34 28 38
TargetSmart Communications 1155 15th St, NW, Suite 750, Washington, DC 20005 targetsmart.com
55 of 228
Page 56
May 21-27, 2020
National Voter Insights Study
TargetSmart + Dynata
Kids at home Religious attendance
Total Yes No
More than
once a week
Once a week
Once or twice a month
A few times a
year Seldom NeverFreq uent
Infreq uent
Seldom / Never
Party ID Difference...2-3-2 PARTY ID Dem-Rep 4 2 6 -10 -15 5 7 6 24 -14 6 163-1-3 PARTY ID Dem-Rep 7 5 9 -19 -17 -5 14 9 35 -17 7 24
Q. 15 A. Hypothetical Coronavirus Job Approval - Barack ObamaTotal Answering (1200) (301) (876) (89) (251) (121) (190) (212) (301) (340) (311) (513)Much better 41 41 42 38 34 27 45 40 53 35 38 47Somewhat better 13 15 12 4 11 24 14 13 12 9 18 12(Neither better nor worse) 12 13 11 15 12 17 11 12 9 13 13 10Somewhat worse 8 9 7 7 9 7 7 8 6 9 7 7Much worse 22 19 23 31 26 23 21 22 16 27 22 18(Unsure/don't know/refused) 6 5 5 5 8 3 2 6 5 7 2 6Total better 54 55 54 42 45 51 59 52 65 44 56 59Total worse 29 27 30 38 35 30 28 30 22 36 29 25Total better - Total worse 25 28 24 4 10 22 31 22 43 8 27 34
Q. 15 B. Hypothetical Coronavirus Job Approval - George W. BushTotal Answering (1200) (301) (876) (89) (251) (121) (190) (212) (301) (340) (311) (513)Much better 21 23 21 24 23 15 19 21 23 24 17 23Somewhat better 29 31 28 16 25 32 39 26 31 22 36 29(Neither better nor worse) 23 23 24 21 25 28 22 21 24 24 25 22Somewhat worse 13 10 14 20 11 15 10 19 9 13 12 13Much worse 7 7 6 11 7 6 7 6 5 8 7 6(Unsure/don't know/refused) 7 6 7 8 9 4 3 7 8 9 3 8Total better 50 54 49 40 48 47 58 47 54 46 54 51Total worse 19 17 20 30 18 21 17 25 14 21 19 19Total better - Total worse 31 37 29 10 30 26 41 22 40 25 35 33
TargetSmart Communications 1155 15th St, NW, Suite 750, Washington, DC 20005 targetsmart.com
56 of 228
Page 57
May 21-27, 2020
National Voter Insights Study
TargetSmart + Dynata
Gender/Age Gender/Education Age/Education
TotalYoun
ger MenOlder Men
Youn ger
WomenOlder
WomenNon Coll
MenColl Men
Non Coll Women
Coll Women
Youn ger Non
CollOlder
Non Coll
Youn ger Coll
egeOlder Coll
Party ID Difference...2-3-2 PARTY ID Dem-Rep 4 7 -15 21 6 -9 -2 7 19 6 -4 22 -53-1-3 PARTY ID Dem-Rep 7 12 -19 28 8 -12 1 10 26 8 -7 31 -3
Q. 15 A. Hypothetical Coronavirus Job Approval - Barack ObamaTotal Answering (1200) (256) (301) (312) (304) (262) (307) (318) (304) (252) (316) (312) (285)Much better 41 42 36 44 45 31 44 39 50 36 36 48 45Somewhat better 13 16 7 21 8 10 12 13 16 18 7 20 7(Neither better nor worse) 12 13 14 11 8 14 14 10 9 15 9 10 13Somewhat worse 8 9 7 5 10 11 6 8 6 9 10 5 7Much worse 22 16 33 15 23 28 22 22 15 18 30 14 25(Unsure/don't know/refused) 6 5 4 5 7 7 3 7 4 5 8 3 4Total better 54 58 42 65 52 42 55 52 65 54 43 68 52Total worse 29 25 40 20 32 38 28 30 22 26 40 19 32Total better - Total worse 25 33 3 45 20 4 27 22 44 27 3 50 21
Q. 15 B. Hypothetical Coronavirus Job Approval - George W. BushTotal Answering (1200) (256) (301) (312) (304) (262) (307) (318) (304) (252) (316) (312) (285)Much better 21 21 22 13 30 17 25 19 25 12 23 21 30Somewhat better 29 31 21 39 24 22 28 26 38 31 20 40 26(Neither better nor worse) 23 22 25 25 21 25 23 25 21 29 23 20 23Somewhat worse 13 16 16 8 12 19 13 13 7 14 16 9 11Much worse 7 6 10 5 5 11 7 7 2 8 10 4 5(Unsure/don't know/refused) 7 4 6 10 8 7 4 9 8 7 9 7 5Total better 50 53 43 52 54 39 54 45 62 43 43 61 56Total worse 19 22 26 13 17 29 20 20 10 23 26 13 16Total better - Total worse 31 31 17 39 37 10 34 25 53 20 17 48 39
TargetSmart Communications 1155 15th St, NW, Suite 750, Washington, DC 20005 targetsmart.com
57 of 228
Page 58
May 21-27, 2020
National Voter Insights Study
TargetSmart + Dynata
Marital Status/Gender Marital Status/Kids Trump Job Approval
Voting Permissions by State
Total
Marr ied
Men
Marr ied
WomenUnmarr ied Men
Unmarr ied
Women
Marr ied
with kids
Marr ied with out kids
Unmarr ied with
kids
Unmarr ied with out kids
Total appr ove
Total disapp rove All mail
Open early / mail Closed
Party ID Difference...2-3-2 PARTY ID Dem-Rep 4 -17 -5 9 30 -4 -15 19 22 -50 50 -9 4 83-1-3 PARTY ID Dem-Rep 7 -22 -4 16 39 -2 -19 22 31 -65 67 -5 9 8
Q. 15 A. Hypothetical Coronavirus Job Approval - Barack ObamaTotal Answering (1200) (312) (306) (247) (313) (216) (400) (83) (471) (528) (626) (111) (605) (484)Much better 41 32 36 45 52 39 32 45 49 6 72 37 44 39Somewhat better 13 10 12 13 16 13 10 19 14 8 16 14 12 13(Neither better nor worse) 12 14 11 14 9 14 11 10 12 18 6 13 12 11Somewhat worse 8 10 11 5 4 10 10 5 5 15 1 6 7 9Much worse 22 30 24 19 13 18 32 20 15 47 2 25 21 21(Unsure/don't know/refused) 6 4 7 4 5 6 5 1 6 6 3 5 4 7Total better 54 42 48 57 69 52 42 64 64 14 88 52 56 52Total worse 29 40 35 24 17 28 42 25 19 62 3 31 28 30Total better - Total worse 25 2 13 33 51 24 -1 39 44 -48 86 21 27 23
Q. 15 B. Hypothetical Coronavirus Job Approval - George W. BushTotal Answering (1200) (312) (306) (247) (313) (216) (400) (83) (471) (528) (626) (111) (605) (484)Much better 21 22 20 20 23 25 20 19 21 7 34 17 22 22Somewhat better 29 23 29 29 35 29 24 35 32 14 42 29 30 27(Neither better nor worse) 23 25 23 23 22 25 24 19 24 35 13 25 21 26Somewhat worse 13 16 13 15 7 10 17 12 11 24 4 17 12 13Much worse 7 9 6 8 4 7 8 8 5 13 2 4 8 6(Unsure/don't know/refused) 7 5 8 6 9 5 7 7 8 8 5 8 7 7Total better 50 45 50 49 58 54 44 54 53 21 76 47 52 49Total worse 19 25 19 23 11 16 25 20 15 36 6 21 20 19Total better - Total worse 31 20 30 26 47 38 19 34 38 -15 71 25 32 30
TargetSmart Communications 1155 15th St, NW, Suite 750, Washington, DC 20005 targetsmart.com
58 of 228
Page 59
May 21-27, 2020
National Voter Insights Study
TargetSmart + Dynata
Permanent Absentee Voter
Status
Ever Voted Early or By Mail
First Time Voters in 2018 2016 Vote History TargetSmart Voter Score
Total PAVNot PAV Yes No Yes No Voted
Did not Vote
Was Not
Regist ered
Super Voter
Freq uent Voter
Infreq uent Voter
Never Voted
Party ID Difference...2-3-2 PARTY ID Dem-Rep 4 16 3 1 5 4 5 2 4 17 0 1 9 73-1-3 PARTY ID Dem-Rep 7 22 5 0 9 9 7 2 8 26 -4 5 13 14
Q. 15 A. Hypothetical Coronavirus Job Approval - Barack ObamaTotal Answering (1200) (130) (1070) (220) (980) (176) (1024) (757) (266) (177) (221) (393) (393) (137)Much better 41 54 40 39 42 34 43 43 36 44 43 43 42 35Somewhat better 13 9 13 14 12 17 12 11 15 17 6 10 16 17(Neither better nor worse) 12 9 12 10 12 16 11 10 19 10 12 10 10 15Somewhat worse 8 8 8 7 8 3 8 9 7 4 9 9 8 1Much worse 22 16 22 26 20 22 22 25 17 15 28 23 17 25(Unsure/don't know/refused) 6 3 6 5 6 9 5 4 7 11 3 5 7 8Total better 54 63 53 53 54 51 54 53 51 61 50 53 59 51Total worse 29 24 30 33 28 25 30 33 24 19 36 31 25 26Total better - Total worse 25 39 23 20 26 27 24 20 26 42 13 22 33 26
Q. 15 B. Hypothetical Coronavirus Job Approval - George W. BushTotal Answering (1200) (130) (1070) (220) (980) (176) (1024) (757) (266) (177) (221) (393) (393) (137)Much better 21 26 21 18 22 22 21 22 18 25 26 23 18 24Somewhat better 29 37 28 32 28 22 30 29 25 34 25 30 31 24(Neither better nor worse) 23 17 24 23 23 27 23 23 29 18 23 22 22 23Somewhat worse 13 7 14 12 13 13 13 14 12 10 15 11 14 13Much worse 7 6 7 7 7 7 7 6 9 5 7 8 6 8(Unsure/don't know/refused) 7 7 7 8 7 10 7 7 8 10 4 7 9 9Total better 50 62 49 50 50 44 51 51 42 58 52 53 49 48Total worse 19 13 20 19 20 20 19 20 21 15 22 19 20 21Total better - Total worse 31 49 28 31 31 24 32 31 22 43 30 35 30 26
TargetSmart Communications 1155 15th St, NW, Suite 750, Washington, DC 20005 targetsmart.com
59 of 228
Page 60
May 21-27, 2020
National Voter Insights Study
TargetSmart + Dynata
Partisan Score Presidential General Turnout Score Mode
Total 0 to 9.9 10 to 89.9 90+ 0 to 69.9 70+ Web Land line Wire less
Party ID Difference...2-3-2 PARTY ID Dem-Rep 4 -48 -4 53 4 5 3 -3 83-1-3 PARTY ID Dem-Rep 7 -55 -1 62 10 5 4 -6 15
Q. 15 A. Hypothetical Coronavirus Job Approval - Barack ObamaTotal Answering (1200) (302) (491) (408) (429) (771) (644) (116) (440)Much better 41 17 38 63 36 44 38 42 45Somewhat better 13 12 12 14 15 11 13 5 14(Neither better nor worse) 12 13 14 8 15 10 15 4 9Somewhat worse 8 13 8 3 6 8 7 8 8Much worse 22 42 21 7 20 22 22 31 18(Unsure/don't know/refused) 6 4 7 5 8 4 4 11 6Total better 54 28 50 77 51 55 52 47 59Total worse 29 54 29 10 26 31 29 39 26Total better - Total worse 25 -26 21 67 25 25 22 8 33
Q. 15 B. Hypothetical Coronavirus Job Approval - George W. BushTotal Answering (1200) (302) (491) (408) (429) (771) (644) (116) (440)Much better 21 12 21 29 18 23 18 31 24Somewhat better 29 24 26 35 26 30 27 20 33(Neither better nor worse) 23 32 24 16 27 21 33 13 12Somewhat worse 13 18 15 7 13 13 9 20 16Much worse 7 10 6 6 7 7 6 8 7(Unsure/don't know/refused) 7 6 8 7 9 6 7 7 8Total better 50 35 47 65 44 54 45 51 58Total worse 19 27 21 12 20 19 16 28 23Total better - Total worse 31 8 27 52 24 34 29 23 35
TargetSmart Communications 1155 15th St, NW, Suite 750, Washington, DC 20005 targetsmart.com
60 of 228
Page 61
May 21-27, 2020
National Voter Insights Study
TargetSmart + Dynata
2-3-2 Party 3-1-3 Party Ideology Party ID/Ideology
Total Dem Ind Rep Dem Ind Rep Lib Mod ConsLib
Dem
Mod / Cons Dem
Mod / Lib Rep
Cons Rep
Party ID Difference...2-3-2 PARTY ID Dem-Rep 4 100 - -100 73 - -75 68 6 -52 100 100 -100 -1003-1-3 PARTY ID Dem-Rep 7 100 8 -100 100 - -100 85 10 -63 100 100 -100 -100
Q. 16 Trump Priority - Re-election or CoronavirusTotal Answering (1200) (415) (395) (362) (566) (124) (482) (304) (469) (368) (213) (189) (117) (239)Re-elected 45 59 50 27 62 46 27 65 47 28 69 47 33 23Outbreak 37 27 34 51 26 30 51 21 35 52 20 36 43 55(Both/neither) 16 11 15 22 10 22 21 11 17 18 8 15 24 21(Don't know/refused) 3 3 2 0 3 2 1 2 1 2 3 2 - 0Re-elected - Outbreak 8 32 16 -25 36 16 -24 44 12 -25 49 11 -10 -32
Q. 17 Trump Priority - Re-election or EconomyTotal Answering (1200) (415) (395) (362) (566) (124) (482) (304) (469) (368) (213) (189) (117) (239)Re-elected 39 57 43 18 58 42 19 62 42 19 66 46 28 13Economy 42 26 41 61 26 39 61 21 42 61 19 35 52 67(Both/neither) 16 14 14 21 13 17 19 15 16 18 14 14 21 20(Don't know/refused) 3 4 2 0 3 2 0 2 1 2 2 5 - 0Re-elected - Economy -3 31 2 -43 32 3 -42 40 0 -41 47 11 -24 -54
Q. 18 State Reopening TimelineTotal Answering (1200) (415) (395) (362) (566) (124) (482) (304) (469) (368) (213) (189) (117) (239)Too quickly 31 43 32 17 43 34 17 49 29 20 49 38 21 14Not quickly enough 19 9 20 31 8 18 33 8 16 34 6 12 20 37Right pace 45 44 46 49 46 43 48 41 51 44 43 47 55 46(Don't know/refused) 4 3 3 3 3 5 3 2 4 3 3 4 5 3
Q. 19 Agree with ProtestersTotal Answering (1200) (415) (395) (362) (566) (124) (482) (304) (469) (368) (213) (189) (117) (239)Strongly agree 11 4 9 23 3 8 22 3 8 24 2 6 15 27Somewhat agree 13 7 13 21 8 6 22 6 12 22 6 8 14 25(Neither agree nor disagree) 10 8 12 12 6 22 13 6 15 9 6 9 17 9Somewhat disagree 13 15 13 11 14 13 11 13 14 13 13 18 12 11Strongly disagree 37 53 39 18 56 37 16 62 37 19 64 42 22 16Not heard enough/no opinion 13 12 12 16 11 14 15 10 15 13 8 15 21 13(Refused) 2 1 2 - 2 1 0 1 0 1 1 1 - -Total Agree 25 11 22 43 11 13 44 9 19 46 9 14 28 51Total Disagree 50 68 52 28 70 49 28 75 51 31 77 60 34 26Total Agree - Total Disagree -26 -57 -30 15 -59 -36 16 -66 -32 15 -68 -46 -6 26
TargetSmart Communications 1155 15th St, NW, Suite 750, Washington, DC 20005 targetsmart.com
61 of 228
Page 62
May 21-27, 2020
National Voter Insights Study
TargetSmart + Dynata
Party ID/Gender
Total Dem MenDem
Women Ind MenInd
Women Rep MenRep
Women
Party ID Difference...2-3-2 PARTY ID Dem-Rep 4 100 100 - - -100 -1003-1-3 PARTY ID Dem-Rep 7 100 100 1 17 -100 -100
Q. 16 Trump Priority - Re-election or CoronavirusTotal Answering (1200) (157) (258) (219) (177) (186) (177)Re-elected 45 57 61 49 51 28 26Outbreak 37 30 25 36 32 48 55(Both/neither) 16 13 10 13 16 25 19(Don't know/refused) 3 0 5 2 1 - 1Re-elected - Outbreak 8 27 36 13 20 -20 -29
Q. 17 Trump Priority - Re-election or EconomyTotal Answering (1200) (157) (258) (219) (177) (186) (177)Re-elected 39 52 60 44 43 18 18Economy 42 26 25 43 40 58 65(Both/neither) 16 20 10 11 17 24 17(Don't know/refused) 3 2 5 3 0 - 0Re-elected - Economy -3 25 35 1 3 -40 -47
Q. 18 State Reopening TimelineTotal Answering (1200) (157) (258) (219) (177) (186) (177)Too quickly 31 39 46 30 34 13 22Not quickly enough 19 14 6 23 17 33 29Right pace 45 46 43 45 47 52 45(Don't know/refused) 4 1 4 2 3 3 3
Q. 19 Agree with ProtestersTotal Answering (1200) (157) (258) (219) (177) (186) (177)Strongly agree 11 5 3 14 3 25 21Somewhat agree 13 11 5 13 13 24 17(Neither agree nor disagree) 10 9 7 11 14 12 12Somewhat disagree 13 13 16 11 15 7 15Strongly disagree 37 51 55 37 42 19 16Not heard enough/no opinion 13 11 12 11 13 13 19(Refused) 2 - 2 2 0 - -Total Agree 25 16 8 28 16 49 38Total Disagree 50 64 71 48 57 26 31Total Agree - Total Disagree -26 -48 -63 -20 -41 23 7
TargetSmart Communications 1155 15th St, NW, Suite 750, Washington, DC 20005 targetsmart.com
62 of 228
Page 63
May 21-27, 2020
National Voter Insights Study
TargetSmart + Dynata
Urbanicity
Total R1 R2 S3 S4 U5 U6 Rural Subu rban Urban
Party ID Difference...2-3-2 PARTY ID Dem-Rep 4 -23 -15 -2 9 22 42 -19 4 283-1-3 PARTY ID Dem-Rep 7 -23 -17 -1 12 26 52 -20 7 33
Q. 16 Trump Priority - Re-election or CoronavirusTotal Answering (1200) (179) (181) (195) (273) (264) (108) (360) (468) (372)Re-elected 45 40 41 41 48 49 50 40 45 50Outbreak 37 35 44 46 39 26 31 39 42 27(Both/neither) 16 20 13 11 10 23 18 16 11 21(Don't know/refused) 3 6 3 2 3 2 2 4 2 2Re-elected - Outbreak 8 5 -4 -5 9 24 19 1 3 22
Q. 17 Trump Priority - Re-election or EconomyTotal Answering (1200) (179) (181) (195) (273) (264) (108) (360) (468) (372)Re-elected 39 30 35 37 43 44 46 32 40 45Economy 42 46 51 48 38 37 33 49 42 36(Both/neither) 16 19 13 13 16 18 17 16 15 17(Don't know/refused) 3 4 1 3 4 2 4 3 3 2Re-elected - Economy -3 -17 -16 -11 5 8 13 -17 -2 9
Q. 18 State Reopening TimelineTotal Answering (1200) (179) (181) (195) (273) (264) (108) (360) (468) (372)Too quickly 31 26 28 26 33 41 27 27 30 37Not quickly enough 19 25 24 19 21 12 16 24 20 13Right pace 45 41 47 51 42 43 54 44 45 47(Don't know/refused) 4 8 2 4 4 4 2 5 4 3
Q. 19 Agree with ProtestersTotal Answering (1200) (179) (181) (195) (273) (264) (108) (360) (468) (372)Strongly agree 11 19 14 12 10 7 6 17 11 7Somewhat agree 13 15 17 14 10 13 13 16 12 13(Neither agree nor disagree) 10 10 7 12 15 9 8 8 14 9Somewhat disagree 13 10 16 16 12 15 11 13 13 14Strongly disagree 37 28 33 32 37 45 50 30 35 46Not heard enough/no opinion 13 16 14 12 14 12 10 15 13 11(Refused) 2 3 - 2 2 1 1 2 2 1Total Agree 25 34 31 26 20 19 19 32 23 19Total Disagree 50 37 48 48 48 60 61 43 48 60Total Agree - Total Disagree -26 -3 -17 -22 -28 -40 -42 -10 -26 -41
TargetSmart Communications 1155 15th St, NW, Suite 750, Washington, DC 20005 targetsmart.com
63 of 228
Page 64
May 21-27, 2020
National Voter Insights Study
TargetSmart + Dynata
Urbanicity/Gender
Total Rural MenRural
WomenSubu rban
MenSubu rban Women Urban Men
Urban Women
Party ID Difference...2-3-2 PARTY ID Dem-Rep 4 -23 -15 -4 12 13 393-1-3 PARTY ID Dem-Rep 7 -28 -13 -1 15 16 48
Q. 16 Trump Priority - Re-election or CoronavirusTotal Answering (1200) (180) (180) (227) (241) (164) (208)Re-elected 45 42 38 43 48 46 52Outbreak 37 40 39 41 43 32 24(Both/neither) 16 17 16 14 8 21 22(Don't know/refused) 3 2 7 2 2 2 2Re-elected - Outbreak 8 2 -1 2 5 14 29
Q. 17 Trump Priority - Re-election or EconomyTotal Answering (1200) (180) (180) (227) (241) (164) (208)Re-elected 39 34 31 36 44 42 48Economy 42 50 47 42 42 37 34(Both/neither) 16 16 17 19 11 19 16(Don't know/refused) 3 0 5 3 3 3 2Re-elected - Economy -3 -17 -16 -6 3 4 13
Q. 18 State Reopening TimelineTotal Answering (1200) (180) (180) (227) (241) (164) (208)Too quickly 31 20 34 30 31 31 42Not quickly enough 19 29 19 22 19 19 9Right pace 45 49 40 44 47 48 46(Don't know/refused) 4 2 7 5 4 2 4
Q. 19 Agree with ProtestersTotal Answering (1200) (180) (180) (227) (241) (164) (208)Strongly agree 11 21 13 13 9 11 3Somewhat agree 13 20 12 13 11 16 10(Neither agree nor disagree) 10 7 10 14 13 10 7Somewhat disagree 13 10 16 10 16 11 16Strongly disagree 37 30 31 35 35 41 51Not heard enough/no opinion 13 14 16 13 14 10 12(Refused) 2 - 3 3 2 2 1Total Agree 25 40 24 26 20 27 13Total Disagree 50 39 46 45 51 52 66Total Agree - Total Disagree -26 1 -22 -19 -32 -25 -53
TargetSmart Communications 1155 15th St, NW, Suite 750, Washington, DC 20005 targetsmart.com
64 of 228
Page 65
May 21-27, 2020
National Voter Insights Study
TargetSmart + Dynata
Region by State
TotalBorder States
Califo rnia
Indust rial
Midw est
Lower Midw
estMid -
Atla ntic
Moun tain
States
Nati onal
Capi talNew
Engl and
Paci fic Northw
est SouthSouthe
ast
Upper Midw
est
Party ID Difference...2-3-2 PARTY ID Dem-Rep 4 4 19 -11 16 15 2 5 17 -7 -3 3 13-1-3 PARTY ID Dem-Rep 7 -5 27 -6 17 21 5 15 29 2 -9 8 -8
Q. 16 Trump Priority - Re-election or CoronavirusTotal Answering (1200) (132) (120) (157) (60) (158) (48) (60) (60) (48) (108) (193) (48)Re-elected 45 44 49 50 39 42 45 42 42 48 36 48 42Outbreak 37 37 34 30 52 37 37 36 30 27 49 36 36(Both/neither) 16 18 15 18 5 20 16 21 20 20 11 11 22(Don't know/refused) 3 1 1 2 5 2 3 1 8 5 4 5 -Re-elected - Outbreak 8 7 15 20 -13 5 8 6 12 21 -13 12 6
Q. 17 Trump Priority - Re-election or EconomyTotal Answering (1200) (132) (120) (157) (60) (158) (48) (60) (60) (48) (108) (193) (48)Re-elected 39 41 44 42 33 38 32 41 46 48 29 40 33Economy 42 43 39 37 54 44 48 42 23 31 55 42 50(Both/neither) 16 16 15 18 9 15 17 16 21 20 15 15 17(Don't know/refused) 3 1 2 3 5 3 3 1 10 2 2 3 -Re-elected - Economy -3 -1 5 5 -22 -5 -16 -1 23 17 -26 -2 -16
Q. 18 State Reopening TimelineTotal Answering (1200) (132) (120) (157) (60) (158) (48) (60) (60) (48) (108) (193) (48)Too quickly 31 42 29 25 36 21 30 27 17 18 37 47 26Not quickly enough 19 11 14 23 14 30 23 28 16 25 18 12 27Right pace 45 44 55 49 46 46 46 44 57 46 39 37 46(Don't know/refused) 4 4 3 3 5 4 2 1 11 12 6 4 0
Q. 19 Agree with ProtestersTotal Answering (1200) (132) (120) (157) (60) (158) (48) (60) (60) (48) (108) (193) (48)Strongly agree 11 10 13 15 3 12 10 9 6 2 20 9 15Somewhat agree 13 8 10 14 18 17 14 10 11 12 16 14 10(Neither agree nor disagree) 10 13 13 6 4 11 6 14 14 14 5 12 22Somewhat disagree 13 15 11 9 21 17 6 11 11 12 14 15 8Strongly disagree 37 38 45 44 38 33 37 46 34 43 30 31 34Not heard enough/no opinion 13 17 5 12 16 8 26 10 19 15 14 16 9(Refused) 2 - 3 1 - 2 2 - 5 2 2 3 2Total Agree 25 17 24 29 21 29 24 19 17 14 35 24 25Total Disagree 50 53 56 53 59 51 43 57 45 55 44 46 42Total Agree - Total Disagree -26 -36 -32 -24 -37 -22 -19 -38 -28 -41 -8 -23 -17
TargetSmart Communications 1155 15th St, NW, Suite 750, Washington, DC 20005 targetsmart.com
65 of 228
Page 66
May 21-27, 2020
National Voter Insights Study
TargetSmart + Dynata
Gender Age
Total Men Women 18 - 34 35 - 49 50 - 64 Over 64 18 - 4950 and
over
Party ID Difference...2-3-2 PARTY ID Dem-Rep 4 -5 13 24 6 -2 -8 15 -53-1-3 PARTY ID Dem-Rep 7 -5 18 33 8 0 -10 21 -5
Q. 16 Trump Priority - Re-election or CoronavirusTotal Answering (1200) (571) (629) (281) (287) (310) (295) (568) (605)Re-elected 45 43 46 49 44 44 42 47 43Outbreak 37 38 35 34 38 39 37 36 38(Both/neither) 16 17 15 14 17 14 19 15 16(Don't know/refused) 3 2 4 3 2 4 2 2 3Re-elected - Outbreak 8 6 11 15 7 6 6 11 6
Q. 17 Trump Priority - Re-election or EconomyTotal Answering (1200) (571) (629) (281) (287) (310) (295) (568) (605)Re-elected 39 37 42 43 41 38 36 42 37Economy 42 43 41 41 44 41 42 43 41(Both/neither) 16 18 14 13 13 18 20 13 19(Don't know/refused) 3 2 3 3 3 3 2 3 3Re-elected - Economy -3 -6 1 2 -4 -3 -5 -1 -4
Q. 18 State Reopening TimelineTotal Answering (1200) (571) (629) (281) (287) (310) (295) (568) (605)Too quickly 31 27 35 41 36 25 26 38 25Not quickly enough 19 23 16 13 21 22 21 17 21Right pace 45 47 44 43 40 49 50 41 49(Don't know/refused) 4 3 5 3 4 5 3 3 4
Q. 19 Agree with ProtestersTotal Answering (1200) (571) (629) (281) (287) (310) (295) (568) (605)Strongly agree 11 15 8 6 10 15 13 8 14Somewhat agree 13 16 11 10 14 14 14 12 14(Neither agree nor disagree) 10 11 10 12 12 11 7 12 9Somewhat disagree 13 10 16 13 10 17 13 11 15Strongly disagree 37 35 39 43 36 29 41 40 35Not heard enough/no opinion 13 12 14 14 16 13 11 15 12(Refused) 2 2 2 2 2 1 2 2 1Total Agree 25 31 19 17 25 29 27 21 28Total Disagree 50 45 55 56 46 46 53 51 50Total Agree - Total Disagree -26 -14 -36 -39 -21 -17 -26 -30 -21
TargetSmart Communications 1155 15th St, NW, Suite 750, Washington, DC 20005 targetsmart.com
66 of 228
Page 67
May 21-27, 2020
National Voter Insights Study
TargetSmart + Dynata
Education Homeownership status Marital status
TotalH.S. or
lessPost H.S.
4yr Coll Grad
Post Grad
Coll ege Grad uate
Total Non Coll Rent Own
Marr ied Single
Separa ted / divo rced
Wido wed
Total Unmarr
ied
Party ID Difference...2-3-2 PARTY ID Dem-Rep 4 5 -3 6 13 9 0 32 -5 -11 30 10 -6 213-1-3 PARTY ID Dem-Rep 7 3 -1 9 20 14 0 44 -6 -13 42 12 -10 29
Q. 16 Trump Priority - Re-election or CoronavirusTotal Answering (1200) (210) (369) (363) (248) (610) (579) (297) (873) (618) (357) (144) (59) (560)Re-elected 45 34 40 49 58 52 38 48 44 41 52 45 48 50Outbreak 37 40 41 37 28 33 41 33 38 42 29 35 35 31(Both/neither) 16 22 17 13 13 13 19 16 16 15 17 18 15 17(Don't know/refused) 3 5 1 1 2 2 3 4 2 2 2 3 2 2Re-elected - Outbreak 8 -6 0 12 30 19 -3 15 6 -1 24 9 13 19
Q. 17 Trump Priority - Re-election or EconomyTotal Answering (1200) (210) (369) (363) (248) (610) (579) (297) (873) (618) (357) (144) (59) (560)Re-elected 39 26 34 45 52 48 31 45 38 35 47 41 42 45Economy 42 50 46 40 32 37 48 39 43 46 37 38 42 38(Both/neither) 16 20 17 14 15 14 18 13 17 17 14 19 12 15(Don't know/refused) 3 4 2 2 1 2 3 3 2 2 2 2 4 2Re-elected - Economy -3 -24 -12 5 19 11 -16 6 -5 -11 10 3 0 7
Q. 18 State Reopening TimelineTotal Answering (1200) (210) (369) (363) (248) (610) (579) (297) (873) (618) (357) (144) (59) (560)Too quickly 31 32 28 33 33 33 30 39 29 27 39 32 35 37Not quickly enough 19 16 22 18 20 19 20 12 22 24 13 17 11 14Right pace 45 48 45 46 44 45 46 45 46 46 45 49 48 46(Don't know/refused) 4 5 4 3 3 3 4 4 3 3 4 2 6 4
Q. 19 Agree with ProtestersTotal Answering (1200) (210) (369) (363) (248) (610) (579) (297) (873) (618) (357) (144) (59) (560)Strongly agree 11 17 11 10 9 9 14 6 13 14 6 15 3 8Somewhat agree 13 12 14 16 9 13 13 11 14 15 12 14 9 12(Neither agree nor disagree) 10 11 10 10 11 11 10 12 10 12 10 9 7 9Somewhat disagree 13 12 15 12 13 12 14 13 14 12 13 22 12 15Strongly disagree 37 24 33 41 50 45 30 42 36 34 44 30 49 41Not heard enough/no opinion 13 22 15 10 7 9 18 16 13 13 14 9 19 13(Refused) 2 1 2 1 1 1 2 2 1 1 1 1 1 1Total Agree 25 30 25 26 18 22 27 17 27 29 17 30 12 20Total Disagree 50 36 48 53 63 57 44 55 49 45 57 52 61 56Total Agree - Total Disagree -26 -7 -23 -28 -45 -35 -17 -38 -22 -16 -40 -22 -50 -37
TargetSmart Communications 1155 15th St, NW, Suite 750, Washington, DC 20005 targetsmart.com
67 of 228
Page 68
May 21-27, 2020
National Voter Insights Study
TargetSmart + Dynata
Kids at home Religious attendance
Total Yes No
More than
once a week
Once a week
Once or twice a month
A few times a
year Seldom NeverFreq uent
Infreq uent
Seldom / Never
Party ID Difference...2-3-2 PARTY ID Dem-Rep 4 2 6 -10 -15 5 7 6 24 -14 6 163-1-3 PARTY ID Dem-Rep 7 5 9 -19 -17 -5 14 9 35 -17 7 24
Q. 16 Trump Priority - Re-election or CoronavirusTotal Answering (1200) (301) (876) (89) (251) (121) (190) (212) (301) (340) (311) (513)Re-elected 45 48 45 45 40 37 56 45 49 41 48 47Outbreak 37 38 36 37 44 47 27 38 32 42 35 35(Both/neither) 16 14 17 13 14 14 16 15 18 14 15 17(Don't know/refused) 3 1 3 5 2 2 1 2 1 3 1 1Re-elected - Outbreak 8 10 9 8 -4 -10 29 7 17 -1 13 13
Q. 17 Trump Priority - Re-election or EconomyTotal Answering (1200) (301) (876) (89) (251) (121) (190) (212) (301) (340) (311) (513)Re-elected 39 43 39 40 37 38 47 41 38 38 43 39Economy 42 43 41 39 46 47 37 41 42 45 41 41(Both/neither) 16 13 17 15 14 14 15 16 19 14 15 18(Don't know/refused) 3 1 3 5 3 1 1 3 1 3 1 2Re-elected - Economy -3 -1 -2 1 -9 -10 10 0 -4 -6 2 -2
Q. 18 State Reopening TimelineTotal Answering (1200) (301) (876) (89) (251) (121) (190) (212) (301) (340) (311) (513)Too quickly 31 32 32 32 29 26 33 30 36 30 30 33Not quickly enough 19 20 19 21 23 24 17 20 15 22 20 17Right pace 45 44 47 45 43 49 50 46 46 44 50 46(Don't know/refused) 4 4 3 3 6 1 - 4 3 5 0 4
Q. 19 Agree with ProtestersTotal Answering (1200) (301) (876) (89) (251) (121) (190) (212) (301) (340) (311) (513)Strongly agree 11 11 11 17 13 12 9 11 10 14 10 10Somewhat agree 13 13 14 18 14 22 12 11 11 15 16 11(Neither agree nor disagree) 10 12 10 6 11 12 11 11 10 9 12 11Somewhat disagree 13 11 14 9 14 17 14 14 12 13 15 13Strongly disagree 37 35 38 30 32 24 41 37 48 31 34 43Not heard enough/no opinion 13 18 12 21 16 12 13 13 9 17 13 11(Refused) 2 1 1 - 1 2 - 2 1 1 1 1Total Agree 25 24 25 34 27 33 21 22 21 29 26 22Total Disagree 50 46 53 40 45 41 55 51 60 44 49 56Total Agree - Total Disagree -26 -23 -28 -5 -18 -8 -34 -29 -39 -15 -24 -35
TargetSmart Communications 1155 15th St, NW, Suite 750, Washington, DC 20005 targetsmart.com
68 of 228
Page 69
May 21-27, 2020
National Voter Insights Study
TargetSmart + Dynata
Gender/Age Gender/Education Age/Education
TotalYoun
ger MenOlder Men
Youn ger
WomenOlder
WomenNon Coll
MenColl Men
Non Coll Women
Coll Women
Youn ger Non
CollOlder
Non Coll
Youn ger Coll
egeOlder Coll
Party ID Difference...2-3-2 PARTY ID Dem-Rep 4 7 -15 21 6 -9 -2 7 19 6 -4 22 -53-1-3 PARTY ID Dem-Rep 7 12 -19 28 8 -12 1 10 26 8 -7 31 -3
Q. 16 Trump Priority - Re-election or CoronavirusTotal Answering (1200) (256) (301) (312) (304) (262) (307) (318) (304) (252) (316) (312) (285)Re-elected 45 45 42 48 45 36 50 39 55 36 40 56 48Outbreak 37 38 38 35 37 41 36 40 31 39 42 34 33(Both/neither) 16 16 18 15 14 22 13 16 13 22 16 10 17(Don't know/refused) 3 1 3 3 4 1 2 4 1 2 3 1 3Re-elected - Outbreak 8 8 4 13 8 -5 14 -1 24 -3 -2 22 15
Q. 17 Trump Priority - Re-election or EconomyTotal Answering (1200) (256) (301) (312) (304) (262) (307) (318) (304) (252) (316) (312) (285)Re-elected 39 39 35 44 39 29 44 33 52 31 32 51 44Economy 42 44 42 42 41 49 39 47 35 50 47 38 36(Both/neither) 16 15 21 11 17 20 16 17 12 16 19 10 19(Don't know/refused) 3 2 2 3 3 2 1 3 2 3 2 1 2Re-elected - Economy -3 -5 -7 2 -1 -20 5 -14 16 -18 -15 13 8
Q. 18 State Reopening TimelineTotal Answering (1200) (256) (301) (312) (304) (262) (307) (318) (304) (252) (316) (312) (285)Too quickly 31 36 20 40 31 27 27 32 40 36 25 41 26Not quickly enough 19 19 27 15 16 28 20 13 18 19 22 16 21Right pace 45 43 50 40 48 43 51 49 40 42 49 41 50(Don't know/refused) 4 2 4 5 5 3 3 5 3 4 4 2 3
Q. 19 Agree with ProtestersTotal Answering (1200) (256) (301) (312) (304) (262) (307) (318) (304) (252) (316) (312) (285)Strongly agree 11 12 17 5 11 19 11 9 8 10 17 7 11Somewhat agree 13 14 18 11 11 14 17 13 9 13 14 12 15(Neither agree nor disagree) 10 11 11 12 7 11 10 9 11 13 7 11 11Somewhat disagree 13 8 12 14 18 9 11 18 14 12 15 10 15Strongly disagree 37 38 32 41 37 28 41 31 49 29 30 49 40Not heard enough/no opinion 13 15 10 14 14 17 9 19 9 21 15 10 8(Refused) 2 2 1 2 2 2 1 1 1 2 2 1 1Total Agree 25 26 34 17 22 34 28 21 17 23 31 19 26Total Disagree 50 46 44 55 55 37 52 49 62 41 45 59 55Total Agree - Total Disagree -26 -20 -10 -38 -33 -3 -24 -28 -46 -18 -15 -40 -30
TargetSmart Communications 1155 15th St, NW, Suite 750, Washington, DC 20005 targetsmart.com
69 of 228
Page 70
May 21-27, 2020
National Voter Insights Study
TargetSmart + Dynata
Marital Status/Gender Marital Status/Kids Trump Job Approval
Voting Permissions by State
Total
Marr ied
Men
Marr ied
WomenUnmarr ied Men
Unmarr ied
Women
Marr ied
with kids
Marr ied with out kids
Unmarr ied with
kids
Unmarr ied with out kids
Total appr ove
Total disapp rove All mail
Open early / mail Closed
Party ID Difference...2-3-2 PARTY ID Dem-Rep 4 -17 -5 9 30 -4 -15 19 22 -50 50 -9 4 83-1-3 PARTY ID Dem-Rep 7 -22 -4 16 39 -2 -19 22 31 -65 67 -5 9 8
Q. 16 Trump Priority - Re-election or CoronavirusTotal Answering (1200) (312) (306) (247) (313) (216) (400) (83) (471) (528) (626) (111) (605) (484)Re-elected 45 41 41 47 52 46 39 53 50 23 64 50 48 40Outbreak 37 40 44 36 27 42 42 27 32 55 22 29 34 41(Both/neither) 16 18 12 17 17 11 17 20 16 21 12 18 15 16(Don't know/refused) 3 1 2 1 3 - 2 1 2 2 2 3 2 3Re-elected - Outbreak 8 1 -3 11 25 4 -3 26 18 -32 42 21 14 -1
Q. 17 Trump Priority - Re-election or EconomyTotal Answering (1200) (312) (306) (247) (313) (216) (400) (83) (471) (528) (626) (111) (605) (484)Re-elected 39 35 35 40 49 40 33 51 44 15 61 44 42 36Economy 42 44 48 42 34 46 46 38 38 65 23 38 41 45(Both/neither) 16 19 15 17 14 14 19 11 16 19 14 16 16 16(Don't know/refused) 3 1 2 2 3 1 2 - 3 2 2 2 2 4Re-elected - Economy -3 -9 -13 -3 14 -6 -14 14 6 -50 38 5 1 -9
Q. 18 State Reopening TimelineTotal Answering (1200) (312) (306) (247) (313) (216) (400) (83) (471) (528) (626) (111) (605) (484)Too quickly 31 25 30 30 42 29 26 39 36 17 44 24 32 33Not quickly enough 19 26 23 20 9 23 25 13 14 34 8 21 19 19Right pace 45 47 45 48 44 45 46 42 47 46 46 49 47 43(Don't know/refused) 4 3 3 2 5 3 3 6 4 4 2 6 3 5
Q. 19 Agree with ProtestersTotal Answering (1200) (312) (306) (247) (313) (216) (400) (83) (471) (528) (626) (111) (605) (484)Strongly agree 11 16 13 13 4 10 16 13 7 23 2 9 11 12Somewhat agree 13 18 11 13 11 14 15 9 12 23 5 13 14 12(Neither agree nor disagree) 10 11 12 10 9 12 11 13 9 13 9 12 11 9Somewhat disagree 13 8 15 13 17 12 12 9 16 10 16 12 11 17Strongly disagree 37 34 33 36 46 35 33 38 43 13 58 38 38 35Not heard enough/no opinion 13 11 15 14 13 17 11 18 13 17 10 14 13 13(Refused) 2 1 1 1 1 1 1 - 1 1 1 1 2 2Total Agree 25 34 24 26 15 24 32 22 19 47 7 22 25 24Total Disagree 50 42 48 49 62 46 45 46 59 23 74 50 49 52Total Agree - Total Disagree -26 -8 -25 -22 -48 -22 -13 -24 -40 24 -67 -28 -24 -28
TargetSmart Communications 1155 15th St, NW, Suite 750, Washington, DC 20005 targetsmart.com
70 of 228
Page 71
May 21-27, 2020
National Voter Insights Study
TargetSmart + Dynata
Permanent Absentee Voter
Status
Ever Voted Early or By Mail
First Time Voters in 2018 2016 Vote History TargetSmart Voter Score
Total PAVNot PAV Yes No Yes No Voted
Did not Vote
Was Not
Regist ered
Super Voter
Freq uent Voter
Infreq uent Voter
Never Voted
Party ID Difference...2-3-2 PARTY ID Dem-Rep 4 16 3 1 5 4 5 2 4 17 0 1 9 73-1-3 PARTY ID Dem-Rep 7 22 5 0 9 9 7 2 8 26 -4 5 13 14
Q. 16 Trump Priority - Re-election or CoronavirusTotal Answering (1200) (130) (1070) (220) (980) (176) (1024) (757) (266) (177) (221) (393) (393) (137)Re-elected 45 60 43 47 45 40 46 46 36 53 46 51 42 42Outbreak 37 29 38 38 36 37 37 36 40 34 35 33 40 38(Both/neither) 16 11 16 13 16 18 15 16 19 9 17 13 15 17(Don't know/refused) 3 0 3 2 3 6 2 2 5 4 2 2 3 3Re-elected - Outbreak 8 32 6 9 8 3 9 10 -3 20 11 18 2 4
Q. 17 Trump Priority - Re-election or EconomyTotal Answering (1200) (130) (1070) (220) (980) (176) (1024) (757) (266) (177) (221) (393) (393) (137)Re-elected 39 52 38 40 39 41 39 39 33 50 39 40 38 44Economy 42 34 43 41 42 38 43 44 43 32 40 44 43 38(Both/neither) 16 14 16 17 16 17 16 15 21 14 20 13 16 17(Don't know/refused) 3 1 3 2 3 4 2 2 3 4 1 3 3 1Re-elected - Economy -3 19 -5 -2 -3 2 -4 -5 -9 18 0 -4 -5 6
Q. 18 State Reopening TimelineTotal Answering (1200) (130) (1070) (220) (980) (176) (1024) (757) (266) (177) (221) (393) (393) (137)Too quickly 31 29 32 41 29 38 30 29 34 37 24 28 36 40Not quickly enough 19 15 20 14 20 17 20 20 19 14 23 18 19 18Right pace 45 53 45 43 46 37 47 48 41 43 51 50 42 35(Don't know/refused) 4 3 4 2 4 8 3 3 5 6 3 4 4 7
Q. 19 Agree with ProtestersTotal Answering (1200) (130) (1070) (220) (980) (176) (1024) (757) (266) (177) (221) (393) (393) (137)Strongly agree 11 14 11 12 11 9 12 13 8 10 14 12 10 11Somewhat agree 13 8 14 15 13 15 13 13 15 11 13 12 14 15(Neither agree nor disagree) 10 12 10 13 10 15 10 9 16 6 8 9 11 11Somewhat disagree 13 12 13 14 13 18 12 13 13 17 12 12 13 17Strongly disagree 37 46 36 32 38 28 39 38 32 42 43 39 36 31Not heard enough/no opinion 13 4 14 15 13 11 13 13 14 11 8 15 14 12(Refused) 2 3 2 0 2 4 1 1 2 3 2 1 2 2Total Agree 25 22 25 28 24 25 25 26 24 21 27 24 24 26Total Disagree 50 59 49 45 51 45 51 50 44 59 55 51 49 48Total Agree - Total Disagree -26 -36 -24 -18 -28 -21 -27 -25 -21 -39 -28 -27 -25 -22
TargetSmart Communications 1155 15th St, NW, Suite 750, Washington, DC 20005 targetsmart.com
71 of 228
Page 72
May 21-27, 2020
National Voter Insights Study
TargetSmart + Dynata
Partisan Score Presidential General Turnout Score Mode
Total 0 to 9.9 10 to 89.9 90+ 0 to 69.9 70+ Web Land line Wire less
Party ID Difference...2-3-2 PARTY ID Dem-Rep 4 -48 -4 53 4 5 3 -3 83-1-3 PARTY ID Dem-Rep 7 -55 -1 62 10 5 4 -6 15
Q. 16 Trump Priority - Re-election or CoronavirusTotal Answering (1200) (302) (491) (408) (429) (771) (644) (116) (440)Re-elected 45 33 42 58 36 50 38 47 55Outbreak 37 48 38 27 40 35 35 42 38(Both/neither) 16 18 18 11 20 13 24 5 6(Don't know/refused) 3 1 2 5 4 2 3 7 1Re-elected - Outbreak 8 -15 4 31 -4 15 4 5 16
Q. 17 Trump Priority - Re-election or EconomyTotal Answering (1200) (302) (491) (408) (429) (771) (644) (116) (440)Re-elected 39 25 37 52 36 41 34 41 47Economy 42 56 43 30 42 42 39 44 45(Both/neither) 16 17 17 14 19 15 24 9 6(Don't know/refused) 3 2 2 4 4 2 3 5 1Re-elected - Economy -3 -31 -6 22 -7 0 -6 -3 2
Q. 18 State Reopening TimelineTotal Answering (1200) (302) (491) (408) (429) (771) (644) (116) (440)Too quickly 31 19 32 40 35 29 33 21 31Not quickly enough 19 32 19 10 17 21 20 22 18Right pace 45 46 45 45 42 47 44 50 47(Don't know/refused) 4 3 4 5 6 3 4 7 4
Q. 19 Agree with ProtestersTotal Answering (1200) (302) (491) (408) (429) (771) (644) (116) (440)Strongly agree 11 23 9 6 11 12 10 19 12Somewhat agree 13 20 13 9 15 12 17 8 9(Neither agree nor disagree) 10 9 14 7 13 9 16 6 3Somewhat disagree 13 15 12 14 14 13 14 11 13Strongly disagree 37 22 36 50 31 40 32 37 45Not heard enough/no opinion 13 11 15 13 14 13 9 19 18(Refused) 2 0 2 3 3 1 3 - 1Total Agree 25 43 22 14 26 24 27 27 21Total Disagree 50 37 47 64 45 53 46 48 58Total Agree - Total Disagree -26 6 -25 -49 -19 -29 -19 -21 -37
TargetSmart Communications 1155 15th St, NW, Suite 750, Washington, DC 20005 targetsmart.com
72 of 228
Page 73
May 21-27, 2020
National Voter Insights Study
TargetSmart + Dynata
2-3-2 Party 3-1-3 Party Ideology Party ID/Ideology
Total Dem Ind Rep Dem Ind Rep Lib Mod ConsLib
Dem
Mod / Cons Dem
Mod / Lib Rep
Cons Rep
Party ID Difference...2-3-2 PARTY ID Dem-Rep 4 100 - -100 73 - -75 68 6 -52 100 100 -100 -1003-1-3 PARTY ID Dem-Rep 7 100 8 -100 100 - -100 85 10 -63 100 100 -100 -100
Q. 20 A. Coronavirus Concern - You or a member of your family losing work and income due to the coronavirus outbreak.Total Answering (1200) (415) (395) (362) (566) (124) (482) (304) (469) (368) (213) (189) (117) (239)Very concerned 30 37 29 24 36 28 24 33 31 27 32 42 23 24Somewhat concerned 23 25 24 21 26 19 21 27 23 20 26 22 26 20A little concerned 18 16 20 19 16 22 20 19 18 17 21 12 22 17Not at all concerned 27 21 27 35 21 31 33 20 27 34 20 23 28 38(Don't know/refused) 2 1 1 1 1 - 1 1 1 2 1 1 1 2Very/Somewhat concerned 54 62 53 45 62 47 46 60 54 47 58 64 49 43A little/Not at all concerned 45 37 46 54 37 53 53 39 45 52 41 35 50 55
Q. 20 B. Coronavirus Concern - The coronavirus outbreak preventing American citizens from registering to vote in this year's elections.Total Answering (1200) (415) (395) (362) (566) (124) (482) (304) (469) (368) (213) (189) (117) (239)Very concerned 26 36 24 18 37 16 17 40 24 18 42 29 17 18Somewhat concerned 24 29 23 20 29 21 19 28 26 19 28 30 23 18A little concerned 17 16 18 17 16 23 16 15 18 17 16 17 18 17Not at all concerned 31 18 34 45 17 36 47 16 31 46 13 23 41 47(Don't know/refused) 2 1 1 1 1 4 1 1 1 1 1 1 1 1Very/Somewhat concerned 50 65 47 38 66 37 36 68 50 37 70 59 40 36A little/Not at all concerned 48 34 52 61 33 59 63 31 49 62 29 40 59 63
Q. 20 C. Coronavirus Concern - The coronavirus outbreak preventing American citizens from voting in this year's elections.Total Answering (1200) (415) (395) (362) (566) (124) (482) (304) (469) (368) (213) (189) (117) (239)Very concerned 33 46 30 25 45 26 23 47 33 24 50 39 27 24Somewhat concerned 22 24 24 18 26 19 19 25 25 18 23 25 23 16A little concerned 16 16 16 17 15 19 17 13 17 18 14 18 16 17Not at all concerned 26 14 29 39 13 35 41 14 23 40 11 17 33 42(Don't know/refused) 2 2 2 1 1 2 1 2 1 1 2 1 1 1Very/Somewhat concerned 56 69 54 43 71 44 42 72 58 41 73 64 50 40A little/Not at all concerned 42 29 45 56 28 54 57 27 41 58 25 35 49 59
Q. 21 Confidence in Community Vote CountTotal Answering (1200) (415) (395) (362) (566) (124) (482) (304) (469) (368) (213) (189) (117) (239)Very confident 35 33 33 43 33 23 43 27 35 44 28 39 37 46Somewhat confident 38 42 37 35 41 34 36 42 39 35 42 42 41 33Not too confident 16 16 18 13 16 27 12 20 19 10 18 15 18 10Not at all confident 8 7 10 6 8 13 6 9 6 8 9 4 1 9(Don't know/refused) 3 2 2 3 2 3 3 3 1 3 3 0 4 3Very/Somewhat confident 73 75 70 78 74 58 79 69 75 80 70 81 78 79Not too/Not at all confident 24 23 28 19 24 40 18 29 24 17 27 19 18 19
Q. 22 Confidence in US Vote CountTotal Answering (1200) (415) (395) (362) (566) (124) (482) (304) (469) (368) (213) (189) (117) (239)Very confident 23 21 20 29 21 18 27 14 25 28 15 28 25 30Somewhat confident 38 41 38 37 39 28 41 37 43 36 38 44 48 32Not too confident 23 24 25 20 25 27 20 29 21 22 27 20 16 22Not at all confident 13 12 15 11 13 22 11 17 10 11 17 6 7 13(Don't know/refused) 4 3 2 3 2 5 2 3 2 3 4 1 4 3Very/Somewhat confident 61 62 59 66 61 47 67 51 68 64 53 72 74 62Not too/Not at all confident 36 35 40 31 37 48 31 46 31 33 43 27 23 36
TargetSmart Communications 1155 15th St, NW, Suite 750, Washington, DC 20005 targetsmart.com
73 of 228
Page 74
May 21-27, 2020
National Voter Insights Study
TargetSmart + Dynata
Party ID/Gender
Total Dem MenDem
Women Ind MenInd
Women Rep MenRep
Women
Party ID Difference...2-3-2 PARTY ID Dem-Rep 4 100 100 - - -100 -1003-1-3 PARTY ID Dem-Rep 7 100 100 1 17 -100 -100
Q. 20 A. Coronavirus Concern - You or a member of your family losing work and income due to the coronavirus outbreak.Total Answering (1200) (157) (258) (219) (177) (186) (177)Very concerned 30 30 42 27 32 23 24Somewhat concerned 23 29 22 19 30 19 23A little concerned 18 16 16 22 17 20 18Not at all concerned 27 24 20 32 20 37 33(Don't know/refused) 2 1 1 - 1 0 2Very/Somewhat concerned 54 59 63 46 61 43 47A little/Not at all concerned 45 40 36 54 37 57 51
Q. 20 B. Coronavirus Concern - The coronavirus outbreak preventing American citizens from registering to vote in this year's elections.Total Answering (1200) (157) (258) (219) (177) (186) (177)Very concerned 26 35 37 23 25 19 18Somewhat concerned 24 31 28 21 26 19 20A little concerned 17 20 13 14 22 18 16Not at all concerned 31 14 20 41 25 45 44(Don't know/refused) 2 1 2 2 1 - 2Very/Somewhat concerned 50 66 65 44 51 38 38A little/Not at all concerned 48 33 34 55 48 62 61
Q. 20 C. Coronavirus Concern - The coronavirus outbreak preventing American citizens from voting in this year's elections.Total Answering (1200) (157) (258) (219) (177) (186) (177)Very concerned 33 48 44 28 32 26 23Somewhat concerned 22 24 24 21 28 17 20A little concerned 16 14 16 17 15 16 19Not at all concerned 26 13 14 33 24 41 37(Don't know/refused) 2 1 2 1 2 - 2Very/Somewhat concerned 56 72 68 49 59 43 43A little/Not at all concerned 42 27 31 49 39 57 56
Q. 21 Confidence in Community Vote CountTotal Answering (1200) (157) (258) (219) (177) (186) (177)Very confident 35 37 30 42 23 47 39Somewhat confident 38 44 41 33 41 34 37Not too confident 16 13 18 15 21 11 14Not at all confident 8 6 7 8 13 7 5(Don't know/refused) 3 - 4 2 2 1 5Very/Somewhat confident 73 81 71 75 64 81 75Not too/Not at all confident 24 19 26 23 34 18 20
Q. 22 Confidence in US Vote CountTotal Answering (1200) (157) (258) (219) (177) (186) (177)Very confident 23 20 22 26 14 30 28Somewhat confident 38 48 36 40 36 38 37Not too confident 23 19 26 19 32 20 21Not at all confident 13 12 12 15 15 12 11(Don't know/refused) 4 1 4 1 3 2 4Very/Somewhat confident 61 68 58 66 50 67 65Not too/Not at all confident 36 31 38 34 47 31 31
TargetSmart Communications 1155 15th St, NW, Suite 750, Washington, DC 20005 targetsmart.com
74 of 228
Page 75
May 21-27, 2020
National Voter Insights Study
TargetSmart + Dynata
Urbanicity
Total R1 R2 S3 S4 U5 U6 Rural Subu rban Urban
Party ID Difference...2-3-2 PARTY ID Dem-Rep 4 -23 -15 -2 9 22 42 -19 4 283-1-3 PARTY ID Dem-Rep 7 -23 -17 -1 12 26 52 -20 7 33
Q. 20 A. Coronavirus Concern - You or a member of your family losing work and income due to the coronavirus outbreak.Total Answering (1200) (179) (181) (195) (273) (264) (108) (360) (468) (372)Very concerned 30 24 25 30 29 37 36 25 30 37Somewhat concerned 23 18 23 24 26 23 24 21 25 23A little concerned 18 17 19 24 20 14 12 18 21 14Not at all concerned 27 39 34 20 24 24 24 36 22 24(Don't know/refused) 2 2 - 2 2 2 3 1 2 2Very/Somewhat concerned 54 43 47 54 55 60 61 45 55 60A little/Not at all concerned 45 55 53 44 43 39 36 54 44 38
Q. 20 B. Coronavirus Concern - The coronavirus outbreak preventing American citizens from registering to vote in this year's elections.Total Answering (1200) (179) (181) (195) (273) (264) (108) (360) (468) (372)Very concerned 26 23 24 25 25 31 30 23 25 31Somewhat concerned 24 18 21 22 25 29 30 19 24 29A little concerned 17 19 12 22 18 14 19 15 20 15Not at all concerned 31 40 42 30 29 24 19 41 29 23(Don't know/refused) 2 1 1 2 3 2 3 1 2 2Very/Somewhat concerned 50 40 45 47 51 60 60 43 49 60A little/Not at all concerned 48 59 54 51 47 38 38 57 49 38
Q. 20 C. Coronavirus Concern - The coronavirus outbreak preventing American citizens from voting in this year's elections.Total Answering (1200) (179) (181) (195) (273) (264) (108) (360) (468) (372)Very concerned 33 26 30 32 36 39 35 28 34 38Somewhat concerned 22 20 16 23 24 24 26 18 24 24A little concerned 16 19 22 13 15 14 19 20 14 15Not at all concerned 26 34 31 30 23 20 19 33 26 20(Don't know/refused) 2 1 1 3 3 3 2 1 3 2Very/Somewhat concerned 56 46 46 55 59 63 61 46 57 63A little/Not at all concerned 42 53 53 43 38 34 37 53 40 35
Q. 21 Confidence in Community Vote CountTotal Answering (1200) (179) (181) (195) (273) (264) (108) (360) (468) (372)Very confident 35 41 44 42 30 31 27 42 35 30Somewhat confident 38 29 33 38 38 43 43 31 38 43Not too confident 16 16 19 9 19 14 17 17 15 15Not at all confident 8 9 4 7 9 10 10 7 8 10(Don't know/refused) 3 4 - 5 5 2 3 2 5 2Very/Somewhat confident 73 71 77 80 68 74 70 74 73 73Not too/Not at all confident 24 25 23 16 28 24 27 24 23 25
Q. 22 Confidence in US Vote CountTotal Answering (1200) (179) (181) (195) (273) (264) (108) (360) (468) (372)Very confident 23 23 27 24 18 24 25 25 21 24Somewhat confident 38 32 42 41 37 40 32 37 39 38Not too confident 23 22 20 18 29 21 27 21 25 23Not at all confident 13 17 10 11 14 12 13 14 13 12(Don't know/refused) 4 6 1 6 2 4 4 4 3 4Very/Somewhat confident 61 55 69 65 55 64 57 62 59 62Not too/Not at all confident 36 39 31 29 43 33 40 35 37 35
TargetSmart Communications 1155 15th St, NW, Suite 750, Washington, DC 20005 targetsmart.com
75 of 228
Page 76
May 21-27, 2020
National Voter Insights Study
TargetSmart + Dynata
Urbanicity/Gender
Total Rural MenRural
WomenSubu rban
MenSubu rban Women Urban Men
Urban Women
Party ID Difference...2-3-2 PARTY ID Dem-Rep 4 -23 -15 -4 12 13 393-1-3 PARTY ID Dem-Rep 7 -28 -13 -1 15 16 48
Q. 20 A. Coronavirus Concern - You or a member of your family losing work and income due to the coronavirus outbreak.Total Answering (1200) (180) (180) (227) (241) (164) (208)Very concerned 30 21 28 28 31 31 42Somewhat concerned 23 20 22 23 27 24 22A little concerned 18 17 18 22 20 17 11Not at all concerned 27 42 30 25 20 27 22(Don't know/refused) 2 - 2 2 2 1 3Very/Somewhat concerned 54 41 50 51 58 55 64A little/Not at all concerned 45 59 49 47 40 44 33
Q. 20 B. Coronavirus Concern - The coronavirus outbreak preventing American citizens from registering to vote in this year's elections.Total Answering (1200) (180) (180) (227) (241) (164) (208)Very concerned 26 26 21 22 29 29 32Somewhat concerned 24 16 23 25 23 28 30A little concerned 17 15 16 20 20 16 14Not at all concerned 31 43 40 33 25 25 21(Don't know/refused) 2 1 1 1 4 2 3Very/Somewhat concerned 50 42 44 46 52 57 62A little/Not at all concerned 48 58 55 53 45 41 35
Q. 20 C. Coronavirus Concern - The coronavirus outbreak preventing American citizens from voting in this year's elections.Total Answering (1200) (180) (180) (227) (241) (164) (208)Very concerned 33 33 23 31 36 35 41Somewhat concerned 22 16 20 22 25 25 24A little concerned 16 16 25 16 12 15 15Not at all concerned 26 35 31 29 23 23 17(Don't know/refused) 2 - 2 2 4 2 3Very/Somewhat concerned 56 49 43 53 62 60 65A little/Not at all concerned 42 51 55 45 35 38 33
Q. 21 Confidence in Community Vote CountTotal Answering (1200) (180) (180) (227) (241) (164) (208)Very confident 35 48 37 39 30 39 23Somewhat confident 38 32 31 36 40 40 46Not too confident 16 14 20 14 16 12 18Not at all confident 8 6 8 7 9 9 11(Don't know/refused) 3 - 4 4 5 2 3Very/Somewhat confident 73 80 67 76 70 78 68Not too/Not at all confident 24 20 28 21 25 20 29
Q. 22 Confidence in US Vote CountTotal Answering (1200) (180) (180) (227) (241) (164) (208)Very confident 23 23 26 25 17 28 20Somewhat confident 38 42 32 38 40 43 34Not too confident 23 18 25 24 26 15 29Not at all confident 13 16 12 12 14 11 13(Don't know/refused) 4 1 6 2 4 2 5Very/Somewhat confident 61 65 58 62 57 71 54Not too/Not at all confident 36 34 36 36 39 26 42
TargetSmart Communications 1155 15th St, NW, Suite 750, Washington, DC 20005 targetsmart.com
76 of 228
Page 77
May 21-27, 2020
National Voter Insights Study
TargetSmart + Dynata
Region by State
TotalBorder States
Califo rnia
Indust rial
Midw est
Lower Midw
estMid -
Atla ntic
Moun tain
States
Nati onal
Capi talNew
Engl and
Paci fic Northw
est SouthSouthe
ast
Upper Midw
est
Party ID Difference...2-3-2 PARTY ID Dem-Rep 4 4 19 -11 16 15 2 5 17 -7 -3 3 13-1-3 PARTY ID Dem-Rep 7 -5 27 -6 17 21 5 15 29 2 -9 8 -8
Q. 20 A. Coronavirus Concern - You or a member of your family losing work and income due to the coronavirus outbreak.Total Answering (1200) (132) (120) (157) (60) (158) (48) (60) (60) (48) (108) (193) (48)Very concerned 30 33 34 29 34 32 31 30 19 31 36 27 27Somewhat concerned 23 23 23 23 26 22 27 13 22 27 24 25 24A little concerned 18 12 18 19 10 17 13 34 24 14 15 18 29Not at all concerned 27 29 23 28 28 27 30 23 30 28 25 29 20(Don't know/refused) 2 3 2 1 3 2 - 1 5 - - 2 -Very/Somewhat concerned 54 56 57 52 59 54 57 43 41 57 60 51 51A little/Not at all concerned 45 41 41 48 38 43 43 56 55 43 40 47 49
Q. 20 B. Coronavirus Concern - The coronavirus outbreak preventing American citizens from registering to vote in this year's elections.Total Answering (1200) (132) (120) (157) (60) (158) (48) (60) (60) (48) (108) (193) (48)Very concerned 26 25 25 23 22 32 19 33 26 27 29 27 26Somewhat concerned 24 23 23 24 27 31 27 21 24 27 17 24 23A little concerned 17 17 19 19 20 15 12 21 12 18 18 17 13Not at all concerned 31 30 32 34 31 22 43 25 28 26 37 31 38(Don't know/refused) 2 5 2 1 - 1 - 1 9 3 - 2 -Very/Somewhat concerned 50 48 48 47 49 63 46 54 51 54 45 51 49A little/Not at all concerned 48 47 51 53 51 36 54 45 40 44 55 48 51
Q. 20 C. Coronavirus Concern - The coronavirus outbreak preventing American citizens from voting in this year's elections.Total Answering (1200) (132) (120) (157) (60) (158) (48) (60) (60) (48) (108) (193) (48)Very concerned 33 32 35 34 24 37 29 29 40 30 33 36 33Somewhat concerned 22 26 20 21 28 26 22 30 17 30 21 17 13A little concerned 16 10 19 18 23 15 16 12 10 19 18 17 22Not at all concerned 26 28 23 27 26 22 34 28 26 22 27 28 27(Don't know/refused) 2 5 2 1 - 1 - 1 8 - 1 2 5Very/Somewhat concerned 56 58 55 55 52 62 50 59 56 60 54 53 47A little/Not at all concerned 42 37 42 44 48 37 50 40 36 40 45 45 49
Q. 21 Confidence in Community Vote CountTotal Answering (1200) (132) (120) (157) (60) (158) (48) (60) (60) (48) (108) (193) (48)Very confident 35 39 41 31 39 28 33 37 33 52 38 36 32Somewhat confident 38 36 28 43 35 38 47 42 39 28 28 40 53Not too confident 16 17 17 16 18 23 9 12 7 14 19 12 13Not at all confident 8 5 13 7 5 10 11 5 13 5 9 8 2(Don't know/refused) 3 3 2 3 3 2 - 4 7 2 7 5 -Very/Somewhat confident 73 75 69 75 74 66 80 79 73 79 66 75 84Not too/Not at all confident 24 22 30 23 23 32 21 17 20 19 28 20 16
Q. 22 Confidence in US Vote CountTotal Answering (1200) (132) (120) (157) (60) (158) (48) (60) (60) (48) (108) (193) (48)Very confident 23 28 27 22 24 22 28 20 13 30 23 20 20Somewhat confident 38 40 29 37 43 35 40 46 41 34 31 41 48Not too confident 23 20 25 25 27 19 16 24 27 28 25 20 27Not at all confident 13 9 16 15 5 21 14 7 13 5 13 14 5(Don't know/refused) 4 3 3 2 2 3 1 3 7 3 8 5 -Very/Somewhat confident 61 68 56 59 67 57 68 66 54 64 54 62 69Not too/Not at all confident 36 30 41 39 32 40 31 31 40 34 38 34 31
TargetSmart Communications 1155 15th St, NW, Suite 750, Washington, DC 20005 targetsmart.com
77 of 228
Page 78
May 21-27, 2020
National Voter Insights Study
TargetSmart + Dynata
Gender Age
Total Men Women 18 - 34 35 - 49 50 - 64 Over 64 18 - 4950 and
over
Party ID Difference...2-3-2 PARTY ID Dem-Rep 4 -5 13 24 6 -2 -8 15 -53-1-3 PARTY ID Dem-Rep 7 -5 18 33 8 0 -10 21 -5
Q. 20 A. Coronavirus Concern - You or a member of your family losing work and income due to the coronavirus outbreak.Total Answering (1200) (571) (629) (281) (287) (310) (295) (568) (605)Very concerned 30 27 34 33 34 35 20 34 28Somewhat concerned 23 22 24 27 26 18 21 26 20A little concerned 18 19 17 24 18 16 15 21 15Not at all concerned 27 31 24 15 20 30 42 18 36(Don't know/refused) 2 1 2 2 2 1 2 2 2Very/Somewhat concerned 54 49 58 60 60 53 41 60 47A little/Not at all concerned 45 50 40 39 38 46 57 38 51
Q. 20 B. Coronavirus Concern - The coronavirus outbreak preventing American citizens from registering to vote in this year's elections.Total Answering (1200) (571) (629) (281) (287) (310) (295) (568) (605)Very concerned 26 25 28 20 28 27 29 24 28Somewhat concerned 24 23 26 31 25 21 22 28 21A little concerned 17 17 17 22 19 15 13 20 14Not at all concerned 31 34 28 26 27 35 35 27 35(Don't know/refused) 2 1 3 2 1 3 1 1 2Very/Somewhat concerned 50 48 53 51 53 48 51 52 49A little/Not at all concerned 48 51 45 48 46 49 48 47 49
Q. 20 C. Coronavirus Concern - The coronavirus outbreak preventing American citizens from voting in this year's elections.Total Answering (1200) (571) (629) (281) (287) (310) (295) (568) (605)Very concerned 33 33 34 27 39 32 36 33 34Somewhat concerned 22 21 24 30 20 21 19 25 20A little concerned 16 16 17 19 17 18 12 18 15Not at all concerned 26 29 23 22 24 28 30 23 29(Don't know/refused) 2 1 3 2 2 2 3 2 2Very/Somewhat concerned 56 54 57 57 58 52 55 58 54A little/Not at all concerned 42 45 40 41 40 46 42 40 44
Q. 21 Confidence in Community Vote CountTotal Answering (1200) (571) (629) (281) (287) (310) (295) (568) (605)Very confident 35 42 30 22 30 42 46 26 44Somewhat confident 38 36 39 44 42 32 34 43 33Not too confident 16 13 18 24 16 15 9 20 12Not at all confident 8 7 9 7 9 8 8 8 8(Don't know/refused) 3 2 4 3 4 3 3 3 3Very/Somewhat confident 73 78 69 67 72 75 79 69 77Not too/Not at all confident 24 20 27 30 25 23 17 28 20
Q. 22 Confidence in US Vote CountTotal Answering (1200) (571) (629) (281) (287) (310) (295) (568) (605)Very confident 23 25 21 19 20 24 29 19 26Somewhat confident 38 41 35 36 39 41 35 38 38Not too confident 23 20 26 28 23 21 21 26 21Not at all confident 13 13 13 13 15 12 11 14 12(Don't know/refused) 4 2 5 5 3 3 3 4 3Very/Somewhat confident 61 66 56 55 58 65 64 57 65Not too/Not at all confident 36 32 39 40 39 32 32 39 32
TargetSmart Communications 1155 15th St, NW, Suite 750, Washington, DC 20005 targetsmart.com
78 of 228
Page 79
May 21-27, 2020
National Voter Insights Study
TargetSmart + Dynata
Education Homeownership status Marital status
TotalH.S. or
lessPost H.S.
4yr Coll Grad
Post Grad
Coll ege Grad uate
Total Non Coll Rent Own
Marr ied Single
Separa ted / divo rced
Wido wed
Total Unmarr
ied
Party ID Difference...2-3-2 PARTY ID Dem-Rep 4 5 -3 6 13 9 0 32 -5 -11 30 10 -6 213-1-3 PARTY ID Dem-Rep 7 3 -1 9 20 14 0 44 -6 -13 42 12 -10 29
Q. 20 A. Coronavirus Concern - You or a member of your family losing work and income due to the coronavirus outbreak.Total Answering (1200) (210) (369) (363) (248) (610) (579) (297) (873) (618) (357) (144) (59) (560)Very concerned 30 36 30 31 26 29 32 39 28 28 34 34 23 33Somewhat concerned 23 20 20 28 23 26 20 23 23 23 24 21 26 24A little concerned 18 18 19 16 21 18 18 17 18 18 20 16 13 18Not at all concerned 27 24 30 24 29 26 28 20 30 31 20 28 32 23(Don't know/refused) 2 2 2 0 1 1 2 2 1 1 1 1 7 2Very/Somewhat concerned 54 56 49 60 48 55 52 62 51 51 59 55 48 57A little/Not at all concerned 45 42 49 40 51 44 46 37 48 48 40 44 45 42
Q. 20 B. Coronavirus Concern - The coronavirus outbreak preventing American citizens from registering to vote in this year's elections.Total Answering (1200) (210) (369) (363) (248) (610) (579) (297) (873) (618) (357) (144) (59) (560)Very concerned 26 29 27 24 28 25 27 32 24 22 31 32 27 31Somewhat concerned 24 25 20 29 23 27 22 25 23 24 28 18 19 25A little concerned 17 19 16 16 19 18 17 18 17 15 18 20 18 19Not at all concerned 31 25 37 31 28 30 32 23 34 38 22 28 31 25(Don't know/refused) 2 3 2 1 2 1 2 2 1 2 1 1 6 1Very/Somewhat concerned 50 54 46 52 51 52 49 57 48 45 59 50 45 55A little/Not at all concerned 48 43 52 47 47 47 49 41 51 53 40 48 49 43
Q. 20 C. Coronavirus Concern - The coronavirus outbreak preventing American citizens from voting in this year's elections.Total Answering (1200) (210) (369) (363) (248) (610) (579) (297) (873) (618) (357) (144) (59) (560)Very concerned 33 34 33 32 35 34 34 38 32 31 35 33 44 36Somewhat concerned 22 26 19 24 22 23 21 24 22 19 29 22 18 26A little concerned 16 18 14 15 19 17 16 15 17 16 18 18 6 17Not at all concerned 26 20 31 28 22 26 27 20 28 33 16 25 29 20(Don't know/refused) 2 3 3 1 1 1 3 3 2 2 2 2 3 2Very/Somewhat concerned 56 60 52 56 57 57 55 63 53 50 64 55 62 62A little/Not at all concerned 42 38 45 43 42 42 43 35 45 48 34 43 35 37
Q. 21 Confidence in Community Vote CountTotal Answering (1200) (210) (369) (363) (248) (610) (579) (297) (873) (618) (357) (144) (59) (560)Very confident 35 37 30 40 37 39 32 26 39 42 26 33 33 29Somewhat confident 38 37 38 39 37 38 38 42 37 35 43 37 37 41Not too confident 16 14 18 14 17 15 16 19 15 14 21 15 12 18Not at all confident 8 9 9 6 8 7 9 11 7 7 7 11 15 9(Don't know/refused) 3 4 5 1 1 1 4 2 3 2 3 4 4 3Very/Somewhat confident 73 74 68 79 74 77 70 68 76 77 70 70 70 70Not too/Not at all confident 24 23 27 20 25 22 25 30 22 21 28 26 26 27
Q. 22 Confidence in US Vote CountTotal Answering (1200) (210) (369) (363) (248) (610) (579) (297) (873) (618) (357) (144) (59) (560)Very confident 23 28 19 25 22 24 22 20 24 27 19 20 17 19Somewhat confident 38 36 35 42 39 41 35 35 39 38 38 40 41 39Not too confident 23 19 27 22 24 23 24 28 22 22 24 25 29 25Not at all confident 13 13 16 10 13 11 15 15 12 12 14 13 11 13(Don't know/refused) 4 4 4 2 2 2 4 2 3 2 4 3 3 4Very/Somewhat confident 61 64 54 67 61 64 58 56 64 65 57 60 58 58Not too/Not at all confident 36 32 42 32 37 34 38 42 33 33 38 37 40 38
TargetSmart Communications 1155 15th St, NW, Suite 750, Washington, DC 20005 targetsmart.com
79 of 228
Page 80
May 21-27, 2020
National Voter Insights Study
TargetSmart + Dynata
Kids at home Religious attendance
Total Yes No
More than
once a week
Once a week
Once or twice a month
A few times a
year Seldom NeverFreq uent
Infreq uent
Seldom / Never
Party ID Difference...2-3-2 PARTY ID Dem-Rep 4 2 6 -10 -15 5 7 6 24 -14 6 163-1-3 PARTY ID Dem-Rep 7 5 9 -19 -17 -5 14 9 35 -17 7 24
Q. 20 A. Coronavirus Concern - You or a member of your family losing work and income due to the coronavirus outbreak.Total Answering (1200) (301) (876) (89) (251) (121) (190) (212) (301) (340) (311) (513)Very concerned 30 36 28 35 31 28 43 28 24 32 37 26Somewhat concerned 23 24 23 17 20 26 21 26 26 19 23 26A little concerned 18 18 18 16 18 21 12 23 17 18 15 20Not at all concerned 27 21 29 30 28 25 25 22 31 29 25 27(Don't know/refused) 2 2 1 2 2 - - 1 2 2 - 2Very/Somewhat concerned 54 60 51 52 51 54 64 54 50 51 60 52A little/Not at all concerned 45 38 47 46 47 46 36 45 49 46 40 47
Q. 20 B. Coronavirus Concern - The coronavirus outbreak preventing American citizens from registering to vote in this year's elections.Total Answering (1200) (301) (876) (89) (251) (121) (190) (212) (301) (340) (311) (513)Very concerned 26 26 26 33 25 23 30 26 23 27 27 25Somewhat concerned 24 23 24 13 22 25 24 28 28 20 25 28A little concerned 17 14 18 17 18 16 14 14 19 18 15 17Not at all concerned 31 35 30 35 34 34 32 30 28 34 33 29(Don't know/refused) 2 2 2 2 2 1 - 2 2 2 1 2Very/Somewhat concerned 50 49 51 47 46 48 54 54 51 47 52 52A little/Not at all concerned 48 49 48 52 52 51 46 44 47 52 48 46
Q. 20 C. Coronavirus Concern - The coronavirus outbreak preventing American citizens from voting in this year's elections.Total Answering (1200) (301) (876) (89) (251) (121) (190) (212) (301) (340) (311) (513)Very concerned 33 36 33 38 34 31 36 34 30 35 34 32Somewhat concerned 22 21 23 14 20 20 26 22 26 18 24 24A little concerned 16 13 17 13 18 18 16 13 16 17 17 15Not at all concerned 26 29 25 32 26 31 20 30 25 28 24 27(Don't know/refused) 2 2 2 3 2 - 1 2 3 2 1 2Very/Somewhat concerned 56 56 56 53 54 51 63 56 56 53 58 56A little/Not at all concerned 42 42 43 45 44 49 37 43 41 44 42 42
Q. 21 Confidence in Community Vote CountTotal Answering (1200) (301) (876) (89) (251) (121) (190) (212) (301) (340) (311) (513)Very confident 35 31 37 49 35 26 38 32 37 39 33 35Somewhat confident 38 41 37 35 36 45 38 39 38 36 40 38Not too confident 16 17 15 8 17 17 16 19 15 14 16 16Not at all confident 8 9 8 7 8 10 8 6 10 8 8 8(Don't know/refused) 3 3 2 2 5 2 2 5 1 4 2 2Very/Somewhat confident 73 72 75 84 71 71 75 71 75 74 74 73Not too/Not at all confident 24 26 23 14 24 27 23 25 25 22 25 25
Q. 22 Confidence in US Vote CountTotal Answering (1200) (301) (876) (89) (251) (121) (190) (212) (301) (340) (311) (513)Very confident 23 20 24 34 23 16 23 21 24 26 20 23Somewhat confident 38 41 38 36 37 46 37 39 38 37 41 38Not too confident 23 26 23 20 27 20 26 23 21 25 24 21Not at all confident 13 10 13 8 11 16 11 13 15 10 13 14(Don't know/refused) 4 4 3 2 3 2 3 4 3 3 3 3Very/Somewhat confident 61 61 62 70 60 62 60 60 62 63 61 61Not too/Not at all confident 36 36 35 28 37 36 37 36 35 35 37 36
TargetSmart Communications 1155 15th St, NW, Suite 750, Washington, DC 20005 targetsmart.com
80 of 228
Page 81
May 21-27, 2020
National Voter Insights Study
TargetSmart + Dynata
Gender/Age Gender/Education Age/Education
TotalYoun
ger MenOlder Men
Youn ger
WomenOlder
WomenNon Coll
MenColl Men
Non Coll Women
Coll Women
Youn ger Non
CollOlder
Non Coll
Youn ger Coll
egeOlder Coll
Party ID Difference...2-3-2 PARTY ID Dem-Rep 4 7 -15 21 6 -9 -2 7 19 6 -4 22 -53-1-3 PARTY ID Dem-Rep 7 12 -19 28 8 -12 1 10 26 8 -7 31 -3
Q. 20 A. Coronavirus Concern - You or a member of your family losing work and income due to the coronavirus outbreak.Total Answering (1200) (256) (301) (312) (304) (262) (307) (318) (304) (252) (316) (312) (285)Very concerned 30 34 21 34 34 29 25 34 33 34 30 34 24Somewhat concerned 23 25 20 28 19 18 26 21 26 21 19 31 20A little concerned 18 23 17 19 14 18 21 19 15 24 14 19 17Not at all concerned 27 19 41 17 31 35 28 23 25 20 34 16 38(Don't know/refused) 2 0 1 3 2 1 1 3 1 2 2 1 1Very/Somewhat concerned 54 58 41 61 53 47 51 56 59 55 49 65 44A little/Not at all concerned 45 41 58 36 45 53 48 41 40 44 48 35 55
Q. 20 B. Coronavirus Concern - The coronavirus outbreak preventing American citizens from registering to vote in this year's elections.Total Answering (1200) (256) (301) (312) (304) (262) (307) (318) (304) (252) (316) (312) (285)Very concerned 26 24 26 24 30 27 23 28 28 24 30 25 26Somewhat concerned 24 31 16 25 26 20 25 23 28 24 21 31 22A little concerned 17 18 16 21 12 16 18 17 17 19 15 21 14Not at all concerned 31 26 40 27 29 36 33 30 27 32 33 23 37(Don't know/refused) 2 1 1 2 3 1 1 3 1 2 2 - 2Very/Somewhat concerned 50 55 42 49 56 47 48 51 55 47 51 56 48A little/Not at all concerned 48 45 56 49 41 52 51 47 43 51 47 44 50
Q. 20 C. Coronavirus Concern - The coronavirus outbreak preventing American citizens from voting in this year's elections.Total Answering (1200) (256) (301) (312) (304) (262) (307) (318) (304) (252) (316) (312) (285)Very concerned 33 35 32 31 36 35 31 32 36 31 36 34 32Somewhat concerned 22 24 18 25 22 18 23 24 24 22 21 28 19A little concerned 16 16 15 19 15 15 17 16 17 19 13 17 17Not at all concerned 26 24 34 22 25 31 28 23 23 25 29 21 30(Don't know/refused) 2 1 2 3 2 1 1 4 1 3 2 0 2Very/Somewhat concerned 56 59 50 56 58 53 54 56 59 53 56 62 52A little/Not at all concerned 42 39 49 41 40 46 44 40 40 44 41 38 47
Q. 21 Confidence in Community Vote CountTotal Answering (1200) (256) (301) (312) (304) (262) (307) (318) (304) (252) (316) (312) (285)Very confident 35 32 50 22 38 42 42 25 36 24 39 29 49Somewhat confident 38 42 32 44 34 33 39 41 37 41 35 45 30Not too confident 16 16 11 23 14 15 12 17 19 22 12 18 13Not at all confident 8 8 6 8 10 7 7 11 7 9 9 7 7(Don't know/refused) 3 2 2 4 4 3 1 6 1 4 5 1 1Very/Somewhat confident 73 74 82 66 72 75 80 66 73 65 75 74 80Not too/Not at all confident 24 24 17 30 24 22 19 28 26 31 21 25 19
Q. 22 Confidence in US Vote CountTotal Answering (1200) (256) (301) (312) (304) (262) (307) (318) (304) (252) (316) (312) (285)Very confident 23 22 28 17 25 25 26 20 22 21 25 19 29Somewhat confident 38 43 39 33 38 37 43 34 38 33 37 42 39Not too confident 23 19 20 31 22 20 19 27 27 27 21 24 21Not at all confident 13 15 11 13 12 15 11 14 11 16 13 12 10(Don't know/refused) 4 1 3 6 4 2 1 6 3 3 5 3 1Very/Somewhat confident 61 64 67 51 63 63 69 54 59 53 62 61 68Not too/Not at all confident 36 34 31 43 34 35 30 41 38 44 34 37 31
TargetSmart Communications 1155 15th St, NW, Suite 750, Washington, DC 20005 targetsmart.com
81 of 228
Page 82
May 21-27, 2020
National Voter Insights Study
TargetSmart + Dynata
Marital Status/Gender Marital Status/Kids Trump Job Approval
Voting Permissions by State
Total
Marr ied
Men
Marr ied
WomenUnmarr ied Men
Unmarr ied
Women
Marr ied
with kids
Marr ied with out kids
Unmarr ied with
kids
Unmarr ied with out kids
Total appr ove
Total disapp rove All mail
Open early / mail Closed
Party ID Difference...2-3-2 PARTY ID Dem-Rep 4 -17 -5 9 30 -4 -15 19 22 -50 50 -9 4 83-1-3 PARTY ID Dem-Rep 7 -22 -4 16 39 -2 -19 22 31 -65 67 -5 9 8
Q. 20 A. Coronavirus Concern - You or a member of your family losing work and income due to the coronavirus outbreak.Total Answering (1200) (312) (306) (247) (313) (216) (400) (83) (471) (528) (626) (111) (605) (484)Very concerned 30 24 32 31 35 33 26 45 31 26 34 33 29 32Somewhat concerned 23 23 22 20 27 24 22 22 24 20 26 21 25 21A little concerned 18 19 16 20 17 18 18 18 18 20 17 11 20 17Not at all concerned 27 33 28 28 20 24 34 13 25 32 22 35 25 28(Don't know/refused) 2 0 2 1 2 1 1 2 2 2 1 - 2 2Very/Somewhat concerned 54 48 54 51 61 58 47 67 55 46 60 54 54 53A little/Not at all concerned 45 52 45 48 37 41 52 31 43 52 39 46 44 45
Q. 20 B. Coronavirus Concern - The coronavirus outbreak preventing American citizens from registering to vote in this year's elections.Total Answering (1200) (312) (306) (247) (313) (216) (400) (83) (471) (528) (626) (111) (605) (484)Very concerned 26 21 23 30 32 21 22 38 30 17 35 23 27 27Somewhat concerned 24 22 25 23 26 26 23 18 26 19 28 29 24 24A little concerned 17 15 15 20 18 13 17 15 19 17 17 13 17 18Not at all concerned 31 42 33 26 24 38 37 28 24 46 19 33 32 29(Don't know/refused) 2 1 3 1 1 2 2 - 1 1 1 3 1 2Very/Somewhat concerned 50 43 48 53 57 46 45 57 56 36 63 52 50 51A little/Not at all concerned 48 57 49 46 42 51 54 44 43 63 36 46 49 47
Q. 20 C. Coronavirus Concern - The coronavirus outbreak preventing American citizens from voting in this year's elections.Total Answering (1200) (312) (306) (247) (313) (216) (400) (83) (471) (528) (626) (111) (605) (484)Very concerned 33 31 31 34 37 33 30 44 34 23 43 29 34 34Somewhat concerned 22 17 21 25 26 19 19 26 26 17 26 29 20 24A little concerned 16 16 15 16 18 13 17 12 18 17 16 14 18 15Not at all concerned 26 36 30 22 17 33 33 19 19 42 14 26 26 26(Don't know/refused) 2 1 3 2 1 2 2 - 2 2 1 1 2 2Very/Somewhat concerned 56 48 52 60 63 52 49 69 61 40 70 58 54 57A little/Not at all concerned 42 52 45 38 35 46 50 31 37 59 29 40 44 41
Q. 21 Confidence in Community Vote CountTotal Answering (1200) (312) (306) (247) (313) (216) (400) (83) (471) (528) (626) (111) (605) (484)Very confident 35 49 35 33 25 34 46 22 30 42 31 43 37 31Somewhat confident 38 32 39 42 40 42 32 37 42 35 40 36 39 36Not too confident 16 12 15 15 21 14 13 26 17 14 18 11 14 19Not at all confident 8 7 8 8 10 7 7 12 8 7 9 9 8 9(Don't know/refused) 3 1 4 3 4 3 2 2 3 3 2 1 2 5Very/Somewhat confident 73 81 74 75 65 76 78 59 72 76 72 79 76 68Not too/Not at all confident 24 19 22 22 31 21 21 39 25 20 27 20 22 28
Q. 22 Confidence in US Vote CountTotal Answering (1200) (312) (306) (247) (313) (216) (400) (83) (471) (528) (626) (111) (605) (484)Very confident 23 29 24 21 18 22 29 15 20 27 20 24 24 22Somewhat confident 38 40 36 42 36 45 35 31 40 38 39 41 38 37Not too confident 23 18 25 21 28 23 21 32 24 21 25 23 23 23Not at all confident 13 11 12 15 12 9 13 14 12 11 14 10 12 15(Don't know/refused) 4 1 3 2 6 2 2 8 3 3 3 1 3 4Very/Somewhat confident 61 69 60 63 54 67 64 46 61 65 58 66 62 59Not too/Not at all confident 36 30 37 36 40 31 34 46 36 32 39 33 35 37
TargetSmart Communications 1155 15th St, NW, Suite 750, Washington, DC 20005 targetsmart.com
82 of 228
Page 83
May 21-27, 2020
National Voter Insights Study
TargetSmart + Dynata
Permanent Absentee Voter
Status
Ever Voted Early or By Mail
First Time Voters in 2018 2016 Vote History TargetSmart Voter Score
Total PAVNot PAV Yes No Yes No Voted
Did not Vote
Was Not
Regist ered
Super Voter
Freq uent Voter
Infreq uent Voter
Never Voted
Party ID Difference...2-3-2 PARTY ID Dem-Rep 4 16 3 1 5 4 5 2 4 17 0 1 9 73-1-3 PARTY ID Dem-Rep 7 22 5 0 9 9 7 2 8 26 -4 5 13 14
Q. 20 A. Coronavirus Concern - You or a member of your family losing work and income due to the coronavirus outbreak.Total Answering (1200) (130) (1070) (220) (980) (176) (1024) (757) (266) (177) (221) (393) (393) (137)Very concerned 30 37 30 30 31 30 31 30 33 30 29 28 34 33Somewhat concerned 23 25 23 24 23 22 23 24 20 25 19 23 26 22A little concerned 18 13 19 19 18 20 18 16 22 19 19 18 16 16Not at all concerned 27 24 27 25 27 28 27 29 25 23 32 29 22 28(Don't know/refused) 2 2 2 2 2 1 2 2 - 3 1 2 2 1Very/Somewhat concerned 54 62 53 54 53 52 54 53 53 55 48 51 60 55A little/Not at all concerned 45 36 46 44 45 47 45 45 47 42 51 47 38 44
Q. 20 B. Coronavirus Concern - The coronavirus outbreak preventing American citizens from registering to vote in this year's elections.Total Answering (1200) (130) (1070) (220) (980) (176) (1024) (757) (266) (177) (221) (393) (393) (137)Very concerned 26 28 26 27 26 17 28 28 24 23 33 27 26 16Somewhat concerned 24 25 24 22 25 28 24 23 25 30 19 24 25 30A little concerned 17 15 17 16 17 22 16 14 23 21 14 15 18 20Not at all concerned 31 30 31 31 31 31 31 34 27 23 34 32 28 32(Don't know/refused) 2 2 2 4 1 3 2 2 1 3 1 2 2 3Very/Somewhat concerned 50 53 50 49 51 45 52 51 49 53 51 51 52 46A little/Not at all concerned 48 45 48 47 48 53 47 48 50 44 48 47 46 51
Q. 20 C. Coronavirus Concern - The coronavirus outbreak preventing American citizens from voting in this year's elections.Total Answering (1200) (130) (1070) (220) (980) (176) (1024) (757) (266) (177) (221) (393) (393) (137)Very concerned 33 40 33 38 32 20 36 36 26 34 38 35 36 20Somewhat concerned 22 20 22 20 23 23 22 21 26 20 21 22 23 25A little concerned 16 14 17 12 17 27 14 13 23 21 12 13 17 26Not at all concerned 26 23 26 26 26 27 26 28 25 20 28 28 22 27(Don't know/refused) 2 2 2 3 2 3 2 2 0 5 1 2 3 3Very/Somewhat concerned 56 61 55 59 55 43 58 57 52 54 59 57 59 45A little/Not at all concerned 42 37 43 38 43 54 40 41 48 41 40 41 39 52
Q. 21 Confidence in Community Vote CountTotal Answering (1200) (130) (1070) (220) (980) (176) (1024) (757) (266) (177) (221) (393) (393) (137)Very confident 35 41 35 41 34 32 36 38 28 36 47 37 29 36Somewhat confident 38 33 38 34 38 36 38 38 39 36 32 39 40 34Not too confident 16 13 16 15 16 18 15 14 21 15 10 14 20 17Not at all confident 8 12 8 7 9 10 8 8 9 9 8 9 7 8(Don't know/refused) 3 1 4 3 3 4 3 3 3 4 2 2 4 5Very/Somewhat confident 73 75 73 75 73 68 74 76 67 72 79 76 69 70Not too/Not at all confident 24 25 24 22 24 28 23 22 30 24 18 22 27 25
Q. 22 Confidence in US Vote CountTotal Answering (1200) (130) (1070) (220) (980) (176) (1024) (757) (266) (177) (221) (393) (393) (137)Very confident 23 28 22 27 22 18 24 25 20 20 26 23 22 22Somewhat confident 38 33 39 38 38 40 38 38 39 39 39 40 35 37Not too confident 23 24 23 22 23 25 23 22 27 24 18 22 26 25Not at all confident 13 13 13 10 13 13 13 13 11 15 14 12 14 12(Don't know/refused) 4 2 4 4 4 4 3 4 3 3 3 3 4 4Very/Somewhat confident 61 61 61 65 60 59 61 62 59 58 65 63 57 59Not too/Not at all confident 36 37 36 32 37 38 36 34 38 39 32 34 39 37
TargetSmart Communications 1155 15th St, NW, Suite 750, Washington, DC 20005 targetsmart.com
83 of 228
Page 84
May 21-27, 2020
National Voter Insights Study
TargetSmart + Dynata
Partisan Score Presidential General Turnout Score Mode
Total 0 to 9.9 10 to 89.9 90+ 0 to 69.9 70+ Web Land line Wire less
Party ID Difference...2-3-2 PARTY ID Dem-Rep 4 -48 -4 53 4 5 3 -3 83-1-3 PARTY ID Dem-Rep 7 -55 -1 62 10 5 4 -6 15
Q. 20 A. Coronavirus Concern - You or a member of your family losing work and income due to the coronavirus outbreak.Total Answering (1200) (302) (491) (408) (429) (771) (644) (116) (440)Very concerned 30 22 30 37 32 30 23 30 41Somewhat concerned 23 19 22 28 22 24 22 21 26A little concerned 18 21 19 14 19 18 26 13 8Not at all concerned 27 35 28 19 26 28 28 36 23(Don't know/refused) 2 2 1 2 2 2 2 1 1Very/Somewhat concerned 54 41 52 65 53 54 45 50 67A little/Not at all concerned 45 57 48 33 45 45 53 49 32
Q. 20 B. Coronavirus Concern - The coronavirus outbreak preventing American citizens from registering to vote in this year's elections.Total Answering (1200) (302) (491) (408) (429) (771) (644) (116) (440)Very concerned 26 18 22 38 23 28 19 31 36Somewhat concerned 24 20 25 26 27 22 25 24 24A little concerned 17 17 18 15 18 17 22 9 12Not at all concerned 31 45 33 18 30 32 32 35 28(Don't know/refused) 2 1 2 3 3 1 2 2 2Very/Somewhat concerned 50 37 47 64 50 51 44 55 59A little/Not at all concerned 48 62 51 33 47 48 54 44 39
Q. 20 C. Coronavirus Concern - The coronavirus outbreak preventing American citizens from voting in this year's elections.Total Answering (1200) (302) (491) (408) (429) (771) (644) (116) (440)Very concerned 33 25 30 44 28 36 26 35 45Somewhat concerned 22 20 21 25 24 21 23 19 23A little concerned 16 14 20 14 19 15 22 14 8Not at all concerned 26 41 27 14 26 26 28 31 23(Don't know/refused) 2 1 2 3 3 2 2 1 2Very/Somewhat concerned 56 44 52 69 52 58 48 54 67A little/Not at all concerned 42 55 47 28 45 41 50 45 31
Q. 21 Confidence in Community Vote CountTotal Answering (1200) (302) (491) (408) (429) (771) (644) (116) (440)Very confident 35 41 35 32 31 38 32 44 38Somewhat confident 38 34 38 40 37 38 41 33 35Not too confident 16 15 16 16 18 14 17 12 15Not at all confident 8 8 8 9 10 7 7 8 9(Don't know/refused) 3 2 3 4 5 2 3 3 3Very/Somewhat confident 73 75 73 72 68 76 73 76 73Not too/Not at all confident 24 23 24 24 28 22 24 20 24
Q. 22 Confidence in US Vote CountTotal Answering (1200) (302) (491) (408) (429) (771) (644) (116) (440)Very confident 23 26 23 21 24 22 23 24 23Somewhat confident 38 38 39 37 36 39 39 41 36Not too confident 23 20 23 25 24 23 24 18 23Not at all confident 13 13 12 13 12 13 11 12 16(Don't know/refused) 4 3 2 5 5 3 3 7 3Very/Somewhat confident 61 63 62 57 60 61 62 64 58Not too/Not at all confident 36 34 35 38 36 36 35 29 39
TargetSmart Communications 1155 15th St, NW, Suite 750, Washington, DC 20005 targetsmart.com
84 of 228
Page 85
May 21-27, 2020
National Voter Insights Study
TargetSmart + Dynata
2-3-2 Party 3-1-3 Party Ideology Party ID/Ideology
Total Dem Ind Rep Dem Ind Rep Lib Mod ConsLib
Dem
Mod / Cons Dem
Mod / Lib Rep
Cons Rep
Party ID Difference...2-3-2 PARTY ID Dem-Rep 4 100 - -100 73 - -75 68 6 -52 100 100 -100 -1003-1-3 PARTY ID Dem-Rep 7 100 8 -100 100 - -100 85 10 -63 100 100 -100 -100
Q. 23 Election Administration in the USTotal Answering (1200) (415) (395) (362) (566) (124) (482) (304) (469) (368) (213) (189) (117) (239)Very well 16 13 12 24 13 11 20 8 17 21 7 19 25 22Somewhat well 42 43 43 42 42 40 45 37 49 41 41 46 47 39Not too well 24 27 24 23 26 30 21 30 20 26 29 25 17 26Not well at all 13 12 17 10 13 18 11 19 12 9 16 8 10 10(Don't know/refused) 5 5 4 2 5 2 3 6 2 3 6 2 1 2Very/Somewhat well 58 56 55 66 55 51 65 45 66 62 49 65 72 62Not too/Not well at all 37 39 41 33 40 47 33 49 32 35 45 32 27 36
Q. 24 Coronavirus Impact on 2020 Voting TurnoutTotal Answering (1200) (415) (395) (362) (566) (124) (482) (304) (469) (368) (213) (189) (117) (239)Very big impact 27 37 26 18 36 28 17 35 26 23 36 37 18 18Fairly big impact 35 37 37 31 39 33 30 39 39 26 39 36 39 27Small impact 29 20 28 42 19 26 42 19 29 39 19 23 40 43No impact at all 7 4 8 9 4 10 9 5 5 10 4 4 4 10Prefer not to answer 2 2 2 1 2 3 1 2 1 2 3 1 - 2Very/Fairly big impact 62 74 63 49 75 62 47 74 65 49 75 73 56 45Small/Not impact at all 36 24 36 50 23 36 51 24 35 49 23 27 44 54
Q. 25 Likelihood That Coronavirus Will Prevent You From VotingTotal Answering (1200) (415) (395) (362) (566) (124) (482) (304) (469) (368) (213) (189) (117) (239)1 55 48 56 64 51 43 64 51 52 64 51 45 51 692 6 5 9 6 4 13 7 6 8 5 7 2 8 53 4 5 5 3 5 4 3 4 4 5 4 6 1 34 4 4 5 3 4 7 3 6 3 3 6 2 3 35 9 12 7 6 11 10 6 9 9 7 10 14 10 56 2 3 3 1 4 1 1 3 4 1 3 4 3 07 3 4 3 1 4 5 1 3 3 2 3 5 3 08 3 6 2 2 5 2 2 5 4 1 6 5 2 29 1 1 0 2 1 - 1 1 1 1 0 2 3 110 6 6 5 5 6 7 4 5 6 4 4 8 6 4(Don't know/refused) 7 7 6 8 6 8 8 7 6 9 8 7 10 8Mean 2.8 3.3 2.6 2.4 3.2 3.1 2.3 3.0 3.0 2.3 2.9 3.6 3.1 2.11-3 66 58 69 72 60 61 74 61 64 73 62 54 61 774-7 18 23 18 11 23 22 10 22 19 13 21 25 19 88-10 10 12 7 8 11 9 7 10 11 6 10 14 11 7
Q. 26 Planned Voting MethodTotal Answering (1200) (415) (395) (362) (566) (124) (482) (304) (469) (368) (213) (189) (117) (239)In-person Eday 36 29 35 45 29 32 45 26 37 45 26 33 46 45In-person early 19 16 20 20 17 19 21 16 19 21 14 18 18 20By mail 41 52 40 33 51 39 32 53 41 32 56 46 33 33(I am not voting) 2 1 3 1 1 8 1 3 1 1 2 1 1 1(Don't know/refused) 3 2 2 2 2 3 2 3 2 1 3 2 3 1
TargetSmart Communications 1155 15th St, NW, Suite 750, Washington, DC 20005 targetsmart.com
85 of 228
Page 86
May 21-27, 2020
National Voter Insights Study
TargetSmart + Dynata
Party ID/Gender
Total Dem MenDem
Women Ind MenInd
Women Rep MenRep
Women
Party ID Difference...2-3-2 PARTY ID Dem-Rep 4 100 100 - - -100 -1003-1-3 PARTY ID Dem-Rep 7 100 100 1 17 -100 -100
Q. 23 Election Administration in the USTotal Answering (1200) (157) (258) (219) (177) (186) (177)Very well 16 14 12 15 8 22 25Somewhat well 42 44 43 44 41 43 41Not too well 24 30 25 21 28 25 20Not well at all 13 9 14 14 20 8 12(Don't know/refused) 5 3 6 6 3 2 2Very/Somewhat well 58 58 55 60 49 65 66Not too/Not well at all 37 39 39 35 48 34 32
Q. 24 Coronavirus Impact on 2020 Voting TurnoutTotal Answering (1200) (157) (258) (219) (177) (186) (177)Very big impact 27 32 39 26 27 16 20Fairly big impact 35 35 39 27 49 28 33Small impact 29 26 17 35 19 47 36No impact at all 7 6 3 11 3 8 9Prefer not to answer 2 2 2 1 2 1 2Very/Fairly big impact 62 67 78 52 76 44 53Small/Not impact at all 36 31 20 46 22 55 45
Q. 25 Likelihood That Coronavirus Will Prevent You From VotingTotal Answering (1200) (157) (258) (219) (177) (186) (177)1 55 51 46 60 51 67 612 6 7 3 9 8 9 33 4 5 6 5 5 4 24 4 5 3 4 7 2 35 9 10 13 5 10 4 96 2 3 3 4 2 1 27 3 4 4 3 3 1 18 3 6 5 1 2 1 29 1 - 1 - 1 2 210 6 5 6 4 6 5 5(Don't know/refused) 7 3 10 6 6 5 11Mean 2.8 3.1 3.4 2.4 2.9 2.2 2.51-3 66 63 55 73 64 79 664-7 18 22 23 16 21 8 158-10 10 12 13 6 9 8 8
Q. 26 Planned Voting MethodTotal Answering (1200) (157) (258) (219) (177) (186) (177)In-person Eday 36 32 27 38 31 46 44In-person early 19 11 19 21 19 21 18By mail 41 53 51 35 46 32 34(I am not voting) 2 1 1 4 2 1 1(Don't know/refused) 3 3 2 2 2 1 3
TargetSmart Communications 1155 15th St, NW, Suite 750, Washington, DC 20005 targetsmart.com
86 of 228
Page 87
May 21-27, 2020
National Voter Insights Study
TargetSmart + Dynata
Urbanicity
Total R1 R2 S3 S4 U5 U6 Rural Subu rban Urban
Party ID Difference...2-3-2 PARTY ID Dem-Rep 4 -23 -15 -2 9 22 42 -19 4 283-1-3 PARTY ID Dem-Rep 7 -23 -17 -1 12 26 52 -20 7 33
Q. 23 Election Administration in the USTotal Answering (1200) (179) (181) (195) (273) (264) (108) (360) (468) (372)Very well 16 19 19 20 10 17 14 19 14 16Somewhat well 42 36 49 47 38 43 42 42 42 42Not too well 24 22 24 18 30 25 21 23 25 24Not well at all 13 17 7 12 16 11 18 12 14 13(Don't know/refused) 5 6 1 4 6 5 6 4 5 5Very/Somewhat well 58 55 67 66 48 59 56 61 56 58Not too/Not well at all 37 39 32 30 46 36 38 35 39 37
Q. 24 Coronavirus Impact on 2020 Voting TurnoutTotal Answering (1200) (179) (181) (195) (273) (264) (108) (360) (468) (372)Very big impact 27 21 23 20 30 32 39 22 26 34Fairly big impact 35 35 33 37 33 37 32 34 35 35Small impact 29 31 37 30 30 23 21 34 30 23No impact at all 7 11 7 8 5 7 6 9 6 6Prefer not to answer 2 3 1 4 3 2 3 2 3 2Very/Fairly big impact 62 56 56 58 63 69 70 56 61 69Small/Not impact at all 36 41 43 38 34 30 27 42 36 29
Q. 25 Likelihood That Coronavirus Will Prevent You From VotingTotal Answering (1200) (179) (181) (195) (273) (264) (108) (360) (468) (372)1 55 61 56 59 56 48 53 59 57 502 6 2 8 9 5 5 9 5 7 73 4 3 3 6 3 6 5 3 4 64 4 2 5 4 5 3 4 3 4 35 9 9 8 6 10 10 8 8 8 96 2 2 2 3 2 3 4 2 2 37 3 2 1 - 4 5 4 1 3 58 3 4 2 1 3 5 2 3 2 49 1 1 3 1 1 - - 2 1 -10 6 8 5 4 4 8 4 6 4 7(Don't know/refused) 7 5 9 6 8 8 5 7 7 7Mean 2.8 2.9 2.7 2.3 2.7 3.3 2.7 2.8 2.6 3.11-3 66 67 66 74 64 59 68 66 68 624-7 18 14 16 13 21 20 21 15 18 208-10 10 14 9 6 8 12 6 12 7 11
Q. 26 Planned Voting MethodTotal Answering (1200) (179) (181) (195) (273) (264) (108) (360) (468) (372)In-person Eday 36 45 33 41 34 32 29 39 37 31In-person early 19 15 21 17 21 19 19 18 19 19By mail 41 35 43 38 39 45 45 39 39 45(I am not voting) 2 1 2 1 2 2 2 2 2 2(Don't know/refused) 3 5 2 3 4 2 4 4 3 3
TargetSmart Communications 1155 15th St, NW, Suite 750, Washington, DC 20005 targetsmart.com
87 of 228
Page 88
May 21-27, 2020
National Voter Insights Study
TargetSmart + Dynata
Urbanicity/Gender
Total Rural MenRural
WomenSubu rban
MenSubu rban Women Urban Men
Urban Women
Party ID Difference...2-3-2 PARTY ID Dem-Rep 4 -23 -15 -4 12 13 393-1-3 PARTY ID Dem-Rep 7 -28 -13 -1 15 16 48
Q. 23 Election Administration in the USTotal Answering (1200) (180) (180) (227) (241) (164) (208)Very well 16 19 19 14 13 20 13Somewhat well 42 44 41 43 40 44 41Not too well 24 24 22 27 24 22 25Not well at all 13 11 14 10 19 11 14(Don't know/refused) 5 3 4 6 4 3 6Very/Somewhat well 58 62 60 58 54 64 54Not too/Not well at all 37 35 36 36 42 33 40
Q. 24 Coronavirus Impact on 2020 Voting TurnoutTotal Answering (1200) (180) (180) (227) (241) (164) (208)Very big impact 27 20 24 24 28 29 38Fairly big impact 35 27 41 29 40 33 37Small impact 29 42 25 36 24 28 19No impact at all 7 10 7 7 5 9 5Prefer not to answer 2 1 3 3 3 2 2Very/Fairly big impact 62 47 65 53 68 62 75Small/Not impact at all 36 53 32 44 29 36 23
Q. 25 Likelihood That Coronavirus Will Prevent You From VotingTotal Answering (1200) (180) (180) (227) (241) (164) (208)1 55 68 49 57 57 51 482 6 6 5 9 4 9 43 4 4 1 4 5 6 54 4 5 2 2 7 3 35 9 4 13 6 11 10 96 2 1 3 4 1 4 37 3 1 2 4 2 4 58 3 2 4 3 2 4 49 1 1 3 1 1 - -10 6 4 9 5 3 6 7(Don't know/refused) 7 5 9 7 8 4 10Mean 2.8 2.2 3.5 2.7 2.5 3.0 3.21-3 66 78 55 70 67 67 584-7 18 11 19 15 20 20 208-10 10 7 16 9 6 10 11
Q. 26 Planned Voting MethodTotal Answering (1200) (180) (180) (227) (241) (164) (208)In-person Eday 36 37 40 42 33 37 27In-person early 19 23 12 15 22 17 20By mail 41 36 42 38 40 40 50(I am not voting) 2 2 1 1 2 2 2(Don't know/refused) 3 1 6 3 3 4 1
TargetSmart Communications 1155 15th St, NW, Suite 750, Washington, DC 20005 targetsmart.com
88 of 228
Page 89
May 21-27, 2020
National Voter Insights Study
TargetSmart + Dynata
Region by State
TotalBorder States
Califo rnia
Indust rial
Midw est
Lower Midw
estMid -
Atla ntic
Moun tain
States
Nati onal
Capi talNew
Engl and
Paci fic Northw
est SouthSouthe
ast
Upper Midw
est
Party ID Difference...2-3-2 PARTY ID Dem-Rep 4 4 19 -11 16 15 2 5 17 -7 -3 3 13-1-3 PARTY ID Dem-Rep 7 -5 27 -6 17 21 5 15 29 2 -9 8 -8
Q. 23 Election Administration in the USTotal Answering (1200) (132) (120) (157) (60) (158) (48) (60) (60) (48) (108) (193) (48)Very well 16 18 18 12 23 20 11 12 14 16 15 16 14Somewhat well 42 41 39 44 50 36 58 41 46 38 36 45 42Not too well 24 22 26 28 21 22 13 32 20 25 28 22 35Not well at all 13 12 14 13 5 19 18 11 10 15 16 12 4(Don't know/refused) 5 7 4 3 2 3 - 6 11 6 6 5 6Very/Somewhat well 58 59 56 57 73 56 69 53 59 54 50 61 56Not too/Not well at all 37 34 40 41 26 41 31 42 30 40 43 34 38
Q. 24 Coronavirus Impact on 2020 Voting TurnoutTotal Answering (1200) (132) (120) (157) (60) (158) (48) (60) (60) (48) (108) (193) (48)Very big impact 27 26 28 25 32 33 29 25 21 26 34 24 24Fairly big impact 35 34 32 36 35 29 41 44 42 34 32 35 37Small impact 29 27 32 31 28 31 21 25 21 25 26 32 32No impact at all 7 12 8 6 3 5 8 6 8 12 5 6 6Prefer not to answer 2 2 - 3 2 2 2 1 8 3 3 4 1Very/Fairly big impact 62 60 60 61 67 62 69 68 63 60 67 59 61Small/Not impact at all 36 39 40 37 31 36 29 31 29 38 30 38 38
Q. 25 Likelihood That Coronavirus Will Prevent You From VotingTotal Answering (1200) (132) (120) (157) (60) (158) (48) (60) (60) (48) (108) (193) (48)1 55 50 54 55 53 56 57 53 48 64 58 57 612 6 4 4 7 9 7 8 4 9 11 4 6 73 4 9 7 2 5 5 4 2 6 - 1 4 54 4 8 3 2 1 3 6 3 8 2 2 4 65 9 10 7 13 6 9 10 8 8 5 11 6 46 2 1 6 2 - 3 2 7 1 - 2 2 27 3 3 1 5 5 3 2 - 3 3 3 3 -8 3 4 1 3 3 4 - 7 - - 5 4 39 1 - - 0 3 1 - 2 - - 3 1 210 6 5 4 5 8 5 8 3 8 8 5 6 8(Don't know/refused) 7 5 12 8 8 5 4 11 10 9 7 7 3Mean 2.8 2.9 2.6 2.8 3.1 2.8 2.7 3.0 2.9 2.3 3.0 2.8 2.71-3 66 63 65 63 66 68 68 60 63 74 63 66 734-7 18 23 18 21 12 17 20 18 20 10 17 16 128-10 10 9 5 8 14 10 8 12 8 8 13 11 13
Q. 26 Planned Voting MethodTotal Answering (1200) (132) (120) (157) (60) (158) (48) (60) (60) (48) (108) (193) (48)In-person Eday 36 20 24 38 57 47 21 44 46 8 52 30 48In-person early 19 44 9 19 5 19 7 12 12 5 23 24 4By mail 41 33 60 40 35 31 70 36 26 84 23 41 42(I am not voting) 2 2 4 - 2 2 1 4 5 - - 2 -(Don't know/refused) 3 2 2 4 2 2 1 4 11 4 2 3 5
TargetSmart Communications 1155 15th St, NW, Suite 750, Washington, DC 20005 targetsmart.com
89 of 228
Page 90
May 21-27, 2020
National Voter Insights Study
TargetSmart + Dynata
Gender Age
Total Men Women 18 - 34 35 - 49 50 - 64 Over 64 18 - 4950 and
over
Party ID Difference...2-3-2 PARTY ID Dem-Rep 4 -5 13 24 6 -2 -8 15 -53-1-3 PARTY ID Dem-Rep 7 -5 18 33 8 0 -10 21 -5
Q. 23 Election Administration in the USTotal Answering (1200) (571) (629) (281) (287) (310) (295) (568) (605)Very well 16 17 15 9 15 18 22 12 20Somewhat well 42 44 41 41 43 42 43 42 42Not too well 24 24 24 30 22 25 20 26 23Not well at all 13 10 16 16 15 11 10 16 11(Don't know/refused) 5 4 5 4 5 4 5 5 5Very/Somewhat well 58 61 56 50 58 59 65 54 62Not too/Not well at all 37 35 40 46 37 37 30 41 34
Q. 24 Coronavirus Impact on 2020 Voting TurnoutTotal Answering (1200) (571) (629) (281) (287) (310) (295) (568) (605)Very big impact 27 24 30 31 29 24 25 30 25Fairly big impact 35 29 39 38 39 34 30 38 32Small impact 29 36 23 23 23 34 34 23 34No impact at all 7 9 5 7 7 7 7 7 7Prefer not to answer 2 2 3 2 2 2 4 2 3Very/Fairly big impact 62 54 69 69 68 58 55 68 56Small/Not impact at all 36 44 28 30 30 41 41 30 41
Q. 25 Likelihood That Coronavirus Will Prevent You From VotingTotal Answering (1200) (571) (629) (281) (287) (310) (295) (568) (605)1 55 59 52 33 55 59 70 44 642 6 8 4 9 5 8 4 7 63 4 5 4 8 4 3 3 6 34 4 3 4 11 3 1 2 7 15 9 6 11 10 11 8 6 11 76 2 3 2 3 3 3 1 3 27 3 3 3 6 1 4 1 4 28 3 3 3 4 4 2 2 4 29 1 1 1 1 1 1 1 1 110 6 5 6 6 7 5 4 7 4(Don't know/refused) 7 5 9 7 6 8 8 7 8Mean 2.8 2.6 3.0 3.6 3.0 2.6 2.1 3.3 2.41-3 66 71 60 51 64 70 77 57 734-7 18 15 20 31 18 15 8 25 128-10 10 8 11 11 12 8 7 12 8
Q. 26 Planned Voting MethodTotal Answering (1200) (571) (629) (281) (287) (310) (295) (568) (605)In-person Eday 36 39 33 28 38 42 34 33 38In-person early 19 18 19 17 20 19 18 19 18By mail 41 38 43 48 38 34 44 43 39(I am not voting) 2 2 2 4 2 1 1 3 1(Don't know/refused) 3 3 3 3 2 3 3 3 3
TargetSmart Communications 1155 15th St, NW, Suite 750, Washington, DC 20005 targetsmart.com
90 of 228
Page 91
May 21-27, 2020
National Voter Insights Study
TargetSmart + Dynata
Education Homeownership status Marital status
TotalH.S. or
lessPost H.S.
4yr Coll Grad
Post Grad
Coll ege Grad uate
Total Non Coll Rent Own
Marr ied Single
Separa ted / divo rced
Wido wed
Total Unmarr
ied
Party ID Difference...2-3-2 PARTY ID Dem-Rep 4 5 -3 6 13 9 0 32 -5 -11 30 10 -6 213-1-3 PARTY ID Dem-Rep 7 3 -1 9 20 14 0 44 -6 -13 42 12 -10 29
Q. 23 Election Administration in the USTotal Answering (1200) (210) (369) (363) (248) (610) (579) (297) (873) (618) (357) (144) (59) (560)Very well 16 25 12 17 13 16 17 11 18 18 11 20 19 14Somewhat well 42 39 44 42 45 43 42 40 43 44 41 42 41 41Not too well 24 20 26 25 24 25 24 30 23 23 28 23 25 26Not well at all 13 12 14 13 14 13 13 15 12 13 16 7 10 13(Don't know/refused) 5 4 5 3 5 4 5 5 4 3 5 7 5 5Very/Somewhat well 58 64 55 59 58 59 58 51 61 61 52 62 60 55Not too/Not well at all 37 32 40 38 38 38 37 45 35 36 44 31 35 39
Q. 24 Coronavirus Impact on 2020 Voting TurnoutTotal Answering (1200) (210) (369) (363) (248) (610) (579) (297) (873) (618) (357) (144) (59) (560)Very big impact 27 36 26 25 26 26 30 36 24 24 31 30 34 31Fairly big impact 35 29 34 37 37 37 32 35 35 35 35 35 32 35Small impact 29 23 31 30 30 30 28 19 33 32 25 26 27 26No impact at all 7 9 6 6 6 6 7 6 7 8 5 7 5 6Prefer not to answer 2 3 3 1 1 1 3 3 2 1 3 3 3 3Very/Fairly big impact 62 65 61 62 63 63 62 71 59 59 66 64 66 65Small/Not impact at all 36 32 37 36 36 36 35 26 40 40 31 33 32 32
Q. 25 Likelihood That Coronavirus Will Prevent You From VotingTotal Answering (1200) (210) (369) (363) (248) (610) (579) (297) (873) (618) (357) (144) (59) (560)1 55 45 55 55 66 59 51 43 59 64 42 54 48 462 6 4 4 9 8 8 4 8 6 7 5 8 4 63 4 4 3 7 2 5 4 5 4 3 7 2 7 64 4 6 3 4 2 4 4 6 3 3 7 1 3 55 9 14 9 8 6 7 11 12 8 7 12 9 6 106 2 3 3 2 2 2 3 3 2 1 3 5 4 47 3 3 4 3 1 2 4 4 2 2 5 2 5 48 3 5 3 2 2 2 4 4 3 2 5 4 - 49 1 1 1 1 2 1 1 0 1 1 0 1 4 110 6 8 6 3 5 4 7 7 5 4 8 4 5 7(Don't know/refused) 7 7 9 7 6 7 8 8 7 6 8 10 13 9Mean 2.8 3.5 3.0 2.5 2.3 2.4 3.2 3.3 2.6 2.4 3.5 2.8 3.1 3.31-3 66 54 62 70 75 72 59 56 69 74 54 64 59 574-7 18 26 19 17 11 14 21 25 15 13 26 17 19 238-10 10 14 11 6 8 7 12 11 9 7 13 9 9 11
Q. 26 Planned Voting MethodTotal Answering (1200) (210) (369) (363) (248) (610) (579) (297) (873) (618) (357) (144) (59) (560)In-person Eday 36 42 36 37 29 34 38 31 37 40 29 41 36 33In-person early 19 16 23 18 17 17 20 22 18 18 22 19 11 20By mail 41 33 37 43 50 46 36 40 41 39 44 39 47 43(I am not voting) 2 4 2 1 2 1 2 2 2 1 3 1 2 2(Don't know/refused) 3 6 2 2 2 2 3 5 2 2 3 0 5 3
TargetSmart Communications 1155 15th St, NW, Suite 750, Washington, DC 20005 targetsmart.com
91 of 228
Page 92
May 21-27, 2020
National Voter Insights Study
TargetSmart + Dynata
Kids at home Religious attendance
Total Yes No
More than
once a week
Once a week
Once or twice a month
A few times a
year Seldom NeverFreq uent
Infreq uent
Seldom / Never
Party ID Difference...2-3-2 PARTY ID Dem-Rep 4 2 6 -10 -15 5 7 6 24 -14 6 163-1-3 PARTY ID Dem-Rep 7 5 9 -19 -17 -5 14 9 35 -17 7 24
Q. 23 Election Administration in the USTotal Answering (1200) (301) (876) (89) (251) (121) (190) (212) (301) (340) (311) (513)Very well 16 17 16 19 17 15 18 14 14 18 17 14Somewhat well 42 46 42 49 41 49 44 40 40 43 46 40Not too well 24 22 25 22 24 20 23 28 27 24 22 27Not well at all 13 12 13 7 13 12 13 14 14 11 13 14(Don't know/refused) 5 3 4 5 5 5 1 4 5 5 3 4Very/Somewhat well 58 63 57 67 58 64 62 54 54 61 63 54Not too/Not well at all 37 34 38 28 37 32 37 42 41 35 35 41
Q. 24 Coronavirus Impact on 2020 Voting TurnoutTotal Answering (1200) (301) (876) (89) (251) (121) (190) (212) (301) (340) (311) (513)Very big impact 27 29 26 33 25 25 33 23 26 27 30 25Fairly big impact 35 40 34 25 33 31 35 36 41 31 34 39Small impact 29 25 31 34 33 31 28 32 23 34 29 27No impact at all 7 5 7 8 7 11 3 6 8 7 6 7Prefer not to answer 2 - 3 1 2 1 1 3 3 1 1 3Very/Fairly big impact 62 70 60 58 59 57 68 59 66 58 64 63Small/Not impact at all 36 31 38 42 40 42 31 38 31 40 35 34
Q. 25 Likelihood That Coronavirus Will Prevent You From VotingTotal Answering (1200) (301) (876) (89) (251) (121) (190) (212) (301) (340) (311) (513)1 55 52 56 58 58 51 52 59 54 58 52 562 6 8 6 6 4 7 6 7 7 4 7 73 4 6 4 5 6 3 7 2 4 6 5 34 4 5 3 1 5 6 2 4 3 4 4 45 9 9 9 9 8 10 7 8 9 8 8 96 2 2 3 3 1 3 4 2 3 2 4 27 3 2 3 4 3 3 5 1 3 3 4 28 3 4 3 1 2 8 2 3 4 2 4 39 1 1 1 1 2 - 2 1 - 1 1 010 6 6 5 2 6 2 6 7 5 5 5 6(Don't know/refused) 7 6 8 11 6 6 6 9 7 7 6 8Mean 2.8 2.9 2.8 2.4 2.7 2.9 3.0 2.6 2.8 2.6 3.0 2.71-3 66 66 66 68 68 62 65 67 65 68 64 664-7 18 18 18 16 17 23 19 14 19 17 20 178-10 10 10 9 5 9 9 10 10 9 8 10 10
Q. 26 Planned Voting MethodTotal Answering (1200) (301) (876) (89) (251) (121) (190) (212) (301) (340) (311) (513)In-person Eday 36 39 35 30 41 41 36 38 31 38 37 34In-person early 19 19 18 32 16 23 24 16 14 20 23 15By mail 41 38 42 33 41 31 38 41 50 39 36 46(I am not voting) 2 1 2 1 1 3 1 3 3 1 2 3(Don't know/refused) 3 2 3 3 1 3 2 3 2 2 2 3
TargetSmart Communications 1155 15th St, NW, Suite 750, Washington, DC 20005 targetsmart.com
92 of 228
Page 93
May 21-27, 2020
National Voter Insights Study
TargetSmart + Dynata
Gender/Age Gender/Education Age/Education
TotalYoun
ger MenOlder Men
Youn ger
WomenOlder
WomenNon Coll
MenColl Men
Non Coll Women
Coll Women
Youn ger Non
CollOlder
Non Coll
Youn ger Coll
egeOlder Coll
Party ID Difference...2-3-2 PARTY ID Dem-Rep 4 7 -15 21 6 -9 -2 7 19 6 -4 22 -53-1-3 PARTY ID Dem-Rep 7 12 -19 28 8 -12 1 10 26 8 -7 31 -3
Q. 23 Election Administration in the USTotal Answering (1200) (256) (301) (312) (304) (262) (307) (318) (304) (252) (316) (312) (285)Very well 16 14 19 10 20 15 19 18 12 15 18 10 22Somewhat well 42 45 43 40 42 45 43 39 43 38 45 46 39Not too well 24 23 26 29 20 22 27 26 23 26 23 26 24Not well at all 13 13 8 17 13 13 8 13 18 16 10 16 10(Don't know/refused) 5 5 4 4 5 5 3 5 4 5 4 3 5Very/Somewhat well 58 59 62 50 62 60 62 57 55 53 63 56 61Not too/Not well at all 37 36 34 46 33 35 35 39 41 42 33 42 34
Q. 24 Coronavirus Impact on 2020 Voting TurnoutTotal Answering (1200) (256) (301) (312) (304) (262) (307) (318) (304) (252) (316) (312) (285)Very big impact 27 30 20 30 29 28 22 31 29 32 27 29 22Fairly big impact 35 30 29 45 35 26 32 38 42 37 29 40 35Small impact 29 28 42 19 26 33 39 24 22 20 35 26 34No impact at all 7 11 7 3 7 11 6 4 6 9 5 5 8Prefer not to answer 2 1 3 3 2 3 1 3 1 2 4 1 2Very/Fairly big impact 62 60 49 75 64 54 54 69 72 69 57 69 57Small/Not impact at all 36 39 48 22 34 44 45 28 27 29 40 31 41
Q. 25 Likelihood That Coronavirus Will Prevent You From VotingTotal Answering (1200) (256) (301) (312) (304) (262) (307) (318) (304) (252) (316) (312) (285)1 55 46 69 43 60 55 62 48 56 38 61 49 682 6 9 8 5 3 5 11 4 5 5 3 8 93 4 5 4 7 1 5 4 3 6 5 3 7 34 4 7 1 7 2 4 3 4 4 7 2 7 -5 9 9 4 13 9 9 4 12 10 13 9 10 46 2 4 2 3 2 3 3 3 1 5 1 2 27 3 5 1 3 3 5 1 3 3 5 3 3 18 3 5 1 4 2 4 2 4 2 6 3 3 19 1 1 1 1 2 0 1 2 1 - 2 1 110 6 6 3 7 6 6 4 8 4 10 4 4 4(Don't know/refused) 7 5 6 8 10 6 5 10 8 8 8 6 8Mean 2.8 3.3 2.0 3.4 2.7 3.0 2.3 3.4 2.6 3.9 2.6 2.9 2.01-3 66 60 81 55 65 64 78 54 67 47 68 65 794-7 18 24 8 25 15 20 11 22 18 29 15 21 88-10 10 12 5 11 10 10 7 13 7 16 9 9 5
Q. 26 Planned Voting MethodTotal Answering (1200) (256) (301) (312) (304) (262) (307) (318) (304) (252) (316) (312) (285)In-person Eday 36 36 42 32 35 41 37 36 30 36 41 32 37In-person early 19 17 20 20 17 22 16 19 19 18 21 19 15By mail 41 41 35 44 43 31 44 40 48 37 35 48 44(I am not voting) 2 4 1 2 1 3 1 2 1 5 1 1 2(Don't know/refused) 3 3 3 3 4 3 2 4 2 4 3 1 3
TargetSmart Communications 1155 15th St, NW, Suite 750, Washington, DC 20005 targetsmart.com
93 of 228
Page 94
May 21-27, 2020
National Voter Insights Study
TargetSmart + Dynata
Marital Status/Gender Marital Status/Kids Trump Job Approval
Voting Permissions by State
Total
Marr ied
Men
Marr ied
WomenUnmarr ied Men
Unmarr ied
Women
Marr ied
with kids
Marr ied with out kids
Unmarr ied with
kids
Unmarr ied with out kids
Total appr ove
Total disapp rove All mail
Open early / mail Closed
Party ID Difference...2-3-2 PARTY ID Dem-Rep 4 -17 -5 9 30 -4 -15 19 22 -50 50 -9 4 83-1-3 PARTY ID Dem-Rep 7 -22 -4 16 39 -2 -19 22 31 -65 67 -5 9 8
Q. 23 Election Administration in the USTotal Answering (1200) (312) (306) (247) (313) (216) (400) (83) (471) (528) (626) (111) (605) (484)Very well 16 16 19 18 11 15 19 18 13 21 11 16 17 14Somewhat well 42 47 41 40 42 47 42 44 41 43 42 41 43 41Not too well 24 24 22 26 26 22 23 23 27 23 27 24 24 25Not well at all 13 10 16 11 15 13 13 10 14 10 15 14 12 14(Don't know/refused) 5 3 3 5 6 3 3 5 5 3 4 5 4 6Very/Somewhat well 58 63 60 58 53 63 61 63 55 64 54 57 60 55Not too/Not well at all 37 34 38 38 41 35 36 33 40 33 42 38 36 39
Q. 24 Coronavirus Impact on 2020 Voting TurnoutTotal Answering (1200) (312) (306) (247) (313) (216) (400) (83) (471) (528) (626) (111) (605) (484)Very big impact 27 21 27 28 33 25 23 40 29 19 35 26 26 29Fairly big impact 35 30 41 30 39 41 32 38 35 31 38 37 35 34Small impact 29 41 24 31 22 29 35 17 28 40 20 28 31 26No impact at all 7 8 7 9 3 5 9 5 6 8 5 7 6 8Prefer not to answer 2 1 1 3 3 - 2 - 4 2 2 2 3 2Very/Fairly big impact 62 51 68 57 72 66 55 78 63 50 73 63 61 63Small/Not impact at all 36 49 31 40 25 34 43 22 33 48 25 35 37 35
Q. 25 Likelihood That Coronavirus Will Prevent You From VotingTotal Answering (1200) (312) (306) (247) (313) (216) (400) (83) (471) (528) (626) (111) (605) (484)1 55 66 62 50 42 57 68 41 46 61 51 62 56 532 6 7 6 10 3 8 6 7 6 6 6 9 7 53 4 4 2 5 6 5 3 8 5 4 5 3 5 44 4 3 3 4 6 6 1 4 5 3 5 4 3 55 9 5 10 8 12 8 7 10 10 6 11 8 8 106 2 2 1 4 3 1 2 3 4 1 3 - 3 27 3 2 2 4 4 2 2 3 4 2 4 2 2 48 3 2 3 4 4 4 1 3 4 2 4 3 3 39 1 1 1 1 1 2 1 - 1 1 1 - 1 110 6 5 4 5 8 4 4 10 6 5 5 5 5 6(Don't know/refused) 7 5 6 5 12 4 7 10 8 8 6 5 8 6Mean 2.8 2.2 2.5 3.0 3.5 2.7 2.2 3.4 3.3 2.5 3.0 2.4 2.7 3.01-3 66 77 71 65 51 70 76 57 57 71 62 74 67 624-7 18 11 15 21 25 17 11 20 24 13 22 13 16 218-10 10 7 8 10 13 10 6 13 11 8 10 8 9 11
Q. 26 Planned Voting MethodTotal Answering (1200) (312) (306) (247) (313) (216) (400) (83) (471) (528) (626) (111) (605) (484)In-person Eday 36 39 40 40 27 38 41 42 31 46 27 14 34 43In-person early 19 18 18 19 20 18 18 23 19 22 16 8 16 24By mail 41 41 38 35 49 42 38 29 45 29 53 76 46 27(I am not voting) 2 1 1 3 2 1 2 3 2 1 3 1 2 2(Don't know/refused) 3 1 3 3 3 2 2 3 3 3 2 2 3 4
TargetSmart Communications 1155 15th St, NW, Suite 750, Washington, DC 20005 targetsmart.com
94 of 228
Page 95
May 21-27, 2020
National Voter Insights Study
TargetSmart + Dynata
Permanent Absentee Voter
Status
Ever Voted Early or By Mail
First Time Voters in 2018 2016 Vote History TargetSmart Voter Score
Total PAVNot PAV Yes No Yes No Voted
Did not Vote
Was Not
Regist ered
Super Voter
Freq uent Voter
Infreq uent Voter
Never Voted
Party ID Difference...2-3-2 PARTY ID Dem-Rep 4 16 3 1 5 4 5 2 4 17 0 1 9 73-1-3 PARTY ID Dem-Rep 7 22 5 0 9 9 7 2 8 26 -4 5 13 14
Q. 23 Election Administration in the USTotal Answering (1200) (130) (1070) (220) (980) (176) (1024) (757) (266) (177) (221) (393) (393) (137)Very well 16 17 16 19 15 11 17 17 13 15 19 14 19 13Somewhat well 42 43 42 45 42 43 42 43 42 41 45 48 34 43Not too well 24 22 24 23 24 24 24 24 25 26 20 23 28 23Not well at all 13 15 13 9 14 16 13 12 16 13 11 12 15 16(Don't know/refused) 5 3 5 5 5 5 5 5 4 5 5 3 6 5Very/Somewhat well 58 60 58 64 57 54 59 60 55 57 64 62 52 56Not too/Not well at all 37 37 37 31 39 41 37 36 41 39 31 35 42 39
Q. 24 Coronavirus Impact on 2020 Voting TurnoutTotal Answering (1200) (130) (1070) (220) (980) (176) (1024) (757) (266) (177) (221) (393) (393) (137)Very big impact 27 30 27 24 28 21 28 27 27 29 25 26 34 24Fairly big impact 35 34 35 34 35 40 34 34 37 35 30 38 31 39Small impact 29 29 29 30 29 26 29 30 26 30 37 28 26 26No impact at all 7 7 7 9 6 9 7 8 8 2 5 7 6 9Prefer not to answer 2 - 3 3 2 3 2 2 2 4 3 2 3 2Very/Fairly big impact 62 64 62 59 63 62 62 61 64 64 55 63 66 63Small/Not impact at all 36 36 36 39 35 36 36 37 34 33 42 35 32 35
Q. 25 Likelihood That Coronavirus Will Prevent You From VotingTotal Answering (1200) (130) (1070) (220) (980) (176) (1024) (757) (266) (177) (221) (393) (393) (137)1 55 55 55 59 54 39 58 61 43 48 73 62 46 432 6 5 6 6 6 6 6 5 7 8 3 7 7 53 4 5 4 2 5 10 3 3 7 7 - 4 5 94 4 5 4 5 3 5 4 4 4 4 2 3 6 55 9 8 9 7 9 16 7 6 14 11 7 7 9 156 2 3 2 1 3 4 2 2 4 2 1 2 4 27 3 3 3 2 3 2 3 2 3 4 1 2 4 28 3 3 3 4 3 3 3 3 3 4 2 2 5 49 1 - 1 0 1 1 1 1 1 1 1 0 1 110 6 4 6 5 6 8 5 5 9 4 2 5 7 7(Don't know/refused) 7 10 7 7 7 7 7 8 5 7 9 7 7 7Mean 2.8 2.6 2.8 2.6 2.9 3.5 2.7 2.5 3.5 2.9 1.9 2.4 3.4 3.41-3 66 66 66 68 65 55 68 69 57 63 76 73 58 574-7 18 18 18 16 18 27 16 14 25 21 10 14 23 248-10 10 7 10 9 10 11 9 9 13 8 5 7 13 12
Q. 26 Planned Voting MethodTotal Answering (1200) (130) (1070) (220) (980) (176) (1024) (757) (266) (177) (221) (393) (393) (137)In-person Eday 36 17 38 23 39 33 36 38 28 37 32 40 35 36In-person early 19 10 20 39 14 22 18 19 19 18 20 19 17 22By mail 41 71 37 36 42 34 42 40 44 41 47 38 43 34(I am not voting) 2 2 2 2 2 3 2 1 3 2 0 1 3 3(Don't know/refused) 3 1 3 1 4 7 2 3 5 2 1 2 3 5
TargetSmart Communications 1155 15th St, NW, Suite 750, Washington, DC 20005 targetsmart.com
95 of 228
Page 96
May 21-27, 2020
National Voter Insights Study
TargetSmart + Dynata
Partisan Score Presidential General Turnout Score Mode
Total 0 to 9.9 10 to 89.9 90+ 0 to 69.9 70+ Web Land line Wire less
Party ID Difference...2-3-2 PARTY ID Dem-Rep 4 -48 -4 53 4 5 3 -3 83-1-3 PARTY ID Dem-Rep 7 -55 -1 62 10 5 4 -6 15
Q. 23 Election Administration in the USTotal Answering (1200) (302) (491) (408) (429) (771) (644) (116) (440)Very well 16 19 15 15 18 15 16 23 14Somewhat well 42 45 42 40 38 45 41 42 44Not too well 24 22 24 26 23 25 27 16 22Not well at all 13 11 14 14 15 12 13 10 15(Don't know/refused) 5 3 4 6 6 4 4 8 5Very/Somewhat well 58 64 57 55 56 59 57 66 58Not too/Not well at all 37 33 38 39 38 37 40 27 37
Q. 24 Coronavirus Impact on 2020 Voting TurnoutTotal Answering (1200) (302) (491) (408) (429) (771) (644) (116) (440)Very big impact 27 17 27 35 27 27 20 27 38Fairly big impact 35 31 36 35 36 34 41 30 27Small impact 29 42 26 22 26 30 29 34 27No impact at all 7 9 8 4 8 6 7 7 6Prefer not to answer 2 1 2 4 3 2 3 3 2Very/Fairly big impact 62 48 64 70 63 61 60 57 66Small/Not impact at all 36 51 34 26 34 37 37 41 33
Q. 25 Likelihood That Coronavirus Will Prevent You From VotingTotal Answering (1200) (302) (491) (408) (429) (771) (644) (116) (440)1 55 63 54 52 45 61 48 69 632 6 8 6 6 6 6 6 2 73 4 3 5 4 5 4 4 2 54 4 3 4 4 4 3 4 1 35 9 4 10 11 11 7 12 7 56 2 1 3 3 3 2 3 1 37 3 1 3 4 4 2 2 3 38 3 3 3 4 4 3 4 2 19 1 2 0 1 1 1 1 2 -10 6 5 6 5 8 4 7 4 4(Don't know/refused) 7 7 8 7 7 7 8 7 7Mean 2.8 2.4 2.9 3.0 3.4 2.5 3.3 2.3 2.31-3 66 74 64 61 57 70 58 73 744-7 18 9 19 22 23 15 21 12 148-10 10 9 9 10 13 7 13 8 5
Q. 26 Planned Voting MethodTotal Answering (1200) (302) (491) (408) (429) (771) (644) (116) (440)In-person Eday 36 41 37 30 36 36 34 37 38In-person early 19 21 18 18 17 20 19 17 19By mail 41 36 39 46 39 42 42 41 40(I am not voting) 2 1 2 2 3 1 3 0 0(Don't know/refused) 3 1 3 4 5 2 3 5 3
TargetSmart Communications 1155 15th St, NW, Suite 750, Washington, DC 20005 targetsmart.com
96 of 228
Page 97
May 21-27, 2020
National Voter Insights Study
TargetSmart + Dynata
2-3-2 Party 3-1-3 Party Ideology Party ID/Ideology
Total Dem Ind Rep Dem Ind Rep Lib Mod ConsLib
Dem
Mod / Cons Dem
Mod / Lib Rep
Cons Rep
Party ID Difference...2-3-2 PARTY ID Dem-Rep 4 100 - -100 73 - -75 68 6 -52 100 100 -100 -1003-1-3 PARTY ID Dem-Rep 7 100 8 -100 100 - -100 85 10 -63 100 100 -100 -100
Q. 27 A. Vote Method - If available to me in my state, I am likely to vote by mail in this election.Total Answering (1200) (415) (395) (362) (566) (124) (482) (304) (469) (368) (213) (189) (117) (239)Strongly agree 40 52 40 29 53 29 30 52 40 32 53 51 31 28Somewhat agree 16 18 16 14 18 21 12 22 16 12 22 15 18 12Somewhat disagree 13 13 11 15 12 12 14 11 15 12 11 16 18 12Strongly disagree 24 11 26 37 12 20 39 11 21 40 11 12 22 44(Neither) 3 2 5 4 1 13 3 3 5 3 2 1 6 3(Don't know/refused) 4 4 3 2 4 4 2 3 4 2 2 5 5 1Total agree 56 71 55 43 71 50 42 74 56 44 75 66 49 40Total disagree 37 24 37 51 24 33 53 21 36 52 22 28 41 56Total agree - Total disagree 19 46 18 -9 47 17 -11 53 19 -8 53 38 8 -17
Q. 27 B. Vote Method - If available to me in my state, I am likely to vote before Election Day at an in-person early voting site in this election.Total Answering (1200) (415) (395) (362) (566) (124) (482) (304) (469) (368) (213) (189) (117) (239)Strongly agree 32 29 33 35 30 29 35 25 31 39 23 34 33 36Somewhat agree 22 25 21 18 24 21 19 28 20 18 30 20 16 19Somewhat disagree 16 21 13 14 19 13 13 18 18 11 19 22 19 11Strongly disagree 21 19 21 25 20 16 25 19 20 27 20 17 20 29(Neither) 4 3 7 3 3 13 4 3 6 3 4 2 4 3(Don't know/refused) 5 4 6 4 5 8 4 6 5 2 4 4 8 2Total agree 54 53 54 53 54 50 54 53 52 57 53 54 49 55Total disagree 37 40 34 40 39 30 39 37 38 38 39 39 39 40Total agree - Total disagree 16 14 19 14 15 20 16 16 14 18 14 15 10 15
Q. 27 C. Vote Method - I have a clear understanding of how to request a mail-in-ballot so that I can vote by mail in my state.Total Answering (1200) (415) (395) (362) (566) (124) (482) (304) (469) (368) (213) (189) (117) (239)Strongly agree 46 46 48 45 47 37 48 46 47 47 47 46 44 46Somewhat agree 22 24 20 22 24 23 20 26 21 22 25 22 21 23Somewhat disagree 15 20 14 11 19 14 12 17 14 13 18 23 10 11Strongly disagree 9 6 8 14 6 11 12 6 11 10 6 6 16 13(Neither) 4 2 6 5 2 12 5 2 4 6 2 2 4 5(Don't know/refused) 4 3 3 4 3 4 4 3 3 3 2 2 4 3Total agree 68 70 68 66 71 59 68 72 67 69 72 68 65 68Total disagree 24 26 22 26 25 25 24 23 26 23 24 28 26 24Total agree - Total disagree 44 44 46 41 45 34 44 49 42 45 48 40 39 44
Q. 27 D. Vote Method - I have a clear understanding of the in-person early voting options available to me in my state.Total Answering (1200) (415) (395) (362) (566) (124) (482) (304) (469) (368) (213) (189) (117) (239)Strongly agree 49 43 53 51 44 46 55 40 49 56 41 45 40 57Somewhat agree 23 28 18 24 26 17 21 28 23 20 29 26 30 21Somewhat disagree 14 17 13 12 16 13 12 19 13 12 19 16 11 12Strongly disagree 8 8 8 7 9 7 7 7 8 8 8 8 10 7(Neither) 3 2 5 2 2 11 2 2 4 2 2 2 2 2(Don't know/refused) 4 3 3 4 3 6 3 3 4 1 2 3 8 1Total agree 72 71 70 75 71 63 76 68 71 76 70 71 69 78Total disagree 22 25 21 19 25 20 19 27 21 21 26 24 21 19Total agree - Total disagree 50 46 49 56 46 43 57 41 51 56 44 48 48 59
TargetSmart Communications 1155 15th St, NW, Suite 750, Washington, DC 20005 targetsmart.com
97 of 228
Page 98
May 21-27, 2020
National Voter Insights Study
TargetSmart + Dynata
Party ID/Gender
Total Dem MenDem
Women Ind MenInd
Women Rep MenRep
Women
Party ID Difference...2-3-2 PARTY ID Dem-Rep 4 100 100 - - -100 -1003-1-3 PARTY ID Dem-Rep 7 100 100 1 17 -100 -100
Q. 27 A. Vote Method - If available to me in my state, I am likely to vote by mail in this election.Total Answering (1200) (157) (258) (219) (177) (186) (177)Strongly agree 40 52 52 36 44 30 28Somewhat agree 16 20 17 15 16 11 16Somewhat disagree 13 14 12 13 10 14 15Strongly disagree 24 10 12 28 23 37 36(Neither) 3 1 2 5 4 5 3(Don't know/refused) 4 2 5 3 2 3 1Total agree 56 73 69 51 61 41 44Total disagree 37 24 24 41 33 51 51Total agree - Total disagree 19 48 45 10 28 -10 -7
Q. 27 B. Vote Method - If available to me in my state, I am likely to vote before Election Day at an in-person early voting site in this election.Total Answering (1200) (157) (258) (219) (177) (186) (177)Strongly agree 32 20 34 34 31 30 40Somewhat agree 22 32 21 19 23 16 20Somewhat disagree 16 24 18 13 14 17 12Strongly disagree 21 16 21 23 18 28 23(Neither) 4 4 3 7 6 4 2(Don't know/refused) 5 4 4 4 8 5 3Total agree 54 52 54 54 54 46 60Total disagree 37 40 39 36 32 44 34Total agree - Total disagree 16 12 15 18 21 2 26
Q. 27 C. Vote Method - I have a clear understanding of how to request a mail-in-ballot so that I can vote by mail in my state.Total Answering (1200) (157) (258) (219) (177) (186) (177)Strongly agree 46 48 45 52 43 44 46Somewhat agree 22 24 23 18 23 21 22Somewhat disagree 15 19 20 12 17 12 11Strongly disagree 9 5 6 9 7 13 15(Neither) 4 2 1 7 5 6 3(Don't know/refused) 4 1 4 2 5 4 3Total agree 68 72 69 70 66 65 68Total disagree 24 24 27 21 24 25 26Total agree - Total disagree 44 48 42 48 43 39 42
Q. 27 D. Vote Method - I have a clear understanding of the in-person early voting options available to me in my state.Total Answering (1200) (157) (258) (219) (177) (186) (177)Strongly agree 49 43 44 58 46 50 52Somewhat agree 23 31 26 15 21 24 25Somewhat disagree 14 16 18 13 14 12 12Strongly disagree 8 6 9 8 8 8 7(Neither) 3 4 1 4 7 3 2(Don't know/refused) 4 1 4 3 4 4 4Total agree 72 73 69 73 67 74 76Total disagree 22 22 26 21 22 20 19Total agree - Total disagree 50 51 43 52 45 54 58
TargetSmart Communications 1155 15th St, NW, Suite 750, Washington, DC 20005 targetsmart.com
98 of 228
Page 99
May 21-27, 2020
National Voter Insights Study
TargetSmart + Dynata
Urbanicity
Total R1 R2 S3 S4 U5 U6 Rural Subu rban Urban
Party ID Difference...2-3-2 PARTY ID Dem-Rep 4 -23 -15 -2 9 22 42 -19 4 283-1-3 PARTY ID Dem-Rep 7 -23 -17 -1 12 26 52 -20 7 33
Q. 27 A. Vote Method - If available to me in my state, I am likely to vote by mail in this election.Total Answering (1200) (179) (181) (195) (273) (264) (108) (360) (468) (372)Strongly agree 40 29 40 39 36 49 51 35 37 50Somewhat agree 16 14 19 15 15 17 14 16 15 16Somewhat disagree 13 15 9 15 14 12 15 12 14 13Strongly disagree 24 37 28 27 25 14 11 33 26 13(Neither) 3 4 3 1 3 4 7 3 2 5(Don't know/refused) 4 0 1 4 7 5 2 1 6 4Total agree 56 43 59 54 52 66 65 51 52 66Total disagree 37 53 37 42 39 26 26 45 40 26Total agree - Total disagree 19 -9 22 12 13 40 40 6 13 40
Q. 27 B. Vote Method - If available to me in my state, I am likely to vote before Election Day at an in-person early voting site in this election.Total Answering (1200) (179) (181) (195) (273) (264) (108) (360) (468) (372)Strongly agree 32 31 29 30 29 37 34 30 29 37Somewhat agree 22 23 20 21 21 26 18 21 21 23Somewhat disagree 16 14 16 23 15 14 14 15 19 14Strongly disagree 21 24 29 22 21 15 20 26 22 16(Neither) 4 5 4 1 4 5 9 4 3 6(Don't know/refused) 5 5 2 3 10 4 5 4 7 4Total agree 54 53 50 51 50 63 52 51 50 60Total disagree 37 37 44 45 37 29 34 41 40 31Total agree - Total disagree 16 16 6 6 13 34 18 11 10 29
Q. 27 C. Vote Method - I have a clear understanding of how to request a mail-in-ballot so that I can vote by mail in my state.Total Answering (1200) (179) (181) (195) (273) (264) (108) (360) (468) (372)Strongly agree 46 43 43 48 44 52 42 43 45 49Somewhat agree 22 17 22 24 25 21 24 20 25 22Somewhat disagree 15 18 17 13 13 13 21 18 13 15Strongly disagree 9 14 10 10 8 8 4 12 9 7(Neither) 4 5 4 1 5 3 8 4 3 4(Don't know/refused) 4 3 3 5 5 4 2 3 5 4Total agree 68 60 66 72 69 72 67 63 70 71Total disagree 24 33 28 22 21 21 24 30 22 22Total agree - Total disagree 44 27 38 50 47 51 43 33 48 49
Q. 27 D. Vote Method - I have a clear understanding of the in-person early voting options available to me in my state.Total Answering (1200) (179) (181) (195) (273) (264) (108) (360) (468) (372)Strongly agree 49 50 49 51 46 53 40 49 48 49Somewhat agree 23 17 21 26 25 22 29 19 25 24Somewhat disagree 14 17 15 13 14 12 16 16 13 13Strongly disagree 8 7 10 7 8 7 8 9 8 7(Neither) 3 6 2 - 3 3 7 4 2 4(Don't know/refused) 4 4 4 4 5 3 2 4 4 3Total agree 72 67 70 77 70 75 68 68 73 73Total disagree 22 24 25 20 22 19 23 24 21 20Total agree - Total disagree 50 44 45 57 49 56 45 44 52 53
TargetSmart Communications 1155 15th St, NW, Suite 750, Washington, DC 20005 targetsmart.com
99 of 228
Page 100
May 21-27, 2020
National Voter Insights Study
TargetSmart + Dynata
Urbanicity/Gender
Total Rural MenRural
WomenSubu rban
MenSubu rban Women Urban Men
Urban Women
Party ID Difference...2-3-2 PARTY ID Dem-Rep 4 -23 -15 -4 12 13 393-1-3 PARTY ID Dem-Rep 7 -28 -13 -1 15 16 48
Q. 27 A. Vote Method - If available to me in my state, I am likely to vote by mail in this election.Total Answering (1200) (180) (180) (227) (241) (164) (208)Strongly agree 40 34 35 36 39 45 53Somewhat agree 16 14 19 16 14 16 16Somewhat disagree 13 12 13 15 13 14 12Strongly disagree 24 37 28 27 25 13 13(Neither) 3 2 5 3 2 8 2(Don't know/refused) 4 1 1 4 7 4 4Total agree 56 49 53 52 53 62 69Total disagree 37 49 41 42 38 27 25Total agree - Total disagree 19 0 13 10 15 35 44
Q. 27 B. Vote Method - If available to me in my state, I am likely to vote before Election Day at an in-person early voting site in this election.Total Answering (1200) (180) (180) (227) (241) (164) (208)Strongly agree 32 30 30 26 32 32 40Somewhat agree 22 20 23 21 21 27 21Somewhat disagree 16 17 13 20 17 14 14Strongly disagree 21 26 26 24 19 15 17(Neither) 4 5 4 4 2 7 5(Don't know/refused) 5 2 5 5 9 6 3Total agree 54 50 53 47 53 58 61Total disagree 37 43 39 44 36 29 32Total agree - Total disagree 16 7 14 3 17 29 29
Q. 27 C. Vote Method - I have a clear understanding of how to request a mail-in-ballot so that I can vote by mail in my state.Total Answering (1200) (180) (180) (227) (241) (164) (208)Strongly agree 46 46 41 49 42 48 50Somewhat agree 22 21 19 22 28 20 23Somewhat disagree 15 13 22 13 13 17 14Strongly disagree 9 13 11 8 9 7 6(Neither) 4 4 4 4 3 7 2(Don't know/refused) 4 3 3 4 6 2 5Total agree 68 66 59 71 69 68 73Total disagree 24 26 34 21 22 23 21Total agree - Total disagree 44 40 26 50 47 44 52
Q. 27 D. Vote Method - I have a clear understanding of the in-person early voting options available to me in my state.Total Answering (1200) (180) (180) (227) (241) (164) (208)Strongly agree 49 54 44 52 44 46 51Somewhat agree 23 18 20 25 26 25 24Somewhat disagree 14 13 19 12 14 15 12Strongly disagree 8 10 7 7 9 5 8(Neither) 3 3 4 2 1 5 3(Don't know/refused) 4 3 5 3 6 4 2Total agree 72 72 65 77 70 70 75Total disagree 22 22 26 19 23 20 20Total agree - Total disagree 50 50 39 58 47 50 55
TargetSmart Communications 1155 15th St, NW, Suite 750, Washington, DC 20005 targetsmart.com
100 of 228
Page 101
May 21-27, 2020
National Voter Insights Study
TargetSmart + Dynata
Region by State
TotalBorder States
Califo rnia
Indust rial
Midw est
Lower Midw
estMid -
Atla ntic
Moun tain
States
Nati onal
Capi talNew
Engl and
Paci fic Northw
est SouthSouthe
ast
Upper Midw
est
Party ID Difference...2-3-2 PARTY ID Dem-Rep 4 4 19 -11 16 15 2 5 17 -7 -3 3 13-1-3 PARTY ID Dem-Rep 7 -5 27 -6 17 21 5 15 29 2 -9 8 -8
Q. 27 A. Vote Method - If available to me in my state, I am likely to vote by mail in this election.Total Answering (1200) (132) (120) (157) (60) (158) (48) (60) (60) (48) (108) (193) (48)Strongly agree 40 38 55 37 41 30 62 39 21 75 27 43 37Somewhat agree 16 12 14 20 15 24 11 12 23 13 15 12 16Somewhat disagree 13 20 10 13 12 17 7 7 10 3 15 15 11Strongly disagree 24 24 14 23 24 24 16 31 25 5 40 25 27(Neither) 3 3 6 5 2 3 - 2 8 4 3 1 6(Don't know/refused) 4 3 2 2 5 3 4 9 14 - 1 3 4Total agree 56 50 68 57 56 54 73 52 44 88 42 55 53Total disagree 37 44 24 36 37 40 23 38 34 9 55 40 38Total agree - Total disagree 19 6 45 21 19 14 50 13 9 79 -13 15 15
Q. 27 B. Vote Method - If available to me in my state, I am likely to vote before Election Day at an in-person early voting site in this election.Total Answering (1200) (132) (120) (157) (60) (158) (48) (60) (60) (48) (108) (193) (48)Strongly agree 32 48 28 36 22 25 28 25 26 25 39 34 21Somewhat agree 22 27 18 19 29 24 22 20 17 16 23 23 17Somewhat disagree 16 9 17 18 24 21 13 15 17 16 8 16 18Strongly disagree 21 8 30 20 21 19 23 23 12 28 26 23 29(Neither) 4 3 3 4 5 6 10 2 12 15 - 1 10(Don't know/refused) 5 5 4 4 - 5 5 14 17 1 3 4 6Total agree 54 75 46 55 51 49 50 46 42 41 62 56 38Total disagree 37 18 47 38 44 41 36 38 29 44 34 40 47Total agree - Total disagree 16 57 -1 17 7 9 14 8 14 -4 28 17 -9
Q. 27 C. Vote Method - I have a clear understanding of how to request a mail-in-ballot so that I can vote by mail in my state.Total Answering (1200) (132) (120) (157) (60) (158) (48) (60) (60) (48) (108) (193) (48)Strongly agree 46 38 57 51 42 36 54 47 22 73 44 46 50Somewhat agree 22 26 21 18 30 26 26 16 27 4 12 29 19Somewhat disagree 15 18 13 15 7 19 9 24 20 4 20 13 9Strongly disagree 9 10 2 8 14 11 8 10 14 12 16 5 7(Neither) 4 3 6 7 4 3 - - 6 5 4 3 4(Don't know/refused) 4 5 2 1 3 4 3 3 11 3 4 3 12Total agree 68 64 78 69 72 62 80 63 50 77 56 75 68Total disagree 24 29 14 24 21 30 17 34 34 16 36 18 16Total agree - Total disagree 44 35 64 45 51 32 63 30 16 60 20 57 52
Q. 27 D. Vote Method - I have a clear understanding of the in-person early voting options available to me in my state.Total Answering (1200) (132) (120) (157) (60) (158) (48) (60) (60) (48) (108) (193) (48)Strongly agree 49 57 48 46 48 37 50 39 22 50 63 56 56Somewhat agree 23 22 23 26 22 29 24 30 20 8 13 26 15Somewhat disagree 14 10 14 12 15 19 13 25 23 12 11 12 13Strongly disagree 8 4 7 10 9 9 6 5 11 17 8 5 9(Neither) 3 1 5 3 4 2 2 - 9 11 3 1 2(Don't know/refused) 4 6 3 3 2 4 5 1 15 2 2 1 6Total agree 72 79 71 73 70 66 74 69 42 58 75 81 71Total disagree 22 13 21 22 24 28 19 30 34 29 19 17 21Total agree - Total disagree 50 66 50 51 46 38 55 38 8 29 56 64 50
TargetSmart Communications 1155 15th St, NW, Suite 750, Washington, DC 20005 targetsmart.com
101 of 228
Page 102
May 21-27, 2020
National Voter Insights Study
TargetSmart + Dynata
Gender Age
Total Men Women 18 - 34 35 - 49 50 - 64 Over 64 18 - 4950 and
over
Party ID Difference...2-3-2 PARTY ID Dem-Rep 4 -5 13 24 6 -2 -8 15 -53-1-3 PARTY ID Dem-Rep 7 -5 18 33 8 0 -10 21 -5
Q. 27 A. Vote Method - If available to me in my state, I am likely to vote by mail in this election.Total Answering (1200) (571) (629) (281) (287) (310) (295) (568) (605)Strongly agree 40 38 42 42 40 36 43 41 40Somewhat agree 16 16 16 21 15 12 15 18 14Somewhat disagree 13 14 13 14 15 13 11 15 12Strongly disagree 24 26 22 16 25 30 24 20 27(Neither) 3 4 3 3 2 5 3 3 4(Don't know/refused) 4 3 4 3 4 4 4 3 4Total agree 56 54 58 63 55 49 58 59 53Total disagree 37 40 35 30 39 43 35 35 39Total agree - Total disagree 19 14 24 33 15 6 23 24 14
Q. 27 B. Vote Method - If available to me in my state, I am likely to vote before Election Day at an in-person early voting site in this election.Total Answering (1200) (571) (629) (281) (287) (310) (295) (568) (605)Strongly agree 32 29 34 28 34 32 33 31 33Somewhat agree 22 22 21 31 19 20 18 25 19Somewhat disagree 16 17 15 18 20 12 14 19 13Strongly disagree 21 22 20 15 19 26 24 17 25(Neither) 4 5 3 4 3 5 5 4 5(Don't know/refused) 5 4 6 4 6 5 6 5 5Total agree 54 51 56 58 53 53 51 56 52Total disagree 37 39 35 33 39 38 38 36 38Total agree - Total disagree 16 12 20 25 14 15 12 20 13
Q. 27 C. Vote Method - I have a clear understanding of how to request a mail-in-ballot so that I can vote by mail in my state.Total Answering (1200) (571) (629) (281) (287) (310) (295) (568) (605)Strongly agree 46 48 44 33 50 43 55 42 49Somewhat agree 22 21 24 30 19 24 17 24 21Somewhat disagree 15 14 16 19 15 15 12 17 14Strongly disagree 9 9 9 12 9 8 8 10 8(Neither) 4 5 3 3 3 6 3 3 5(Don't know/refused) 4 3 5 3 5 4 5 4 4Total agree 68 69 68 63 69 67 72 66 69Total disagree 24 23 25 31 23 23 20 27 22Total agree - Total disagree 44 45 43 32 46 44 52 39 48
Q. 27 D. Vote Method - I have a clear understanding of the in-person early voting options available to me in my state.Total Answering (1200) (571) (629) (281) (287) (310) (295) (568) (605)Strongly agree 49 51 47 35 46 54 56 41 55Somewhat agree 23 22 23 28 24 22 19 26 21Somewhat disagree 14 13 15 25 12 9 12 18 10Strongly disagree 8 7 8 7 11 8 5 9 7(Neither) 3 3 3 2 3 4 3 2 4(Don't know/refused) 4 3 5 3 4 3 5 4 4Total agree 72 73 70 64 71 76 75 67 75Total disagree 22 20 23 32 23 17 17 27 17Total agree - Total disagree 50 53 47 32 48 59 57 40 58
TargetSmart Communications 1155 15th St, NW, Suite 750, Washington, DC 20005 targetsmart.com
102 of 228
Page 103
May 21-27, 2020
National Voter Insights Study
TargetSmart + Dynata
Education Homeownership status Marital status
TotalH.S. or
lessPost H.S.
4yr Coll Grad
Post Grad
Coll ege Grad uate
Total Non Coll Rent Own
Marr ied Single
Separa ted / divo rced
Wido wed
Total Unmarr
ied
Party ID Difference...2-3-2 PARTY ID Dem-Rep 4 5 -3 6 13 9 0 32 -5 -11 30 10 -6 213-1-3 PARTY ID Dem-Rep 7 3 -1 9 20 14 0 44 -6 -13 42 12 -10 29
Q. 27 A. Vote Method - If available to me in my state, I am likely to vote by mail in this election.Total Answering (1200) (210) (369) (363) (248) (610) (579) (297) (873) (618) (357) (144) (59) (560)Strongly agree 40 40 35 42 46 44 37 43 39 38 46 37 46 44Somewhat agree 16 15 15 18 15 17 15 19 15 12 21 17 18 20Somewhat disagree 13 8 15 13 14 14 13 12 14 14 14 10 9 12Strongly disagree 24 27 28 22 19 21 28 18 26 29 16 25 18 18(Neither) 3 3 4 3 4 3 4 4 3 4 2 3 2 2(Don't know/refused) 4 7 3 3 2 3 4 5 3 3 2 8 6 4Total agree 56 55 50 60 62 60 52 62 54 50 66 55 65 63Total disagree 37 35 43 35 33 34 40 30 40 43 30 35 27 31Total agree - Total disagree 19 21 7 25 29 26 12 32 15 7 37 20 37 33
Q. 27 B. Vote Method - If available to me in my state, I am likely to vote before Election Day at an in-person early voting site in this election.Total Answering (1200) (210) (369) (363) (248) (610) (579) (297) (873) (618) (357) (144) (59) (560)Strongly agree 32 32 36 30 30 30 34 31 33 31 33 27 43 32Somewhat agree 22 22 18 24 22 24 20 24 20 18 28 26 9 25Somewhat disagree 16 15 17 17 15 16 16 19 15 16 18 16 14 17Strongly disagree 21 21 21 20 25 22 21 16 23 26 15 22 22 17(Neither) 4 3 4 6 4 5 3 4 5 5 3 2 3 3(Don't know/refused) 5 7 5 4 4 4 6 7 4 4 4 8 8 5Total agree 54 54 54 54 52 53 54 55 53 49 61 53 53 58Total disagree 37 36 38 37 40 38 37 35 39 41 32 37 36 34Total agree - Total disagree 16 18 16 17 12 15 17 20 14 8 28 15 17 24
Q. 27 C. Vote Method - I have a clear understanding of how to request a mail-in-ballot so that I can vote by mail in my state.Total Answering (1200) (210) (369) (363) (248) (610) (579) (297) (873) (618) (357) (144) (59) (560)Strongly agree 46 41 44 50 47 49 43 41 48 48 44 40 46 43Somewhat agree 22 24 20 24 22 23 21 22 22 21 25 23 16 24Somewhat disagree 15 16 17 14 15 14 16 19 14 14 18 16 15 17Strongly disagree 9 8 11 8 9 9 10 9 9 10 7 9 12 8(Neither) 4 4 5 2 5 3 5 4 4 5 2 7 - 3(Don't know/refused) 4 8 4 3 2 2 5 5 3 3 3 5 12 5Total agree 68 65 64 74 69 72 64 63 70 69 70 63 62 67Total disagree 24 24 28 22 24 23 26 28 23 24 25 25 27 25Total agree - Total disagree 44 41 36 52 45 49 38 35 47 45 45 38 35 42
Q. 27 D. Vote Method - I have a clear understanding of the in-person early voting options available to me in my state.Total Answering (1200) (210) (369) (363) (248) (610) (579) (297) (873) (618) (357) (144) (59) (560)Strongly agree 49 48 50 50 46 48 49 40 52 51 43 49 48 45Somewhat agree 23 22 21 24 26 25 22 24 23 21 26 25 21 25Somewhat disagree 14 14 15 13 14 13 15 21 12 12 19 8 15 16Strongly disagree 8 7 7 8 9 9 7 8 8 8 7 9 9 8(Neither) 3 2 3 4 3 3 3 3 3 4 2 3 2 2(Don't know/refused) 4 7 4 2 2 2 5 4 4 4 2 6 6 3Total agree 72 70 71 74 71 73 71 64 75 73 69 74 69 71Total disagree 22 21 23 21 23 22 22 29 19 20 26 17 24 24Total agree - Total disagree 50 49 48 53 48 51 49 35 56 52 43 58 45 47
TargetSmart Communications 1155 15th St, NW, Suite 750, Washington, DC 20005 targetsmart.com
103 of 228
Page 104
May 21-27, 2020
National Voter Insights Study
TargetSmart + Dynata
Kids at home Religious attendance
Total Yes No
More than
once a week
Once a week
Once or twice a month
A few times a
year Seldom NeverFreq uent
Infreq uent
Seldom / Never
Party ID Difference...2-3-2 PARTY ID Dem-Rep 4 2 6 -10 -15 5 7 6 24 -14 6 163-1-3 PARTY ID Dem-Rep 7 5 9 -19 -17 -5 14 9 35 -17 7 24
Q. 27 A. Vote Method - If available to me in my state, I am likely to vote by mail in this election.Total Answering (1200) (301) (876) (89) (251) (121) (190) (212) (301) (340) (311) (513)Strongly agree 40 40 41 39 40 28 40 39 49 40 35 45Somewhat agree 16 14 17 17 14 19 18 14 15 15 18 15Somewhat disagree 13 17 12 10 14 17 9 15 12 13 12 14Strongly disagree 24 24 24 30 28 32 30 23 13 28 31 17(Neither) 3 3 3 3 1 1 3 5 5 1 2 5(Don't know/refused) 4 2 4 1 3 3 1 3 6 3 2 5Total agree 56 54 57 56 54 46 58 53 64 55 54 59Total disagree 37 41 36 40 42 50 38 39 25 42 43 31Total agree - Total disagree 19 13 22 16 12 -4 20 14 39 13 11 28
Q. 27 B. Vote Method - If available to me in my state, I am likely to vote before Election Day at an in-person early voting site in this election.Total Answering (1200) (301) (876) (89) (251) (121) (190) (212) (301) (340) (311) (513)Strongly agree 32 34 31 61 35 35 32 26 23 42 33 24Somewhat agree 22 23 21 11 22 13 25 26 23 19 20 24Somewhat disagree 16 17 16 8 19 23 18 14 15 16 20 14Strongly disagree 21 19 22 17 18 25 20 24 24 18 22 24(Neither) 4 4 5 3 2 3 3 6 7 3 3 6(Don't know/refused) 5 4 5 - 4 1 3 6 9 3 2 8Total agree 54 57 52 72 57 48 56 52 46 61 53 48Total disagree 37 36 38 25 37 48 39 37 39 34 42 38Total agree - Total disagree 16 21 14 47 21 0 18 14 8 28 11 10
Q. 27 C. Vote Method - I have a clear understanding of how to request a mail-in-ballot so that I can vote by mail in my state.Total Answering (1200) (301) (876) (89) (251) (121) (190) (212) (301) (340) (311) (513)Strongly agree 46 48 46 63 48 45 49 41 42 52 47 42Somewhat agree 22 19 23 12 20 29 28 22 21 18 29 22Somewhat disagree 15 16 15 10 14 16 9 21 17 13 12 19Strongly disagree 9 11 9 10 10 9 9 8 9 10 9 9(Neither) 4 4 4 2 2 2 4 6 6 2 3 6(Don't know/refused) 4 2 4 2 6 - 2 3 5 5 1 4Total agree 68 67 69 75 68 73 77 63 63 70 76 63Total disagree 24 27 23 21 24 25 18 29 26 23 20 27Total agree - Total disagree 44 40 46 55 44 49 59 34 38 47 55 36
Q. 27 D. Vote Method - I have a clear understanding of the in-person early voting options available to me in my state.Total Answering (1200) (301) (876) (89) (251) (121) (190) (212) (301) (340) (311) (513)Strongly agree 49 46 49 69 50 48 51 46 43 55 50 45Somewhat agree 23 22 24 13 22 26 26 24 22 20 26 23Somewhat disagree 14 15 14 5 13 13 13 16 17 11 13 17Strongly disagree 8 11 7 11 8 10 5 8 8 9 7 8(Neither) 3 3 3 1 2 2 1 3 6 2 1 5(Don't know/refused) 4 3 4 1 5 1 4 3 4 4 3 3Total agree 72 68 73 83 72 74 77 71 65 75 76 67Total disagree 22 26 21 16 21 23 18 24 25 20 20 25Total agree - Total disagree 50 42 52 67 51 51 59 46 40 55 56 43
TargetSmart Communications 1155 15th St, NW, Suite 750, Washington, DC 20005 targetsmart.com
104 of 228
Page 105
May 21-27, 2020
National Voter Insights Study
TargetSmart + Dynata
Gender/Age Gender/Education Age/Education
TotalYoun
ger MenOlder Men
Youn ger
WomenOlder
WomenNon Coll
MenColl Men
Non Coll Women
Coll Women
Youn ger Non
CollOlder
Non Coll
Youn ger Coll
egeOlder Coll
Party ID Difference...2-3-2 PARTY ID Dem-Rep 4 7 -15 21 6 -9 -2 7 19 6 -4 22 -53-1-3 PARTY ID Dem-Rep 7 12 -19 28 8 -12 1 10 26 8 -7 31 -3
Q. 27 A. Vote Method - If available to me in my state, I am likely to vote by mail in this election.Total Answering (1200) (256) (301) (312) (304) (262) (307) (318) (304) (252) (316) (312) (285)Strongly agree 40 41 35 41 44 35 41 39 47 37 37 44 43Somewhat agree 16 19 13 18 14 14 17 16 16 17 13 19 14Somewhat disagree 13 15 12 14 11 14 14 12 13 13 12 16 11Strongly disagree 24 19 32 21 23 33 21 23 21 25 30 17 24(Neither) 3 3 5 3 3 3 4 4 2 4 4 2 5(Don't know/refused) 4 3 3 4 5 2 3 6 2 4 4 2 4Total agree 56 60 48 58 58 49 58 55 63 54 51 63 57Total disagree 37 35 44 35 34 46 34 35 34 38 42 33 35Total agree - Total disagree 19 25 5 23 24 2 24 20 29 16 9 31 21
Q. 27 B. Vote Method - If available to me in my state, I am likely to vote before Election Day at an in-person early voting site in this election.Total Answering (1200) (256) (301) (312) (304) (262) (307) (318) (304) (252) (316) (312) (285)Strongly agree 32 30 29 32 36 33 26 36 33 33 35 29 30Somewhat agree 22 25 20 24 18 19 25 20 22 24 16 26 22Somewhat disagree 16 22 12 16 14 17 17 16 15 18 15 20 12Strongly disagree 21 16 28 18 23 24 21 18 23 15 26 19 25(Neither) 4 3 7 4 3 4 7 3 4 4 3 3 7(Don't know/refused) 5 4 5 6 6 5 4 7 4 6 6 3 5Total agree 54 55 48 56 55 51 51 56 55 57 51 55 52Total disagree 37 38 40 34 37 41 38 34 37 33 40 39 36Total agree - Total disagree 16 17 9 22 18 10 13 22 18 24 10 16 15
Q. 27 C. Vote Method - I have a clear understanding of how to request a mail-in-ballot so that I can vote by mail in my state.Total Answering (1200) (256) (301) (312) (304) (262) (307) (318) (304) (252) (316) (312) (285)Strongly agree 46 42 52 41 46 46 49 40 49 40 45 44 54Somewhat agree 22 25 18 24 23 20 22 22 24 24 19 25 21Somewhat disagree 15 14 14 19 14 15 13 17 15 18 15 16 12Strongly disagree 9 11 8 10 8 10 9 10 8 10 9 11 7(Neither) 4 5 6 2 4 6 5 4 2 4 5 2 4(Don't know/refused) 4 3 4 4 5 3 3 7 2 4 6 2 3Total agree 68 67 69 65 69 66 71 62 73 63 64 69 74Total disagree 24 26 21 29 22 25 22 27 24 28 24 27 19Total agree - Total disagree 44 42 48 36 48 41 49 35 50 35 40 42 56
Q. 27 D. Vote Method - I have a clear understanding of the in-person early voting options available to me in my state.Total Answering (1200) (256) (301) (312) (304) (262) (307) (318) (304) (252) (316) (312) (285)Strongly agree 49 44 56 38 54 54 48 45 48 43 53 40 56Somewhat agree 23 24 22 28 20 21 24 22 26 25 19 27 23Somewhat disagree 14 17 10 19 11 15 12 15 15 19 12 18 9Strongly disagree 8 9 6 9 8 6 9 8 8 7 7 11 6(Neither) 3 3 4 2 4 2 5 3 2 2 3 3 5(Don't know/refused) 4 3 3 4 5 3 3 7 2 5 5 2 3Total agree 72 68 78 67 73 75 72 67 73 68 72 67 78Total disagree 22 27 15 28 19 20 21 23 23 26 19 29 15Total agree - Total disagree 50 41 62 39 54 55 51 44 50 42 53 39 63
TargetSmart Communications 1155 15th St, NW, Suite 750, Washington, DC 20005 targetsmart.com
105 of 228
Page 106
May 21-27, 2020
National Voter Insights Study
TargetSmart + Dynata
Marital Status/Gender Marital Status/Kids Trump Job Approval
Voting Permissions by State
Total
Marr ied
Men
Marr ied
WomenUnmarr ied Men
Unmarr ied
Women
Marr ied
with kids
Marr ied with out kids
Unmarr ied with
kids
Unmarr ied with out kids
Total appr ove
Total disapp rove All mail
Open early / mail Closed
Party ID Difference...2-3-2 PARTY ID Dem-Rep 4 -17 -5 9 30 -4 -15 19 22 -50 50 -9 4 83-1-3 PARTY ID Dem-Rep 7 -22 -4 16 39 -2 -19 22 31 -65 67 -5 9 8
Q. 27 A. Vote Method - If available to me in my state, I am likely to vote by mail in this election.Total Answering (1200) (312) (306) (247) (313) (216) (400) (83) (471) (528) (626) (111) (605) (484)Strongly agree 40 39 37 37 49 39 37 44 44 28 51 66 44 30Somewhat agree 16 11 13 20 19 14 11 13 21 12 19 12 15 17Somewhat disagree 13 12 15 16 10 17 12 17 12 15 12 7 13 15Strongly disagree 24 32 27 20 17 24 32 24 17 40 11 11 21 31(Neither) 3 4 4 3 2 4 5 1 3 4 3 3 4 3(Don't know/refused) 4 2 4 4 4 2 3 1 4 2 4 1 3 5Total agree 56 50 49 57 68 53 48 57 65 40 70 78 59 47Total disagree 37 44 42 36 27 41 44 40 29 54 23 18 34 45Total agree - Total disagree 19 6 7 22 41 12 4 17 36 -14 47 60 25 2
Q. 27 B. Vote Method - If available to me in my state, I am likely to vote before Election Day at an in-person early voting site in this election.Total Answering (1200) (312) (306) (247) (313) (216) (400) (83) (471) (528) (626) (111) (605) (484)Strongly agree 32 30 32 28 36 31 31 43 31 35 29 27 31 35Somewhat agree 22 17 20 29 23 21 17 25 25 19 25 21 20 24Somewhat disagree 16 17 15 18 16 18 15 13 18 14 18 16 18 14Strongly disagree 21 28 23 17 18 21 28 14 18 23 20 27 23 19(Neither) 4 6 5 4 2 4 6 3 3 5 4 9 4 3(Don't know/refused) 5 3 5 5 5 4 4 2 6 4 5 2 5 6Total agree 54 47 52 56 59 53 48 68 56 54 53 48 51 58Total disagree 37 44 38 34 34 39 42 27 36 37 38 42 40 33Total agree - Total disagree 16 3 14 22 25 13 6 40 20 17 16 6 11 25
Q. 27 C. Vote Method - I have a clear understanding of how to request a mail-in-ballot so that I can vote by mail in my state.Total Answering (1200) (312) (306) (247) (313) (216) (400) (83) (471) (528) (626) (111) (605) (484)Strongly agree 46 52 44 42 45 45 50 55 42 47 45 66 49 37Somewhat agree 22 20 21 22 25 22 20 12 26 19 24 17 22 23Somewhat disagree 15 11 17 18 16 15 13 18 16 13 18 4 13 20Strongly disagree 9 10 10 9 8 11 9 11 8 12 7 8 7 12(Neither) 4 5 5 6 1 4 5 2 3 5 3 4 4 4(Don't know/refused) 4 3 3 3 6 3 3 1 5 4 3 1 3 5Total agree 68 72 66 64 70 67 70 68 68 66 69 83 72 60Total disagree 24 20 27 27 23 26 22 29 24 25 25 12 21 31Total agree - Total disagree 44 52 38 36 46 41 47 39 43 41 44 71 51 29
Q. 27 D. Vote Method - I have a clear understanding of the in-person early voting options available to me in my state.Total Answering (1200) (312) (306) (247) (313) (216) (400) (83) (471) (528) (626) (111) (605) (484)Strongly agree 49 55 48 45 46 46 54 46 45 54 45 55 49 46Somewhat agree 23 21 21 24 26 23 20 19 27 21 26 17 25 22Somewhat disagree 14 10 15 17 15 15 11 16 16 12 16 11 13 16Strongly disagree 8 8 8 7 9 9 8 16 6 7 8 8 7 9(Neither) 3 3 4 4 2 3 4 2 2 3 3 6 3 2(Don't know/refused) 4 2 5 4 3 4 4 - 4 3 3 4 4 4Total agree 72 77 69 69 72 69 74 65 72 75 70 72 74 69Total disagree 22 18 23 24 23 24 19 33 22 19 24 18 20 25Total agree - Total disagree 50 58 46 45 49 45 56 32 50 56 46 54 54 44
TargetSmart Communications 1155 15th St, NW, Suite 750, Washington, DC 20005 targetsmart.com
106 of 228
Page 107
May 21-27, 2020
National Voter Insights Study
TargetSmart + Dynata
Permanent Absentee Voter
Status
Ever Voted Early or By Mail
First Time Voters in 2018 2016 Vote History TargetSmart Voter Score
Total PAVNot PAV Yes No Yes No Voted
Did not Vote
Was Not
Regist ered
Super Voter
Freq uent Voter
Infreq uent Voter
Never Voted
Party ID Difference...2-3-2 PARTY ID Dem-Rep 4 16 3 1 5 4 5 2 4 17 0 1 9 73-1-3 PARTY ID Dem-Rep 7 22 5 0 9 9 7 2 8 26 -4 5 13 14
Q. 27 A. Vote Method - If available to me in my state, I am likely to vote by mail in this election.Total Answering (1200) (130) (1070) (220) (980) (176) (1024) (757) (266) (177) (221) (393) (393) (137)Strongly agree 40 64 37 42 40 28 42 43 38 33 48 39 43 32Somewhat agree 16 9 17 10 17 25 14 11 26 20 12 13 17 23Somewhat disagree 13 12 13 15 13 20 12 11 14 21 8 11 15 19Strongly disagree 24 8 26 27 23 18 25 28 14 20 27 30 19 22(Neither) 3 4 3 2 4 5 3 3 6 3 3 3 2 3(Don't know/refused) 4 2 4 4 4 4 4 4 3 3 3 4 4 2Total agree 56 74 54 52 57 53 57 54 63 54 60 52 60 55Total disagree 37 20 39 42 36 38 37 39 27 41 35 41 34 41Total agree - Total disagree 19 54 15 9 21 14 20 15 36 12 25 10 26 14
Q. 27 B. Vote Method - If available to me in my state, I am likely to vote before Election Day at an in-person early voting site in this election.Total Answering (1200) (130) (1070) (220) (980) (176) (1024) (757) (266) (177) (221) (393) (393) (137)Strongly agree 32 29 32 48 28 29 32 33 27 32 30 37 29 31Somewhat agree 22 17 22 19 22 36 19 18 30 27 16 15 25 34Somewhat disagree 16 17 16 10 17 18 16 15 16 20 13 15 17 21Strongly disagree 21 29 20 16 23 6 24 25 15 13 32 25 19 6(Neither) 4 3 4 2 5 5 4 4 7 2 6 3 4 4(Don't know/refused) 5 6 5 5 5 6 5 5 5 6 3 6 5 5Total agree 54 46 54 67 50 65 52 51 57 59 46 52 55 65Total disagree 37 45 36 26 40 24 40 41 31 33 45 39 37 27Total agree - Total disagree 16 0 18 42 10 41 12 11 26 26 1 13 18 39
Q. 27 C. Vote Method - I have a clear understanding of how to request a mail-in-ballot so that I can vote by mail in my state.Total Answering (1200) (130) (1070) (220) (980) (176) (1024) (757) (266) (177) (221) (393) (393) (137)Strongly agree 46 66 43 47 46 34 48 52 35 37 60 49 40 37Somewhat agree 22 19 23 21 22 27 21 18 33 26 19 18 25 26Somewhat disagree 15 8 16 13 16 21 14 14 14 21 9 15 17 21Strongly disagree 9 3 10 12 8 5 10 10 7 8 8 11 10 6(Neither) 4 2 4 3 4 8 3 3 8 2 3 3 4 7(Don't know/refused) 4 2 4 4 4 6 4 4 3 6 2 4 4 4Total agree 68 85 66 68 68 61 69 69 68 63 79 67 65 62Total disagree 24 11 26 25 24 26 24 24 21 29 17 26 27 27Total agree - Total disagree 44 75 40 43 44 35 45 45 46 34 62 42 39 35
Q. 27 D. Vote Method - I have a clear understanding of the in-person early voting options available to me in my state.Total Answering (1200) (130) (1070) (220) (980) (176) (1024) (757) (266) (177) (221) (393) (393) (137)Strongly agree 49 55 48 65 45 38 51 54 37 43 59 56 42 42Somewhat agree 23 22 23 20 24 32 21 18 33 29 18 19 26 31Somewhat disagree 14 10 15 7 16 18 13 13 15 15 11 11 17 16Strongly disagree 8 8 8 3 9 5 8 8 7 8 7 9 9 6(Neither) 3 4 3 1 3 5 3 2 6 2 3 2 3 3(Don't know/refused) 4 3 4 5 4 4 4 4 3 3 3 4 4 2Total agree 72 76 71 85 69 69 72 72 70 71 77 74 67 73Total disagree 22 18 22 10 24 23 22 21 22 24 18 20 26 23Total agree - Total disagree 50 59 49 75 44 47 50 51 48 48 59 55 41 51
TargetSmart Communications 1155 15th St, NW, Suite 750, Washington, DC 20005 targetsmart.com
107 of 228
Page 108
May 21-27, 2020
National Voter Insights Study
TargetSmart + Dynata
Partisan Score Presidential General Turnout Score Mode
Total 0 to 9.9 10 to 89.9 90+ 0 to 69.9 70+ Web Land line Wire less
Party ID Difference...2-3-2 PARTY ID Dem-Rep 4 -48 -4 53 4 5 3 -3 83-1-3 PARTY ID Dem-Rep 7 -55 -1 62 10 5 4 -6 15
Q. 27 A. Vote Method - If available to me in my state, I am likely to vote by mail in this election.Total Answering (1200) (302) (491) (408) (429) (771) (644) (116) (440)Strongly agree 40 31 38 50 35 43 36 44 46Somewhat agree 16 13 16 18 21 13 20 9 11Somewhat disagree 13 11 16 11 15 12 16 11 9Strongly disagree 24 40 22 15 19 27 17 33 32(Neither) 3 3 4 2 6 2 5 3 0(Don't know/refused) 4 2 4 5 4 3 6 1 1Total agree 56 44 54 68 56 56 56 53 57Total disagree 37 51 38 26 34 39 33 44 41Total agree - Total disagree 19 -7 16 42 23 17 23 9 16
Q. 27 B. Vote Method - If available to me in my state, I am likely to vote before Election Day at an in-person early voting site in this election.Total Answering (1200) (302) (491) (408) (429) (771) (644) (116) (440)Strongly agree 32 34 29 33 28 34 27 34 38Somewhat agree 22 18 24 22 28 18 26 13 18Somewhat disagree 16 14 18 16 17 16 16 14 17Strongly disagree 21 28 19 19 16 24 17 35 24(Neither) 4 3 5 5 5 4 6 3 1(Don't know/refused) 5 3 5 6 6 5 8 2 2Total agree 54 52 53 54 56 52 53 47 56Total disagree 37 41 37 35 33 40 33 49 41Total agree - Total disagree 16 11 16 20 23 12 20 -2 15
Q. 27 C. Vote Method - I have a clear understanding of how to request a mail-in-ballot so that I can vote by mail in my state.Total Answering (1200) (302) (491) (408) (429) (771) (644) (116) (440)Strongly agree 46 46 42 50 38 50 35 52 60Somewhat agree 22 21 24 22 29 19 28 15 16Somewhat disagree 15 16 16 14 16 15 18 18 10Strongly disagree 9 12 9 7 6 11 8 13 10(Neither) 4 4 5 3 7 2 6 - 1(Don't know/refused) 4 3 4 4 4 4 6 2 2Total agree 68 66 66 72 67 69 63 67 76Total disagree 24 28 25 21 23 25 26 31 21Total agree - Total disagree 44 39 41 51 44 44 37 36 56
Q. 27 D. Vote Method - I have a clear understanding of the in-person early voting options available to me in my state.Total Answering (1200) (302) (491) (408) (429) (771) (644) (116) (440)Strongly agree 49 54 46 48 42 52 39 61 60Somewhat agree 23 20 25 23 27 21 29 18 16Somewhat disagree 14 14 13 15 16 13 17 5 11Strongly disagree 8 7 9 8 6 9 6 8 10(Neither) 3 2 4 3 4 2 5 2 1(Don't know/refused) 4 4 3 4 5 3 4 6 2Total agree 72 74 71 71 69 73 67 79 76Total disagree 22 20 22 22 22 21 24 13 21Total agree - Total disagree 50 53 49 49 47 52 44 66 55
TargetSmart Communications 1155 15th St, NW, Suite 750, Washington, DC 20005 targetsmart.com
108 of 228
Page 109
May 21-27, 2020
National Voter Insights Study
TargetSmart + Dynata
2-3-2 Party 3-1-3 Party Ideology Party ID/Ideology
Total Dem Ind Rep Dem Ind Rep Lib Mod ConsLib
Dem
Mod / Cons Dem
Mod / Lib Rep
Cons Rep
Party ID Difference...2-3-2 PARTY ID Dem-Rep 4 100 - -100 73 - -75 68 6 -52 100 100 -100 -1003-1-3 PARTY ID Dem-Rep 7 100 8 -100 100 - -100 85 10 -63 100 100 -100 -100
Q. 27 E. Vote Method - I don't have enough information about how to take advantage of alternatives to in-person Election Day voting.Total Answering (1200) (415) (395) (362) (566) (124) (482) (304) (469) (368) (213) (189) (117) (239)Strongly agree 12 14 11 10 13 10 11 16 12 9 15 12 14 9Somewhat agree 19 22 18 17 22 16 16 20 20 16 22 22 21 15Somewhat disagree 19 19 19 19 19 20 18 21 18 20 19 20 19 20Strongly disagree 39 38 41 40 38 36 43 36 40 44 37 40 34 44(Neither) 7 4 9 9 5 15 8 5 8 7 4 3 7 9(Don't know/refused) 4 4 3 5 3 4 4 3 3 3 3 3 6 3Total agree 31 36 29 27 35 26 27 36 32 25 37 34 34 23Total disagree 58 57 60 60 58 55 61 57 58 64 55 60 53 64Total agree - Total disagree -27 -21 -32 -33 -23 -29 -34 -21 -26 -39 -18 -26 -19 -41
Q. 27 F. Vote Method - I am concerned that the mail system in my state cannot be relied upon to get mail-in ballots to election officials in time for them to be counted.Total Answering (1200) (415) (395) (362) (566) (124) (482) (304) (469) (368) (213) (189) (117) (239)Strongly agree 17 11 18 24 11 22 25 11 15 26 12 10 17 29Somewhat agree 20 22 18 21 21 19 20 23 19 21 23 22 27 20Somewhat disagree 20 23 16 19 23 13 18 24 18 17 25 22 20 17Strongly disagree 34 38 36 28 41 26 29 37 36 31 37 40 26 29(Neither) 4 2 8 4 2 14 5 3 8 3 1 3 8 2(Don't know/refused) 4 3 4 4 3 6 3 3 4 3 3 3 4 4Total agree 38 34 36 46 31 41 45 33 34 47 34 33 43 48Total disagree 54 61 53 47 63 39 47 61 55 48 61 62 45 46Total agree - Total disagree -16 -28 -17 -1 -32 2 -1 -28 -21 0 -27 -29 -2 2
Q. 28 Worry About Contracting Coronavirus While VotingTotal Answering (1200) (415) (395) (362) (566) (124) (482) (304) (469) (368) (213) (189) (117) (239)Very worried 15 25 9 8 22 9 7 21 13 11 24 27 10 7Somewhat worried 28 35 29 20 36 29 19 37 32 18 37 32 28 17Not too worried 28 28 30 29 27 30 31 28 30 29 27 29 29 29Not worried at all 27 12 31 42 14 31 43 14 25 43 11 12 34 47(Don't know/refused) 1 1 0 1 1 - 1 1 - 1 1 - - 0Very/Somewhat worried 43 60 38 28 58 38 26 58 45 28 61 59 37 24Not too/Not at all worried 56 39 61 71 41 62 73 41 55 71 38 41 63 76
Q. 29 A. Voting and Election Proposal - Extend voter registration deadlines.Total Answering (1200) (415) (395) (362) (566) (124) (482) (304) (469) (368) (213) (189) (117) (239)Support strongly 41 56 43 24 58 32 25 58 44 26 61 53 31 19Support somewhat 23 25 23 22 24 25 22 25 24 22 26 23 20 24Oppose somewhat 12 8 10 18 8 7 17 7 11 16 5 10 19 17Oppose strongly 16 6 15 27 6 17 27 4 13 29 4 9 20 32(Neither/undecided) 7 4 9 8 4 17 8 6 8 7 3 5 10 7(Don't know/refused) 2 2 1 1 1 2 1 1 1 0 2 1 1 0Total support 64 81 66 46 82 57 47 82 68 47 87 76 51 43Total oppose 27 14 25 45 13 24 44 11 24 45 9 19 39 49Total support - Total oppose 37 67 41 0 69 33 3 71 44 2 78 57 12 -6
TargetSmart Communications 1155 15th St, NW, Suite 750, Washington, DC 20005 targetsmart.com
109 of 228
Page 110
May 21-27, 2020
National Voter Insights Study
TargetSmart + Dynata
Party ID/Gender
Total Dem MenDem
Women Ind MenInd
Women Rep MenRep
Women
Party ID Difference...2-3-2 PARTY ID Dem-Rep 4 100 100 - - -100 -1003-1-3 PARTY ID Dem-Rep 7 100 100 1 17 -100 -100
Q. 27 E. Vote Method - I don't have enough information about how to take advantage of alternatives to in-person Election Day voting.Total Answering (1200) (157) (258) (219) (177) (186) (177)Strongly agree 12 12 15 13 8 10 11Somewhat agree 19 19 24 13 24 16 18Somewhat disagree 19 23 17 17 21 21 18Strongly disagree 39 40 37 48 33 38 42(Neither) 7 5 4 6 12 10 7(Don't know/refused) 4 2 4 3 3 4 5Total agree 31 31 39 26 32 26 29Total disagree 58 63 53 65 54 59 60Total agree - Total disagree -27 -32 -14 -39 -22 -34 -32
Q. 27 F. Vote Method - I am concerned that the mail system in my state cannot be relied upon to get mail-in ballots to election officials in time for them to be counted.Total Answering (1200) (157) (258) (219) (177) (186) (177)Strongly agree 17 10 12 19 17 25 23Somewhat agree 20 22 22 16 20 17 26Somewhat disagree 20 22 24 15 18 21 17Strongly disagree 34 41 36 38 34 29 27(Neither) 4 2 2 8 7 5 3(Don't know/refused) 4 2 4 4 4 4 4Total agree 38 32 34 35 38 42 50Total disagree 54 64 60 53 52 49 44Total agree - Total disagree -16 -32 -25 -19 -14 -7 6
Q. 28 Worry About Contracting Coronavirus While VotingTotal Answering (1200) (157) (258) (219) (177) (186) (177)Very worried 15 26 25 10 9 7 10Somewhat worried 28 31 37 22 39 17 23Not too worried 28 32 25 32 27 29 29Not worried at all 27 11 12 36 25 47 38(Don't know/refused) 1 0 1 0 0 1 0Very/Somewhat worried 43 57 62 31 47 24 33Not too/Not at all worried 56 43 37 69 52 75 67
Q. 29 A. Voting and Election Proposal - Extend voter registration deadlines.Total Answering (1200) (157) (258) (219) (177) (186) (177)Support strongly 41 57 56 46 39 19 29Support somewhat 23 27 23 21 26 20 24Oppose somewhat 12 8 8 8 12 21 15Oppose strongly 16 5 7 18 12 31 23(Neither/undecided) 7 3 4 7 12 7 10(Don't know/refused) 2 1 2 1 1 1 -Total support 64 84 79 67 65 39 53Total oppose 27 13 14 25 23 52 38Total support - Total oppose 37 71 65 41 41 -13 15
TargetSmart Communications 1155 15th St, NW, Suite 750, Washington, DC 20005 targetsmart.com
110 of 228
Page 111
May 21-27, 2020
National Voter Insights Study
TargetSmart + Dynata
Urbanicity
Total R1 R2 S3 S4 U5 U6 Rural Subu rban Urban
Party ID Difference...2-3-2 PARTY ID Dem-Rep 4 -23 -15 -2 9 22 42 -19 4 283-1-3 PARTY ID Dem-Rep 7 -23 -17 -1 12 26 52 -20 7 33
Q. 27 E. Vote Method - I don't have enough information about how to take advantage of alternatives to in-person Election Day voting.Total Answering (1200) (179) (181) (195) (273) (264) (108) (360) (468) (372)Strongly agree 12 14 14 10 10 12 12 14 10 12Somewhat agree 19 19 21 18 17 20 22 20 18 20Somewhat disagree 19 19 17 19 19 18 24 18 19 20Strongly disagree 39 37 39 43 42 39 28 38 43 36(Neither) 7 8 5 5 6 8 10 7 6 8(Don't know/refused) 4 4 6 4 5 3 4 5 5 3Total agree 31 33 34 28 28 32 34 34 28 32Total disagree 58 55 55 62 61 58 52 55 62 56Total agree - Total disagree -27 -23 -21 -34 -34 -26 -18 -22 -34 -24
Q. 27 F. Vote Method - I am concerned that the mail system in my state cannot be relied upon to get mail-in ballots to election officials in time for them to be counted.Total Answering (1200) (179) (181) (195) (273) (264) (108) (360) (468) (372)Strongly agree 17 30 18 14 16 16 11 24 15 14Somewhat agree 20 13 23 19 19 24 26 18 19 25Somewhat disagree 20 17 17 20 21 21 24 17 20 22Strongly disagree 34 30 35 40 34 33 30 33 37 32(Neither) 4 7 5 2 5 3 7 6 4 4(Don't know/refused) 4 3 2 5 6 3 3 3 6 3Total agree 38 43 40 33 35 40 36 42 34 39Total disagree 54 47 53 60 54 54 54 50 57 54Total agree - Total disagree -16 -4 -12 -27 -20 -15 -18 -8 -23 -15
Q. 28 Worry About Contracting Coronavirus While VotingTotal Answering (1200) (179) (181) (195) (273) (264) (108) (360) (468) (372)Very worried 15 12 11 14 13 20 20 11 13 20Somewhat worried 28 22 22 28 30 33 35 22 29 33Not too worried 28 27 38 30 26 24 28 33 28 25Not worried at all 27 37 30 27 30 22 17 33 29 21(Don't know/refused) 1 2 - 1 1 2 1 1 1 1Very/Somewhat worried 43 34 32 42 43 53 55 33 43 53Not too/Not at all worried 56 64 68 57 56 46 45 66 56 45
Q. 29 A. Voting and Election Proposal - Extend voter registration deadlines.Total Answering (1200) (179) (181) (195) (273) (264) (108) (360) (468) (372)Support strongly 41 34 30 38 43 50 52 32 41 50Support somewhat 23 24 26 29 18 23 21 25 23 22Oppose somewhat 12 8 17 14 11 9 10 13 12 9Oppose strongly 16 24 18 13 17 13 8 21 15 12(Neither/undecided) 7 9 9 4 8 4 9 9 6 5(Don't know/refused) 2 - 1 3 3 2 1 1 3 2Total support 64 58 55 67 61 72 73 57 63 72Total oppose 27 33 35 27 28 22 17 34 27 21Total support - Total oppose 37 26 21 40 33 50 56 23 36 52
TargetSmart Communications 1155 15th St, NW, Suite 750, Washington, DC 20005 targetsmart.com
111 of 228
Page 112
May 21-27, 2020
National Voter Insights Study
TargetSmart + Dynata
Urbanicity/Gender
Total Rural MenRural
WomenSubu rban
MenSubu rban Women Urban Men
Urban Women
Party ID Difference...2-3-2 PARTY ID Dem-Rep 4 -23 -15 -4 12 13 393-1-3 PARTY ID Dem-Rep 7 -28 -13 -1 15 16 48
Q. 27 E. Vote Method - I don't have enough information about how to take advantage of alternatives to in-person Election Day voting.Total Answering (1200) (180) (180) (227) (241) (164) (208)Strongly agree 12 15 13 10 11 13 11Somewhat agree 19 13 27 16 19 18 22Somewhat disagree 19 16 19 22 16 20 20Strongly disagree 39 44 31 43 42 38 35(Neither) 7 6 7 6 5 9 8(Don't know/refused) 4 7 3 3 7 2 4Total agree 31 28 40 26 30 31 34Total disagree 58 60 50 65 58 58 55Total agree - Total disagree -27 -33 -11 -40 -28 -27 -21
Q. 27 F. Vote Method - I am concerned that the mail system in my state cannot be relied upon to get mail-in ballots to election officials in time for them to be counted.Total Answering (1200) (180) (180) (227) (241) (164) (208)Strongly agree 17 24 24 16 14 16 13Somewhat agree 20 15 20 16 21 25 25Somewhat disagree 20 17 17 21 20 20 24Strongly disagree 34 37 28 37 36 31 33(Neither) 4 4 7 5 2 7 2(Don't know/refused) 4 3 3 5 6 3 4Total agree 38 39 44 32 35 40 37Total disagree 54 54 45 58 56 51 57Total agree - Total disagree -16 -15 -1 -25 -21 -10 -19
Q. 28 Worry About Contracting Coronavirus While VotingTotal Answering (1200) (180) (180) (227) (241) (164) (208)Very worried 15 7 16 13 14 23 18Somewhat worried 28 17 27 24 34 27 38Not too worried 28 33 33 31 25 27 23Not worried at all 27 43 23 31 26 22 20(Don't know/refused) 1 - 2 1 1 2 1Very/Somewhat worried 43 24 43 37 48 50 56Not too/Not at all worried 56 76 55 62 51 49 43
Q. 29 A. Voting and Election Proposal - Extend voter registration deadlines.Total Answering (1200) (180) (180) (227) (241) (164) (208)Support strongly 41 31 33 41 41 48 53Support somewhat 23 24 26 22 24 21 23Oppose somewhat 12 13 12 12 13 11 8Oppose strongly 16 25 17 18 13 13 11(Neither/undecided) 7 6 12 6 7 6 5(Don't know/refused) 2 1 1 2 3 2 1Total support 64 55 58 62 64 69 76Total oppose 27 38 29 30 25 24 18Total support - Total oppose 37 17 29 33 39 45 57
TargetSmart Communications 1155 15th St, NW, Suite 750, Washington, DC 20005 targetsmart.com
112 of 228
Page 113
May 21-27, 2020
National Voter Insights Study
TargetSmart + Dynata
Region by State
TotalBorder States
Califo rnia
Indust rial
Midw est
Lower Midw
estMid -
Atla ntic
Moun tain
States
Nati onal
Capi talNew
Engl and
Paci fic Northw
est SouthSouthe
ast
Upper Midw
est
Party ID Difference...2-3-2 PARTY ID Dem-Rep 4 4 19 -11 16 15 2 5 17 -7 -3 3 13-1-3 PARTY ID Dem-Rep 7 -5 27 -6 17 21 5 15 29 2 -9 8 -8
Q. 27 E. Vote Method - I don't have enough information about how to take advantage of alternatives to in-person Election Day voting.Total Answering (1200) (132) (120) (157) (60) (158) (48) (60) (60) (48) (108) (193) (48)Strongly agree 12 12 9 17 12 14 8 2 15 14 10 11 10Somewhat agree 19 20 13 13 25 25 13 23 28 10 25 18 19Somewhat disagree 19 20 26 17 17 22 16 24 19 10 18 16 18Strongly disagree 39 34 44 42 42 30 46 39 16 56 39 46 37(Neither) 7 7 6 7 2 8 11 9 10 9 4 6 8(Don't know/refused) 4 7 3 5 2 3 6 4 12 1 4 3 8Total agree 31 32 21 30 37 38 21 24 43 24 35 30 29Total disagree 58 53 70 58 59 51 63 62 35 66 57 62 55Total agree - Total disagree -27 -21 -49 -28 -22 -13 -42 -38 8 -43 -23 -32 -26
Q. 27 F. Vote Method - I am concerned that the mail system in my state cannot be relied upon to get mail-in ballots to election officials in time for them to be counted.Total Answering (1200) (132) (120) (157) (60) (158) (48) (60) (60) (48) (108) (193) (48)Strongly agree 17 17 12 19 8 15 18 18 18 23 27 16 28Somewhat agree 20 26 19 22 14 30 6 20 21 9 17 22 9Somewhat disagree 20 19 20 19 21 25 26 25 14 13 16 21 12Strongly disagree 34 29 40 35 47 23 46 32 23 49 32 35 36(Neither) 4 6 7 3 10 3 1 3 9 5 2 2 9(Don't know/refused) 4 3 3 2 - 4 3 3 14 3 7 5 6Total agree 38 42 30 40 21 45 24 38 40 32 44 37 37Total disagree 54 48 60 54 69 48 73 56 38 61 48 56 49Total agree - Total disagree -16 -6 -30 -14 -47 -4 -49 -19 2 -30 -4 -18 -11
Q. 28 Worry About Contracting Coronavirus While VotingTotal Answering (1200) (132) (120) (157) (60) (158) (48) (60) (60) (48) (108) (193) (48)Very worried 15 14 16 16 8 17 10 14 15 5 25 13 10Somewhat worried 28 34 31 29 40 28 20 31 27 17 26 28 15Not too worried 28 26 32 30 32 29 25 14 36 21 22 29 39Not worried at all 27 25 21 25 19 25 44 39 22 54 25 27 34(Don't know/refused) 1 1 - - - 2 - 1 - 4 1 3 2Very/Somewhat worried 43 48 47 45 48 45 30 45 42 22 51 42 26Not too/Not at all worried 56 51 53 55 52 53 70 54 58 75 48 56 73
Q. 29 A. Voting and Election Proposal - Extend voter registration deadlines.Total Answering (1200) (132) (120) (157) (60) (158) (48) (60) (60) (48) (108) (193) (48)Support strongly 41 39 43 45 31 42 40 47 33 45 42 42 37Support somewhat 23 30 23 21 21 25 17 22 21 14 22 25 18Oppose somewhat 12 8 13 10 14 11 9 12 15 6 7 16 16Oppose strongly 16 12 15 19 26 13 22 13 14 24 22 12 7(Neither/undecided) 7 6 4 6 8 7 12 5 9 8 7 4 20(Don't know/refused) 2 4 2 - - 2 - 1 8 3 2 0 3Total support 64 69 66 66 53 67 57 70 54 58 63 67 55Total oppose 27 21 28 28 40 24 31 25 29 31 28 28 22Total support - Total oppose 37 49 38 37 13 43 26 45 25 28 35 39 33
TargetSmart Communications 1155 15th St, NW, Suite 750, Washington, DC 20005 targetsmart.com
113 of 228
Page 114
May 21-27, 2020
National Voter Insights Study
TargetSmart + Dynata
Gender Age
Total Men Women 18 - 34 35 - 49 50 - 64 Over 64 18 - 4950 and
over
Party ID Difference...2-3-2 PARTY ID Dem-Rep 4 -5 13 24 6 -2 -8 15 -53-1-3 PARTY ID Dem-Rep 7 -5 18 33 8 0 -10 21 -5
Q. 27 E. Vote Method - I don't have enough information about how to take advantage of alternatives to in-person Election Day voting.Total Answering (1200) (571) (629) (281) (287) (310) (295) (568) (605)Strongly agree 12 12 12 16 14 10 9 15 9Somewhat agree 19 16 22 25 17 18 17 21 18Somewhat disagree 19 20 18 19 20 19 16 20 18Strongly disagree 39 42 37 32 39 41 44 35 42(Neither) 7 7 7 6 6 8 8 6 8(Don't know/refused) 4 4 5 3 5 4 6 4 5Total agree 31 28 34 40 30 28 26 35 27Total disagree 58 62 55 51 59 60 60 55 60Total agree - Total disagree -27 -34 -21 -11 -29 -32 -34 -20 -33
Q. 27 F. Vote Method - I am concerned that the mail system in my state cannot be relied upon to get mail-in ballots to election officials in time for them to be counted.Total Answering (1200) (571) (629) (281) (287) (310) (295) (568) (605)Strongly agree 17 19 17 15 24 17 15 19 16Somewhat agree 20 18 22 28 18 21 15 23 18Somewhat disagree 20 19 21 23 18 18 20 21 19Strongly disagree 34 35 33 25 31 37 41 28 39(Neither) 4 5 4 5 5 5 4 5 4(Don't know/refused) 4 4 5 4 5 3 5 4 4Total agree 38 37 39 43 42 38 30 42 34Total disagree 54 54 53 48 49 55 61 49 58Total agree - Total disagree -16 -18 -15 -6 -7 -17 -31 -6 -24
Q. 28 Worry About Contracting Coronavirus While VotingTotal Answering (1200) (571) (629) (281) (287) (310) (295) (568) (605)Very worried 15 14 16 16 15 15 12 16 14Somewhat worried 28 23 34 37 28 23 28 32 25Not too worried 28 31 26 30 28 30 26 29 28Not worried at all 27 32 23 16 29 30 32 23 31(Don't know/refused) 1 1 1 2 - 1 2 1 2Very/Somewhat worried 43 37 49 53 43 38 40 48 39Not too/Not at all worried 56 63 50 46 57 60 59 52 59
Q. 29 A. Voting and Election Proposal - Extend voter registration deadlines.Total Answering (1200) (571) (629) (281) (287) (310) (295) (568) (605)Support strongly 41 40 42 46 45 36 38 45 37Support somewhat 23 22 24 28 23 25 17 26 21Oppose somewhat 12 12 11 11 9 11 15 10 13Oppose strongly 16 19 13 7 14 19 22 11 21(Neither/undecided) 7 6 8 6 7 7 7 6 7(Don't know/refused) 2 2 2 2 2 2 1 2 2Total support 64 62 66 74 68 61 55 71 58Total oppose 27 31 24 18 23 30 37 21 34Total support - Total oppose 37 31 42 56 45 31 17 50 24
TargetSmart Communications 1155 15th St, NW, Suite 750, Washington, DC 20005 targetsmart.com
114 of 228
Page 115
May 21-27, 2020
National Voter Insights Study
TargetSmart + Dynata
Education Homeownership status Marital status
TotalH.S. or
lessPost H.S.
4yr Coll Grad
Post Grad
Coll ege Grad uate
Total Non Coll Rent Own
Marr ied Single
Separa ted / divo rced
Wido wed
Total Unmarr
ied
Party ID Difference...2-3-2 PARTY ID Dem-Rep 4 5 -3 6 13 9 0 32 -5 -11 30 10 -6 213-1-3 PARTY ID Dem-Rep 7 3 -1 9 20 14 0 44 -6 -13 42 12 -10 29
Q. 27 E. Vote Method - I don't have enough information about how to take advantage of alternatives to in-person Election Day voting.Total Answering (1200) (210) (369) (363) (248) (610) (579) (297) (873) (618) (357) (144) (59) (560)Strongly agree 12 14 11 11 12 12 12 13 12 11 14 12 11 13Somewhat agree 19 20 23 17 16 17 22 23 17 16 24 19 22 22Somewhat disagree 19 16 19 19 23 21 18 19 19 20 18 20 14 18Strongly disagree 39 34 36 44 41 43 36 34 42 42 36 37 34 36(Neither) 7 6 8 7 5 6 8 7 6 7 6 5 9 6(Don't know/refused) 4 9 4 2 3 3 6 4 4 4 3 8 10 5Total agree 31 34 33 28 28 28 34 36 29 27 37 31 33 35Total disagree 58 50 55 63 64 63 53 53 61 62 54 57 49 54Total agree - Total disagree -27 -16 -22 -35 -36 -35 -19 -17 -32 -35 -17 -26 -16 -19
Q. 27 F. Vote Method - I am concerned that the mail system in my state cannot be relied upon to get mail-in ballots to election officials in time for them to be counted.Total Answering (1200) (210) (369) (363) (248) (610) (579) (297) (873) (618) (357) (144) (59) (560)Strongly agree 17 22 20 15 14 15 21 15 19 19 16 17 12 16Somewhat agree 20 18 20 23 20 22 19 24 19 20 22 21 16 21Somewhat disagree 20 25 20 17 20 18 22 22 19 17 25 15 25 22Strongly disagree 34 26 32 37 41 38 30 31 35 35 29 36 42 32(Neither) 4 2 5 7 3 5 4 5 4 5 4 2 2 4(Don't know/refused) 4 7 4 2 2 2 5 4 4 3 3 8 4 4Total agree 38 41 39 37 34 36 40 39 38 39 39 38 27 37Total disagree 54 50 52 54 60 57 51 53 54 53 54 52 67 55Total agree - Total disagree -16 -10 -12 -17 -26 -20 -11 -14 -16 -14 -16 -13 -40 -18
Q. 28 Worry About Contracting Coronavirus While VotingTotal Answering (1200) (210) (369) (363) (248) (610) (579) (297) (873) (618) (357) (144) (59) (560)Very worried 15 24 13 10 16 13 17 20 13 13 17 15 16 16Somewhat worried 28 27 27 30 28 30 27 35 26 24 34 31 36 34Not too worried 28 25 30 30 28 29 28 27 29 28 31 30 24 30Not worried at all 27 24 29 29 27 28 27 17 31 35 17 23 23 19(Don't know/refused) 1 0 1 1 1 1 1 1 1 0 1 1 1 1Very/Somewhat worried 43 51 40 41 44 42 44 55 39 37 51 46 52 50Not too/Not at all worried 56 49 59 59 55 57 55 44 60 62 48 52 47 49
Q. 29 A. Voting and Election Proposal - Extend voter registration deadlines.Total Answering (1200) (210) (369) (363) (248) (610) (579) (297) (873) (618) (357) (144) (59) (560)Support strongly 41 42 38 43 43 43 39 45 39 35 49 47 37 47Support somewhat 23 23 24 21 24 23 24 27 22 22 26 22 22 24Oppose somewhat 12 9 12 12 12 12 11 11 12 12 11 8 21 11Oppose strongly 16 17 17 15 15 15 17 8 19 21 9 13 16 10(Neither/undecided) 7 8 8 7 5 6 8 6 7 9 4 9 2 5(Don't know/refused) 2 1 2 2 1 2 2 2 1 1 2 2 3 2Total support 64 65 62 64 68 66 63 73 61 57 75 69 59 72Total oppose 27 26 29 27 27 27 28 20 31 33 20 20 37 22Total support - Total oppose 37 39 33 37 41 39 35 53 31 24 55 48 22 50
TargetSmart Communications 1155 15th St, NW, Suite 750, Washington, DC 20005 targetsmart.com
115 of 228
Page 116
May 21-27, 2020
National Voter Insights Study
TargetSmart + Dynata
Kids at home Religious attendance
Total Yes No
More than
once a week
Once a week
Once or twice a month
A few times a
year Seldom NeverFreq uent
Infreq uent
Seldom / Never
Party ID Difference...2-3-2 PARTY ID Dem-Rep 4 2 6 -10 -15 5 7 6 24 -14 6 163-1-3 PARTY ID Dem-Rep 7 5 9 -19 -17 -5 14 9 35 -17 7 24
Q. 27 E. Vote Method - I don't have enough information about how to take advantage of alternatives to in-person Election Day voting.Total Answering (1200) (301) (876) (89) (251) (121) (190) (212) (301) (340) (311) (513)Strongly agree 12 15 11 8 14 15 12 9 11 13 13 10Somewhat agree 19 17 20 20 20 21 20 20 17 20 20 18Somewhat disagree 19 19 19 17 15 16 21 24 19 16 19 21Strongly disagree 39 38 40 51 40 41 40 35 40 43 40 38(Neither) 7 7 7 3 6 5 5 8 10 5 5 9(Don't know/refused) 4 4 4 2 6 4 2 4 4 5 3 4Total agree 31 32 31 28 34 35 32 29 27 32 33 28Total disagree 58 57 59 68 55 56 62 59 59 58 60 59Total agree - Total disagree -27 -25 -28 -40 -21 -21 -30 -30 -32 -26 -27 -31
Q. 27 F. Vote Method - I am concerned that the mail system in my state cannot be relied upon to get mail-in ballots to election officials in time for them to be counted.Total Answering (1200) (301) (876) (89) (251) (121) (190) (212) (301) (340) (311) (513)Strongly agree 17 17 18 24 21 19 16 17 13 22 17 15Somewhat agree 20 24 19 15 18 29 24 22 16 17 26 19Somewhat disagree 20 18 21 26 18 18 17 18 23 20 18 21Strongly disagree 34 33 34 30 37 28 37 33 36 35 34 34(Neither) 4 6 4 2 1 6 5 5 7 1 5 6(Don't know/refused) 4 3 4 3 5 - 0 4 6 4 0 5Total agree 38 41 37 39 39 48 41 40 29 39 44 33Total disagree 54 51 55 56 55 46 54 51 59 55 51 55Total agree - Total disagree -16 -10 -18 -17 -15 2 -14 -11 -30 -16 -8 -22
Q. 28 Worry About Contracting Coronavirus While VotingTotal Answering (1200) (301) (876) (89) (251) (121) (190) (212) (301) (340) (311) (513)Very worried 15 16 15 19 11 10 19 16 16 13 15 16Somewhat worried 28 28 29 18 27 29 33 26 31 25 31 29Not too worried 28 28 29 27 31 27 29 29 28 30 28 28Not worried at all 27 29 27 35 31 34 20 28 24 32 26 26(Don't know/refused) 1 0 1 1 0 - 1 1 1 0 0 1Very/Somewhat worried 43 44 43 37 38 39 51 42 47 38 46 45Not too/Not at all worried 56 56 56 62 62 61 48 57 52 62 54 54
Q. 29 A. Voting and Election Proposal - Extend voter registration deadlines.Total Answering (1200) (301) (876) (89) (251) (121) (190) (212) (301) (340) (311) (513)Support strongly 41 43 40 42 40 30 44 41 44 41 39 43Support somewhat 23 23 23 17 20 30 24 22 25 20 27 24Oppose somewhat 12 9 13 14 13 15 13 12 7 13 14 9Oppose strongly 16 17 16 24 17 21 14 16 12 19 17 14(Neither/undecided) 7 7 7 3 6 3 5 9 9 5 4 9(Don't know/refused) 2 1 2 - 3 - - 1 2 2 - 2Total support 64 66 64 59 61 61 68 63 69 60 65 66Total oppose 27 25 28 38 30 36 27 28 20 32 30 23Total support - Total oppose 37 41 35 21 30 25 42 35 50 28 35 44
TargetSmart Communications 1155 15th St, NW, Suite 750, Washington, DC 20005 targetsmart.com
116 of 228
Page 117
May 21-27, 2020
National Voter Insights Study
TargetSmart + Dynata
Gender/Age Gender/Education Age/Education
TotalYoun
ger MenOlder Men
Youn ger
WomenOlder
WomenNon Coll
MenColl Men
Non Coll Women
Coll Women
Youn ger Non
CollOlder
Non Coll
Youn ger Coll
egeOlder Coll
Party ID Difference...2-3-2 PARTY ID Dem-Rep 4 7 -15 21 6 -9 -2 7 19 6 -4 22 -53-1-3 PARTY ID Dem-Rep 7 12 -19 28 8 -12 1 10 26 8 -7 31 -3
Q. 27 E. Vote Method - I don't have enough information about how to take advantage of alternatives to in-person Election Day voting.Total Answering (1200) (256) (301) (312) (304) (262) (307) (318) (304) (252) (316) (312) (285)Strongly agree 12 17 9 13 10 13 11 11 12 15 10 14 9Somewhat agree 19 18 14 23 21 16 15 26 18 22 21 20 13Somewhat disagree 19 19 20 21 15 19 20 16 21 18 16 21 20Strongly disagree 39 41 42 31 43 39 44 33 42 33 38 38 47(Neither) 7 3 10 8 6 8 6 7 6 6 9 5 7(Don't know/refused) 4 3 5 5 5 4 3 7 2 5 6 2 3Total agree 31 34 23 36 31 29 27 37 30 37 31 34 22Total disagree 58 59 62 52 58 58 64 49 62 51 54 59 67Total agree - Total disagree -27 -25 -39 -16 -27 -29 -38 -11 -32 -14 -23 -25 -45
Q. 27 F. Vote Method - I am concerned that the mail system in my state cannot be relied upon to get mail-in ballots to election officials in time for them to be counted.Total Answering (1200) (256) (301) (312) (304) (262) (307) (318) (304) (252) (316) (312) (285)Strongly agree 17 21 17 18 15 24 14 18 15 23 20 17 12Somewhat agree 20 18 19 27 17 16 20 22 23 20 19 26 17Somewhat disagree 20 19 19 22 20 22 17 21 20 23 20 19 18Strongly disagree 34 32 37 25 40 29 40 30 37 24 34 32 44(Neither) 4 7 5 3 4 5 6 3 4 4 3 5 5(Don't know/refused) 4 4 3 5 4 4 3 6 2 7 5 2 3Total agree 38 39 36 45 32 40 34 40 38 42 38 43 30Total disagree 54 51 56 46 60 52 57 51 56 47 54 51 62Total agree - Total disagree -16 -13 -20 -1 -27 -12 -23 -11 -18 -5 -16 -8 -33
Q. 28 Worry About Contracting Coronavirus While VotingTotal Answering (1200) (256) (301) (312) (304) (262) (307) (318) (304) (252) (316) (312) (285)Very worried 15 16 12 15 16 15 12 18 13 16 17 15 10Somewhat worried 28 23 23 40 27 23 23 31 36 31 25 33 26Not too worried 28 34 27 24 29 28 33 28 25 31 26 28 31Not worried at all 27 26 37 20 26 34 30 21 25 21 31 24 31(Don't know/refused) 1 1 1 1 2 0 1 1 0 1 1 0 2Very/Somewhat worried 43 39 35 55 43 38 35 49 49 47 42 48 36Not too/Not at all worried 56 61 64 44 55 62 64 50 51 52 57 52 62
Q. 29 A. Voting and Election Proposal - Extend voter registration deadlines.Total Answering (1200) (256) (301) (312) (304) (262) (307) (318) (304) (252) (316) (312) (285)Support strongly 41 48 33 44 41 40 40 39 47 44 35 47 39Support somewhat 23 26 19 26 22 21 23 25 22 25 22 26 19Oppose somewhat 12 9 15 11 12 11 13 11 11 11 11 9 15Oppose strongly 16 13 24 9 17 20 18 14 12 11 22 11 19(Neither/undecided) 7 4 7 9 7 7 5 8 7 8 8 6 6(Don't know/refused) 2 1 2 3 1 1 2 2 1 1 2 1 2Total support 64 73 52 69 63 61 63 65 69 70 58 73 58Total oppose 27 22 39 20 29 31 30 25 23 21 33 20 34Total support - Total oppose 37 52 14 49 35 30 33 40 45 48 25 53 23
TargetSmart Communications 1155 15th St, NW, Suite 750, Washington, DC 20005 targetsmart.com
117 of 228
Page 118
May 21-27, 2020
National Voter Insights Study
TargetSmart + Dynata
Marital Status/Gender Marital Status/Kids Trump Job Approval
Voting Permissions by State
Total
Marr ied
Men
Marr ied
WomenUnmarr ied Men
Unmarr ied
Women
Marr ied
with kids
Marr ied with out kids
Unmarr ied with
kids
Unmarr ied with out kids
Total appr ove
Total disapp rove All mail
Open early / mail Closed
Party ID Difference...2-3-2 PARTY ID Dem-Rep 4 -17 -5 9 30 -4 -15 19 22 -50 50 -9 4 83-1-3 PARTY ID Dem-Rep 7 -22 -4 16 39 -2 -19 22 31 -65 67 -5 9 8
Q. 27 E. Vote Method - I don't have enough information about how to take advantage of alternatives to in-person Election Day voting.Total Answering (1200) (312) (306) (247) (313) (216) (400) (83) (471) (528) (626) (111) (605) (484)Strongly agree 12 10 12 15 11 15 9 15 13 11 13 12 12 12Somewhat agree 19 12 20 19 24 14 17 26 22 19 18 16 16 24Somewhat disagree 19 19 21 21 16 20 20 18 19 17 21 14 20 19Strongly disagree 39 47 37 35 37 40 43 32 37 40 38 50 41 34(Neither) 7 7 7 7 6 7 7 4 6 9 6 8 7 6(Don't know/refused) 4 4 3 3 6 3 4 6 4 4 3 0 4 5Total agree 31 22 32 35 35 29 26 41 34 31 31 28 28 36Total disagree 58 67 57 56 53 60 63 50 55 57 60 64 61 53Total agree - Total disagree -27 -45 -25 -21 -18 -32 -36 -9 -21 -26 -28 -36 -33 -17
Q. 27 F. Vote Method - I am concerned that the mail system in my state cannot be relied upon to get mail-in ballots to election officials in time for them to be counted.Total Answering (1200) (312) (306) (247) (313) (216) (400) (83) (471) (528) (626) (111) (605) (484)Strongly agree 17 19 19 18 15 16 21 22 15 27 10 20 17 18Somewhat agree 20 18 21 19 23 22 18 28 20 22 19 11 19 24Somewhat disagree 20 17 18 22 23 19 17 15 24 15 24 23 19 21Strongly disagree 34 36 34 33 32 33 36 32 32 26 40 41 37 29(Neither) 4 6 5 5 2 7 4 1 4 6 3 4 6 3(Don't know/refused) 4 3 3 4 5 3 3 2 5 3 4 2 4 5Total agree 38 38 40 37 38 38 39 50 35 49 29 31 36 42Total disagree 54 53 52 55 55 52 53 47 56 42 64 64 55 50Total agree - Total disagree -16 -16 -12 -18 -17 -14 -14 3 -21 7 -35 -33 -20 -8
Q. 28 Worry About Contracting Coronavirus While VotingTotal Answering (1200) (312) (306) (247) (313) (216) (400) (83) (471) (528) (626) (111) (605) (484)Very worried 15 13 14 15 18 12 14 23 15 8 21 10 14 17Somewhat worried 28 21 27 26 40 27 23 31 34 20 36 21 30 29Not too worried 28 28 27 35 26 27 28 29 31 30 28 24 30 28Not worried at all 27 38 32 24 15 33 36 18 19 42 15 44 26 26(Don't know/refused) 1 1 0 0 1 0 1 - 1 0 1 2 1 1Very/Somewhat worried 43 34 41 41 57 40 36 53 49 27 57 31 44 45Not too/Not at all worried 56 66 59 59 41 60 63 47 50 72 42 67 55 54
Q. 29 A. Voting and Election Proposal - Extend voter registration deadlines.Total Answering (1200) (312) (306) (247) (313) (216) (400) (83) (471) (528) (626) (111) (605) (484)Support strongly 41 33 37 46 48 42 32 48 47 26 54 40 42 40Support somewhat 23 21 24 25 24 21 23 29 24 20 25 22 22 25Oppose somewhat 12 15 10 9 13 9 14 7 12 15 9 10 12 12Oppose strongly 16 24 18 12 9 18 22 13 10 28 6 20 15 16(Neither/undecided) 7 6 11 5 5 9 8 1 5 9 5 9 7 6(Don't know/refused) 2 1 1 3 2 1 1 2 2 2 1 1 1 3Total support 64 55 60 71 72 62 54 76 71 47 79 61 65 65Total oppose 27 38 28 22 22 27 36 21 22 43 15 29 27 27Total support - Total oppose 37 16 32 49 51 35 18 56 49 4 64 32 38 37
TargetSmart Communications 1155 15th St, NW, Suite 750, Washington, DC 20005 targetsmart.com
118 of 228
Page 119
May 21-27, 2020
National Voter Insights Study
TargetSmart + Dynata
Permanent Absentee Voter
Status
Ever Voted Early or By Mail
First Time Voters in 2018 2016 Vote History TargetSmart Voter Score
Total PAVNot PAV Yes No Yes No Voted
Did not Vote
Was Not
Regist ered
Super Voter
Freq uent Voter
Infreq uent Voter
Never Voted
Party ID Difference...2-3-2 PARTY ID Dem-Rep 4 16 3 1 5 4 5 2 4 17 0 1 9 73-1-3 PARTY ID Dem-Rep 7 22 5 0 9 9 7 2 8 26 -4 5 13 14
Q. 27 E. Vote Method - I don't have enough information about how to take advantage of alternatives to in-person Election Day voting.Total Answering (1200) (130) (1070) (220) (980) (176) (1024) (757) (266) (177) (221) (393) (393) (137)Strongly agree 12 12 12 10 12 12 12 11 13 12 9 12 13 15Somewhat agree 19 17 19 15 20 21 19 18 19 24 16 17 23 21Somewhat disagree 19 20 19 17 19 23 18 18 22 19 16 20 18 17Strongly disagree 39 39 39 47 37 32 40 43 29 38 50 42 33 36(Neither) 7 8 7 7 7 9 7 6 10 4 5 6 8 8(Don't know/refused) 4 4 4 5 4 5 4 4 6 4 4 4 5 3Total agree 31 29 31 25 32 32 31 29 33 36 25 28 37 36Total disagree 58 59 58 64 57 54 59 61 51 57 66 62 51 53Total agree - Total disagree -27 -30 -27 -40 -24 -22 -28 -31 -19 -21 -40 -34 -14 -17
Q. 27 F. Vote Method - I am concerned that the mail system in my state cannot be relied upon to get mail-in ballots to election officials in time for them to be counted.Total Answering (1200) (130) (1070) (220) (980) (176) (1024) (757) (266) (177) (221) (393) (393) (137)Strongly agree 17 14 18 18 17 12 18 20 16 11 14 21 19 14Somewhat agree 20 20 20 20 20 30 19 19 25 20 15 17 23 32Somewhat disagree 20 20 20 17 21 25 19 17 22 27 20 18 20 23Strongly disagree 34 39 33 36 34 23 36 37 27 32 44 36 31 25(Neither) 4 6 4 4 5 7 4 3 7 7 4 4 4 5(Don't know/refused) 4 2 4 5 4 4 4 4 4 3 3 5 4 2Total agree 38 33 38 39 38 42 37 38 40 31 29 37 42 45Total disagree 54 59 53 53 54 47 55 54 49 59 64 54 50 48Total agree - Total disagree -16 -26 -15 -15 -17 -5 -18 -16 -9 -28 -35 -17 -8 -2
Q. 28 Worry About Contracting Coronavirus While VotingTotal Answering (1200) (130) (1070) (220) (980) (176) (1024) (757) (266) (177) (221) (393) (393) (137)Very worried 15 21 14 13 15 15 15 13 21 14 13 12 18 16Somewhat worried 28 28 28 29 28 30 28 26 29 36 20 29 30 30Not too worried 28 30 28 28 28 32 28 28 31 26 31 28 26 30Not worried at all 27 21 28 28 27 21 29 32 17 23 34 30 25 24(Don't know/refused) 1 0 1 1 1 3 1 1 2 1 2 1 1 1Very/Somewhat worried 43 49 42 42 43 44 43 39 50 50 33 41 49 46Not too/Not at all worried 56 51 56 57 56 53 56 60 48 50 65 58 51 54
Q. 29 A. Voting and Election Proposal - Extend voter registration deadlines.Total Answering (1200) (130) (1070) (220) (980) (176) (1024) (757) (266) (177) (221) (393) (393) (137)Support strongly 41 45 41 40 41 31 43 40 39 50 37 41 48 34Support somewhat 23 20 24 25 23 32 22 21 31 21 19 22 22 29Oppose somewhat 12 13 11 12 11 14 11 13 10 9 15 11 9 14Oppose strongly 16 16 16 13 16 10 17 18 9 15 21 18 13 13(Neither/undecided) 7 6 7 9 6 10 6 7 8 3 6 6 6 7(Don't know/refused) 2 2 2 1 2 3 2 1 2 4 1 2 2 3Total support 64 65 64 65 64 63 64 61 70 70 56 63 71 63Total oppose 27 28 27 25 28 24 28 31 20 24 37 29 21 27Total support - Total oppose 37 37 37 40 36 39 37 30 50 46 19 34 50 36
TargetSmart Communications 1155 15th St, NW, Suite 750, Washington, DC 20005 targetsmart.com
119 of 228
Page 120
May 21-27, 2020
National Voter Insights Study
TargetSmart + Dynata
Partisan Score Presidential General Turnout Score Mode
Total 0 to 9.9 10 to 89.9 90+ 0 to 69.9 70+ Web Land line Wire less
Party ID Difference...2-3-2 PARTY ID Dem-Rep 4 -48 -4 53 4 5 3 -3 83-1-3 PARTY ID Dem-Rep 7 -55 -1 62 10 5 4 -6 15
Q. 27 E. Vote Method - I don't have enough information about how to take advantage of alternatives to in-person Election Day voting.Total Answering (1200) (302) (491) (408) (429) (771) (644) (116) (440)Strongly agree 12 13 12 12 11 12 12 9 13Somewhat agree 19 15 20 21 21 18 22 15 17Somewhat disagree 19 21 19 18 22 17 20 19 17Strongly disagree 39 43 38 38 32 43 31 47 49(Neither) 7 6 8 7 9 6 11 5 2(Don't know/refused) 4 4 5 4 6 4 6 4 2Total agree 31 28 31 33 33 30 33 24 30Total disagree 58 63 56 57 53 61 51 67 67Total agree - Total disagree -27 -35 -25 -24 -21 -31 -17 -43 -37
Q. 27 F. Vote Method - I am concerned that the mail system in my state cannot be relied upon to get mail-in ballots to election officials in time for them to be counted.Total Answering (1200) (302) (491) (408) (429) (771) (644) (116) (440)Strongly agree 17 26 17 12 18 17 16 13 20Somewhat agree 20 19 20 22 24 18 25 8 16Somewhat disagree 20 17 19 23 21 20 20 26 19Strongly disagree 34 31 34 36 28 37 26 49 42(Neither) 4 4 6 4 6 4 8 2 1(Don't know/refused) 4 3 4 4 4 4 6 2 2Total agree 38 45 37 34 42 36 41 21 37Total disagree 54 48 53 58 49 57 45 75 61Total agree - Total disagree -16 -3 -17 -25 -7 -21 -4 -53 -24
Q. 28 Worry About Contracting Coronavirus While VotingTotal Answering (1200) (302) (491) (408) (429) (771) (644) (116) (440)Very worried 15 6 15 21 18 13 17 8 14Somewhat worried 28 24 28 32 29 28 32 19 26Not too worried 28 32 27 27 29 28 31 36 23Not worried at all 27 39 29 17 22 30 19 36 37(Don't know/refused) 1 0 1 2 1 1 2 2 0Very/Somewhat worried 43 29 43 53 47 41 48 27 40Not too/Not at all worried 56 71 56 45 51 58 50 72 60
Q. 29 A. Voting and Election Proposal - Extend voter registration deadlines.Total Answering (1200) (302) (491) (408) (429) (771) (644) (116) (440)Support strongly 41 28 38 55 40 42 32 43 55Support somewhat 23 22 25 22 26 22 29 13 18Oppose somewhat 12 18 10 8 10 13 13 15 8Oppose strongly 16 24 17 8 13 17 13 28 17(Neither/undecided) 7 6 8 6 9 6 12 2 1(Don't know/refused) 2 1 1 3 3 1 2 1 1Total support 64 50 63 76 65 64 60 55 73Total oppose 27 43 28 16 23 30 26 42 26Total support - Total oppose 37 8 36 61 43 34 35 13 47
TargetSmart Communications 1155 15th St, NW, Suite 750, Washington, DC 20005 targetsmart.com
120 of 228
Page 121
May 21-27, 2020
National Voter Insights Study
TargetSmart + Dynata
2-3-2 Party 3-1-3 Party Ideology Party ID/Ideology
Total Dem Ind Rep Dem Ind Rep Lib Mod ConsLib
Dem
Mod / Cons Dem
Mod / Lib Rep
Cons Rep
Party ID Difference...2-3-2 PARTY ID Dem-Rep 4 100 - -100 73 - -75 68 6 -52 100 100 -100 -1003-1-3 PARTY ID Dem-Rep 7 100 8 -100 100 - -100 85 10 -63 100 100 -100 -100
Q. 29 B. Voting and Election Proposal - Expand access to vote-by-mail.Total Answering (1200) (415) (395) (362) (566) (124) (482) (304) (469) (368) (213) (189) (117) (239)Support strongly 47 69 47 23 69 42 24 69 48 30 70 68 25 23Support somewhat 19 15 20 20 16 21 20 16 22 16 17 13 27 17Oppose somewhat 9 6 9 13 5 11 13 6 10 12 5 7 13 13Oppose strongly 17 5 16 34 6 11 34 4 13 35 4 6 23 40(Neither/undecided) 6 4 7 9 3 16 8 4 7 7 2 6 10 7(Don't know/refused) 2 1 1 2 1 - 1 1 1 1 1 1 2 1Total support 65 84 67 43 85 63 44 86 69 46 88 81 52 39Total oppose 27 11 25 47 10 22 47 10 23 46 9 12 36 53Total support - Total oppose 39 74 42 -4 75 41 -4 76 47 0 78 69 16 -13
Q. 29 C. Voting and Election Proposal - Expand access to early voting.Total Answering (1200) (415) (395) (362) (566) (124) (482) (304) (469) (368) (213) (189) (117) (239)Support strongly 54 67 54 42 67 51 42 65 55 45 69 64 41 42Support somewhat 23 20 25 26 20 29 26 20 25 23 19 22 27 25Oppose somewhat 8 5 7 12 5 5 11 4 7 12 4 5 12 12Oppose strongly 8 4 8 14 4 6 14 3 7 15 3 5 10 15(Neither/undecided) 5 3 6 6 3 9 6 6 5 5 4 3 9 5(Don't know/refused) 2 2 1 1 1 1 1 1 1 0 2 1 1 0Total support 77 87 78 68 87 79 68 86 80 68 88 86 68 68Total oppose 16 8 15 26 9 11 25 8 14 27 7 10 22 27Total support - Total oppose 61 78 63 42 78 68 42 78 67 42 81 76 46 41
Q. 29 D. Voting and Election Proposal - Include pre-paid postage for anyone who votes by mail.Total Answering (1200) (415) (395) (362) (566) (124) (482) (304) (469) (368) (213) (189) (117) (239)Support strongly 51 67 52 34 69 41 34 69 54 36 71 63 40 31Support somewhat 19 18 20 18 17 22 19 19 19 17 20 17 17 18Oppose somewhat 7 5 6 11 5 9 10 3 8 9 2 8 13 10Oppose strongly 15 5 15 28 5 13 29 4 12 30 4 6 20 32(Neither/undecided) 6 4 7 8 4 15 7 4 6 7 3 6 9 7(Don't know/refused) 2 1 0 2 1 - 1 1 1 1 1 1 1 2Total support 70 85 72 52 86 63 53 88 73 53 90 80 56 49Total oppose 23 10 21 39 9 22 39 7 20 39 6 14 33 42Total support - Total oppose 47 74 51 12 77 41 15 81 52 14 84 65 23 7
Q. 29 E. Voting and Election Proposal - Increase the number of in-person polling places in order to minimize lines.Total Answering (1200) (415) (395) (362) (566) (124) (482) (304) (469) (368) (213) (189) (117) (239)Support strongly 49 55 46 45 55 33 46 54 48 46 58 51 45 44Support somewhat 29 25 32 33 26 34 32 27 30 32 24 25 29 35Oppose somewhat 8 8 7 9 8 11 8 9 9 7 8 9 13 7Oppose strongly 6 6 6 4 6 4 5 4 5 7 4 9 1 6(Neither/undecided) 7 4 9 9 4 17 9 6 8 7 5 4 11 8(Don't know/refused) 2 1 0 1 1 1 1 1 1 1 1 1 1 0Total support 78 80 78 78 81 67 78 81 78 78 83 76 74 79Total oppose 14 15 13 13 14 15 13 13 13 15 12 19 14 13Total support - Total oppose 64 65 65 65 68 52 65 68 65 64 71 57 60 66
TargetSmart Communications 1155 15th St, NW, Suite 750, Washington, DC 20005 targetsmart.com
121 of 228
Page 122
May 21-27, 2020
National Voter Insights Study
TargetSmart + Dynata
Party ID/Gender
Total Dem MenDem
Women Ind MenInd
Women Rep MenRep
Women
Party ID Difference...2-3-2 PARTY ID Dem-Rep 4 100 100 - - -100 -1003-1-3 PARTY ID Dem-Rep 7 100 100 1 17 -100 -100
Q. 29 B. Voting and Election Proposal - Expand access to vote-by-mail.Total Answering (1200) (157) (258) (219) (177) (186) (177)Support strongly 47 68 70 49 45 22 25Support somewhat 19 14 16 14 28 20 20Oppose somewhat 9 8 5 10 8 13 13Oppose strongly 17 6 5 20 12 34 34(Neither/undecided) 6 4 4 7 7 9 8(Don't know/refused) 2 1 1 0 1 3 0Total support 65 82 86 63 73 42 45Total oppose 27 13 9 30 19 47 47Total support - Total oppose 39 69 76 33 54 -5 -2
Q. 29 C. Voting and Election Proposal - Expand access to early voting.Total Answering (1200) (157) (258) (219) (177) (186) (177)Support strongly 54 65 68 60 46 36 49Support somewhat 23 19 20 17 34 25 27Oppose somewhat 8 6 4 7 7 15 9Oppose strongly 8 4 3 9 7 17 10(Neither/undecided) 5 5 3 6 7 7 6(Don't know/refused) 2 1 2 1 - 1 1Total support 77 84 88 77 80 60 76Total oppose 16 10 7 17 13 32 19Total support - Total oppose 61 74 81 60 67 28 57
Q. 29 D. Voting and Election Proposal - Include pre-paid postage for anyone who votes by mail.Total Answering (1200) (157) (258) (219) (177) (186) (177)Support strongly 51 57 72 53 51 31 36Support somewhat 19 19 17 15 26 18 18Oppose somewhat 7 11 2 7 5 13 10Oppose strongly 15 7 4 20 9 28 28(Neither/undecided) 6 4 4 6 8 8 7(Don't know/refused) 2 1 1 - 0 2 1Total support 70 77 90 67 77 49 54Total oppose 23 19 5 26 14 41 38Total support - Total oppose 47 58 85 41 63 9 17
Q. 29 E. Voting and Election Proposal - Increase the number of in-person polling places in order to minimize lines.Total Answering (1200) (157) (258) (219) (177) (186) (177)Support strongly 49 52 57 48 45 42 49Support somewhat 29 23 26 31 32 34 32Oppose somewhat 8 11 7 7 8 10 8Oppose strongly 6 8 5 6 6 5 3(Neither/undecided) 7 5 4 8 10 9 8(Don't know/refused) 2 1 1 1 - 1 -Total support 78 75 83 79 77 75 81Total oppose 14 19 12 12 14 15 11Total support - Total oppose 64 56 71 67 63 60 69
TargetSmart Communications 1155 15th St, NW, Suite 750, Washington, DC 20005 targetsmart.com
122 of 228
Page 123
May 21-27, 2020
National Voter Insights Study
TargetSmart + Dynata
Urbanicity
Total R1 R2 S3 S4 U5 U6 Rural Subu rban Urban
Party ID Difference...2-3-2 PARTY ID Dem-Rep 4 -23 -15 -2 9 22 42 -19 4 283-1-3 PARTY ID Dem-Rep 7 -23 -17 -1 12 26 52 -20 7 33
Q. 29 B. Voting and Election Proposal - Expand access to vote-by-mail.Total Answering (1200) (179) (181) (195) (273) (264) (108) (360) (468) (372)Support strongly 47 31 36 45 46 61 63 33 45 61Support somewhat 19 18 29 19 18 15 14 23 18 15Oppose somewhat 9 8 11 11 10 7 10 10 10 8Oppose strongly 17 33 20 20 15 10 5 27 17 9(Neither/undecided) 6 10 3 5 8 5 8 6 7 6(Don't know/refused) 2 0 1 1 3 2 1 1 2 2Total support 65 48 65 64 64 76 76 57 64 76Total oppose 27 41 32 31 25 17 15 36 28 16Total support - Total oppose 39 7 34 33 38 59 61 20 36 60
Q. 29 C. Voting and Election Proposal - Expand access to early voting.Total Answering (1200) (179) (181) (195) (273) (264) (108) (360) (468) (372)Support strongly 54 49 47 53 56 62 55 48 55 60Support somewhat 23 24 27 24 19 21 27 25 21 23Oppose somewhat 8 6 9 12 7 7 6 7 9 7Oppose strongly 8 13 13 6 7 5 6 13 7 5(Neither/undecided) 5 8 5 3 7 3 6 6 5 4(Don't know/refused) 2 - - 3 3 2 1 - 3 2Total support 77 73 73 76 75 83 82 73 76 83Total oppose 16 19 22 18 15 12 12 20 16 12Total support - Total oppose 61 55 51 58 61 71 70 53 60 71
Q. 29 D. Voting and Election Proposal - Include pre-paid postage for anyone who votes by mail.Total Answering (1200) (179) (181) (195) (273) (264) (108) (360) (468) (372)Support strongly 51 40 45 52 51 60 61 42 51 60Support somewhat 19 20 22 17 18 18 17 21 17 18Oppose somewhat 7 3 10 8 6 7 11 7 7 8Oppose strongly 15 27 20 18 13 10 2 23 15 7(Neither/undecided) 6 10 3 5 9 4 7 7 7 5(Don't know/refused) 2 - - 1 3 2 1 - 2 2Total support 70 60 66 69 69 77 78 63 69 78Total oppose 23 30 30 26 19 17 13 30 22 16Total support - Total oppose 47 30 36 43 50 61 65 33 47 62
Q. 29 E. Voting and Election Proposal - Increase the number of in-person polling places in order to minimize lines.Total Answering (1200) (179) (181) (195) (273) (264) (108) (360) (468) (372)Support strongly 49 44 39 49 49 57 52 41 49 56Support somewhat 29 31 36 31 28 25 26 34 29 25Oppose somewhat 8 9 8 9 6 9 9 9 7 9Oppose strongly 6 5 10 6 5 3 5 7 5 4(Neither/undecided) 7 10 7 5 9 5 7 9 7 5(Don't know/refused) 2 - 1 2 3 2 1 0 2 2Total support 78 75 75 79 77 82 78 75 78 80Total oppose 14 15 18 14 11 12 15 16 12 13Total support - Total oppose 64 61 57 65 66 69 63 59 66 68
TargetSmart Communications 1155 15th St, NW, Suite 750, Washington, DC 20005 targetsmart.com
123 of 228
Page 124
May 21-27, 2020
National Voter Insights Study
TargetSmart + Dynata
Urbanicity/Gender
Total Rural MenRural
WomenSubu rban
MenSubu rban Women Urban Men
Urban Women
Party ID Difference...2-3-2 PARTY ID Dem-Rep 4 -23 -15 -4 12 13 393-1-3 PARTY ID Dem-Rep 7 -28 -13 -1 15 16 48
Q. 29 B. Voting and Election Proposal - Expand access to vote-by-mail.Total Answering (1200) (180) (180) (227) (241) (164) (208)Support strongly 47 33 34 45 45 56 65Support somewhat 19 21 26 16 20 10 18Oppose somewhat 9 10 9 10 11 12 4Oppose strongly 17 32 22 18 17 12 6(Neither/undecided) 6 4 9 10 4 7 5(Don't know/refused) 2 - 1 1 3 3 1Total support 65 55 59 62 66 67 83Total oppose 27 42 31 27 28 24 11Total support - Total oppose 39 13 28 34 38 43 73
Q. 29 C. Voting and Election Proposal - Expand access to early voting.Total Answering (1200) (180) (180) (227) (241) (164) (208)Support strongly 54 48 48 54 55 57 63Support somewhat 23 23 28 20 23 18 27Oppose somewhat 8 7 7 10 8 10 4Oppose strongly 8 17 9 8 6 8 3(Neither/undecided) 5 5 8 6 4 6 2(Don't know/refused) 2 - - 3 4 2 1Total support 77 71 76 74 78 75 89Total oppose 16 24 16 18 15 18 8Total support - Total oppose 61 47 60 56 63 57 82
Q. 29 D. Voting and Election Proposal - Include pre-paid postage for anyone who votes by mail.Total Answering (1200) (180) (180) (227) (241) (164) (208)Support strongly 51 39 46 48 54 54 65Support somewhat 19 17 25 17 18 17 19Oppose somewhat 7 10 4 9 5 12 5Oppose strongly 15 30 17 16 14 10 6(Neither/undecided) 6 6 8 8 6 5 4(Don't know/refused) 2 - - 1 3 2 2Total support 70 55 71 65 72 71 83Total oppose 23 39 21 25 19 22 11Total support - Total oppose 47 16 50 40 53 48 73
Q. 29 E. Voting and Election Proposal - Increase the number of in-person polling places in order to minimize lines.Total Answering (1200) (180) (180) (227) (241) (164) (208)Support strongly 49 40 42 47 51 55 56Support somewhat 29 38 30 30 28 19 29Oppose somewhat 8 8 10 8 7 11 8Oppose strongly 6 6 9 5 5 7 1(Neither/undecided) 7 8 9 8 7 6 5(Don't know/refused) 2 1 - 2 3 2 1Total support 78 78 72 77 79 74 85Total oppose 14 14 19 13 12 18 9Total support - Total oppose 64 64 54 64 67 56 77
TargetSmart Communications 1155 15th St, NW, Suite 750, Washington, DC 20005 targetsmart.com
124 of 228
Page 125
May 21-27, 2020
National Voter Insights Study
TargetSmart + Dynata
Region by State
TotalBorder States
Califo rnia
Indust rial
Midw est
Lower Midw
estMid -
Atla ntic
Moun tain
States
Nati onal
Capi talNew
Engl and
Paci fic Northw
est SouthSouthe
ast
Upper Midw
est
Party ID Difference...2-3-2 PARTY ID Dem-Rep 4 4 19 -11 16 15 2 5 17 -7 -3 3 13-1-3 PARTY ID Dem-Rep 7 -5 27 -6 17 21 5 15 29 2 -9 8 -8
Q. 29 B. Voting and Election Proposal - Expand access to vote-by-mail.Total Answering (1200) (132) (120) (157) (60) (158) (48) (60) (60) (48) (108) (193) (48)Support strongly 47 43 55 49 56 43 64 50 32 58 39 46 38Support somewhat 19 26 16 19 18 21 11 18 28 12 13 19 11Oppose somewhat 9 8 7 7 7 11 6 9 10 8 12 11 15Oppose strongly 17 16 16 16 8 18 8 21 16 12 29 18 22(Neither/undecided) 6 6 4 8 11 6 12 - 6 8 7 5 14(Don't know/refused) 2 2 2 1 - 2 - 1 8 4 - 1 -Total support 65 69 71 68 74 64 75 68 60 69 52 65 49Total oppose 27 24 23 23 15 28 14 31 26 19 41 29 37Total support - Total oppose 39 44 48 44 59 35 61 38 34 50 11 36 12
Q. 29 C. Voting and Election Proposal - Expand access to early voting.Total Answering (1200) (132) (120) (157) (60) (158) (48) (60) (60) (48) (108) (193) (48)Support strongly 54 59 53 59 60 43 61 55 40 58 54 61 45Support somewhat 23 21 23 19 24 25 23 27 27 17 21 22 29Oppose somewhat 8 6 9 7 1 14 4 9 13 8 9 7 5Oppose strongly 8 7 8 10 5 12 5 6 8 5 10 8 6(Neither/undecided) 5 3 6 5 10 4 7 2 4 11 5 2 13(Don't know/refused) 2 3 1 - - 2 - 1 8 1 2 1 3Total support 77 81 76 78 84 68 84 82 67 76 75 82 73Total oppose 16 13 17 17 6 26 9 15 21 13 18 15 11Total support - Total oppose 61 68 60 61 77 42 75 67 47 63 57 67 63
Q. 29 D. Voting and Election Proposal - Include pre-paid postage for anyone who votes by mail.Total Answering (1200) (132) (120) (157) (60) (158) (48) (60) (60) (48) (108) (193) (48)Support strongly 51 52 58 61 50 41 55 55 36 63 48 54 35Support somewhat 19 20 15 18 16 24 24 18 30 10 13 15 24Oppose somewhat 7 9 8 5 6 12 4 7 3 7 7 7 9Oppose strongly 15 10 11 12 17 16 10 20 16 10 26 16 20(Neither/undecided) 6 7 5 5 11 6 6 - 6 10 7 6 12(Don't know/refused) 2 2 2 - - 2 1 1 8 - - 1 -Total support 70 72 73 78 66 64 79 72 67 73 60 69 60Total oppose 23 19 20 17 23 28 14 27 19 17 33 23 28Total support - Total oppose 47 53 54 61 43 36 66 46 47 56 27 46 31
Q. 29 E. Voting and Election Proposal - Increase the number of in-person polling places in order to minimize lines.Total Answering (1200) (132) (120) (157) (60) (158) (48) (60) (60) (48) (108) (193) (48)Support strongly 49 49 47 51 45 42 45 54 36 62 53 54 41Support somewhat 29 37 26 26 27 34 31 35 27 15 25 29 37Oppose somewhat 8 5 11 7 14 12 4 4 9 9 10 7 4Oppose strongly 6 1 8 7 7 6 4 4 9 1 8 4 7(Neither/undecided) 7 6 7 9 8 3 16 2 10 13 5 6 12(Don't know/refused) 2 3 2 - - 2 - 1 8 1 - 1 -Total support 78 86 73 76 72 76 76 89 64 77 78 82 78Total oppose 14 6 19 14 20 19 9 8 18 10 18 11 10Total support - Total oppose 64 80 54 62 52 58 67 81 46 67 60 72 68
TargetSmart Communications 1155 15th St, NW, Suite 750, Washington, DC 20005 targetsmart.com
125 of 228
Page 126
May 21-27, 2020
National Voter Insights Study
TargetSmart + Dynata
Gender Age
Total Men Women 18 - 34 35 - 49 50 - 64 Over 64 18 - 4950 and
over
Party ID Difference...2-3-2 PARTY ID Dem-Rep 4 -5 13 24 6 -2 -8 15 -53-1-3 PARTY ID Dem-Rep 7 -5 18 33 8 0 -10 21 -5
Q. 29 B. Voting and Election Proposal - Expand access to vote-by-mail.Total Answering (1200) (571) (629) (281) (287) (310) (295) (568) (605)Support strongly 47 45 49 55 49 39 45 52 42Support somewhat 19 16 21 21 17 20 17 19 18Oppose somewhat 9 10 8 10 9 11 6 10 9Oppose strongly 17 21 15 10 14 21 24 12 23(Neither/undecided) 6 7 6 3 9 8 7 6 7(Don't know/refused) 2 1 2 1 2 1 2 2 2Total support 65 61 70 76 66 59 62 71 60Total oppose 27 31 23 20 23 32 30 22 31Total support - Total oppose 39 30 47 56 43 26 32 50 29
Q. 29 C. Voting and Election Proposal - Expand access to early voting.Total Answering (1200) (571) (629) (281) (287) (310) (295) (568) (605)Support strongly 54 53 56 54 58 55 50 56 52Support somewhat 23 20 26 23 24 22 22 23 22Oppose somewhat 8 9 7 10 5 9 9 7 9Oppose strongly 8 11 6 5 7 9 12 6 11(Neither/undecided) 5 6 4 5 5 4 6 5 5(Don't know/refused) 2 2 2 2 2 1 2 2 1Total support 77 73 81 77 82 77 73 79 75Total oppose 16 20 13 16 11 18 20 13 19Total support - Total oppose 61 53 68 62 71 59 52 66 56
Q. 29 D. Voting and Election Proposal - Include pre-paid postage for anyone who votes by mail.Total Answering (1200) (571) (629) (281) (287) (310) (295) (568) (605)Support strongly 51 47 55 59 53 46 49 56 47Support somewhat 19 17 20 21 18 19 16 19 17Oppose somewhat 7 10 5 9 6 10 5 7 8Oppose strongly 15 19 12 5 14 18 23 10 20(Neither/undecided) 6 6 6 5 8 7 6 6 6(Don't know/refused) 2 1 2 1 2 2 1 2 2Total support 70 64 76 80 70 64 65 75 65Total oppose 23 29 17 14 20 27 28 17 28Total support - Total oppose 47 35 59 66 50 37 37 58 37
Q. 29 E. Voting and Election Proposal - Increase the number of in-person polling places in order to minimize lines.Total Answering (1200) (571) (629) (281) (287) (310) (295) (568) (605)Support strongly 49 47 50 40 56 49 50 48 50Support somewhat 29 30 29 34 25 27 31 29 29Oppose somewhat 8 9 8 13 5 10 5 9 8Oppose strongly 6 6 5 7 5 5 5 6 5(Neither/undecided) 7 7 7 6 7 7 8 7 8(Don't know/refused) 2 2 2 1 2 1 1 2 1Total support 78 77 79 73 80 76 81 77 78Total oppose 14 15 13 20 10 15 10 15 13Total support - Total oppose 64 62 67 53 70 61 71 62 66
TargetSmart Communications 1155 15th St, NW, Suite 750, Washington, DC 20005 targetsmart.com
126 of 228
Page 127
May 21-27, 2020
National Voter Insights Study
TargetSmart + Dynata
Education Homeownership status Marital status
TotalH.S. or
lessPost H.S.
4yr Coll Grad
Post Grad
Coll ege Grad uate
Total Non Coll Rent Own
Marr ied Single
Separa ted / divo rced
Wido wed
Total Unmarr
ied
Party ID Difference...2-3-2 PARTY ID Dem-Rep 4 5 -3 6 13 9 0 32 -5 -11 30 10 -6 213-1-3 PARTY ID Dem-Rep 7 3 -1 9 20 14 0 44 -6 -13 42 12 -10 29
Q. 29 B. Voting and Election Proposal - Expand access to vote-by-mail.Total Answering (1200) (210) (369) (363) (248) (610) (579) (297) (873) (618) (357) (144) (59) (560)Support strongly 47 37 42 53 53 53 40 55 44 40 60 44 41 54Support somewhat 19 22 19 17 17 17 20 21 18 18 18 21 24 20Oppose somewhat 9 7 10 10 8 9 9 11 9 10 9 7 10 8Oppose strongly 17 21 20 13 16 15 21 9 21 23 8 16 19 11(Neither/undecided) 6 12 6 5 5 5 8 4 7 7 5 9 4 6(Don't know/refused) 2 2 2 1 0 1 2 1 1 1 1 3 3 1Total support 65 59 62 70 70 70 61 75 62 58 78 65 65 73Total oppose 27 27 31 24 25 24 30 19 30 33 17 23 29 20Total support - Total oppose 39 32 31 47 46 46 31 56 33 25 61 42 36 54
Q. 29 C. Voting and Election Proposal - Expand access to early voting.Total Answering (1200) (210) (369) (363) (248) (610) (579) (297) (873) (618) (357) (144) (59) (560)Support strongly 54 51 55 53 60 56 53 54 54 51 59 59 46 57Support somewhat 23 21 22 26 21 24 22 28 22 24 22 24 26 23Oppose somewhat 8 10 9 6 6 6 10 6 8 7 8 6 16 8Oppose strongly 8 10 8 9 7 8 9 5 9 11 6 5 7 6(Neither/undecided) 5 7 5 5 5 5 5 4 5 6 4 5 3 4(Don't know/refused) 2 1 2 1 1 1 2 2 1 1 2 2 3 2Total support 77 72 77 80 80 80 75 82 76 75 81 82 72 80Total oppose 16 20 17 14 14 14 18 11 18 18 13 11 23 14Total support - Total oppose 61 53 59 65 67 66 57 71 58 57 68 72 49 67
Q. 29 D. Voting and Election Proposal - Include pre-paid postage for anyone who votes by mail.Total Answering (1200) (210) (369) (363) (248) (610) (579) (297) (873) (618) (357) (144) (59) (560)Support strongly 51 44 49 54 57 55 47 60 48 48 59 49 47 55Support somewhat 19 22 18 19 16 18 19 21 18 15 22 23 23 22Oppose somewhat 7 8 8 6 9 7 8 6 8 8 7 7 9 7Oppose strongly 15 17 18 14 12 13 18 6 19 21 6 11 16 9(Neither/undecided) 6 8 7 6 6 6 7 5 6 7 6 8 3 6(Don't know/refused) 2 2 1 1 1 1 1 1 1 1 1 3 3 2Total support 70 66 67 74 73 73 66 82 66 63 81 71 69 77Total oppose 23 24 26 20 20 20 25 12 27 29 13 18 25 15Total support - Total oppose 47 42 41 54 53 53 41 70 40 34 68 53 44 62
Q. 29 E. Voting and Election Proposal - Increase the number of in-person polling places in order to minimize lines.Total Answering (1200) (210) (369) (363) (248) (610) (579) (297) (873) (618) (357) (144) (59) (560)Support strongly 49 49 50 49 47 48 50 47 49 49 46 51 55 48Support somewhat 29 26 27 31 33 32 27 31 29 29 31 31 22 30Oppose somewhat 8 7 9 7 9 8 8 10 8 9 8 6 5 7Oppose strongly 6 8 6 4 5 4 7 5 6 5 7 2 9 6(Neither/undecided) 7 9 6 9 5 7 7 5 8 8 6 8 6 7(Don't know/refused) 2 1 2 1 1 1 2 2 1 1 1 2 3 2Total support 78 75 77 80 80 80 76 78 78 78 77 83 77 78Total oppose 14 15 15 10 14 12 15 15 13 14 16 8 14 14Total support - Total oppose 64 60 62 70 66 68 61 63 65 64 61 75 63 65
TargetSmart Communications 1155 15th St, NW, Suite 750, Washington, DC 20005 targetsmart.com
127 of 228
Page 128
May 21-27, 2020
National Voter Insights Study
TargetSmart + Dynata
Kids at home Religious attendance
Total Yes No
More than
once a week
Once a week
Once or twice a month
A few times a
year Seldom NeverFreq uent
Infreq uent
Seldom / Never
Party ID Difference...2-3-2 PARTY ID Dem-Rep 4 2 6 -10 -15 5 7 6 24 -14 6 163-1-3 PARTY ID Dem-Rep 7 5 9 -19 -17 -5 14 9 35 -17 7 24
Q. 29 B. Voting and Election Proposal - Expand access to vote-by-mail.Total Answering (1200) (301) (876) (89) (251) (121) (190) (212) (301) (340) (311) (513)Support strongly 47 47 47 39 43 36 52 43 57 42 45 52Support somewhat 19 23 17 21 14 27 19 22 17 16 22 19Oppose somewhat 9 9 10 6 14 12 11 7 6 12 11 7Oppose strongly 17 17 18 25 21 21 16 18 11 22 18 14(Neither/undecided) 6 4 7 7 7 4 3 8 7 7 4 7(Don't know/refused) 2 1 1 2 2 - 1 1 2 2 0 1Total support 65 69 65 60 56 63 70 66 74 57 67 71Total oppose 27 26 27 32 35 33 26 26 17 34 29 21Total support - Total oppose 39 44 37 28 22 30 44 40 57 24 39 50
Q. 29 C. Voting and Election Proposal - Expand access to early voting.Total Answering (1200) (301) (876) (89) (251) (121) (190) (212) (301) (340) (311) (513)Support strongly 54 57 53 58 51 46 59 55 57 52 54 56Support somewhat 23 23 23 19 23 20 24 23 25 22 23 24Oppose somewhat 8 5 9 6 10 12 7 9 5 9 9 6Oppose strongly 8 9 8 13 7 18 8 6 5 9 12 6(Neither/undecided) 5 5 5 3 6 4 2 6 6 5 2 6(Don't know/refused) 2 1 1 1 3 - - 1 2 3 - 2Total support 77 80 77 77 74 67 83 78 82 74 77 80Total oppose 16 14 17 19 17 30 15 15 10 18 21 12Total support - Total oppose 61 66 60 58 57 37 68 63 72 57 56 69
Q. 29 D. Voting and Election Proposal - Include pre-paid postage for anyone who votes by mail.Total Answering (1200) (301) (876) (89) (251) (121) (190) (212) (301) (340) (311) (513)Support strongly 51 58 49 49 50 39 61 49 55 49 52 53Support somewhat 19 18 19 16 17 30 12 20 21 17 19 20Oppose somewhat 7 8 7 7 9 5 8 9 6 8 7 7Oppose strongly 15 12 16 21 18 21 15 14 10 19 17 11(Neither/undecided) 6 3 7 5 5 5 5 8 7 5 5 7(Don't know/refused) 2 1 1 1 2 1 - 1 2 2 0 2Total support 70 76 68 65 67 69 73 69 75 66 71 73Total oppose 23 20 24 28 27 26 23 23 15 27 24 18Total support - Total oppose 47 56 45 37 40 43 50 46 60 39 47 54
Q. 29 E. Voting and Election Proposal - Increase the number of in-person polling places in order to minimize lines.Total Answering (1200) (301) (876) (89) (251) (121) (190) (212) (301) (340) (311) (513)Support strongly 49 51 48 62 48 45 54 48 44 52 50 46Support somewhat 29 28 30 24 26 38 26 34 30 26 31 32Oppose somewhat 8 8 8 5 8 4 9 7 10 7 7 9Oppose strongly 6 6 5 3 8 10 6 4 4 6 8 4(Neither/undecided) 7 6 8 5 9 3 5 6 9 8 4 8(Don't know/refused) 2 1 1 1 2 - - 1 2 2 - 1Total support 78 79 78 86 74 83 80 82 74 77 81 78Total oppose 14 14 14 8 15 15 15 11 14 13 15 13Total support - Total oppose 64 66 64 78 59 68 65 71 60 64 66 65
TargetSmart Communications 1155 15th St, NW, Suite 750, Washington, DC 20005 targetsmart.com
128 of 228
Page 129
May 21-27, 2020
National Voter Insights Study
TargetSmart + Dynata
Gender/Age Gender/Education Age/Education
TotalYoun
ger MenOlder Men
Youn ger
WomenOlder
WomenNon Coll
MenColl Men
Non Coll Women
Coll Women
Youn ger Non
CollOlder
Non Coll
Youn ger Coll
egeOlder Coll
Party ID Difference...2-3-2 PARTY ID Dem-Rep 4 7 -15 21 6 -9 -2 7 19 6 -4 22 -53-1-3 PARTY ID Dem-Rep 7 12 -19 28 8 -12 1 10 26 8 -7 31 -3
Q. 29 B. Voting and Election Proposal - Expand access to vote-by-mail.Total Answering (1200) (256) (301) (312) (304) (262) (307) (318) (304) (252) (316) (312) (285)Support strongly 47 51 39 53 44 38 50 42 57 45 36 58 49Support somewhat 19 17 15 21 21 17 15 23 19 22 19 17 17Oppose somewhat 9 10 10 9 7 10 11 9 8 10 8 9 9Oppose strongly 17 14 26 10 19 26 16 16 13 14 26 11 19(Neither/undecided) 6 7 8 5 7 8 6 8 4 7 9 4 6(Don't know/refused) 2 1 2 2 1 1 1 3 - 2 2 1 1Total support 65 68 55 74 66 56 65 65 75 67 56 75 66Total oppose 27 25 36 19 26 35 27 25 21 24 34 20 28Total support - Total oppose 39 43 19 55 40 20 38 40 54 43 22 55 38
Q. 29 C. Voting and Election Proposal - Expand access to early voting.Total Answering (1200) (256) (301) (312) (304) (262) (307) (318) (304) (252) (316) (312) (285)Support strongly 54 60 47 53 58 52 54 55 57 54 53 58 53Support somewhat 23 17 23 29 22 19 21 24 27 21 22 25 23Oppose somewhat 8 8 11 7 7 12 8 8 5 10 9 5 7Oppose strongly 8 9 12 4 9 12 10 6 6 6 11 6 10(Neither/undecided) 5 5 6 5 4 6 6 5 4 7 4 4 6(Don't know/refused) 2 2 1 3 1 1 2 2 1 1 2 2 1Total support 77 77 69 82 80 70 76 79 84 75 74 84 76Total oppose 16 17 23 10 15 23 17 14 11 17 20 11 18Total support - Total oppose 61 60 47 72 64 47 58 65 74 59 54 73 58
Q. 29 D. Voting and Election Proposal - Include pre-paid postage for anyone who votes by mail.Total Answering (1200) (256) (301) (312) (304) (262) (307) (318) (304) (252) (316) (312) (285)Support strongly 51 52 42 59 52 44 49 50 62 50 45 61 49Support somewhat 19 19 15 20 20 15 18 23 18 19 18 20 16Oppose somewhat 7 8 12 7 3 10 10 6 4 11 5 5 10Oppose strongly 15 14 23 7 17 23 16 14 10 11 23 9 17(Neither/undecided) 6 7 6 6 7 7 6 7 5 8 7 5 6(Don't know/refused) 2 1 1 2 2 1 1 2 1 1 1 1 2Total support 70 71 57 79 72 59 67 72 79 69 64 81 65Total oppose 23 22 35 14 20 33 26 19 15 22 28 14 27Total support - Total oppose 47 49 22 65 52 26 42 53 65 47 35 67 38
Q. 29 E. Voting and Election Proposal - Increase the number of in-person polling places in order to minimize lines.Total Answering (1200) (256) (301) (312) (304) (262) (307) (318) (304) (252) (316) (312) (285)Support strongly 49 49 46 47 54 50 45 50 52 47 52 49 47Support somewhat 29 29 29 29 28 25 33 28 31 24 28 33 31Oppose somewhat 8 8 10 10 6 9 8 8 7 11 6 7 9Oppose strongly 6 7 5 5 5 8 5 6 4 8 6 4 4(Neither/undecided) 7 6 9 7 7 8 7 6 7 8 7 6 9(Don't know/refused) 2 2 2 2 1 1 2 2 - 1 2 1 1Total support 78 78 75 76 82 75 78 78 82 71 80 82 78Total oppose 14 15 15 15 11 17 13 14 11 20 12 11 13Total support - Total oppose 64 63 60 61 71 58 65 64 71 51 68 71 65
TargetSmart Communications 1155 15th St, NW, Suite 750, Washington, DC 20005 targetsmart.com
129 of 228
Page 130
May 21-27, 2020
National Voter Insights Study
TargetSmart + Dynata
Marital Status/Gender Marital Status/Kids Trump Job Approval
Voting Permissions by State
Total
Marr ied
Men
Marr ied
WomenUnmarr ied Men
Unmarr ied
Women
Marr ied
with kids
Marr ied with out kids
Unmarr ied with
kids
Unmarr ied with out kids
Total appr ove
Total disapp rove All mail
Open early / mail Closed
Party ID Difference...2-3-2 PARTY ID Dem-Rep 4 -17 -5 9 30 -4 -15 19 22 -50 50 -9 4 83-1-3 PARTY ID Dem-Rep 7 -22 -4 16 39 -2 -19 22 31 -65 67 -5 9 8
Q. 29 B. Voting and Election Proposal - Expand access to vote-by-mail.Total Answering (1200) (312) (306) (247) (313) (216) (400) (83) (471) (528) (626) (111) (605) (484)Support strongly 47 39 41 50 57 46 38 49 55 22 68 54 51 39Support somewhat 19 17 19 15 23 20 17 30 18 20 17 19 16 23Oppose somewhat 9 10 10 11 7 11 10 5 9 12 7 8 9 10Oppose strongly 17 25 21 15 8 18 26 13 11 35 3 12 16 21(Neither/undecided) 6 8 7 7 5 4 9 3 5 9 4 6 7 6(Don't know/refused) 2 1 2 2 1 1 1 - 2 1 1 2 2 2Total support 65 56 60 66 79 66 54 79 73 42 85 73 67 62Total oppose 27 36 31 26 15 29 36 18 20 47 10 20 25 31Total support - Total oppose 39 20 29 40 65 37 19 61 53 -5 75 53 42 31
Q. 29 C. Voting and Election Proposal - Expand access to early voting.Total Answering (1200) (312) (306) (247) (313) (216) (400) (83) (471) (528) (626) (111) (605) (484)Support strongly 54 50 53 55 60 56 49 58 57 42 65 55 58 50Support somewhat 23 20 27 21 25 22 25 28 22 26 21 28 21 24Oppose somewhat 8 10 5 9 7 6 8 4 9 10 6 7 6 10Oppose strongly 8 14 8 7 4 10 11 6 6 14 3 3 8 9(Neither/undecided) 5 6 6 6 3 6 6 1 5 7 4 7 6 4(Don't know/refused) 2 1 1 3 2 1 1 2 2 2 1 0 1 3Total support 77 71 80 75 84 77 74 87 79 68 86 83 78 74Total oppose 16 23 13 16 11 15 20 10 14 25 9 10 15 19Total support - Total oppose 61 47 67 59 73 62 55 76 65 43 77 73 64 55
Q. 29 D. Voting and Election Proposal - Include pre-paid postage for anyone who votes by mail.Total Answering (1200) (312) (306) (247) (313) (216) (400) (83) (471) (528) (626) (111) (605) (484)Support strongly 51 45 50 48 60 56 44 65 54 33 67 54 56 45Support somewhat 19 12 18 22 22 16 15 22 23 19 18 21 16 21Oppose somewhat 7 11 6 10 4 9 8 4 7 10 5 7 7 8Oppose strongly 15 25 17 11 6 14 25 8 9 28 5 12 13 18(Neither/undecided) 6 6 7 7 5 4 8 1 6 8 5 6 6 6(Don't know/refused) 2 0 1 2 1 1 1 - 2 1 1 - 2 2Total support 70 58 69 70 83 72 59 86 76 52 85 75 72 66Total oppose 23 36 23 21 11 23 33 13 16 38 10 19 20 26Total support - Total oppose 47 22 46 49 72 49 26 74 60 14 75 56 52 40
Q. 29 E. Voting and Election Proposal - Increase the number of in-person polling places in order to minimize lines.Total Answering (1200) (312) (306) (247) (313) (216) (400) (83) (471) (528) (626) (111) (605) (484)Support strongly 49 46 52 47 49 51 48 49 48 45 52 51 50 46Support somewhat 29 30 28 30 31 28 29 29 31 33 27 30 27 31Oppose somewhat 8 9 8 8 7 7 10 11 7 6 10 7 8 9Oppose strongly 6 6 4 7 6 6 5 7 6 7 5 2 6 6(Neither/undecided) 7 8 8 7 6 7 8 4 7 9 6 9 8 5(Don't know/refused) 2 1 1 2 1 2 1 - 2 1 1 0 1 2Total support 78 76 80 76 80 80 77 78 79 77 79 82 77 78Total oppose 14 16 12 15 13 12 14 18 13 13 15 9 13 15Total support - Total oppose 64 61 68 62 67 68 63 60 66 65 64 72 64 62
TargetSmart Communications 1155 15th St, NW, Suite 750, Washington, DC 20005 targetsmart.com
130 of 228
Page 131
May 21-27, 2020
National Voter Insights Study
TargetSmart + Dynata
Permanent Absentee Voter
Status
Ever Voted Early or By Mail
First Time Voters in 2018 2016 Vote History TargetSmart Voter Score
Total PAVNot PAV Yes No Yes No Voted
Did not Vote
Was Not
Regist ered
Super Voter
Freq uent Voter
Infreq uent Voter
Never Voted
Party ID Difference...2-3-2 PARTY ID Dem-Rep 4 16 3 1 5 4 5 2 4 17 0 1 9 73-1-3 PARTY ID Dem-Rep 7 22 5 0 9 9 7 2 8 26 -4 5 13 14
Q. 29 B. Voting and Election Proposal - Expand access to vote-by-mail.Total Answering (1200) (130) (1070) (220) (980) (176) (1024) (757) (266) (177) (221) (393) (393) (137)Support strongly 47 57 45 45 47 37 49 45 50 47 49 44 52 41Support somewhat 19 17 19 13 20 29 17 16 23 23 15 18 18 27Oppose somewhat 9 8 10 11 9 9 9 10 8 8 9 11 8 8Oppose strongly 17 14 18 22 16 14 18 21 8 17 21 19 17 16(Neither/undecided) 6 2 7 8 6 11 6 6 9 4 5 7 4 8(Don't know/refused) 2 2 2 1 2 1 2 2 1 2 2 2 2 -Total support 65 75 64 58 67 66 65 62 73 69 63 62 70 68Total oppose 27 21 27 33 25 23 27 31 16 25 31 29 24 25Total support - Total oppose 39 53 37 26 42 43 38 31 57 45 33 33 45 43
Q. 29 C. Voting and Election Proposal - Expand access to early voting.Total Answering (1200) (130) (1070) (220) (980) (176) (1024) (757) (266) (177) (221) (393) (393) (137)Support strongly 54 55 54 65 52 45 56 55 53 56 54 60 55 48Support somewhat 23 24 23 20 24 25 23 23 26 18 20 20 25 24Oppose somewhat 8 7 8 4 9 12 7 6 10 11 7 7 8 11Oppose strongly 8 8 8 6 9 9 8 9 5 9 13 8 6 12(Neither/undecided) 5 6 5 4 5 6 5 5 5 3 5 4 5 3(Don't know/refused) 2 1 2 1 2 2 2 1 2 4 1 2 2 2Total support 77 79 77 85 76 69 79 78 78 73 73 80 80 71Total oppose 16 15 16 11 17 22 15 16 15 20 20 15 14 23Total support - Total oppose 61 64 61 74 58 48 63 62 63 53 53 65 66 48
Q. 29 D. Voting and Election Proposal - Include pre-paid postage for anyone who votes by mail.Total Answering (1200) (130) (1070) (220) (980) (176) (1024) (757) (266) (177) (221) (393) (393) (137)Support strongly 51 60 50 49 52 46 52 50 52 54 49 52 55 48Support somewhat 19 16 19 18 19 27 17 16 25 20 15 15 20 28Oppose somewhat 7 8 7 7 7 9 7 7 8 7 8 7 6 8Oppose strongly 15 11 16 16 15 8 17 19 8 11 22 17 13 10(Neither/undecided) 6 4 7 8 6 10 6 6 7 6 3 7 5 6(Don't know/refused) 2 2 1 2 1 1 2 2 1 2 3 2 1 -Total support 70 76 69 67 70 73 69 67 77 74 64 67 75 76Total oppose 23 19 23 24 22 17 24 26 15 19 30 25 18 18Total support - Total oppose 47 57 46 44 48 56 46 41 62 55 34 43 57 58
Q. 29 E. Voting and Election Proposal - Increase the number of in-person polling places in order to minimize lines.Total Answering (1200) (130) (1070) (220) (980) (176) (1024) (757) (266) (177) (221) (393) (393) (137)Support strongly 49 47 49 52 48 41 50 51 41 51 48 54 48 46Support somewhat 29 31 29 30 29 33 29 28 33 29 30 26 31 33Oppose somewhat 8 8 8 6 9 8 8 7 12 7 8 7 9 6Oppose strongly 6 6 5 3 6 9 5 5 6 6 6 5 5 9(Neither/undecided) 7 6 7 9 7 8 7 7 8 5 8 8 5 5(Don't know/refused) 2 2 2 1 2 2 2 1 1 3 1 1 2 1Total support 78 78 78 82 77 74 79 79 74 80 78 80 80 79Total oppose 14 14 14 8 15 17 13 13 17 13 14 11 14 15Total support - Total oppose 64 64 64 74 62 57 66 66 57 67 64 69 66 64
TargetSmart Communications 1155 15th St, NW, Suite 750, Washington, DC 20005 targetsmart.com
131 of 228
Page 132
May 21-27, 2020
National Voter Insights Study
TargetSmart + Dynata
Partisan Score Presidential General Turnout Score Mode
Total 0 to 9.9 10 to 89.9 90+ 0 to 69.9 70+ Web Land line Wire less
Party ID Difference...2-3-2 PARTY ID Dem-Rep 4 -48 -4 53 4 5 3 -3 83-1-3 PARTY ID Dem-Rep 7 -55 -1 62 10 5 4 -6 15
Q. 29 B. Voting and Election Proposal - Expand access to vote-by-mail.Total Answering (1200) (302) (491) (408) (429) (771) (644) (116) (440)Support strongly 47 30 43 64 44 48 40 44 57Support somewhat 19 19 20 16 22 17 23 15 13Oppose somewhat 9 12 10 6 8 10 11 6 8Oppose strongly 17 32 17 7 15 19 14 27 20(Neither/undecided) 6 6 8 5 9 5 10 6 1(Don't know/refused) 2 1 1 2 2 1 2 1 1Total support 65 49 63 80 66 65 63 60 70Total oppose 27 44 27 13 23 29 25 33 28Total support - Total oppose 39 5 36 67 43 36 38 27 43
Q. 29 C. Voting and Election Proposal - Expand access to early voting.Total Answering (1200) (302) (491) (408) (429) (771) (644) (116) (440)Support strongly 54 45 53 63 49 57 47 58 65Support somewhat 23 23 26 19 27 21 29 20 16Oppose somewhat 8 11 8 5 10 7 10 4 7Oppose strongly 8 14 6 6 6 10 5 16 11(Neither/undecided) 5 5 6 4 5 5 8 1 1(Don't know/refused) 2 1 1 3 3 1 2 1 1Total support 77 68 78 82 76 78 75 78 80Total oppose 16 26 15 11 16 16 15 20 17Total support - Total oppose 61 43 64 72 61 61 60 57 63
Q. 29 D. Voting and Election Proposal - Include pre-paid postage for anyone who votes by mail.Total Answering (1200) (302) (491) (408) (429) (771) (644) (116) (440)Support strongly 51 36 48 66 50 52 43 53 63Support somewhat 19 18 21 15 24 16 23 17 12Oppose somewhat 7 8 8 6 8 7 9 4 6Oppose strongly 15 28 15 7 10 18 13 24 16(Neither/undecided) 6 8 7 4 7 6 10 1 2(Don't know/refused) 2 2 1 2 2 1 2 2 0Total support 70 54 70 81 73 68 66 70 75Total oppose 23 37 23 12 18 25 22 27 22Total support - Total oppose 47 18 47 69 55 43 44 43 53
Q. 29 E. Voting and Election Proposal - Increase the number of in-person polling places in order to minimize lines.Total Answering (1200) (302) (491) (408) (429) (771) (644) (116) (440)Support strongly 49 45 46 55 43 52 34 65 66Support somewhat 29 32 32 23 32 28 36 22 20Oppose somewhat 8 7 8 9 9 8 11 5 6Oppose strongly 6 6 6 5 7 5 6 6 5(Neither/undecided) 7 9 7 6 7 7 11 3 2(Don't know/refused) 2 1 1 3 2 1 2 0 1Total support 78 77 78 78 75 80 71 87 86Total oppose 14 12 14 14 16 12 16 10 11Total support - Total oppose 64 65 64 64 58 68 54 77 76
TargetSmart Communications 1155 15th St, NW, Suite 750, Washington, DC 20005 targetsmart.com
132 of 228
Page 133
May 21-27, 2020
National Voter Insights Study
TargetSmart + Dynata
2-3-2 Party 3-1-3 Party Ideology Party ID/Ideology
Total Dem Ind Rep Dem Ind Rep Lib Mod ConsLib
Dem
Mod / Cons Dem
Mod / Lib Rep
Cons Rep
Party ID Difference...2-3-2 PARTY ID Dem-Rep 4 100 - -100 73 - -75 68 6 -52 100 100 -100 -1003-1-3 PARTY ID Dem-Rep 7 100 8 -100 100 - -100 85 10 -63 100 100 -100 -100
Q. 29 F. Voting and Election Proposal - Implement drive-through voting that will let voters cast their votes at precinct locations without leaving their vehicles.Total Answering (1200) (415) (395) (362) (566) (124) (482) (304) (469) (368) (213) (189) (117) (239)Support strongly 44 56 43 31 56 40 31 60 42 33 62 50 39 26Support somewhat 29 28 29 31 28 28 31 27 31 29 28 28 30 33Oppose somewhat 9 7 7 13 6 5 12 3 10 12 4 11 15 12Oppose strongly 10 3 11 16 4 10 17 3 8 19 2 5 7 21(Neither/undecided) 7 4 10 7 4 17 7 6 7 7 3 5 7 7(Don't know/refused) 2 2 1 1 2 - 1 1 1 1 1 1 2 1Total support 73 85 72 63 84 68 62 86 74 62 90 78 68 59Total oppose 18 10 18 29 10 15 30 7 18 31 6 16 22 33Total support - Total oppose 55 74 54 34 74 53 33 80 56 31 84 62 46 26
Q. 30 Alternatives to In-Person VotingTotal Answering (1200) (415) (395) (362) (566) (124) (482) (304) (469) (368) (213) (189) (117) (239)Very important 48 65 47 32 66 41 30 67 50 32 70 61 42 26Somewhat important 29 24 31 31 25 30 33 25 31 30 22 26 31 32Not that important 13 8 13 19 6 22 18 6 15 16 5 11 23 18Not important at all 8 2 9 17 1 5 18 2 5 20 2 2 5 22(Don't know/refused) 2 1 1 2 1 2 1 1 1 2 1 1 - 3Very/Somewhat important 77 89 78 63 91 71 63 91 80 62 91 87 72 58Not that important/not at all 21 9 21 36 8 27 36 7 19 36 7 12 28 40
Q. 31 Additional Federal Funding for Election AdministrationTotal Answering (1200) (415) (395) (362) (566) (124) (482) (304) (469) (368) (213) (189) (117) (239)Very important 45 61 45 26 63 40 25 63 46 29 65 57 35 21Somewhat important 30 29 30 32 29 33 31 27 34 28 26 32 35 31Not that important 13 7 12 23 7 15 22 6 12 22 6 10 16 26Not important at all 10 2 11 18 2 10 19 2 7 20 2 2 11 21(Don't know/refused) 3 1 2 3 1 3 2 2 1 2 1 - 3 2Very/Somewhat important 75 90 75 58 91 72 57 90 80 57 91 89 71 51Not that/Not at all important 23 9 23 40 8 25 41 9 19 42 8 11 27 47
Q. 32 A. Coronavirus Voting Statements - We should not allow the coronavirus outbreak to prevent eligible citizens from voting safely in the 2020 elections.Total Answering (1200) (415) (395) (362) (566) (124) (482) (304) (469) (368) (213) (189) (117) (239)Strongly agree 64 68 64 62 70 52 63 73 59 66 75 62 51 67Somewhat agree 19 16 21 21 16 21 22 15 22 20 15 17 27 19Somewhat disagree 7 6 6 8 5 14 6 2 9 7 3 11 9 7Strongly disagree 5 7 3 3 6 4 3 4 5 3 4 9 6 2(Neither) 6 3 6 6 3 10 6 5 4 5 3 2 8 6(Don't know/refused) - - - - - - - - - - - - - -Total agree 83 84 85 83 86 73 85 89 81 85 90 79 78 85Total disagree 11 13 9 11 11 17 9 6 15 9 7 20 15 9Total agree - Total disagree 72 71 76 72 75 56 75 83 67 76 83 59 63 76
TargetSmart Communications 1155 15th St, NW, Suite 750, Washington, DC 20005 targetsmart.com
133 of 228
Page 134
May 21-27, 2020
National Voter Insights Study
TargetSmart + Dynata
Party ID/Gender
Total Dem MenDem
Women Ind MenInd
Women Rep MenRep
Women
Party ID Difference...2-3-2 PARTY ID Dem-Rep 4 100 100 - - -100 -1003-1-3 PARTY ID Dem-Rep 7 100 100 1 17 -100 -100
Q. 29 F. Voting and Election Proposal - Implement drive-through voting that will let voters cast their votes at precinct locations without leaving their vehicles.Total Answering (1200) (157) (258) (219) (177) (186) (177)Support strongly 44 54 58 44 41 25 38Support somewhat 29 30 27 26 33 32 31Oppose somewhat 9 9 5 6 8 14 11Oppose strongly 10 4 3 14 8 18 14(Neither/undecided) 7 3 4 11 10 8 6(Don't know/refused) 2 1 2 - 1 2 1Total support 73 84 85 70 74 57 69Total oppose 18 13 8 20 15 33 25Total support - Total oppose 55 71 77 50 59 25 44
Q. 30 Alternatives to In-Person VotingTotal Answering (1200) (157) (258) (219) (177) (186) (177)Very important 48 61 67 46 47 28 36Somewhat important 29 25 24 26 37 26 37Not that important 13 11 6 14 11 25 13Not important at all 8 2 2 13 3 20 13(Don't know/refused) 2 0 2 1 2 2 2Very/Somewhat important 77 86 91 72 85 54 73Not that important/not at all 21 13 7 27 14 45 26
Q. 31 Additional Federal Funding for Election AdministrationTotal Answering (1200) (157) (258) (219) (177) (186) (177)Very important 45 59 63 48 41 23 29Somewhat important 30 28 30 23 39 33 30Not that important 13 9 6 13 12 23 22Not important at all 10 5 0 15 6 20 15(Don't know/refused) 3 - 1 2 1 1 4Very/Somewhat important 75 86 92 71 80 56 59Not that/Not at all important 23 14 6 27 19 43 37
Q. 32 A. Coronavirus Voting Statements - We should not allow the coronavirus outbreak to prevent eligible citizens from voting safely in the 2020 elections.Total Answering (1200) (157) (258) (219) (177) (186) (177)Strongly agree 64 62 72 68 59 60 64Somewhat agree 19 19 14 18 25 22 20Somewhat disagree 7 6 7 4 7 9 6Strongly disagree 5 11 4 4 3 3 4(Neither) 6 3 3 6 7 6 7(Don't know/refused) - - - - - - -Total agree 83 81 86 86 83 82 84Total disagree 11 16 11 8 11 11 10Total agree - Total disagree 72 64 75 78 73 71 74
TargetSmart Communications 1155 15th St, NW, Suite 750, Washington, DC 20005 targetsmart.com
134 of 228
Page 135
May 21-27, 2020
National Voter Insights Study
TargetSmart + Dynata
Urbanicity
Total R1 R2 S3 S4 U5 U6 Rural Subu rban Urban
Party ID Difference...2-3-2 PARTY ID Dem-Rep 4 -23 -15 -2 9 22 42 -19 4 283-1-3 PARTY ID Dem-Rep 7 -23 -17 -1 12 26 52 -20 7 33
Q. 29 F. Voting and Election Proposal - Implement drive-through voting that will let voters cast their votes at precinct locations without leaving their vehicles.Total Answering (1200) (179) (181) (195) (273) (264) (108) (360) (468) (372)Support strongly 44 35 33 46 43 54 47 34 44 52Support somewhat 29 31 39 30 27 24 33 35 28 26Oppose somewhat 9 7 11 11 9 8 4 9 10 7Oppose strongly 10 16 12 9 10 7 5 14 9 7(Neither/undecided) 7 11 5 4 9 4 9 8 7 6(Don't know/refused) 2 - 1 1 3 3 3 0 2 3Total support 73 66 72 75 70 77 80 69 72 78Total oppose 18 23 22 20 19 16 8 23 19 13Total support - Total oppose 55 43 50 56 51 62 72 46 53 65
Q. 30 Alternatives to In-Person VotingTotal Answering (1200) (179) (181) (195) (273) (264) (108) (360) (468) (372)Very important 48 38 42 50 47 57 53 40 48 56Somewhat important 29 31 36 27 27 25 30 34 27 26Not that important 13 14 11 13 15 11 10 13 14 11Not important at all 8 14 12 7 8 5 6 13 8 6(Don't know/refused) 2 3 - 3 4 2 1 2 3 2Very/Somewhat important 77 70 77 77 73 82 83 74 75 83Not that important/not at all 21 27 23 20 23 16 16 25 22 16
Q. 31 Additional Federal Funding for Election AdministrationTotal Answering (1200) (179) (181) (195) (273) (264) (108) (360) (468) (372)Very important 45 37 38 44 44 52 54 38 44 52Somewhat important 30 33 34 34 26 29 26 33 29 28Not that important 13 12 14 14 17 11 10 13 16 11Not important at all 10 13 14 5 10 8 8 13 8 8(Don't know/refused) 3 5 0 3 3 1 2 3 3 2Very/Somewhat important 75 70 72 78 69 80 80 71 73 80Not that/Not at all important 23 25 28 19 28 19 18 27 24 18
Q. 32 A. Coronavirus Voting Statements - We should not allow the coronavirus outbreak to prevent eligible citizens from voting safely in the 2020 elections.Total Answering (1200) (179) (181) (195) (273) (264) (108) (360) (468) (372)Strongly agree 64 67 62 69 61 66 57 64 65 64Somewhat agree 19 18 25 14 17 18 26 22 16 21Somewhat disagree 7 6 5 8 7 6 9 5 7 7Strongly disagree 5 6 4 4 6 4 3 5 5 3(Neither) 6 3 4 5 9 6 5 3 7 6(Don't know/refused) - - - - - - - - - -Total agree 83 85 87 83 78 84 84 86 81 84Total disagree 11 12 9 12 13 10 12 11 12 10Total agree - Total disagree 72 73 79 71 66 75 72 76 68 74
TargetSmart Communications 1155 15th St, NW, Suite 750, Washington, DC 20005 targetsmart.com
135 of 228
Page 136
May 21-27, 2020
National Voter Insights Study
TargetSmart + Dynata
Urbanicity/Gender
Total Rural MenRural
WomenSubu rban
MenSubu rban Women Urban Men
Urban Women
Party ID Difference...2-3-2 PARTY ID Dem-Rep 4 -23 -15 -4 12 13 393-1-3 PARTY ID Dem-Rep 7 -28 -13 -1 15 16 48
Q. 29 F. Voting and Election Proposal - Implement drive-through voting that will let voters cast their votes at precinct locations without leaving their vehicles.Total Answering (1200) (180) (180) (227) (241) (164) (208)Support strongly 44 36 33 41 48 45 57Support somewhat 29 29 40 30 26 27 26Oppose somewhat 9 11 6 9 11 9 5Oppose strongly 10 18 10 11 8 9 5(Neither/undecided) 7 6 10 9 5 8 5(Don't know/refused) 2 - 1 1 3 2 3Total support 73 65 73 71 73 72 83Total oppose 18 29 17 20 18 18 10Total support - Total oppose 55 37 56 51 55 54 73
Q. 30 Alternatives to In-Person VotingTotal Answering (1200) (180) (180) (227) (241) (164) (208)Very important 48 36 44 45 51 51 60Somewhat important 29 31 36 26 28 22 30Not that important 13 15 10 16 13 19 4Not important at all 8 18 7 11 5 8 4(Don't know/refused) 2 0 3 3 4 1 2Very/Somewhat important 77 67 80 71 79 73 90Not that important/not at all 21 33 17 27 17 26 8
Q. 31 Additional Federal Funding for Election AdministrationTotal Answering (1200) (180) (180) (227) (241) (164) (208)Very important 45 34 41 43 45 51 54Somewhat important 30 32 34 30 29 20 34Not that important 13 14 13 15 17 16 6Not important at all 10 19 8 11 6 11 5(Don't know/refused) 3 1 5 2 4 1 2Very/Somewhat important 75 67 75 72 74 71 87Not that/Not at all important 23 33 21 26 22 27 11
Q. 32 A. Coronavirus Voting Statements - We should not allow the coronavirus outbreak to prevent eligible citizens from voting safely in the 2020 elections.Total Answering (1200) (180) (180) (227) (241) (164) (208)Strongly agree 64 69 60 63 66 57 69Somewhat agree 19 21 23 16 16 25 17Somewhat disagree 7 3 8 7 8 8 6Strongly disagree 5 5 5 6 4 4 3(Neither) 6 2 5 7 7 6 6(Don't know/refused) - - - - - - -Total agree 83 89 83 79 82 82 86Total disagree 11 8 13 14 11 12 8Total agree - Total disagree 72 81 70 66 71 70 77
TargetSmart Communications 1155 15th St, NW, Suite 750, Washington, DC 20005 targetsmart.com
136 of 228
Page 137
May 21-27, 2020
National Voter Insights Study
TargetSmart + Dynata
Region by State
TotalBorder States
Califo rnia
Indust rial
Midw est
Lower Midw
estMid -
Atla ntic
Moun tain
States
Nati onal
Capi talNew
Engl and
Paci fic Northw
est SouthSouthe
ast
Upper Midw
est
Party ID Difference...2-3-2 PARTY ID Dem-Rep 4 4 19 -11 16 15 2 5 17 -7 -3 3 13-1-3 PARTY ID Dem-Rep 7 -5 27 -6 17 21 5 15 29 2 -9 8 -8
Q. 29 F. Voting and Election Proposal - Implement drive-through voting that will let voters cast their votes at precinct locations without leaving their vehicles.Total Answering (1200) (132) (120) (157) (60) (158) (48) (60) (60) (48) (108) (193) (48)Support strongly 44 47 45 47 45 44 41 47 36 50 36 46 31Support somewhat 29 25 32 28 27 31 34 33 26 21 32 30 36Oppose somewhat 9 13 8 5 7 8 3 8 11 10 8 10 8Oppose strongly 10 8 7 10 9 11 15 9 8 5 17 9 12(Neither/undecided) 7 5 8 7 12 5 7 3 11 10 8 4 13(Don't know/refused) 2 2 2 2 - 2 - 1 8 5 - 1 -Total support 73 71 76 75 72 75 74 79 62 71 68 76 67Total oppose 18 21 15 16 16 19 18 17 18 15 25 19 20Total support - Total oppose 55 50 62 60 56 56 56 62 44 56 43 57 47
Q. 30 Alternatives to In-Person VotingTotal Answering (1200) (132) (120) (157) (60) (158) (48) (60) (60) (48) (108) (193) (48)Very important 48 50 52 49 44 43 45 55 30 62 53 49 45Somewhat important 29 31 27 29 38 27 31 21 42 15 25 29 30Not that important 13 11 13 11 10 18 19 5 14 9 9 14 16Not important at all 8 7 8 11 7 9 1 18 3 8 10 6 10(Don't know/refused) 2 2 - - 2 2 4 1 11 6 3 3 -Very/Somewhat important 77 81 80 78 81 70 75 77 71 77 78 77 74Not that important/not at all 21 17 20 22 17 27 21 22 18 17 19 20 26
Q. 31 Additional Federal Funding for Election AdministrationTotal Answering (1200) (132) (120) (157) (60) (158) (48) (60) (60) (48) (108) (193) (48)Very important 45 42 48 52 41 40 44 56 37 47 50 41 38Somewhat important 30 36 29 24 31 34 32 18 36 24 27 32 27Not that important 13 14 12 12 18 17 12 9 15 10 14 13 18Not important at all 10 7 12 10 10 7 12 14 6 17 7 9 15(Don't know/refused) 3 2 - 2 - 2 1 4 6 2 3 5 2Very/Somewhat important 75 78 77 76 72 74 76 74 73 71 77 73 65Not that/Not at all important 23 21 23 22 28 24 23 22 21 27 20 22 33
Q. 32 A. Coronavirus Voting Statements - We should not allow the coronavirus outbreak to prevent eligible citizens from voting safely in the 2020 elections.Total Answering (1200) (132) (120) (157) (60) (158) (48) (60) (60) (48) (108) (193) (48)Strongly agree 64 62 67 66 66 61 73 64 52 74 67 64 60Somewhat agree 19 22 15 19 19 26 12 22 34 11 17 15 11Somewhat disagree 7 4 10 6 10 6 9 4 5 5 4 8 16Strongly disagree 5 7 3 5 2 3 1 4 - 4 8 7 2(Neither) 6 6 6 4 3 5 5 6 10 6 4 6 11(Don't know/refused) - - - - - - - - - - - - -Total agree 83 84 82 85 85 87 86 86 86 85 83 79 71Total disagree 11 11 13 11 12 8 9 8 5 9 12 15 18Total agree - Total disagree 72 73 69 74 73 79 76 78 81 76 71 65 53
TargetSmart Communications 1155 15th St, NW, Suite 750, Washington, DC 20005 targetsmart.com
137 of 228
Page 138
May 21-27, 2020
National Voter Insights Study
TargetSmart + Dynata
Gender Age
Total Men Women 18 - 34 35 - 49 50 - 64 Over 64 18 - 4950 and
over
Party ID Difference...2-3-2 PARTY ID Dem-Rep 4 -5 13 24 6 -2 -8 15 -53-1-3 PARTY ID Dem-Rep 7 -5 18 33 8 0 -10 21 -5
Q. 29 F. Voting and Election Proposal - Implement drive-through voting that will let voters cast their votes at precinct locations without leaving their vehicles.Total Answering (1200) (571) (629) (281) (287) (310) (295) (568) (605)Support strongly 44 41 47 45 48 41 40 47 41Support somewhat 29 29 30 33 28 29 28 30 29Oppose somewhat 9 10 8 10 9 8 8 9 8Oppose strongly 10 13 7 7 7 13 12 7 12(Neither/undecided) 7 7 6 4 7 6 10 5 8(Don't know/refused) 2 1 3 1 2 2 2 2 2Total support 73 70 76 78 75 71 68 77 70Total oppose 18 22 15 17 16 21 20 16 21Total support - Total oppose 55 48 61 62 60 50 48 61 49
Q. 30 Alternatives to In-Person VotingTotal Answering (1200) (571) (629) (281) (287) (310) (295) (568) (605)Very important 48 44 52 48 51 47 46 50 47Somewhat important 29 26 31 31 28 27 28 30 27Not that important 13 17 9 15 10 12 14 13 13Not important at all 8 12 5 4 8 12 10 6 11(Don't know/refused) 2 2 3 2 2 2 3 2 2Very/Somewhat important 77 70 83 79 79 74 74 79 74Not that important/not at all 21 29 14 19 19 24 23 19 24
Q. 31 Additional Federal Funding for Election AdministrationTotal Answering (1200) (571) (629) (281) (287) (310) (295) (568) (605)Very important 45 42 47 46 46 46 40 46 43Somewhat important 30 28 32 32 33 24 32 33 28Not that important 13 15 12 15 12 16 12 13 14Not important at all 10 13 6 4 7 13 15 5 14(Don't know/refused) 3 2 3 2 3 2 2 3 2Very/Somewhat important 75 70 79 79 79 69 72 79 70Not that/Not at all important 23 28 18 19 18 28 26 19 27
Q. 32 A. Coronavirus Voting Statements - We should not allow the coronavirus outbreak to prevent eligible citizens from voting safely in the 2020 elections.Total Answering (1200) (571) (629) (281) (287) (310) (295) (568) (605)Strongly agree 64 63 65 52 69 62 73 61 67Somewhat agree 19 20 18 23 15 22 17 19 19Somewhat disagree 7 6 7 11 6 7 2 9 5Strongly disagree 5 5 4 7 3 4 4 5 4(Neither) 6 5 6 7 6 6 4 6 5(Don't know/refused) - - - - - - - - -Total agree 83 83 83 75 85 83 90 80 87Total disagree 11 12 11 19 9 11 6 14 9Total agree - Total disagree 72 72 73 56 75 73 84 66 78
TargetSmart Communications 1155 15th St, NW, Suite 750, Washington, DC 20005 targetsmart.com
138 of 228
Page 139
May 21-27, 2020
National Voter Insights Study
TargetSmart + Dynata
Education Homeownership status Marital status
TotalH.S. or
lessPost H.S.
4yr Coll Grad
Post Grad
Coll ege Grad uate
Total Non Coll Rent Own
Marr ied Single
Separa ted / divo rced
Wido wed
Total Unmarr
ied
Party ID Difference...2-3-2 PARTY ID Dem-Rep 4 5 -3 6 13 9 0 32 -5 -11 30 10 -6 213-1-3 PARTY ID Dem-Rep 7 3 -1 9 20 14 0 44 -6 -13 42 12 -10 29
Q. 29 F. Voting and Election Proposal - Implement drive-through voting that will let voters cast their votes at precinct locations without leaving their vehicles.Total Answering (1200) (210) (369) (363) (248) (610) (579) (297) (873) (618) (357) (144) (59) (560)Support strongly 44 38 43 47 46 47 41 51 41 39 49 51 41 49Support somewhat 29 31 27 28 33 30 28 27 30 30 30 24 33 29Oppose somewhat 9 9 10 9 7 8 9 7 9 10 8 5 9 8Oppose strongly 10 13 14 7 6 7 13 6 11 13 7 6 9 7(Neither/undecided) 7 8 5 8 7 7 6 6 7 7 5 12 4 7(Don't know/refused) 2 1 2 1 1 1 2 2 2 1 1 3 3 2Total support 73 69 70 75 79 77 69 79 71 69 79 75 74 77Total oppose 18 21 23 16 13 15 23 13 21 22 15 11 18 14Total support - Total oppose 55 48 47 59 66 62 47 65 51 47 64 64 56 63
Q. 30 Alternatives to In-Person VotingTotal Answering (1200) (210) (369) (363) (248) (610) (579) (297) (873) (618) (357) (144) (59) (560)Very important 48 47 46 49 53 51 46 58 45 42 57 53 47 55Somewhat important 29 32 28 28 28 28 30 26 30 32 27 23 32 26Not that important 13 10 14 13 12 13 13 12 13 14 11 14 11 12Not important at all 8 9 9 9 6 8 9 2 10 11 4 8 5 5(Don't know/refused) 2 3 3 1 1 1 3 1 2 1 1 2 4 2Very/Somewhat important 77 79 74 77 81 79 76 85 75 74 84 76 80 81Not that important/not at all 21 19 23 22 18 21 22 14 23 25 15 22 16 17
Q. 31 Additional Federal Funding for Election AdministrationTotal Answering (1200) (210) (369) (363) (248) (610) (579) (297) (873) (618) (357) (144) (59) (560)Very important 45 47 42 44 49 46 44 52 42 39 55 45 44 51Somewhat important 30 32 31 30 28 29 31 33 29 31 28 33 32 29Not that important 13 10 16 15 10 13 14 10 15 16 11 13 11 12Not important at all 10 9 8 11 10 11 9 4 11 13 5 6 12 6(Don't know/refused) 3 3 3 1 2 1 3 1 2 1 2 3 1 2Very/Somewhat important 75 79 73 73 78 75 75 85 72 70 82 77 77 80Not that/Not at all important 23 19 25 26 21 24 22 14 27 28 16 20 22 18
Q. 32 A. Coronavirus Voting Statements - We should not allow the coronavirus outbreak to prevent eligible citizens from voting safely in the 2020 elections.Total Answering (1200) (210) (369) (363) (248) (610) (579) (297) (873) (618) (357) (144) (59) (560)Strongly agree 64 55 64 66 70 68 61 60 66 65 61 67 67 63Somewhat agree 19 27 15 21 16 19 19 20 19 19 20 18 16 19Somewhat disagree 7 8 7 6 5 6 7 8 6 6 8 5 8 7Strongly disagree 5 4 8 3 4 3 6 8 4 4 7 5 3 6(Neither) 6 6 7 5 5 5 6 5 6 6 5 5 7 5(Don't know/refused) - - - - - - - - - - - - - -Total agree 83 82 79 87 86 87 80 80 85 84 81 85 84 83Total disagree 11 12 14 9 9 9 14 16 10 10 14 10 10 13Total agree - Total disagree 72 70 65 78 78 78 67 64 75 74 67 76 74 70
TargetSmart Communications 1155 15th St, NW, Suite 750, Washington, DC 20005 targetsmart.com
139 of 228
Page 140
May 21-27, 2020
National Voter Insights Study
TargetSmart + Dynata
Kids at home Religious attendance
Total Yes No
More than
once a week
Once a week
Once or twice a month
A few times a
year Seldom NeverFreq uent
Infreq uent
Seldom / Never
Party ID Difference...2-3-2 PARTY ID Dem-Rep 4 2 6 -10 -15 5 7 6 24 -14 6 163-1-3 PARTY ID Dem-Rep 7 5 9 -19 -17 -5 14 9 35 -17 7 24
Q. 29 F. Voting and Election Proposal - Implement drive-through voting that will let voters cast their votes at precinct locations without leaving their vehicles.Total Answering (1200) (301) (876) (89) (251) (121) (190) (212) (301) (340) (311) (513)Support strongly 44 46 43 46 41 38 51 40 44 43 46 42Support somewhat 29 29 30 27 27 30 31 28 33 27 31 31Oppose somewhat 9 9 9 7 12 10 7 10 6 11 8 8Oppose strongly 10 10 10 15 10 17 8 10 7 11 12 9(Neither/undecided) 7 6 7 4 7 4 3 12 7 6 3 9(Don't know/refused) 2 1 2 2 3 0 1 1 2 3 1 1Total support 73 74 73 73 69 68 82 67 77 70 76 73Total oppose 18 19 19 22 22 27 15 20 13 22 20 16Total support - Total oppose 55 55 54 51 47 41 67 47 64 48 57 57
Q. 30 Alternatives to In-Person VotingTotal Answering (1200) (301) (876) (89) (251) (121) (190) (212) (301) (340) (311) (513)Very important 48 49 48 43 45 43 52 43 57 44 49 51Somewhat important 29 30 29 36 26 28 31 34 26 28 30 29Not that important 13 12 13 12 16 13 12 13 12 15 12 12Not important at all 8 7 8 9 11 16 6 8 5 10 10 6(Don't know/refused) 2 2 2 - 4 1 - 2 1 3 1 1Very/Somewhat important 77 79 77 79 70 71 83 77 83 72 78 81Not that important/not at all 21 20 21 21 27 28 17 21 16 25 22 18
Q. 31 Additional Federal Funding for Election AdministrationTotal Answering (1200) (301) (876) (89) (251) (121) (190) (212) (301) (340) (311) (513)Very important 45 45 45 48 42 31 50 46 49 44 42 48Somewhat important 30 34 29 21 27 33 26 35 33 26 29 33Not that important 13 12 14 14 18 16 15 11 11 17 15 11Not important at all 10 8 10 17 11 18 8 7 6 13 12 7(Don't know/refused) 3 1 2 0 2 2 1 3 1 2 2 2Very/Somewhat important 75 79 74 69 69 65 76 80 82 69 72 81Not that/Not at all important 23 20 24 31 29 34 23 18 17 29 27 18
Q. 32 A. Coronavirus Voting Statements - We should not allow the coronavirus outbreak to prevent eligible citizens from voting safely in the 2020 elections.Total Answering (1200) (301) (876) (89) (251) (121) (190) (212) (301) (340) (311) (513)Strongly agree 64 64 64 67 69 63 64 60 63 69 63 62Somewhat agree 19 18 20 20 19 17 19 19 20 19 18 20Somewhat disagree 7 7 6 3 5 8 8 6 7 4 8 7Strongly disagree 5 6 4 3 3 5 6 5 5 3 6 5(Neither) 6 5 6 7 4 7 4 9 5 5 5 7(Don't know/refused) - - - - - - - - - - - -Total agree 83 82 84 87 88 80 82 80 83 88 81 81Total disagree 11 13 11 6 8 14 14 12 12 8 14 12Total agree - Total disagree 72 69 73 81 80 67 68 68 70 81 68 69
TargetSmart Communications 1155 15th St, NW, Suite 750, Washington, DC 20005 targetsmart.com
140 of 228
Page 141
May 21-27, 2020
National Voter Insights Study
TargetSmart + Dynata
Gender/Age Gender/Education Age/Education
TotalYoun
ger MenOlder Men
Youn ger
WomenOlder
WomenNon Coll
MenColl Men
Non Coll Women
Coll Women
Youn ger Non
CollOlder
Non Coll
Youn ger Coll
egeOlder Coll
Party ID Difference...2-3-2 PARTY ID Dem-Rep 4 7 -15 21 6 -9 -2 7 19 6 -4 22 -53-1-3 PARTY ID Dem-Rep 7 12 -19 28 8 -12 1 10 26 8 -7 31 -3
Q. 29 F. Voting and Election Proposal - Implement drive-through voting that will let voters cast their votes at precinct locations without leaving their vehicles.Total Answering (1200) (256) (301) (312) (304) (262) (307) (318) (304) (252) (316) (312) (285)Support strongly 44 45 36 47 45 39 42 42 52 43 39 50 43Support somewhat 29 27 31 33 27 26 31 30 28 30 28 31 29Oppose somewhat 9 10 9 8 7 10 9 9 7 11 9 8 8Oppose strongly 10 10 15 5 10 17 8 10 5 10 16 5 9(Neither/undecided) 7 6 8 5 8 7 8 6 6 5 7 6 9(Don't know/refused) 2 1 1 2 3 1 1 3 1 1 2 1 2Total support 73 73 67 80 72 66 73 73 80 73 67 81 72Total oppose 18 20 24 13 17 27 18 19 12 21 24 13 17Total support - Total oppose 55 53 43 67 55 38 55 54 69 52 43 68 55
Q. 30 Alternatives to In-Person VotingTotal Answering (1200) (256) (301) (312) (304) (262) (307) (318) (304) (252) (316) (312) (285)Very important 48 47 41 52 52 43 45 49 56 46 47 54 48Somewhat important 29 25 27 33 28 25 28 33 28 31 28 29 27Not that important 13 16 17 10 9 17 16 9 9 13 12 12 14Not important at all 8 10 14 3 7 14 11 5 5 8 11 5 11(Don't know/refused) 2 2 1 3 3 2 1 3 1 3 2 0 1Very/Somewhat important 77 72 68 85 81 68 73 83 85 76 75 83 74Not that important/not at all 21 26 31 13 16 31 27 14 14 21 23 17 24
Q. 31 Additional Federal Funding for Election AdministrationTotal Answering (1200) (256) (301) (312) (304) (262) (307) (318) (304) (252) (316) (312) (285)Very important 45 47 39 46 47 43 42 45 50 45 43 48 44Somewhat important 30 29 26 35 29 28 28 34 31 34 28 32 27Not that important 13 15 15 12 12 15 15 13 12 13 15 14 12Not important at all 10 9 18 3 10 12 15 6 6 6 11 5 17(Don't know/refused) 3 1 2 4 3 2 1 3 2 2 3 1 1Very/Somewhat important 75 76 65 81 76 71 70 78 81 79 71 79 71Not that/Not at all important 23 23 33 15 22 27 30 19 18 18 26 19 29
Q. 32 A. Coronavirus Voting Statements - We should not allow the coronavirus outbreak to prevent eligible citizens from voting safely in the 2020 elections.Total Answering (1200) (256) (301) (312) (304) (262) (307) (318) (304) (252) (316) (312) (285)Strongly agree 64 63 64 59 71 58 68 63 68 53 68 67 68Somewhat agree 19 16 23 22 15 21 19 18 19 22 17 17 22Somewhat disagree 7 9 4 9 5 7 5 8 6 9 6 9 3Strongly disagree 5 6 5 4 3 8 3 5 3 8 4 3 4(Neither) 6 7 4 6 6 6 5 7 5 8 5 5 4(Don't know/refused) - - - - - - - - - - - - -Total agree 83 79 87 81 86 79 87 81 87 75 85 84 90Total disagree 11 15 9 13 8 15 9 12 9 18 10 11 6Total agree - Total disagree 72 64 78 68 78 64 78 69 78 57 74 73 83
TargetSmart Communications 1155 15th St, NW, Suite 750, Washington, DC 20005 targetsmart.com
141 of 228
Page 142
May 21-27, 2020
National Voter Insights Study
TargetSmart + Dynata
Marital Status/Gender Marital Status/Kids Trump Job Approval
Voting Permissions by State
Total
Marr ied
Men
Marr ied
WomenUnmarr ied Men
Unmarr ied
Women
Marr ied
with kids
Marr ied with out kids
Unmarr ied with
kids
Unmarr ied with out kids
Total appr ove
Total disapp rove All mail
Open early / mail Closed
Party ID Difference...2-3-2 PARTY ID Dem-Rep 4 -17 -5 9 30 -4 -15 19 22 -50 50 -9 4 83-1-3 PARTY ID Dem-Rep 7 -22 -4 16 39 -2 -19 22 31 -65 67 -5 9 8
Q. 29 F. Voting and Election Proposal - Implement drive-through voting that will let voters cast their votes at precinct locations without leaving their vehicles.Total Answering (1200) (312) (306) (247) (313) (216) (400) (83) (471) (528) (626) (111) (605) (484)Support strongly 44 37 41 44 52 42 37 55 47 31 55 42 46 42Support somewhat 29 28 32 31 27 30 30 25 30 32 28 29 27 32Oppose somewhat 9 12 7 7 8 10 10 6 8 11 6 14 8 9Oppose strongly 10 15 11 10 4 9 15 12 6 17 4 6 10 10(Neither/undecided) 7 8 6 7 6 8 7 1 8 8 6 7 7 6(Don't know/refused) 2 1 2 1 2 2 1 - 2 1 1 2 2 2Total support 73 65 73 75 79 72 67 80 77 63 83 71 73 74Total oppose 18 27 18 17 12 19 24 19 14 28 10 20 18 19Total support - Total oppose 55 39 55 58 67 54 43 62 63 34 72 51 56 55
Q. 30 Alternatives to In-Person VotingTotal Answering (1200) (312) (306) (247) (313) (216) (400) (83) (471) (528) (626) (111) (605) (484)Very important 48 40 45 48 61 45 41 60 54 28 65 51 49 46Somewhat important 29 27 36 26 27 30 32 29 26 34 26 23 30 29Not that important 13 16 11 18 7 15 13 5 13 19 7 17 12 12Not important at all 8 16 7 8 3 8 13 5 5 17 1 6 8 10(Don't know/refused) 2 1 1 1 2 2 1 1 2 2 1 3 1 4Very/Somewhat important 77 67 80 74 88 75 73 89 81 62 91 74 79 75Not that important/not at all 21 32 18 25 10 23 26 10 18 36 9 23 20 22
Q. 31 Additional Federal Funding for Election AdministrationTotal Answering (1200) (312) (306) (247) (313) (216) (400) (83) (471) (528) (626) (111) (605) (484)Very important 45 39 40 47 54 43 37 49 51 26 61 40 47 43Somewhat important 30 28 35 28 31 34 30 35 29 32 29 36 28 31Not that important 13 16 15 15 9 14 16 6 12 21 8 8 13 16Not important at all 10 17 9 9 4 7 16 10 6 18 2 15 11 7(Don't know/refused) 3 1 2 1 3 2 1 1 2 3 1 1 2 3Very/Somewhat important 75 66 75 76 84 78 67 84 80 58 89 76 75 74Not that/Not at all important 23 33 24 24 13 21 32 16 18 39 10 23 23 23
Q. 32 A. Coronavirus Voting Statements - We should not allow the coronavirus outbreak to prevent eligible citizens from voting safely in the 2020 elections.Total Answering (1200) (312) (306) (247) (313) (216) (400) (83) (471) (528) (626) (111) (605) (484)Strongly agree 64 66 64 59 67 62 67 71 62 59 70 74 63 64Somewhat agree 19 19 19 21 18 18 19 15 20 24 15 14 18 21Somewhat disagree 7 6 7 7 7 8 5 5 7 7 6 6 8 5Strongly disagree 5 4 4 8 4 6 2 6 6 5 4 4 5 4(Neither) 6 5 7 5 5 6 6 3 5 6 5 3 6 5(Don't know/refused) - - - - - - - - - - - - - -Total agree 83 86 82 80 85 80 86 87 82 82 85 88 81 85Total disagree 11 9 11 15 11 14 8 11 13 12 10 9 13 10Total agree - Total disagree 72 76 72 65 74 66 78 76 69 70 75 79 68 75
TargetSmart Communications 1155 15th St, NW, Suite 750, Washington, DC 20005 targetsmart.com
142 of 228
Page 143
May 21-27, 2020
National Voter Insights Study
TargetSmart + Dynata
Permanent Absentee Voter
Status
Ever Voted Early or By Mail
First Time Voters in 2018 2016 Vote History TargetSmart Voter Score
Total PAVNot PAV Yes No Yes No Voted
Did not Vote
Was Not
Regist ered
Super Voter
Freq uent Voter
Infreq uent Voter
Never Voted
Party ID Difference...2-3-2 PARTY ID Dem-Rep 4 16 3 1 5 4 5 2 4 17 0 1 9 73-1-3 PARTY ID Dem-Rep 7 22 5 0 9 9 7 2 8 26 -4 5 13 14
Q. 29 F. Voting and Election Proposal - Implement drive-through voting that will let voters cast their votes at precinct locations without leaving their vehicles.Total Answering (1200) (130) (1070) (220) (980) (176) (1024) (757) (266) (177) (221) (393) (393) (137)Support strongly 44 46 43 42 44 45 43 40 49 50 40 45 45 49Support somewhat 29 28 30 28 30 24 30 31 28 26 31 28 33 22Oppose somewhat 9 11 8 9 8 12 8 9 7 10 8 8 8 12Oppose strongly 10 7 10 14 9 9 10 11 8 7 12 11 8 10(Neither/undecided) 7 7 7 5 7 10 6 7 7 6 7 7 5 7(Don't know/refused) 2 2 2 1 2 1 2 2 1 2 2 2 2 -Total support 73 74 73 70 74 69 74 71 77 76 71 72 77 71Total oppose 18 18 19 24 17 20 18 20 15 17 20 19 16 22Total support - Total oppose 55 56 55 46 57 49 56 51 63 60 51 54 61 49
Q. 30 Alternatives to In-Person VotingTotal Answering (1200) (130) (1070) (220) (980) (176) (1024) (757) (266) (177) (221) (393) (393) (137)Very important 48 49 48 45 49 46 48 48 46 53 45 50 50 49Somewhat important 29 30 29 31 28 29 29 27 33 28 26 28 31 31Not that important 13 15 12 14 12 14 12 13 12 13 15 13 10 11Not important at all 8 6 9 9 8 9 8 10 6 5 12 8 7 8(Don't know/refused) 2 - 3 1 3 2 2 2 3 2 3 2 3 -Very/Somewhat important 77 79 77 76 77 76 77 75 80 80 70 77 81 81Not that important/not at all 21 21 21 23 21 23 21 23 18 18 27 21 17 19
Q. 31 Additional Federal Funding for Election AdministrationTotal Answering (1200) (130) (1070) (220) (980) (176) (1024) (757) (266) (177) (221) (393) (393) (137)Very important 45 49 44 40 46 37 46 45 42 48 43 45 48 41Somewhat important 30 31 30 34 29 34 29 29 34 30 27 29 31 36Not that important 13 8 14 15 13 20 12 12 16 15 16 13 11 17Not important at all 10 12 9 9 10 6 10 12 5 5 13 10 8 7(Don't know/refused) 3 - 3 3 2 3 2 2 3 2 2 3 3 -Very/Somewhat important 75 80 74 74 75 71 75 73 76 78 70 75 79 77Not that/Not at all important 23 20 23 24 23 26 23 24 21 20 28 23 19 23
Q. 32 A. Coronavirus Voting Statements - We should not allow the coronavirus outbreak to prevent eligible citizens from voting safely in the 2020 elections.Total Answering (1200) (130) (1070) (220) (980) (176) (1024) (757) (266) (177) (221) (393) (393) (137)Strongly agree 64 70 64 70 63 51 67 68 54 65 70 69 63 55Somewhat agree 19 15 20 16 20 25 18 18 23 17 20 17 17 28Somewhat disagree 7 8 7 4 7 10 6 5 12 5 3 5 9 7Strongly disagree 5 4 5 4 5 6 4 4 4 7 3 4 5 7(Neither) 6 4 6 7 5 8 5 5 7 6 3 5 6 4(Don't know/refused) - - - - - - - - - - - - - -Total agree 83 85 83 86 83 76 85 86 77 82 91 86 80 83Total disagree 11 12 11 7 12 15 10 9 16 12 6 9 14 13Total agree - Total disagree 72 73 72 78 71 61 74 77 60 70 85 77 67 70
TargetSmart Communications 1155 15th St, NW, Suite 750, Washington, DC 20005 targetsmart.com
143 of 228
Page 144
May 21-27, 2020
National Voter Insights Study
TargetSmart + Dynata
Partisan Score Presidential General Turnout Score Mode
Total 0 to 9.9 10 to 89.9 90+ 0 to 69.9 70+ Web Land line Wire less
Party ID Difference...2-3-2 PARTY ID Dem-Rep 4 -48 -4 53 4 5 3 -3 83-1-3 PARTY ID Dem-Rep 7 -55 -1 62 10 5 4 -6 15
Q. 29 F. Voting and Election Proposal - Implement drive-through voting that will let voters cast their votes at precinct locations without leaving their vehicles.Total Answering (1200) (302) (491) (408) (429) (771) (644) (116) (440)Support strongly 44 31 44 53 44 44 35 46 56Support somewhat 29 32 29 28 29 30 34 27 24Oppose somewhat 9 13 8 6 9 8 10 7 6Oppose strongly 10 16 10 5 9 10 8 18 10(Neither/undecided) 7 7 8 5 8 6 11 1 2(Don't know/refused) 2 1 1 3 2 2 2 2 1Total support 73 63 73 81 73 73 68 72 80Total oppose 18 29 18 11 18 19 19 24 17Total support - Total oppose 55 35 54 70 55 55 50 48 63
Q. 30 Alternatives to In-Person VotingTotal Answering (1200) (302) (491) (408) (429) (771) (644) (116) (440)Very important 48 33 47 60 47 49 40 49 59Somewhat important 29 29 29 28 32 27 33 28 22Not that important 13 21 14 5 12 13 16 13 7Not important at all 8 17 8 3 6 10 7 8 10(Don't know/refused) 2 1 2 3 4 2 3 2 1Very/Somewhat important 77 62 76 89 79 75 74 77 82Not that important/not at all 21 37 21 8 17 23 23 21 18
Q. 31 Additional Federal Funding for Election AdministrationTotal Answering (1200) (302) (491) (408) (429) (771) (644) (116) (440)Very important 45 25 45 59 42 46 36 44 58Somewhat important 30 32 32 27 33 28 36 26 22Not that important 13 22 13 8 15 13 17 10 10Not important at all 10 20 9 3 7 11 9 16 9(Don't know/refused) 3 1 2 4 4 2 3 4 1Very/Somewhat important 75 57 77 86 75 75 72 70 80Not that/Not at all important 23 42 22 11 22 24 25 26 19
Q. 32 A. Coronavirus Voting Statements - We should not allow the coronavirus outbreak to prevent eligible citizens from voting safely in the 2020 elections.Total Answering (1200) (302) (491) (408) (429) (771) (644) (116) (440)Strongly agree 64 65 62 67 56 69 52 82 78Somewhat agree 19 22 20 16 22 18 26 9 11Somewhat disagree 7 7 7 6 9 6 10 1 3Strongly disagree 5 2 6 5 6 4 4 6 5(Neither) 6 5 6 6 8 4 7 2 4(Don't know/refused) - - - - - - - - -Total agree 83 87 81 83 78 87 79 91 88Total disagree 11 9 12 11 15 9 14 7 8Total agree - Total disagree 72 78 69 72 63 77 64 83 81
TargetSmart Communications 1155 15th St, NW, Suite 750, Washington, DC 20005 targetsmart.com
144 of 228
Page 145
May 21-27, 2020
National Voter Insights Study
TargetSmart + Dynata
2-3-2 Party 3-1-3 Party Ideology Party ID/Ideology
Total Dem Ind Rep Dem Ind Rep Lib Mod ConsLib
Dem
Mod / Cons Dem
Mod / Lib Rep
Cons Rep
Party ID Difference...2-3-2 PARTY ID Dem-Rep 4 100 - -100 73 - -75 68 6 -52 100 100 -100 -1003-1-3 PARTY ID Dem-Rep 7 100 8 -100 100 - -100 85 10 -63 100 100 -100 -100
Q. 32 B. Coronavirus Voting Statements - Alternatives to in-person Election Day voting are non-partisan reforms meant to help Americans vote safely in the 2020 elections.Total Answering (1200) (415) (395) (362) (566) (124) (482) (304) (469) (368) (213) (189) (117) (239)Strongly agree 41 55 45 21 58 43 22 61 42 25 60 49 19 21Somewhat agree 27 26 23 35 24 23 33 23 30 29 24 28 43 31Somewhat disagree 12 8 13 16 8 15 16 6 13 16 7 10 17 15Strongly disagree 10 4 9 19 4 4 19 3 6 22 4 6 7 24(Neither) 10 7 10 10 7 16 10 8 10 8 5 7 14 9(Don't know/refused) - - - - - - - - - - - - - -Total agree 68 81 68 56 82 66 55 84 72 54 85 77 62 52Total disagree 22 12 21 34 12 19 35 9 18 38 10 15 24 39Total agree - Total disagree 47 69 47 22 70 47 19 75 54 16 75 62 38 13
Q. 32 C. Coronavirus Voting Statements - Expanded access to vote-by-mail would lead to higher levels of voter fraud.Total Answering (1200) (415) (395) (362) (566) (124) (482) (304) (469) (368) (213) (189) (117) (239)Strongly agree 29 15 24 49 14 18 49 14 22 50 13 17 39 54Somewhat agree 23 19 26 24 20 32 25 19 24 23 18 19 26 23Somewhat disagree 15 17 16 12 17 16 12 13 20 11 13 21 18 9Strongly disagree 26 43 26 9 44 21 8 47 26 11 50 36 9 10(Neither) 8 6 8 6 6 13 6 8 9 4 5 7 9 5(Don't know/refused) - - - - - - - - - - - - - -Total agree 52 34 50 73 33 50 74 33 46 73 32 36 65 77Total disagree 41 60 42 21 61 37 20 60 46 23 63 57 26 19Total agree - Total disagree 10 -25 8 52 -28 14 53 -27 -1 51 -32 -21 39 58
Q. 32 D. Coronavirus Voting Statements - Proposals to expand access to early voting and vote-by-mail are a power grab by Democrats to defeat Donald Trump.Total Answering (1200) (415) (395) (362) (566) (124) (482) (304) (469) (368) (213) (189) (117) (239)Strongly agree 23 13 15 42 11 10 39 10 14 43 11 15 26 49Somewhat agree 16 13 15 22 12 16 22 11 17 19 13 12 27 19Somewhat disagree 14 13 16 14 14 18 15 11 16 15 10 17 17 14Strongly disagree 38 54 45 13 57 40 15 61 42 16 61 47 19 10(Neither) 9 7 9 9 6 15 9 7 10 8 5 9 12 8(Don't know/refused) - - - - - - - - - - - - - -Total agree 39 26 30 64 23 27 61 22 32 62 25 27 53 68Total disagree 52 67 61 27 71 58 30 72 58 30 71 64 36 24Total agree - Total disagree -13 -42 -31 37 -48 -32 31 -50 -27 32 -46 -37 17 44
Q. 32 E. Coronavirus Voting Statements - The risk of exposure to coronavirus is a valid excuse for voting absentee rather than in-person on Election Day.Total Answering (1200) (415) (395) (362) (566) (124) (482) (304) (469) (368) (213) (189) (117) (239)Strongly agree 44 59 45 25 61 40 25 62 44 30 62 56 27 23Somewhat agree 27 26 27 29 25 28 30 24 30 25 28 26 32 27Somewhat disagree 11 7 10 16 7 15 14 6 10 16 4 10 15 17Strongly disagree 14 4 14 27 4 7 29 4 13 27 2 6 22 30(Neither) 4 3 4 3 3 11 3 5 3 3 3 3 4 3(Don't know/refused) - - - - - - - - - - - - - -Total agree 71 86 72 53 86 67 54 85 74 55 90 82 59 50Total disagree 25 11 24 44 11 22 43 10 23 42 7 16 38 47Total agree - Total disagree 45 75 48 10 75 45 11 76 51 13 83 66 21 3
TargetSmart Communications 1155 15th St, NW, Suite 750, Washington, DC 20005 targetsmart.com
145 of 228
Page 146
May 21-27, 2020
National Voter Insights Study
TargetSmart + Dynata
Party ID/Gender
Total Dem MenDem
Women Ind MenInd
Women Rep MenRep
Women
Party ID Difference...2-3-2 PARTY ID Dem-Rep 4 100 100 - - -100 -1003-1-3 PARTY ID Dem-Rep 7 100 100 1 17 -100 -100
Q. 32 B. Coronavirus Voting Statements - Alternatives to in-person Election Day voting are non-partisan reforms meant to help Americans vote safely in the 2020 elections.Total Answering (1200) (157) (258) (219) (177) (186) (177)Strongly agree 41 57 54 47 43 19 23Somewhat agree 27 21 29 17 30 35 35Somewhat disagree 12 11 6 14 12 19 12Strongly disagree 10 4 5 13 3 18 20(Neither) 10 7 7 8 13 10 11(Don't know/refused) - - - - - - -Total agree 68 78 82 65 73 53 58Total disagree 22 15 11 27 15 37 31Total agree - Total disagree 47 64 72 38 58 17 27
Q. 32 C. Coronavirus Voting Statements - Expanded access to vote-by-mail would lead to higher levels of voter fraud.Total Answering (1200) (157) (258) (219) (177) (186) (177)Strongly agree 29 16 15 30 17 52 46Somewhat agree 23 17 20 18 36 23 25Somewhat disagree 15 17 17 17 16 12 12Strongly disagree 26 46 41 27 23 8 10(Neither) 8 4 7 8 8 5 7(Don't know/refused) - - - - - - -Total agree 52 33 35 48 53 75 71Total disagree 41 63 58 44 39 20 22Total agree - Total disagree 10 -30 -22 4 13 55 49
Q. 32 D. Coronavirus Voting Statements - Proposals to expand access to early voting and vote-by-mail are a power grab by Democrats to defeat Donald Trump.Total Answering (1200) (157) (258) (219) (177) (186) (177)Strongly agree 23 15 12 18 12 42 41Somewhat agree 16 14 12 15 15 23 21Somewhat disagree 14 15 12 12 21 15 14Strongly disagree 38 52 55 48 41 14 11(Neither) 9 5 8 8 11 7 12(Don't know/refused) - - - - - - -Total agree 39 28 24 33 27 65 62Total disagree 52 67 67 60 62 29 26Total agree - Total disagree -13 -39 -43 -27 -35 36 37
Q. 32 E. Coronavirus Voting Statements - The risk of exposure to coronavirus is a valid excuse for voting absentee rather than in-person on Election Day.Total Answering (1200) (157) (258) (219) (177) (186) (177)Strongly agree 44 56 61 47 43 25 24Somewhat agree 27 27 26 18 37 24 34Somewhat disagree 11 8 6 11 9 20 13Strongly disagree 14 5 4 20 6 28 27(Neither) 4 3 4 5 4 4 3(Don't know/refused) - - - - - - -Total agree 71 84 87 65 80 49 58Total disagree 25 14 9 31 16 47 40Total agree - Total disagree 45 70 78 34 64 2 18
TargetSmart Communications 1155 15th St, NW, Suite 750, Washington, DC 20005 targetsmart.com
146 of 228
Page 147
May 21-27, 2020
National Voter Insights Study
TargetSmart + Dynata
Urbanicity
Total R1 R2 S3 S4 U5 U6 Rural Subu rban Urban
Party ID Difference...2-3-2 PARTY ID Dem-Rep 4 -23 -15 -2 9 22 42 -19 4 283-1-3 PARTY ID Dem-Rep 7 -23 -17 -1 12 26 52 -20 7 33
Q. 32 B. Coronavirus Voting Statements - Alternatives to in-person Election Day voting are non-partisan reforms meant to help Americans vote safely in the 2020 elections.Total Answering (1200) (179) (181) (195) (273) (264) (108) (360) (468) (372)Strongly agree 41 31 34 43 38 53 46 32 40 51Somewhat agree 27 29 33 27 28 23 27 31 27 24Somewhat disagree 12 17 14 12 9 12 10 15 10 11Strongly disagree 10 19 9 10 12 4 6 14 11 5(Neither) 10 5 10 8 14 9 12 8 11 10(Don't know/refused) - - - - - - - - - -Total agree 68 59 67 70 66 75 73 63 68 75Total disagree 22 35 23 22 20 16 16 29 21 16Total agree - Total disagree 47 24 44 48 46 60 57 34 47 59
Q. 32 C. Coronavirus Voting Statements - Expanded access to vote-by-mail would lead to higher levels of voter fraud.Total Answering (1200) (179) (181) (195) (273) (264) (108) (360) (468) (372)Strongly agree 29 39 30 29 29 27 14 35 29 23Somewhat agree 23 19 23 24 25 20 25 21 25 21Somewhat disagree 15 10 20 15 15 15 16 15 15 15Strongly disagree 26 24 20 25 23 30 38 22 24 32(Neither) 8 7 6 7 8 9 7 7 7 8(Don't know/refused) - - - - - - - - - -Total agree 52 58 54 53 54 46 39 56 54 44Total disagree 41 35 40 40 38 45 54 37 39 48Total agree - Total disagree 10 24 14 13 16 1 -14 19 15 -3
Q. 32 D. Coronavirus Voting Statements - Proposals to expand access to early voting and vote-by-mail are a power grab by Democrats to defeat Donald Trump.Total Answering (1200) (179) (181) (195) (273) (264) (108) (360) (468) (372)Strongly agree 23 32 24 27 20 20 12 28 23 18Somewhat agree 16 18 17 15 16 14 19 17 16 16Somewhat disagree 14 10 17 15 16 13 15 13 16 13Strongly disagree 38 33 33 34 38 43 45 33 36 43(Neither) 9 8 10 10 10 10 10 9 10 10(Don't know/refused) - - - - - - - - - -Total agree 39 49 41 42 35 35 31 45 38 34Total disagree 52 43 50 48 55 56 59 47 52 57Total agree - Total disagree -13 6 -10 -6 -19 -21 -28 -2 -14 -23
Q. 32 E. Coronavirus Voting Statements - The risk of exposure to coronavirus is a valid excuse for voting absentee rather than in-person on Election Day.Total Answering (1200) (179) (181) (195) (273) (264) (108) (360) (468) (372)Strongly agree 44 36 36 45 46 51 45 36 45 49Somewhat agree 27 31 30 26 23 25 31 31 24 27Somewhat disagree 11 11 14 11 11 9 11 12 11 9Strongly disagree 14 21 17 15 15 10 7 19 15 9(Neither) 4 2 4 3 5 5 6 3 4 6(Don't know/refused) - - - - - - - - - -Total agree 71 67 66 71 69 76 76 66 70 76Total disagree 25 32 30 27 26 19 18 31 26 18Total agree - Total disagree 45 35 36 44 43 58 58 35 43 58
TargetSmart Communications 1155 15th St, NW, Suite 750, Washington, DC 20005 targetsmart.com
147 of 228
Page 148
May 21-27, 2020
National Voter Insights Study
TargetSmart + Dynata
Urbanicity/Gender
Total Rural MenRural
WomenSubu rban
MenSubu rban Women Urban Men
Urban Women
Party ID Difference...2-3-2 PARTY ID Dem-Rep 4 -23 -15 -4 12 13 393-1-3 PARTY ID Dem-Rep 7 -28 -13 -1 15 16 48
Q. 32 B. Coronavirus Voting Statements - Alternatives to in-person Election Day voting are non-partisan reforms meant to help Americans vote safely in the 2020 elections.Total Answering (1200) (180) (180) (227) (241) (164) (208)Strongly agree 41 34 30 41 40 49 53Somewhat agree 27 27 35 24 30 21 26Somewhat disagree 12 16 15 13 7 15 8Strongly disagree 10 14 13 13 9 7 3(Neither) 10 9 7 9 14 8 10(Don't know/refused) - - - - - - -Total agree 68 61 65 65 70 69 79Total disagree 22 30 28 26 16 22 11Total agree - Total disagree 47 31 37 39 54 47 68
Q. 32 C. Coronavirus Voting Statements - Expanded access to vote-by-mail would lead to higher levels of voter fraud.Total Answering (1200) (180) (180) (227) (241) (164) (208)Strongly agree 29 45 25 33 25 23 23Somewhat agree 23 13 29 21 29 25 19Somewhat disagree 15 12 18 16 14 16 15Strongly disagree 26 25 20 23 25 31 33(Neither) 8 5 9 7 8 6 10(Don't know/refused) - - - - - - -Total agree 52 58 54 53 54 48 42Total disagree 41 37 38 39 39 47 48Total agree - Total disagree 10 21 16 14 16 1 -6
Q. 32 D. Coronavirus Voting Statements - Proposals to expand access to early voting and vote-by-mail are a power grab by Democrats to defeat Donald Trump.Total Answering (1200) (180) (180) (227) (241) (164) (208)Strongly agree 23 30 25 25 21 20 17Somewhat agree 16 18 16 16 16 18 14Somewhat disagree 14 11 16 17 15 13 14Strongly disagree 38 37 30 36 37 40 46(Neither) 9 5 13 8 12 9 11(Don't know/refused) - - - - - - -Total agree 39 48 41 40 36 38 30Total disagree 52 47 46 52 52 53 59Total agree - Total disagree -13 1 -5 -12 -16 -15 -29
Q. 32 E. Coronavirus Voting Statements - The risk of exposure to coronavirus is a valid excuse for voting absentee rather than in-person on Election Day.Total Answering (1200) (180) (180) (227) (241) (164) (208)Strongly agree 44 36 36 44 47 47 51Somewhat agree 27 22 39 20 28 26 27Somewhat disagree 11 16 8 13 9 11 8Strongly disagree 14 23 15 19 11 11 7(Neither) 4 3 3 4 5 5 6(Don't know/refused) - - - - - - -Total agree 71 58 74 64 75 73 79Total disagree 25 39 23 33 21 22 15Total agree - Total disagree 45 19 51 31 54 51 63
TargetSmart Communications 1155 15th St, NW, Suite 750, Washington, DC 20005 targetsmart.com
148 of 228
Page 149
May 21-27, 2020
National Voter Insights Study
TargetSmart + Dynata
Region by State
TotalBorder States
Califo rnia
Indust rial
Midw est
Lower Midw
estMid -
Atla ntic
Moun tain
States
Nati onal
Capi talNew
Engl and
Paci fic Northw
est SouthSouthe
ast
Upper Midw
est
Party ID Difference...2-3-2 PARTY ID Dem-Rep 4 4 19 -11 16 15 2 5 17 -7 -3 3 13-1-3 PARTY ID Dem-Rep 7 -5 27 -6 17 21 5 15 29 2 -9 8 -8
Q. 32 B. Coronavirus Voting Statements - Alternatives to in-person Election Day voting are non-partisan reforms meant to help Americans vote safely in the 2020 elections.Total Answering (1200) (132) (120) (157) (60) (158) (48) (60) (60) (48) (108) (193) (48)Strongly agree 41 39 42 44 46 38 38 40 35 52 45 43 30Somewhat agree 27 38 22 30 30 31 31 29 23 24 17 23 33Somewhat disagree 12 8 12 11 11 10 16 11 16 8 13 15 14Strongly disagree 10 8 11 11 6 11 4 11 6 7 19 8 12(Neither) 10 8 13 5 7 10 11 9 22 10 7 11 11(Don't know/refused) - - - - - - - - - - - - -Total agree 68 78 64 73 76 69 69 69 57 76 62 66 63Total disagree 22 15 23 22 17 21 20 22 21 15 32 23 26Total agree - Total disagree 47 62 42 51 60 48 49 47 36 61 30 43 37
Q. 32 C. Coronavirus Voting Statements - Expanded access to vote-by-mail would lead to higher levels of voter fraud.Total Answering (1200) (132) (120) (157) (60) (158) (48) (60) (60) (48) (108) (193) (48)Strongly agree 29 31 22 30 39 25 22 30 22 26 36 29 33Somewhat agree 23 26 21 26 17 23 22 19 33 16 19 24 18Somewhat disagree 15 11 18 12 14 16 24 12 13 21 12 17 16Strongly disagree 26 22 31 27 22 28 27 32 18 34 28 24 26(Neither) 8 11 9 5 7 9 5 7 15 3 5 6 7(Don't know/refused) - - - - - - - - - - - - -Total agree 52 56 43 57 57 48 44 49 54 42 56 53 51Total disagree 41 33 49 39 36 44 51 44 31 55 39 41 42Total agree - Total disagree 10 23 -6 18 20 4 -6 4 24 -13 16 12 9
Q. 32 D. Coronavirus Voting Statements - Proposals to expand access to early voting and vote-by-mail are a power grab by Democrats to defeat Donald Trump.Total Answering (1200) (132) (120) (157) (60) (158) (48) (60) (60) (48) (108) (193) (48)Strongly agree 23 28 21 22 15 18 18 25 18 23 30 23 27Somewhat agree 16 17 15 19 24 21 13 14 9 12 12 15 10Somewhat disagree 14 15 15 14 7 17 19 6 16 14 14 16 12Strongly disagree 38 28 42 37 45 34 39 51 39 43 37 37 40(Neither) 9 11 7 9 9 11 11 5 18 7 8 9 12(Don't know/refused) - - - - - - - - - - - - -Total agree 39 45 36 41 39 39 32 39 27 36 42 39 36Total disagree 52 44 57 51 52 51 58 57 55 57 51 53 52Total agree - Total disagree -13 1 -21 -10 -13 -12 -26 -18 -29 -21 -9 -14 -16
Q. 32 E. Coronavirus Voting Statements - The risk of exposure to coronavirus is a valid excuse for voting absentee rather than in-person on Election Day.Total Answering (1200) (132) (120) (157) (60) (158) (48) (60) (60) (48) (108) (193) (48)Strongly agree 44 42 49 49 49 38 55 47 34 48 43 38 41Somewhat agree 27 32 24 25 25 27 17 20 44 29 23 29 23Somewhat disagree 11 9 8 7 9 17 17 6 8 7 13 13 11Strongly disagree 14 11 14 16 13 13 8 26 7 11 19 16 15(Neither) 4 6 4 2 3 5 3 1 7 6 3 4 10(Don't know/refused) - - - - - - - - - - - - -Total agree 71 74 73 74 74 65 72 67 79 76 65 67 64Total disagree 25 20 23 24 23 30 25 32 14 18 32 29 26Total agree - Total disagree 45 54 51 51 52 36 47 35 64 58 33 38 39
TargetSmart Communications 1155 15th St, NW, Suite 750, Washington, DC 20005 targetsmart.com
149 of 228
Page 150
May 21-27, 2020
National Voter Insights Study
TargetSmart + Dynata
Gender Age
Total Men Women 18 - 34 35 - 49 50 - 64 Over 64 18 - 4950 and
over
Party ID Difference...2-3-2 PARTY ID Dem-Rep 4 -5 13 24 6 -2 -8 15 -53-1-3 PARTY ID Dem-Rep 7 -5 18 33 8 0 -10 21 -5
Q. 32 B. Coronavirus Voting Statements - Alternatives to in-person Election Day voting are non-partisan reforms meant to help Americans vote safely in the 2020 elections.Total Answering (1200) (571) (629) (281) (287) (310) (295) (568) (605)Strongly agree 41 41 41 42 44 36 43 43 39Somewhat agree 27 24 30 31 29 29 21 30 25Somewhat disagree 12 15 10 14 10 12 12 12 12Strongly disagree 10 12 8 6 8 12 13 7 13(Neither) 10 9 11 7 10 11 11 9 11(Don't know/refused) - - - - - - - - -Total agree 68 65 72 73 73 65 64 73 65Total disagree 22 26 18 20 18 25 25 19 25Total agree - Total disagree 47 39 54 53 55 40 39 54 40
Q. 32 C. Coronavirus Voting Statements - Expanded access to vote-by-mail would lead to higher levels of voter fraud.Total Answering (1200) (571) (629) (281) (287) (310) (295) (568) (605)Strongly agree 29 34 24 19 31 32 32 25 32Somewhat agree 23 20 26 30 21 23 18 25 21Somewhat disagree 15 15 15 17 17 14 12 17 13Strongly disagree 26 26 26 28 22 23 31 25 27(Neither) 8 6 9 6 9 8 7 8 8(Don't know/refused) - - - - - - - - -Total agree 52 53 50 49 52 56 50 50 53Total disagree 41 41 41 45 39 37 43 42 40Total agree - Total disagree 10 12 9 4 13 19 7 8 13
Q. 32 D. Coronavirus Voting Statements - Proposals to expand access to early voting and vote-by-mail are a power grab by Democrats to defeat Donald Trump.Total Answering (1200) (571) (629) (281) (287) (310) (295) (568) (605)Strongly agree 23 25 21 13 24 25 29 18 27Somewhat agree 16 17 15 18 13 20 14 15 17Somewhat disagree 14 14 15 20 17 12 9 19 11Strongly disagree 38 37 38 42 36 34 38 39 36(Neither) 9 7 12 7 11 9 11 9 10(Don't know/refused) - - - - - - - - -Total agree 39 42 36 31 36 45 43 33 44Total disagree 52 51 53 62 53 46 47 57 47Total agree - Total disagree -13 -9 -17 -32 -17 -1 -4 -24 -3
Q. 32 E. Coronavirus Voting Statements - The risk of exposure to coronavirus is a valid excuse for voting absentee rather than in-person on Election Day.Total Answering (1200) (571) (629) (281) (287) (310) (295) (568) (605)Strongly agree 44 42 45 44 41 42 47 43 44Somewhat agree 27 23 31 35 26 26 23 30 24Somewhat disagree 11 13 9 11 11 11 11 11 11Strongly disagree 14 18 11 6 16 18 18 11 18(Neither) 4 4 5 5 6 4 2 5 3(Don't know/refused) - - - - - - - - -Total agree 71 65 76 78 67 68 70 73 69Total disagree 25 32 20 17 27 29 28 22 28Total agree - Total disagree 45 33 56 62 41 39 41 51 40
TargetSmart Communications 1155 15th St, NW, Suite 750, Washington, DC 20005 targetsmart.com
150 of 228
Page 151
May 21-27, 2020
National Voter Insights Study
TargetSmart + Dynata
Education Homeownership status Marital status
TotalH.S. or
lessPost H.S.
4yr Coll Grad
Post Grad
Coll ege Grad uate
Total Non Coll Rent Own
Marr ied Single
Separa ted / divo rced
Wido wed
Total Unmarr
ied
Party ID Difference...2-3-2 PARTY ID Dem-Rep 4 5 -3 6 13 9 0 32 -5 -11 30 10 -6 213-1-3 PARTY ID Dem-Rep 7 3 -1 9 20 14 0 44 -6 -13 42 12 -10 29
Q. 32 B. Coronavirus Voting Statements - Alternatives to in-person Election Day voting are non-partisan reforms meant to help Americans vote safely in the 2020 elections.Total Answering (1200) (210) (369) (363) (248) (610) (579) (297) (873) (618) (357) (144) (59) (560)Strongly agree 41 38 38 43 46 44 38 51 38 34 53 39 44 49Somewhat agree 27 27 26 32 23 29 26 25 28 29 27 23 25 26Somewhat disagree 12 17 11 9 12 10 14 11 12 14 8 13 9 9Strongly disagree 10 9 14 8 8 8 12 5 12 13 5 10 16 7(Neither) 10 8 11 8 11 9 10 8 10 10 8 14 7 10(Don't know/refused) - - - - - - - - - - - - - -Total agree 68 65 64 75 69 73 65 76 66 64 80 63 69 74Total disagree 22 26 25 17 20 18 26 16 24 27 12 23 25 16Total agree - Total disagree 47 39 39 58 50 55 39 60 43 37 68 40 44 58
Q. 32 C. Coronavirus Voting Statements - Expanded access to vote-by-mail would lead to higher levels of voter fraud.Total Answering (1200) (210) (369) (363) (248) (610) (579) (297) (873) (618) (357) (144) (59) (560)Strongly agree 29 40 30 27 21 24 34 19 32 33 21 31 24 24Somewhat agree 23 23 21 26 21 24 22 28 22 21 25 23 36 25Somewhat disagree 15 14 14 13 20 15 14 17 14 15 15 17 8 15Strongly disagree 26 12 25 30 34 32 20 29 25 24 32 23 24 29(Neither) 8 10 10 5 4 5 10 7 7 7 8 7 8 8(Don't know/refused) - - - - - - - - - - - - - -Total agree 52 63 51 53 42 49 55 46 54 54 46 54 60 49Total disagree 41 27 39 43 54 47 35 47 39 39 46 39 32 43Total agree - Total disagree 10 37 11 10 -12 1 20 0 15 15 -1 15 28 6
Q. 32 D. Coronavirus Voting Statements - Proposals to expand access to early voting and vote-by-mail are a power grab by Democrats to defeat Donald Trump.Total Answering (1200) (210) (369) (363) (248) (610) (579) (297) (873) (618) (357) (144) (59) (560)Strongly agree 23 34 23 19 17 18 27 15 25 26 15 20 33 18Somewhat agree 16 15 15 17 18 17 15 15 17 17 15 20 13 16Somewhat disagree 14 15 14 15 14 14 15 16 14 15 16 6 16 14Strongly disagree 38 25 36 43 44 44 32 42 36 33 45 43 29 43(Neither) 9 12 12 7 7 7 12 12 8 9 9 12 9 10(Don't know/refused) - - - - - - - - - - - - - -Total agree 39 49 38 36 34 35 42 29 42 43 30 40 46 34Total disagree 52 40 50 57 58 58 46 59 50 48 61 48 45 56Total agree - Total disagree -13 9 -12 -22 -24 -23 -4 -29 -8 -5 -31 -9 1 -22
Q. 32 E. Coronavirus Voting Statements - The risk of exposure to coronavirus is a valid excuse for voting absentee rather than in-person on Election Day.Total Answering (1200) (210) (369) (363) (248) (610) (579) (297) (873) (618) (357) (144) (59) (560)Strongly agree 44 39 40 45 52 48 39 49 42 38 52 45 47 50Somewhat agree 27 30 26 28 24 26 28 29 26 27 29 19 29 27Somewhat disagree 11 10 15 8 9 8 13 10 12 12 8 13 14 10Strongly disagree 14 16 15 16 12 14 15 7 17 19 7 17 5 9(Neither) 4 4 5 4 4 4 5 5 4 4 4 5 5 5(Don't know/refused) - - - - - - - - - - - - - -Total agree 71 69 66 73 76 74 67 78 68 65 81 65 76 76Total disagree 25 27 30 24 20 22 29 17 29 31 15 31 19 19Total agree - Total disagree 45 42 36 49 55 51 38 61 39 34 66 34 57 57
TargetSmart Communications 1155 15th St, NW, Suite 750, Washington, DC 20005 targetsmart.com
151 of 228
Page 152
May 21-27, 2020
National Voter Insights Study
TargetSmart + Dynata
Kids at home Religious attendance
Total Yes No
More than
once a week
Once a week
Once or twice a month
A few times a
year Seldom NeverFreq uent
Infreq uent
Seldom / Never
Party ID Difference...2-3-2 PARTY ID Dem-Rep 4 2 6 -10 -15 5 7 6 24 -14 6 163-1-3 PARTY ID Dem-Rep 7 5 9 -19 -17 -5 14 9 35 -17 7 24
Q. 32 B. Coronavirus Voting Statements - Alternatives to in-person Election Day voting are non-partisan reforms meant to help Americans vote safely in the 2020 elections.Total Answering (1200) (301) (876) (89) (251) (121) (190) (212) (301) (340) (311) (513)Strongly agree 41 39 42 44 35 33 42 38 51 37 38 46Somewhat agree 27 30 27 23 30 28 33 28 22 28 31 25Somewhat disagree 12 12 12 13 10 17 11 15 9 11 13 12Strongly disagree 10 10 10 14 14 15 8 10 5 14 11 7(Neither) 10 8 10 6 11 7 6 10 13 10 6 11(Don't know/refused) - - - - - - - - - - - -Total agree 68 70 69 67 65 61 75 66 73 66 70 70Total disagree 22 22 22 27 24 32 19 25 14 24 24 19Total agree - Total disagree 47 48 47 40 42 29 56 41 59 41 45 52
Q. 32 C. Coronavirus Voting Statements - Expanded access to vote-by-mail would lead to higher levels of voter fraud.Total Answering (1200) (301) (876) (89) (251) (121) (190) (212) (301) (340) (311) (513)Strongly agree 29 28 28 39 34 40 28 25 18 35 33 21Somewhat agree 23 26 22 22 25 29 22 22 21 24 25 21Somewhat disagree 15 18 14 14 15 12 15 15 16 15 14 15Strongly disagree 26 23 28 22 20 15 28 31 34 21 23 33(Neither) 8 5 8 3 6 5 6 7 11 5 6 9(Don't know/refused) - - - - - - - - - - - -Total agree 52 54 51 61 59 69 51 47 40 59 58 43Total disagree 41 42 41 36 36 27 43 46 50 36 37 48Total agree - Total disagree 10 12 9 25 23 42 8 1 -10 24 21 -6
Q. 32 D. Coronavirus Voting Statements - Proposals to expand access to early voting and vote-by-mail are a power grab by Democrats to defeat Donald Trump.Total Answering (1200) (301) (876) (89) (251) (121) (190) (212) (301) (340) (311) (513)Strongly agree 23 21 22 31 28 28 22 21 14 29 24 17Somewhat agree 16 17 16 13 17 22 17 16 13 16 19 15Somewhat disagree 14 17 14 13 13 19 15 15 15 13 16 15Strongly disagree 38 35 39 30 33 28 42 35 48 32 36 43(Neither) 9 10 9 13 10 4 5 13 10 10 5 11(Don't know/refused) - - - - - - - - - - - -Total agree 39 38 39 45 45 49 38 37 28 45 43 32Total disagree 52 52 52 43 46 46 56 50 63 45 53 58Total agree - Total disagree -13 -14 -14 2 -1 3 -18 -13 -35 - -10 -26
Q. 32 E. Coronavirus Voting Statements - The risk of exposure to coronavirus is a valid excuse for voting absentee rather than in-person on Election Day.Total Answering (1200) (301) (876) (89) (251) (121) (190) (212) (301) (340) (311) (513)Strongly agree 44 41 45 44 40 32 51 39 50 41 44 45Somewhat agree 27 29 27 16 31 30 27 28 25 27 28 26Somewhat disagree 11 10 11 17 14 8 8 13 8 15 8 10Strongly disagree 14 16 13 20 13 24 12 15 12 15 16 13(Neither) 4 4 4 3 2 7 2 5 5 2 4 5(Don't know/refused) - - - - - - - - - - - -Total agree 71 70 71 60 71 62 79 67 75 68 72 72Total disagree 25 26 25 37 27 32 20 28 20 30 24 23Total agree - Total disagree 45 43 47 23 44 30 59 39 55 38 48 49
TargetSmart Communications 1155 15th St, NW, Suite 750, Washington, DC 20005 targetsmart.com
152 of 228
Page 153
May 21-27, 2020
National Voter Insights Study
TargetSmart + Dynata
Gender/Age Gender/Education Age/Education
TotalYoun
ger MenOlder Men
Youn ger
WomenOlder
WomenNon Coll
MenColl Men
Non Coll Women
Coll Women
Youn ger Non
CollOlder
Non Coll
Youn ger Coll
egeOlder Coll
Party ID Difference...2-3-2 PARTY ID Dem-Rep 4 7 -15 21 6 -9 -2 7 19 6 -4 22 -53-1-3 PARTY ID Dem-Rep 7 12 -19 28 8 -12 1 10 26 8 -7 31 -3
Q. 32 B. Coronavirus Voting Statements - Alternatives to in-person Election Day voting are non-partisan reforms meant to help Americans vote safely in the 2020 elections.Total Answering (1200) (256) (301) (312) (304) (262) (307) (318) (304) (252) (316) (312) (285)Strongly agree 41 45 37 41 42 38 43 38 46 40 37 46 43Somewhat agree 27 26 22 33 28 24 25 29 32 27 26 32 25Somewhat disagree 12 12 18 12 7 15 14 12 6 16 12 8 12Strongly disagree 10 9 14 5 11 15 9 10 7 9 15 6 10(Neither) 10 8 10 9 12 8 9 12 9 8 11 8 10(Don't know/refused) - - - - - - - - - - - - -Total agree 68 71 59 74 70 62 68 66 78 67 62 78 68Total disagree 22 21 31 17 19 30 23 22 13 25 27 14 22Total agree - Total disagree 47 50 28 57 51 32 44 45 65 42 36 64 45
Q. 32 C. Coronavirus Voting Statements - Expanded access to vote-by-mail would lead to higher levels of voter fraud.Total Answering (1200) (256) (301) (312) (304) (262) (307) (318) (304) (252) (316) (312) (285)Strongly agree 29 31 36 21 28 39 29 29 19 32 36 21 28Somewhat agree 23 19 20 30 21 18 21 25 27 23 20 27 21Somewhat disagree 15 17 13 18 13 13 16 15 14 19 11 17 14Strongly disagree 26 27 25 23 29 22 29 19 34 16 24 32 30(Neither) 8 7 6 9 9 8 4 12 5 12 9 4 6(Don't know/refused) - - - - - - - - - - - - -Total agree 52 50 56 50 49 57 50 54 47 54 56 48 50Total disagree 41 43 39 41 41 35 46 35 48 34 35 49 45Total agree - Total disagree 10 7 17 9 8 22 4 19 -1 20 20 -1 5
Q. 32 D. Coronavirus Voting Statements - Proposals to expand access to early voting and vote-by-mail are a power grab by Democrats to defeat Donald Trump.Total Answering (1200) (256) (301) (312) (304) (262) (307) (318) (304) (252) (316) (312) (285)Strongly agree 23 21 29 16 26 32 19 23 18 22 32 15 21Somewhat agree 16 14 20 17 13 16 18 14 16 15 14 16 19Somewhat disagree 14 18 9 19 12 14 13 15 16 20 11 18 10Strongly disagree 38 41 34 37 38 29 44 34 43 31 32 46 41(Neither) 9 6 8 12 12 8 6 15 8 13 11 5 9(Don't know/refused) - - - - - - - - - - - - -Total agree 39 35 49 32 39 48 37 37 34 37 46 31 40Total disagree 52 59 44 56 50 44 57 48 59 51 43 64 51Total agree - Total disagree -13 -25 5 -24 -11 4 -20 -12 -25 -14 3 -33 -11
Q. 32 E. Coronavirus Voting Statements - The risk of exposure to coronavirus is a valid excuse for voting absentee rather than in-person on Election Day.Total Answering (1200) (256) (301) (312) (304) (262) (307) (318) (304) (252) (316) (312) (285)Strongly agree 44 43 42 43 47 37 46 41 49 33 44 50 45Somewhat agree 27 26 20 34 29 23 22 31 30 32 24 29 23Somewhat disagree 11 12 14 9 7 16 11 11 6 16 11 7 10Strongly disagree 14 14 22 9 14 20 17 11 11 11 18 11 17(Neither) 4 5 3 6 3 4 4 5 4 8 2 4 4(Don't know/refused) - - - - - - - - - - - - -Total agree 71 69 61 76 76 60 68 72 79 65 69 79 69Total disagree 25 26 36 18 21 36 28 23 17 27 29 18 27Total agree - Total disagree 45 42 26 58 55 25 40 50 63 38 39 61 41
TargetSmart Communications 1155 15th St, NW, Suite 750, Washington, DC 20005 targetsmart.com
153 of 228
Page 154
May 21-27, 2020
National Voter Insights Study
TargetSmart + Dynata
Marital Status/Gender Marital Status/Kids Trump Job Approval
Voting Permissions by State
Total
Marr ied
Men
Marr ied
WomenUnmarr ied Men
Unmarr ied
Women
Marr ied
with kids
Marr ied with out kids
Unmarr ied with
kids
Unmarr ied with out kids
Total appr ove
Total disapp rove All mail
Open early / mail Closed
Party ID Difference...2-3-2 PARTY ID Dem-Rep 4 -17 -5 9 30 -4 -15 19 22 -50 50 -9 4 83-1-3 PARTY ID Dem-Rep 7 -22 -4 16 39 -2 -19 22 31 -65 67 -5 9 8
Q. 32 B. Coronavirus Voting Statements - Alternatives to in-person Election Day voting are non-partisan reforms meant to help Americans vote safely in the 2020 elections.Total Answering (1200) (312) (306) (247) (313) (216) (400) (83) (471) (528) (626) (111) (605) (484)Strongly agree 41 34 34 48 49 35 34 51 48 22 57 38 43 39Somewhat agree 27 27 32 20 30 34 27 20 27 33 23 32 26 29Somewhat disagree 12 16 13 14 6 12 15 11 9 18 7 11 12 12Strongly disagree 10 15 10 9 6 10 14 12 6 18 3 9 9 12(Neither) 10 8 11 10 10 9 10 6 10 10 9 10 10 9(Don't know/refused) - - - - - - - - - - - - - -Total agree 68 62 66 68 79 69 61 70 75 54 81 70 69 68Total disagree 22 30 23 22 11 22 29 24 15 36 11 20 21 24Total agree - Total disagree 47 32 43 46 68 48 31 47 61 18 70 50 48 44
Q. 32 C. Coronavirus Voting Statements - Expanded access to vote-by-mail would lead to higher levels of voter fraud.Total Answering (1200) (312) (306) (247) (313) (216) (400) (83) (471) (528) (626) (111) (605) (484)Strongly agree 29 35 31 32 18 28 35 28 23 49 11 26 28 31Somewhat agree 23 20 23 20 29 26 19 26 25 28 19 24 22 23Somewhat disagree 15 15 15 14 15 19 13 16 14 9 19 19 15 14Strongly disagree 26 25 22 27 30 23 25 25 30 8 43 28 28 23(Neither) 8 5 9 7 8 4 9 5 8 6 8 3 7 9(Don't know/refused) - - - - - - - - - - - - - -Total agree 52 54 54 52 47 54 54 54 48 77 30 51 50 54Total disagree 41 41 37 41 45 42 38 41 44 17 62 47 43 38Total agree - Total disagree 10 14 17 11 3 12 17 12 5 60 -32 4 7 16
Q. 32 D. Coronavirus Voting Statements - Proposals to expand access to early voting and vote-by-mail are a power grab by Democrats to defeat Donald Trump.Total Answering (1200) (312) (306) (247) (313) (216) (400) (83) (471) (528) (626) (111) (605) (484)Strongly agree 23 27 26 23 15 22 28 20 18 39 10 23 21 24Somewhat agree 16 19 14 15 17 17 17 16 16 24 10 17 15 17Somewhat disagree 14 14 16 13 14 20 13 10 14 14 14 16 14 15Strongly disagree 38 33 32 42 43 32 34 44 43 12 59 37 40 34(Neither) 9 6 12 8 11 9 9 11 9 11 7 6 10 10(Don't know/refused) - - - - - - - - - - - - - -Total agree 39 46 40 38 31 39 45 36 34 63 20 41 36 41Total disagree 52 48 49 55 57 52 46 53 57 27 73 54 54 49Total agree - Total disagree -13 -1 -9 -17 -26 -13 -1 -17 -23 36 -54 -13 -18 -8
Q. 32 E. Coronavirus Voting Statements - The risk of exposure to coronavirus is a valid excuse for voting absentee rather than in-person on Election Day.Total Answering (1200) (312) (306) (247) (313) (216) (400) (83) (471) (528) (626) (111) (605) (484)Strongly agree 44 38 37 46 53 38 38 49 50 23 61 48 43 43Somewhat agree 27 22 32 23 30 29 27 27 27 31 24 29 28 26Somewhat disagree 11 14 10 13 8 10 13 10 10 16 7 10 11 11Strongly disagree 14 22 16 14 6 18 20 11 8 27 4 10 14 16(Neither) 4 3 4 5 5 5 3 3 5 4 4 4 4 5(Don't know/refused) - - - - - - - - - - - - - -Total agree 71 61 70 69 82 67 64 76 77 54 85 76 71 69Total disagree 25 36 26 27 14 28 33 21 18 43 12 20 25 27Total agree - Total disagree 45 24 43 42 69 39 32 54 59 11 73 57 46 42
TargetSmart Communications 1155 15th St, NW, Suite 750, Washington, DC 20005 targetsmart.com
154 of 228
Page 155
May 21-27, 2020
National Voter Insights Study
TargetSmart + Dynata
Permanent Absentee Voter
Status
Ever Voted Early or By Mail
First Time Voters in 2018 2016 Vote History TargetSmart Voter Score
Total PAVNot PAV Yes No Yes No Voted
Did not Vote
Was Not
Regist ered
Super Voter
Freq uent Voter
Infreq uent Voter
Never Voted
Party ID Difference...2-3-2 PARTY ID Dem-Rep 4 16 3 1 5 4 5 2 4 17 0 1 9 73-1-3 PARTY ID Dem-Rep 7 22 5 0 9 9 7 2 8 26 -4 5 13 14
Q. 32 B. Coronavirus Voting Statements - Alternatives to in-person Election Day voting are non-partisan reforms meant to help Americans vote safely in the 2020 elections.Total Answering (1200) (130) (1070) (220) (980) (176) (1024) (757) (266) (177) (221) (393) (393) (137)Strongly agree 41 39 41 41 41 33 42 42 38 42 44 41 44 37Somewhat agree 27 24 28 27 27 32 27 26 31 30 24 28 27 32Somewhat disagree 12 14 12 13 12 10 12 13 14 7 13 11 12 9Strongly disagree 10 11 10 8 10 13 9 11 6 12 11 11 8 15(Neither) 10 12 9 10 10 13 9 9 12 9 8 10 10 8(Don't know/refused) - - - - - - - - - - - - - -Total agree 68 64 69 69 68 65 69 67 69 72 68 68 70 69Total disagree 22 24 22 21 22 23 22 23 19 19 24 22 20 24Total agree - Total disagree 47 39 47 48 46 42 47 44 50 53 43 46 51 45
Q. 32 C. Coronavirus Voting Statements - Expanded access to vote-by-mail would lead to higher levels of voter fraud.Total Answering (1200) (130) (1070) (220) (980) (176) (1024) (757) (266) (177) (221) (393) (393) (137)Strongly agree 29 24 29 35 27 26 29 31 25 23 30 28 30 28Somewhat agree 23 21 23 20 23 29 22 22 23 27 21 20 24 33Somewhat disagree 15 16 15 11 16 18 14 14 14 19 13 14 15 18Strongly disagree 26 34 25 26 26 14 28 27 26 23 31 31 24 13(Neither) 8 6 8 8 7 14 6 6 12 7 5 7 7 9(Don't know/refused) - - - - - - - - - - - - - -Total agree 52 44 52 55 51 54 51 53 48 50 52 49 54 61Total disagree 41 50 40 37 42 32 43 41 40 43 44 44 39 30Total agree - Total disagree 10 -6 12 19 9 23 8 12 8 8 8 5 15 30
Q. 32 D. Coronavirus Voting Statements - Proposals to expand access to early voting and vote-by-mail are a power grab by Democrats to defeat Donald Trump.Total Answering (1200) (130) (1070) (220) (980) (176) (1024) (757) (266) (177) (221) (393) (393) (137)Strongly agree 23 23 23 26 22 23 23 25 20 18 27 21 22 25Somewhat agree 16 16 16 15 16 23 15 15 19 19 15 15 16 25Somewhat disagree 14 15 14 14 14 16 14 15 13 14 16 12 16 15Strongly disagree 38 40 37 36 38 21 40 38 35 40 36 46 37 22(Neither) 9 6 10 9 10 17 8 8 15 9 6 8 10 12(Don't know/refused) - - - - - - - - - - - - - -Total agree 39 39 39 41 38 46 38 39 38 37 42 35 38 50Total disagree 52 55 51 49 52 37 54 53 47 54 52 57 52 38Total agree - Total disagree -13 -16 -13 -8 -14 9 -17 -14 -9 -17 -10 -22 -14 13
Q. 32 E. Coronavirus Voting Statements - The risk of exposure to coronavirus is a valid excuse for voting absentee rather than in-person on Election Day.Total Answering (1200) (130) (1070) (220) (980) (176) (1024) (757) (266) (177) (221) (393) (393) (137)Strongly agree 44 52 43 44 44 32 46 45 42 41 50 45 44 33Somewhat agree 27 25 27 24 28 41 25 23 34 34 18 24 29 44Somewhat disagree 11 8 11 11 11 7 12 12 9 8 12 11 11 7Strongly disagree 14 12 15 18 14 12 15 17 8 13 16 17 12 13(Neither) 4 4 4 4 4 9 3 3 7 4 4 3 4 4(Don't know/refused) - - - - - - - - - - - - - -Total agree 71 77 70 68 71 73 70 68 76 75 68 69 73 77Total disagree 25 20 26 29 25 19 26 29 17 21 28 29 24 20Total agree - Total disagree 45 57 44 39 47 54 44 38 59 54 40 40 49 57
TargetSmart Communications 1155 15th St, NW, Suite 750, Washington, DC 20005 targetsmart.com
155 of 228
Page 156
May 21-27, 2020
National Voter Insights Study
TargetSmart + Dynata
Partisan Score Presidential General Turnout Score Mode
Total 0 to 9.9 10 to 89.9 90+ 0 to 69.9 70+ Web Land line Wire less
Party ID Difference...2-3-2 PARTY ID Dem-Rep 4 -48 -4 53 4 5 3 -3 83-1-3 PARTY ID Dem-Rep 7 -55 -1 62 10 5 4 -6 15
Q. 32 B. Coronavirus Voting Statements - Alternatives to in-person Election Day voting are non-partisan reforms meant to help Americans vote safely in the 2020 elections.Total Answering (1200) (302) (491) (408) (429) (771) (644) (116) (440)Strongly agree 41 26 40 53 38 43 34 35 52Somewhat agree 27 30 30 23 30 26 28 32 25Somewhat disagree 12 17 11 10 13 12 15 5 9Strongly disagree 10 18 10 4 8 11 9 16 9(Neither) 10 9 10 10 12 9 13 12 4(Don't know/refused) - - - - - - - - -Total agree 68 56 70 76 68 69 62 68 78Total disagree 22 35 21 14 21 22 25 21 18Total agree - Total disagree 47 21 49 63 47 47 38 47 60
Q. 32 C. Coronavirus Voting Statements - Expanded access to vote-by-mail would lead to higher levels of voter fraud.Total Answering (1200) (302) (491) (408) (429) (771) (644) (116) (440)Strongly agree 29 46 28 17 29 29 25 34 33Somewhat agree 23 23 23 22 25 22 26 19 19Somewhat disagree 15 11 17 16 17 14 17 11 14Strongly disagree 26 13 24 38 20 30 21 31 32(Neither) 8 6 8 7 10 6 12 4 2(Don't know/refused) - - - - - - - - -Total agree 52 70 51 39 54 50 51 54 52Total disagree 41 24 41 54 36 44 38 42 46Total agree - Total disagree 10 45 11 -16 17 7 13 11 6
Q. 32 D. Coronavirus Voting Statements - Proposals to expand access to early voting and vote-by-mail are a power grab by Democrats to defeat Donald Trump.Total Answering (1200) (302) (491) (408) (429) (771) (644) (116) (440)Strongly agree 23 37 20 16 23 23 20 28 25Somewhat agree 16 21 16 13 19 15 20 14 11Somewhat disagree 14 13 17 12 15 14 17 11 12Strongly disagree 38 21 38 49 30 42 30 41 47(Neither) 9 8 10 10 14 7 13 5 5(Don't know/refused) - - - - - - - - -Total agree 39 57 36 29 42 37 40 43 36Total disagree 52 34 55 61 44 56 47 52 59Total agree - Total disagree -13 23 -19 -33 -3 -19 -7 -10 -23
Q. 32 E. Coronavirus Voting Statements - The risk of exposure to coronavirus is a valid excuse for voting absentee rather than in-person on Election Day.Total Answering (1200) (302) (491) (408) (429) (771) (644) (116) (440)Strongly agree 44 31 42 55 41 45 36 46 54Somewhat agree 27 26 29 25 32 24 33 24 20Somewhat disagree 11 14 12 7 10 11 13 7 9Strongly disagree 14 26 13 8 11 17 12 22 16(Neither) 4 3 5 5 6 3 7 1 2(Don't know/refused) - - - - - - - - -Total agree 71 57 71 81 73 69 69 70 74Total disagree 25 41 25 14 21 28 25 29 25Total agree - Total disagree 45 16 46 66 52 41 44 41 49
TargetSmart Communications 1155 15th St, NW, Suite 750, Washington, DC 20005 targetsmart.com
156 of 228
Page 157
May 21-27, 2020
National Voter Insights Study
TargetSmart + Dynata
2-3-2 Party 3-1-3 Party Ideology Party ID/Ideology
Total Dem Ind Rep Dem Ind Rep Lib Mod ConsLib
Dem
Mod / Cons Dem
Mod / Lib Rep
Cons Rep
Party ID Difference...2-3-2 PARTY ID Dem-Rep 4 100 - -100 73 - -75 68 6 -52 100 100 -100 -1003-1-3 PARTY ID Dem-Rep 7 100 8 -100 100 - -100 85 10 -63 100 100 -100 -100
Q. 32 F. Coronavirus Voting Statements - Elections officials should only count vote-by-mail ballots that are postmarked by Election Day.Total Answering (1200) (415) (395) (362) (566) (124) (482) (304) (469) (368) (213) (189) (117) (239)Strongly agree 43 37 40 52 37 27 54 33 42 56 32 44 47 56Somewhat agree 26 29 26 22 27 36 22 28 30 18 32 26 30 18Somewhat disagree 13 16 14 8 17 11 8 17 13 9 18 14 6 10Strongly disagree 12 13 13 11 13 13 11 14 9 12 13 12 7 12(Neither) 7 6 8 7 6 12 5 9 7 4 5 5 10 5(Don't know/refused) - - - - - - - - - - - - - -Total agree 68 66 66 74 64 63 75 60 71 74 64 69 77 74Total disagree 25 28 26 19 30 24 19 31 22 22 30 26 13 22Total agree - Total disagree 44 38 40 55 34 39 56 29 49 52 34 44 64 52
Q. 32 G. Coronavirus Voting Statements - Elections officials should only count vote-by-mail ballots that are received by Election Day.Total Answering (1200) (415) (395) (362) (566) (124) (482) (304) (469) (368) (213) (189) (117) (239)Strongly agree 31 25 27 43 23 23 43 20 30 44 19 30 38 45Somewhat agree 25 26 24 24 26 23 24 23 29 20 24 28 32 21Somewhat disagree 17 20 17 13 19 19 14 20 17 14 22 18 13 14Strongly disagree 21 26 23 14 27 20 14 30 18 17 29 22 11 15(Neither) 7 4 8 6 5 15 5 8 6 5 5 3 6 6(Don't know/refused) - - - - - - - - - - - - - -Total agree 56 50 51 67 48 46 67 43 59 64 43 58 70 66Total disagree 38 45 41 27 47 39 28 50 36 31 52 40 24 28Total agree - Total disagree 18 5 10 40 2 7 39 -7 23 32 -8 18 45 38
Q. 32 H. Coronavirus Voting Statements - It is important to give registered voters the option to vote-by-mail so that they can choose to avoid potential exposure to the coronavirus.Total Answering (1200) (415) (395) (362) (566) (124) (482) (304) (469) (368) (213) (189) (117) (239)Strongly agree 54 72 55 32 73 44 34 73 53 38 75 68 31 32Somewhat agree 23 17 22 32 17 26 29 16 27 24 16 19 42 27Somewhat disagree 9 5 9 12 5 13 13 2 8 15 3 7 11 13Strongly disagree 11 4 10 19 4 7 20 4 8 20 4 5 10 23(Neither) 4 2 4 5 2 11 4 4 3 4 3 1 6 5(Don't know/refused) - - - - - - - - - - - - - -Total agree 77 89 76 64 90 70 63 90 81 62 91 87 73 59Total disagree 19 9 19 31 8 19 33 6 16 34 6 12 21 37Total agree - Total disagree 57 80 57 32 82 51 30 83 65 27 85 75 52 22
TargetSmart Communications 1155 15th St, NW, Suite 750, Washington, DC 20005 targetsmart.com
157 of 228
Page 158
May 21-27, 2020
National Voter Insights Study
TargetSmart + Dynata
Party ID/Gender
Total Dem MenDem
Women Ind MenInd
Women Rep MenRep
Women
Party ID Difference...2-3-2 PARTY ID Dem-Rep 4 100 100 - - -100 -1003-1-3 PARTY ID Dem-Rep 7 100 100 1 17 -100 -100
Q. 32 F. Coronavirus Voting Statements - Elections officials should only count vote-by-mail ballots that are postmarked by Election Day.Total Answering (1200) (157) (258) (219) (177) (186) (177)Strongly agree 43 38 37 46 33 54 50Somewhat agree 26 30 29 21 32 22 22Somewhat disagree 13 13 17 10 18 10 7Strongly disagree 12 16 11 14 11 10 13(Neither) 7 4 7 8 7 5 8(Don't know/refused) - - - - - - -Total agree 68 68 65 68 64 76 72Total disagree 25 28 28 24 29 19 20Total agree - Total disagree 44 40 37 43 35 57 52
Q. 32 G. Coronavirus Voting Statements - Elections officials should only count vote-by-mail ballots that are received by Election Day.Total Answering (1200) (157) (258) (219) (177) (186) (177)Strongly agree 31 24 25 32 21 45 41Somewhat agree 25 32 22 17 31 24 25Somewhat disagree 17 20 19 15 21 16 11Strongly disagree 21 22 28 27 19 10 17(Neither) 7 2 6 9 8 5 7(Don't know/refused) - - - - - - -Total agree 56 56 47 50 52 69 65Total disagree 38 42 47 42 40 26 28Total agree - Total disagree 18 14 0 8 13 43 37
Q. 32 H. Coronavirus Voting Statements - It is important to give registered voters the option to vote-by-mail so that they can choose to avoid potential exposure to the coronavirus.Total Answering (1200) (157) (258) (219) (177) (186) (177)Strongly agree 54 67 75 55 55 31 33Somewhat agree 23 15 18 15 30 32 31Somewhat disagree 9 9 2 11 7 13 12Strongly disagree 11 6 3 14 5 19 19(Neither) 4 2 2 5 4 5 5(Don't know/refused) - - - - - - -Total agree 77 83 93 70 84 63 64Total disagree 19 16 5 25 12 32 31Total agree - Total disagree 57 67 88 45 72 32 33
TargetSmart Communications 1155 15th St, NW, Suite 750, Washington, DC 20005 targetsmart.com
158 of 228
Page 159
May 21-27, 2020
National Voter Insights Study
TargetSmart + Dynata
Urbanicity
Total R1 R2 S3 S4 U5 U6 Rural Subu rban Urban
Party ID Difference...2-3-2 PARTY ID Dem-Rep 4 -23 -15 -2 9 22 42 -19 4 283-1-3 PARTY ID Dem-Rep 7 -23 -17 -1 12 26 52 -20 7 33
Q. 32 F. Coronavirus Voting Statements - Elections officials should only count vote-by-mail ballots that are postmarked by Election Day.Total Answering (1200) (179) (181) (195) (273) (264) (108) (360) (468) (372)Strongly agree 43 48 48 41 40 42 37 48 40 41Somewhat agree 26 26 26 28 24 26 23 26 25 25Somewhat disagree 13 6 15 14 15 11 17 11 14 13Strongly disagree 12 13 7 9 13 13 19 10 11 15(Neither) 7 7 4 9 10 8 4 6 9 7(Don't know/refused) - - - - - - - - - -Total agree 68 73 74 69 63 68 60 74 66 66Total disagree 25 19 22 23 27 24 36 21 25 28Total agree - Total disagree 44 54 52 46 36 44 24 53 40 38
Q. 32 G. Coronavirus Voting Statements - Elections officials should only count vote-by-mail ballots that are received by Election Day.Total Answering (1200) (179) (181) (195) (273) (264) (108) (360) (468) (372)Strongly agree 31 35 37 30 29 29 27 36 29 28Somewhat agree 25 26 27 26 21 25 24 27 23 25Somewhat disagree 17 14 16 20 17 16 16 15 18 16Strongly disagree 21 19 15 19 25 22 27 17 22 24(Neither) 7 6 5 6 9 8 5 5 8 7(Don't know/refused) - - - - - - - - - -Total agree 56 61 65 55 50 54 51 63 52 53Total disagree 38 33 31 39 41 38 44 32 40 40Total agree - Total disagree 18 27 34 17 8 16 8 31 12 14
Q. 32 H. Coronavirus Voting Statements - It is important to give registered voters the option to vote-by-mail so that they can choose to avoid potential exposure to the coronavirus.Total Answering (1200) (179) (181) (195) (273) (264) (108) (360) (468) (372)Strongly agree 54 46 44 54 52 62 65 45 53 63Somewhat agree 23 20 32 23 23 22 17 26 23 21Somewhat disagree 9 11 10 10 8 5 10 10 9 7Strongly disagree 11 20 13 9 12 5 4 16 11 5(Neither) 4 3 2 4 5 6 3 3 5 5(Don't know/refused) - - - - - - - - - -Total agree 77 66 76 77 74 84 82 71 75 84Total disagree 19 31 22 19 20 10 14 27 20 11Total agree - Total disagree 57 35 53 58 54 74 68 44 56 72
TargetSmart Communications 1155 15th St, NW, Suite 750, Washington, DC 20005 targetsmart.com
159 of 228
Page 160
May 21-27, 2020
National Voter Insights Study
TargetSmart + Dynata
Urbanicity/Gender
Total Rural MenRural
WomenSubu rban
MenSubu rban Women Urban Men
Urban Women
Party ID Difference...2-3-2 PARTY ID Dem-Rep 4 -23 -15 -4 12 13 393-1-3 PARTY ID Dem-Rep 7 -28 -13 -1 15 16 48
Q. 32 F. Coronavirus Voting Statements - Elections officials should only count vote-by-mail ballots that are postmarked by Election Day.Total Answering (1200) (180) (180) (227) (241) (164) (208)Strongly agree 43 56 39 42 39 42 39Somewhat agree 26 22 30 23 27 26 25Somewhat disagree 13 6 15 15 14 11 14Strongly disagree 12 11 9 13 9 15 15(Neither) 7 5 6 7 11 6 7(Don't know/refused) - - - - - - -Total agree 68 78 69 65 66 68 64Total disagree 25 17 24 28 23 25 29Total agree - Total disagree 44 61 45 37 43 43 35
Q. 32 G. Coronavirus Voting Statements - Elections officials should only count vote-by-mail ballots that are received by Election Day.Total Answering (1200) (180) (180) (227) (241) (164) (208)Strongly agree 31 41 31 33 26 30 27Somewhat agree 25 24 29 21 25 26 24Somewhat disagree 17 14 16 18 18 16 16Strongly disagree 21 16 18 21 23 22 25(Neither) 7 5 6 7 8 6 8(Don't know/refused) - - - - - - -Total agree 56 65 61 54 50 56 51Total disagree 38 30 33 39 41 38 41Total agree - Total disagree 18 34 27 15 9 18 10
Q. 32 H. Coronavirus Voting Statements - It is important to give registered voters the option to vote-by-mail so that they can choose to avoid potential exposure to the coronavirus.Total Answering (1200) (180) (180) (227) (241) (164) (208)Strongly agree 54 45 44 49 56 57 68Somewhat agree 23 21 31 22 24 21 20Somewhat disagree 9 12 9 11 7 9 5Strongly disagree 11 19 14 13 9 7 3(Neither) 4 2 3 5 5 6 5(Don't know/refused) - - - - - - -Total agree 77 66 75 71 80 78 88Total disagree 19 31 22 24 16 16 7Total agree - Total disagree 57 35 53 47 64 62 81
TargetSmart Communications 1155 15th St, NW, Suite 750, Washington, DC 20005 targetsmart.com
160 of 228
Page 161
May 21-27, 2020
National Voter Insights Study
TargetSmart + Dynata
Region by State
TotalBorder States
Califo rnia
Indust rial
Midw est
Lower Midw
estMid -
Atla ntic
Moun tain
States
Nati onal
Capi talNew
Engl and
Paci fic Northw
est SouthSouthe
ast
Upper Midw
est
Party ID Difference...2-3-2 PARTY ID Dem-Rep 4 4 19 -11 16 15 2 5 17 -7 -3 3 13-1-3 PARTY ID Dem-Rep 7 -5 27 -6 17 21 5 15 29 2 -9 8 -8
Q. 32 F. Coronavirus Voting Statements - Elections officials should only count vote-by-mail ballots that are postmarked by Election Day.Total Answering (1200) (132) (120) (157) (60) (158) (48) (60) (60) (48) (108) (193) (48)Strongly agree 43 45 46 41 40 38 54 47 21 54 49 41 37Somewhat agree 26 30 21 30 22 30 17 19 42 19 21 25 21Somewhat disagree 13 9 14 10 19 11 15 16 13 8 12 15 15Strongly disagree 12 9 13 16 13 12 12 9 6 13 12 11 15(Neither) 7 7 7 3 6 9 3 9 18 5 5 8 12(Don't know/refused) - - - - - - - - - - - - -Total agree 68 75 66 71 62 67 71 65 63 74 70 65 58Total disagree 25 18 27 26 32 24 27 25 19 21 24 27 30Total agree - Total disagree 44 57 40 45 31 44 44 40 43 52 46 39 28
Q. 32 G. Coronavirus Voting Statements - Elections officials should only count vote-by-mail ballots that are received by Election Day.Total Answering (1200) (132) (120) (157) (60) (158) (48) (60) (60) (48) (108) (193) (48)Strongly agree 31 25 26 38 30 30 40 26 19 40 36 30 29Somewhat agree 25 26 20 29 30 29 18 24 24 23 16 25 25Somewhat disagree 17 20 19 11 23 15 18 20 16 11 18 17 18Strongly disagree 21 21 29 20 14 18 21 23 22 22 24 21 12(Neither) 7 8 6 3 3 9 3 7 19 4 6 6 15(Don't know/refused) - - - - - - - - - - - - -Total agree 56 51 46 67 60 59 58 50 43 63 52 55 54Total disagree 38 40 48 30 36 32 39 43 38 33 42 39 30Total agree - Total disagree 18 11 -1 37 24 27 18 7 5 30 10 16 24
Q. 32 H. Coronavirus Voting Statements - It is important to give registered voters the option to vote-by-mail so that they can choose to avoid potential exposure to the coronavirus.Total Answering (1200) (132) (120) (157) (60) (158) (48) (60) (60) (48) (108) (193) (48)Strongly agree 54 51 65 57 52 46 67 56 52 65 50 51 44Somewhat agree 23 23 16 24 32 27 21 17 26 20 16 25 21Somewhat disagree 9 8 8 6 5 13 5 12 5 6 9 11 11Strongly disagree 11 11 7 11 8 8 5 14 6 7 19 10 17(Neither) 4 6 5 2 3 6 3 1 11 3 5 3 7(Don't know/refused) - - - - - - - - - - - - -Total agree 77 75 81 81 84 73 88 73 78 85 67 76 65Total disagree 19 19 15 18 13 21 9 26 11 13 28 21 28Total agree - Total disagree 57 55 66 63 70 52 79 47 67 72 38 56 37
TargetSmart Communications 1155 15th St, NW, Suite 750, Washington, DC 20005 targetsmart.com
161 of 228
Page 162
May 21-27, 2020
National Voter Insights Study
TargetSmart + Dynata
Gender Age
Total Men Women 18 - 34 35 - 49 50 - 64 Over 64 18 - 4950 and
over
Party ID Difference...2-3-2 PARTY ID Dem-Rep 4 -5 13 24 6 -2 -8 15 -53-1-3 PARTY ID Dem-Rep 7 -5 18 33 8 0 -10 21 -5
Q. 32 F. Coronavirus Voting Statements - Elections officials should only count vote-by-mail ballots that are postmarked by Election Day.Total Answering (1200) (571) (629) (281) (287) (310) (295) (568) (605)Strongly agree 43 46 39 28 43 46 52 36 49Somewhat agree 26 24 27 33 22 24 24 28 24Somewhat disagree 13 11 14 20 12 9 9 16 9Strongly disagree 12 13 11 11 14 13 11 12 12(Neither) 7 6 8 8 9 8 6 9 7(Don't know/refused) - - - - - - - - -Total agree 68 70 66 61 65 70 75 63 73Total disagree 25 24 25 31 26 23 19 29 21Total agree - Total disagree 44 46 41 30 39 47 56 35 52
Q. 32 G. Coronavirus Voting Statements - Elections officials should only count vote-by-mail ballots that are received by Election Day.Total Answering (1200) (571) (629) (281) (287) (310) (295) (568) (605)Strongly agree 31 35 28 24 33 31 36 29 33Somewhat agree 25 23 26 27 21 29 21 24 25Somewhat disagree 17 16 17 23 16 12 16 19 14Strongly disagree 21 20 22 20 20 21 23 20 22(Neither) 7 6 8 6 10 7 5 8 6(Don't know/refused) - - - - - - - - -Total agree 56 58 54 51 55 60 57 53 58Total disagree 38 36 39 43 35 33 39 39 36Total agree - Total disagree 18 22 15 8 20 26 18 14 22
Q. 32 H. Coronavirus Voting Statements - It is important to give registered voters the option to vote-by-mail so that they can choose to avoid potential exposure to the coronavirus.Total Answering (1200) (571) (629) (281) (287) (310) (295) (568) (605)Strongly agree 54 50 57 56 55 48 55 55 51Somewhat agree 23 21 25 24 22 24 21 23 23Somewhat disagree 9 11 7 9 7 10 9 8 10Strongly disagree 11 13 8 6 12 14 10 9 12(Neither) 4 4 4 5 5 4 4 5 4(Don't know/refused) - - - - - - - - -Total agree 77 71 81 81 77 72 76 79 74Total disagree 19 24 15 15 18 24 20 17 22Total agree - Total disagree 57 47 67 66 58 49 56 62 52
TargetSmart Communications 1155 15th St, NW, Suite 750, Washington, DC 20005 targetsmart.com
162 of 228
Page 163
May 21-27, 2020
National Voter Insights Study
TargetSmart + Dynata
Education Homeownership status Marital status
TotalH.S. or
lessPost H.S.
4yr Coll Grad
Post Grad
Coll ege Grad uate
Total Non Coll Rent Own
Marr ied Single
Separa ted / divo rced
Wido wed
Total Unmarr
ied
Party ID Difference...2-3-2 PARTY ID Dem-Rep 4 5 -3 6 13 9 0 32 -5 -11 30 10 -6 213-1-3 PARTY ID Dem-Rep 7 3 -1 9 20 14 0 44 -6 -13 42 12 -10 29
Q. 32 F. Coronavirus Voting Statements - Elections officials should only count vote-by-mail ballots that are postmarked by Election Day.Total Answering (1200) (210) (369) (363) (248) (610) (579) (297) (873) (618) (357) (144) (59) (560)Strongly agree 43 41 44 43 42 43 43 32 47 48 33 41 54 37Somewhat agree 26 24 22 27 30 28 23 27 25 22 32 25 22 29Somewhat disagree 13 11 14 12 12 12 13 17 12 12 16 11 9 14Strongly disagree 12 15 12 11 11 11 13 18 10 11 13 16 10 13(Neither) 7 9 8 7 4 6 8 7 7 7 8 8 5 7(Don't know/refused) - - - - - - - - - - - - - -Total agree 68 65 65 70 73 71 65 59 72 70 65 65 76 66Total disagree 25 26 27 23 24 23 26 34 22 23 28 27 19 27Total agree - Total disagree 44 39 39 47 49 48 39 25 50 47 37 38 57 39
Q. 32 G. Coronavirus Voting Statements - Elections officials should only count vote-by-mail ballots that are received by Election Day.Total Answering (1200) (210) (369) (363) (248) (610) (579) (297) (873) (618) (357) (144) (59) (560)Strongly agree 31 39 32 28 28 28 35 25 33 35 24 31 38 27Somewhat agree 25 24 23 26 26 26 23 26 24 22 27 29 20 27Somewhat disagree 17 12 17 17 20 18 15 19 16 16 20 12 16 18Strongly disagree 21 19 19 24 23 23 19 23 21 20 22 21 23 22(Neither) 7 6 10 5 4 5 9 8 6 6 7 8 3 7(Don't know/refused) - - - - - - - - - - - - - -Total agree 56 63 55 54 54 54 58 51 57 57 51 60 58 54Total disagree 38 31 35 41 43 41 34 42 37 36 42 33 39 39Total agree - Total disagree 18 32 19 14 11 13 24 10 21 21 8 27 20 14
Q. 32 H. Coronavirus Voting Statements - It is important to give registered voters the option to vote-by-mail so that they can choose to avoid potential exposure to the coronavirus.Total Answering (1200) (210) (369) (363) (248) (610) (579) (297) (873) (618) (357) (144) (59) (560)Strongly agree 54 52 49 55 60 57 50 60 51 48 65 47 59 59Somewhat agree 23 21 24 26 20 24 23 24 23 25 20 25 21 21Somewhat disagree 9 10 9 8 7 7 10 7 9 10 6 9 10 7Strongly disagree 11 11 12 9 10 10 12 6 12 14 6 13 3 7(Neither) 4 6 6 3 3 3 6 3 5 4 4 6 6 5(Don't know/refused) - - - - - - - - - - - - - -Total agree 77 73 73 81 80 80 73 84 74 73 84 73 80 81Total disagree 19 21 22 17 17 17 21 13 21 23 12 22 14 15Total agree - Total disagree 57 52 51 64 63 64 51 71 53 50 73 51 67 66
TargetSmart Communications 1155 15th St, NW, Suite 750, Washington, DC 20005 targetsmart.com
163 of 228
Page 164
May 21-27, 2020
National Voter Insights Study
TargetSmart + Dynata
Kids at home Religious attendance
Total Yes No
More than
once a week
Once a week
Once or twice a month
A few times a
year Seldom NeverFreq uent
Infreq uent
Seldom / Never
Party ID Difference...2-3-2 PARTY ID Dem-Rep 4 2 6 -10 -15 5 7 6 24 -14 6 163-1-3 PARTY ID Dem-Rep 7 5 9 -19 -17 -5 14 9 35 -17 7 24
Q. 32 F. Coronavirus Voting Statements - Elections officials should only count vote-by-mail ballots that are postmarked by Election Day.Total Answering (1200) (301) (876) (89) (251) (121) (190) (212) (301) (340) (311) (513)Strongly agree 43 44 42 61 42 41 48 36 40 47 46 38Somewhat agree 26 22 27 11 23 32 23 26 31 20 26 29Somewhat disagree 13 17 12 6 15 11 12 20 9 13 12 14Strongly disagree 12 12 12 19 13 12 13 9 12 14 12 10(Neither) 7 5 8 3 8 4 4 10 8 6 4 9(Don't know/refused) - - - - - - - - - - - -Total agree 68 67 69 72 65 73 71 61 71 67 72 67Total disagree 25 28 23 26 28 23 25 29 21 27 24 24Total agree - Total disagree 44 38 46 46 37 50 47 33 50 40 48 43
Q. 32 G. Coronavirus Voting Statements - Elections officials should only count vote-by-mail ballots that are received by Election Day.Total Answering (1200) (301) (876) (89) (251) (121) (190) (212) (301) (340) (311) (513)Strongly agree 31 34 30 41 35 28 34 28 26 36 32 27Somewhat agree 25 22 26 14 25 30 25 23 27 22 27 25Somewhat disagree 17 18 16 15 16 20 14 18 18 16 16 18Strongly disagree 21 20 21 28 17 19 23 23 22 20 21 22(Neither) 7 7 7 1 8 5 4 8 8 6 4 8(Don't know/refused) - - - - - - - - - - - -Total agree 56 55 56 55 60 57 60 51 53 58 59 52Total disagree 38 38 38 44 33 38 36 41 39 36 37 40Total agree - Total disagree 18 17 18 11 27 19 23 10 14 23 22 12
Q. 32 H. Coronavirus Voting Statements - It is important to give registered voters the option to vote-by-mail so that they can choose to avoid potential exposure to the coronavirus.Total Answering (1200) (301) (876) (89) (251) (121) (190) (212) (301) (340) (311) (513)Strongly agree 54 56 53 54 47 50 59 51 60 49 56 56Somewhat agree 23 24 23 18 30 23 20 22 21 27 21 22Somewhat disagree 9 6 9 8 8 8 12 10 7 8 11 8Strongly disagree 11 11 10 17 11 17 7 11 6 13 11 8(Neither) 4 3 5 2 4 2 2 7 5 4 2 6(Don't know/refused) - - - - - - - - - - - -Total agree 77 80 76 72 77 73 79 73 81 76 77 78Total disagree 19 17 19 25 19 25 20 20 13 21 22 16Total agree - Total disagree 57 63 57 47 58 48 59 53 68 55 55 62
TargetSmart Communications 1155 15th St, NW, Suite 750, Washington, DC 20005 targetsmart.com
164 of 228
Page 165
May 21-27, 2020
National Voter Insights Study
TargetSmart + Dynata
Gender/Age Gender/Education Age/Education
TotalYoun
ger MenOlder Men
Youn ger
WomenOlder
WomenNon Coll
MenColl Men
Non Coll Women
Coll Women
Youn ger Non
CollOlder
Non Coll
Youn ger Coll
egeOlder Coll
Party ID Difference...2-3-2 PARTY ID Dem-Rep 4 7 -15 21 6 -9 -2 7 19 6 -4 22 -53-1-3 PARTY ID Dem-Rep 7 12 -19 28 8 -12 1 10 26 8 -7 31 -3
Q. 32 F. Coronavirus Voting Statements - Elections officials should only count vote-by-mail ballots that are postmarked by Election Day.Total Answering (1200) (256) (301) (312) (304) (262) (307) (318) (304) (252) (316) (312) (285)Strongly agree 43 40 53 32 45 45 48 41 38 34 49 37 49Somewhat agree 26 25 23 30 25 21 26 24 30 23 22 32 25Somewhat disagree 13 15 7 18 11 11 11 15 14 19 8 14 10Strongly disagree 12 14 12 11 12 17 10 10 12 14 13 11 11(Neither) 7 7 6 10 8 7 6 10 6 10 7 6 6(Don't know/refused) - - - - - - - - - - - - -Total agree 68 64 75 62 70 66 74 65 68 57 71 68 73Total disagree 25 29 19 28 22 28 20 25 26 32 21 26 21Total agree - Total disagree 44 36 56 34 48 38 54 40 42 25 50 43 53
Q. 32 G. Coronavirus Voting Statements - Elections officials should only count vote-by-mail ballots that are received by Election Day.Total Answering (1200) (256) (301) (312) (304) (262) (307) (318) (304) (252) (316) (312) (285)Strongly agree 31 35 35 24 31 39 31 31 25 31 37 27 29Somewhat agree 25 23 24 26 26 21 25 25 27 23 22 25 27Somewhat disagree 17 17 15 21 13 14 18 16 18 19 12 20 17Strongly disagree 21 20 19 20 24 19 21 19 26 16 21 23 24(Neither) 7 6 6 10 6 7 5 10 5 10 8 5 4(Don't know/refused) - - - - - - - - - - - - -Total agree 56 57 59 49 57 60 56 55 52 54 60 52 56Total disagree 38 37 35 41 37 32 39 35 44 36 33 42 40Total agree - Total disagree 18 21 24 8 20 28 17 20 8 19 27 10 16
Q. 32 H. Coronavirus Voting Statements - It is important to give registered voters the option to vote-by-mail so that they can choose to avoid potential exposure to the coronavirus.Total Answering (1200) (256) (301) (312) (304) (262) (307) (318) (304) (252) (316) (312) (285)Strongly agree 54 55 45 56 57 48 52 52 61 51 49 58 54Somewhat agree 23 18 24 27 22 20 22 25 25 21 24 25 22Somewhat disagree 9 10 13 6 7 13 9 7 5 10 10 6 9Strongly disagree 11 12 14 7 10 14 13 10 6 11 13 8 12(Neither) 4 5 4 5 4 5 4 7 2 7 5 3 3(Don't know/refused) - - - - - - - - - - - - -Total agree 77 74 69 83 80 68 75 77 86 72 73 84 76Total disagree 19 22 27 12 17 27 22 17 12 21 22 14 21Total agree - Total disagree 57 52 42 70 63 41 53 60 74 52 51 70 56
TargetSmart Communications 1155 15th St, NW, Suite 750, Washington, DC 20005 targetsmart.com
165 of 228
Page 166
May 21-27, 2020
National Voter Insights Study
TargetSmart + Dynata
Marital Status/Gender Marital Status/Kids Trump Job Approval
Voting Permissions by State
Total
Marr ied
Men
Marr ied
WomenUnmarr ied Men
Unmarr ied
Women
Marr ied
with kids
Marr ied with out kids
Unmarr ied with
kids
Unmarr ied with out kids
Total appr ove
Total disapp rove All mail
Open early / mail Closed
Party ID Difference...2-3-2 PARTY ID Dem-Rep 4 -17 -5 9 30 -4 -15 19 22 -50 50 -9 4 83-1-3 PARTY ID Dem-Rep 7 -22 -4 16 39 -2 -19 22 31 -65 67 -5 9 8
Q. 32 F. Coronavirus Voting Statements - Elections officials should only count vote-by-mail ballots that are postmarked by Election Day.Total Answering (1200) (312) (306) (247) (313) (216) (400) (83) (471) (528) (626) (111) (605) (484)Strongly agree 43 54 42 37 37 44 49 44 36 50 37 55 43 40Somewhat agree 26 19 25 29 29 23 22 21 31 24 27 22 24 29Somewhat disagree 13 11 14 11 16 18 9 14 14 9 16 11 14 12Strongly disagree 12 11 11 15 12 10 12 16 12 11 13 10 13 11(Neither) 7 5 9 8 7 6 8 5 8 6 8 2 7 9(Don't know/refused) - - - - - - - - - - - - - -Total agree 68 73 67 66 66 67 71 64 67 73 64 77 66 68Total disagree 25 22 24 26 27 27 21 31 26 20 29 21 27 23Total agree - Total disagree 44 51 43 39 39 40 50 34 41 53 35 56 40 46
Q. 32 G. Coronavirus Voting Statements - Elections officials should only count vote-by-mail ballots that are received by Election Day.Total Answering (1200) (312) (306) (247) (313) (216) (400) (83) (471) (528) (626) (111) (605) (484)Strongly agree 31 39 31 29 25 33 36 33 26 42 22 42 30 30Somewhat agree 25 21 24 27 27 23 22 20 28 27 23 20 26 24Somewhat disagree 17 17 15 16 19 18 15 20 18 12 21 16 16 18Strongly disagree 21 19 22 21 23 19 21 23 21 13 28 19 22 20(Neither) 7 5 8 8 6 7 6 5 7 6 7 3 6 9(Don't know/refused) - - - - - - - - - - - - - -Total agree 56 59 55 56 52 56 58 53 54 69 45 62 56 54Total disagree 38 36 37 37 42 37 36 42 39 25 49 35 38 37Total agree - Total disagree 18 23 18 19 11 20 22 10 15 44 -4 28 18 16
Q. 32 H. Coronavirus Voting Statements - It is important to give registered voters the option to vote-by-mail so that they can choose to avoid potential exposure to the coronavirus.Total Answering (1200) (312) (306) (247) (313) (216) (400) (83) (471) (528) (626) (111) (605) (484)Strongly agree 54 48 48 52 65 52 46 65 59 32 71 61 55 50Somewhat agree 23 21 29 22 21 27 24 17 22 30 19 22 24 22Somewhat disagree 9 11 8 11 4 7 11 4 8 14 5 9 8 9Strongly disagree 11 16 11 11 5 11 15 11 6 20 3 5 9 13(Neither) 4 5 4 4 5 3 5 4 5 5 3 3 4 5(Don't know/refused) - - - - - - - - - - - - - -Total agree 77 69 77 74 86 79 70 82 82 61 90 83 79 72Total disagree 19 27 20 22 9 18 26 15 14 34 7 15 17 23Total agree - Total disagree 57 42 57 52 78 61 44 67 68 27 83 68 62 49
TargetSmart Communications 1155 15th St, NW, Suite 750, Washington, DC 20005 targetsmart.com
166 of 228
Page 167
May 21-27, 2020
National Voter Insights Study
TargetSmart + Dynata
Permanent Absentee Voter
Status
Ever Voted Early or By Mail
First Time Voters in 2018 2016 Vote History TargetSmart Voter Score
Total PAVNot PAV Yes No Yes No Voted
Did not Vote
Was Not
Regist ered
Super Voter
Freq uent Voter
Infreq uent Voter
Never Voted
Party ID Difference...2-3-2 PARTY ID Dem-Rep 4 16 3 1 5 4 5 2 4 17 0 1 9 73-1-3 PARTY ID Dem-Rep 7 22 5 0 9 9 7 2 8 26 -4 5 13 14
Q. 32 F. Coronavirus Voting Statements - Elections officials should only count vote-by-mail ballots that are postmarked by Election Day.Total Answering (1200) (130) (1070) (220) (980) (176) (1024) (757) (266) (177) (221) (393) (393) (137)Strongly agree 43 49 42 48 41 31 45 48 35 32 57 45 39 34Somewhat agree 26 24 26 25 26 28 25 23 30 31 19 25 28 27Somewhat disagree 13 13 13 11 13 13 13 12 14 14 7 11 17 13Strongly disagree 12 10 12 10 13 14 12 12 10 15 10 13 11 17(Neither) 7 5 8 7 8 15 6 6 11 8 7 6 6 9(Don't know/refused) - - - - - - - - - - - - - -Total agree 68 73 68 73 67 58 70 70 65 63 76 70 66 62Total disagree 25 23 25 20 26 27 24 24 24 29 17 24 28 30Total agree - Total disagree 44 50 43 53 41 31 46 47 41 34 59 46 38 32
Q. 32 G. Coronavirus Voting Statements - Elections officials should only count vote-by-mail ballots that are received by Election Day.Total Answering (1200) (130) (1070) (220) (980) (176) (1024) (757) (266) (177) (221) (393) (393) (137)Strongly agree 31 34 31 31 31 23 33 35 27 23 36 35 29 24Somewhat agree 25 21 25 26 24 28 24 22 33 23 20 22 28 29Somewhat disagree 17 17 17 19 16 16 17 17 13 22 14 18 17 14Strongly disagree 21 25 21 19 21 20 21 22 17 23 24 20 20 23(Neither) 7 4 7 6 7 14 6 6 10 9 6 6 6 10(Don't know/refused) - - - - - - - - - - - - - -Total agree 56 54 56 57 55 51 56 56 60 46 56 56 58 53Total disagree 38 42 37 38 38 36 38 38 30 45 38 38 37 37Total agree - Total disagree 18 13 19 19 18 15 19 18 30 1 19 18 21 16
Q. 32 H. Coronavirus Voting Statements - It is important to give registered voters the option to vote-by-mail so that they can choose to avoid potential exposure to the coronavirus.Total Answering (1200) (130) (1070) (220) (980) (176) (1024) (757) (266) (177) (221) (393) (393) (137)Strongly agree 54 69 52 51 54 45 55 54 52 55 57 54 55 50Somewhat agree 23 14 24 21 24 27 22 22 26 25 17 24 23 26Somewhat disagree 9 7 9 11 8 9 9 9 9 8 11 8 8 7Strongly disagree 11 6 11 12 10 11 10 12 6 10 10 11 11 14(Neither) 4 4 5 5 4 8 4 4 7 2 5 4 4 3(Don't know/refused) - - - - - - - - - - - - - -Total agree 77 83 76 72 78 72 77 75 78 80 75 78 78 76Total disagree 19 13 20 23 18 20 19 21 15 18 21 19 19 21Total agree - Total disagree 57 70 56 49 59 52 58 55 63 61 54 59 59 55
TargetSmart Communications 1155 15th St, NW, Suite 750, Washington, DC 20005 targetsmart.com
167 of 228
Page 168
May 21-27, 2020
National Voter Insights Study
TargetSmart + Dynata
Partisan Score Presidential General Turnout Score Mode
Total 0 to 9.9 10 to 89.9 90+ 0 to 69.9 70+ Web Land line Wire less
Party ID Difference...2-3-2 PARTY ID Dem-Rep 4 -48 -4 53 4 5 3 -3 83-1-3 PARTY ID Dem-Rep 7 -55 -1 62 10 5 4 -6 15
Q. 32 F. Coronavirus Voting Statements - Elections officials should only count vote-by-mail ballots that are postmarked by Election Day.Total Answering (1200) (302) (491) (408) (429) (771) (644) (116) (440)Strongly agree 43 50 40 40 35 47 34 56 52Somewhat agree 26 24 28 23 29 24 30 18 21Somewhat disagree 13 10 14 13 13 12 15 6 11Strongly disagree 12 10 11 15 13 12 9 19 14(Neither) 7 6 7 9 10 6 12 1 2(Don't know/refused) - - - - - - - - -Total agree 68 74 68 63 64 71 64 74 72Total disagree 25 20 25 28 26 24 24 25 26Total agree - Total disagree 44 54 44 35 38 47 40 49 47
Q. 32 G. Coronavirus Voting Statements - Elections officials should only count vote-by-mail ballots that are received by Election Day.Total Answering (1200) (302) (491) (408) (429) (771) (644) (116) (440)Strongly agree 31 42 29 26 26 34 26 41 36Somewhat agree 25 24 26 23 30 22 30 14 20Somewhat disagree 17 15 17 17 16 17 18 15 16Strongly disagree 21 14 21 26 18 22 16 29 26(Neither) 7 5 7 9 10 5 11 1 3(Don't know/refused) - - - - - - - - -Total agree 56 66 55 48 56 55 56 55 56Total disagree 38 30 38 43 34 40 34 44 41Total agree - Total disagree 18 36 18 5 22 16 22 11 15
Q. 32 H. Coronavirus Voting Statements - It is important to give registered voters the option to vote-by-mail so that they can choose to avoid potential exposure to the coronavirus.Total Answering (1200) (302) (491) (408) (429) (771) (644) (116) (440)Strongly agree 54 37 50 69 51 55 45 62 64Somewhat agree 23 29 26 16 25 22 27 17 18Somewhat disagree 9 11 9 7 9 8 12 5 5Strongly disagree 11 18 12 4 9 12 9 15 12(Neither) 4 5 4 5 6 3 7 1 1(Don't know/refused) - - - - - - - - -Total agree 77 65 76 85 76 77 72 79 82Total disagree 19 30 20 10 18 20 21 20 17Total agree - Total disagree 57 36 56 75 58 57 52 59 65
TargetSmart Communications 1155 15th St, NW, Suite 750, Washington, DC 20005 targetsmart.com
168 of 228
Page 169
May 21-27, 2020
National Voter Insights Study
TargetSmart + Dynata
2-3-2 Party 3-1-3 Party Ideology Party ID/Ideology
Total Dem Ind Rep Dem Ind Rep Lib Mod ConsLib
Dem
Mod / Cons Dem
Mod / Lib Rep
Cons Rep
Party ID Difference...2-3-2 PARTY ID Dem-Rep 4 100 - -100 73 - -75 68 6 -52 100 100 -100 -1003-1-3 PARTY ID Dem-Rep 7 100 8 -100 100 - -100 85 10 -63 100 100 -100 -100
Q. 33 A. Statement Pair - Election Security vs. Evidence of SuccessTotal Answering (1200) (415) (395) (362) (566) (124) (482) (304) (469) (368) (213) (189) (117) (239)Democrats much more 40 72 38 7 71 29 8 72 40 15 78 65 7 7Democrats somewhat more 14 16 16 10 17 12 11 12 16 13 11 22 10 10Trump somewhat more 11 4 11 18 5 7 18 6 12 14 5 3 25 15Trump much more 22 2 17 50 2 14 47 2 17 45 1 3 37 56(Both) 5 3 7 6 2 14 6 3 6 5 2 3 9 4(Neither) 7 2 11 7 2 20 9 4 8 6 2 2 11 6(Don't know/refused) 3 2 2 2 2 4 2 1 2 2 2 2 1 2Total Democrats 53 88 53 17 87 41 19 84 56 28 89 87 18 17Total Trump 32 6 28 68 7 22 65 7 29 59 6 6 62 71Total Democrats - Total Trump 21 82 26 -52 80 19 -47 77 27 -31 83 80 -44 -55
Q. 33 B. Statement Pair - Power grab vs. Stronger Electorate/SafetyTotal Answering (1200) (415) (395) (362) (566) (124) (482) (304) (469) (368) (213) (189) (117) (239)Democrats much more 41 74 41 8 73 31 10 74 42 17 79 67 8 8Democrats somewhat more 14 15 16 10 16 15 11 14 16 13 12 20 11 10Trump somewhat more 9 3 11 16 3 5 18 2 11 14 1 5 20 14Trump much more 21 2 14 51 2 13 46 3 16 44 2 4 39 56(Both) 4 2 5 6 2 11 5 3 5 4 3 1 9 4(Neither) 7 3 11 8 3 19 9 4 8 7 2 2 12 7(Don't know/refused) 3 1 2 1 1 5 1 1 3 1 1 1 2 1Total Democrats 55 89 57 18 89 46 21 87 58 30 91 87 20 18Total Trump 31 5 25 67 5 19 65 5 27 58 3 8 59 70Total Democrats - Total Trump 25 84 32 -49 84 27 -44 83 31 -29 88 79 -39 -52
TargetSmart Communications 1155 15th St, NW, Suite 750, Washington, DC 20005 targetsmart.com
169 of 228
Page 170
May 21-27, 2020
National Voter Insights Study
TargetSmart + Dynata
Party ID/Gender
Total Dem MenDem
Women Ind MenInd
Women Rep MenRep
Women
Party ID Difference...2-3-2 PARTY ID Dem-Rep 4 100 100 - - -100 -1003-1-3 PARTY ID Dem-Rep 7 100 100 1 17 -100 -100
Q. 33 A. Statement Pair - Election Security vs. Evidence of SuccessTotal Answering (1200) (157) (258) (219) (177) (186) (177)Democrats much more 40 69 74 38 37 10 3Democrats somewhat more 14 19 14 17 15 10 10Trump somewhat more 11 5 3 10 13 15 21Trump much more 22 3 2 18 14 54 47(Both) 5 3 2 5 9 7 5(Neither) 7 1 2 11 11 6 9(Don't know/refused) 3 - 3 2 1 - 4Total Democrats 53 88 88 54 52 20 14Total Trump 32 8 5 28 27 68 68Total Democrats - Total Trump 21 80 83 26 25 -49 -55
Q. 33 B. Statement Pair - Power grab vs. Stronger Electorate/SafetyTotal Answering (1200) (157) (258) (219) (177) (186) (177)Democrats much more 41 70 76 42 40 12 4Democrats somewhat more 14 17 14 15 17 8 13Trump somewhat more 9 4 2 10 12 16 15Trump much more 21 4 1 17 11 54 48(Both) 4 1 2 3 7 5 6(Neither) 7 3 2 11 10 5 11(Don't know/refused) 3 0 2 2 3 - 3Total Democrats 55 87 90 57 57 20 17Total Trump 31 9 4 27 23 70 63Total Democrats - Total Trump 25 78 87 30 34 -51 -46
TargetSmart Communications 1155 15th St, NW, Suite 750, Washington, DC 20005 targetsmart.com
170 of 228
Page 171
May 21-27, 2020
National Voter Insights Study
TargetSmart + Dynata
Urbanicity
Total R1 R2 S3 S4 U5 U6 Rural Subu rban Urban
Party ID Difference...2-3-2 PARTY ID Dem-Rep 4 -23 -15 -2 9 22 42 -19 4 283-1-3 PARTY ID Dem-Rep 7 -23 -17 -1 12 26 52 -20 7 33
Q. 33 A. Statement Pair - Election Security vs. Evidence of SuccessTotal Answering (1200) (179) (181) (195) (273) (264) (108) (360) (468) (372)Democrats much more 40 27 30 38 39 49 55 29 39 51Democrats somewhat more 14 8 12 13 14 17 18 10 14 17Trump somewhat more 11 8 23 12 9 6 7 16 11 6Trump much more 22 35 23 22 21 17 10 29 21 15(Both) 5 9 4 3 4 6 3 7 4 5(Neither) 7 9 7 7 9 4 5 8 8 4(Don't know/refused) 3 4 1 5 3 2 3 2 4 2Total Democrats 53 35 43 51 54 66 73 39 53 68Total Trump 32 43 46 34 30 23 17 44 32 21Total Democrats - Total Trump 21 -8 -3 17 23 43 56 -6 21 47
Q. 33 B. Statement Pair - Power grab vs. Stronger Electorate/SafetyTotal Answering (1200) (179) (181) (195) (273) (264) (108) (360) (468) (372)Democrats much more 41 29 31 39 43 51 56 30 41 53Democrats somewhat more 14 7 15 12 16 16 17 11 14 16Trump somewhat more 9 12 12 11 9 6 10 12 10 7Trump much more 21 34 27 22 19 16 7 31 20 13(Both) 4 5 6 3 3 5 2 6 3 4(Neither) 7 11 8 6 7 5 5 9 7 5(Don't know/refused) 3 1 1 7 3 2 3 1 5 2Total Democrats 55 36 46 51 59 67 73 41 56 69Total Trump 31 46 39 33 28 21 17 43 30 20Total Democrats - Total Trump 25 -10 6 18 31 46 56 -2 26 49
TargetSmart Communications 1155 15th St, NW, Suite 750, Washington, DC 20005 targetsmart.com
171 of 228
Page 172
May 21-27, 2020
National Voter Insights Study
TargetSmart + Dynata
Urbanicity/Gender
Total Rural MenRural
WomenSubu rban
MenSubu rban Women Urban Men
Urban Women
Party ID Difference...2-3-2 PARTY ID Dem-Rep 4 -23 -15 -4 12 13 393-1-3 PARTY ID Dem-Rep 7 -28 -13 -1 15 16 48
Q. 33 A. Statement Pair - Election Security vs. Evidence of SuccessTotal Answering (1200) (180) (180) (227) (241) (164) (208)Democrats much more 40 31 26 37 40 42 58Democrats somewhat more 14 13 7 14 13 17 17Trump somewhat more 11 14 18 9 13 8 4Trump much more 22 33 25 24 19 19 12(Both) 5 4 9 5 3 7 4(Neither) 7 6 11 9 7 5 4(Don't know/refused) 3 - 5 3 5 1 2Total Democrats 53 44 34 51 54 60 74Total Trump 32 47 42 32 31 27 16Total Democrats - Total Trump 21 -3 -8 19 23 32 59
Q. 33 B. Statement Pair - Power grab vs. Stronger Electorate/SafetyTotal Answering (1200) (180) (180) (227) (241) (164) (208)Democrats much more 41 32 28 41 42 45 59Democrats somewhat more 14 14 9 12 17 15 17Trump somewhat more 9 10 13 11 8 10 5Trump much more 21 35 27 24 17 18 10(Both) 4 3 9 3 3 4 4(Neither) 7 6 13 7 7 8 3(Don't know/refused) 3 0 2 3 6 1 3Total Democrats 55 46 37 53 58 60 76Total Trump 31 45 40 35 25 27 14Total Democrats - Total Trump 25 0 -4 18 33 33 61
TargetSmart Communications 1155 15th St, NW, Suite 750, Washington, DC 20005 targetsmart.com
172 of 228
Page 173
May 21-27, 2020
National Voter Insights Study
TargetSmart + Dynata
Region by State
TotalBorder States
Califo rnia
Indust rial
Midw est
Lower Midw
estMid -
Atla ntic
Moun tain
States
Nati onal
Capi talNew
Engl and
Paci fic Northw
est SouthSouthe
ast
Upper Midw
est
Party ID Difference...2-3-2 PARTY ID Dem-Rep 4 4 19 -11 16 15 2 5 17 -7 -3 3 13-1-3 PARTY ID Dem-Rep 7 -5 27 -6 17 21 5 15 29 2 -9 8 -8
Q. 33 A. Statement Pair - Election Security vs. Evidence of SuccessTotal Answering (1200) (132) (120) (157) (60) (158) (48) (60) (60) (48) (108) (193) (48)Democrats much more 40 33 55 37 33 41 42 44 31 47 35 40 34Democrats somewhat more 14 15 8 13 20 14 18 20 21 14 6 13 15Trump somewhat more 11 9 8 9 15 11 9 12 10 7 17 10 12Trump much more 22 25 17 22 17 18 16 18 18 23 30 21 31(Both) 5 6 4 5 7 11 4 5 3 1 2 4 -(Neither) 7 8 6 10 6 3 8 - 10 5 8 8 6(Don't know/refused) 3 4 1 3 2 2 2 2 7 3 3 3 3Total Democrats 53 48 64 51 53 55 60 64 52 61 41 53 49Total Trump 32 34 26 31 32 29 25 30 28 30 47 31 43Total Democrats - Total Trump 21 14 38 20 21 26 35 34 24 31 -6 22 6
Q. 33 B. Statement Pair - Power grab vs. Stronger Electorate/SafetyTotal Answering (1200) (132) (120) (157) (60) (158) (48) (60) (60) (48) (108) (193) (48)Democrats much more 41 39 55 40 37 41 47 45 31 46 37 41 43Democrats somewhat more 14 14 10 15 17 15 19 13 27 13 9 14 4Trump somewhat more 9 9 7 8 18 10 7 12 8 12 12 8 8Trump much more 21 23 16 21 14 22 14 20 13 23 33 20 33(Both) 4 2 5 6 3 6 2 4 8 1 2 4 -(Neither) 7 8 6 9 8 5 8 - 6 2 6 10 9(Don't know/refused) 3 4 - 2 3 2 2 6 8 3 2 3 4Total Democrats 55 53 66 55 53 56 66 58 57 59 46 55 47Total Trump 31 32 23 29 33 32 21 32 21 35 45 28 41Total Democrats - Total Trump 25 22 43 26 21 24 45 25 37 24 1 27 6
TargetSmart Communications 1155 15th St, NW, Suite 750, Washington, DC 20005 targetsmart.com
173 of 228
Page 174
May 21-27, 2020
National Voter Insights Study
TargetSmart + Dynata
Gender Age
Total Men Women 18 - 34 35 - 49 50 - 64 Over 64 18 - 4950 and
over
Party ID Difference...2-3-2 PARTY ID Dem-Rep 4 -5 13 24 6 -2 -8 15 -53-1-3 PARTY ID Dem-Rep 7 -5 18 33 8 0 -10 21 -5
Q. 33 A. Statement Pair - Election Security vs. Evidence of SuccessTotal Answering (1200) (571) (629) (281) (287) (310) (295) (568) (605)Democrats much more 40 37 42 41 40 37 42 40 39Democrats somewhat more 14 15 13 18 15 11 10 17 11Trump somewhat more 11 10 11 13 10 11 8 11 10Trump much more 22 25 18 10 22 27 26 16 27(Both) 5 5 5 6 3 6 6 5 6(Neither) 7 7 7 8 8 7 5 8 6(Don't know/refused) 3 2 4 4 2 2 3 3 2Total Democrats 53 51 55 59 55 48 52 57 50Total Trump 32 35 29 23 32 38 35 27 36Total Democrats - Total Trump 21 16 26 36 23 10 17 29 13
Q. 33 B. Statement Pair - Power grab vs. Stronger Electorate/SafetyTotal Answering (1200) (571) (629) (281) (287) (310) (295) (568) (605)Democrats much more 41 39 44 45 43 35 43 44 39Democrats somewhat more 14 13 14 16 15 16 8 16 12Trump somewhat more 9 10 9 9 9 10 10 9 10Trump much more 21 26 17 11 21 28 26 16 27(Both) 4 3 5 5 4 4 3 5 4(Neither) 7 7 7 10 7 6 5 8 6(Don't know/refused) 3 2 4 4 3 1 4 3 3Total Democrats 55 52 58 61 57 51 52 59 51Total Trump 31 36 26 20 29 37 36 25 37Total Democrats - Total Trump 25 17 32 41 28 14 16 35 15
TargetSmart Communications 1155 15th St, NW, Suite 750, Washington, DC 20005 targetsmart.com
174 of 228
Page 175
May 21-27, 2020
National Voter Insights Study
TargetSmart + Dynata
Education Homeownership status Marital status
TotalH.S. or
lessPost H.S.
4yr Coll Grad
Post Grad
Coll ege Grad uate
Total Non Coll Rent Own
Marr ied Single
Separa ted / divo rced
Wido wed
Total Unmarr
ied
Party ID Difference...2-3-2 PARTY ID Dem-Rep 4 5 -3 6 13 9 0 32 -5 -11 30 10 -6 213-1-3 PARTY ID Dem-Rep 7 3 -1 9 20 14 0 44 -6 -13 42 12 -10 29
Q. 33 A. Statement Pair - Election Security vs. Evidence of SuccessTotal Answering (1200) (210) (369) (363) (248) (610) (579) (297) (873) (618) (357) (144) (59) (560)Democrats much more 40 34 33 45 47 46 33 49 37 33 51 43 35 47Democrats somewhat more 14 12 14 16 13 15 13 18 13 13 15 12 17 14Trump somewhat more 11 12 11 10 10 10 12 7 12 13 7 8 16 8Trump much more 22 30 24 18 16 17 26 11 25 28 13 21 11 15(Both) 5 4 6 5 6 5 5 4 6 5 5 7 5 5(Neither) 7 6 9 4 8 6 8 7 7 6 7 9 8 8(Don't know/refused) 3 3 3 2 1 2 3 5 2 1 3 2 8 3Total Democrats 53 46 47 61 60 60 46 67 49 46 66 54 52 61Total Trump 32 42 36 28 26 27 38 18 37 41 20 28 27 23Total Democrats - Total Trump 21 4 11 33 35 34 8 48 12 5 46 26 25 39
Q. 33 B. Statement Pair - Power grab vs. Stronger Electorate/SafetyTotal Answering (1200) (210) (369) (363) (248) (610) (579) (297) (873) (618) (357) (144) (59) (560)Democrats much more 41 33 37 48 48 48 35 53 38 34 55 42 33 50Democrats somewhat more 14 16 14 14 14 14 14 18 13 13 15 12 23 15Trump somewhat more 9 11 11 7 9 8 11 6 11 13 5 6 15 6Trump much more 21 27 24 20 15 18 25 9 25 27 13 23 11 15(Both) 4 3 5 3 5 4 4 3 5 4 3 6 6 4(Neither) 7 6 7 7 7 7 7 8 7 7 6 9 7 7(Don't know/refused) 3 4 3 2 2 2 3 4 2 2 3 2 5 3Total Democrats 55 49 50 61 62 61 50 70 51 48 70 54 56 65Total Trump 31 38 35 27 24 26 36 15 36 39 18 29 26 22Total Democrats - Total Trump 25 11 15 35 38 36 13 55 14 8 52 25 30 43
TargetSmart Communications 1155 15th St, NW, Suite 750, Washington, DC 20005 targetsmart.com
175 of 228
Page 176
May 21-27, 2020
National Voter Insights Study
TargetSmart + Dynata
Kids at home Religious attendance
Total Yes No
More than
once a week
Once a week
Once or twice a month
A few times a
year Seldom NeverFreq uent
Infreq uent
Seldom / Never
Party ID Difference...2-3-2 PARTY ID Dem-Rep 4 2 6 -10 -15 5 7 6 24 -14 6 163-1-3 PARTY ID Dem-Rep 7 5 9 -19 -17 -5 14 9 35 -17 7 24
Q. 33 A. Statement Pair - Election Security vs. Evidence of SuccessTotal Answering (1200) (301) (876) (89) (251) (121) (190) (212) (301) (340) (311) (513)Democrats much more 40 38 40 34 35 26 43 39 51 35 36 46Democrats somewhat more 14 17 13 7 13 21 18 11 14 12 19 13Trump somewhat more 11 12 11 13 12 12 11 9 10 12 12 9Trump much more 22 20 22 30 28 25 20 21 13 29 22 16(Both) 5 3 6 6 3 8 4 7 5 4 6 6(Neither) 7 9 6 6 8 8 3 7 7 8 5 7(Don't know/refused) 3 2 3 3 2 1 - 7 2 2 0 4Total Democrats 53 55 53 41 48 46 61 50 64 46 55 58Total Trump 32 32 33 43 40 37 32 30 22 41 34 25Total Democrats - Total Trump 21 23 21 -2 8 10 30 20 42 5 22 33
Q. 33 B. Statement Pair - Power grab vs. Stronger Electorate/SafetyTotal Answering (1200) (301) (876) (89) (251) (121) (190) (212) (301) (340) (311) (513)Democrats much more 41 38 43 34 35 30 43 42 54 35 38 49Democrats somewhat more 14 18 13 9 10 21 22 11 14 10 21 13Trump somewhat more 9 10 10 12 13 11 6 10 7 13 8 8Trump much more 21 18 22 28 26 24 22 20 13 27 23 16(Both) 4 5 4 1 4 6 4 4 5 3 5 4(Neither) 7 7 7 9 9 8 3 9 6 9 5 7(Don't know/refused) 3 4 2 7 2 1 - 5 2 4 0 3Total Democrats 55 56 56 43 46 51 64 53 67 45 59 61Total Trump 31 28 31 40 40 35 29 30 20 40 31 24Total Democrats - Total Trump 25 28 25 3 6 16 36 22 48 5 28 37
TargetSmart Communications 1155 15th St, NW, Suite 750, Washington, DC 20005 targetsmart.com
176 of 228
Page 177
May 21-27, 2020
National Voter Insights Study
TargetSmart + Dynata
Gender/Age Gender/Education Age/Education
TotalYoun
ger MenOlder Men
Youn ger
WomenOlder
WomenNon Coll
MenColl Men
Non Coll Women
Coll Women
Youn ger Non
CollOlder
Non Coll
Youn ger Coll
egeOlder Coll
Party ID Difference...2-3-2 PARTY ID Dem-Rep 4 7 -15 21 6 -9 -2 7 19 6 -4 22 -53-1-3 PARTY ID Dem-Rep 7 12 -19 28 8 -12 1 10 26 8 -7 31 -3
Q. 33 A. Statement Pair - Election Security vs. Evidence of SuccessTotal Answering (1200) (256) (301) (312) (304) (262) (307) (318) (304) (252) (316) (312) (285)Democrats much more 40 37 36 43 42 30 43 37 49 32 35 47 45Democrats somewhat more 14 19 11 15 11 16 14 10 16 14 12 19 9Trump somewhat more 11 10 10 13 9 11 9 12 10 14 10 10 10Trump much more 22 21 29 12 24 29 22 24 12 21 31 12 22(Both) 5 4 6 5 5 6 5 5 5 6 5 3 7(Neither) 7 8 6 9 6 7 6 8 5 11 6 6 5(Don't know/refused) 3 1 2 4 3 1 1 4 3 2 3 2 2Total Democrats 53 57 47 57 53 45 57 47 64 46 47 66 54Total Trump 32 30 39 25 33 40 32 36 22 35 41 22 32Total Democrats - Total Trump 21 26 7 32 20 5 25 11 42 11 6 45 22
Q. 33 B. Statement Pair - Power grab vs. Stronger Electorate/SafetyTotal Answering (1200) (256) (301) (312) (304) (262) (307) (318) (304) (252) (316) (312) (285)Democrats much more 41 44 35 44 43 34 44 36 52 35 36 52 43Democrats somewhat more 14 15 12 16 13 13 14 15 14 15 13 16 11Trump somewhat more 9 8 12 10 8 12 9 11 7 12 10 7 9Trump much more 21 22 30 11 24 31 22 21 14 19 31 13 23(Both) 4 4 3 6 4 3 4 5 5 6 3 4 5(Neither) 7 9 6 8 6 6 8 7 7 9 5 8 7(Don't know/refused) 3 1 3 5 2 2 1 5 3 4 3 1 3Total Democrats 55 58 47 60 56 47 57 52 66 50 49 67 54Total Trump 31 29 42 21 32 42 31 32 20 31 41 20 32Total Democrats - Total Trump 25 29 5 39 24 5 27 20 46 19 8 47 23
TargetSmart Communications 1155 15th St, NW, Suite 750, Washington, DC 20005 targetsmart.com
177 of 228
Page 178
May 21-27, 2020
National Voter Insights Study
TargetSmart + Dynata
Marital Status/Gender Marital Status/Kids Trump Job Approval
Voting Permissions by State
Total
Marr ied
Men
Marr ied
WomenUnmarr ied Men
Unmarr ied
Women
Marr ied
with kids
Marr ied with out kids
Unmarr ied with
kids
Unmarr ied with out kids
Total appr ove
Total disapp rove All mail
Open early / mail Closed
Party ID Difference...2-3-2 PARTY ID Dem-Rep 4 -17 -5 9 30 -4 -15 19 22 -50 50 -9 4 83-1-3 PARTY ID Dem-Rep 7 -22 -4 16 39 -2 -19 22 31 -65 67 -5 9 8
Q. 33 A. Statement Pair - Election Security vs. Evidence of SuccessTotal Answering (1200) (312) (306) (247) (313) (216) (400) (83) (471) (528) (626) (111) (605) (484)Democrats much more 40 34 32 40 53 34 33 50 47 7 68 40 43 35Democrats somewhat more 14 14 13 16 13 18 11 13 15 12 16 14 14 14Trump somewhat more 11 13 14 7 9 14 13 7 9 19 4 10 10 12Trump much more 22 30 27 20 10 21 31 16 15 46 2 22 21 22(Both) 5 4 6 7 4 3 6 4 6 6 4 4 5 6(Neither) 7 6 6 8 7 8 5 9 6 8 5 8 6 8(Don't know/refused) 3 0 3 2 5 2 1 3 3 3 1 3 2 3Total Democrats 53 48 45 56 65 52 43 62 62 19 84 54 57 49Total Trump 32 42 40 28 19 35 44 22 23 64 6 32 30 34Total Democrats - Total Trump 21 6 5 28 47 17 -1 40 38 -46 78 22 26 14
Q. 33 B. Statement Pair - Power grab vs. Stronger Electorate/SafetyTotal Answering (1200) (312) (306) (247) (313) (216) (400) (83) (471) (528) (626) (111) (605) (484)Democrats much more 41 34 35 46 53 36 33 43 51 8 71 40 45 37Democrats somewhat more 14 13 14 14 16 18 11 20 14 12 16 16 12 15Trump somewhat more 9 13 12 7 6 10 14 8 6 18 2 12 8 11Trump much more 21 29 24 21 11 20 30 14 15 46 1 20 22 21(Both) 4 2 6 4 4 5 4 5 4 5 3 2 4 4(Neither) 7 7 7 7 7 8 7 5 7 8 6 6 7 8(Don't know/refused) 3 1 3 1 4 3 2 5 3 3 2 4 2 4Total Democrats 55 47 48 60 68 54 44 62 65 20 86 56 57 53Total Trump 31 43 36 28 17 31 44 22 21 64 4 32 30 32Total Democrats - Total Trump 25 4 13 32 52 23 1 40 44 -44 83 25 28 21
TargetSmart Communications 1155 15th St, NW, Suite 750, Washington, DC 20005 targetsmart.com
178 of 228
Page 179
May 21-27, 2020
National Voter Insights Study
TargetSmart + Dynata
Permanent Absentee Voter
Status
Ever Voted Early or By Mail
First Time Voters in 2018 2016 Vote History TargetSmart Voter Score
Total PAVNot PAV Yes No Yes No Voted
Did not Vote
Was Not
Regist ered
Super Voter
Freq uent Voter
Infreq uent Voter
Never Voted
Party ID Difference...2-3-2 PARTY ID Dem-Rep 4 16 3 1 5 4 5 2 4 17 0 1 9 73-1-3 PARTY ID Dem-Rep 7 22 5 0 9 9 7 2 8 26 -4 5 13 14
Q. 33 A. Statement Pair - Election Security vs. Evidence of SuccessTotal Answering (1200) (130) (1070) (220) (980) (176) (1024) (757) (266) (177) (221) (393) (393) (137)Democrats much more 40 53 38 38 40 29 41 42 33 40 46 41 39 33Democrats somewhat more 14 9 14 11 14 20 13 11 18 17 8 12 16 19Trump somewhat more 11 11 11 11 11 10 11 11 10 10 13 10 11 8Trump much more 22 16 22 27 20 19 22 24 17 18 24 25 19 22(Both) 5 4 5 5 5 7 5 4 8 6 3 6 4 4(Neither) 7 6 7 7 7 11 6 6 12 5 6 5 7 10(Don't know/refused) 3 2 3 3 3 5 3 3 3 4 1 1 5 5Total Democrats 53 62 52 48 54 49 54 53 51 57 54 53 55 52Total Trump 32 26 33 37 31 29 33 35 27 28 36 35 30 30Total Democrats - Total Trump 21 36 19 11 23 20 21 18 24 29 18 19 25 22
Q. 33 B. Statement Pair - Power grab vs. Stronger Electorate/SafetyTotal Answering (1200) (130) (1070) (220) (980) (176) (1024) (757) (266) (177) (221) (393) (393) (137)Democrats much more 41 55 40 38 42 31 43 43 36 45 45 44 42 34Democrats somewhat more 14 9 15 13 14 23 12 12 15 18 10 12 15 25Trump somewhat more 9 10 9 11 9 6 10 11 7 7 13 9 9 4Trump much more 21 15 22 26 20 19 22 24 17 15 23 25 18 21(Both) 4 5 4 2 4 8 4 2 9 7 1 3 5 6(Neither) 7 6 7 7 7 9 7 5 14 5 7 5 8 7(Don't know/refused) 3 1 3 3 3 4 3 3 3 3 2 2 4 4Total Democrats 55 64 54 51 56 54 56 55 51 62 56 55 56 59Total Trump 31 25 31 37 29 25 32 35 24 23 35 34 27 25Total Democrats - Total Trump 25 39 23 14 27 28 24 20 27 40 20 21 29 34
TargetSmart Communications 1155 15th St, NW, Suite 750, Washington, DC 20005 targetsmart.com
179 of 228
Page 180
May 21-27, 2020
National Voter Insights Study
TargetSmart + Dynata
Partisan Score Presidential General Turnout Score Mode
Total 0 to 9.9 10 to 89.9 90+ 0 to 69.9 70+ Web Land line Wire less
Party ID Difference...2-3-2 PARTY ID Dem-Rep 4 -48 -4 53 4 5 3 -3 83-1-3 PARTY ID Dem-Rep 7 -55 -1 62 10 5 4 -6 15
Q. 33 A. Statement Pair - Election Security vs. Evidence of SuccessTotal Answering (1200) (302) (491) (408) (429) (771) (644) (116) (440)Democrats much more 40 19 34 62 33 43 34 38 47Democrats somewhat more 14 11 14 15 16 12 13 13 14Trump somewhat more 11 13 13 6 11 11 12 10 9Trump much more 22 43 21 6 19 23 17 33 25(Both) 5 6 6 3 7 4 9 1 1(Neither) 7 7 9 5 9 6 11 1 3(Don't know/refused) 3 2 4 3 6 1 4 3 1Total Democrats 53 30 48 76 49 55 48 51 61Total Trump 32 56 34 13 29 34 29 44 34Total Democrats - Total Trump 21 -26 14 64 20 22 19 8 28
Q. 33 B. Statement Pair - Power grab vs. Stronger Electorate/SafetyTotal Answering (1200) (302) (491) (408) (429) (771) (644) (116) (440)Democrats much more 41 19 37 63 33 46 35 40 52Democrats somewhat more 14 10 15 15 17 12 15 14 13Trump somewhat more 9 12 12 5 9 10 10 12 8Trump much more 21 44 20 6 19 22 19 29 23(Both) 4 5 5 2 7 2 7 1 1(Neither) 7 7 9 5 11 5 12 2 2(Don't know/refused) 3 3 3 3 5 2 4 2 2Total Democrats 55 30 53 78 50 59 49 54 64Total Trump 31 55 32 11 28 32 29 41 31Total Democrats - Total Trump 25 -26 21 66 22 26 21 13 34
TargetSmart Communications 1155 15th St, NW, Suite 750, Washington, DC 20005 targetsmart.com
180 of 228
Page 181
May 21-27, 2020
National Voter Insights Study
TargetSmart + Dynata
2-3-2 Party 3-1-3 Party Ideology Party ID/Ideology
Total Dem Ind Rep Dem Ind Rep Lib Mod ConsLib
Dem
Mod / Cons Dem
Mod / Lib Rep
Cons Rep
Party ID Difference...2-3-2 PARTY ID Dem-Rep 4 100 - -100 73 - -75 68 6 -52 100 100 -100 -1003-1-3 PARTY ID Dem-Rep 7 100 8 -100 100 - -100 85 10 -63 100 100 -100 -100
Q. 34 Fair and accurate election commitment - DemocratsTotal Answering (1200) (415) (395) (362) (566) (124) (482) (304) (469) (368) (213) (189) (117) (239)Very committed 36 64 29 14 60 24 12 56 38 18 65 62 19 11Somewhat committed 28 28 35 22 31 31 24 31 33 20 28 27 38 14Not too committed 14 6 17 22 6 22 22 8 14 20 4 7 20 22Not committed at all 19 1 18 41 2 18 40 3 13 40 1 1 20 52(Don't know/refused) 4 2 3 2 2 5 2 2 3 2 2 2 2 1Very/Somewhat committed 64 91 63 35 91 55 36 87 71 38 93 89 57 25Not too/Not at all committed 33 7 34 63 8 40 62 11 26 60 5 8 41 74
Q. 35 Fair and accurate election commitment - RepublicansTotal Answering (1200) (415) (395) (362) (566) (124) (482) (304) (469) (368) (213) (189) (117) (239)Very committed 28 13 20 57 12 12 52 9 22 52 9 17 45 62Somewhat committed 30 23 36 33 24 40 35 19 37 30 16 30 42 29Not too committed 16 25 18 5 24 21 7 23 18 10 24 26 6 5Not committed at all 22 38 25 3 38 24 4 46 21 6 49 25 5 2(Don't know/refused) 3 3 2 3 2 4 2 3 2 2 3 2 3 3Very/Somewhat committed 58 36 55 89 36 52 87 29 59 82 25 47 87 90Not too/Not at all committed 38 62 43 8 62 45 11 69 38 16 73 51 10 7
Q. 36 Self-Identified PartyTotal Answering (1200) (415) (395) (362) (566) (124) (482) (304) (469) (368) (213) (189) (117) (239)Strong Dem 21 60 - - 44 - - 48 15 6 69 49 - -Weak Dem 14 40 - - 29 - - 22 15 7 31 51 - -Ind-lean Dem 13 - 38 - 27 - - 20 16 3 - - - -Ind 10 - 31 - - 100 - 5 17 4 - - - -Ind-lean Rep 10 - 30 - - - 25 2 13 14 - - - -Weak Rep 10 - - 33 - - 25 1 12 16 - - 50 24Strong Rep 20 - - 67 - - 51 2 11 49 - - 50 76(Don't know/refused) 2 - - - - - - 1 1 1 - - - -2-3-2 Dem 35 100 - - 73 - - 70 30 14 100 100 - -Ind 33 - 100 - 27 100 25 27 46 21 - - - -Rep 30 - - 100 - - 75 2 24 65 - - 100 100Dem-Rep 4 100 - -100 73 - -75 68 6 -52 100 100 -100 -1003-1-3 Dem 47 100 38 - 100 - - 90 46 16 100 100 - -Ind 10 - 31 - - 100 - 5 17 4 - - - -Rep 40 - 30 100 - - 100 5 36 79 - - 100 100Dem-Rep 7 100 8 -100 100 - -100 85 10 -63 100 100 -100 -100
Q. 39 Self-Identified IdeologyTotal Answering (1200) (415) (395) (362) (566) (124) (482) (304) (469) (368) (213) (189) (117) (239)Liberal 25 51 21 2 48 13 3 100 - - 100 - 6 -Moderate 39 34 55 30 38 66 35 - 100 - - 74 94 -Conservative 31 12 19 66 11 10 60 - - 100 - 26 - 100(Don't know/refused) 5 3 5 2 3 11 2 - - - - - - -
TargetSmart Communications 1155 15th St, NW, Suite 750, Washington, DC 20005 targetsmart.com
181 of 228
Page 182
May 21-27, 2020
National Voter Insights Study
TargetSmart + Dynata
Party ID/Gender
Total Dem MenDem
Women Ind MenInd
Women Rep MenRep
Women
Party ID Difference...2-3-2 PARTY ID Dem-Rep 4 100 100 - - -100 -1003-1-3 PARTY ID Dem-Rep 7 100 100 1 17 -100 -100
Q. 34 Fair and accurate election commitment - DemocratsTotal Answering (1200) (157) (258) (219) (177) (186) (177)Very committed 36 59 66 28 30 12 15Somewhat committed 28 30 26 33 37 18 25Not too committed 14 7 5 16 17 28 16Not committed at all 19 3 - 22 13 41 41(Don't know/refused) 4 2 3 2 3 1 2Very/Somewhat committed 64 89 93 60 67 30 41Not too/Not at all committed 33 10 5 37 30 69 57
Q. 35 Fair and accurate election commitment - RepublicansTotal Answering (1200) (157) (258) (219) (177) (186) (177)Very committed 28 11 14 22 16 57 56Somewhat committed 30 20 24 35 37 30 35Not too committed 16 24 25 13 24 8 3Not committed at all 22 42 35 28 21 5 1(Don't know/refused) 3 3 2 2 2 0 5Very/Somewhat committed 58 31 38 57 53 87 91Not too/Not at all committed 38 66 60 42 45 13 4
Q. 36 Self-Identified PartyTotal Answering (1200) (157) (258) (219) (177) (186) (177)Strong Dem 21 58 61 - - - -Weak Dem 14 42 39 - - - -Ind-lean Dem 13 - - 37 41 - -Ind 10 - - 28 36 - -Ind-lean Rep 10 - - 36 24 - -Weak Rep 10 - - - - 34 31Strong Rep 20 - - - - 66 69(Don't know/refused) 2 - - - - - -2-3-2 Dem 35 100 100 - - - -Ind 33 - - 100 100 - -Rep 30 - - - - 100 100Dem-Rep 4 100 100 - - -100 -1003-1-3 Dem 47 100 100 37 41 - -Ind 10 - - 28 36 - -Rep 40 - - 36 24 100 100Dem-Rep 7 100 100 1 17 -100 -100
Q. 39 Self-Identified IdeologyTotal Answering (1200) (157) (258) (219) (177) (186) (177)Liberal 25 56 48 18 23 2 2Moderate 39 26 38 54 57 29 32Conservative 31 16 10 25 12 67 65(Don't know/refused) 5 2 4 3 8 1 2
TargetSmart Communications 1155 15th St, NW, Suite 750, Washington, DC 20005 targetsmart.com
182 of 228
Page 183
May 21-27, 2020
National Voter Insights Study
TargetSmart + Dynata
Urbanicity
Total R1 R2 S3 S4 U5 U6 Rural Subu rban Urban
Party ID Difference...2-3-2 PARTY ID Dem-Rep 4 -23 -15 -2 9 22 42 -19 4 283-1-3 PARTY ID Dem-Rep 7 -23 -17 -1 12 26 52 -20 7 33
Q. 34 Fair and accurate election commitment - DemocratsTotal Answering (1200) (179) (181) (195) (273) (264) (108) (360) (468) (372)Very committed 36 28 29 37 35 41 47 28 36 43Somewhat committed 28 27 27 28 28 28 30 27 28 29Not too committed 14 17 16 13 14 14 10 16 13 13Not committed at all 19 26 26 18 19 13 8 26 19 12(Don't know/refused) 4 2 2 5 4 4 5 2 5 4Very/Somewhat committed 64 55 56 65 63 69 77 56 64 72Not too/Not at all committed 33 43 42 30 33 27 19 43 32 25
Q. 35 Fair and accurate election commitment - RepublicansTotal Answering (1200) (179) (181) (195) (273) (264) (108) (360) (468) (372)Very committed 28 44 32 33 23 25 10 38 27 21Somewhat committed 30 24 33 32 30 32 25 29 31 30Not too committed 16 16 18 15 19 13 18 17 17 14Not committed at all 22 15 15 16 24 27 42 15 21 31(Don't know/refused) 3 2 2 4 4 3 6 2 4 4Very/Somewhat committed 58 68 65 65 53 57 35 66 58 51Not too/Not at all committed 38 30 33 31 43 40 60 32 38 46
Q. 36 Self-Identified PartyTotal Answering (1200) (179) (181) (195) (273) (264) (108) (360) (468) (372)Strong Dem 21 9 12 21 22 28 33 11 22 30Weak Dem 14 12 11 9 12 19 21 12 11 20Ind-lean Dem 13 12 14 13 14 10 15 13 14 11Ind 10 8 10 7 13 11 13 9 10 12Ind-lean Rep 10 13 16 12 10 6 4 14 11 5Weak Rep 10 15 10 9 7 11 6 13 8 9Strong Rep 20 29 28 24 18 15 7 28 20 12(Don't know/refused) 2 2 - 5 4 2 1 1 4 22-3-2 Dem 35 21 23 31 34 47 55 22 33 49Ind 33 33 39 31 37 26 32 36 35 28Rep 30 44 38 33 25 25 13 41 29 22Dem-Rep 4 -23 -15 -2 9 22 42 -19 4 283-1-3 Dem 47 33 37 44 48 56 69 35 46 60Ind 10 8 10 7 13 11 13 9 10 12Rep 40 57 54 45 36 31 17 55 39 27Dem-Rep 7 -23 -17 -1 12 26 52 -20 7 33
Q. 39 Self-Identified IdeologyTotal Answering (1200) (179) (181) (195) (273) (264) (108) (360) (468) (372)Liberal 25 19 19 24 26 30 35 19 25 32Moderate 39 36 40 37 43 39 36 38 41 38Conservative 31 38 38 31 26 27 25 38 29 26(Don't know/refused) 5 7 3 7 5 4 4 5 6 4
TargetSmart Communications 1155 15th St, NW, Suite 750, Washington, DC 20005 targetsmart.com
183 of 228
Page 184
May 21-27, 2020
National Voter Insights Study
TargetSmart + Dynata
Urbanicity/Gender
Total Rural MenRural
WomenSubu rban
MenSubu rban Women Urban Men
Urban Women
Party ID Difference...2-3-2 PARTY ID Dem-Rep 4 -23 -15 -4 12 13 393-1-3 PARTY ID Dem-Rep 7 -28 -13 -1 15 16 48
Q. 34 Fair and accurate election commitment - DemocratsTotal Answering (1200) (180) (180) (227) (241) (164) (208)Very committed 36 24 32 32 40 36 48Somewhat committed 28 25 30 28 27 28 29Not too committed 14 21 12 14 13 17 9Not committed at all 19 29 23 23 14 15 9(Don't know/refused) 4 1 3 3 6 3 5Very/Somewhat committed 64 49 62 60 67 65 77Not too/Not at all committed 33 50 35 37 27 32 19
Q. 35 Fair and accurate election commitment - RepublicansTotal Answering (1200) (180) (180) (227) (241) (164) (208)Very committed 28 41 35 30 24 20 22Somewhat committed 30 25 32 28 34 36 25Not too committed 16 15 18 16 18 10 18Not committed at all 22 19 11 23 19 32 31(Don't know/refused) 3 1 3 3 5 3 5Very/Somewhat committed 58 65 67 58 59 55 47Not too/Not at all committed 38 34 29 40 37 42 48
Q. 36 Self-Identified PartyTotal Answering (1200) (180) (180) (227) (241) (164) (208)Strong Dem 21 9 13 15 28 25 33Weak Dem 14 7 16 11 11 17 21Ind-lean Dem 13 15 10 16 11 10 12Ind 10 10 8 12 9 10 13Ind-lean Rep 10 19 9 13 8 8 3Weak Rep 10 11 14 9 7 13 6Strong Rep 20 28 29 21 20 16 10(Don't know/refused) 2 - 2 4 5 1 22-3-2 Dem 35 16 29 26 39 42 54Ind 33 45 27 41 29 27 28Rep 30 39 43 30 28 29 16Dem-Rep 4 -23 -15 -4 12 13 393-1-3 Dem 47 31 39 42 51 52 67Ind 10 10 8 12 9 10 13Rep 40 59 52 43 36 37 19Dem-Rep 7 -28 -13 -1 15 16 48
Q. 39 Self-Identified IdeologyTotal Answering (1200) (180) (180) (227) (241) (164) (208)Liberal 25 17 21 22 28 32 32Moderate 39 36 40 40 41 35 41Conservative 31 44 32 33 24 31 23(Don't know/refused) 5 3 7 4 7 3 5
TargetSmart Communications 1155 15th St, NW, Suite 750, Washington, DC 20005 targetsmart.com
184 of 228
Page 185
May 21-27, 2020
National Voter Insights Study
TargetSmart + Dynata
Region by State
TotalBorder States
Califo rnia
Indust rial
Midw est
Lower Midw
estMid -
Atla ntic
Moun tain
States
Nati onal
Capi talNew
Engl and
Paci fic Northw
est SouthSouthe
ast
Upper Midw
est
Party ID Difference...2-3-2 PARTY ID Dem-Rep 4 4 19 -11 16 15 2 5 17 -7 -3 3 13-1-3 PARTY ID Dem-Rep 7 -5 27 -6 17 21 5 15 29 2 -9 8 -8
Q. 34 Fair and accurate election commitment - DemocratsTotal Answering (1200) (132) (120) (157) (60) (158) (48) (60) (60) (48) (108) (193) (48)Very committed 36 29 41 36 38 36 38 34 27 40 46 33 34Somewhat committed 28 32 33 28 36 28 32 31 32 27 13 28 17Not too committed 14 14 9 13 13 15 15 16 7 14 17 17 17Not committed at all 19 19 15 22 13 17 13 15 24 16 23 18 28(Don't know/refused) 4 5 3 1 - 5 2 5 10 4 1 4 5Very/Somewhat committed 64 62 73 64 74 64 70 65 60 67 59 62 50Not too/Not at all committed 33 33 24 35 26 32 28 30 31 30 40 34 44
Q. 35 Fair and accurate election commitment - RepublicansTotal Answering (1200) (132) (120) (157) (60) (158) (48) (60) (60) (48) (108) (193) (48)Very committed 28 29 18 28 27 22 28 27 20 29 45 31 39Somewhat committed 30 36 31 32 35 30 33 29 35 32 19 26 29Not too committed 16 13 23 13 17 13 19 18 16 16 18 17 16Not committed at all 22 19 26 26 20 32 21 22 18 15 18 22 14(Don't know/refused) 3 3 3 1 1 5 - 5 12 8 - 4 2Very/Somewhat committed 58 65 49 60 62 51 61 56 55 62 64 57 68Not too/Not at all committed 38 33 49 39 37 44 40 40 34 31 36 39 30
Q. 36 Self-Identified PartyTotal Answering (1200) (132) (120) (157) (60) (158) (48) (60) (60) (48) (108) (193) (48)Strong Dem 21 18 27 16 13 27 23 26 11 17 26 21 17Weak Dem 14 18 15 12 27 15 11 10 14 8 10 14 12Ind-lean Dem 13 3 17 15 12 13 12 17 23 20 5 13 13Ind 10 13 10 9 6 8 13 8 24 10 9 9 9Ind-lean Rep 10 12 9 10 11 7 10 7 11 12 11 8 21Weak Rep 10 10 3 14 12 9 13 15 4 10 10 9 13Strong Rep 20 23 19 25 12 18 19 15 5 22 29 23 15(Don't know/refused) 2 4 - 0 9 2 - 2 7 2 - 3 -2-3-2 Dem 35 36 41 27 39 42 34 35 25 25 36 35 29Ind 33 27 37 34 29 28 35 33 59 42 25 29 43Rep 30 32 22 38 23 27 31 30 9 32 39 32 28Dem-Rep 4 4 19 -11 16 15 2 5 17 -7 -3 3 13-1-3 Dem 47 39 58 42 51 55 46 52 49 45 41 48 41Ind 10 13 10 9 6 8 13 8 24 10 9 9 9Rep 40 44 32 48 34 34 41 37 20 43 50 40 49Dem-Rep 7 -5 27 -6 17 21 5 15 29 2 -9 8 -8
Q. 39 Self-Identified IdeologyTotal Answering (1200) (132) (120) (157) (60) (158) (48) (60) (60) (48) (108) (193) (48)Liberal 25 25 29 23 23 30 25 30 27 21 23 26 20Moderate 39 40 40 41 40 44 33 33 46 45 39 31 45Conservative 31 31 28 34 34 23 39 30 16 23 36 35 31(Don't know/refused) 5 5 3 3 3 4 4 7 11 11 3 8 4
TargetSmart Communications 1155 15th St, NW, Suite 750, Washington, DC 20005 targetsmart.com
185 of 228
Page 186
May 21-27, 2020
National Voter Insights Study
TargetSmart + Dynata
Gender Age
Total Men Women 18 - 34 35 - 49 50 - 64 Over 64 18 - 4950 and
over
Party ID Difference...2-3-2 PARTY ID Dem-Rep 4 -5 13 24 6 -2 -8 15 -53-1-3 PARTY ID Dem-Rep 7 -5 18 33 8 0 -10 21 -5
Q. 34 Fair and accurate election commitment - DemocratsTotal Answering (1200) (571) (629) (281) (287) (310) (295) (568) (605)Very committed 36 31 40 31 36 37 41 33 39Somewhat committed 28 27 28 39 31 22 20 35 21Not too committed 14 17 11 17 13 13 14 15 13Not committed at all 19 23 15 10 17 25 23 13 24(Don't know/refused) 4 2 5 4 4 3 3 4 3Very/Somewhat committed 64 58 69 69 66 59 61 68 60Not too/Not at all committed 33 40 26 26 29 38 37 28 38
Q. 35 Fair and accurate election commitment - RepublicansTotal Answering (1200) (571) (629) (281) (287) (310) (295) (568) (605)Very committed 28 30 27 16 27 32 38 22 35Somewhat committed 30 29 31 33 31 33 23 32 28Not too committed 16 14 18 23 15 13 14 19 14Not committed at all 22 24 21 25 23 20 22 24 21(Don't know/refused) 3 2 4 3 4 2 3 4 3Very/Somewhat committed 58 59 57 49 58 65 61 53 63Not too/Not at all committed 38 38 39 48 38 33 36 43 34
Q. 36 Self-Identified PartyTotal Answering (1200) (571) (629) (281) (287) (310) (295) (568) (605)Strong Dem 21 16 25 23 19 21 22 21 21Weak Dem 14 11 16 20 16 13 7 18 10Ind-lean Dem 13 14 11 16 13 10 11 15 10Ind 10 11 10 13 12 10 8 12 9Ind-lean Rep 10 14 7 6 11 8 14 9 11Weak Rep 10 11 9 6 11 10 11 9 11Strong Rep 20 22 19 13 17 26 25 15 26(Don't know/refused) 2 2 3 3 1 2 3 2 22-3-2 Dem 35 27 41 43 34 34 29 39 32Ind 33 38 28 34 37 28 32 35 30Rep 30 33 28 19 28 36 37 24 36Dem-Rep 4 -5 13 24 6 -2 -8 15 -53-1-3 Dem 47 41 52 59 48 44 40 53 42Ind 10 11 10 13 12 10 8 12 9Rep 40 46 35 26 39 44 50 33 47Dem-Rep 7 -5 18 33 8 0 -10 21 -5
Q. 39 Self-Identified IdeologyTotal Answering (1200) (571) (629) (281) (287) (310) (295) (568) (605)Liberal 25 23 27 41 25 18 19 33 18Moderate 39 38 41 38 40 40 39 39 40Conservative 31 36 26 17 29 37 37 23 37(Don't know/refused) 5 3 6 4 5 4 5 5 5
TargetSmart Communications 1155 15th St, NW, Suite 750, Washington, DC 20005 targetsmart.com
186 of 228
Page 187
May 21-27, 2020
National Voter Insights Study
TargetSmart + Dynata
Education Homeownership status Marital status
TotalH.S. or
lessPost H.S.
4yr Coll Grad
Post Grad
Coll ege Grad uate
Total Non Coll Rent Own
Marr ied Single
Separa ted / divo rced
Wido wed
Total Unmarr
ied
Party ID Difference...2-3-2 PARTY ID Dem-Rep 4 5 -3 6 13 9 0 32 -5 -11 30 10 -6 213-1-3 PARTY ID Dem-Rep 7 3 -1 9 20 14 0 44 -6 -13 42 12 -10 29
Q. 34 Fair and accurate election commitment - DemocratsTotal Answering (1200) (210) (369) (363) (248) (610) (579) (297) (873) (618) (357) (144) (59) (560)Very committed 36 34 32 39 39 39 33 43 34 31 43 38 40 42Somewhat committed 28 27 26 29 31 30 26 28 28 27 31 24 32 29Not too committed 14 14 17 14 10 12 16 15 14 16 13 14 11 13Not committed at all 19 19 22 18 16 17 21 10 22 24 11 19 15 13(Don't know/refused) 4 5 4 1 4 2 4 4 3 3 2 5 3 3Very/Somewhat committed 64 62 57 68 70 69 59 71 62 58 74 63 71 71Not too/Not at all committed 33 33 39 31 26 29 37 25 36 39 24 33 26 26
Q. 35 Fair and accurate election commitment - RepublicansTotal Answering (1200) (210) (369) (363) (248) (610) (579) (297) (873) (618) (357) (144) (59) (560)Very committed 28 37 32 26 19 23 34 18 32 34 18 30 32 23Somewhat committed 30 31 29 30 31 30 30 26 32 31 30 27 27 29Not too committed 16 13 16 17 18 17 15 20 15 15 18 15 19 17Not committed at all 22 14 19 26 30 28 17 32 19 18 31 21 20 27(Don't know/refused) 3 5 4 1 2 2 4 5 2 2 3 7 3 4Very/Somewhat committed 58 68 61 57 50 54 63 44 64 65 48 57 59 52Not too/Not at all committed 38 27 35 42 48 45 33 51 34 33 49 36 39 44
Q. 36 Self-Identified PartyTotal Answering (1200) (210) (369) (363) (248) (610) (579) (297) (873) (618) (357) (144) (59) (560)Strong Dem 21 20 20 21 23 22 20 26 19 15 30 22 23 27Weak Dem 14 16 12 14 14 14 13 21 12 13 17 15 7 15Ind-lean Dem 13 7 11 15 17 16 9 18 11 10 18 13 11 16Ind 10 11 11 8 12 10 11 11 10 10 12 12 7 11Ind-lean Rep 10 9 10 12 9 11 10 6 12 12 6 10 15 8Weak Rep 10 6 11 12 8 11 9 6 11 12 5 11 14 8Strong Rep 20 26 23 18 16 17 24 9 25 27 11 17 22 13(Don't know/refused) 2 4 3 - 1 0 3 3 1 1 3 - 3 22-3-2 Dem 35 37 31 36 37 36 33 47 31 28 46 37 29 42Ind 33 27 32 35 38 36 30 35 32 32 36 35 32 35Rep 30 32 34 30 24 28 33 15 36 39 16 28 35 21Dem-Rep 4 5 -3 6 13 9 0 32 -5 -11 30 10 -6 213-1-3 Dem 47 44 42 51 54 52 43 65 42 38 64 50 40 58Ind 10 11 11 8 12 10 11 11 10 10 12 12 7 11Rep 40 41 44 42 33 38 43 21 47 51 22 38 50 29Dem-Rep 7 3 -1 9 20 14 0 44 -6 -13 42 12 -10 29
Q. 39 Self-Identified IdeologyTotal Answering (1200) (210) (369) (363) (248) (610) (579) (297) (873) (618) (357) (144) (59) (560)Liberal 25 18 21 32 30 31 20 42 19 17 42 20 23 35Moderate 39 38 40 38 41 40 39 34 42 42 36 42 29 37Conservative 31 35 35 28 25 27 35 17 36 38 17 33 44 24(Don't know/refused) 5 9 5 2 4 3 6 8 3 3 5 5 4 5
TargetSmart Communications 1155 15th St, NW, Suite 750, Washington, DC 20005 targetsmart.com
187 of 228
Page 188
May 21-27, 2020
National Voter Insights Study
TargetSmart + Dynata
Kids at home Religious attendance
Total Yes No
More than
once a week
Once a week
Once or twice a month
A few times a
year Seldom NeverFreq uent
Infreq uent
Seldom / Never
Party ID Difference...2-3-2 PARTY ID Dem-Rep 4 2 6 -10 -15 5 7 6 24 -14 6 163-1-3 PARTY ID Dem-Rep 7 5 9 -19 -17 -5 14 9 35 -17 7 24
Q. 34 Fair and accurate election commitment - DemocratsTotal Answering (1200) (301) (876) (89) (251) (121) (190) (212) (301) (340) (311) (513)Very committed 36 35 37 27 32 33 34 39 43 31 34 41Somewhat committed 28 31 27 26 27 30 35 24 27 26 33 26Not too committed 14 14 14 16 15 17 16 14 12 15 16 13Not committed at all 19 16 19 24 25 21 14 20 15 24 17 17(Don't know/refused) 4 5 2 7 2 0 1 4 3 3 1 4Very/Somewhat committed 64 65 64 53 59 62 69 63 70 57 66 67Not too/Not at all committed 33 30 34 40 39 37 30 33 27 39 33 29
Q. 35 Fair and accurate election commitment - RepublicansTotal Answering (1200) (301) (876) (89) (251) (121) (190) (212) (301) (340) (311) (513)Very committed 28 26 29 38 35 35 28 29 19 36 31 23Somewhat committed 30 34 29 27 34 32 36 26 26 32 34 26Not too committed 16 18 16 13 13 14 14 18 22 13 14 20Not committed at all 22 18 24 15 16 17 22 26 31 16 20 29(Don't know/refused) 3 4 2 6 2 4 1 1 3 3 2 2Very/Somewhat committed 58 60 58 66 69 66 64 55 45 68 65 49Not too/Not at all committed 38 36 40 28 29 30 35 44 52 29 33 49
Q. 36 Self-Identified PartyTotal Answering (1200) (301) (876) (89) (251) (121) (190) (212) (301) (340) (311) (513)Strong Dem 21 16 23 16 17 19 25 17 27 17 23 23Weak Dem 14 16 13 8 10 16 14 17 16 9 15 17Ind-lean Dem 13 14 12 9 9 8 15 13 18 9 12 16Ind 10 10 10 14 9 7 5 14 12 10 6 13Ind-lean Rep 10 12 9 18 12 18 8 9 7 13 12 8Weak Rep 10 13 9 8 14 13 10 6 8 12 11 7Strong Rep 20 17 22 26 28 18 23 23 11 27 21 16(Don't know/refused) 2 2 2 4 2 3 0 1 1 2 1 12-3-2 Dem 35 32 36 24 27 35 39 34 43 26 38 39Ind 33 36 32 40 30 32 28 35 37 33 29 36Rep 30 30 31 33 42 30 33 29 19 39 32 23Dem-Rep 4 2 6 -10 -15 5 7 6 24 -14 6 163-1-3 Dem 47 46 48 32 36 43 54 47 61 35 50 55Ind 10 10 10 14 9 7 5 14 12 10 6 13Rep 40 42 40 51 53 48 41 38 26 53 43 31Dem-Rep 7 5 9 -19 -17 -5 14 9 35 -17 7 24
Q. 39 Self-Identified IdeologyTotal Answering (1200) (301) (876) (89) (251) (121) (190) (212) (301) (340) (311) (513)Liberal 25 20 28 7 12 23 28 30 37 11 26 34Moderate 39 44 38 29 41 37 40 38 43 38 39 41Conservative 31 32 31 60 42 35 27 28 16 47 30 21(Don't know/refused) 5 4 4 4 4 5 4 4 4 4 4 4
TargetSmart Communications 1155 15th St, NW, Suite 750, Washington, DC 20005 targetsmart.com
188 of 228
Page 189
May 21-27, 2020
National Voter Insights Study
TargetSmart + Dynata
Gender/Age Gender/Education Age/Education
TotalYoun
ger MenOlder Men
Youn ger
WomenOlder
WomenNon Coll
MenColl Men
Non Coll Women
Coll Women
Youn ger Non
CollOlder
Non Coll
Youn ger Coll
egeOlder Coll
Party ID Difference...2-3-2 PARTY ID Dem-Rep 4 7 -15 21 6 -9 -2 7 19 6 -4 22 -53-1-3 PARTY ID Dem-Rep 7 12 -19 28 8 -12 1 10 26 8 -7 31 -3
Q. 34 Fair and accurate election commitment - DemocratsTotal Answering (1200) (256) (301) (312) (304) (262) (307) (318) (304) (252) (316) (312) (285)Very committed 36 30 32 35 46 25 36 39 42 28 37 37 41Somewhat committed 28 33 22 36 21 26 29 26 31 33 21 37 22Not too committed 14 16 18 13 9 20 15 13 10 21 13 10 14Not committed at all 19 18 27 9 22 28 19 15 15 13 27 13 21(Don't know/refused) 4 2 2 6 3 2 2 6 2 5 3 2 2Very/Somewhat committed 64 63 53 72 66 51 65 66 73 61 58 74 63Not too/Not at all committed 33 35 45 22 31 48 34 28 25 34 40 23 35
Q. 35 Fair and accurate election commitment - RepublicansTotal Answering (1200) (256) (301) (312) (304) (262) (307) (318) (304) (252) (316) (312) (285)Very committed 28 24 35 19 34 36 26 32 21 26 40 18 29Somewhat committed 30 30 28 33 29 29 29 30 31 32 28 32 29Not too committed 16 17 12 21 15 13 15 17 20 21 11 18 17Not committed at all 22 27 23 22 19 20 28 15 27 16 18 31 24(Don't know/refused) 3 3 2 5 3 2 2 6 2 5 3 2 2Very/Somewhat committed 58 54 63 53 63 65 55 63 52 59 68 50 58Not too/Not at all committed 38 44 35 43 34 33 43 32 46 37 29 49 41
Q. 36 Self-Identified PartyTotal Answering (1200) (256) (301) (312) (304) (262) (307) (318) (304) (252) (316) (312) (285)Strong Dem 21 17 16 24 27 16 16 23 28 17 22 24 21Weak Dem 14 16 8 20 13 10 13 16 16 16 12 20 9Ind-lean Dem 13 17 11 12 10 10 17 9 14 12 7 17 15Ind 10 11 10 13 7 13 9 10 10 16 8 9 9Ind-lean Rep 10 13 14 6 8 13 14 6 7 10 9 8 13Weak Rep 10 10 13 8 9 8 13 10 8 9 9 9 13Strong Rep 20 16 26 14 25 26 18 22 17 18 29 13 21(Don't know/refused) 2 1 2 3 2 3 0 4 0 3 3 0 12-3-2 Dem 35 33 24 44 39 26 29 39 44 33 34 44 29Ind 33 41 35 31 25 37 40 25 32 37 24 34 36Rep 30 25 39 22 34 35 31 32 24 27 39 22 34Dem-Rep 4 7 -15 21 6 -9 -2 7 19 6 -4 22 -53-1-3 Dem 47 50 34 56 50 36 46 48 58 45 41 61 44Ind 10 11 10 13 7 13 9 10 10 16 8 9 9Rep 40 38 53 28 41 48 45 38 32 37 48 30 47Dem-Rep 7 12 -19 28 8 -12 1 10 26 8 -7 31 -3
Q. 39 Self-Identified IdeologyTotal Answering (1200) (256) (301) (312) (304) (262) (307) (318) (304) (252) (316) (312) (285)Liberal 25 33 16 34 20 19 27 20 35 24 16 41 21Moderate 39 39 36 39 43 36 39 42 40 42 37 37 43Conservative 31 27 43 21 31 41 32 30 22 29 41 19 34(Don't know/refused) 5 2 4 7 6 4 3 8 3 5 6 3 2
TargetSmart Communications 1155 15th St, NW, Suite 750, Washington, DC 20005 targetsmart.com
189 of 228
Page 190
May 21-27, 2020
National Voter Insights Study
TargetSmart + Dynata
Marital Status/Gender Marital Status/Kids Trump Job Approval
Voting Permissions by State
Total
Marr ied
Men
Marr ied
WomenUnmarr ied Men
Unmarr ied
Women
Marr ied
with kids
Marr ied with out kids
Unmarr ied with
kids
Unmarr ied with out kids
Total appr ove
Total disapp rove All mail
Open early / mail Closed
Party ID Difference...2-3-2 PARTY ID Dem-Rep 4 -17 -5 9 30 -4 -15 19 22 -50 50 -9 4 83-1-3 PARTY ID Dem-Rep 7 -22 -4 16 39 -2 -19 22 31 -65 67 -5 9 8
Q. 34 Fair and accurate election commitment - DemocratsTotal Answering (1200) (312) (306) (247) (313) (216) (400) (83) (471) (528) (626) (111) (605) (484)Very committed 36 28 34 35 47 33 30 39 42 14 55 36 36 36Somewhat committed 28 25 29 29 29 30 26 32 29 23 32 26 30 26Not too committed 14 18 13 17 10 16 15 8 14 24 7 16 14 14Not committed at all 19 27 21 19 9 18 27 14 13 38 4 18 18 20(Don't know/refused) 4 2 4 1 5 3 3 8 2 2 3 4 3 4Very/Somewhat committed 64 53 63 64 76 63 55 71 71 36 87 62 66 61Not too/Not at all committed 33 45 34 35 20 34 42 21 27 62 10 33 31 35
Q. 35 Fair and accurate election commitment - RepublicansTotal Answering (1200) (312) (306) (247) (313) (216) (400) (83) (471) (528) (626) (111) (605) (484)Very committed 28 36 33 25 21 29 37 19 23 52 9 29 26 31Somewhat committed 30 28 35 31 28 37 28 25 30 36 24 30 31 28Not too committed 16 13 18 15 19 15 16 27 16 7 24 16 16 16Not committed at all 22 23 13 26 28 17 18 19 29 4 39 19 23 22(Don't know/refused) 3 1 2 3 5 2 2 9 3 2 3 6 3 4Very/Somewhat committed 58 63 68 56 48 66 65 44 53 88 34 59 58 59Not too/Not at all committed 38 36 30 41 47 32 34 46 44 11 64 35 40 38
Q. 36 Self-Identified PartyTotal Answering (1200) (312) (306) (247) (313) (216) (400) (83) (471) (528) (626) (111) (605) (484)Strong Dem 21 11 20 23 30 15 16 19 28 3 37 16 21 22Weak Dem 14 12 14 11 18 15 12 20 15 7 20 11 14 15Ind-lean Dem 13 11 9 18 14 14 8 15 16 4 21 14 14 10Ind 10 10 10 12 11 9 10 14 11 8 12 11 10 10Ind-lean Rep 10 17 8 11 6 12 12 11 7 18 3 10 10 10Weak Rep 10 13 11 9 7 13 11 11 7 16 5 12 11 8Strong Rep 20 27 27 15 12 20 31 10 14 44 2 24 19 21(Don't know/refused) 2 0 2 2 2 2 1 2 2 1 1 2 1 42-3-2 Dem 35 23 34 34 49 30 27 39 43 10 56 27 35 37Ind 33 37 26 40 31 36 30 39 34 29 36 36 34 31Rep 30 40 38 24 19 33 42 20 21 60 7 36 30 29Dem-Rep 4 -17 -5 9 30 -4 -15 19 22 -50 50 -9 4 83-1-3 Dem 47 34 42 51 63 44 35 53 59 13 77 41 49 47Ind 10 10 10 12 11 9 10 14 11 8 12 11 10 10Rep 40 56 46 35 24 46 54 31 28 78 10 46 40 39Dem-Rep 7 -22 -4 16 39 -2 -19 22 31 -65 67 -5 9 8
Q. 39 Self-Identified IdeologyTotal Answering (1200) (312) (306) (247) (313) (216) (400) (83) (471) (528) (626) (111) (605) (484)Liberal 25 17 18 32 37 21 16 20 37 7 42 23 25 26Moderate 39 39 45 36 38 43 41 48 35 37 42 41 40 38Conservative 31 42 33 29 20 33 40 28 23 53 13 29 31 31(Don't know/refused) 5 2 4 3 6 4 3 5 4 3 4 7 4 5
TargetSmart Communications 1155 15th St, NW, Suite 750, Washington, DC 20005 targetsmart.com
190 of 228
Page 191
May 21-27, 2020
National Voter Insights Study
TargetSmart + Dynata
Permanent Absentee Voter
Status
Ever Voted Early or By Mail
First Time Voters in 2018 2016 Vote History TargetSmart Voter Score
Total PAVNot PAV Yes No Yes No Voted
Did not Vote
Was Not
Regist ered
Super Voter
Freq uent Voter
Infreq uent Voter
Never Voted
Party ID Difference...2-3-2 PARTY ID Dem-Rep 4 16 3 1 5 4 5 2 4 17 0 1 9 73-1-3 PARTY ID Dem-Rep 7 22 5 0 9 9 7 2 8 26 -4 5 13 14
Q. 34 Fair and accurate election commitment - DemocratsTotal Answering (1200) (130) (1070) (220) (980) (176) (1024) (757) (266) (177) (221) (393) (393) (137)Very committed 36 48 34 33 36 23 38 39 28 35 42 39 34 26Somewhat committed 28 28 28 25 28 35 27 24 34 37 20 25 32 35Not too committed 14 7 15 14 14 17 14 14 17 12 15 12 14 18Not committed at all 19 15 19 24 18 19 19 21 16 14 22 21 16 20(Don't know/refused) 4 2 4 4 4 6 3 3 5 2 2 3 5 -Very/Somewhat committed 64 75 62 59 65 58 65 62 62 72 62 64 66 61Not too/Not at all committed 33 22 34 38 32 36 32 34 33 26 36 33 29 39
Q. 35 Fair and accurate election commitment - RepublicansTotal Answering (1200) (130) (1070) (220) (980) (176) (1024) (757) (266) (177) (221) (393) (393) (137)Very committed 28 22 29 31 28 23 29 31 25 21 32 30 28 25Somewhat committed 30 27 30 28 31 39 28 28 33 33 28 27 30 41Not too committed 16 18 16 20 15 20 15 15 17 20 16 15 16 19Not committed at all 22 30 22 19 23 15 24 23 23 22 22 26 23 13(Don't know/refused) 3 3 3 3 3 4 3 4 3 4 3 3 4 2Very/Somewhat committed 58 50 59 58 58 62 58 59 58 54 59 57 58 66Not too/Not at all committed 38 47 37 39 38 34 39 37 40 42 38 40 38 32
Q. 36 Self-Identified PartyTotal Answering (1200) (130) (1070) (220) (980) (176) (1024) (757) (266) (177) (221) (393) (393) (137)Strong Dem 21 26 20 21 21 13 22 22 16 23 24 23 21 14Weak Dem 14 15 14 14 14 16 13 13 15 16 11 11 16 17Ind-lean Dem 13 16 12 9 13 15 12 12 13 15 10 13 13 17Ind 10 6 11 12 10 15 10 7 18 13 6 10 10 14Ind-lean Rep 10 9 10 10 10 10 10 11 9 6 14 9 9 11Weak Rep 10 4 11 8 10 13 9 9 13 8 9 9 9 10Strong Rep 20 22 20 25 19 12 22 24 14 15 25 24 19 14(Don't know/refused) 2 1 3 1 3 6 2 2 3 4 0 1 4 42-3-2 Dem 35 42 34 34 35 29 36 35 30 39 34 34 37 31Ind 33 31 33 31 33 39 32 30 40 34 31 33 32 42Rep 30 26 31 33 30 25 31 33 27 23 35 33 28 24Dem-Rep 4 16 3 1 5 4 5 2 4 17 0 1 9 73-1-3 Dem 47 57 46 43 48 44 48 47 44 55 45 47 50 48Ind 10 6 11 12 10 15 10 7 18 13 6 10 10 14Rep 40 35 41 44 39 35 41 44 36 28 49 42 37 34Dem-Rep 7 22 5 0 9 9 7 2 8 26 -4 5 13 14
Q. 39 Self-Identified IdeologyTotal Answering (1200) (130) (1070) (220) (980) (176) (1024) (757) (266) (177) (221) (393) (393) (137)Liberal 25 30 25 26 25 22 26 23 27 32 21 25 30 24Moderate 39 38 39 37 40 37 39 39 40 39 39 41 39 36Conservative 31 29 31 33 30 33 30 34 27 23 38 31 25 34(Don't know/refused) 5 3 5 4 5 8 4 4 7 5 3 3 6 6
TargetSmart Communications 1155 15th St, NW, Suite 750, Washington, DC 20005 targetsmart.com
191 of 228
Page 192
May 21-27, 2020
National Voter Insights Study
TargetSmart + Dynata
Partisan Score Presidential General Turnout Score Mode
Total 0 to 9.9 10 to 89.9 90+ 0 to 69.9 70+ Web Land line Wire less
Party ID Difference...2-3-2 PARTY ID Dem-Rep 4 -48 -4 53 4 5 3 -3 83-1-3 PARTY ID Dem-Rep 7 -55 -1 62 10 5 4 -6 15
Q. 34 Fair and accurate election commitment - DemocratsTotal Answering (1200) (302) (491) (408) (429) (771) (644) (116) (440)Very committed 36 19 32 52 29 40 32 42 40Somewhat committed 28 23 32 27 33 25 29 24 27Not too committed 14 21 14 10 16 13 17 11 11Not committed at all 19 36 18 6 16 20 16 22 22(Don't know/refused) 4 1 4 5 6 2 5 2 2Very/Somewhat committed 64 42 64 79 62 65 61 66 66Not too/Not at all committed 33 57 32 16 32 33 33 32 32
Q. 35 Fair and accurate election commitment - RepublicansTotal Answering (1200) (302) (491) (408) (429) (771) (644) (116) (440)Very committed 28 43 30 16 27 29 27 37 28Somewhat committed 30 33 31 27 33 28 28 36 31Not too committed 16 13 15 19 16 16 20 9 13Not committed at all 22 9 21 34 19 24 21 17 25(Don't know/refused) 3 2 3 4 4 3 4 2 2Very/Somewhat committed 58 76 61 42 61 57 55 72 60Not too/Not at all committed 38 22 36 54 35 40 41 26 38
Q. 36 Self-Identified PartyTotal Answering (1200) (302) (491) (408) (429) (771) (644) (116) (440)Strong Dem 21 5 15 40 15 24 19 23 22Weak Dem 14 7 12 21 16 12 16 10 12Ind-lean Dem 13 6 16 14 14 12 10 9 18Ind 10 9 12 9 14 8 11 10 9Ind-lean Rep 10 13 13 5 7 11 9 13 11Weak Rep 10 17 11 3 11 10 13 10 6Strong Rep 20 43 19 5 18 22 20 25 20(Don't know/refused) 2 1 3 3 5 1 2 - 32-3-2 Dem 35 11 27 62 32 36 36 33 34Ind 33 28 40 28 35 32 30 32 38Rep 30 60 30 8 28 31 32 35 26Dem-Rep 4 -48 -4 53 4 5 3 -3 83-1-3 Dem 47 17 42 75 46 48 45 42 51Ind 10 9 12 9 14 8 11 10 9Rep 40 73 43 13 36 43 41 48 37Dem-Rep 7 -55 -1 62 10 5 4 -6 15
Q. 39 Self-Identified IdeologyTotal Answering (1200) (302) (491) (408) (429) (771) (644) (116) (440)Liberal 25 9 23 41 25 26 26 19 27Moderate 39 37 41 38 38 40 40 39 38Conservative 31 52 31 15 30 31 31 35 30(Don't know/refused) 5 3 5 6 8 3 4 8 6
TargetSmart Communications 1155 15th St, NW, Suite 750, Washington, DC 20005 targetsmart.com
192 of 228
Page 193
May 21-27, 2020
National Voter Insights Study
TargetSmart + Dynata
2-3-2 Party 3-1-3 Party Ideology Party ID/Ideology
Total Dem Ind Rep Dem Ind Rep Lib Mod ConsLib
Dem
Mod / Cons Dem
Mod / Lib Rep
Cons Rep
Party ID Difference...2-3-2 PARTY ID Dem-Rep 4 100 - -100 73 - -75 68 6 -52 100 100 -100 -1003-1-3 PARTY ID Dem-Rep 7 100 8 -100 100 - -100 85 10 -63 100 100 -100 -100
Q. 4 Respondent GenderTotal Answering (1200) (415) (395) (362) (566) (124) (482) (304) (469) (368) (213) (189) (117) (239)Male 48 38 55 51 42 49 55 44 46 56 41 35 50 52Female 52 62 45 49 58 51 45 56 54 45 59 65 51 48
Q. 40 Respondent AgeTotal Answering (1200) (415) (395) (362) (566) (124) (482) (304) (469) (368) (213) (189) (117) (239)18 - 24 7 10 7 3 10 7 3 13 6 4 14 6 3 325 - 29 9 11 9 6 10 13 6 15 9 4 14 8 9 430 - 34 8 9 8 7 9 9 6 11 8 5 13 5 10 535 - 39 9 10 11 6 10 8 8 13 9 6 12 7 7 640 - 44 8 7 9 8 8 9 8 7 8 8 5 10 11 645 - 49 7 7 7 9 6 10 8 4 8 9 4 10 9 850 - 54 7 7 6 8 7 6 7 6 5 9 6 6 2 1055 - 59 9 8 9 9 8 10 9 6 11 10 6 11 10 960 - 64 10 11 7 15 9 8 13 7 11 13 9 12 14 14Over 64 25 21 24 30 21 18 31 18 25 30 16 25 26 31(No answer) 2 1 3 2 2 2 3 2 2 3 1 1 1 318 - 34 23 29 24 15 29 28 15 38 23 13 41 19 22 1235 - 49 24 24 27 22 24 27 23 24 25 23 21 27 27 2050 - 64 26 25 22 31 24 24 29 18 27 31 21 29 26 33Over 64 25 21 24 30 21 18 31 18 25 30 16 25 26 31(No answer) 2 1 3 2 2 2 3 2 2 3 1 1 1 318 - 49 47 53 51 37 53 56 38 62 47 36 62 45 48 3250 and over 50 46 46 61 45 42 59 36 51 61 37 54 51 65
Q. 41 Respondent Educational AttainmentTotal Answering (1200) (415) (395) (362) (566) (124) (482) (304) (469) (368) (213) (189) (117) (239)1 - 11th grade 1 1 1 1 1 1 1 1 1 1 1 1 - 1High school graduate 16 18 14 17 15 19 17 12 17 19 12 22 17 17Non-college post H.S. 3 2 2 4 2 1 4 1 3 4 1 3 5 4Some college 28 26 28 31 26 33 29 24 28 32 23 30 25 34College graduate 30 31 32 30 33 23 31 38 30 28 37 25 40 26Post-graduate school 21 22 24 17 24 24 17 24 22 17 26 19 13 19(Don't know/refused) 1 0 0 0 0 - 0 0 0 0 1 - - 0H.S. or less 18 19 15 19 16 19 18 12 17 20 12 23 17 18Post H.S. 31 28 30 35 28 34 33 25 31 35 24 33 30 38College Graduate 51 53 55 47 56 47 48 62 51 45 63 43 53 44Not College 48 47 44 53 44 53 51 37 48 55 36 57 47 55
TargetSmart Communications 1155 15th St, NW, Suite 750, Washington, DC 20005 targetsmart.com
193 of 228
Page 194
May 21-27, 2020
National Voter Insights Study
TargetSmart + Dynata
Party ID/Gender
Total Dem MenDem
Women Ind MenInd
Women Rep MenRep
Women
Party ID Difference...2-3-2 PARTY ID Dem-Rep 4 100 100 - - -100 -1003-1-3 PARTY ID Dem-Rep 7 100 100 1 17 -100 -100
Q. 4 Respondent GenderTotal Answering (1200) (157) (258) (219) (177) (186) (177)Male 48 100 - 100 - 100 -Female 52 - 100 - 100 - 100
Q. 40 Respondent AgeTotal Answering (1200) (157) (258) (219) (177) (186) (177)18 - 24 7 8 11 6 9 3 225 - 29 9 10 11 9 10 6 630 - 34 8 8 9 9 7 7 735 - 39 9 10 10 11 11 6 640 - 44 8 8 7 7 10 6 1045 - 49 7 8 6 6 8 8 950 - 54 7 4 8 5 8 6 955 - 59 9 9 8 11 7 9 960 - 64 10 8 12 7 6 14 15Over 64 25 24 18 25 22 34 25(No answer) 2 1 1 4 3 2 318 - 34 23 27 31 24 26 15 1535 - 49 24 26 22 24 29 20 2550 - 64 26 21 28 23 21 29 33Over 64 25 24 18 25 22 34 25(No answer) 2 1 1 4 3 2 318 - 49 47 53 53 48 55 35 4050 and over 50 45 46 48 43 63 58
Q. 41 Respondent Educational AttainmentTotal Answering (1200) (157) (258) (219) (177) (186) (177)1 - 11th grade 1 1 1 1 1 - 3High school graduate 16 21 16 13 15 18 17Non-college post H.S. 3 1 3 3 1 4 4Some college 28 21 29 27 29 27 35College graduate 30 29 32 32 31 29 31Post-graduate school 21 27 19 23 24 22 11(Don't know/refused) 1 - 1 1 - - 1H.S. or less 18 21 17 14 16 18 19Post H.S. 31 22 32 30 30 31 39College Graduate 51 57 51 56 55 51 42Not College 48 43 48 44 45 49 58
TargetSmart Communications 1155 15th St, NW, Suite 750, Washington, DC 20005 targetsmart.com
194 of 228
Page 195
May 21-27, 2020
National Voter Insights Study
TargetSmart + Dynata
Urbanicity
Total R1 R2 S3 S4 U5 U6 Rural Subu rban Urban
Party ID Difference...2-3-2 PARTY ID Dem-Rep 4 -23 -15 -2 9 22 42 -19 4 283-1-3 PARTY ID Dem-Rep 7 -23 -17 -1 12 26 52 -20 7 33
Q. 4 Respondent GenderTotal Answering (1200) (179) (181) (195) (273) (264) (108) (360) (468) (372)Male 48 47 53 47 50 45 42 50 49 44Female 52 53 47 54 50 55 58 50 52 56
Q. 40 Respondent AgeTotal Answering (1200) (179) (181) (195) (273) (264) (108) (360) (468) (372)18 - 24 7 6 5 7 8 7 7 6 8 725 - 29 9 4 7 10 10 12 6 6 10 1030 - 34 8 6 6 7 9 8 13 6 8 935 - 39 9 10 7 7 11 9 10 9 10 940 - 44 8 8 7 7 7 8 9 8 7 945 - 49 7 6 8 5 8 8 7 7 7 850 - 54 7 12 5 7 5 5 10 8 6 755 - 59 9 5 14 7 9 9 8 10 8 960 - 64 10 10 10 13 8 11 9 10 10 10Over 64 25 29 29 27 23 20 20 29 25 20(No answer) 2 3 1 3 2 3 1 2 2 218 - 34 23 17 18 25 27 26 26 18 26 2635 - 49 24 25 22 20 26 25 26 23 23 2550 - 64 26 26 30 27 22 25 28 28 24 26Over 64 25 29 29 27 23 20 20 29 25 20(No answer) 2 3 1 3 2 3 1 2 2 218 - 49 47 42 40 44 52 52 51 41 49 5250 and over 50 56 59 53 46 45 48 57 49 46
Q. 41 Respondent Educational AttainmentTotal Answering (1200) (179) (181) (195) (273) (264) (108) (360) (468) (372)1 - 11th grade 1 3 - 1 1 1 1 1 1 1High school graduate 16 18 21 16 14 14 16 20 15 15Non-college post H.S. 3 5 3 3 4 0 2 4 4 1Some college 28 34 32 29 27 26 18 33 27 24College graduate 30 27 29 29 28 34 36 28 28 35Post-graduate school 21 12 15 21 25 23 26 14 23 24(Don't know/refused) 1 3 - 1 1 0 1 1 1 0H.S. or less 18 20 21 18 15 16 17 21 16 16Post H.S. 31 39 35 32 31 26 20 37 31 25College Graduate 51 39 44 50 53 58 62 41 52 59Not College 48 59 56 49 46 42 37 57 47 41
TargetSmart Communications 1155 15th St, NW, Suite 750, Washington, DC 20005 targetsmart.com
195 of 228
Page 196
May 21-27, 2020
National Voter Insights Study
TargetSmart + Dynata
Urbanicity/Gender
Total Rural MenRural
WomenSubu rban
MenSubu rban Women Urban Men
Urban Women
Party ID Difference...2-3-2 PARTY ID Dem-Rep 4 -23 -15 -4 12 13 393-1-3 PARTY ID Dem-Rep 7 -28 -13 -1 15 16 48
Q. 4 Respondent GenderTotal Answering (1200) (180) (180) (227) (241) (164) (208)Male 48 100 - 100 - 100 -Female 52 - 100 - 100 - 100
Q. 40 Respondent AgeTotal Answering (1200) (180) (180) (227) (241) (164) (208)18 - 24 7 4 7 8 7 6 925 - 29 9 7 5 9 12 9 1130 - 34 8 6 7 7 8 10 835 - 39 9 6 11 11 8 9 940 - 44 8 9 7 7 7 6 1145 - 49 7 7 7 6 7 9 750 - 54 7 4 12 4 7 6 755 - 59 9 11 8 9 7 9 960 - 64 10 11 10 8 12 10 10Over 64 25 33 25 28 22 25 16(No answer) 2 2 2 3 2 2 318 - 34 23 17 18 24 27 25 2835 - 49 24 22 25 24 23 23 2750 - 64 26 26 30 22 27 25 26Over 64 25 33 25 28 22 25 16(No answer) 2 2 2 3 2 2 318 - 49 47 38 44 48 50 48 5450 and over 50 60 55 49 49 51 42
Q. 41 Respondent Educational AttainmentTotal Answering (1200) (180) (180) (227) (241) (164) (208)1 - 11th grade 1 - 3 1 1 1 1High school graduate 16 21 18 14 16 16 14Non-college post H.S. 3 5 3 4 4 - 1Some college 28 27 39 26 29 23 24College graduate 30 29 26 28 29 33 37Post-graduate school 21 18 9 27 20 26 23(Don't know/refused) 1 0 2 0 2 1 -H.S. or less 18 21 21 15 17 17 15Post H.S. 31 32 42 30 33 23 26College Graduate 51 47 36 55 48 59 59Not College 48 53 62 45 50 40 41
TargetSmart Communications 1155 15th St, NW, Suite 750, Washington, DC 20005 targetsmart.com
196 of 228
Page 197
May 21-27, 2020
National Voter Insights Study
TargetSmart + Dynata
Region by State
TotalBorder States
Califo rnia
Indust rial
Midw est
Lower Midw
estMid -
Atla ntic
Moun tain
States
Nati onal
Capi talNew
Engl and
Paci fic Northw
est SouthSouthe
ast
Upper Midw
est
Party ID Difference...2-3-2 PARTY ID Dem-Rep 4 4 19 -11 16 15 2 5 17 -7 -3 3 13-1-3 PARTY ID Dem-Rep 7 -5 27 -6 17 21 5 15 29 2 -9 8 -8
Q. 4 Respondent GenderTotal Answering (1200) (132) (120) (157) (60) (158) (48) (60) (60) (48) (108) (193) (48)Male 48 46 48 57 40 45 46 40 50 59 40 46 60Female 52 54 52 44 60 56 54 60 50 41 60 54 40
Q. 40 Respondent AgeTotal Answering (1200) (132) (120) (157) (60) (158) (48) (60) (60) (48) (108) (193) (48)18 - 24 7 10 11 5 8 8 6 9 11 - 3 6 525 - 29 9 13 5 9 10 8 11 6 13 10 11 7 830 - 34 8 6 7 10 7 7 13 8 2 9 6 9 1135 - 39 9 9 7 10 11 9 12 8 11 14 13 6 740 - 44 8 8 6 9 5 10 5 10 9 10 7 6 1145 - 49 7 10 7 6 6 5 14 4 5 10 8 7 850 - 54 7 3 5 9 7 9 4 9 7 9 6 6 1155 - 59 9 12 10 8 15 8 5 3 4 12 10 9 760 - 64 10 9 12 10 9 12 6 8 3 2 14 12 13Over 64 25 19 24 23 22 24 26 32 36 23 21 28 19(No answer) 2 2 5 1 1 2 1 4 - 4 2 3 218 - 34 23 29 23 24 25 22 29 23 26 18 20 23 2435 - 49 24 26 20 26 21 24 30 22 25 33 28 19 2650 - 64 26 24 27 27 32 28 14 19 14 23 30 27 30Over 64 25 19 24 23 22 24 26 32 36 23 21 28 19(No answer) 2 2 5 1 1 2 1 4 - 4 2 3 218 - 49 47 55 44 49 46 46 59 45 51 51 47 41 4950 and over 50 43 51 50 53 52 40 51 50 45 51 56 49
Q. 41 Respondent Educational AttainmentTotal Answering (1200) (132) (120) (157) (60) (158) (48) (60) (60) (48) (108) (193) (48)1 - 11th grade 1 1 - 2 2 1 - - 1 - 3 2 2High school graduate 16 13 10 19 18 16 14 12 22 7 24 18 19Non-college post H.S. 3 4 - 4 3 4 4 - - 2 5 3 2Some college 28 33 30 20 28 31 33 26 23 32 31 26 23College graduate 30 32 37 31 36 31 28 33 26 31 22 27 39Post-graduate school 21 18 24 24 14 16 22 29 23 27 15 22 16(Don't know/refused) 1 - - 0 - 1 - - 5 2 1 2 -H.S. or less 18 14 10 21 20 17 14 12 24 7 27 20 20Post H.S. 31 37 30 24 31 35 36 26 23 34 36 29 25College Graduate 51 50 61 55 49 48 50 62 49 58 36 49 55Not College 48 50 40 45 51 52 50 38 47 41 63 49 45
TargetSmart Communications 1155 15th St, NW, Suite 750, Washington, DC 20005 targetsmart.com
197 of 228
Page 198
May 21-27, 2020
National Voter Insights Study
TargetSmart + Dynata
Gender Age
Total Men Women 18 - 34 35 - 49 50 - 64 Over 64 18 - 4950 and
over
Party ID Difference...2-3-2 PARTY ID Dem-Rep 4 -5 13 24 6 -2 -8 15 -53-1-3 PARTY ID Dem-Rep 7 -5 18 33 8 0 -10 21 -5
Q. 4 Respondent GenderTotal Answering (1200) (571) (629) (281) (287) (310) (295) (568) (605)Male 48 100 - 45 46 44 56 45 50Female 52 - 100 56 54 56 44 55 50
Q. 40 Respondent AgeTotal Answering (1200) (571) (629) (281) (287) (310) (295) (568) (605)18 - 24 7 6 8 29 - - - 15 -25 - 29 9 8 9 38 - - - 19 -30 - 34 8 8 8 33 - - - 16 -35 - 39 9 9 9 - 38 - - 19 -40 - 44 8 7 9 - 32 - - 16 -45 - 49 7 7 7 - 30 - - 15 -50 - 54 7 5 9 - - 27 - - 1455 - 59 9 10 8 - - 34 - - 1760 - 64 10 10 11 - - 40 - - 20Over 64 25 29 21 - - - 100 - 49(No answer) 2 2 2 - - - - - -18 - 34 23 22 25 100 - - - 50 -35 - 49 24 23 25 - 100 - - 51 -50 - 64 26 24 27 - - 100 - - 51Over 64 25 29 21 - - - 100 - 49(No answer) 2 2 2 - - - - - -18 - 49 47 45 50 100 100 - - 100 -50 and over 50 53 48 - - 100 100 - 100
Q. 41 Respondent Educational AttainmentTotal Answering (1200) (571) (629) (281) (287) (310) (295) (568) (605)1 - 11th grade 1 1 2 0 1 2 2 0 2High school graduate 16 17 16 16 17 17 17 16 17Non-college post H.S. 3 3 3 2 1 4 4 2 4Some college 28 26 30 27 25 30 29 26 30College graduate 30 30 31 37 32 27 25 35 26Post-graduate school 21 24 18 17 23 18 24 20 21(Don't know/refused) 1 1 1 1 1 1 - 1 1H.S. or less 18 17 18 16 17 19 19 17 19Post H.S. 31 28 33 29 26 34 33 28 33College Graduate 51 54 48 54 56 46 49 55 47Not College 48 46 51 45 43 53 51 44 52
TargetSmart Communications 1155 15th St, NW, Suite 750, Washington, DC 20005 targetsmart.com
198 of 228
Page 199
May 21-27, 2020
National Voter Insights Study
TargetSmart + Dynata
Education Homeownership status Marital status
TotalH.S. or
lessPost H.S.
4yr Coll Grad
Post Grad
Coll ege Grad uate
Total Non Coll Rent Own
Marr ied Single
Separa ted / divo rced
Wido wed
Total Unmarr
ied
Party ID Difference...2-3-2 PARTY ID Dem-Rep 4 5 -3 6 13 9 0 32 -5 -11 30 10 -6 213-1-3 PARTY ID Dem-Rep 7 3 -1 9 20 14 0 44 -6 -13 42 12 -10 29
Q. 4 Respondent GenderTotal Answering (1200) (210) (369) (363) (248) (610) (579) (297) (873) (618) (357) (144) (59) (560)Male 48 47 44 47 55 50 45 44 49 51 47 45 23 44Female 52 53 56 53 45 50 55 57 51 50 53 55 77 56
Q. 40 Respondent AgeTotal Answering (1200) (210) (369) (363) (248) (610) (579) (297) (873) (618) (357) (144) (59) (560)18 - 24 7 10 7 7 4 6 8 10 5 2 19 0 3 1325 - 29 9 8 7 14 6 10 7 18 6 6 20 1 - 1330 - 34 8 4 8 9 10 9 7 11 7 7 14 1 - 935 - 39 9 8 8 11 10 10 8 10 8 10 10 7 - 840 - 44 8 11 5 8 9 9 7 8 8 9 6 9 7 745 - 49 7 5 8 7 9 7 7 5 8 8 4 9 2 550 - 54 7 7 8 6 7 6 7 7 7 8 4 11 2 555 - 59 9 10 8 10 8 9 9 8 9 10 6 14 5 860 - 64 10 12 13 8 8 8 12 6 12 13 5 12 9 7Over 64 25 26 26 21 28 24 26 14 29 26 10 35 68 22(No answer) 2 1 3 2 2 2 2 3 2 3 2 1 4 218 - 34 23 21 22 29 20 25 22 39 18 14 53 2 3 3535 - 49 24 23 20 26 27 26 22 23 24 27 21 25 9 2150 - 64 26 28 29 23 23 23 28 21 28 31 14 37 16 20Over 64 25 26 26 21 28 24 26 14 29 26 10 35 68 22(No answer) 2 1 3 2 2 2 2 3 2 3 2 1 4 218 - 49 47 45 43 54 47 51 44 62 42 40 74 27 13 5550 and over 50 54 55 44 51 47 55 35 56 57 24 72 84 43
Q. 41 Respondent Educational AttainmentTotal Answering (1200) (210) (369) (363) (248) (610) (579) (297) (873) (618) (357) (144) (59) (560)1 - 11th grade 1 7 - - - - 3 2 1 1 2 1 7 2High school graduate 16 93 - - - - 34 21 15 14 19 21 16 19Non-college post H.S. 3 - 9 - - - 6 3 3 3 3 3 4 3Some college 28 - 91 - - - 58 28 29 28 27 31 35 29College graduate 30 - - 100 - 59 - 33 30 31 33 26 19 30Post-graduate school 21 - - - 100 41 - 13 24 24 17 17 20 17(Don't know/refused) 1 - - - - - - 0 0 - 1 1 - 1H.S. or less 18 100 - - - - 36 23 16 15 20 22 23 21Post H.S. 31 - 100 - - - 64 31 31 31 29 34 39 32College Graduate 51 - - 100 100 100 - 46 53 55 50 44 38 47Not College 48 100 100 - - - 100 54 47 45 49 56 62 52
TargetSmart Communications 1155 15th St, NW, Suite 750, Washington, DC 20005 targetsmart.com
199 of 228
Page 200
May 21-27, 2020
National Voter Insights Study
TargetSmart + Dynata
Kids at home Religious attendance
Total Yes No
More than
once a week
Once a week
Once or twice a month
A few times a
year Seldom NeverFreq uent
Infreq uent
Seldom / Never
Party ID Difference...2-3-2 PARTY ID Dem-Rep 4 2 6 -10 -15 5 7 6 24 -14 6 163-1-3 PARTY ID Dem-Rep 7 5 9 -19 -17 -5 14 9 35 -17 7 24
Q. 4 Respondent GenderTotal Answering (1200) (301) (876) (89) (251) (121) (190) (212) (301) (340) (311) (513)Male 48 43 49 50 38 51 44 53 52 41 47 52Female 52 57 51 50 62 49 56 47 48 59 53 48
Q. 40 Respondent AgeTotal Answering (1200) (301) (876) (89) (251) (121) (190) (212) (301) (340) (311) (513)18 - 24 7 3 8 1 10 6 9 4 8 7 7 625 - 29 9 7 10 8 6 6 13 6 13 7 10 1030 - 34 8 12 6 3 5 8 7 10 10 5 7 1035 - 39 9 20 5 6 6 10 11 9 11 6 11 1040 - 44 8 20 4 10 7 14 6 5 7 7 9 745 - 49 7 15 4 10 8 9 5 7 6 8 7 650 - 54 7 8 7 7 5 7 8 8 6 5 8 755 - 59 9 6 10 9 11 9 7 6 11 10 8 960 - 64 10 3 13 7 14 9 10 15 7 12 10 10Over 64 25 2 33 32 28 20 22 29 20 29 21 24(No answer) 2 4 1 7 1 2 4 1 2 3 3 118 - 34 23 23 24 11 21 20 28 20 31 19 25 2635 - 49 24 55 13 26 20 33 21 21 24 22 26 2350 - 64 26 17 29 23 29 25 25 29 24 28 25 26Over 64 25 2 33 32 28 20 22 29 20 29 21 24(No answer) 2 4 1 7 1 2 4 1 2 3 3 118 - 49 47 78 37 38 41 53 49 41 55 40 51 4950 and over 50 19 62 56 57 45 47 58 44 57 46 50
Q. 41 Respondent Educational AttainmentTotal Answering (1200) (301) (876) (89) (251) (121) (190) (212) (301) (340) (311) (513)1 - 11th grade 1 1 2 1 1 2 2 3 0 1 2 1High school graduate 16 15 17 22 12 14 14 16 20 15 14 18Non-college post H.S. 3 2 3 3 5 1 3 3 2 4 2 2Some college 28 29 28 24 30 29 29 30 26 28 29 28College graduate 30 30 31 33 33 34 27 23 34 33 30 29Post-graduate school 21 24 20 18 20 21 25 26 17 19 24 21(Don't know/refused) 1 - 0 - - - 0 1 0 - 0 1H.S. or less 18 15 18 23 13 16 15 18 20 15 15 20Post H.S. 31 31 31 27 34 30 32 33 28 32 31 30College Graduate 51 54 50 50 53 55 52 48 52 52 53 50Not College 48 47 49 50 47 45 47 51 48 48 46 49
TargetSmart Communications 1155 15th St, NW, Suite 750, Washington, DC 20005 targetsmart.com
200 of 228
Page 201
May 21-27, 2020
National Voter Insights Study
TargetSmart + Dynata
Gender/Age Gender/Education Age/Education
TotalYoun
ger MenOlder Men
Youn ger
WomenOlder
WomenNon Coll
MenColl Men
Non Coll Women
Coll Women
Youn ger Non
CollOlder
Non Coll
Youn ger Coll
egeOlder Coll
Party ID Difference...2-3-2 PARTY ID Dem-Rep 4 7 -15 21 6 -9 -2 7 19 6 -4 22 -53-1-3 PARTY ID Dem-Rep 7 12 -19 28 8 -12 1 10 26 8 -7 31 -3
Q. 4 Respondent GenderTotal Answering (1200) (256) (301) (312) (304) (262) (307) (318) (304) (252) (316) (312) (285)Male 48 100 100 - - 100 100 - - 47 43 44 57Female 52 - - 100 100 - - 100 100 53 57 57 43
Q. 40 Respondent AgeTotal Answering (1200) (256) (301) (312) (304) (262) (307) (318) (304) (252) (316) (312) (285)18 - 24 7 13 - 15 - 8 4 8 7 19 - 11 -25 - 29 9 18 - 19 - 9 8 6 13 17 - 20 -30 - 34 8 17 - 16 - 8 8 5 11 15 - 18 -35 - 39 9 20 - 19 - 8 10 7 11 17 - 20 -40 - 44 8 16 - 17 - 6 8 8 10 16 - 17 -45 - 49 7 16 - 14 - 6 8 8 7 16 - 14 -50 - 54 7 - 9 - 18 3 6 10 6 - 13 - 1355 - 59 9 - 19 - 16 10 9 8 8 - 16 - 1960 - 64 10 - 18 - 23 11 8 14 8 - 23 - 17Over 64 25 - 54 - 43 28 30 24 18 - 48 - 51(No answer) 2 - - - - 2 2 2 2 - - - -18 - 34 23 49 - 50 - 25 19 19 31 51 - 49 -35 - 49 24 51 - 50 - 20 26 23 27 49 - 51 -50 - 64 26 - 46 - 57 24 24 32 22 - 52 - 50Over 64 25 - 54 - 43 28 30 24 18 - 48 - 51(No answer) 2 - - - - 2 2 2 2 - - - -18 - 49 47 100 - 100 - 45 44 42 58 100 - 100 -50 and over 50 - 100 - 100 53 53 56 40 - 100 - 100
Q. 41 Respondent Educational AttainmentTotal Answering (1200) (256) (301) (312) (304) (262) (307) (318) (304) (252) (316) (312) (285)1 - 11th grade 1 0 1 1 3 2 - 3 - 1 4 - -High school graduate 16 19 15 13 19 36 - 32 - 36 32 - -Non-college post H.S. 3 1 4 2 4 6 - 5 - 4 7 - -Some college 28 25 26 27 33 56 - 60 - 59 56 - -College graduate 30 34 26 35 26 - 55 - 63 - - 63 56Post-graduate school 21 20 28 21 14 - 45 - 37 - - 37 44(Don't know/refused) 1 1 0 1 1 - - - - - - - -H.S. or less 18 20 16 14 22 38 - 35 - 37 36 - -Post H.S. 31 27 30 29 37 62 - 65 - 63 64 - -College Graduate 51 53 54 57 40 - 100 - 100 - - 100 100Not College 48 46 46 43 59 100 - 100 - 100 100 - -
TargetSmart Communications 1155 15th St, NW, Suite 750, Washington, DC 20005 targetsmart.com
201 of 228
Page 202
May 21-27, 2020
National Voter Insights Study
TargetSmart + Dynata
Marital Status/Gender Marital Status/Kids Trump Job Approval
Voting Permissions by State
Total
Marr ied
Men
Marr ied
WomenUnmarr ied Men
Unmarr ied
Women
Marr ied
with kids
Marr ied with out kids
Unmarr ied with
kids
Unmarr ied with out kids
Total appr ove
Total disapp rove All mail
Open early / mail Closed
Party ID Difference...2-3-2 PARTY ID Dem-Rep 4 -17 -5 9 30 -4 -15 19 22 -50 50 -9 4 83-1-3 PARTY ID Dem-Rep 7 -22 -4 16 39 -2 -19 22 31 -65 67 -5 9 8
Q. 4 Respondent GenderTotal Answering (1200) (312) (306) (247) (313) (216) (400) (83) (471) (528) (626) (111) (605) (484)Male 48 100 - 100 - 47 53 32 46 52 44 55 50 43Female 52 - 100 - 100 54 47 68 54 48 56 45 50 57
Q. 40 Respondent AgeTotal Answering (1200) (312) (306) (247) (313) (216) (400) (83) (471) (528) (626) (111) (605) (484)18 - 24 7 1 2 12 14 2 2 7 14 5 8 4 7 725 - 29 9 3 8 15 11 6 5 10 13 8 9 9 8 1030 - 34 8 5 8 11 8 13 3 10 9 7 8 7 9 635 - 39 9 9 11 10 7 23 2 13 7 9 9 9 9 1040 - 44 8 9 9 5 9 19 3 22 5 7 8 8 7 945 - 49 7 9 8 4 6 15 5 14 4 7 7 12 7 550 - 54 7 6 10 4 7 7 9 9 5 7 6 5 7 755 - 59 9 11 9 9 7 6 12 7 8 9 9 10 8 1060 - 64 10 11 15 8 7 3 19 3 8 12 9 7 10 11Over 64 25 34 18 21 24 2 40 1 26 27 24 25 25 24(No answer) 2 2 3 2 1 4 1 3 2 2 2 3 3 118 - 34 23 10 17 38 32 21 10 28 36 20 26 21 24 2335 - 49 24 26 27 19 22 57 10 48 15 23 24 29 23 2450 - 64 26 28 34 20 21 16 40 20 21 29 24 22 25 28Over 64 25 34 18 21 24 2 40 1 26 27 24 25 25 24(No answer) 2 2 3 2 1 4 1 3 2 2 2 3 3 118 - 49 47 36 45 57 54 78 20 76 51 43 50 50 47 4750 and over 50 62 53 41 44 17 79 21 47 55 48 47 50 52
Q. 41 Respondent Educational AttainmentTotal Answering (1200) (312) (306) (247) (313) (216) (400) (83) (471) (528) (626) (111) (605) (484)1 - 11th grade 1 - 2 2 2 0 1 1 2 1 1 - 1 1High school graduate 16 14 14 20 18 11 16 25 18 19 14 9 15 20Non-college post H.S. 3 4 2 2 3 1 3 3 2 4 2 2 2 4Some college 28 24 33 29 29 28 29 34 28 29 26 34 25 30College graduate 30 30 32 30 30 32 31 25 31 30 31 27 34 26Post-graduate school 21 29 18 17 18 28 21 13 19 16 25 28 22 17(Don't know/refused) 1 - - 0 1 - - - 1 0 0 1 0 1H.S. or less 18 14 16 22 20 11 16 26 20 20 15 9 16 21Post H.S. 31 27 35 31 32 29 32 37 30 33 28 36 27 34College Graduate 51 59 50 47 48 60 52 38 49 46 57 54 56 43Not College 48 41 50 53 52 40 48 63 50 54 43 45 43 55
TargetSmart Communications 1155 15th St, NW, Suite 750, Washington, DC 20005 targetsmart.com
202 of 228
Page 203
May 21-27, 2020
National Voter Insights Study
TargetSmart + Dynata
Permanent Absentee Voter
Status
Ever Voted Early or By Mail
First Time Voters in 2018 2016 Vote History TargetSmart Voter Score
Total PAVNot PAV Yes No Yes No Voted
Did not Vote
Was Not
Regist ered
Super Voter
Freq uent Voter
Infreq uent Voter
Never Voted
Party ID Difference...2-3-2 PARTY ID Dem-Rep 4 16 3 1 5 4 5 2 4 17 0 1 9 73-1-3 PARTY ID Dem-Rep 7 22 5 0 9 9 7 2 8 26 -4 5 13 14
Q. 4 Respondent GenderTotal Answering (1200) (130) (1070) (220) (980) (176) (1024) (757) (266) (177) (221) (393) (393) (137)Male 48 44 48 47 48 47 48 49 46 42 61 45 42 45Female 52 56 52 53 52 53 52 51 54 58 39 55 58 55
Q. 40 Respondent AgeTotal Answering (1200) (130) (1070) (220) (980) (176) (1024) (757) (266) (177) (221) (393) (393) (137)18 - 24 7 11 6 7 7 11 6 4 7 17 1 3 13 1325 - 29 9 6 9 6 9 10 9 8 9 11 4 5 15 1030 - 34 8 6 8 5 8 5 8 7 13 3 2 8 12 435 - 39 9 8 9 8 9 7 9 8 9 13 3 12 10 740 - 44 8 7 8 5 8 11 7 7 8 8 3 7 9 945 - 49 7 9 7 9 7 8 7 7 9 7 5 6 9 850 - 54 7 5 7 8 7 10 6 6 8 6 5 8 6 955 - 59 9 9 9 11 8 11 9 8 9 10 9 9 8 1160 - 64 10 9 10 10 10 8 11 12 9 6 15 14 6 9Over 64 25 27 24 29 24 19 26 29 17 17 51 25 10 19(No answer) 2 5 2 3 2 1 3 3 1 2 2 3 2 118 - 34 23 23 24 18 25 26 23 20 29 31 6 16 40 2735 - 49 24 24 24 22 24 27 23 22 26 28 11 26 29 2550 - 64 26 22 26 29 25 28 25 26 27 22 29 30 19 29Over 64 25 27 24 29 24 19 26 29 17 17 51 25 10 19(No answer) 2 5 2 3 2 1 3 3 1 2 2 3 2 118 - 49 47 47 47 40 49 52 47 42 55 59 17 41 68 5150 and over 50 49 51 58 49 47 51 56 44 39 80 55 30 48
Q. 41 Respondent Educational AttainmentTotal Answering (1200) (130) (1070) (220) (980) (176) (1024) (757) (266) (177) (221) (393) (393) (137)1 - 11th grade 1 - 1 1 1 3 1 1 2 - 1 1 1 3High school graduate 16 8 17 15 17 19 16 16 19 12 14 15 18 21Non-college post H.S. 3 - 3 3 3 3 3 3 4 2 4 3 2 4Some college 28 31 28 29 28 26 28 27 30 29 24 29 31 27College graduate 30 40 29 30 30 30 30 31 27 32 29 32 29 30Post-graduate school 21 21 21 21 21 18 21 21 17 24 28 20 18 15(Don't know/refused) 1 - 1 1 1 2 1 1 2 2 0 1 1 -H.S. or less 18 8 19 16 18 22 17 18 21 12 14 16 19 24Post H.S. 31 31 31 33 30 30 31 30 34 31 28 32 33 31College Graduate 51 61 50 51 51 47 52 52 44 55 57 52 47 45Not College 48 40 49 49 48 51 48 47 55 43 42 48 52 55
TargetSmart Communications 1155 15th St, NW, Suite 750, Washington, DC 20005 targetsmart.com
203 of 228
Page 204
May 21-27, 2020
National Voter Insights Study
TargetSmart + Dynata
Partisan Score Presidential General Turnout Score Mode
Total 0 to 9.9 10 to 89.9 90+ 0 to 69.9 70+ Web Land line Wire less
Party ID Difference...2-3-2 PARTY ID Dem-Rep 4 -48 -4 53 4 5 3 -3 83-1-3 PARTY ID Dem-Rep 7 -55 -1 62 10 5 4 -6 15
Q. 4 Respondent GenderTotal Answering (1200) (302) (491) (408) (429) (771) (644) (116) (440)Male 48 53 51 40 44 49 46 38 52Female 52 48 49 60 56 51 54 62 48
Q. 40 Respondent AgeTotal Answering (1200) (302) (491) (408) (429) (771) (644) (116) (440)18 - 24 7 4 8 8 11 4 8 4 625 - 29 9 8 8 11 11 8 11 2 830 - 34 8 5 8 10 9 7 9 2 835 - 39 9 8 9 10 8 9 9 - 1240 - 44 8 7 10 6 10 7 7 5 1045 - 49 7 6 9 6 7 7 6 7 950 - 54 7 6 6 8 8 6 6 7 855 - 59 9 11 9 8 9 9 9 8 860 - 64 10 12 9 10 10 11 10 23 7Over 64 25 31 23 22 16 29 25 39 20(No answer) 2 3 2 2 1 3 - 4 518 - 34 23 17 23 28 31 19 28 7 2235 - 49 24 21 28 22 25 23 22 12 3050 - 64 26 28 24 26 26 26 26 37 23Over 64 25 31 23 22 16 29 25 39 20(No answer) 2 3 2 2 1 3 - 4 518 - 49 47 39 51 50 56 42 49 20 5250 and over 50 59 47 48 43 55 51 76 43
Q. 41 Respondent Educational AttainmentTotal Answering (1200) (302) (491) (408) (429) (771) (644) (116) (440)1 - 11th grade 1 1 1 2 1 1 0 4 2High school graduate 16 14 17 17 21 14 17 20 14Non-college post H.S. 3 3 3 3 3 3 3 4 2Some college 28 30 31 23 28 28 29 25 27College graduate 30 31 28 33 28 32 29 29 33Post-graduate school 21 21 20 21 18 22 21 17 22(Don't know/refused) 1 0 1 2 2 1 1 1 1H.S. or less 18 15 18 19 23 15 17 25 16Post H.S. 31 34 33 26 31 31 32 28 29College Graduate 51 51 48 54 45 54 49 46 55Not College 48 48 52 44 53 46 50 53 45
TargetSmart Communications 1155 15th St, NW, Suite 750, Washington, DC 20005 targetsmart.com
204 of 228
Page 205
May 21-27, 2020
National Voter Insights Study
TargetSmart + Dynata
2-3-2 Party 3-1-3 Party Ideology Party ID/Ideology
Total Dem Ind Rep Dem Ind Rep Lib Mod ConsLib
Dem
Mod / Cons Dem
Mod / Lib Rep
Cons Rep
Party ID Difference...2-3-2 PARTY ID Dem-Rep 4 100 - -100 73 - -75 68 6 -52 100 100 -100 -1003-1-3 PARTY ID Dem-Rep 7 100 8 -100 100 - -100 85 10 -63 100 100 -100 -100
Q. 42 Respondent RaceTotal Answering (1200) (415) (395) (362) (566) (124) (482) (304) (469) (368) (213) (189) (117) (239)White 73 60 75 89 63 71 88 66 74 82 67 55 85 90Black 10 18 9 1 17 9 1 16 9 5 16 19 4 -Hispanic 10 15 7 6 13 10 6 12 10 8 12 19 6 7Asian/Pacific Islander 3 3 5 2 4 7 2 4 4 2 4 3 3 1(Other) 2 2 3 1 2 2 2 2 1 3 1 3 2 1(Don't know/refused) 2 1 1 1 1 1 1 1 1 1 1 1 1 1Total Non-White 25 39 23 11 36 28 11 33 25 18 32 44 14 9
Q. 43 Homeownership statusTotal Answering (1200) (415) (395) (362) (566) (124) (482) (304) (469) (368) (213) (189) (117) (239)Rent 25 33 26 12 34 26 13 41 21 14 37 27 19 10Own 73 65 72 86 64 72 86 56 78 85 60 73 79 90(Refused) 3 2 2 1 2 2 2 3 1 2 3 - 2 1
Q. 44 Marital statusTotal Answering (1200) (415) (395) (362) (566) (124) (482) (304) (469) (368) (213) (189) (117) (239)Married 52 42 50 67 42 47 66 35 55 63 37 48 60 70Single 30 40 32 16 40 34 16 50 27 17 49 30 18 15Separated/divorced 12 13 13 11 13 14 11 9 13 13 9 16 15 10Widowed 5 4 5 6 4 3 6 4 4 7 4 5 6 6(Don't know/refused) 2 2 1 1 1 2 1 1 1 0 2 1 1 0Total Unmarried 47 57 50 33 57 51 34 64 44 37 61 51 39 30
Q. 45 Kids at homeTotal Answering (1200) (415) (395) (362) (566) (124) (482) (304) (469) (368) (213) (189) (117) (239)Yes 25 23 28 25 25 25 26 20 28 26 20 28 29 23No 73 76 70 74 75 72 72 79 71 73 80 72 69 77(Refused) 2 0 2 1 1 3 2 1 1 1 0 - 3 0
Q. 46 Religious attendanceTotal Answering (1200) (415) (395) (362) (566) (124) (482) (304) (469) (368) (213) (189) (117) (239)More than once a week 7 5 9 8 5 10 9 2 6 15 1 10 4 11Once a week 21 16 19 29 16 19 28 10 22 29 10 23 24 32Once or twice a month 10 10 10 10 9 7 12 9 10 12 11 9 11 10A few times a year 16 18 13 17 18 8 16 18 16 14 17 19 20 15Seldom 18 18 19 17 18 23 17 21 17 16 20 15 17 16Never 25 31 28 16 32 30 16 37 27 13 39 24 20 15(Don't know/refused) 3 2 2 3 2 4 2 3 3 1 2 2 5 1Frequent 28 21 28 37 21 29 37 12 27 44 11 32 28 43Infrequent 26 28 23 27 27 14 28 27 26 26 28 28 30 25Seldom/Never 43 49 47 33 50 53 33 58 44 29 60 38 37 31
Q. 47 Coronavirus ContractionTotal Answering (1200) (415) (395) (362) (566) (124) (482) (304) (469) (368) (213) (189) (117) (239)Yes 4 6 3 2 5 4 3 5 4 3 5 8 2 2No 93 92 94 96 93 91 95 91 94 95 91 91 94 97(Don't know/refused) 3 2 3 2 2 5 2 4 2 2 3 1 4 1
TargetSmart Communications 1155 15th St, NW, Suite 750, Washington, DC 20005 targetsmart.com
205 of 228
Page 206
May 21-27, 2020
National Voter Insights Study
TargetSmart + Dynata
Party ID/Gender
Total Dem MenDem
Women Ind MenInd
Women Rep MenRep
Women
Party ID Difference...2-3-2 PARTY ID Dem-Rep 4 100 100 - - -100 -1003-1-3 PARTY ID Dem-Rep 7 100 100 1 17 -100 -100
Q. 42 Respondent RaceTotal Answering (1200) (157) (258) (219) (177) (186) (177)White 73 65 58 74 77 88 89Black 10 17 19 8 9 2 0Hispanic 10 12 18 7 7 6 7Asian/Pacific Islander 3 5 2 5 5 3 1(Other) 2 2 2 4 1 1 2(Don't know/refused) 2 0 1 2 1 1 1Total Non-White 25 35 42 24 22 11 10
Q. 43 Homeownership statusTotal Answering (1200) (157) (258) (219) (177) (186) (177)Rent 25 32 34 25 29 12 13Own 73 67 64 72 71 87 86(Refused) 3 1 2 3 1 1 2
Q. 44 Marital statusTotal Answering (1200) (157) (258) (219) (177) (186) (177)Married 52 45 40 53 45 67 66Single 30 41 39 30 35 19 12Separated/divorced 12 10 15 14 12 11 11Widowed 5 2 5 2 8 2 10(Don't know/refused) 2 2 1 2 - 1 1Total Unmarried 47 53 59 45 55 32 33
Q. 45 Kids at homeTotal Answering (1200) (157) (258) (219) (177) (186) (177)Yes 25 24 23 24 33 20 29No 73 76 77 73 67 79 69(Refused) 2 - 1 3 1 1 2
Q. 46 Religious attendanceTotal Answering (1200) (157) (258) (219) (177) (186) (177)More than once a week 7 4 6 8 10 10 6Once a week 21 10 20 15 24 24 34Once or twice a month 10 12 9 12 7 9 11A few times a year 16 15 20 13 14 17 18Seldom 18 20 16 23 14 17 17Never 25 38 27 26 30 21 11(Don't know/refused) 3 2 2 3 1 3 3Frequent 28 14 26 23 34 34 40Infrequent 26 27 29 25 21 25 29Seldom/Never 43 57 43 49 45 38 28
Q. 47 Coronavirus ContractionTotal Answering (1200) (157) (258) (219) (177) (186) (177)Yes 4 7 6 1 6 3 1No 93 92 92 94 94 95 96(Don't know/refused) 3 1 3 5 - 2 3
TargetSmart Communications 1155 15th St, NW, Suite 750, Washington, DC 20005 targetsmart.com
206 of 228
Page 207
May 21-27, 2020
National Voter Insights Study
TargetSmart + Dynata
Urbanicity
Total R1 R2 S3 S4 U5 U6 Rural Subu rban Urban
Party ID Difference...2-3-2 PARTY ID Dem-Rep 4 -23 -15 -2 9 22 42 -19 4 283-1-3 PARTY ID Dem-Rep 7 -23 -17 -1 12 26 52 -20 7 33
Q. 42 Respondent RaceTotal Answering (1200) (179) (181) (195) (273) (264) (108) (360) (468) (372)White 73 87 90 77 67 65 52 88 71 61Black 10 6 3 10 12 12 16 5 11 13Hispanic 10 2 6 7 13 15 15 4 11 15Asian/Pacific Islander 3 1 0 2 3 6 9 1 3 7(Other) 2 3 1 1 2 2 6 2 1 3(Don't know/refused) 2 2 1 2 3 1 1 2 2 1Total Non-White 25 11 10 21 30 34 47 10 26 38
Q. 43 Homeownership statusTotal Answering (1200) (179) (181) (195) (273) (264) (108) (360) (468) (372)Rent 25 16 25 22 21 29 44 20 22 33Own 73 79 74 76 75 70 55 77 75 66(Refused) 3 5 1 2 4 1 1 3 3 1
Q. 44 Marital statusTotal Answering (1200) (179) (181) (195) (273) (264) (108) (360) (468) (372)Married 52 63 58 53 50 44 43 60 51 44Single 30 19 21 28 33 36 42 20 31 38Separated/divorced 12 10 12 12 10 16 9 11 11 14Widowed 5 5 7 6 5 3 4 6 5 4(Don't know/refused) 2 3 2 2 3 1 2 2 2 1Total Unmarried 47 34 41 46 48 56 55 37 47 56
Q. 45 Kids at homeTotal Answering (1200) (179) (181) (195) (273) (264) (108) (360) (468) (372)Yes 25 26 27 29 23 22 28 26 25 24No 73 72 72 69 74 78 70 72 72 76(Refused) 2 3 1 2 4 0 2 2 3 1
Q. 46 Religious attendanceTotal Answering (1200) (179) (181) (195) (273) (264) (108) (360) (468) (372)More than once a week 7 8 7 6 8 7 10 7 7 8Once a week 21 21 24 25 22 18 13 23 23 16Once or twice a month 10 10 15 9 7 10 10 13 8 10A few times a year 16 13 14 19 14 20 10 14 16 17Seldom 18 20 17 14 19 15 26 19 17 18Never 25 22 20 24 25 30 29 21 25 30(Don't know/refused) 3 5 3 3 5 1 2 4 4 1Frequent 28 29 30 31 30 25 23 30 31 24Infrequent 26 24 30 29 22 30 20 27 25 27Seldom/Never 43 43 37 37 44 44 55 40 41 48
Q. 47 Coronavirus ContractionTotal Answering (1200) (179) (181) (195) (273) (264) (108) (360) (468) (372)Yes 4 2 5 3 2 6 8 4 2 7No 93 94 92 92 95 91 89 93 94 91(Don't know/refused) 3 4 3 5 3 3 3 3 4 3
TargetSmart Communications 1155 15th St, NW, Suite 750, Washington, DC 20005 targetsmart.com
207 of 228
Page 208
May 21-27, 2020
National Voter Insights Study
TargetSmart + Dynata
Urbanicity/Gender
Total Rural MenRural
WomenSubu rban
MenSubu rban Women Urban Men
Urban Women
Party ID Difference...2-3-2 PARTY ID Dem-Rep 4 -23 -15 -4 12 13 393-1-3 PARTY ID Dem-Rep 7 -28 -13 -1 15 16 48
Q. 42 Respondent RaceTotal Answering (1200) (180) (180) (227) (241) (164) (208)White 73 88 89 75 69 62 61Black 10 3 6 9 13 13 14Hispanic 10 5 3 8 13 13 16Asian/Pacific Islander 3 0 1 4 2 8 5(Other) 2 2 1 2 1 3 4(Don't know/refused) 2 2 2 2 3 1 1Total Non-White 25 10 10 24 29 37 39
Q. 43 Homeownership statusTotal Answering (1200) (180) (180) (227) (241) (164) (208)Rent 25 19 21 19 24 31 35Own 73 79 74 77 74 67 65(Refused) 3 2 5 4 3 2 1
Q. 44 Marital statusTotal Answering (1200) (180) (180) (227) (241) (164) (208)Married 52 66 55 52 50 47 41Single 30 20 20 33 29 36 39Separated/divorced 12 10 13 11 11 14 15Widowed 5 3 9 2 9 2 5(Don't know/refused) 2 1 4 3 1 1 1Total Unmarried 47 33 41 45 49 52 58
Q. 45 Kids at homeTotal Answering (1200) (180) (180) (227) (241) (164) (208)Yes 25 23 30 22 29 23 24No 73 76 67 75 69 76 76(Refused) 2 1 2 3 3 1 0
Q. 46 Religious attendanceTotal Answering (1200) (180) (180) (227) (241) (164) (208)More than once a week 7 9 5 8 7 6 9Once a week 21 19 26 17 30 14 18Once or twice a month 10 14 12 9 7 10 10A few times a year 16 14 14 16 17 15 19Seldom 18 19 19 18 15 23 14Never 25 23 20 29 20 30 29(Don't know/refused) 3 3 5 4 4 2 1Frequent 28 28 31 24 36 21 27Infrequent 26 27 26 24 25 25 29Seldom/Never 43 42 38 47 35 53 43
Q. 47 Coronavirus ContractionTotal Answering (1200) (180) (180) (227) (241) (164) (208)Yes 4 3 4 2 2 5 8No 93 94 92 93 95 91 90(Don't know/refused) 3 3 4 5 3 4 2
TargetSmart Communications 1155 15th St, NW, Suite 750, Washington, DC 20005 targetsmart.com
208 of 228
Page 209
May 21-27, 2020
National Voter Insights Study
TargetSmart + Dynata
Region by State
TotalBorder States
Califo rnia
Indust rial
Midw est
Lower Midw
estMid -
Atla ntic
Moun tain
States
Nati onal
Capi talNew
Engl and
Paci fic Northw
est SouthSouthe
ast
Upper Midw
est
Party ID Difference...2-3-2 PARTY ID Dem-Rep 4 4 19 -11 16 15 2 5 17 -7 -3 3 13-1-3 PARTY ID Dem-Rep 7 -5 27 -6 17 21 5 15 29 2 -9 8 -8
Q. 42 Respondent RaceTotal Answering (1200) (132) (120) (157) (60) (158) (48) (60) (60) (48) (108) (193) (48)White 73 58 57 83 84 79 77 67 78 85 77 68 98Black 10 6 4 11 4 6 6 19 6 4 23 17 -Hispanic 10 30 17 3 9 11 9 5 7 5 - 9 -Asian/Pacific Islander 3 2 16 1 - 2 3 5 2 4 - 1 -(Other) 2 2 5 1 2 1 4 5 3 2 1 1 0(Don't know/refused) 2 1 1 0 2 1 1 - 5 - - 5 2Total Non-White 25 41 43 17 14 20 22 33 17 15 23 27 0
Q. 43 Homeownership statusTotal Answering (1200) (132) (120) (157) (60) (158) (48) (60) (60) (48) (108) (193) (48)Rent 25 24 28 24 36 28 24 24 32 17 21 22 18Own 73 74 71 72 62 70 76 75 60 79 78 74 80(Refused) 3 2 1 4 2 2 - 1 7 4 1 4 2
Q. 44 Marital statusTotal Answering (1200) (132) (120) (157) (60) (158) (48) (60) (60) (48) (108) (193) (48)Married 52 54 55 50 54 44 60 58 46 57 50 49 60Single 30 31 27 33 30 38 19 29 30 30 27 28 26Separated/divorced 12 11 12 13 14 12 11 10 9 5 12 13 15Widowed 5 5 4 3 3 4 7 4 11 5 7 7 -(Don't know/refused) 2 - 1 1 - 2 3 - 5 3 3 4 -Total Unmarried 47 46 43 49 46 54 37 43 49 40 47 48 41
Q. 45 Kids at homeTotal Answering (1200) (132) (120) (157) (60) (158) (48) (60) (60) (48) (108) (193) (48)Yes 25 32 24 29 19 25 26 30 20 28 27 18 24No 73 68 75 69 81 74 72 71 76 71 72 77 75(Refused) 2 - 1 3 - 2 3 - 5 2 1 5 1
Q. 46 Religious attendanceTotal Answering (1200) (132) (120) (157) (60) (158) (48) (60) (60) (48) (108) (193) (48)More than once a week 7 13 6 7 6 5 7 10 - 7 15 6 4Once a week 21 18 17 17 22 19 23 17 28 19 27 23 22Once or twice a month 10 14 8 13 12 5 11 10 6 11 12 9 14A few times a year 16 20 19 19 13 15 5 19 12 10 8 18 21Seldom 18 15 24 18 21 20 20 16 17 17 17 14 17Never 25 20 25 24 23 33 34 26 30 27 19 25 18(Don't know/refused) 3 2 1 2 4 2 - 2 8 9 2 6 4Frequent 28 30 23 24 27 24 30 27 28 26 42 28 26Infrequent 26 34 27 33 25 20 16 29 17 21 20 27 35Seldom/Never 43 35 49 42 43 54 54 42 47 44 36 39 35
Q. 47 Coronavirus ContractionTotal Answering (1200) (132) (120) (157) (60) (158) (48) (60) (60) (48) (108) (193) (48)Yes 4 7 5 3 3 7 4 - 3 3 4 3 -No 93 92 92 96 96 91 96 97 90 91 89 92 96(Don't know/refused) 3 2 3 1 1 2 - 3 7 6 7 5 5
TargetSmart Communications 1155 15th St, NW, Suite 750, Washington, DC 20005 targetsmart.com
209 of 228
Page 210
May 21-27, 2020
National Voter Insights Study
TargetSmart + Dynata
Gender Age
Total Men Women 18 - 34 35 - 49 50 - 64 Over 64 18 - 4950 and
over
Party ID Difference...2-3-2 PARTY ID Dem-Rep 4 -5 13 24 6 -2 -8 15 -53-1-3 PARTY ID Dem-Rep 7 -5 18 33 8 0 -10 21 -5
Q. 42 Respondent RaceTotal Answering (1200) (571) (629) (281) (287) (310) (295) (568) (605)White 73 75 72 68 69 75 84 68 79Black 10 9 11 13 12 9 6 12 7Hispanic 10 9 11 13 12 11 4 12 8Asian/Pacific Islander 3 4 3 3 5 3 3 4 3(Other) 2 2 2 3 2 2 1 2 2(Don't know/refused) 2 2 2 1 1 1 2 1 2Total Non-White 25 23 27 32 30 24 15 31 19
Q. 43 Homeownership statusTotal Answering (1200) (571) (629) (281) (287) (310) (295) (568) (605)Rent 25 23 27 41 24 20 14 33 17Own 73 75 71 56 72 78 85 64 82(Refused) 3 3 3 3 4 2 1 3 2
Q. 44 Marital statusTotal Answering (1200) (571) (629) (281) (287) (310) (295) (568) (605)Married 52 55 49 30 57 62 55 44 59Single 30 30 30 68 26 17 12 47 14Separated/divorced 12 11 13 1 12 17 17 7 17Widowed 5 2 7 1 2 3 14 1 8(Don't know/refused) 2 2 2 1 2 1 2 2 2Total Unmarried 47 43 50 69 40 37 43 55 40
Q. 45 Kids at homeTotal Answering (1200) (571) (629) (281) (287) (310) (295) (568) (605)Yes 25 22 27 24 57 16 2 41 9No 73 76 71 74 39 83 97 57 90(Refused) 2 2 2 1 4 1 1 2 1
Q. 46 Religious attendanceTotal Answering (1200) (571) (629) (281) (287) (310) (295) (568) (605)More than once a week 7 8 7 4 8 7 10 6 8Once a week 21 17 25 19 18 24 24 18 24Once or twice a month 10 11 9 9 14 10 8 11 9A few times a year 16 15 17 19 14 16 14 16 15Seldom 18 20 16 15 16 20 21 15 20Never 25 27 23 33 25 23 21 29 22(Don't know/refused) 3 3 3 2 6 2 2 4 2Frequent 28 25 32 22 26 30 34 24 32Infrequent 26 25 26 27 28 25 23 28 24Seldom/Never 43 47 39 48 40 43 41 44 42
Q. 47 Coronavirus ContractionTotal Answering (1200) (571) (629) (281) (287) (310) (295) (568) (605)Yes 4 3 5 5 5 4 2 5 3No 93 93 93 91 91 93 95 91 94(Don't know/refused) 3 4 3 4 4 3 3 4 3
TargetSmart Communications 1155 15th St, NW, Suite 750, Washington, DC 20005 targetsmart.com
210 of 228
Page 211
May 21-27, 2020
National Voter Insights Study
TargetSmart + Dynata
Education Homeownership status Marital status
TotalH.S. or
lessPost H.S.
4yr Coll Grad
Post Grad
Coll ege Grad uate
Total Non Coll Rent Own
Marr ied Single
Separa ted / divo rced
Wido wed
Total Unmarr
ied
Party ID Difference...2-3-2 PARTY ID Dem-Rep 4 5 -3 6 13 9 0 32 -5 -11 30 10 -6 213-1-3 PARTY ID Dem-Rep 7 3 -1 9 20 14 0 44 -6 -13 42 12 -10 29
Q. 42 Respondent RaceTotal Answering (1200) (210) (369) (363) (248) (610) (579) (297) (873) (618) (357) (144) (59) (560)White 73 69 76 74 75 74 73 65 77 78 66 77 75 70Black 10 17 10 7 7 7 13 20 7 6 16 9 12 14Hispanic 10 12 9 11 8 10 10 10 10 9 12 11 9 11Asian/Pacific Islander 3 1 2 4 7 5 2 2 4 4 3 1 - 2(Other) 2 1 1 3 2 3 1 2 2 2 3 1 2 2(Don't know/refused) 2 1 1 1 1 1 1 2 1 1 0 1 2 1Total Non-White 25 30 23 25 24 25 26 34 23 21 34 22 23 30
Q. 43 Homeownership statusTotal Answering (1200) (210) (369) (363) (248) (610) (579) (297) (873) (618) (357) (144) (59) (560)Rent 25 33 25 27 16 22 28 100 - 14 43 32 23 38Own 73 65 74 71 83 76 70 - 100 86 54 66 78 60(Refused) 3 3 2 2 2 2 2 - - 1 3 2 - 2
Q. 44 Marital statusTotal Answering (1200) (210) (369) (363) (248) (610) (579) (297) (873) (618) (357) (144) (59) (560)Married 52 43 51 53 59 55 49 28 61 100 - - - -Single 30 34 28 33 25 29 30 52 22 - 100 - - 64Separated/divorced 12 15 13 11 10 10 14 15 11 - - 100 - 26Widowed 5 6 6 3 5 4 6 5 5 - - - 100 11(Don't know/refused) 2 2 1 1 2 1 1 - 1 - - - - -Total Unmarried 47 55 48 46 39 43 51 72 38 - 100 100 100 100
Q. 45 Kids at homeTotal Answering (1200) (210) (369) (363) (248) (610) (579) (297) (873) (618) (357) (144) (59) (560)Yes 25 22 25 25 29 26 24 28 25 35 12 24 13 15No 73 76 74 74 70 72 75 71 75 65 88 74 87 84(Refused) 2 2 1 2 1 1 1 1 1 0 1 3 - 1
Q. 46 Religious attendanceTotal Answering (1200) (210) (369) (363) (248) (610) (579) (297) (873) (618) (357) (144) (59) (560)More than once a week 7 10 7 8 6 7 8 7 8 8 5 10 15 7Once a week 21 15 23 23 20 22 20 13 24 23 16 23 29 19Once or twice a month 10 9 10 11 10 11 10 9 11 11 10 11 7 10A few times a year 16 14 16 14 19 16 16 19 15 15 17 14 22 17Seldom 18 18 19 13 22 17 19 19 18 20 14 20 10 15Never 25 29 23 28 21 25 25 33 22 21 36 21 15 30(Don't know/refused) 3 5 3 2 2 2 4 1 2 2 2 1 3 2Frequent 28 25 30 31 26 29 28 20 32 31 21 33 43 26Infrequent 26 23 26 26 30 27 25 27 26 26 27 25 29 27Seldom/Never 43 48 41 42 43 42 44 52 40 41 50 41 25 45
Q. 47 Coronavirus ContractionTotal Answering (1200) (210) (369) (363) (248) (610) (579) (297) (873) (618) (357) (144) (59) (560)Yes 4 4 3 5 4 5 4 4 4 5 4 2 6 3No 93 94 94 92 92 92 94 93 94 93 94 97 92 95(Don't know/refused) 3 2 3 3 3 3 3 3 2 2 2 1 2 2
TargetSmart Communications 1155 15th St, NW, Suite 750, Washington, DC 20005 targetsmart.com
211 of 228
Page 212
May 21-27, 2020
National Voter Insights Study
TargetSmart + Dynata
Kids at home Religious attendance
Total Yes No
More than
once a week
Once a week
Once or twice a month
A few times a
year Seldom NeverFreq uent
Infreq uent
Seldom / Never
Party ID Difference...2-3-2 PARTY ID Dem-Rep 4 2 6 -10 -15 5 7 6 24 -14 6 163-1-3 PARTY ID Dem-Rep 7 5 9 -19 -17 -5 14 9 35 -17 7 24
Q. 42 Respondent RaceTotal Answering (1200) (301) (876) (89) (251) (121) (190) (212) (301) (340) (311) (513)White 73 67 77 58 75 71 69 79 79 71 69 79Black 10 15 8 26 11 11 9 6 6 15 10 6Hispanic 10 12 9 8 10 13 13 8 8 9 13 8Asian/Pacific Islander 3 3 3 1 2 3 4 4 4 2 4 4(Other) 2 2 2 5 2 1 4 2 1 3 3 1(Don't know/refused) 2 1 1 1 - 2 1 - 1 0 1 1Total Non-White 25 32 23 41 25 28 30 21 19 29 29 20
Q. 43 Homeownership statusTotal Answering (1200) (301) (876) (89) (251) (121) (190) (212) (301) (340) (311) (513)Rent 25 27 24 24 15 21 29 26 33 17 26 30Own 73 72 75 77 84 78 71 73 64 82 73 68(Refused) 3 1 1 - 1 1 0 2 3 1 1 2
Q. 44 Marital statusTotal Answering (1200) (301) (876) (89) (251) (121) (190) (212) (301) (340) (311) (513)Married 52 72 46 53 58 55 50 59 43 57 52 50Single 30 14 36 20 22 28 33 24 43 22 31 35Separated/divorced 12 11 12 16 13 13 11 13 10 14 12 12Widowed 5 3 6 10 7 4 7 3 3 8 6 3(Don't know/refused) 2 0 1 1 - - 0 1 1 0 0 1Total Unmarried 47 28 54 46 42 45 50 40 56 43 48 49
Q. 45 Kids at homeTotal Answering (1200) (301) (876) (89) (251) (121) (190) (212) (301) (340) (311) (513)Yes 25 100 - 33 28 37 23 20 21 29 29 21No 73 - 100 67 71 63 76 80 78 70 70 79(Refused) 2 - - 1 1 1 1 - 0 1 1 0
Q. 46 Religious attendanceTotal Answering (1200) (301) (876) (89) (251) (121) (190) (212) (301) (340) (311) (513)More than once a week 7 10 7 100 - - - - - 26 - -Once a week 21 24 20 - 100 - - - - 74 - -Once or twice a month 10 15 9 - - 100 - - - - 39 -A few times a year 16 15 16 - - - 100 - - - 61 -Seldom 18 14 19 - - - - 100 - - - 41Never 25 21 27 - - - - - 100 - - 59(Don't know/refused) 3 2 2 - - - - - - - - -Frequent 28 33 27 100 100 - - - - 100 - -Infrequent 26 30 25 - - 100 100 - - - 100 -Seldom/Never 43 35 46 - - - - 100 100 - - 100
Q. 47 Coronavirus ContractionTotal Answering (1200) (301) (876) (89) (251) (121) (190) (212) (301) (340) (311) (513)Yes 4 7 3 7 3 8 5 3 3 4 6 3No 93 91 95 91 96 90 94 94 95 95 93 95(Don't know/refused) 3 3 2 2 2 2 2 3 2 2 2 2
TargetSmart Communications 1155 15th St, NW, Suite 750, Washington, DC 20005 targetsmart.com
212 of 228
Page 213
May 21-27, 2020
National Voter Insights Study
TargetSmart + Dynata
Gender/Age Gender/Education Age/Education
TotalYoun
ger MenOlder Men
Youn ger
WomenOlder
WomenNon Coll
MenColl Men
Non Coll Women
Coll Women
Youn ger Non
CollOlder
Non Coll
Youn ger Coll
egeOlder Coll
Party ID Difference...2-3-2 PARTY ID Dem-Rep 4 7 -15 21 6 -9 -2 7 19 6 -4 22 -53-1-3 PARTY ID Dem-Rep 7 12 -19 28 8 -12 1 10 26 8 -7 31 -3
Q. 42 Respondent RaceTotal Answering (1200) (256) (301) (312) (304) (262) (307) (318) (304) (252) (316) (312) (285)White 73 67 83 69 75 74 77 73 72 66 80 71 80Black 10 12 6 13 9 12 5 13 9 17 10 9 5Hispanic 10 12 5 13 10 10 8 11 12 13 8 12 7Asian/Pacific Islander 3 5 4 3 2 2 6 1 4 2 1 5 5(Other) 2 3 1 2 2 1 3 1 2 2 1 3 2(Don't know/refused) 2 1 1 1 2 1 1 1 1 0 1 1 2Total Non-White 25 32 16 30 23 25 22 26 27 33 20 29 19
Q. 43 Homeownership statusTotal Answering (1200) (256) (301) (312) (304) (262) (307) (318) (304) (252) (316) (312) (285)Rent 25 31 16 34 19 26 20 29 24 36 21 30 14Own 73 65 83 63 80 72 78 69 74 61 78 67 86(Refused) 3 4 1 3 2 3 2 2 2 3 1 3 1
Q. 44 Marital statusTotal Answering (1200) (256) (301) (312) (304) (262) (307) (318) (304) (252) (316) (312) (285)Married 52 44 64 44 53 49 60 48 50 40 55 47 64Single 30 48 14 46 15 37 23 25 35 48 17 46 12Separated/divorced 12 7 15 7 19 11 12 16 9 9 18 5 17Widowed 5 - 4 2 12 3 2 9 5 1 10 1 6(Don't know/refused) 2 2 2 2 1 1 2 1 1 1 1 1 2Total Unmarried 47 55 34 55 46 50 38 51 49 58 44 52 34
Q. 45 Kids at homeTotal Answering (1200) (256) (301) (312) (304) (262) (307) (318) (304) (252) (316) (312) (285)Yes 25 38 9 44 10 19 26 28 27 44 8 39 11No 73 60 90 54 89 80 73 70 72 54 92 60 88(Refused) 2 3 1 2 1 2 2 1 1 2 0 1 1
Q. 46 Religious attendanceTotal Answering (1200) (256) (301) (312) (304) (262) (307) (318) (304) (252) (316) (312) (285)More than once a week 7 6 9 6 8 8 8 7 7 7 8 5 9Once a week 21 14 19 22 29 16 18 24 26 19 22 18 26Once or twice a month 10 13 9 10 9 9 12 10 9 10 9 13 9A few times a year 16 13 15 19 14 15 14 16 19 16 15 17 15Seldom 18 18 21 13 19 20 20 17 14 15 21 15 19Never 25 31 25 27 19 29 26 22 25 28 23 30 21(Don't know/refused) 3 4 2 4 2 3 2 4 1 5 2 2 2Frequent 28 20 28 28 36 23 26 32 33 25 30 23 35Infrequent 26 27 24 29 23 24 26 25 28 26 24 29 24Seldom/Never 43 49 46 40 38 49 46 39 39 43 45 46 40
Q. 47 Coronavirus ContractionTotal Answering (1200) (256) (301) (312) (304) (262) (307) (318) (304) (252) (316) (312) (285)Yes 4 5 2 5 4 4 3 3 6 5 2 5 4No 93 92 94 91 94 94 92 94 93 92 96 92 93(Don't know/refused) 3 3 4 4 2 2 5 3 2 3 2 3 3
TargetSmart Communications 1155 15th St, NW, Suite 750, Washington, DC 20005 targetsmart.com
213 of 228
Page 214
May 21-27, 2020
National Voter Insights Study
TargetSmart + Dynata
Marital Status/Gender Marital Status/Kids Trump Job Approval
Voting Permissions by State
Total
Marr ied
Men
Marr ied
WomenUnmarr ied Men
Unmarr ied
Women
Marr ied
with kids
Marr ied with out kids
Unmarr ied with
kids
Unmarr ied with out kids
Total appr ove
Total disapp rove All mail
Open early / mail Closed
Party ID Difference...2-3-2 PARTY ID Dem-Rep 4 -17 -5 9 30 -4 -15 19 22 -50 50 -9 4 83-1-3 PARTY ID Dem-Rep 7 -22 -4 16 39 -2 -19 22 31 -65 67 -5 9 8
Q. 42 Respondent RaceTotal Answering (1200) (312) (306) (247) (313) (216) (400) (83) (471) (528) (626) (111) (605) (484)White 73 79 76 71 69 68 83 64 71 84 66 79 72 74Black 10 5 8 14 14 12 4 23 12 4 15 2 9 12Hispanic 10 8 10 9 13 13 7 10 11 7 12 7 10 10Asian/Pacific Islander 3 5 3 3 2 4 4 1 3 2 4 7 4 1(Other) 2 2 1 2 2 2 2 2 2 2 3 3 2 2(Don't know/refused) 2 1 2 1 0 1 1 1 1 1 1 2 2 1Total Non-White 25 20 22 28 31 31 16 36 29 15 33 19 26 25
Q. 43 Homeownership statusTotal Answering (1200) (312) (306) (247) (313) (216) (400) (83) (471) (528) (626) (111) (605) (484)Rent 25 12 16 38 38 21 10 44 37 18 30 19 26 25Own 73 88 83 59 60 78 90 55 61 81 67 79 73 72(Refused) 3 - 1 4 1 1 1 1 2 2 2 2 2 4
Q. 44 Marital statusTotal Answering (1200) (312) (306) (247) (313) (216) (400) (83) (471) (528) (626) (111) (605) (484)Married 52 100 100 - - 100 100 - - 61 44 61 52 49Single 30 - - 68 60 - - 50 67 22 37 25 30 30Separated/divorced 12 - - 26 25 - - 41 23 11 14 9 13 12Widowed 5 - - 6 14 - - 9 11 6 4 4 4 6(Don't know/refused) 2 - - - - - - - - 1 1 2 2 2Total Unmarried 47 - - 100 100 - - 100 100 38 55 38 47 48
Q. 45 Kids at homeTotal Answering (1200) (312) (306) (247) (313) (216) (400) (83) (471) (528) (626) (111) (605) (484)Yes 25 32 38 11 18 100 - 100 - 26 24 29 24 25No 73 68 62 88 81 - 100 - 100 72 75 70 74 73(Refused) 2 0 0 1 1 - - - - 2 1 1 2 2
Q. 46 Religious attendanceTotal Answering (1200) (312) (306) (247) (313) (216) (400) (83) (471) (528) (626) (111) (605) (484)More than once a week 7 9 7 6 8 7 8 14 6 9 6 7 6 9Once a week 21 20 27 14 23 26 22 17 19 25 18 25 20 21Once or twice a month 10 10 11 12 8 15 9 15 9 12 8 11 10 11A few times a year 16 16 14 13 20 15 15 14 17 15 17 9 20 13Seldom 18 23 18 16 15 15 23 12 16 19 17 14 18 18Never 25 21 22 36 25 20 22 26 31 17 32 30 24 25(Don't know/refused) 3 2 1 2 2 2 1 1 2 3 2 4 3 4Frequent 28 28 34 20 31 34 30 32 25 34 23 32 26 31Infrequent 26 26 26 25 28 30 24 29 26 27 25 20 29 23Seldom/Never 43 44 39 52 39 34 46 39 47 36 49 44 42 43
Q. 47 Coronavirus ContractionTotal Answering (1200) (312) (306) (247) (313) (216) (400) (83) (471) (528) (626) (111) (605) (484)Yes 4 5 4 2 4 7 4 7 3 3 5 6 3 5No 93 92 94 96 94 92 94 87 96 94 93 91 94 91(Don't know/refused) 3 3 2 2 2 2 2 5 1 3 2 3 3 4
TargetSmart Communications 1155 15th St, NW, Suite 750, Washington, DC 20005 targetsmart.com
214 of 228
Page 215
May 21-27, 2020
National Voter Insights Study
TargetSmart + Dynata
Permanent Absentee Voter
Status
Ever Voted Early or By Mail
First Time Voters in 2018 2016 Vote History TargetSmart Voter Score
Total PAVNot PAV Yes No Yes No Voted
Did not Vote
Was Not
Regist ered
Super Voter
Freq uent Voter
Infreq uent Voter
Never Voted
Party ID Difference...2-3-2 PARTY ID Dem-Rep 4 16 3 1 5 4 5 2 4 17 0 1 9 73-1-3 PARTY ID Dem-Rep 7 22 5 0 9 9 7 2 8 26 -4 5 13 14
Q. 42 Respondent RaceTotal Answering (1200) (130) (1070) (220) (980) (176) (1024) (757) (266) (177) (221) (393) (393) (137)White 73 63 75 73 73 68 74 76 73 63 80 77 67 67Black 10 5 11 9 10 9 10 10 10 9 9 10 10 10Hispanic 10 13 10 14 9 15 9 9 9 18 5 7 14 18Asian/Pacific Islander 3 12 2 2 4 3 3 2 5 5 4 2 5 1(Other) 2 6 2 1 2 3 2 2 1 3 1 2 2 4(Don't know/refused) 2 2 2 1 2 3 2 1 2 2 1 2 2 1Total Non-White 25 36 24 26 25 30 24 23 25 34 19 21 31 33
Q. 43 Homeownership statusTotal Answering (1200) (130) (1070) (220) (980) (176) (1024) (757) (266) (177) (221) (393) (393) (137)Rent 25 25 25 19 26 32 24 21 33 29 13 21 31 33Own 73 73 73 81 71 63 75 77 63 68 87 77 66 62(Refused) 3 2 3 0 3 6 2 2 4 3 - 2 3 5
Q. 44 Marital statusTotal Answering (1200) (130) (1070) (220) (980) (176) (1024) (757) (266) (177) (221) (393) (393) (137)Married 52 57 51 57 50 45 53 56 45 42 59 56 46 43Single 30 26 30 24 31 36 29 26 34 38 21 25 38 39Separated/divorced 12 10 12 14 12 13 12 11 15 11 12 12 12 12Widowed 5 6 5 4 5 5 5 5 3 6 7 6 3 6(Don't know/refused) 2 1 2 0 2 2 2 1 3 3 2 1 3 1Total Unmarried 47 42 47 42 48 53 46 43 52 55 40 43 52 56
Q. 45 Kids at homeTotal Answering (1200) (130) (1070) (220) (980) (176) (1024) (757) (266) (177) (221) (393) (393) (137)Yes 25 30 25 22 26 26 25 25 26 26 11 26 32 28No 73 70 73 78 72 70 74 74 71 72 89 73 65 70(Refused) 2 0 2 1 2 4 2 1 4 2 - 1 3 2
Q. 46 Religious attendanceTotal Answering (1200) (130) (1070) (220) (980) (176) (1024) (757) (266) (177) (221) (393) (393) (137)More than once a week 7 6 8 10 7 6 8 8 5 8 11 8 6 6Once a week 21 18 21 23 21 18 22 22 19 20 27 21 18 20Once or twice a month 10 10 10 11 10 13 10 10 11 9 11 8 10 14A few times a year 16 19 15 16 16 19 15 15 17 17 14 15 16 20Seldom 18 22 17 15 18 16 18 18 16 17 17 18 18 16Never 25 24 25 24 25 22 26 24 28 25 19 27 28 20(Don't know/refused) 3 1 3 1 4 6 3 2 5 4 2 2 3 4Frequent 28 24 29 33 27 23 29 30 24 28 38 29 24 26Infrequent 26 30 26 28 26 32 25 25 28 26 25 24 26 34Seldom/Never 43 45 42 39 44 38 44 43 44 42 36 45 47 36
Q. 47 Coronavirus ContractionTotal Answering (1200) (130) (1070) (220) (980) (176) (1024) (757) (266) (177) (221) (393) (393) (137)Yes 4 9 3 5 4 2 4 5 2 4 5 3 5 3No 93 89 93 93 93 92 93 93 94 91 93 94 91 93(Don't know/refused) 3 3 4 2 4 6 3 3 4 5 2 3 4 4
TargetSmart Communications 1155 15th St, NW, Suite 750, Washington, DC 20005 targetsmart.com
215 of 228
Page 216
May 21-27, 2020
National Voter Insights Study
TargetSmart + Dynata
Partisan Score Presidential General Turnout Score Mode
Total 0 to 9.9 10 to 89.9 90+ 0 to 69.9 70+ Web Land line Wire less
Party ID Difference...2-3-2 PARTY ID Dem-Rep 4 -48 -4 53 4 5 3 -3 83-1-3 PARTY ID Dem-Rep 7 -55 -1 62 10 5 4 -6 15
Q. 42 Respondent RaceTotal Answering (1200) (302) (491) (408) (429) (771) (644) (116) (440)White 73 90 80 54 71 75 75 83 68Black 10 1 5 22 10 10 7 9 14Hispanic 10 5 9 15 11 9 10 2 12Asian/Pacific Islander 3 1 2 6 4 3 5 2 1(Other) 2 2 2 2 2 2 1 3 4(Don't know/refused) 2 1 2 2 3 1 1 2 2Total Non-White 25 9 19 45 26 24 23 16 30
Q. 43 Homeownership statusTotal Answering (1200) (302) (491) (408) (429) (771) (644) (116) (440)Rent 25 17 23 33 33 20 25 13 28Own 73 81 75 64 64 78 73 85 70(Refused) 3 2 2 3 4 2 3 2 2
Q. 44 Marital statusTotal Answering (1200) (302) (491) (408) (429) (771) (644) (116) (440)Married 52 63 53 41 46 55 50 57 53Single 30 21 27 40 33 28 33 21 27Separated/divorced 12 12 12 12 15 10 13 8 12Widowed 5 4 6 4 4 5 3 13 6(Don't know/refused) 2 - 2 3 2 2 2 2 2Total Unmarried 47 37 45 56 52 44 49 41 45
Q. 45 Kids at homeTotal Answering (1200) (302) (491) (408) (429) (771) (644) (116) (440)Yes 25 23 28 23 26 25 21 17 34No 73 77 70 74 71 74 78 81 64(Refused) 2 - 3 3 3 1 2 2 2
Q. 46 Religious attendanceTotal Answering (1200) (302) (491) (408) (429) (771) (644) (116) (440)More than once a week 7 8 7 7 6 8 4 12 12Once a week 21 27 20 17 20 21 20 25 22Once or twice a month 10 12 10 9 11 10 9 16 11A few times a year 16 15 15 18 17 15 13 15 20Seldom 18 16 20 16 17 18 18 20 16Never 25 20 25 29 24 26 33 10 17(Don't know/refused) 3 2 4 3 4 3 4 2 3Frequent 28 35 27 24 27 29 23 37 33Infrequent 26 27 25 27 28 25 22 31 31Seldom/Never 43 36 44 46 41 44 51 30 34
Q. 47 Coronavirus ContractionTotal Answering (1200) (302) (491) (408) (429) (771) (644) (116) (440)Yes 4 4 3 5 4 4 4 4 4No 93 95 93 90 92 93 93 91 92(Don't know/refused) 3 1 4 5 4 3 2 5 5
TargetSmart Communications 1155 15th St, NW, Suite 750, Washington, DC 20005 targetsmart.com
216 of 228
Page 217
May 21-27, 2020
National Voter Insights Study
TargetSmart + Dynata
2-3-2 Party 3-1-3 Party Ideology Party ID/Ideology
Total Dem Ind Rep Dem Ind Rep Lib Mod ConsLib
Dem
Mod / Cons Dem
Mod / Lib Rep
Cons Rep
Party ID Difference...2-3-2 PARTY ID Dem-Rep 4 100 - -100 73 - -75 68 6 -52 100 100 -100 -1003-1-3 PARTY ID Dem-Rep 7 100 8 -100 100 - -100 85 10 -63 100 100 -100 -100
UrbanicityTotal Answering (1200) (415) (395) (362) (566) (124) (482) (304) (469) (368) (213) (189) (117) (239)R1 15 9 15 22 11 12 21 11 14 18 11 8 19 22R2 15 10 18 19 12 14 20 11 16 19 11 9 16 21S3 16 14 15 18 15 11 18 15 15 17 16 13 18 18S4 23 22 26 19 23 28 20 23 25 20 22 23 21 19U5 22 30 17 18 26 23 17 26 22 19 30 30 20 18U6 9 14 9 4 13 12 4 12 8 8 11 18 6 3Rural 30 19 33 41 22 26 41 22 29 37 22 17 35 43Suburban 39 37 41 37 38 39 38 39 41 36 37 36 39 37Urban 31 44 26 22 40 35 21 39 30 27 41 48 25 21
Region by StateTotal Answering (1200) (415) (395) (362) (566) (124) (482) (304) (469) (368) (213) (189) (117) (239)Border States 11 12 9 12 9 13 12 11 11 11 13 11 11 12California 10 12 11 7 12 10 8 12 10 9 11 13 7 8Industrial Midwest 13 10 14 17 12 12 16 12 14 15 8 13 19 15Lower Midwest 5 6 4 4 5 3 4 5 5 6 5 7 3 4Mid-Atlantic 13 16 11 12 15 11 11 15 15 10 15 17 17 9Mountain States 4 4 4 4 4 5 4 4 3 5 5 4 2 5National Capital 5 5 5 5 6 4 5 6 4 5 6 4 5 5New England 5 4 9 1 5 12 3 5 6 3 4 3 1 2Non-Mainland 1 - 1 1 - 2 1 - 1 1 - - - 2Pacific Northwest 4 3 5 4 4 4 4 3 5 3 4 2 6 3South 9 9 7 12 8 8 11 8 9 10 11 9 10 12Southeast 16 16 14 17 16 13 16 17 13 19 16 15 14 19Upper Midwest 4 3 5 4 4 4 5 3 5 4 4 2 6 3Unknown - - - - - - - - - - - - - -
ModeTotal Answering (1200) (415) (395) (362) (566) (124) (482) (304) (469) (368) (213) (189) (117) (239)Web 54 55 48 58 51 59 55 54 55 54 57 54 57 60Landline 10 9 9 11 9 9 12 7 10 11 7 11 10 11Wireless 37 36 42 31 40 32 34 39 36 36 36 35 33 30
TargetSmart Communications 1155 15th St, NW, Suite 750, Washington, DC 20005 targetsmart.com
217 of 228
Page 218
May 21-27, 2020
National Voter Insights Study
TargetSmart + Dynata
Party ID/Gender
Total Dem MenDem
Women Ind MenInd
Women Rep MenRep
Women
Party ID Difference...2-3-2 PARTY ID Dem-Rep 4 100 100 - - -100 -1003-1-3 PARTY ID Dem-Rep 7 100 100 1 17 -100 -100
UrbanicityTotal Answering (1200) (157) (258) (219) (177) (186) (177)R1 15 9 9 16 13 18 26R2 15 9 11 21 14 20 18S3 16 16 14 16 15 14 21S4 23 22 23 27 24 22 16U5 22 31 29 15 20 19 17U6 9 14 15 5 13 6 1Rural 30 18 20 37 28 38 44Suburban 39 37 37 43 39 36 38Urban 31 44 44 21 33 26 19
Region by StateTotal Answering (1200) (157) (258) (219) (177) (186) (177)Border States 11 13 11 8 11 12 12California 10 13 11 11 11 8 7Industrial Midwest 13 10 11 16 10 20 13Lower Midwest 5 5 6 5 3 2 6Mid-Atlantic 13 17 16 8 16 14 9Mountain States 4 3 5 4 4 5 4National Capital 5 4 6 5 5 4 7New England 5 4 3 9 9 2 1Non-Mainland 1 - - 1 1 1 1Pacific Northwest 4 3 3 6 4 6 2South 9 7 11 8 6 8 15Southeast 16 17 16 13 16 16 19Upper Midwest 4 5 2 7 3 3 4Unknown - - - - - - -
ModeTotal Answering (1200) (157) (258) (219) (177) (186) (177)Web 54 58 53 43 56 58 57Landline 10 6 11 9 10 8 15Wireless 37 35 36 49 34 34 29
TargetSmart Communications 1155 15th St, NW, Suite 750, Washington, DC 20005 targetsmart.com
218 of 228
Page 219
May 21-27, 2020
National Voter Insights Study
TargetSmart + Dynata
Urbanicity
Total R1 R2 S3 S4 U5 U6 Rural Subu rban Urban
Party ID Difference...2-3-2 PARTY ID Dem-Rep 4 -23 -15 -2 9 22 42 -19 4 283-1-3 PARTY ID Dem-Rep 7 -23 -17 -1 12 26 52 -20 7 33
UrbanicityTotal Answering (1200) (179) (181) (195) (273) (264) (108) (360) (468) (372)R1 15 100 - - - - - 50 - -R2 15 - 100 - - - - 50 - -S3 16 - - 100 - - - - 42 -S4 23 - - - 100 - - - 58 -U5 22 - - - - 100 - - - 71U6 9 - - - - - 100 - - 29Rural 30 100 100 - - - - 100 - -Suburban 39 - - 100 100 - - - 100 -Urban 31 - - - - 100 100 - - 100
Region by StateTotal Answering (1200) (179) (181) (195) (273) (264) (108) (360) (468) (372)Border States 11 6 8 14 10 19 1 7 12 14California 10 3 4 6 10 14 27 4 9 18Industrial Midwest 13 18 13 11 14 10 15 15 13 12Lower Midwest 5 8 6 3 8 4 - 7 5 3Mid-Atlantic 13 6 12 12 6 12 49 9 9 23Mountain States 4 1 5 4 5 6 2 3 4 5National Capital 5 10 - 9 5 3 5 5 7 3New England 5 3 8 4 8 4 1 5 6 3Non-Mainland 1 2 0 1 0 - - 1 1 -Pacific Northwest 4 2 7 4 5 4 - 5 4 3South 9 22 13 7 7 5 - 18 7 3Southeast 16 12 20 22 19 16 1 16 20 11Upper Midwest 4 6 5 4 4 4 - 6 4 3Unknown - - - - - - - - - -
ModeTotal Answering (1200) (179) (181) (195) (273) (264) (108) (360) (468) (372)Web 54 56 51 50 54 55 55 54 53 55Landline 10 17 13 9 5 8 9 15 7 8Wireless 37 26 36 41 40 38 36 31 41 37
TargetSmart Communications 1155 15th St, NW, Suite 750, Washington, DC 20005 targetsmart.com
219 of 228
Page 220
May 21-27, 2020
National Voter Insights Study
TargetSmart + Dynata
Urbanicity/Gender
Total Rural MenRural
WomenSubu rban
MenSubu rban Women Urban Men
Urban Women
Party ID Difference...2-3-2 PARTY ID Dem-Rep 4 -23 -15 -4 12 13 393-1-3 PARTY ID Dem-Rep 7 -28 -13 -1 15 16 48
UrbanicityTotal Answering (1200) (180) (180) (227) (241) (164) (208)R1 15 46 53 - - - -R2 15 54 47 - - - -S3 16 - - 40 43 - -S4 23 - - 60 57 - -U5 22 - - - - 72 70U6 9 - - - - 28 30Rural 30 100 100 - - - -Suburban 39 - - 100 100 - -Urban 31 - - - - 100 100
Region by StateTotal Answering (1200) (180) (180) (227) (241) (164) (208)Border States 11 10 4 9 14 14 14California 10 3 4 9 8 19 17Industrial Midwest 13 14 16 18 8 13 10Lower Midwest 5 5 9 5 6 2 3Mid-Atlantic 13 11 7 7 11 22 24Mountain States 4 3 3 4 5 5 5National Capital 5 5 5 5 8 2 4New England 5 6 5 6 7 4 2Non-Mainland 1 2 1 1 1 - -Pacific Northwest 4 5 4 5 4 5 2South 9 11 24 8 5 3 4Southeast 16 17 14 18 22 11 12Upper Midwest 4 7 4 6 2 2 3Unknown - - - - - - -
ModeTotal Answering (1200) (180) (180) (227) (241) (164) (208)Web 54 49 59 50 55 59 52Landline 10 14 16 4 9 6 10Wireless 37 38 25 46 36 35 38
TargetSmart Communications 1155 15th St, NW, Suite 750, Washington, DC 20005 targetsmart.com
220 of 228
Page 221
May 21-27, 2020
National Voter Insights Study
TargetSmart + Dynata
Region by State
TotalBorder States
Califo rnia
Indust rial
Midw est
Lower Midw
estMid -
Atla ntic
Moun tain
States
Nati onal
Capi talNew
Engl and
Paci fic Northw
est SouthSouthe
ast
Upper Midw
est
Party ID Difference...2-3-2 PARTY ID Dem-Rep 4 4 19 -11 16 15 2 5 17 -7 -3 3 13-1-3 PARTY ID Dem-Rep 7 -5 27 -6 17 21 5 15 29 2 -9 8 -8
UrbanicityTotal Answering (1200) (132) (120) (157) (60) (158) (48) (60) (60) (48) (108) (193) (48)R1 15 9 5 20 25 7 3 28 9 9 37 11 22R2 15 11 6 15 17 14 20 - 24 25 21 18 20S3 16 20 10 14 8 15 14 28 14 16 13 22 14S4 23 21 23 24 34 11 27 22 35 26 17 27 24U5 22 38 31 17 16 20 32 12 17 24 12 21 19U6 9 1 25 10 - 34 3 9 1 - - 1 -Rural 30 20 11 35 42 20 23 28 33 34 59 29 42Suburban 39 41 34 38 42 26 41 51 49 42 30 49 39Urban 31 39 55 28 16 54 35 21 18 24 12 22 19
Region by StateTotal Answering (1200) (132) (120) (157) (60) (158) (48) (60) (60) (48) (108) (193) (48)Border States 11 100 - - - - - - - - - - -California 10 - 100 - - - - - - - - - -Industrial Midwest 13 - - 100 - - - - - - - - -Lower Midwest 5 - - - 100 - - - - - - - -Mid-Atlantic 13 - - - - 100 - - - - - - -Mountain States 4 - - - - - 100 - - - - - -National Capital 5 - - - - - - 100 - - - - -New England 5 - - - - - - - 100 - - - -Non-Mainland 1 - - - - - - - - - - - -Pacific Northwest 4 - - - - - - - - 100 - - -South 9 - - - - - - - - - 100 - -Southeast 16 - - - - - - - - - - 100 -Upper Midwest 4 - - - - - - - - - - - 100Unknown - - - - - - - - - - - - -
ModeTotal Answering (1200) (132) (120) (157) (60) (158) (48) (60) (60) (48) (108) (193) (48)Web 54 54 46 54 52 60 39 59 64 26 53 60 48Landline 10 6 8 10 12 11 13 9 5 16 9 11 15Wireless 37 41 46 37 36 29 48 32 31 59 39 30 37
TargetSmart Communications 1155 15th St, NW, Suite 750, Washington, DC 20005 targetsmart.com
221 of 228
Page 222
May 21-27, 2020
National Voter Insights Study
TargetSmart + Dynata
Gender Age
Total Men Women 18 - 34 35 - 49 50 - 64 Over 64 18 - 4950 and
over
Party ID Difference...2-3-2 PARTY ID Dem-Rep 4 -5 13 24 6 -2 -8 15 -53-1-3 PARTY ID Dem-Rep 7 -5 18 33 8 0 -10 21 -5
UrbanicityTotal Answering (1200) (571) (629) (281) (287) (310) (295) (568) (605)R1 15 15 15 11 16 15 18 13 16R2 15 17 13 12 14 17 18 13 18S3 16 16 17 17 13 17 18 15 17S4 23 24 22 26 24 20 22 25 21U5 22 21 23 25 23 21 18 24 20U6 9 8 10 10 10 10 7 10 9Rural 30 32 29 23 29 33 35 26 34Suburban 39 40 38 43 38 36 39 40 38Urban 31 29 33 35 33 31 26 34 28
Region by StateTotal Answering (1200) (571) (629) (281) (287) (310) (295) (568) (605)Border States 11 11 11 14 12 10 9 13 9California 10 10 10 10 9 11 10 9 10Industrial Midwest 13 16 11 13 14 14 12 14 13Lower Midwest 5 4 6 5 4 6 4 5 5Mid-Atlantic 13 12 14 12 13 15 13 13 14Mountain States 4 4 4 5 5 2 4 5 3National Capital 5 4 6 5 5 4 7 5 5New England 5 5 5 6 5 3 7 5 5Non-Mainland 1 1 1 - 0 1 1 0 1Pacific Northwest 4 5 3 3 6 4 4 4 4South 9 8 10 8 10 10 8 9 9Southeast 16 16 17 16 13 17 19 14 18Upper Midwest 4 5 3 4 4 5 3 4 4Unknown - - - - - - - - -
ModeTotal Answering (1200) (571) (629) (281) (287) (310) (295) (568) (605)Web 54 52 55 63 49 53 55 56 54Landline 10 8 11 3 5 14 15 4 15Wireless 37 40 34 34 46 33 30 40 31
TargetSmart Communications 1155 15th St, NW, Suite 750, Washington, DC 20005 targetsmart.com
222 of 228
Page 223
May 21-27, 2020
National Voter Insights Study
TargetSmart + Dynata
Education Homeownership status Marital status
TotalH.S. or
lessPost H.S.
4yr Coll Grad
Post Grad
Coll ege Grad uate
Total Non Coll Rent Own
Marr ied Single
Separa ted / divo rced
Wido wed
Total Unmarr
ied
Party ID Difference...2-3-2 PARTY ID Dem-Rep 4 5 -3 6 13 9 0 32 -5 -11 30 10 -6 213-1-3 PARTY ID Dem-Rep 7 3 -1 9 20 14 0 44 -6 -13 42 12 -10 29
UrbanicityTotal Answering (1200) (210) (369) (363) (248) (610) (579) (297) (873) (618) (357) (144) (59) (560)R1 15 17 19 13 9 11 18 10 16 18 9 13 15 11R2 15 18 17 14 11 13 17 15 15 17 11 15 22 13S3 16 16 17 15 17 16 17 14 17 17 15 16 21 16S4 23 20 23 21 27 24 22 20 24 22 25 19 21 23U5 22 20 19 25 25 25 19 25 21 19 27 30 15 26U6 9 9 6 11 12 11 7 16 7 8 13 7 8 11Rural 30 36 36 28 20 24 36 25 32 35 20 28 36 24Suburban 39 36 40 37 44 40 38 34 40 39 41 35 42 39Urban 31 28 25 36 36 36 26 41 28 26 39 37 22 37
Region by StateTotal Answering (1200) (210) (369) (363) (248) (610) (579) (297) (873) (618) (357) (144) (59) (560)Border States 11 9 13 12 10 11 12 11 11 12 11 10 11 11California 10 6 10 12 12 12 8 11 10 11 9 10 8 9Industrial Midwest 13 16 10 14 15 14 12 13 13 13 14 14 9 14Lower Midwest 5 6 5 6 3 5 5 7 4 5 5 6 3 5Mid-Atlantic 13 13 15 14 10 12 14 15 13 11 17 13 11 15Mountain States 4 3 5 4 4 4 4 4 4 5 3 4 6 3National Capital 5 4 4 6 7 6 4 5 5 6 5 4 4 5New England 5 7 4 4 6 5 5 7 4 5 5 4 11 5Non-Mainland 1 - 1 - 2 1 1 - 1 1 - 2 - 0Pacific Northwest 4 2 4 4 5 5 3 3 4 4 4 2 4 4South 9 14 11 6 6 6 12 8 10 9 8 9 13 9Southeast 16 18 15 14 17 15 16 14 16 15 15 18 21 16Upper Midwest 4 5 3 5 3 4 4 3 4 5 3 5 - 4Unknown - - - - - - - - - - - - - -
ModeTotal Answering (1200) (210) (369) (363) (248) (610) (579) (297) (873) (618) (357) (144) (59) (560)Web 54 53 57 51 53 52 55 53 54 52 60 56 34 56Landline 10 14 9 9 8 9 11 5 11 11 7 6 25 9Wireless 37 34 35 40 39 39 34 42 35 37 34 38 41 36
TargetSmart Communications 1155 15th St, NW, Suite 750, Washington, DC 20005 targetsmart.com
223 of 228
Page 224
May 21-27, 2020
National Voter Insights Study
TargetSmart + Dynata
Kids at home Religious attendance
Total Yes No
More than
once a week
Once a week
Once or twice a month
A few times a
year Seldom NeverFreq uent
Infreq uent
Seldom / Never
Party ID Difference...2-3-2 PARTY ID Dem-Rep 4 2 6 -10 -15 5 7 6 24 -14 6 163-1-3 PARTY ID Dem-Rep 7 5 9 -19 -17 -5 14 9 35 -17 7 24
UrbanicityTotal Answering (1200) (301) (876) (89) (251) (121) (190) (212) (301) (340) (311) (513)R1 15 15 15 15 15 15 13 17 13 15 14 15R2 15 16 15 14 17 23 14 15 12 16 17 13S3 16 19 15 13 20 15 20 13 15 18 18 14S4 23 21 23 25 24 16 21 24 23 24 19 23U5 22 19 24 21 19 22 27 18 26 19 25 23U6 9 10 9 12 6 9 6 13 10 7 7 12Rural 30 32 30 29 32 38 26 32 25 31 31 28Suburban 39 39 38 38 43 31 40 37 38 42 37 38Urban 31 29 32 33 24 31 33 32 37 27 32 35
Region by StateTotal Answering (1200) (301) (876) (89) (251) (121) (190) (212) (301) (340) (311) (513)Border States 11 14 10 19 9 15 14 9 9 12 14 9California 10 10 10 8 8 8 12 14 10 8 11 12Industrial Midwest 13 15 12 13 11 17 16 13 13 11 17 13Lower Midwest 5 4 6 4 5 6 4 6 5 5 5 5Mid-Atlantic 13 13 13 9 12 7 13 15 18 11 10 17Mountain States 4 4 4 4 4 4 1 5 5 4 3 5National Capital 5 6 5 7 4 5 6 5 5 5 6 5New England 5 4 5 - 7 3 4 5 6 5 3 6Non-Mainland 1 1 1 1 3 - - - 0 2 - 0Pacific Northwest 4 4 4 4 4 4 3 4 4 4 3 4South 9 10 9 18 12 11 5 8 7 13 7 8Southeast 16 11 17 12 17 14 18 13 16 16 17 15Upper Midwest 4 4 4 2 4 6 5 4 3 4 5 3Unknown - - - - - - - - - - - -
ModeTotal Answering (1200) (301) (876) (89) (251) (121) (190) (212) (301) (340) (311) (513)Web 54 44 57 27 50 47 44 55 71 44 45 64Landline 10 7 11 16 11 15 9 11 4 13 11 7Wireless 37 49 32 57 38 38 47 34 25 43 43 29
TargetSmart Communications 1155 15th St, NW, Suite 750, Washington, DC 20005 targetsmart.com
224 of 228
Page 225
May 21-27, 2020
National Voter Insights Study
TargetSmart + Dynata
Gender/Age Gender/Education Age/Education
TotalYoun
ger MenOlder Men
Youn ger
WomenOlder
WomenNon Coll
MenColl Men
Non Coll Women
Coll Women
Youn ger Non
CollOlder
Non Coll
Youn ger Coll
egeOlder Coll
Party ID Difference...2-3-2 PARTY ID Dem-Rep 4 7 -15 21 6 -9 -2 7 19 6 -4 22 -53-1-3 PARTY ID Dem-Rep 7 12 -19 28 8 -12 1 10 26 8 -7 31 -3
UrbanicityTotal Answering (1200) (256) (301) (312) (304) (262) (307) (318) (304) (252) (316) (312) (285)R1 15 14 15 13 18 16 13 20 10 17 19 10 13R2 15 13 21 13 15 20 15 15 12 16 20 11 16S3 16 16 16 15 19 16 16 17 16 15 18 15 17S4 23 27 21 24 20 23 25 21 22 24 19 25 22U5 22 24 18 24 21 18 23 20 27 21 18 27 22U6 9 7 9 12 8 7 8 7 14 7 7 12 10Rural 30 27 36 25 32 36 28 35 21 33 39 21 29Suburban 39 42 37 39 39 39 41 38 38 39 37 41 39Urban 31 31 28 36 29 25 32 27 41 28 24 39 33
Region by StateTotal Answering (1200) (256) (301) (312) (304) (262) (307) (318) (304) (252) (316) (312) (285)Border States 11 12 10 13 9 13 9 11 12 14 10 12 10California 10 11 9 8 11 6 14 10 10 9 7 9 14Industrial Midwest 13 16 15 11 11 13 17 11 11 10 14 17 12Lower Midwest 5 4 4 5 7 4 4 6 5 5 6 5 5Mid-Atlantic 13 10 14 15 14 17 8 12 17 12 16 14 11Mountain States 4 4 4 6 2 3 4 5 4 7 2 4 4National Capital 5 3 5 6 5 3 5 4 7 6 3 4 8New England 5 6 5 5 5 6 5 4 5 6 4 4 6Non-Mainland 1 0 1 - 1 0 1 1 0 0 1 - 1Pacific Northwest 4 5 5 4 2 5 5 2 4 4 3 4 4South 9 8 7 10 11 8 7 15 6 10 13 8 5Southeast 16 15 17 14 19 17 15 16 16 15 18 14 17Upper Midwest 4 5 5 3 3 5 6 3 3 4 4 4 4Unknown - - - - - - - - - - - - -
ModeTotal Answering (1200) (256) (301) (312) (304) (262) (307) (318) (304) (252) (316) (312) (285)Web 54 47 59 63 49 54 51 57 53 57 56 55 52Landline 10 5 10 3 19 6 9 14 9 5 15 3 15Wireless 37 48 31 33 32 40 40 29 38 38 29 42 34
TargetSmart Communications 1155 15th St, NW, Suite 750, Washington, DC 20005 targetsmart.com
225 of 228
Page 226
May 21-27, 2020
National Voter Insights Study
TargetSmart + Dynata
Marital Status/Gender Marital Status/Kids Trump Job Approval
Voting Permissions by State
Total
Marr ied
Men
Marr ied
WomenUnmarr ied Men
Unmarr ied
Women
Marr ied
with kids
Marr ied with out kids
Unmarr ied with
kids
Unmarr ied with out kids
Total appr ove
Total disapp rove All mail
Open early / mail Closed
Party ID Difference...2-3-2 PARTY ID Dem-Rep 4 -17 -5 9 30 -4 -15 19 22 -50 50 -9 4 83-1-3 PARTY ID Dem-Rep 7 -22 -4 16 39 -2 -19 22 31 -65 67 -5 9 8
UrbanicityTotal Answering (1200) (312) (306) (247) (313) (216) (400) (83) (471) (528) (626) (111) (605) (484)R1 15 18 19 11 11 15 20 16 10 20 10 9 13 18R2 15 20 14 13 13 18 17 13 13 20 12 18 14 16S3 16 15 18 17 16 17 16 22 15 18 14 15 14 19S4 23 23 21 25 22 23 21 13 25 20 25 27 25 20U5 22 17 21 26 26 18 19 22 27 17 26 31 24 18U6 9 8 7 8 13 9 7 15 10 5 12 - 10 10Rural 30 38 33 24 24 33 37 29 23 40 22 26 27 34Suburban 39 38 40 41 37 41 37 35 39 38 40 42 39 38Urban 31 25 28 34 39 27 26 36 37 22 38 31 34 27
Region by StateTotal Answering (1200) (312) (306) (247) (313) (216) (400) (83) (471) (528) (626) (111) (605) (484)Border States 11 12 11 10 12 15 10 11 11 12 10 23 2 19California 10 12 10 8 10 9 12 12 9 8 11 - 20 -Industrial Midwest 13 14 11 18 11 15 11 16 13 16 12 - 21 6Lower Midwest 5 4 7 5 5 4 6 3 5 5 5 - 6 5Mid-Atlantic 13 11 11 13 17 11 11 18 15 11 15 - 6 25Mountain States 4 5 5 3 3 4 5 4 3 4 4 26 3 -National Capital 5 5 6 3 6 6 6 6 4 4 6 - 3 9New England 5 4 5 7 4 5 5 3 6 4 6 - 3 9Non-Mainland 1 1 1 - 1 1 1 - 0 1 0 7 - -Pacific Northwest 4 6 3 4 3 6 4 1 4 4 4 43 - -South 9 8 9 7 11 8 9 14 8 12 7 - - 22Southeast 16 14 17 17 16 12 17 10 18 15 17 - 28 4Upper Midwest 4 5 4 5 2 4 5 3 4 5 4 1 8 -Unknown - - - - - - - - - - - - - -
ModeTotal Answering (1200) (312) (306) (247) (313) (216) (400) (83) (471) (528) (626) (111) (605) (484)Web 54 53 51 53 59 42 57 50 57 55 54 43 54 56Landline 10 8 13 7 10 7 13 6 9 12 8 12 10 9Wireless 37 39 36 41 32 51 30 44 34 33 38 46 36 36
TargetSmart Communications 1155 15th St, NW, Suite 750, Washington, DC 20005 targetsmart.com
226 of 228
Page 227
May 21-27, 2020
National Voter Insights Study
TargetSmart + Dynata
Permanent Absentee Voter
Status
Ever Voted Early or By Mail
First Time Voters in 2018 2016 Vote History TargetSmart Voter Score
Total PAVNot PAV Yes No Yes No Voted
Did not Vote
Was Not
Regist ered
Super Voter
Freq uent Voter
Infreq uent Voter
Never Voted
Party ID Difference...2-3-2 PARTY ID Dem-Rep 4 16 3 1 5 4 5 2 4 17 0 1 9 73-1-3 PARTY ID Dem-Rep 7 22 5 0 9 9 7 2 8 26 -4 5 13 14
UrbanicityTotal Answering (1200) (130) (1070) (220) (980) (176) (1024) (757) (266) (177) (221) (393) (393) (137)R1 15 8 16 15 15 13 15 16 15 11 16 15 15 12R2 15 6 16 16 15 14 15 17 14 10 17 17 13 13S3 16 12 17 19 16 17 16 17 14 16 15 18 16 18S4 23 24 23 23 23 24 23 21 22 30 23 23 23 25U5 22 32 21 24 22 26 21 20 26 25 20 19 23 27U6 9 18 8 3 10 6 10 9 11 8 9 9 10 6Rural 30 14 32 31 30 27 31 33 28 21 33 32 28 25Suburban 39 36 39 41 39 41 39 38 36 46 38 40 38 43Urban 31 50 29 27 32 32 31 29 36 33 29 28 34 33
Region by StateTotal Answering (1200) (130) (1070) (220) (980) (176) (1024) (757) (266) (177) (221) (393) (393) (137)Border States 11 17 10 36 5 18 10 9 12 17 6 10 12 21California 10 69 3 1 12 14 9 9 7 20 14 8 8 15Industrial Midwest 13 7 14 2 16 18 12 12 20 6 13 13 12 19Lower Midwest 5 - 6 2 6 6 5 5 4 6 4 4 5 7Mid-Atlantic 13 2 15 1 16 11 14 13 17 10 12 14 14 11Mountain States 4 4 4 7 3 3 4 4 5 2 4 3 5 3National Capital 5 - 6 2 6 1 6 5 4 8 7 4 7 -New England 5 - 6 - 6 7 5 5 6 6 4 6 4 7Non-Mainland 1 - 1 2 1 1 1 1 1 - 1 1 0 1Pacific Northwest 4 1 4 0 5 2 4 5 3 1 6 5 3 2South 9 - 10 9 9 3 10 10 7 7 9 12 9 4Southeast 16 - 18 37 12 15 16 18 12 16 18 17 15 11Upper Midwest 4 1 4 2 5 2 4 5 3 2 3 5 4 1Unknown - - - - - - - - - - - - - -
ModeTotal Answering (1200) (130) (1070) (220) (980) (176) (1024) (757) (266) (177) (221) (393) (393) (137)Web 54 49 54 56 53 63 52 49 69 53 54 46 55 52Landline 10 8 10 10 10 6 10 12 5 6 16 11 7 8Wireless 37 43 36 34 37 31 38 39 26 41 29 44 38 40
TargetSmart Communications 1155 15th St, NW, Suite 750, Washington, DC 20005 targetsmart.com
227 of 228
Page 228
May 21-27, 2020
National Voter Insights Study
TargetSmart + Dynata
Partisan Score Presidential General Turnout Score Mode
Total 0 to 9.9 10 to 89.9 90+ 0 to 69.9 70+ Web Land line Wire less
Party ID Difference...2-3-2 PARTY ID Dem-Rep 4 -48 -4 53 4 5 3 -3 83-1-3 PARTY ID Dem-Rep 7 -55 -1 62 10 5 4 -6 15
UrbanicityTotal Answering (1200) (302) (491) (408) (429) (771) (644) (116) (440)R1 15 24 17 6 15 15 16 27 11R2 15 23 16 8 13 16 14 20 15S3 16 16 18 14 16 16 15 15 18S4 23 18 25 24 20 24 23 13 25U5 22 16 19 30 27 20 23 17 23U6 9 3 5 19 10 9 9 9 9Rural 30 47 33 14 27 32 30 47 25Suburban 39 34 44 37 37 40 38 27 43Urban 31 19 23 49 36 28 32 26 31
Region by StateTotal Answering (1200) (302) (491) (408) (429) (771) (644) (116) (440)Border States 11 12 11 10 14 10 11 7 12California 10 9 7 15 8 11 9 8 13Industrial Midwest 13 9 18 10 15 12 13 13 13Lower Midwest 5 7 5 4 5 5 5 6 5Mid-Atlantic 13 14 11 16 15 12 15 15 11Mountain States 4 3 5 4 4 4 3 5 5National Capital 5 5 4 6 4 5 6 5 4New England 5 3 6 6 6 4 6 2 4Non-Mainland 1 1 1 0 1 1 1 - 0Pacific Northwest 4 4 4 4 3 5 2 6 6South 9 10 10 7 7 10 9 8 10Southeast 16 21 12 18 13 18 18 18 13Upper Midwest 4 2 8 1 5 3 4 6 4Unknown - - - - - - - - -
ModeTotal Answering (1200) (302) (491) (408) (429) (771) (644) (116) (440)Web 54 55 57 49 61 50 100 - -Landline 10 12 8 11 8 11 - 100 -Wireless 37 34 35 41 31 40 - - 100
TargetSmart Communications 1155 15th St, NW, Suite 750, Washington, DC 20005 targetsmart.com
228 of 228