A STUDY ON SERVICE QUALITY IN RELIANCE FRESH ROYAPETTAH BRANCH CHENNAI PROJECT REPORT Submitted by KRISHNARAJ .A Register No: 13MBA050 Under the Guidance of Mr. R. RAMESH B.E., MBA. Assistant Professor, Department of Management Studies In partial fulfillment for the award of the degree Of MASTER OF BUSINESS ADMINISTRATION DEPARTMENT OF MANAGEMENT STUDIES SRI MANAKULA VINAYAGAR ENGINEERING COLLEGE PUDUCHERRY UNIVERSITY PUDUCHERRY JULY – 2014
Transcript
A STUDY ON SERVICE QUALITY IN RELIANCE FRESH
ROYAPETTAH BRANCH CHENNAI
PROJECT REPORT
Submitted by
KRISHNARAJ .A
Register No: 13MBA050
Under the Guidance of
Mr. R. RAMESH B.E., MBA.
Assistant Professor, Department of Management Studies
In partial fulfillment for the award of the degree
Of
MASTER OF BUSINESS ADMINISTRATION
DEPARTMENT OF MANAGEMENT STUDIES
SRI MANAKULA VINAYAGAR ENGINEERING COLLEGE
PUDUCHERRY UNIVERSITY
PUDUCHERRY
JULY – 2014
SRI MANAKULA VINAYAGAR ENGINEERING COLLEGE
MADAGADIPET, PUDUCHERRY
DEPARTMENT OF MANAGEMENT STUDIES
BONAFIDE CERTIFICATE
This is to certify that the project work entitled “A STUDY ON SERVICE QUALITY
IN RELIANCE FRESH RETAIL LTD., ROYAPETTAH BRANCH CHENNAI” is a
bonafide work done A.KRISHNARAJ [REGISTER NUMBER: 13MBA050] in partial
fulfillment of the requirement for the award of the degree of Master of Business Administration
by Pondicherry University, during the academic year 2013-2014.
INTERNAL GUIDE HEAD OF THE DEPARTMENT
Submitted for Viva -Voice Examination held on___________________
EXTERNAL EXAMINER
1.
2.
ACKNOWLEDGEMENT
In connection with this endeavour I would like to record my gratitude to many people
surrounding me for this encouragement affirmation and guidance.
I express my profound thanks and gratitude to SHRI. M. DHANASEKARAN,
Chairman and Managing Director, SHRI. S.V. SUGUMARAN, Vice Chairman of Sri Manakula
Vinayagar Engineering College Puducherry.
I would like to thank Dr. V.S.K. VENKATACHALAPATHY, Director cum Principal,
Sri Manakula Vinayagar Engineering College Puducherry, for given me the opportunity to do
this project.
I would like to thank with gratitude my sincere thanks to Mr.N.S.N. CAILASSAME,
Associate Professor, Department of Management Studies, for his encouragement, support and
guidance to complete this project successfully.
I take the privilege to extend my hearty thanks to Mr. R. RAMESH, Assistant Professor,
Department of Management Studies, Sri Manakula Vinayagar Engineering College, my internal
guide for his dedicated support and encouragement to complete this project.
At the outset, I take the privilege to extend my sincere gratitude and hearty thanks to the
Mr. SHIRAJ HUSSAIN, Marketing Manager in reliance retail Chennai for giving to do the
project and also support for my study.
ABSTRACT
The Retail is the process of selling consumer goods and services to customers through
multiple channels of distribution to earn a profit. Demand is created through diverse target
markets and promotional tactics, satisfying consumer wants and needs through a lean supply
chain.
This project is entitled “A study on service quality in Reliance fresh Royapettah Chennai
“This study conducted with customer of reliance fresh store out of an unlimited population. The
samples are selected on the basis of convenience sampling the questionnaire is used for
collecting the date. The data analysis is carried out the percentage, T-test, ANOVA and
weighted average tools in SPSS.
From the findings, it was discovered that customer are satisfied towards service quality
of the store the recommendation have been also offered for the retailer to make repeated
shopping, quality service and trustworthy
CONTENTS
TABLE OF CONTENTS
CHAPTER
TITLE PAGE NO.
I INTRODUCTION AND RESEARCH DESIGN 1-10
II REVIEW OF LITERATURE 11-13
III CONCEPTUAL FRAMEWORK OF THE INDUSTRY 14-25
IV DATA ANALYSIS AND INTERPRETATION 26-100
V FINDINGS, SUGGESTION AND CONCLUSION 101-106
ANNEXURE - I BIBLIOGRAPHY 107
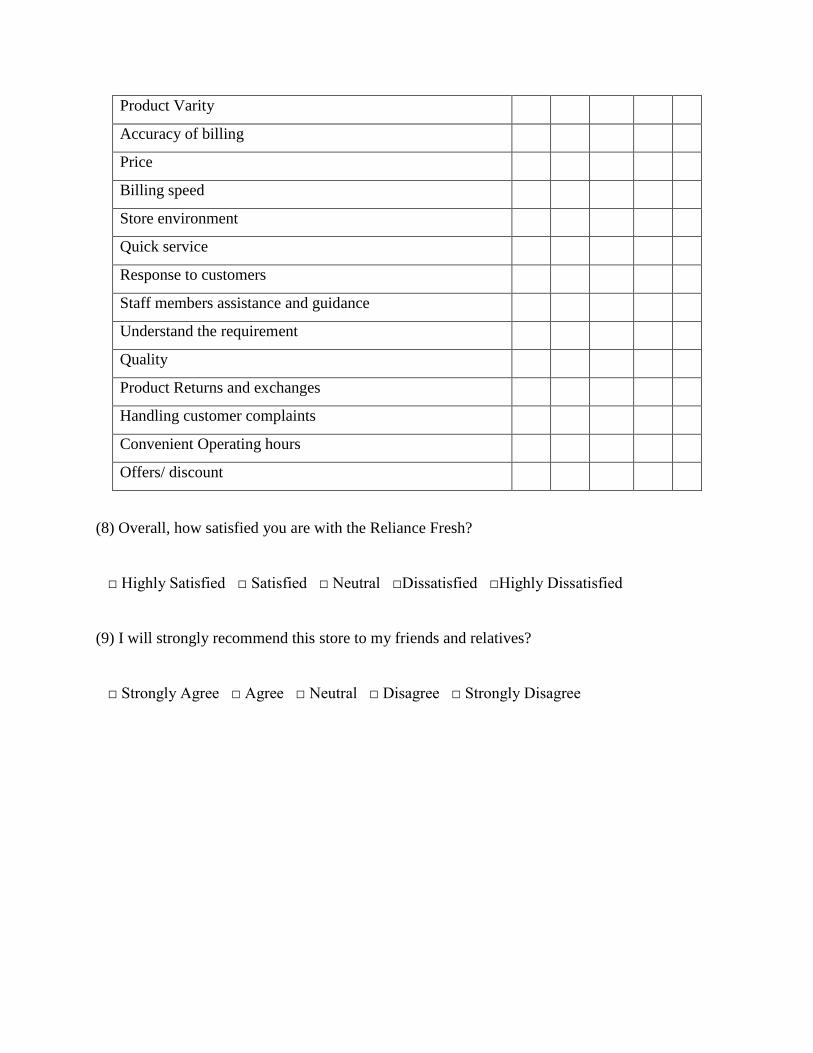
ANNEXURE - II QUESTIONNAIRE 107-110
LIST OF TABLES
TABLE
NO. TITLE
PAGE
NO.
3.1
Table showing Global Top Five Retailers 19
3.2 Table showing Name of reliance directors 22
4.1 Table showing the classification of the respondents based on their gender
26
4.2 Table showing the classification of the respondents based on their age 27
4.3 Table showing the classification of the respondents based on their qualification 28
4.4 Table showing the classification of the respondents based on their annual
income 29
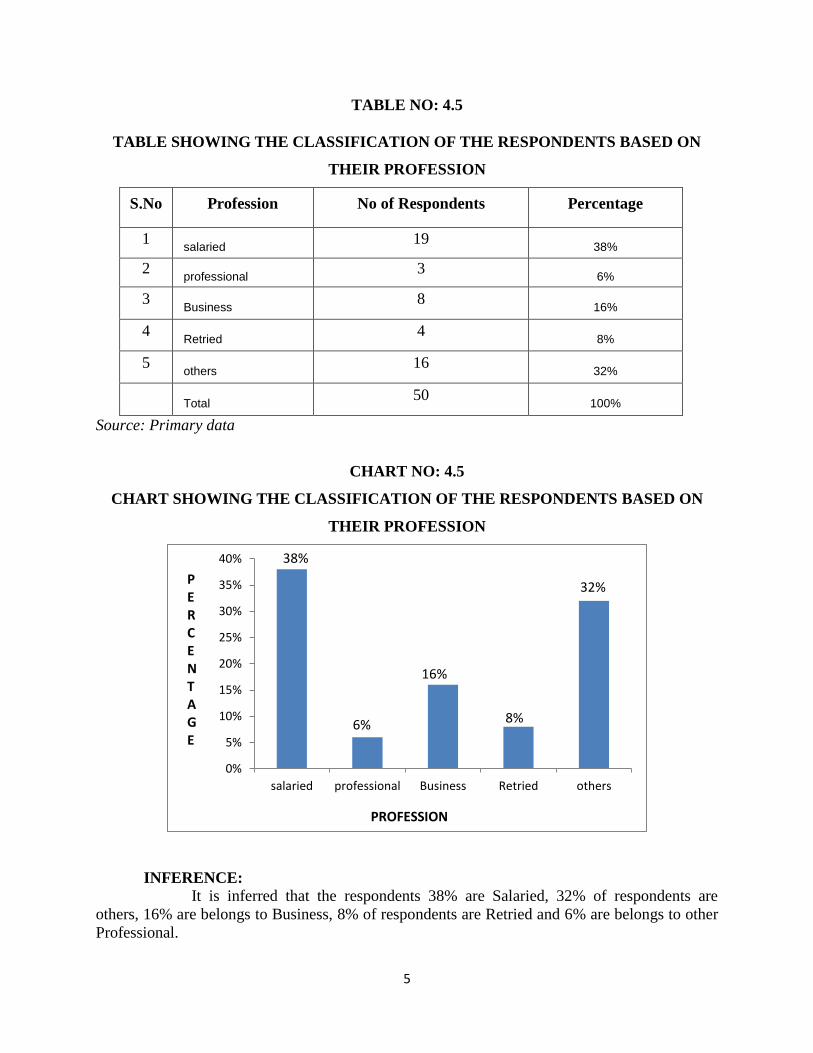
4.5 Table showing the classification of the respondents based on their profession 30
4.6 Table showing the classification of the respondents based on store clean
31
4.7 Table showing the classification of the respondents based on carry bag in
stores 32
4.8 Table showing the classification of the respondents based on sufficient place in
store 33
4.9 Table showing the classification of the respondents based on staff members
easy to identify 34
4.10 Table showing the classification of the respondents based on offers are
displayed 35
4.11 Table showing the classification of the respondents based on promised
delivery 36
4.12 Table showing the classification of the respondents based on staff in billing
counter 37
4.13 Table showing the classification of the respondents based on all products
available 38
4.14 Table showing the classification of the respondents based on product instantly 39
TABLE
NO. TITLE PAGE
NO.
4.15 Table showing the classification of the respondents based on handled queries
immediately 40
4.16 Table showing the classification of the respondents based on personal
belongings return immediately 41
4.17 Table showing the classification of the respondents based on individual
attention 42
4.18 Table showing the classification of the respondents based on understand
customer need 43
4.19 Table showing the classification of the respondents based on exchanging
product 44
4.20 Table showing the classification of the respondents based on promise delivery
of service 45
4.21 Table showing the classification of the respondents based on bills error less 46
4.22 Table showing the classification of the respondents based on product delivered
without damages 47
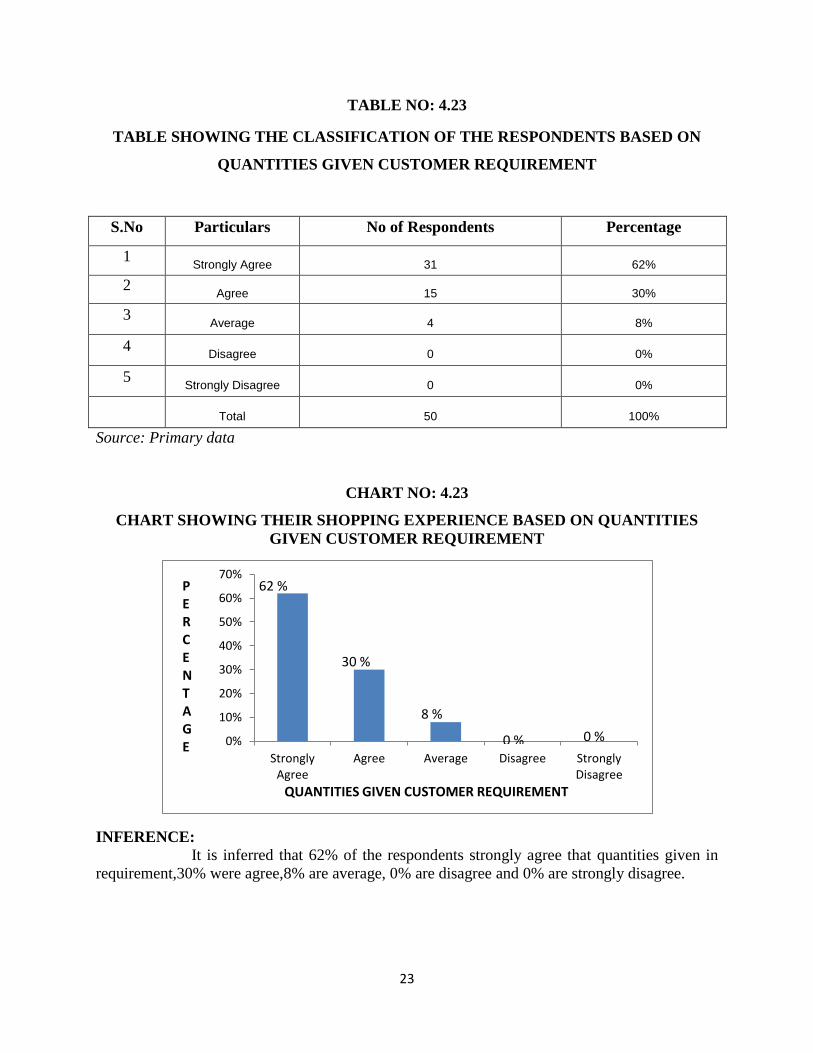
4.23 Table showing the classification of the respondents based on quantities given
customer requirement 48
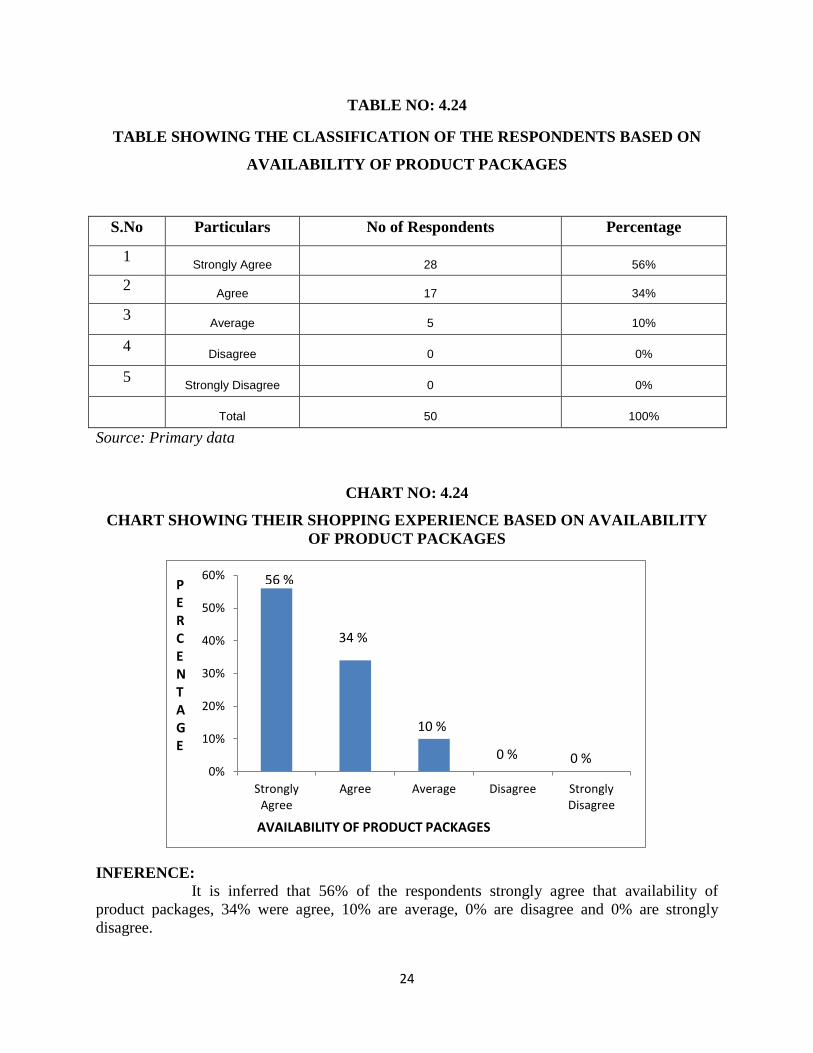
4.24 Table showing the classification of the respondents based on availability of
product packages 49
4.25 Table showing the classification of the respondents based on offers provided 50
4.26 Table showing the classification of the respondents based on allowed to take
own time to shop 51
4.27 Table showing the satisfaction level of customer towards store location 52
4.28 Table showing the satisfaction level towards availability of trolley 53
4.29 Table showing the satisfaction level of loyalty program 54
4.30 Table showing the satisfaction level of parking facilities 55
4.31 Table showing the satisfaction level towards brand name 56
TABLE
NO. TITLE
PAGE
NO.
4.32 Table showing the satisfaction level for availability of product quantity 57
4.33 Table showing the satisfaction level of product variety 58
4.34 Table showing the satisfaction level of accuracy of billing 59
4.35 Table showing the satisfaction level of product price 60
4.36 Table showing the satisfaction level of billing speed 61
4.67 Table showing the satisfaction level of store environment 62
4.38 Table showing the satisfaction level of quick service 63
4.39 Table showing the satisfaction level of response to customers 64
4.40 Table showing the satisfaction level of staff members assistance and guidance 65
4.41 Table showing the satisfaction level of understand the requirement 66
4.42 Table showing the satisfaction level of quality 67
4.43 Table showing the satisfaction level of product returns and exchanges 68
4.44 Table showing the satisfaction level of handling customer complaints 69
4.45 Table showing the satisfaction level of convenient operating hours 70
4.46 Table showing the satisfaction level of offers/discount 71
4.47 Table showing the weighted average service attributes based customer shopping
experience 72
4.48 Table showing the weighted average rate of satisfaction level of service quality 74
4.49 Table showing the weighted average of service attributes based on tangibility
76
TABLE
NO. TITLE
PAGE
NO.
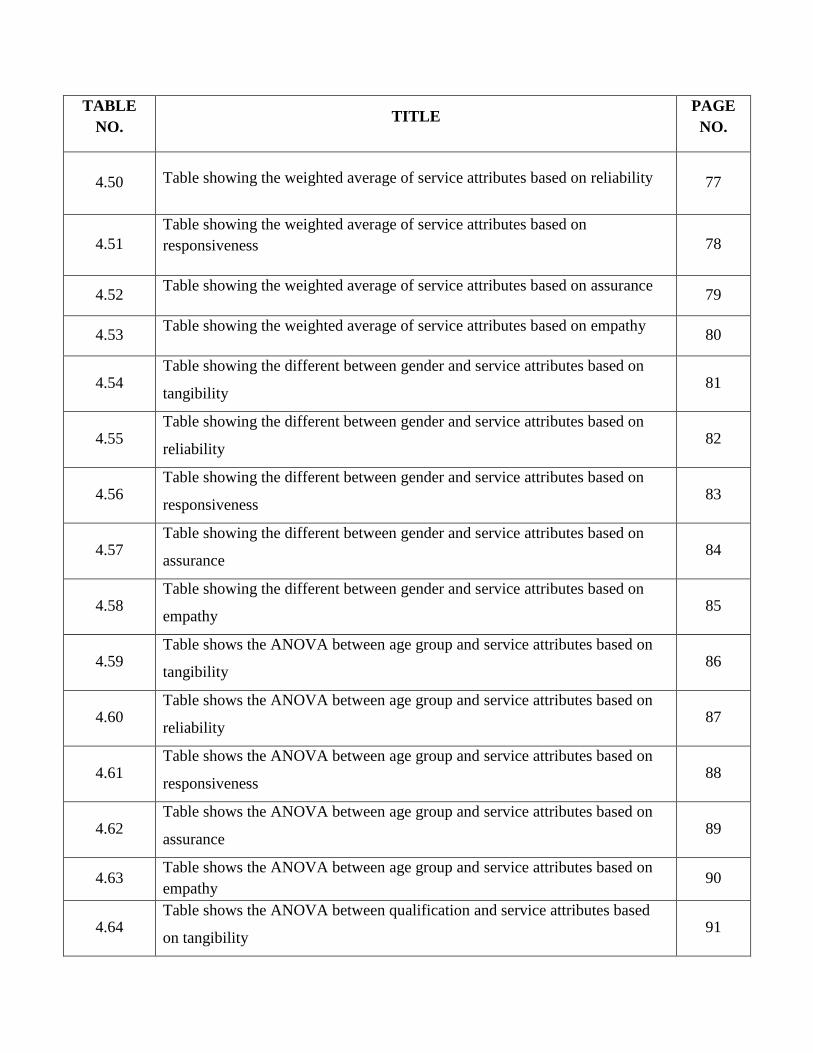
4.50 Table showing the weighted average of service attributes based on reliability
77
4.51
Table showing the weighted average of service attributes based on
responsiveness
78
4.52 Table showing the weighted average of service attributes based on assurance
79
4.53 Table showing the weighted average of service attributes based on empathy
80
4.54 Table showing the different between gender and service attributes based on
tangibility 81
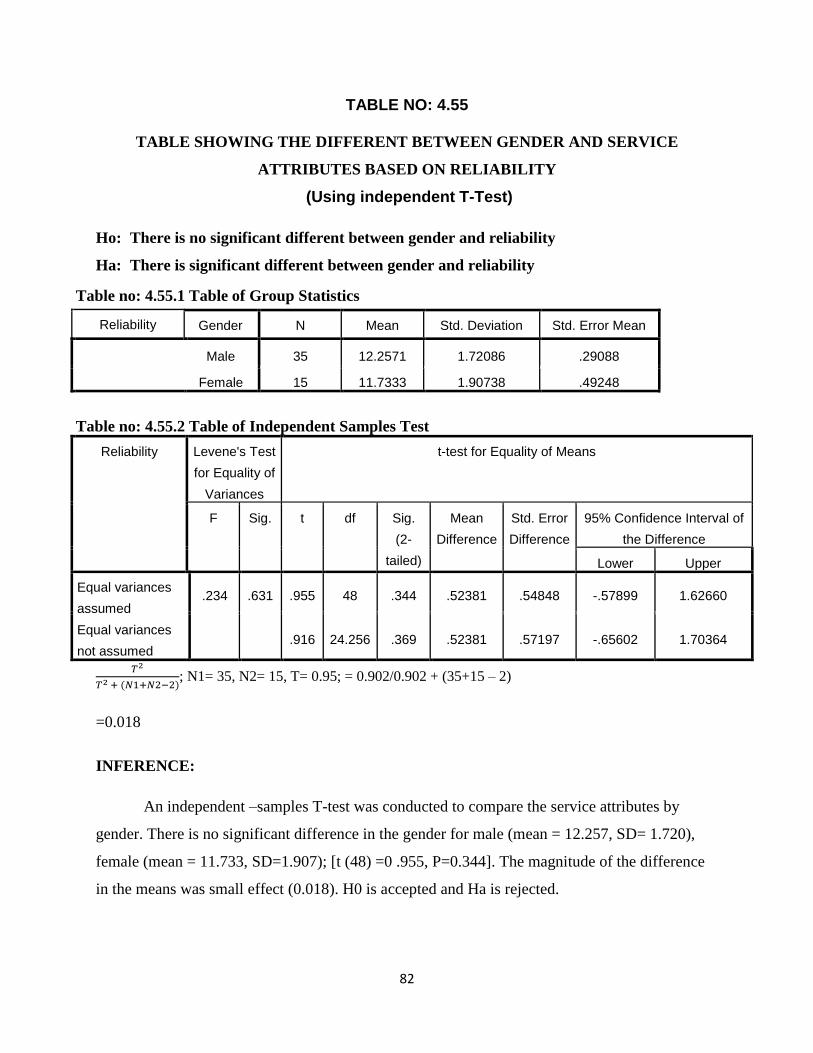
4.55 Table showing the different between gender and service attributes based on
reliability 82
4.56 Table showing the different between gender and service attributes based on
responsiveness 83
4.57 Table showing the different between gender and service attributes based on
assurance 84
4.58 Table showing the different between gender and service attributes based on
empathy 85
4.59 Table shows the ANOVA between age group and service attributes based on
tangibility 86
4.60 Table shows the ANOVA between age group and service attributes based on
reliability 87
4.61 Table shows the ANOVA between age group and service attributes based on
responsiveness 88
4.62 Table shows the ANOVA between age group and service attributes based on
assurance 89
4.63 Table shows the ANOVA between age group and service attributes based on
empathy 90
4.64 Table shows the ANOVA between qualification and service attributes based
on tangibility 91
TABLE
NO. TITLE
PAGE
NO.
4.65 Table shows the ANOVA between qualification and service attributes based
on reliability 92
4.66 Table shows the ANOVA between qualification and service attributes based
on responsiveness 93
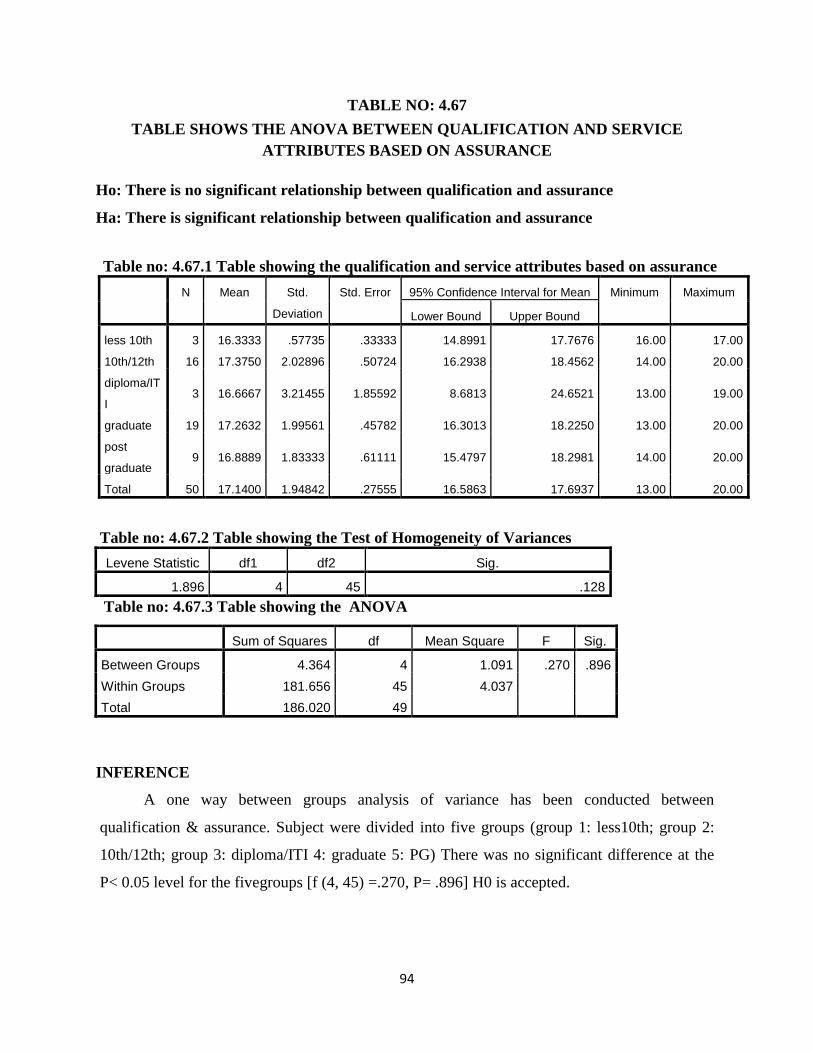
4.67 Table shows the ANOVA between qualification and service attributes based
on assurance 94
4.68 Table shows the ANOVA between qualification and service attributes based
on empathy 95
4.69 Table shows the ANOVA between income and service attributes based on
tangibility 96
4.70 Table shows the ANOVA between income and service attributes based on
reliability 97
4.71 Table shows the ANOVA between income and service attributes based on
responsiveness 98
4.72 Table shows the ANOVA between income and service attributes based on
assurance 99
4.73 Table shows the ANOVA between income and service attributes based on
empathy 100
LIST OF CHARTS
CHART
NO. TABLE NAME
PAGE
NO.
4.1 Chart showing the classification of the respondents based on their gender
26
4.2 Chart showing the classification of the respondents based on their age
27
4.3 Chart showing the classification of the respondents based on their
qualification
28
4.4 Chart showing the classification of the respondents based on their annual
income 29
4.5 Chart showing the classification of the respondents based on their
profession 30
4.6 Chart showing the classification of the respondents based on store clean 31
4.7 Chart showing the classification of the respondents based on carry bag in
stores 32
4.8 Chart showing the classification of the respondents based on sufficient
place in store 33
4.9 Chart showing the classification of the respondents based on staff members
easy to identify 34
4.10 Chart showing the classification of the respondents based on offers are
displayed 35
4.11 Chart showing the classification of the respondents based on promised
delivery 36
4.12 Chart showing the classification of the respondents based on staff in billing
counter 37
4.13 Chart showing the classification of the respondents based on all products
available 38
4.14 Chart showing the classification of the respondents based on product
instantly 39
4.15 Chart showing the classification of the respondents based on handled
queries immediately 40
4.16 Chart showing the classification of the respondents based on personal
belongings return immediately 41
CHART
NO. TABLE NAME
PAGE
NO.
4.17 Chart showing the classification of the respondents based on individual
attention 42
4.18 Chart showing the classification of the respondents based on understand
customer need 43
4.19 Chart showing the classification of the respondents based on exchanging
product 44
4.20 Chart showing the classification of the respondents based on promise
delivery of service 45
4.21 Chart showing the classification of the respondents based on bills error less 46
4.22 Chart showing the classification of the respondents based on product
delivered without damages 47
4.23 Chart showing the classification of the respondents based on quantities
given customer requirement 48
4.24 Chart showing the classification of the respondents based on availability of
product packages 49
4.25 Chart showing the classification of the respondents based on offers
provided 50
4.26 Chart showing the classification of the respondents based on allowed to
take own time to shop 51
4.27 Chart showing the satisfaction level of customer towards store location 52
4.28 Chart showing the satisfaction level towards availability of trolley 53
4.29 Chart showing the satisfaction level of loyalty program 54
4.30 Chart showing the satisfaction level of parking facilities 55
4.31 Chart showing the satisfaction level towards brand name 56
4.32 Chart showing the satisfaction level for availability of product quantity 57
4.33 Chart showing the satisfaction level of product variety 58
4.34 Chart showing the satisfaction level of accuracy of billing 59
4.35 Chart showing the satisfaction level of product price 60
CHART
NO. TABLE NAME
PAGE
NO.
4.36 Chart showing the satisfaction level of billing speed 61
4.37 Chart showing the satisfaction level of store environment 62
4.38 Chart showing the satisfaction level of quick service 63
4.39 Chart showing the satisfaction level of response to customers 64
4.40 Chart showing the satisfaction level of staff members assistance and
guidance 65
4.41 Chart showing the satisfaction level of understand the requirement 66
4.42 Chart showing the satisfaction level of quality
67
4.43 Chart showing the satisfaction level of product returns and exchanges
68
4.44 Chart showing the satisfaction level of handling customer complaints 69
4.45 Chart showing the satisfaction level of convenient operating hours 70
4.46 Chart showing the satisfaction level of offers/discount 71
H0 HYPOTHESIS PAGE NO.
H0 1 There is no significant different between gender and tangibility. 81
H0 2 There is no significant different between gender and reliability. 82
H0 3 There is no significant different between gender and responsiveness. 83
H0 4 There is no significant different between gender and assurance. 84
H0 5 There is no significant different between gender and empathy. 85
H0 6 There is no significant relationship between age group and tangibility. 86
H0 7 There is no significant relationship between age group and reliability. 87
H0 8 There is no significant relationship between age group and responsiveness. 88
H0 9 There is no significant relationship between age group and assurance. 89
H0 10 There is no significant relationship between age group and empathy. 90
H0 11 There is no significant relationship between qualification and tangibility. 91
H0 12 There is no significant relationship between qualification and reliability. 92
H0 13 There is no significant relationship between qualification and responsiveness. 93
H0 14 There is no significant relationship between qualification and assurance. 94
H0 15 There is no significant relationship between qualification and empathy. 95
H0 16 There is no significant relationship between income and tangibility. 96
H0 17 There is no significant relationship between income and reliability. 97
H0 18 There is no significant relationship between income and responsiveness. 98
H0 19 There is no significant relationship between income and assurance. 99
H0 20 There is no significant relationship between income and empathy. 100
SLIST OF FIGURES
FIG
NO. FIGURE NAME
PAGE
NO.
1.1.1 SERVQUAL Model 3
3.3.1 Reliance fresh logo 20
3.3.2 Founder of Reliance 21
LIST OF ABBREVIATION
S. No ABBREVIATION ABBREVIATION FULL FORM
1. SERVQUAL service quality model
2. SERVCON service convenience scale
3. SERPERF performance of the Service Quality
4. RSQS Retail Service Quality Scale
5. GDP Gross Domestic Product
6. GRDI global retail development index
CHAPTER I
INTRODUCTION AND
RESEARCH DESIGN
CHAPTER-1
INTRODUCTION AND RESEARCH DESIGN
1.1 INTRODUCTION
In the present day of retailing, service quality has become the basic tool for retailers to
create competitive advantage and to enhance shopping experience. The quality of services
significantly affects customer satisfaction, company revenues, cross selling and also repeat
purchase behavior. The fast pace of the Indian retail industry presents many companies with a
host of daily challenges. In today‟s competitive environment and with the growing importance of
services, delivering high quality services has become the basic retailing strategy. The present
paper studies the impact of service quality on apparel retail customer satisfaction and also
identifies the critical factors of service quality from customer‟s perspective.
SERVICE QUALITY DEFINITION:
According to Asubonteng, (1996) Parasuraman, (1985) define service quality as “The
discrepancy between consumers” perceptions of services offered by a particular firm and their
expectations about firms offering such services
SERVICE QUALITY:
„Quality‟ in a service organization is a measure of the extent to which the service
delivered meets customer‟s expectations because to the customer, quality is all about Meeting or
exceeding their expectation. The National quality institute web site defined quality as follows:
Quality is in the eye of the beholder. Yet we all recognize it when we See it Quality is when you
are so satisfied with a product or service That you go out of your way to recommend it to other
people” There is a tendency to think of quality as being upscale, first class and expensive. In fact,
quality can be achieved at all price levels – if the need and desires of the customers are met, and
exceeded. The nature of most services is such that the customer is present in the delivery process.
This means that the perception of quality is influenced not only by the service outcome but also
by the service processes. Reliance fresh is a store, which provides services to the customers. In
this project it is estimated that to what extent the quality service is by reliance fresh and what
role does the marketers play in delivering high quality goods and services to get the target
customers.
Service quality if defined generally:
1) TANGIBLES:
The appearance of physical facilities equipment, appearance of personnel and
communication material.
2) RELIABILITY:
The ability to perform the promised service dependably and accurately.
3) RESPONSIVENESS:
To willingness to help customer and provide prompt service.
4) ASSURANCE:
The knowledge and courtesy of employees and their ability to inspire trust and
confidence.
5) EMAPATHY:
The individualized attention to customers and power of entering into another‟s
personality and imaginatively experiencing his feelings.
GAPS MODELS OF SERVICE QUALITY:
Gap1: Expected service.
Gap2: company perception of consumer expectations.
Gap3: customer driven service designs and standards.
Gap4: External communication to customers.
Customer service is the provision of services to customers before, during and after a
purchase. According to Turban “Customer service is a series of activities designed to enhance
the level of customer satisfaction – that is, the feeling that a product or service has met the
customer expectation."
A multi-task position drawing on extensive CUSTOMER SERVICE experience to
advance a proven track record for developing and maintaining key accounts and improving
departmental efficiencies.
Figure: 1.1.1 SERVQUAL Model
Its importance varies by product, industry and customer defective or broken merchandise
can be exchanged, often only with a receipt and within a specified time frame. Big Bazaar will
often have a desk or counter devoted to dealing with returns, exchanges and complaints, or will
perform related functions at the point of sale; the perceived success of such interactions being
dependent on employees "who can adjust themselves to the personality of the guest,"
Customer service plays an important role in an organization's ability to generate income and
revenue. From that perspective, customer service should be included as part of an overall
approach to systematic improvement. A customer service experience can change the entire
perception a customer has of the organization.
1.2 OBJECTIVES OF THE STUDY
Primary objectives
To study the service quality in reliance retail.
Secondary objectives:
To identify the factors influencing service quality towards retails outlet.
To know the purchasing problems and gaps in quality faced by customers.
To find the influence of the staff members in the service quality.
To know the satisfaction level of customers towards the store.
1.3 SCOPE OF THE STUDY
This research provides me with an opportunity to understand customer. This research also
provides the feedback of customer involves in the shopping. A part from that it would provide
me a great deal of exposure to interact with the customer.
The study helps to know the factor influencing service quality towards retail.
The scope of the study service quality to measure the performance of the staff members
in the store effectively.
The study analyses the purchasing problems and gaps in service quality towards retail.
The study helps to know the satisfaction level of retail customers with respect to various
services attribute.
1.4 LIMITATION OF THE STUDY
This study is restricted to the experience of reliance fresh store only from Lloyd‟s road,
Rayapettah, Chennai region.
The time allocated to the study is limited and sometimes the respondents may be biased.
The study concluded the satisfaction level mostly based on the concentrated on services
quality.
The study concludes the attitude of the shopper different from each other‟s so,
methodology of product, availability of the products and omitted other attributes.
1.5 MAIN STUDY
1.5.1 RESEARCH METHODOLOGY
The research methodology deals with various aspects of research, it talks about the types
of research to be used, the research plans, how data can be collected either by primary or
secondary sources. It also plans what type of questionnaire to be followed and what ranking
scales to be used. The research decides about the sample frame (size), research boundary and the
various statistical tools to be used in data analysis and interpretation.
RESEARCH DESIGN
A Research design is purely and simply the framework or plan for the study that guides
the collection of the data. It is used to fulfill the research objective and answering questions. “A
research design is the arrangement of conditions for collection and analysis of data in a matter
that aims to combine relevance to the research purpose with economy in procedure”.
DESCRIPTIVE RESEARCH DESIGN
Research design followed in this study is descriptive study. Descriptive research, also
known as statistical research, describes data and characteristics about the population being
studied. Descriptive research answer the question who, what, where, when and how. Descriptive
study is undertaken to ascertain and be able to describe the characteristics of the variables of
interest in a situation. Quite frequently, describe studies are undertaken in organizations to learn
about and describe the characteristic of a group of employees.
RESEARCH PROBLEM
A research problem in general refers to some difficulty which a researcher experience in
the context of both a theoretical (or) practical situation and wants to obtain a solution. A research
problem is one which requires a researcher to find out the best solution for the given problem i.e.
to find out by which course of action the objective can be attained optionally in the context of a
given environment. There are several factors which may result in making the problem
complicated.
1.5.2 RESEARCH HYPOTHESIS
HYPOTHESIS:
H0 1: There is no significant relationship between gender and tangibility.
H0 2: There is no significant relationship between gender and reliability.
H0 3: There is no significant relationship between gender and responsiveness.
H0 4: There is no significant relationship between gender and assurance.
H0 5: There is no significant relationship between gender and empathy.
H0 6: There is no significant relationship between age group and tangibility.
H0 7: There is no significant relationship between age group and reliability.
H0 8: There is no significant relationship between age group and responsiveness.
H0 9: There is no significant relationship between age group and assurance.
H0 10: There is no significant relationship between age group and empathy.
H0 11: There is no significant relationship between qualification and tangibility.
H0 12: There is no significant relationship between qualification and reliability.
H0 13: There is no significant relationship between qualification and responsiveness.
H0 14: There is no significant relationship between qualification and assurance.
H0 15: There is no significant relationship between qualification and empathy.
H0 16: There is no significant relationship between income and tangibility.
H0 17: There is no significant relationship between income and reliability.
H0 18: There is no significant relationship between income and responsiveness.
H0 19: There is no significant relationship between income and assurance.
H0 20: There is no significant relationship between income and empathy.
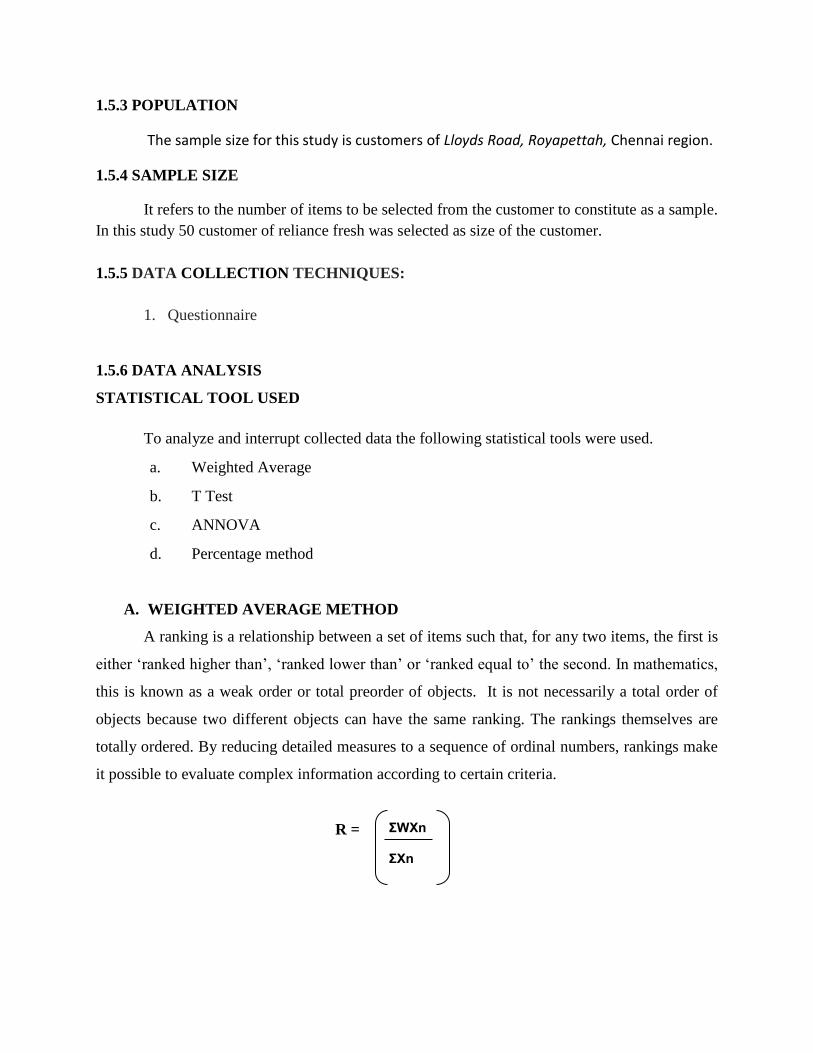
1.5.3 POPULATION
The sample size for this study is customers of Lloyds Road, Royapettah, Chennai region.
1.5.4 SAMPLE SIZE
It refers to the number of items to be selected from the customer to constitute as a sample.
In this study 50 customer of reliance fresh was selected as size of the customer.
1.5.5 DATA COLLECTION TECHNIQUES:
1. Questionnaire
1.5.6 DATA ANALYSIS
STATISTICAL TOOL USED
To analyze and interrupt collected data the following statistical tools were used.
a. Weighted Average
b. T Test
c. ANNOVA
d. Percentage method
A. WEIGHTED AVERAGE METHOD
A ranking is a relationship between a set of items such that, for any two items, the first is
either „ranked higher than‟, „ranked lower than‟ or „ranked equal to‟ the second. In mathematics,
this is known as a weak order or total preorder of objects. It is not necessarily a total order of
objects because two different objects can have the same ranking. The rankings themselves are
totally ordered. By reducing detailed measures to a sequence of ordinal numbers, rankings make
it possible to evaluate complex information according to certain criteria.
R =
ΣWXn
ΣXn
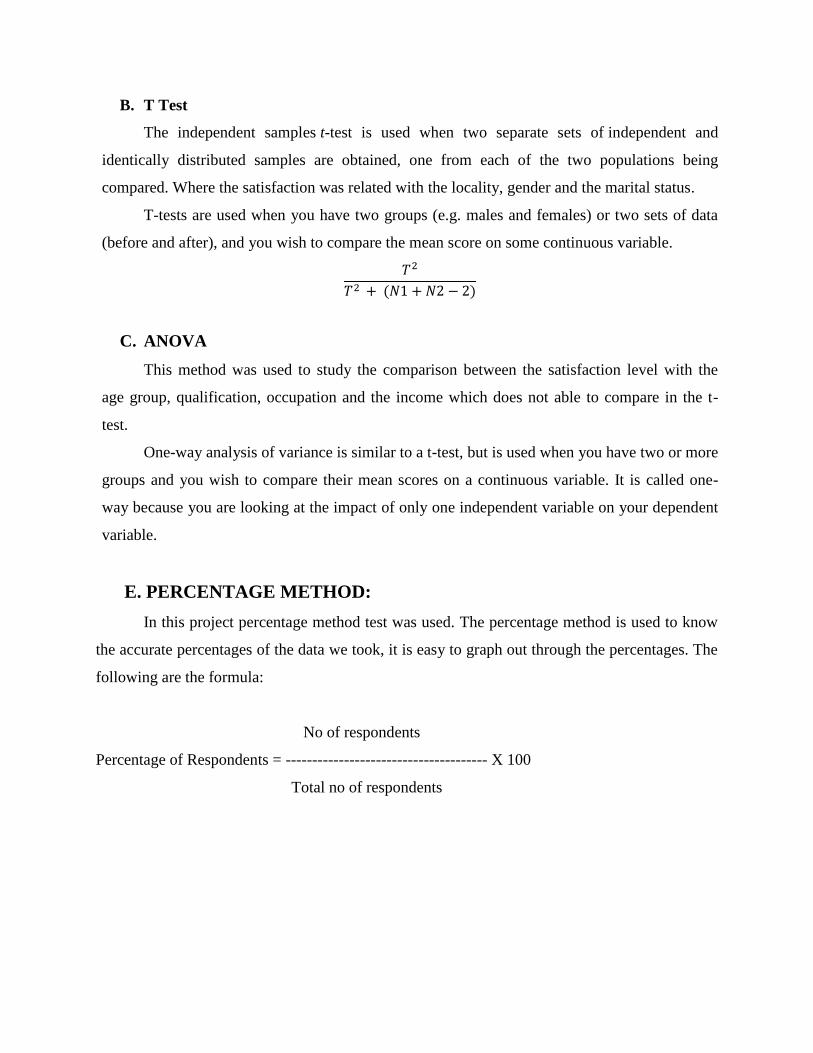
B. T Test
The independent samples t-test is used when two separate sets of independent and
identically distributed samples are obtained, one from each of the two populations being
compared. Where the satisfaction was related with the locality, gender and the marital status.
T-tests are used when you have two groups (e.g. males and females) or two sets of data
(before and after), and you wish to compare the mean score on some continuous variable.
C. ANOVA
This method was used to study the comparison between the satisfaction level with the
age group, qualification, occupation and the income which does not able to compare in the t-
test.
One-way analysis of variance is similar to a t-test, but is used when you have two or more
groups and you wish to compare their mean scores on a continuous variable. It is called one-
way because you are looking at the impact of only one independent variable on your dependent
variable.
E. PERCENTAGE METHOD:
In this project percentage method test was used. The percentage method is used to know
the accurate percentages of the data we took, it is easy to graph out through the percentages. The
following are the formula:
No of respondents
Percentage of Respondents = -------------------------------------- X 100
Total no of respondents
CHAPTER II
REVIEW OF
LITERATURE
CHAPTER- II
REVIEW OF LITERATURE
SERVICE QUALITY AT RETAIL STORES - CUSTOMERS’ PERCEPTION by
P. Praba Devi and R. Sellappan 2009 from the research it refers that The
performance of the retailing sector for the past few years is outstanding and witnesses a
huge revamping exercise, significantly contributed by the growth of the organized
retailing. The retail environment today is changing more rapidly than ever before
(Dabholkar, 1996). It is characterized by intensifying competition from both domestic
and foreign companies, a spate of mergers and acquisition, and more sophisticated and
demanding customers who have great expectations related to their consumption
experiences (Sellers, 1990; Smith, 1989). There is a general agreement that a basic
retailing strategy for creating competitive advantage is the delivery of high service
quality (Berry, 1986; Hummel and Savitt, 1988; Reichheld and Sasser, 1990). Retail
literature suggests that store appearance is important to retail customers (Baker, Dhruv
and Parasuraman, 1994). It also suggest that the customer value the convenience of
shopping that physical aspects such as store layout offer (Gutman and
Alden,1985;Hummel and Savitt, 1988; Mazursky and Jacoby,1985; Oliver,1981)
Westbrook (1981) found that the availability of merchandise is also a measure of
reliability. Customers also value parking availability for retail shopping (Oliver, 1981).
Studies have also shown that the customers are sensitive to recognizing and solving the
customer problems. Service quality in retailing is different from any other product or
service environment (Finn and Lamb, 1991).
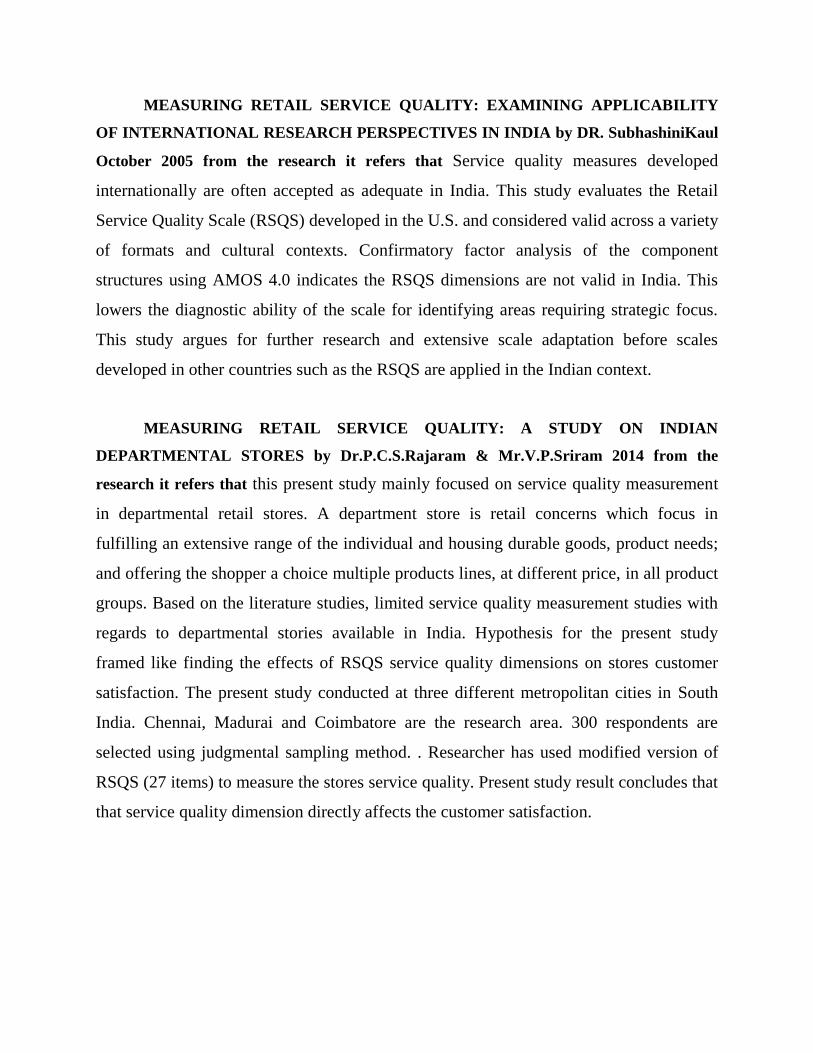
MEASURING RETAIL SERVICE QUALITY: EXAMINING APPLICABILITY
OF INTERNATIONAL RESEARCH PERSPECTIVES IN INDIA by DR. SubhashiniKaul
October 2005 from the research it refers that Service quality measures developed
internationally are often accepted as adequate in India. This study evaluates the Retail
Service Quality Scale (RSQS) developed in the U.S. and considered valid across a variety
of formats and cultural contexts. Confirmatory factor analysis of the component
structures using AMOS 4.0 indicates the RSQS dimensions are not valid in India. This
lowers the diagnostic ability of the scale for identifying areas requiring strategic focus.
This study argues for further research and extensive scale adaptation before scales
developed in other countries such as the RSQS are applied in the Indian context.
MEASURING RETAIL SERVICE QUALITY: A STUDY ON INDIAN
DEPARTMENTAL STORES by Dr.P.C.S.Rajaram & Mr.V.P.Sriram 2014 from the
research it refers that this present study mainly focused on service quality measurement
in departmental retail stores. A department store is retail concerns which focus in
fulfilling an extensive range of the individual and housing durable goods, product needs;
and offering the shopper a choice multiple products lines, at different price, in all product
groups. Based on the literature studies, limited service quality measurement studies with
regards to departmental stories available in India. Hypothesis for the present study
framed like finding the effects of RSQS service quality dimensions on stores customer
satisfaction. The present study conducted at three different metropolitan cities in South
India. Chennai, Madurai and Coimbatore are the research area. 300 respondents are
selected using judgmental sampling method. . Researcher has used modified version of
RSQS (27 items) to measure the stores service quality. Present study result concludes that
that service quality dimension directly affects the customer satisfaction.
ANALYTICAL STUDY ON RETAIL SERVICE QUALITY OF ORGANIZED
RETAIL SECTOR IN TRICHY by C. Thirumal Azhagan Dr. P. S. Nagarajan July – Dec
2011 from the research it refers that Customer service assumes vital importance in the
marketing programs of all modern organizations, specifically service organizations. The retail
sector comes under service industry and the main focus is on the efficient and effective delivery
of services to the customers. The most important factors in the retail sectors are, quality of the
product delivered and customer satisfaction. The best way of surviving and prospering in the
competitive environment is through providing prompt, relevant and efficient customer services at
measurable cost with comfortable environment.
A CHRONOLOGICAL STUDY OF SERVICE QUALITY RESEARCH ON
RETAIL SECTOR By Sanjeev Kr. Singh from the research it refers that Researchers and
academician in the area of services around the world have been using various tools and
techniques to measure service quality, as a result have been successful in developing scales like
SERVQUAL, SERPERF, SERVCON, RSQS etc. These scales are extensively used for
measuring service quality in different service sectors in different geographical locations. It has
been observed that the applicability of these scales has many limitations or is to be used with
appropriate modifications in each circumstances depending on the type of services for which it is
to be used. This paper is thus an attempt to bring together all such research instruments, scales,
tools & techniques, so as to help future researchers in comparing the same and selecting the one
which is more close to their usage. The paper also tries to summaries the dimensions and
attributes used by authors for different service businesses. The methodology used is simple
comparison method between various studies conducted on service quality issue, using published
research papers from different sources like online databases example- Ebsco & Emerald, and
physical journals from libraries. This paper is unique as it is for the first time such
comprehensive study is done on service quality measurement.
CHAPTER III
CONCEPTUAL
FRAMEWORK OF THE
INDUSTRY
CHAPTER: III
CONCEPTUAL FRAMEWORK OF INDUSTRY
3.1 SERVICE INDUSTRY:
Every economy consists of three sectors. They are primary sector (extraction such as
mining, agriculture and fishing), secondary sector (manufacturing) and the tertiary sector
(service sector). Economies tend to follow a developmental progression that takes them from a
heavy reliance on primary, toward the development of manufacturing and finally toward a more
service based structure. Historically, manufacturing tended to be more open to international trade
and competition than services. As a result, there has been a tendency for the first economies to
industrialize to come under competitive attack by those seeking to industrialize later. The
resultant shrinkage of manufacturing in the leading economies might explain their growing
reliance on the service sector. However, currently and prospectively, with dramatic cost
reduction and speed and reliability improvements in the transportation of people and the
communication of information, the service sector is one of the most intensive international
competition. The service sector is the most common workplace in India.
The service sector consists of the soft parts of the economy such as insurance,
government, tourism, banking, retail, education, and social services. In soft-sector employment,
people use time to deploy knowledge assets, collaboration assets, and process-engagement to
create productivity, effectiveness, performance improvement potential and sustainability. Service
industry involves the provision of services to businesses as well as final consumers. Services
may involve transport, distribution and sale of goods from producer to a consumer as may
happen in wholesaling and retailing, or may involve the provision of a service, such as in pest
control or entertainment. Goods may be transformed in the process of providing a service, as
happens in the restaurant industry or in equipment repair. However, the focus is on people
interacting with people and serving the customer rather than transforming physical goods.
Service sector in India
Service Sector in India today accounts for more than half of India's GDP. According to
data for the financial year 2006-2007, the share of services contributes to 55.1 per cent of the
GDP, whereas industry, and agriculture in shares 26.4 per cent, and 18.5 per cent respectively.
This shows the importance of service industry to the Indian economy and as service sector now
accounts for more than half the GDP marks a watershed in the evolution of the Indian economy
and takes it closer to the fundamentals of a developed economy. There was marked acceleration
in the growth of services sector in the nineties. While the share of services in India's GDP
increased by 21 per cent points in the 50 years between 1950 and 2000, nearly 40 per cent of that
increase was concentrated in the nineties. While almost all service sectors participated in this
boom, growth was fastest in communications, banking, hotels and restaurants, community
services, trade and business services. One of the reasons for the sudden growth in the services
sector in India in the nineties was the liberalization in the regulatory framework that gave rise to
innovation and higher exports from the services sector. In the current economic scenario it looks
that the boom in the services sector is here to stay as India is fast emerging as global services
hub.
RETAIL:
Reliance Footprint received the Retailer of the Year Award in the Non Apparel and
Footwear category at Asia Retail Congress 2010.
Reliance Time Out received the Retailer of the Year Award in the Leisure Category at
Asia Retail Congress 2010.
Vision Express was bestowed the 'Award 2010' for its contribution by the Netherlands
India Chamber of Commerce and Trade in 2010.
Reliance Trends received the 'Retail Marketing Campaign of the Year Award' at the Asia
Retail Congress 2010.
Reliance Trends received the 'Impactful Retail Design and Visual Merchandising of the Year
Award' at the Asia Retail Congress 2010.
Growth through Consumer Products
Reliance’s Manufacturing Division at Naroda, Ahmedabad is one of the largest and most
modern textile complexes in the world. The Company’s flagship brand VIMAL is one of the
most trusted brands of premium textiles in the country. Main growth drivers for VIMAL are
retail presence across India, innovation and focus on premium products and men’s formal
wear.RIL is distinctly known for shepherding a new era in fabrics. The flagship brand VIMAL is
one of the most trusted brands of premium textiles in the Country. With the commissioning of
new investments in design, modern weaving, state-of-the-art finishing equipment, RIL continues
to operate one of the most modern textile complexes in Asia. Major growth drivers for VIMAL
continued to be retail presence across India, constant innovation in products, cost efficiency and
improved customer service. The division continued adding clients in auto textiles and is now a
significant supplier to major automobile manufacturers in India. The division continued its
forays in the defense / police / paramilitary services by supplying specialized fabrics for their
applications.
New product initiatives included:
Fresca anti-microbial and anti-bacterial work-wear apparel fabrics
Home furnishing and auto-textiles
Silk-Amino suiting fabrics
Fire-retardant and water-repellent tent fabrics for defense/ police services
3.2 INDUSTRY PROFILE
India has been described as a notion of shopkeepers having an estimated 15 million Small
retail outlets, mostly single-store, family-owned fronts all over the country. This works out to 14
shops per 1000 people, which is one of the highest densities of shops per 1000 population all
over the world.
The unorganized sector comprising small & medium retailers who employ over 40
million people is indeed the current face of retail that is in the threshold of transformation to a
more organized form. Only 2-3 % of retailers are large -scale who have the ambition to
organized retailing to the whole of India. Only 4% of the 15 million retail outlets have floor
space in excess of 500sq.ft. The vast available untapped potential naturally has attracted majors
like Reliance, Tata‘s, Birla‘s, Godrej‘s, Mahindra‘s & ITC to foray into this sector.
More importantly, the revolution in retail forges farm to fork linkages with thousands of
farmers to procure additional outlets for retailing their produce. This necessarily entails huge
investments in supply chain logistics, cold chain, warehousing, &so on all over India‘s rural
market.
The Indian retail market, which is the fifth largest retail destination globally, according to
industry estimates is estimated to grow from the US$ 330 billion in 2007 to US$ 427 billion by
2010 and $637 billion by 2015. Simultaneously, modern retail which presently accounts for 4 per
cent of the total market is likely to increase its share to 22 per cent by 2010.
India tops the AT Kearney's annual Global Retail Development Index (GRDI) for the
third consecutive year, maintaining its position as the most attractive market for retail
investment, Continuing the robust growth of the organized retail in India, according to the Credit
Rating and Information Services of India, the industry raked in US$ 25.44 billion turnover in
2007-08 as against US$ 16.99 billion in 2006-07, a whopping growth rate of -per cent. India has
one of the largest numbers of retail outlets in the world. Of the 12 million retail outlets present in
the country, nearly 5 million sell food and related products.
Overview of Indian Retail Sector:
Retail Sector is the most booming sector in the Indian economy. Some of the biggest
players of the world are going to enter the industry soon. It is on the threshold of bringing the
next big revolution after the IT sector.
Although organized retail market is not as strong as of now, it is expected to grow
manifolds by the year 2010. The sector contributes 10% of the GDP, and is estimated to show
20% annual growth rate by the end of the decade as against the current growth rate of 8.5%. A
CRISIL report says that the Indian retail market is the most fragmented in the world and that
only 2% of the entire retailing business is in the organized sector. This suggests that the potential
for growth is immense. There are about 300 new malls, 1500 supermarkets and 325 departmental
stores currently being built in the cities across India.
Some of the players present in the industry:
Archie’s, Bata India Ltd, Big Bazaar, Crossword, Ebony Retail Holdings Ltd., Fabmall,
Food Bazaar, Globus Stores Pvt. Ltd., Health and Glow, Liberty Shoes Ltd., MTR Foods Ltd.,
Music World Entertainment Ltd., Pantaloon Retail India Ltd., Shoppers Stop, Style SPA
Furniture Ltd, Subhiksha, Titan Industries, Lifestyle, etc.
New entrants entering the market soon will be Reliance Retail Ltd, Wal-Mart Stores,
Carrefour, Tesco, Boots Group, etc.
Challenges:
The Indian Retail sector is constantly shacked with cut throat competition. It is also
facing challenges in the form of shortages for management professionals, cash flow, supply chin
management and frauds.
International retailers:
There has been greater influence of brands like Wal-Mart, Tommy Hilfiger, Carrefour,
Marks & Spencer, Nike, etc. in the big cities of India for long
Scope of the Retail Sector:
Retail is clearly the sector that is poised to show the highest growth in the next five years.
The sector is set for a revolution, as both the present players and new entrants are gearing up to
explore the market. This sector contributes 10% of India's GDP and the current growth rate is
8.5%. The present size of the organized retailing sector is approximately 3% and is expected to
grow to 25-30% by the year 2010. There are about 300 new malls, 1500 supermarkets and 325
departmental stores currently under construction. Global retail giants such as Wal-Mart, Tesco,
Germany's Metro AG and many others are ready to enter the retail markets. The rising demands
of branded products and increase in purchasing power have lured these companies to enter the
market.
Leading Indian Retailers:
Bata India Ltd, Big Bazaar, Crossword, Ebony Retail Holdings Ltd., Food Bazaar,
Globus Stores Pvt. Ltd., Liberty shoes Ltd., Music World Entertainment Ltd., Pantaloon Retail
India Ltd., Shoppers Stop, Subhiksha, Titan Industries, Trent and the new entrants penetrating
the market soon will include Reliance Retail Ltd, Wal-Mart Stores, Carrefour, Tesco, Boots
Group, etc.
Current Scenario:
One of the world's largest industries exceeding US$ 9 trillion
47 global fortune companies & 25 of Asia's top 200 companies are retailers Dominated