MDT Advisers, a Federated Advisory Company MDT Mid Cap Growth Strategy April 30, 2015 City of Naples General Employees’, Police Officers’, & Firefighters’ Pensions Use Only. Not for Distribution to the Public. Presented to: City of Naples General Employees’, Police Officers’, & Firefighters’ Pensions Nick Kemerer, Vice President Managed Accounts Sarah A. Stahl, CIPM, Vice President, Managing Director, MDT Advisers Presented by:
Transcript
MDT Advisers, a Federated Advisory Company
MDT Mid Cap Growth Strategy
April 30, 2015
City of Naples General Employees’, Police Officers’, & Firefighters’ Pensions Use Only. Not for Distribution to the Public.
Presented to:
City of Naples General Employees’, Police Officers’, & Firefighters’ Pensions
Nick Kemerer, Vice President Managed Accounts
Sarah A. Stahl, CIPM, Vice President, Managing Director, MDT Advisers
Presented by:
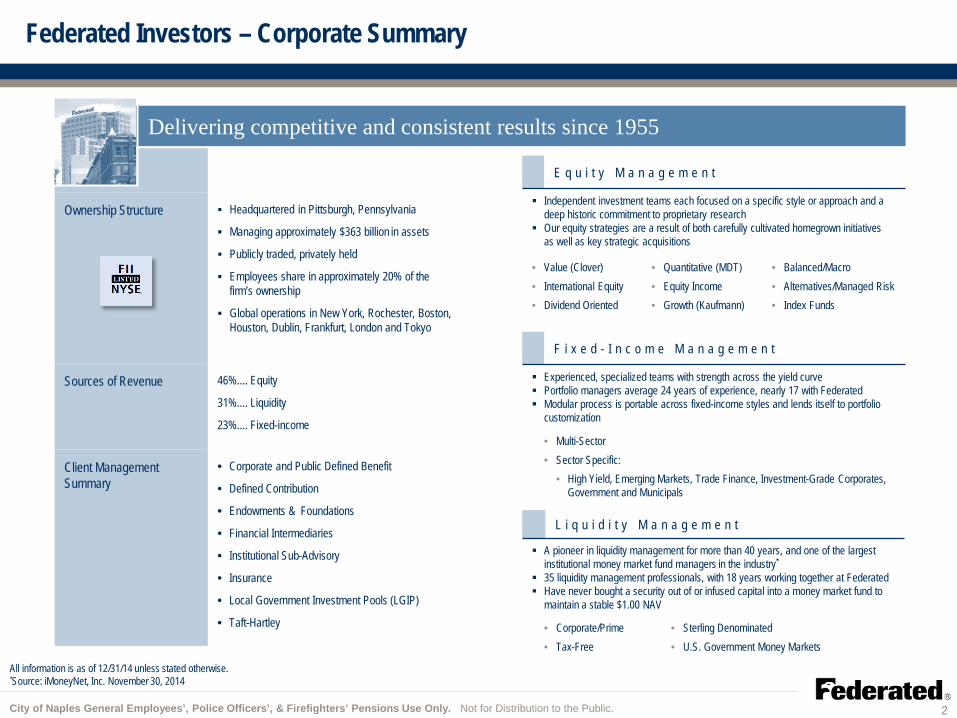
Federated Investors – Corporate Summary
All information is as of 12/31/14 unless stated otherwise. *Source: iMoneyNet, Inc. November 30, 2014
Ownership Structure Headquartered in Pittsburgh, Pennsylvania
Managing approximately $363 billion in assets
Publicly traded, privately held
Employees share in approximately 20% of the firm’s ownership
Global operations in New York, Rochester, Boston, Houston, Dublin, Frankfurt, London and Tokyo
Sources of Revenue 46%.... Equity
31%.... Liquidity
23%.... Fixed-income
Client Management Summary
• Corporate and Public Defined Benefit
• Defined Contribution
• Endowments & Foundations
• Financial Intermediaries
• Institutional Sub-Advisory
• Insurance
• Local Government Investment Pools (LGIP)
• Taft-Hartley
L i q u i d i t y M a n a g e m e n t
A pioneer in liquidity management for more than 40 years, and one of the largest institutional money market fund managers in the industry*
35 liquidity management professionals, with 18 years working together at Federated Have never bought a security out of or infused capital into a money market fund to
maintain a stable $1.00 NAV
• Corporate/Prime • Tax-Free
• Sterling Denominated • U.S. Government Money Markets
Delivering competitive and consistent results since 1955
E q u i t y M a n a g e m e n t
Independent investment teams each focused on a specific style or approach and a deep historic commitment to proprietary research
Our equity strategies are a result of both carefully cultivated homegrown initiatives as well as key strategic acquisitions
• Value (Clover) • International Equity • Dividend Oriented
• Quantitative (MDT) • Equity Income • Growth (Kaufmann)
• Balanced/Macro • Alternatives/Managed Risk • Index Funds
F i x e d - I n c o m e M a n a g e m e n t
Experienced, specialized teams with strength across the yield curve Portfolio managers average 24 years of experience, nearly 17 with Federated Modular process is portable across fixed-income styles and lends itself to portfolio
customization
• Multi-Sector • Sector Specific:
• High Yield, Emerging Markets, Trade Finance, Investment-Grade Corporates, Government and Municipals
City of Naples General Employees’, Police Officers’, & Firefighters’ Pensions Use Only. Not for Distribution to the Public. 2
Global Equity Team
ALTERNATIVES / MANAGED RISK Michael Dieschbourg, CIMA
Investment Professionals: 9
Portfolio Managers 4 Analysts 5
Average yrs: Industry 15 Federated 9
Chief Investment Officer is included in International Portfolio Manager count.
City of Naples General Employees’, Police Officers’, & Firefighters’ Pensions Use Only. Not for Distribution to the Public. 3
2/15
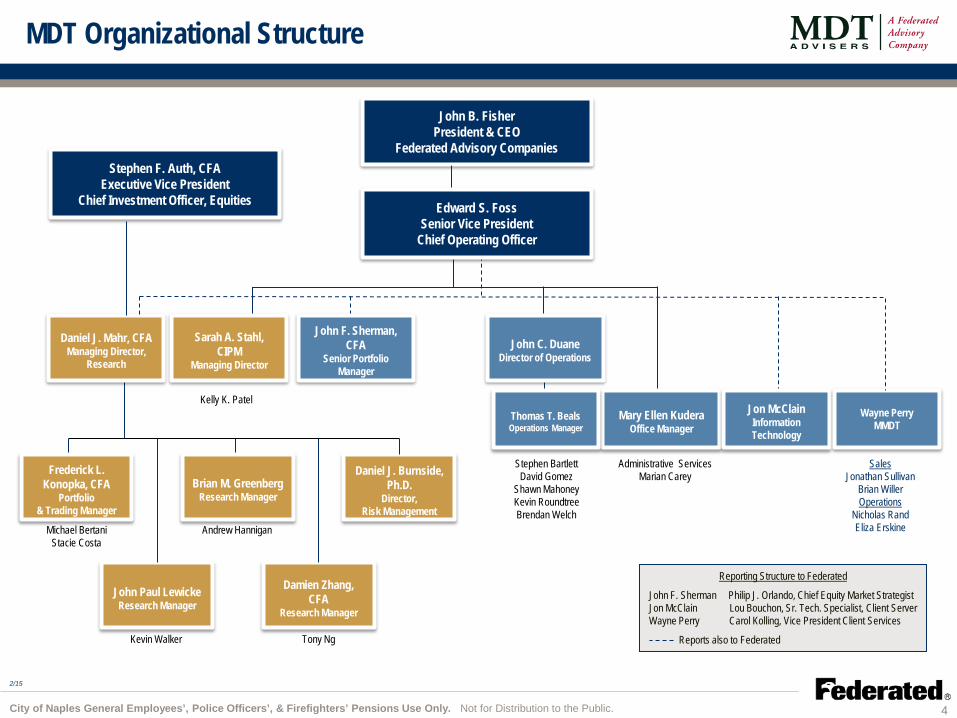
MDT Organizational Structure
John B. Fisher President & CEO
Federated Advisory Companies
Kevin Walker
Michael Bertani Stacie Costa
Administrative Services Marian Carey
Stephen Bartlett David Gomez
Shawn Mahoney Kevin Roundtree Brendan Welch
Brian M. Greenberg Research Manager
Frederick L. Konopka, CFA
Portfolio & Trading Manager
Kelly K. Patel
Sarah A. Stahl, CIPM
Managing Director
Mary Ellen Kudera
Office Manager
John C. Duane Director of Operations
Thomas T. Beals Operations Manager
Reporting Structure to Federated
John F. Sherman Philip J. Orlando, Chief Equity Market Strategist Jon McClain Lou Bouchon, Sr. Tech. Specialist, Client Server Wayne Perry Carol Kolling, Vice President Client Services
Reports also to Federated
Daniel J. Mahr, CFA Managing Director,
Research
John F. Sherman, CFA
Senior Portfolio Manager
Edward S. Foss Senior Vice President
Chief Operating Officer
Daniel J. Burnside,
Ph.D. Director,
Risk Management
Jon McClain Information Technology
John Paul Lewicke
Research Manager
Andrew Hannigan
Wayne Perry MMDT
Sales Jonathan Sullivan
Brian Willer Operations
Nicholas Rand Eliza Erskine
Stephen F. Auth, CFA Executive Vice President
Chief Investment Officer, Equities
Tony Ng
Damien Zhang,
CFA Research Manager
City of Naples General Employees’, Police Officers’, & Firefighters’ Pensions Use Only. Not for Distribution to the Public. 4
MDT Investment Team
Education Years with MDT Significant Experience at MDT
Daniel J. Mahr, CFA Managing Director, Research
Harvard College, A.B., Cum Laude, Computer Science Harvard University, S.M., Computer Science 13 Developed proprietary system for building trees
Managing Director, Research 2008 -
Sarah A. Stahl, CIPM Managing Director
Harvard College, A.B., Cum Laude, Applied Mathematics Harvard Graduate School of Business Administration, M.B.A 18
Designed and built trading and investment performance systems
Introduced tax-aware strategy
Brian M. Greenberg Research Manager
Harvard College, A.B., Computer Science Harvard University, S.M., Computer Science 11 Developed new versions of several stock selection variables
Added new detailed data streams to the research process
Frederick L. Konopka, CFA Portfolio & Trading Manager
Dartmouth College, Mathematics, A.B M.I.T. Sloan School of Management, M.S 18 Introduced mid cap and small cap strategies
Developed trading methodology and built trading team
John Paul Lewicke Research Manager
Dartmouth College, A.B., Cum Laude, Mathematics and Computer Science 8
Improved backtest simulation accuracy Developed enhanced technology for scoring companies using
trees
Damien Zhang, CFA Research Manager
Princeton University, A.B., Summa Cum Laude, Economics 6 Improved portfolio optimization risk management Made tree predictions more robust
Daniel J. Burnside, Ph.D., CFA Director, Risk Management
Cornell University, Ph.D., Electrical Engineering University of Rochester, M.B.A. 6
21 years experience in industry Lecturer in Finance, U. Rochester business school Provides input for risk analysis and model design
Research Analysts Traders
Andrew Hannigan Associate Analyst Years with MDT: 2
Tony Ng Analyst
Years with MDT: 4
Kelly Patel Analyst
Years with MDT: 5
Kevin Walker Associate Analyst Years with MDT: 2
Michael G. Bertani Assistant Portfolio
and Trading Manager Years with MDT: 7
Stacie Costa Trader
Years with MDT: 2
City of Naples General Employees’, Police Officers’, & Firefighters’ Pensions Use Only. Not for Distribution to the Public. 5
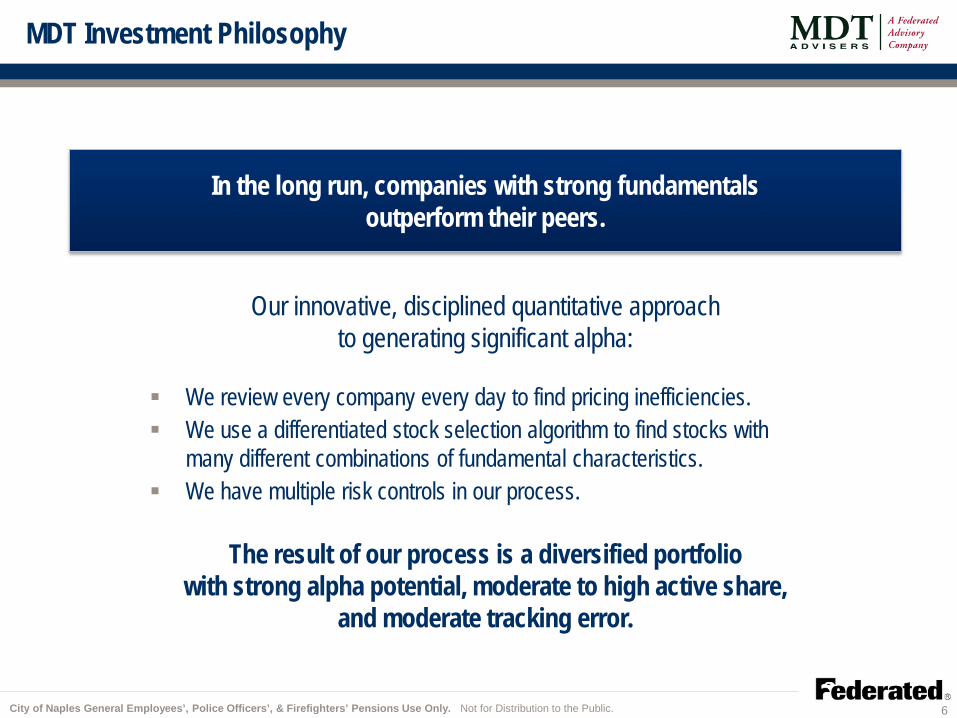
MDT Investment Philosophy
In the long run, companies with strong fundamentals outperform their peers.
Our innovative, disciplined quantitative approach to generating significant alpha:
We review every company every day to find pricing inefficiencies. We use a differentiated stock selection algorithm to find stocks with
many different combinations of fundamental characteristics. We have multiple risk controls in our process.
The result of our process is a diversified portfolio
with strong alpha potential, moderate to high active share, and moderate tracking error.
City of Naples General Employees’, Police Officers’, & Firefighters’ Pensions Use Only. Not for Distribution to the Public. 6
Distinguishing Features: Mid Cap Growth Portfolio Strategy
A T T R A C T I V E R I S K – R E T U R N M E T R I C S
As of 3/31/2015, except calendar year data which end at 12/31/2014. Statistics from MDT Mid Cap Growth Institutional Composite. Based on gross performance. Supplemental Information. Please see the full GIPS presentation that follows. Past performance is no guarantee of future results. *Monthly (annualized) tracking error.
D I V E R S I F Y I N G S T Y L E S T R A T E G Y F O R M O S T I N V E S T O R S
S U S T A I N A B L E A L P H A O V E R M O S T T I M E P E R I O D S
A L O N G H I S T O R Y O F E X P E R I E N C E I N Q U A N T I T A T I V E M A N A G E M E N T
305 bps
564 bps
Average AnnualOutperformance
Last 5 Years
8.3%
3.9%
ActualSince Inception
Last 5 Years
Monthly Tracking Error*
77%
Portfolio Actual3/31/2015
Active Share
0.33 0.15
PortfolioSince Inception
BenchmarkSince Inception
Sharpe Ratio
0.33
0.92
PortfolioSince Inception
Last 5 Years
Information Ratio
Track Record Since Inception (Aug. 2000)
$0.00
$0.50
$1.00
$1.50
$2.00
$2.50
$3.00
$3.50
Jul 2
000
Jul 2
001
Jul 2
002
Jul 2
003
Jul 2
004
Jul 2
005
Jul 2
006
Jul 2
007
Jul 2
008
Jul 2
009
Jul 2
010
Jul 2
011
Jul 2
012
Jul 2
013
Jul 2
014
Valu
e of $
1 Inv
este
d at I
ncep
tion
MDT Mid Cap Growth Cumulative Total Returns
MDT Mid Cap Growth Russell Midcap Growth
71% 75%
% of Calendar Years>Benchmark
% of 3 Year RollingYear Periods >
Benchmark
City of Naples General Employees’, Police Officers’, & Firefighters’ Pensions Use Only. Not for Distribution to the Public. 7
Fundamentally Driven Quantitative Investment Process
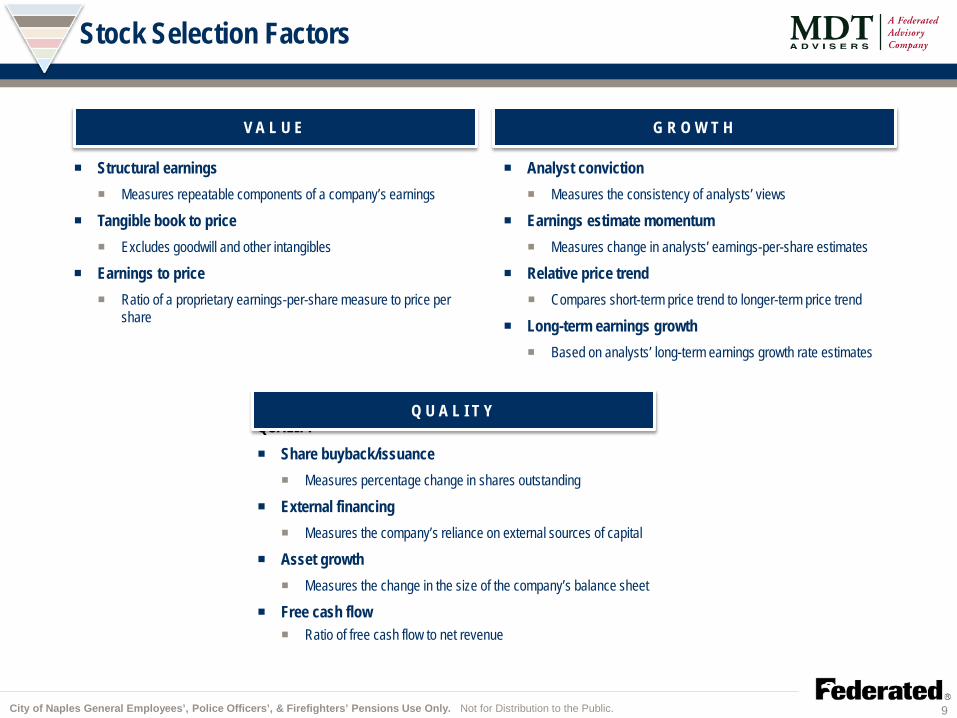
Russell Midcap® Growth Stock Universe
Fundamental Research Model Scores stocks daily against 11 key factor attributes
measuring value, growth and quality
Trade Optimization Model Balances projected stock alphas with
marginal trading costs
Risk Management Budgets exposure to manage the
risk/return tradeoff
Daily Trade Review All significant
recommended trades reviewed manually
Client Portfolio
90-150 stocks
Fresh Model updated every 18-30 months
Original Incorporates proprietary research on latest MDT and academic thinking
Robust Utilizes decision tree technology to evaluate factors over a significant number of stocks and time periods
Long-term earnings growth Based on analysts’ long-term earnings growth rate estimates
QUALITY Share buyback/issuance
Measures percentage change in shares outstanding
External financing Measures the company’s reliance on external sources of capital
Asset growth Measures the change in the size of the company’s balance sheet
Free cash flow Ratio of free cash flow to net revenue
V A L U E G R O W T H
Q U A L I T Y
City of Naples General Employees’, Police Officers’, & Firefighters’ Pensions Use Only. Not for Distribution to the Public. 9
Mid Cap Growth – Scoring with a Decision Tree
Node 1 External
Financing <= -3.8%
TN04 TN05
Node 3 Structural
Earnings %ile <=76.6%
Node 2 Asset Growth
<=35.3%
Node 5 Earnings Estimate
Momentum <=1.1%
Node 6 Structural
Earnings %ile <=84.4%
Node 4 Structural
Earnings %ile <=74.4%
TN03
Node 7 Earnings to Price %ile <=42.2%
TN06 TN07 TN08 TN01 TN02
-1.26%
-0.52% 0.19% 0.66% 0.92% 1.23%
-0.34% 0.19%
Score: Expected 3-Month-Ahead Performance versus Universe
Summarized Scoring Tree and Tree Nodes (TN)
City of Naples General Employees’, Police Officers’, & Firefighters’ Pensions Use Only. Not for Distribution to the Public. 10
Mid Cap Growth – Scoring with a Decision Tree
Node 1 External
Financing <= -3.8%
TN04 TN05
Node 3 Structural
Earnings %ile <=76.6%
Node 2 Asset Growth
<=35.3%
Node 5 Earnings Estimate
Momentum <=1.1%
Node 6 Structural
Earnings %ile <=84.4%
Node 4 Structural
Earnings %ile <=74.4%
TN03
Node 7 Earnings to Price %ile <=42.2%
TN06 TN07 TN08 TN01 TN02
-1.26%
-0.52% 0.19% 0.66% 0.92% 1.23%
-0.34% 0.19%
Score: Expected 3-Month-Ahead Performance versus Universe
Very high structural earnings
High structural earnings
Improving earnings projections No high structural earnings
or improving earnings or high value
High external financing required, rapid asset growth
Summarized Scoring Tree and Tree Nodes (TN)
City of Naples General Employees’, Police Officers’, & Firefighters’ Pensions Use Only. Not for Distribution to the Public. 11
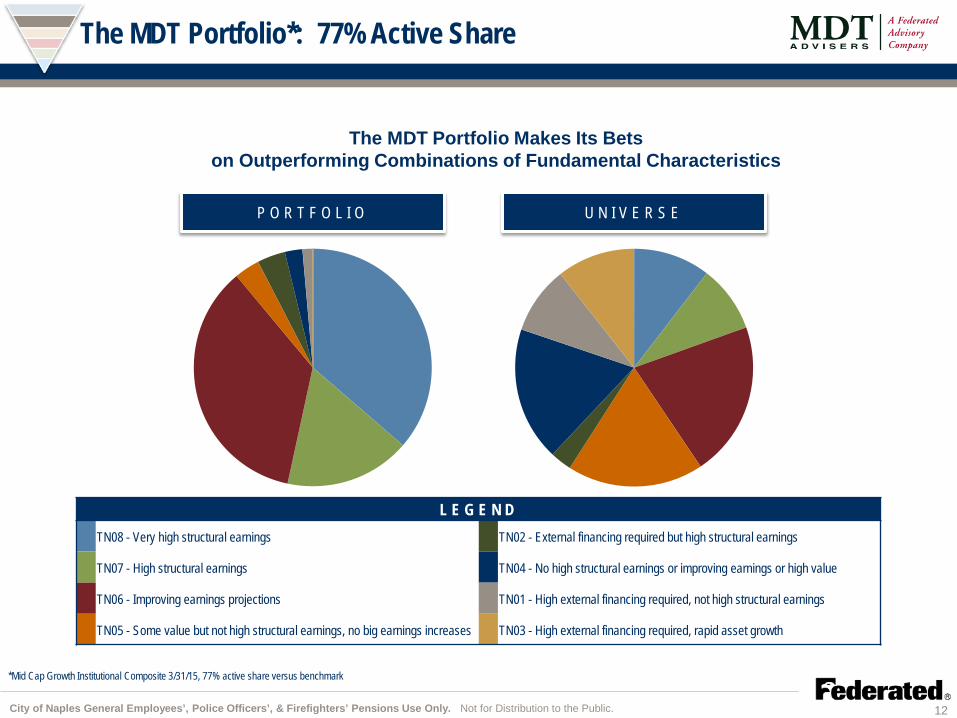
MDT Mid Cap Growth Weights Russell Midcap Growth Weights
The MDT Portfolio*: 77% Active Share
The MDT Portfolio Makes Its Bets on Outperforming Combinations of Fundamental Characteristics
*Mid Cap Growth Institutional Composite 3/31/15, 77% active share versus benchmark
L E G E N D TN08 - Very high structural earnings TN02 - External financing required but high structural earnings
TN07 - High structural earnings TN04 - No high structural earnings or improving earnings or high value
TN06 - Improving earnings projections TN01 - High external financing required, not high structural earnings
TN05 - Some value but not high structural earnings, no big earnings increases TN03 - High external financing required, rapid asset growth
U N I V E R S E P O R T F O L I O
City of Naples General Employees’, Police Officers’, & Firefighters’ Pensions Use Only. Not for Distribution to the Public. 12
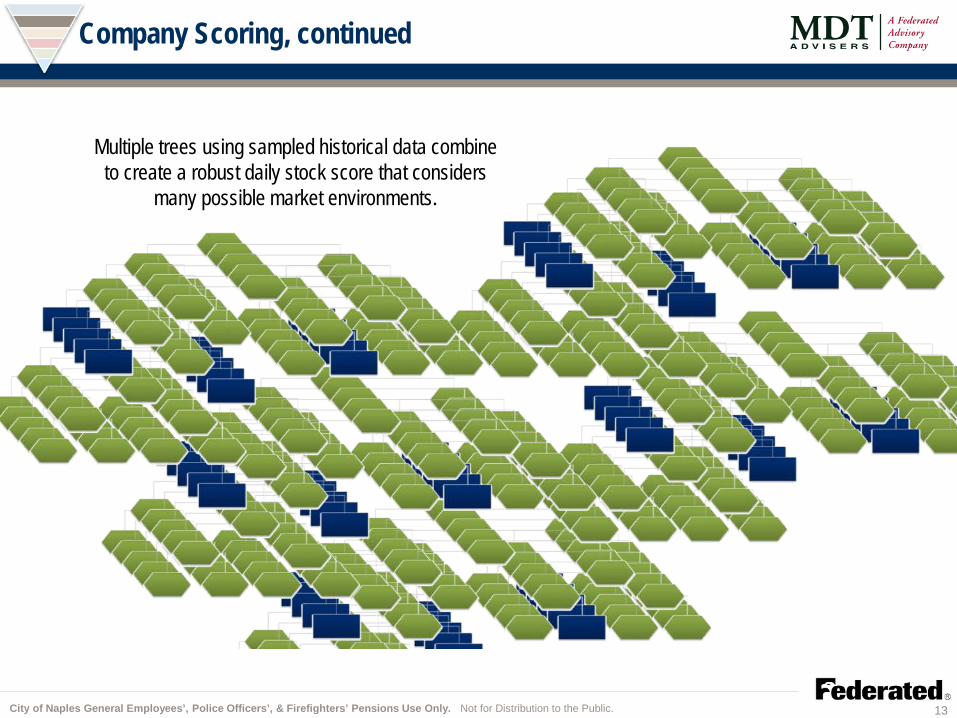
Company Scoring, continued
Multiple trees using sampled historical data combine to create a robust daily stock score that considers
many possible market environments.
City of Naples General Employees’, Police Officers’, & Firefighters’ Pensions Use Only. Not for Distribution to the Public. 13
Trade Optimization Model
Buy discipline and trading cost control
A position will not be purchased until its projected alpha is high enough to cover its estimated trading costs
Trading costs are company-specific, trade-size-dependent, and reflect
Commission
Spread
Market impact
Trading cost estimates are based on an internal database of hundreds of thousands of actual trades
The speed at which final trades are worked reflects the trade-off between market impact and short-term alpha
City of Naples General Employees’, Police Officers’, & Firefighters’ Pensions Use Only. Not for Distribution to the Public. 14
Trade Optimization Model
Sell discipline
A mirror of the buy discipline
Companies with declining fundamentals are sold as soon as there are replacement companies with high enough alpha to pay their own trading costs
Consistent, objective, unemotional
City of Naples General Employees’, Police Officers’, & Firefighters’ Pensions Use Only. Not for Distribution to the Public. 15
Risk Management Process – Mid Cap Growth
Risk Management Model constructed to control beta and tracking error
Diversification constraints:
Company correlations analyzed
Typically 90 – 150 stocks in portfolio
Maximum company weight 2.5% of portfolio†
Business range ± 5.0%*
Industry range ± 5.0%*
Sector range ± 1.0%*
* From weight in MDT Mid Cap Growth buyable universe which approximates the Russell Midcap Growth Index. Business, industry and sector definitions based on Thomson Reuters I/B/E/S.
† Or MDT Mid Cap Growth Universe weight, if larger.
2015
City of Naples General Employees’, Police Officers’, & Firefighters’ Pensions Use Only. Not for Distribution to the Public. 16
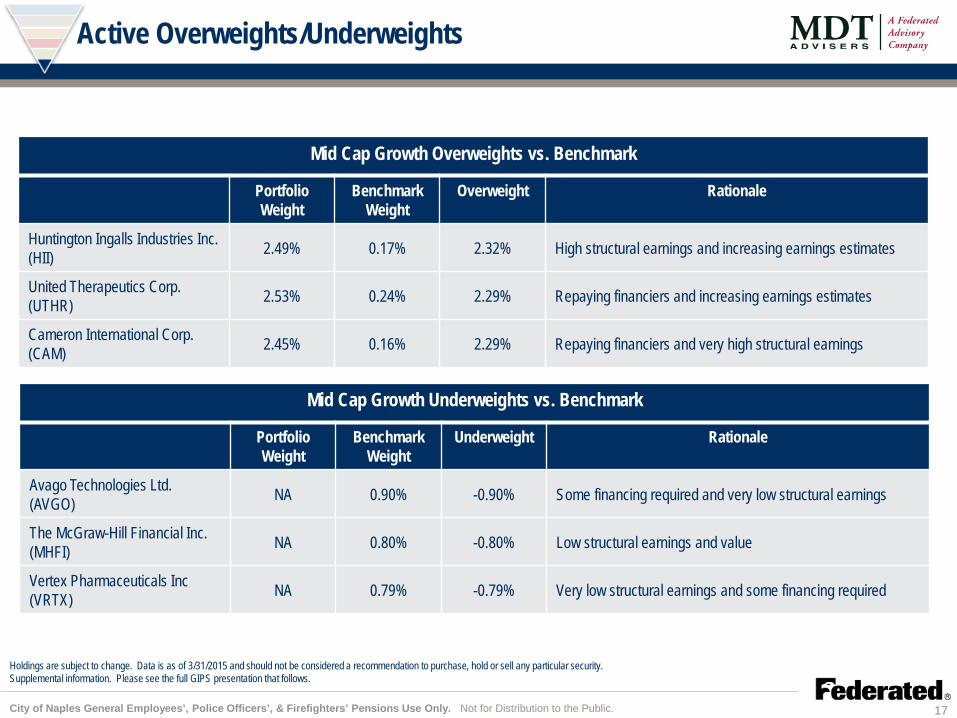
Active Overweights/Underweights
Mid Cap Growth Overweights vs. Benchmark
Portfolio Weight
Benchmark Weight
Overweight Rationale
Huntington Ingalls Industries Inc. (HII) 2.49% 0.17% 2.32% High structural earnings and increasing earnings estimates
United Therapeutics Corp. (UTHR) 2.53% 0.24% 2.29% Repaying financiers and increasing earnings estimates
Cameron International Corp. (CAM) 2.45% 0.16% 2.29% Repaying financiers and very high structural earnings
Mid Cap Growth Underweights vs. Benchmark
Portfolio Weight
Benchmark Weight
Underweight Rationale
Avago Technologies Ltd. (AVGO) NA 0.90% -0.90% Some financing required and very low structural earnings
The McGraw-Hill Financial Inc. (MHFI) NA 0.80% -0.80% Low structural earnings and value
Vertex Pharmaceuticals Inc (VRTX) NA 0.79% -0.79% Very low structural earnings and some financing required
Holdings are subject to change. Data is as of 3/31/2015 and should not be considered a recommendation to purchase, hold or sell any particular security. Supplemental information. Please see the full GIPS presentation that follows.
City of Naples General Employees’, Police Officers’, & Firefighters’ Pensions Use Only. Not for Distribution to the Public. 17
Summary: Our Investment Edge
Fresh Research process is continuous to take advantage of latest and best academic and internal thinking, to stay ahead of fast moving markets.
Robust Sophisticated technology used to allow consideration of thousands of combinations of stock factors and external environments.
Consistent Dynamic quantitative rules developed using 30 years of stock market history, implemented without emotion.
Experienced Investment process running live for the past 20 years through multiple market environments.
Rigorous and Repeatable.
City of Naples General Employees’, Police Officers’, & Firefighters’ Pensions Use Only. Not for Distribution to the Public. 18
Appendix
City of Naples General Employees’, Police Officers’, & Firefighters’ Pensions Use Only. Not for Distribution to the Public. 19
Account Specific Performance
City of Naples General Employees’, Police Officers’ and Firefighters’ Pensions Gross Performance Returns as of 3/31/15
Supplemental Information
Firefighters General
Employees Police Index
1Q 2015 3.63% 3.54% 3.63% 5.38%
1 Year 15.12% 15.09% 15.28% 15.56%
3 Years 20.53% 20.59% 20.63% 17.41%
5 Years 21.80% 22.01% 21.94% 16.43%
Since Inception† 23.05% 23.24% 23.19% 22.27%
† Since inception 1/16/2009. Periods greater than one year are annualized.
Performance returns are gross of management and other fees. Deduction of fees and expenses over time will reduce a client’s return.
Investing in equities is speculative and involves substantial risk. Please refer to the disclosure pages at the end of this document as they are an integral part of this presentation. Past performance is no guarantee of future results. Supplemental Information is supplemental to the attached GIPS presentation.
Source: MDT’s internal Investment Team.
City of Naples General Employees’, Police Officers’, & Firefighters’ Pensions Use Only. Not for Distribution to the Public. 20
MDT Mid Cap Growth
As of 3/31/2015. Past performance is no guarantee of future results. Supplemental information. Please see the full GIPS presentation that follows.
Gross Performance vs. Benchmark -0.59% 1.14% 1.43% 2.98% -1.79% -1.79%
City of Naples General Employees’, Police Officers’, & Firefighters’ Pensions Use Only. Not for Distribution to the Public. 21
-600bp
-400bp
-200bp
0bp
200bp
400bp
600bp
800bp
1000bp
1200bp
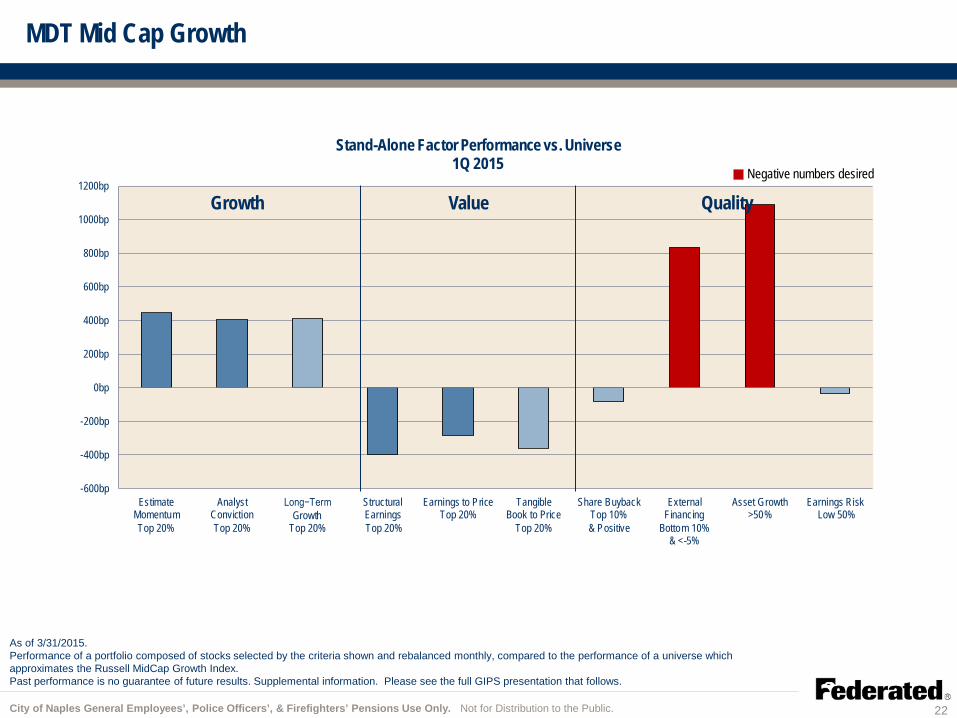
EstimateMomentumTop 20%
AnalystConvictionTop 20%
Long−Term Growth
Top 20%
StructuralEarnings Top 20%
Earnings to PriceTop 20%
TangibleBook to Price
Top 20%
Share BuybackTop 10%& Positive
ExternalFinancing
Bottom 10%& <-5%
Asset Growth>50%
Earnings Risk Low 50%
Stand-Alone Factor Performance vs. Universe1Q 2015
MDT Mid Cap Growth
As of 3/31/2015. Performance of a portfolio composed of stocks selected by the criteria shown and rebalanced monthly, compared to the performance of a universe which approximates the Russell MidCap Growth Index. Past performance is no guarantee of future results. Supplemental information. Please see the full GIPS presentation that follows.
Negative numbers desired
Growth Value Quality
City of Naples General Employees’, Police Officers’, & Firefighters’ Pensions Use Only. Not for Distribution to the Public. 22
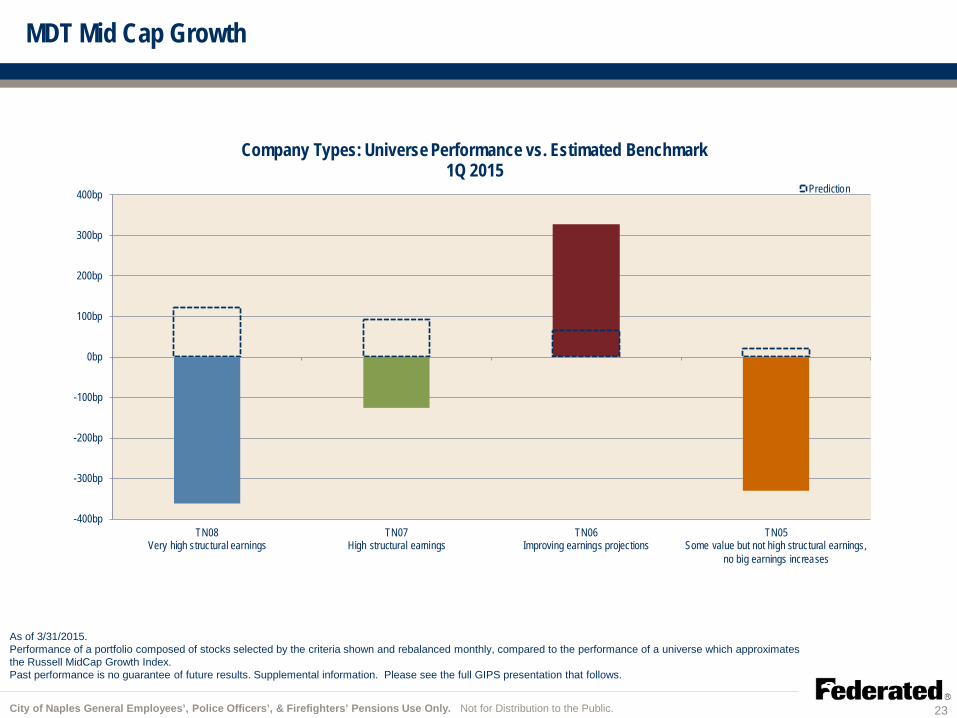
MDT Mid Cap Growth
-400bp
-300bp
-200bp
-100bp
0bp
100bp
200bp
300bp
400bp
TN08Very high structural earnings
TN07High structural earnings
TN06Improving earnings projections
TN05Some value but not high structural earnings,
no big earnings increases
Company Types: Universe Performance vs. Estimated Benchmark1Q 2015
Prediction
As of 3/31/2015. Performance of a portfolio composed of stocks selected by the criteria shown and rebalanced monthly, compared to the performance of a universe which approximates the Russell MidCap Growth Index. Past performance is no guarantee of future results. Supplemental information. Please see the full GIPS presentation that follows.
City of Naples General Employees’, Police Officers’, & Firefighters’ Pensions Use Only. Not for Distribution to the Public. 23
MDT Mid Cap Growth
-250bp
-200bp
-150bp
-100bp
-50bp
0bp
50bp
100bp
150bp
200bp
TN08Very high structural earnings
TN07High structural earnings
TN06Improving earnings projections
TN05Some value but not high structural earnings,
no big earnings increases
Company Types: Contribution to Portfolio Performance1Q 2015
As of 3/31/2015. Past performance is no guarantee of future results. Supplemental information. Please see the full GIPS presentation that follows.
City of Naples General Employees’, Police Officers’, & Firefighters’ Pensions Use Only. Not for Distribution to the Public. 24
MDT Mid Cap Growth
0%
20%
40%
60%
80%
100%
120%
Company Types: Portfolio WeightDecember 2012 to March 2015
TN08Very high structural earnings
TN07High structural earnings
TN06Improving earnings projections
TN05Some value but not high structuralearnings, no big earnings increases
As of 3/31/2015. Supplemental information. Please see the full GIPS presentation that follows.
City of Naples General Employees’, Police Officers’, & Firefighters’ Pensions Use Only. Not for Distribution to the Public. 25
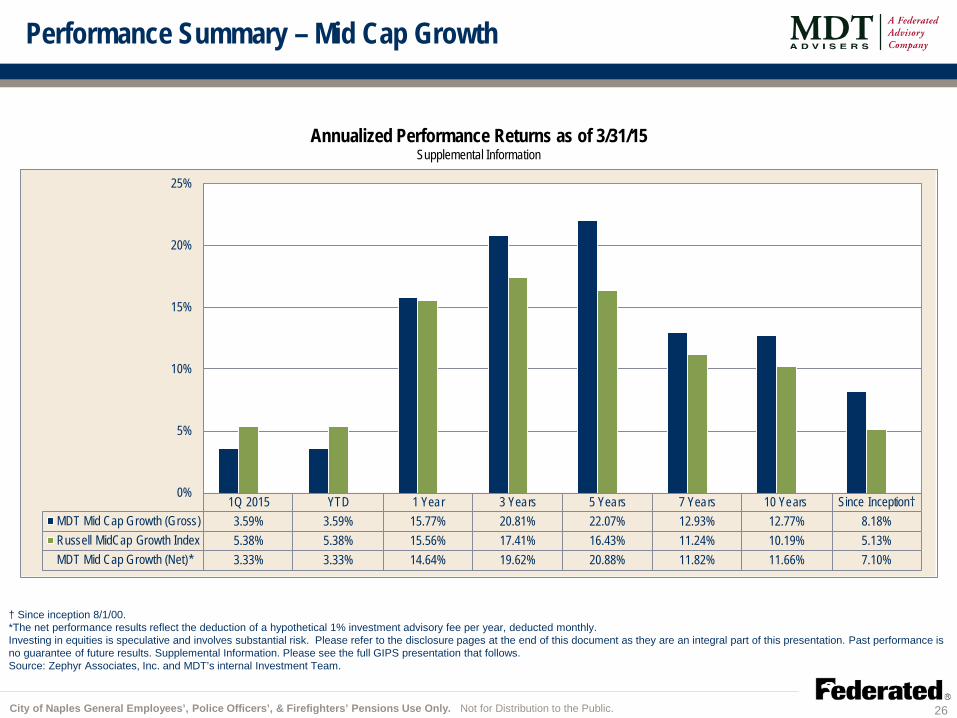
Performance Summary – Mid Cap Growth
Annualized Performance Returns as of 3/31/15 Supplemental Information
† Since inception 8/1/00. *The net performance results reflect the deduction of a hypothetical 1% investment advisory fee per year, deducted monthly. Investing in equities is speculative and involves substantial risk. Please refer to the disclosure pages at the end of this document as they are an integral part of this presentation. Past performance is no guarantee of future results. Supplemental Information. Please see the full GIPS presentation that follows. Source: Zephyr Associates, Inc. and MDT’s internal Investment Team.
1Q 2015 YTD 1 Year 3 Years 5 Years 7 Years 10 Years Since Inception†MDT Mid Cap Growth (Gross) 3.59% 3.59% 15.77% 20.81% 22.07% 12.93% 12.77% 8.18%Russell MidCap Growth Index 5.38% 5.38% 15.56% 17.41% 16.43% 11.24% 10.19% 5.13%MDT Mid Cap Growth (Net)* 3.33% 3.33% 14.64% 19.62% 20.88% 11.82% 11.66% 7.10%
0%
5%
10%
15%
20%
25%
City of Naples General Employees’, Police Officers’, & Firefighters’ Pensions Use Only. Not for Distribution to the Public. 26
Performance Summary – Mid Cap Growth
Annual Performance Returns as of 3/31/15 Supplemental Information
† Since inception 8/1/00. *The net performance results reflect the deduction of a hypothetical 1% investment advisory fee per year, deducted monthly. Investing in equities is speculative and involves substantial risk. Please refer to the disclosure pages at the end of this document as they are an integral part of this presentation. Past performance is no guarantee of future results. Supplemental Information. Please see the full GIPS presentation that follows. Source: Zephyr Associates, Inc. and MDT’s internal Investment Team.
City of Naples General Employees’, Police Officers’, & Firefighters’ Pensions Use Only. Not for Distribution to the Public. 27
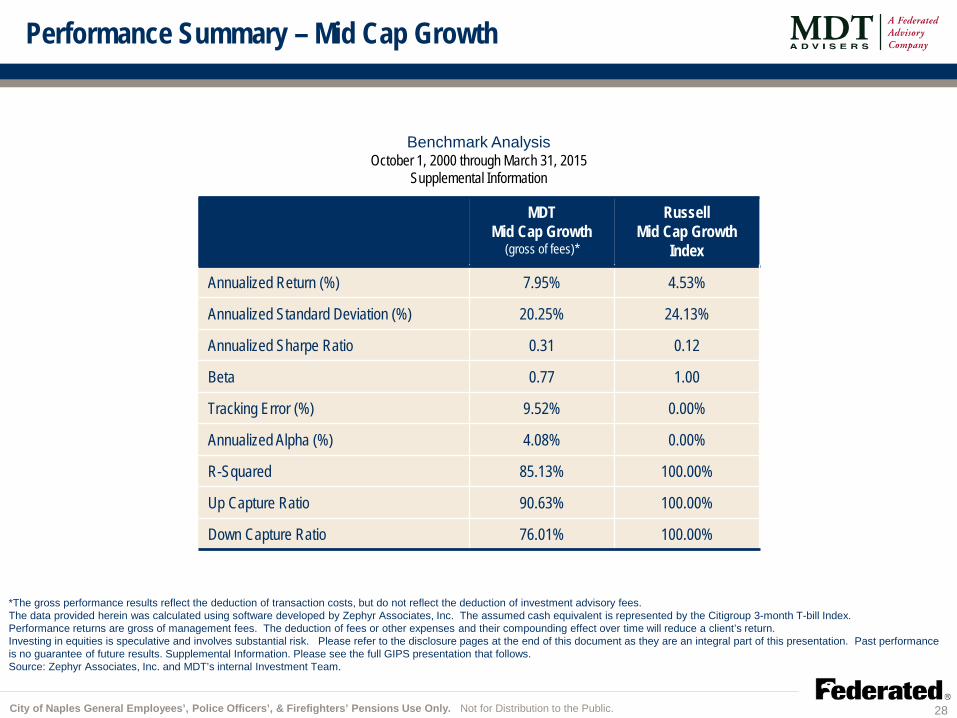
Performance Summary – Mid Cap Growth
Benchmark Analysis October 1, 2000 through March 31, 2015
Supplemental Information
MDT Mid Cap Growth
(gross of fees)*
Russell Mid Cap Growth
Index
Annualized Return (%) 7.95% 4.53%
Annualized Standard Deviation (%) 20.25% 24.13%
Annualized Sharpe Ratio 0.31 0.12
Beta 0.77 1.00
Tracking Error (%) 9.52% 0.00%
Annualized Alpha (%) 4.08% 0.00%
R-Squared 85.13% 100.00%
Up Capture Ratio 90.63% 100.00%
Down Capture Ratio 76.01% 100.00%
*The gross performance results reflect the deduction of transaction costs, but do not reflect the deduction of investment advisory fees. The data provided herein was calculated using software developed by Zephyr Associates, Inc. The assumed cash equivalent is represented by the Citigroup 3-month T-bill Index. Performance returns are gross of management fees. The deduction of fees or other expenses and their compounding effect over time will reduce a client’s return. Investing in equities is speculative and involves substantial risk. Please refer to the disclosure pages at the end of this document as they are an integral part of this presentation. Past performance is no guarantee of future results. Supplemental Information. Please see the full GIPS presentation that follows. Source: Zephyr Associates, Inc. and MDT’s internal Investment Team.
City of Naples General Employees’, Police Officers’, & Firefighters’ Pensions Use Only. Not for Distribution to the Public. 28
Mid Cap Growth Portfolio
As of 3/31/2015. *Top 10 holdings are bold and italicized. Supplemental Information. Please see the full GIPS presentation that follows. All securities listed are used to illustrate the MDT Mid Cap Growth portfolio and should not be viewed as recommendations. It should not be assumed that holdings listed were or will be profitable. The portfolio securities have changed over time and may change at any time. Individual client accounts will vary.
BASIC INDUSTRIES Bemis Co Inc. International Paper Co. Owens-Illinois Inc. RPM International Inc. Sealed Air Corp. The Sherwin-Williams Co.* The Timken Co. CAPITAL GOODS Acuity Brands Inc. Agilent Technologies Inc. Chicago Bridge & Iron Co. N.V. Dover Corp. Huntington Ingalls Industries Inc.* Joy Global Inc. MRC Global Inc. Paccar Inc. Pitney Bowes Inc. Spirit AeroSystems Holdings Inc. Trinity Industries Inc. Valmont Industries Inc. CONSUMER CYCLICALS Abercrombie & Fitch Co. Apollo Group Inc. -CL A AutoNation Inc. Autozone Inc.
Avis Budget Group Inc. Bed Bath & Beyond Inc. Big Lots Inc. Cablevision Systems Corp. Cintas Corp. Deckers Outdoor Corp. DeVry Inc. Dick's Sporting Goods Inc. Dillard's Inc. Discovery Communications Inc. Expedia Inc. Foot Locker Inc. Fossil Group Inc. Gap Inc. Guess? Inc. Harman International Herbalife Ltd. IAC/InterActiveCorp Kohl's Corp. Macy's Inc. Marriott International - CL A Mattel Inc. NeuStar Inc. Nu Skin Enterprises - Cl A O'Reilly Automotive Inc.* PVH Corp. Ralph Lauren Corp. Robert Half International Inc.
Ross Stores Inc. Royal Caribbean Cruises Ltd. Wyndham Worldwide Corp. CONSUMER DURABLES Genuine Parts Co. Goodyear Tire & Rubber Co. Harley-Davidson Inc. Lear Corp.* Penske Automotive Group Inc. Stanley Black & Decker Inc. CONSUMER STAPLES Avon Products Inc. Coca-Cola Enterprises Inc. ConAgra Foods Inc. Constellation Brands Inc. Dean Foods Co. Dr. Pepper Snapple Group Inc. Flowers Foods Inc. Ingredion Inc. Kroger Co.* Monster Beverage Corp. Tupperware Corp. Ulta Salon, Cosmetics & Fragrances Inc. Whole Foods Market Inc.
ENERGY Cameron International Corp.* FMC Technologies Inc. Helmerich & Payne Inc. Patterson-UTI Energy Inc. Tesoro Corp. FINANCIALS Allied World Assurance Co. Holdings Ltd. Ally Financial Inc. Aon Corp. Broadridge Financial Solutions LLC CB Richard Ellis Group Inc. Dun & Bradstreet Corp. Del NE Global Payments Inc. IntercontinentalExchange Inc. Lazard Ltd. Western Union Co.* HEALTH CARE Alexion Pharmaceuticals Inc. AmerisourceBergen Corp. Cardinal Health Inc. Cerner Corp. Edwards Lifesciences Corp. HCA Holdings Inc. Henry Schein Inc.
Laboratory Corp. of America Holdings Mednax Inc. Patterson Cos. Inc. Quest Diagnostics Quintiles Transnational Hldg St. Jude Medical Inc. United Therapeutics Corp.* Weight Watchers Intl Inc. INFORMATION TECHNOLOGY Arris Group Inc. Broadcom Corp. CA Inc. CDW Corp. Citrix Systems Inc. Electronic Arts Inc.* F5 Networks Inc. IPG Photoics Corp. Jabil Circuit Inc. Microchip Technology Inc. NetApp Inc. Polycom Inc. SanDisk Corp. ServiceNow Inc. Skyworks Solutions Inc.* Symantec Corp. Teradata Corp. Western Digital Corp.
TRANSPORTATION Alaska Air Group Inc. Delta Airlines Inc. Southwest Airlines Co. United Continental Holdings Inc. UTILITIES Windstream Holdings Inc.
City of Naples General Employees’, Police Officers’, & Firefighters’ Pensions Use Only. Not for Distribution to the Public. 29
Disclosures MDT Mid Cap Growth Institutional Composite
City of Naples General Employees’, Police Officers’, & Firefighters’ Pensions Use Only. Not for Distribution to the Public. 30
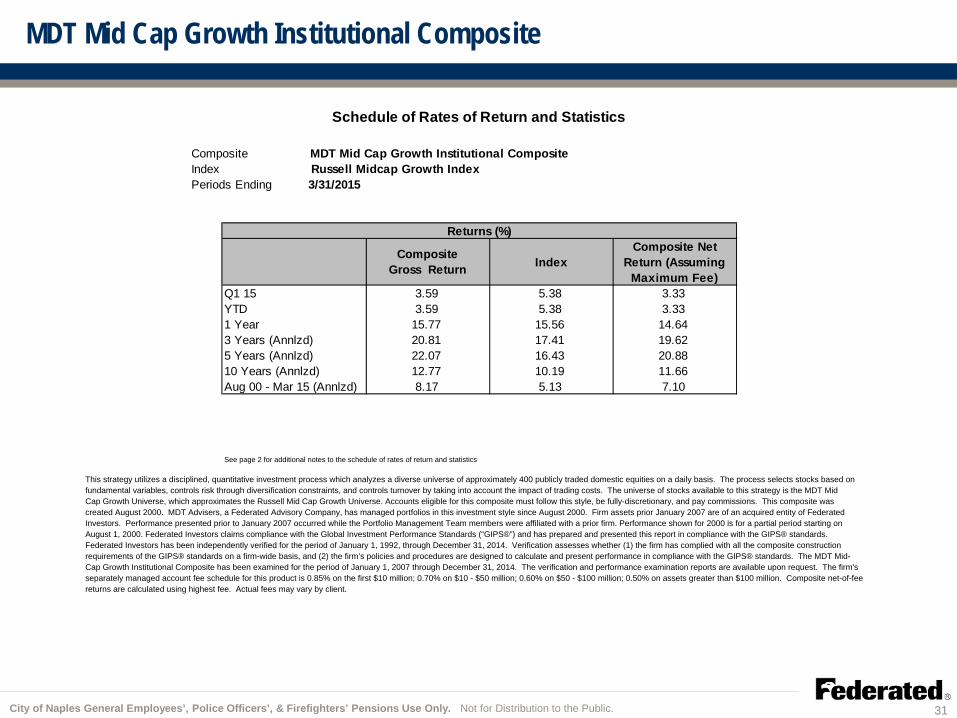
MDT Mid Cap Growth Institutional Composite
Composite MDT Mid Cap Growth Institutional CompositeIndex Russell Midcap Growth IndexPeriods Ending 3/31/2015
CompositeGross Return Index
Composite Net Return (Assuming
Maximum Fee)Q1 15 3.59 5.38 3.33YTD 3.59 5.38 3.331 Year 15.77 15.56 14.643 Years (Annlzd) 20.81 17.41 19.625 Years (Annlzd) 22.07 16.43 20.8810 Years (Annlzd) 12.77 10.19 11.66Aug 00 - Mar 15 (Annlzd) 8.17 5.13 7.10
See page 2 for additional notes to the schedule of rates of return and statistics
Returns (%)
Schedule of Rates of Return and Statistics
This strategy utilizes a disciplined, quantitative investment process which analyzes a diverse universe of approximately 400 publicly traded domestic equities on a daily basis. The process selects stocks based on fundamental variables, controls risk through diversification constraints, and controls turnover by taking into account the impact of trading costs. The universe of stocks available to this strategy is the MDT Mid Cap Growth Universe, which approximates the Russell Mid Cap Growth Universe. Accounts eligible for this composite must follow this style, be fully-discretionary, and pay commissions. This composite was created August 2000. MDT Advisers, a Federated Advisory Company, has managed portfolios in this investment style since August 2000. Firm assets prior January 2007 are of an acquired entity of Federated Investors. Performance presented prior to January 2007 occurred while the Portfolio Management Team members were affiliated with a prior firm. Performance shown for 2000 is for a partial period starting on August 1, 2000. Federated Investors claims compliance with the Global Investment Performance Standards (“GIPS®”) and has prepared and presented this report in compliance with the GIPS® standards. Federated Investors has been independently verified for the period of January 1, 1992, through December 31, 2014. Verification assesses whether (1) the firm has complied with all the composite construction requirements of the GIPS® standards on a firm-wide basis, and (2) the firm’s policies and procedures are designed to calculate and present performance in compliance with the GIPS® standards. The MDT Mid-Cap Growth Institutional Composite has been examined for the period of January 1, 2007 through December 31, 2014. The verification and performance examination reports are available upon request. The firm's separately managed account fee schedule for this product is 0.85% on the first $10 million; 0.70% on $10 - $50 million; 0.60% on $50 - $100 million; 0.50% on assets greater than $100 million. Composite net-of-fee returns are calculated using highest fee. Actual fees may vary by client.
City of Naples General Employees’, Police Officers’, & Firefighters’ Pensions Use Only. Not for Distribution to the Public. 31
MDT Mid Cap Growth Institutional Composite
Composite MDT Mid Cap Growth Institutional CompositeIndex Russell Midcap Growth IndexPeriods Ending
*Represents the 3-year annualized standard deviation for both the composite and index returns. The statistic is used to measure the volatility of composite returns.**Standard deviation is calculated using gross returns. Standard deviation is not applicable ("N/A") for any period if fewer than five accounts are in the composite for that period. (See footnote 5)
Schedule of Rates of Return and StatisticsPage -2-
8. Additional information regarding the policies for valuing portfolios, calculating performance, and preparing compliant presentations, as w ell as a complete list and description of the f irm’s composites is available upon request.
9. Past performance is not indicative of future results.
10. See disclosures on the Schedule of Rates of Return and Statistics Reports for additional information.
3/31/2015
2. Interest income and dividends are recognized on an accrual basis. Returns include the reinvestment of all income.
3. All market values and performance information are valued in US. dollars unless currency is denoted in composite title.
4. With the exception of the Federated Clover Investment Advisors composites, annual composite dispersion is measured and presented using the asset w eighted standard deviation of the returns of all of the portfolios included in the composite over the entire year. Quarterly dispersion is measured using all portfolios included in the composite for that quarter. With regard to Federated Clover Investment Advisors composites, annual dispersion is measured using the equal w eighted standard deviation of the returns of all the portfolios included in the composite over the entire year.
6. The composites may include the equity or f ixed segments of balanced separate accounts, w hen appropriate. Client directed cash f low s for balanced accounts are accounted for independently in the appropriate segment using the portfolio’s cash position in place at the time of the cash f low .
5. Composite dispersion does not measure the risk of the product presented, it simply measures the return variance among portfolios managed in a similar fashion. This variance can be affected by variations in cash f low or specif ic client parameters among the portfolios comprising the composites, as w ell as by Federated’s execution of strategy across accounts.
1. Federated Investors is a global, independent, multi-strategy investment management f irm w ith off ices in Pittsburgh, New York, Rochester, Boston, London, Dublin, and Frankfurt. For GIPS® purposes, Federated Investors is defined to include the assets of registered investment companies, separate (or private) accounts, managed accounts (including w rap accounts) and commingled or collective trusts that are advised or sub-advised by the follow ing subsidiaries: Federated Advisory Services Co.; Federated Equity Management Co. of PA; Federated Investment Counseling; Federated Investment Management Co.; Federated Global Investment Management Corp.; International Management Limited; Passport Research, Ltd.; MDT Advisers; Federated Securities Corp.; effective December, 2008, (the date of acquisition) the institutional assets of Federated Clover Investment Advisors, and effective September, 2009, (the date the assets w ere brought into compliance) the SMA/Wrap assets of Federated Clover Investment Advisors; and effective April, 2012 (the date of acquisition) Federated Investors (UK) LLP. Effective w ith the January 1, 2011, change in GIPS® policies regarding fair value, the assets of the Capital Preservation Fund (a Guaranteed Investment Contract vehicle) w ere included in the defined f irm assets. Prior to that date they w ere excluded as they are not market value based investments.
7. See the composite description language on the prior page for a discussion on appropriate fees currently applied to calculate composite performance. With regard to the institutional composites not managed by the Federated Clover or MDT Advisers teams, for the period July 1, 1992 through September 30, 2009, net of fee performance w as calculated monthly by reducing the gross composite return by the highest actual fee of any account in the composite for that month, regardless of investment vehicle. Prior to this, the maximum management fee charged for the period July 1, 1992 through September 30, 1992 w as used to calculate net of fee performance back to inception of the composite. In addition, further fee information can be obtained from Federated’s respective Forms ADV Part 2 Brochure Item 5.
City of Naples General Employees’, Police Officers’, & Firefighters’ Pensions Use Only. Not for Distribution to the Public. 32
Federated is a registered trademark of Federated Investors, Inc.
City of Naples General Employees’, Police Officers’, & Firefighters’ Pensions Use Only. Not for Distribution to the Public. 33