34
Measured Energy Savings Program Results ACC 2003 - Kansas City David Carroll, APPRISE Incorporated
| Date post: | 25-Dec-2015 |
| Category: |
Documents |
| Upload: | erin-lester |
| View: | 215 times |
| Download: | 1 times |

Measured Energy Savings Program Results
ACC 2003 - Kansas City
David Carroll, APPRISE Incorporated
Program Data Tracking Systems
How much information is needed to furnish measure-level savings?

Required Information• Measure savings estimates require data on
measures for each home• ….More detailed data give better measure
savings estimates• .…Tracking systems take time, cost money,
and overwhelm some contractors• ….Tracking systems can be a valuable tool
for program management

Savings Estimation Model• Model: Savings is a function of expected
savings from measures or measure groups• Observations: Treated units• Dependent Variable: Consumption savings• Independent Variables: Expected savings
for each measure or measure group• Y = a + bx1 + cx2 + … (where x1 is
insulation, x2 is air sealing, etc…)

Savings Disaggregation Model• For each unit…
• Projected Savings = a + bx1 + cx2 + …
• Ratio = Actual Savings / Projected Savings
• If x1 is the insulation term, bx1 is the projected savings from insulation, and Ratio* bx1 is the normalized savings attributed to insulation

6
Option #1- Installed MeasuresData Inputs
Data on:• Insulation – Y/N• Air Sealing – Y/N • Thermostat – Y/N• Tank Wrap – Y/N
Model Outputs
Savings for:• Insulation• Air Sealing• Thermostat• Tank Wrap

Requirements/Assumptions/ Caveats• Requirements: Units vary on the types of
measured installed• Assumptions: Standard regression assumptions /
collinearity and outliers cause problems / issue with intercept term
• Caveats: Lots of variance in expected and actual savings for measures across homes leads to high variance in model statistics
• Expectations: If all goes right, you may get a decent rough estimate of savings by measure

8
Option #2- $ By Measure GroupData Inputs
Data on:• $ for WX• $ for Low Cost • $ for Appliances• $ for Education
Model Outputs
Savings per:• $ of WX• $ for LC Measures• $ for Appliances• $ for Education

Option #3 - $ By MeasureData Inputs
Data on:• $ for Insulation• $ for Air Sealing • $ for Thermostats• $ for Water Measures• Etc…
Outputs
Savings per:• $ for Insulation• $ for Air Sealing• $ for Thermostat• $ for Water Measures• Etc…
Requirements/Assumptions/ Caveats• Requirements: Spending differs across treated
homes by measure or measure group• Assumptions: Standard regression assumptions /
collinearity and outliers cause problems• Caveats: Measures are “lumpy” and impacts may
not be linear. Be careful with savings per $ parameters
• Expectations: Lower variance than simplest model.
Option #4 – Measure QuantitiesData Inputs
Data on:• Amount/location of
insulation• Hours/location of air sealing• Thermostat and setback
protocol• # and type of water
measures• Etc…
Outputs
Actual savings per projected savings for:
• Insulation• Air sealing• Thermostats• Water Measures• Etc…
Improvements in Model #3• Variance: Measure based system may
improve model specification and reduce collinearity problems
• Model Validity: Unsupportable results may highlight measurement or statistical issues
• Usefulness: Savings attributed to individual measures may better focus quality control
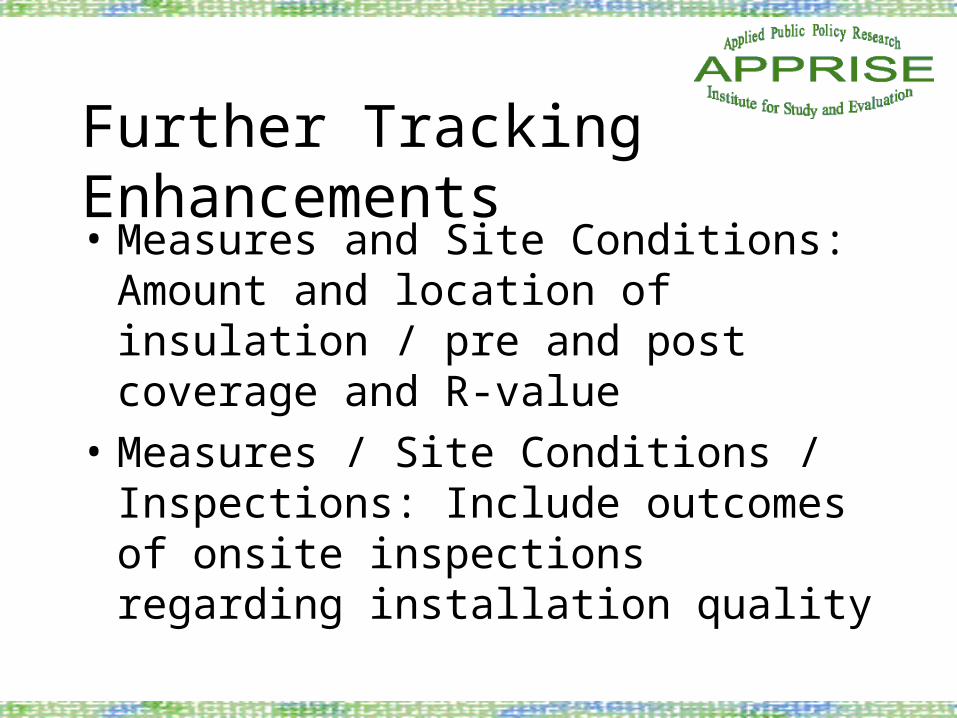
Further Tracking Enhancements• Measures and Site Conditions: Amount and
location of insulation / pre and post coverage and R-value
• Measures / Site Conditions / Inspections: Include outcomes of onsite inspections regarding installation quality
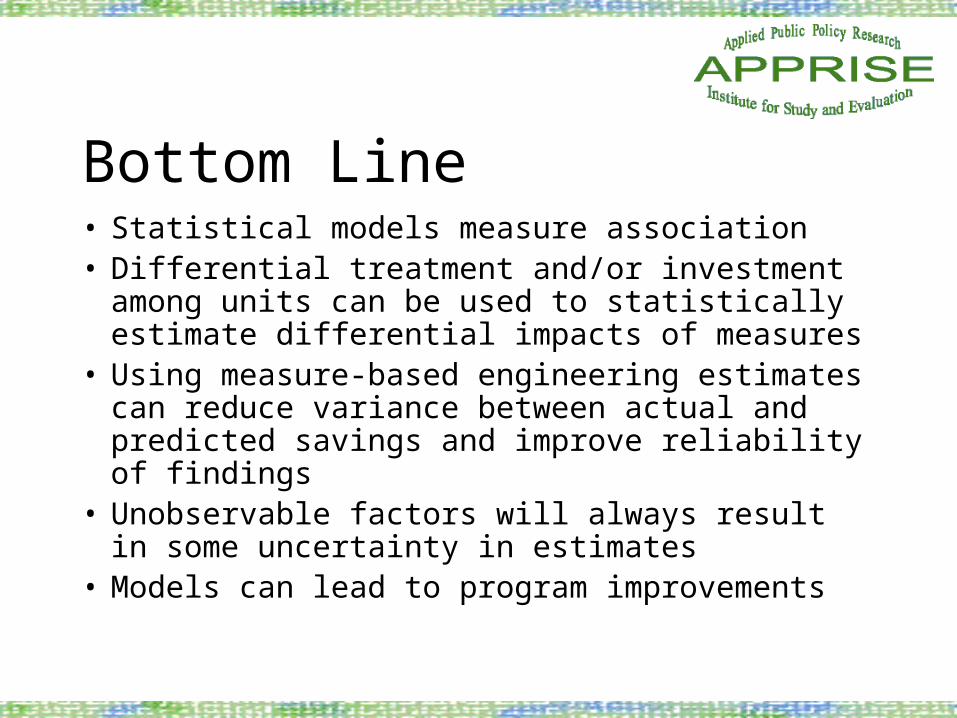
Bottom Line• Statistical models measure association• Differential treatment and/or investment among
units can be used to statistically estimate differential impacts of measures
• Using measure-based engineering estimates can reduce variance between actual and predicted savings and improve reliability of findings
• Unobservable factors will always result in some uncertainty in estimates
• Models can lead to program improvements

Energy Education
Untapped Resource or Unrealistic Expectations?

Savings from EducationProgram Year Gas Savings Electric Savings
NMPC Power Partnerships
1992 10% 3%*
PSE&G E-Team Partners
1997 No savings statistically attributed to customer behaviors
NMPC LICAP 1998 -- 7%*
Ohio EPP 2002 NA Action plans limited
NJ Comfort Partners
2002 Low level of action plans but high level of actions

Education ProtocolsProgram Procedures
NMPC Power Partnerships
Three-visit protocol with both energy savings and budget counseling goals
PSE&G E-Team Partners
Energy education was part of audit. Procedures include measures visit and insulation visit.
NMPC LICAP Options: Energy education workshop / Energy education video / Education with energy services
Ohio EPP Electric Baseload - Bill reconciliation process identifies biggest users and biggest savings actions
NJ Comfort Partners
Energy education staff use education tools to review bills, inform customers of costs, and identify actions
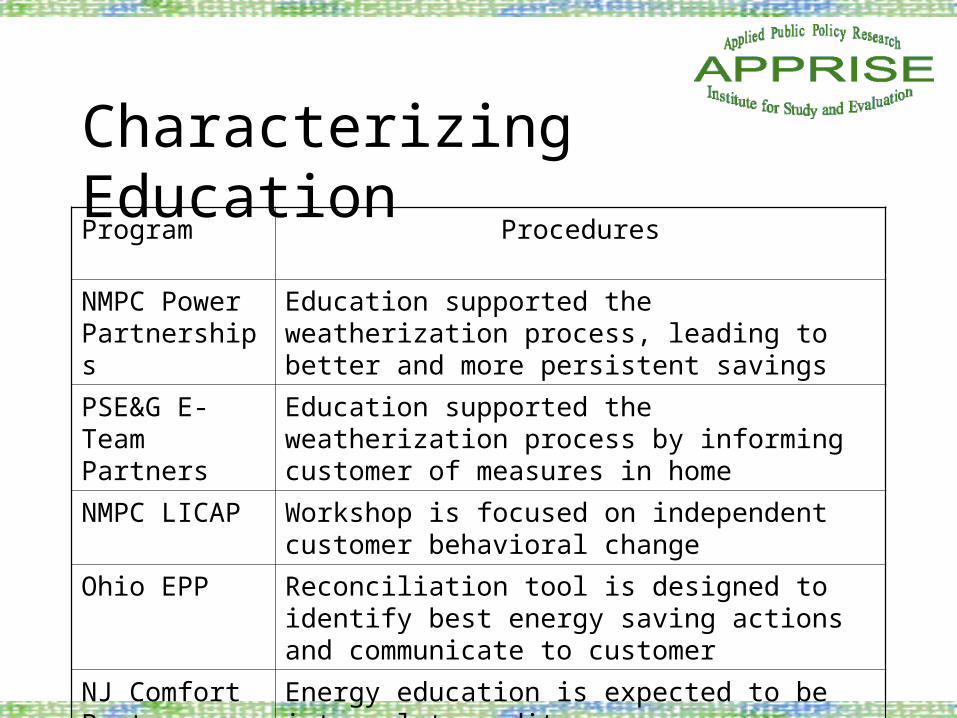
Characterizing EducationProgram Procedures
NMPC Power Partnerships
Education supported the weatherization process, leading to better and more persistent savings
PSE&G E-Team Partners
Education supported the weatherization process by informing customer of measures in home
NMPC LICAP Workshop is focused on independent customer behavioral change
Ohio EPP Reconciliation tool is designed to identify best energy saving actions and communicate to customer
NJ Comfort Partners
Energy education is expected to be integral to audit, measures installation, and follow-up
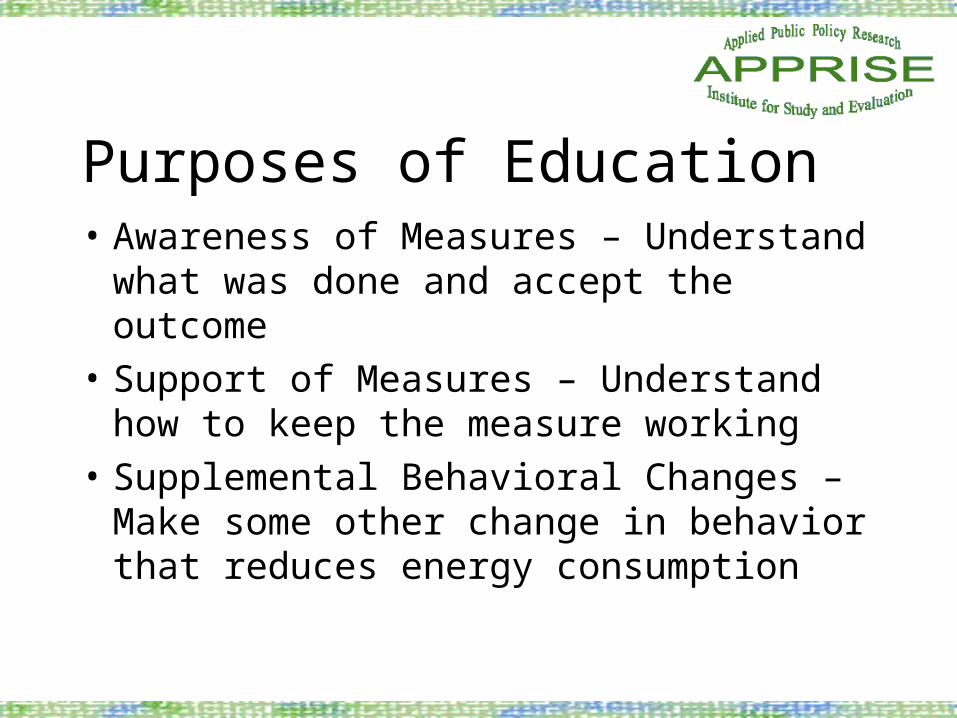
Purposes of Education• Awareness of Measures – Understand what
was done and accept the outcome
• Support of Measures – Understand how to keep the measure working
• Supplemental Behavioral Changes – Make some other change in behavior that reduces energy consumption

Examples of Effective Education• Awareness of Measures – Retain thermostat
setback and hot water turndown, Replace broken CFLs with CFLs
• Support of Measures – Replace furnace filters, fix faucet leaks, clean lint filter
• Supplemental Behavioral Changes – Wash clothes in cold water, turn off lights, use energy saver cycle on dishwasher
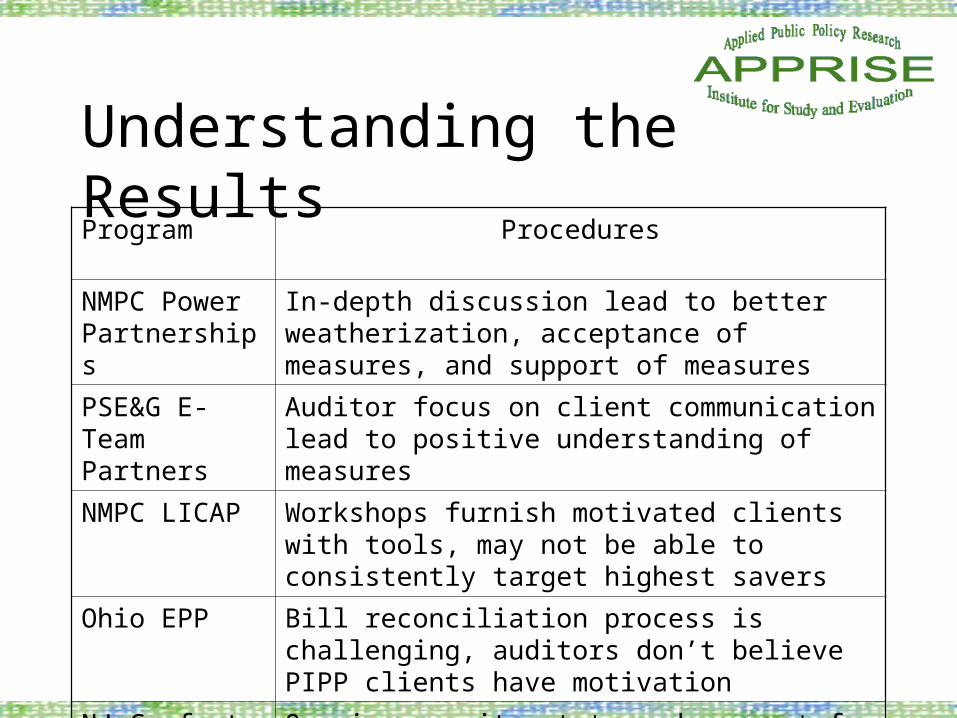
Understanding the ResultsProgram Procedures
NMPC Power Partnerships
In-depth discussion lead to better weatherization, acceptance of measures, and support of measures
PSE&G E-Team Partners
Auditor focus on client communication lead to positive understanding of measures
NMPC LICAP Workshops furnish motivated clients with tools, may not be able to consistently target highest savers
Ohio EPP Bill reconciliation process is challenging, auditors don’t believe PIPP clients have motivation
NJ Comfort Partners
Ongoing commitment to and payment for education leads to constant improvement in attitudes and effectiveness
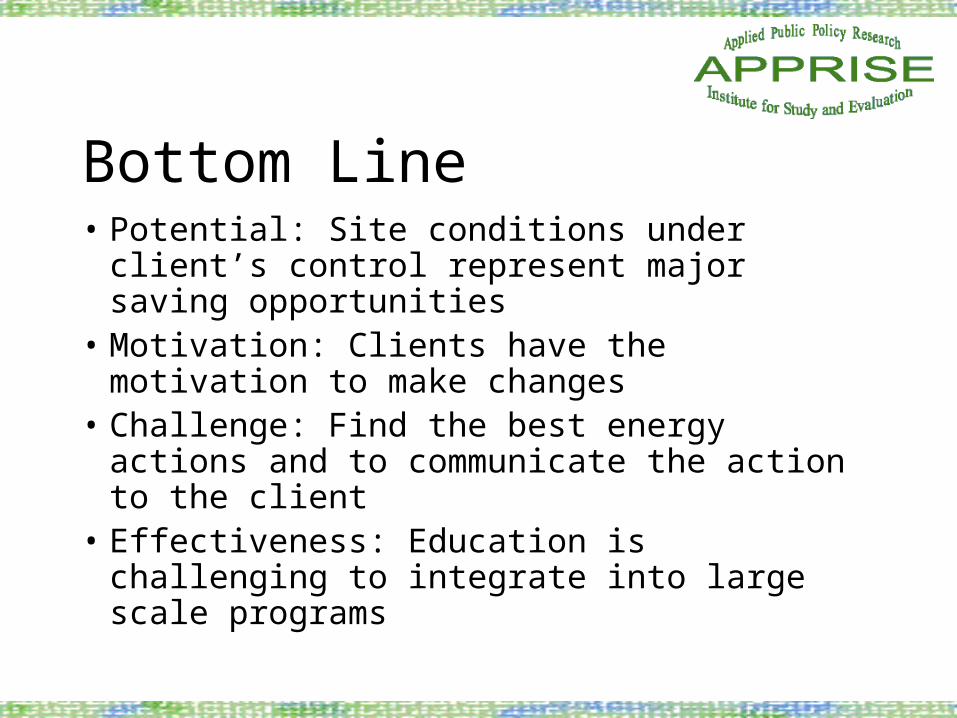
Bottom Line• Potential: Site conditions under client’s
control represent major saving opportunities• Motivation: Clients have the motivation to
make changes• Challenge: Find the best energy actions and
to communicate the action to the client• Effectiveness: Education is challenging to
integrate into large scale programs

Affordability
Who gets the benefits?

Affordability Logic• Arrearage customers fail to pay for 10% to
25% of energy usage.• Weatherization and baseload programs
reduce energy usage by 10% to 25%• Therefore: Usage reduction programs can
make energy affordable, can resolve payment problems, and save collections costs.

Affordability Barrier1996 Study of NMPC LIHEAP Customers
• Half of LIHEAP customers had 60-day arrears
• Many 60-day arrears customers had high energy bills
• BUT – 75% of arrears customers also had problems with other bills

A Design That Worked• Negotiate payments that equaled or exceeded
payments made last year.• Offer arrearage credits for making negotiated
payments• Furnish targeted energy services• Follow-up for missed payments• OUTCOME – On average, customers increased
payment coverage from 75% to 90%.

A Design That Didn’t Work• Furnish energy services
• Assign budget bill that anticipates 10% usage reduction and LIHEAP grant
• Offer arrearage credits for bill payment
• Don’t follow-up missed payments
• OUTCOME – Customers reduced usage and payments, coverage remained at 90%
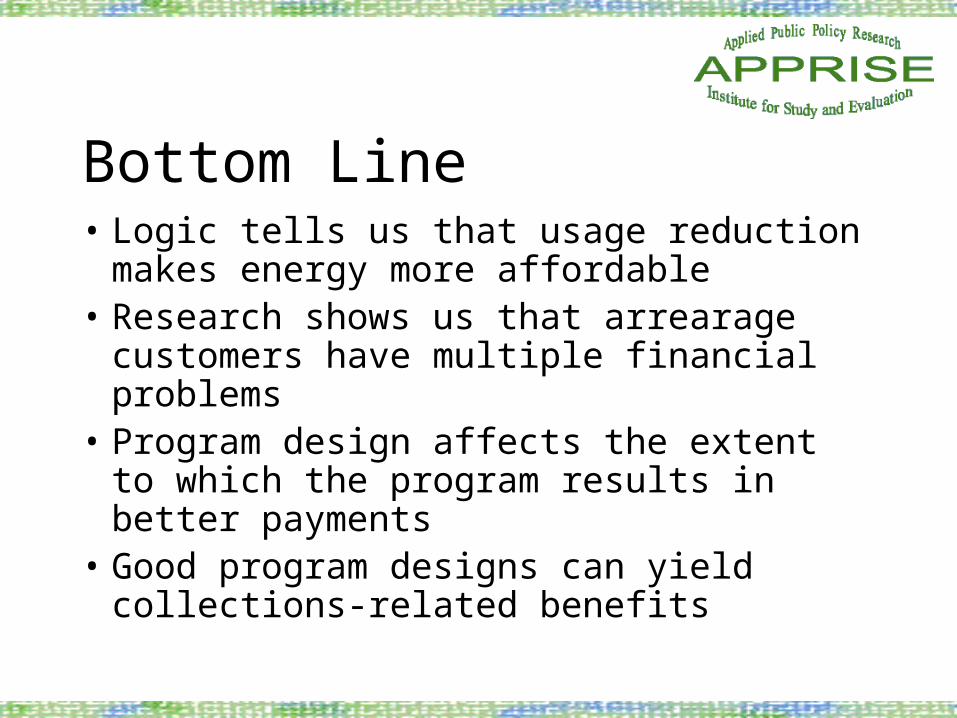
Bottom Line• Logic tells us that usage reduction makes
energy more affordable• Research shows us that arrearage customers
have multiple financial problems• Program design affects the extent to which
the program results in better payments• Good program designs can yield
collections-related benefits
Health and Safety
You can’t take credit for it if you don’t measure it.
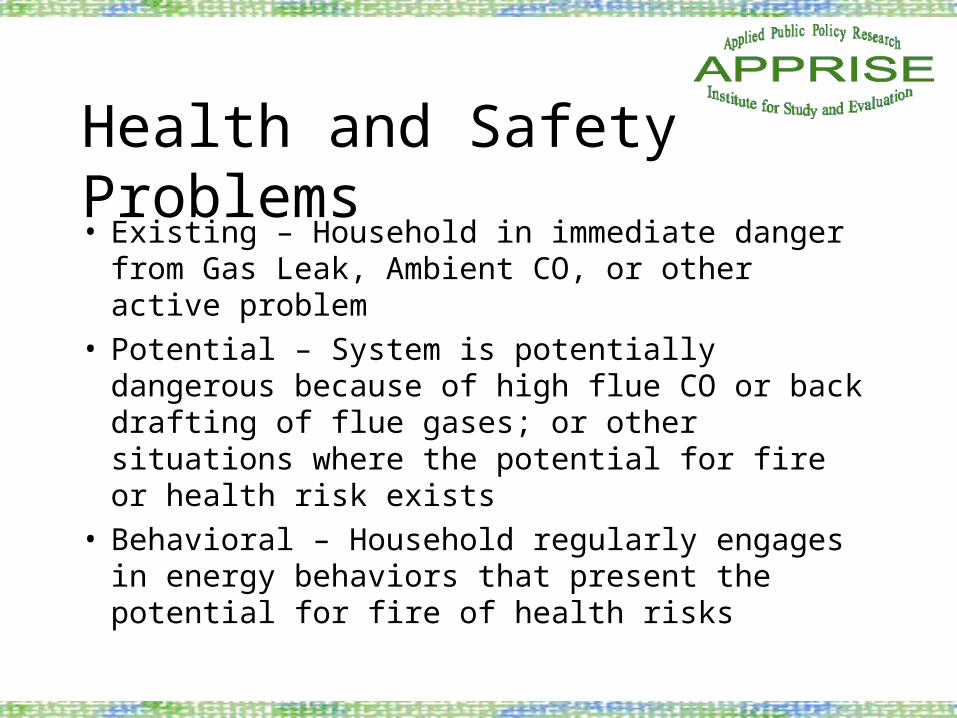
Health and Safety Problems• Existing – Household in immediate danger from
Gas Leak, Ambient CO, or other active problem• Potential – System is potentially dangerous
because of high flue CO or back drafting of flue gases; or other situations where the potential for fire or health risk exists
• Behavioral – Household regularly engages in energy behaviors that present the potential for fire of health risks

E-Team Measurements - 1999Problem Rate Comments
High Ambient CO 1 in 350 18 ppm in basement
High Flue CO 3%-5% >200 ppm in flue
Draft Problems 5%-7% 1%-2% with spillage
Gas Leaks 6%-10% Found at both first and second visit
Hot Water Temps 33% >140 degrees
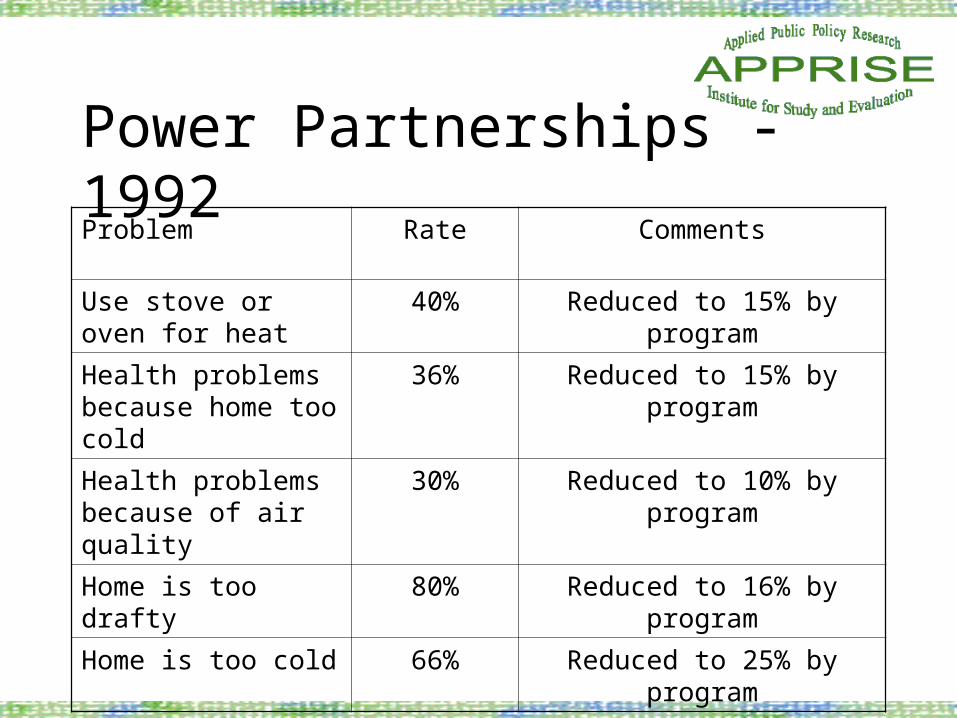
Power Partnerships - 1992Problem Rate Comments
Use stove or oven for heat
40% Reduced to 15% by program
Health problems because home too cold
36% Reduced to 15% by program
Health problems because of air quality
30% Reduced to 10% by program
Home is too drafty 80% Reduced to 16% by program
Home is too cold 66% Reduced to 25% by program
Measurement
• E-Team: H&S measurements recorded in database. Detailed analysis of data collection forms for problem homes. Supplemental sample of forms to check for data not entered into database.
• Power Partnerships: Random assignment to test and control groups. Post treatment survey with clients.

Bottom Line• Health and safety opportunities exist
• The incidence can and should be measured
• Low rate of serious problems
• Moderate rate of potential problems
• High rate of behavioral problems
• Challenging to quantify value and get funding support


