21 R&D Review of Toyota CRDL Vol. 40 No. 3 Measurement and Estimation Technologies for the Experimental Analysis of Metal V-belt Type CVTs Hiroyuki Yamaguchi, Hirofumi Tani, Kisaburo Hayakawa Research Report Abstract CVT CVT This paper outlines measurement and estimation technologies necessary for solving metal V-belt CVT issues. These technologies examine the detailed behavior of the working belt. The test apparatus consists of a low inertia dynamo with high response that can reproduce the transitional characteristic similar to engines. To analyze power transmission characteristics, we construct a measurement technology that clarifies the transitional characteristic and transmission performance around the marginal torque of the belt. In addition, we construct estimation technologies as a substitute for the measurements of working belt behavior, which is difficult to measure in an actual system. In this paper, we discuss cases of a special experimental technology for metal V-belt type CVTs. CVT Keywords CVT, Metal V-belt, Friction characteristic, Working state, Measurement, Observer, Low inertia dynamo Special Issue Basic Analysis Towards Further Development of Continuously Variable Transmissions
Transcript
21
R&D Review of Toyota CRDL Vol. 40 No. 3
Measurement and Estimation Technologies for the ExperimentalAnalysis of Metal V-belt Type CVTs
This paper outlines measurement andestimation technologies necessary for solvingmetal V-belt CVT issues. These technologiesexamine the detailed behavior of the workingbelt. The test apparatus consists of a low inertiadynamo with high response that can reproducethe transitional characteristic similar to engines.To analyze power transmission characteristics, weconstruct a measurement technology that clarifies
the transitional characteristic and transmissionperformance around the marginal torque of thebelt. In addition, we construct estimationtechnologies as a substitute for the measurementsof working belt behavior, which is difficult tomeasure in an actual system. In this paper, wediscuss cases of a special experimentaltechnology for metal V-belt type CVTs.
CVT
Keywords CVT, Metal V-belt, Friction characteristic, Working state, Measurement, Observer, Low inertia dynamo
Special Issue Basic Analysis Towards Further Development of Continuously Variable Transmissions
R&D Review of Toyota CRDL Vol. 40 No. 3
1. Introduction
The metal V-belt CVT has gained popularity as ameans of reducing fuel costs. Issues confrontingCVTs is to approach an ideal power transmissionmechanism through improvements in transferefficiency, torque capacity, durability, and quietnessthat would make the CVT superior to conventionalAT. Solutions to these issues require the analysis ofthe power transmission characteristics of the belt,and various belt behavior measurements havealready been examined. However, as theunderstanding of working belt behavior advances, amore detailed analysis of working belt behavior isneeded.
In response to this need, this paper presents a newtest apparatus and new technologies for measuringand estimating belt behavior. We first discuss thelow inertia dynamo with high response, which canreproduce the transitional characteristics similar toengines. Next, with regard to the analysis of torquetransmission mechanism, we discuss a method formeasuring element strain that uses sensing parts todetect load and minute behavior. We then discuss amethod for measuring the pitch radius of a pulley.This method, which measures the pitch radius evenduring changes in the speed ratio, is needed for themeasurement of the friction characteristic betweenthe pulley and the belt. We also discuss estimationtechnologies for belt velocity and the marginal
performance of transmission torque. Thesetechnologies are necessary to examine the beltmarginal performance, which is difficult to measurein actual systems.
2. Driving apparatus (low inertia dynamo)
A low inertia dynamo that can reproduce anengine was used to research a static maximumfriction coefficient and a dynamic friction coefficientfor the input torque and belt slip velocity in a CVT.1, 2)
Table 1 shows the specification. The moment ofinertia of the dynamo is appropriate for a mid-levelengine. As shown in Fig. 1, the low inertia dynamosystem consists of a control board that drives thedynamo, which is connected to both ends of thetransmission, and a control system for inputtingcommands to the control board. The control systemeasily reproduces the driving conditions of enginesbecause it is configured from the general-purposecontrol system design software Matlab/Simulink.Because the dynamo torque control is feed-forwardof the command current through high-speed digitalcommunication, the maximum response frequencyof the torque is 500 Hz, as shown in Fig. 2.Moreover, the speed response of the low inertiadynamo surpasses that of conventional dynamos toan extent that allows it to follow changes in thetarget rotating speed of about 8000 rpm at around 10Hz and of 1000 rpm below 1 Hz, as shown in Fig. 3.
The following describes examinations of the CVTthat take advantage of the high response of the lowinertia dynamo. As shown in Fig. 4, the testapparatus cordons off space for the pulley, the belt,and the box, and facilitates the installation of
22
Control Board
Fig. 1 Dynamo control system.
Type Three-phase induction motor
Output power 220kW
Moment of inertia 0.098kgm2
Rated speed 6000rpm
Max speed 8000rpm
350Nm (Constant@6000rpm)
550Nm (60 seconds@6000rpm)Allowable torque
Table 1 Specification of low inertia dynamo.
sensors. A primary pulley and asecondary pulley are connected to thelow inertia dynamo and to an absorbingdynamo, respectively. The former iscontrolled by torque, the latter byrevolution speed. Both pulleys aremade movable by controlling oilpressure. The transmitting torque andthe speed ratio are controlled by servovalves. An example of measuring themaximum friction coefficient of the beltis shown in Fig. 5. Input torque isincreased gradually while keeping thespeed ratio and the clamping force ofthe secondary pulley constant. Thebeginning of a macro slip (large beltslip) is detected when the slip ratiosuddenly increases. Shortly thereafter,the input torque can be rapidly
decreased to prevent persistence of the macro slip.The relation between a macro slip and the inputtorque near the belt slip limit is shown in Fig. 5.While the amplitude of input torque vibration isgradually increased at a constant speed ratio, inputtorque, and speed ratio, the input torque suddenlychanges near the black line in Fig. 5 and macro slipoccurs. From this point, it is possible to find a sliplimit for the input torque. It can be expected that thefriction characteristic, the transmission efficiencycharacteristic, and the stress characteristic under
23
R&D Review of Toyota CRDL Vol. 40 No. 3
Frequency [Hz]
Frequency [Hz]
Phas
e [d
eg]
Mag
nitu
de [d
B]
Fig. 2 Torque response of low inertia dynamo.
Hydraulic sensor
Metal belt
Primary
Revolutionspeed pickup
Low inertiadynamo
Absorbingdynamo
Secondary Torque meter
Speed ratio
Clamping force Controllercontrol
control
Torque control
Revolution speed control
Fig. 4 Schematic of test apparatus.
Conventional
Low Inertia Dynamomete
Cha
nge
of S
peed
[min
-1]
Conventional
Cha
nge
of sp
eed
[min
-1]
Frequency [Hz]
Low inertia dynamo
Fig. 3 Speed response of low inertia dynamo.
110
140
20 4 60
0.4
Torq
ue [
Nm
]B
elt
Slip
vel
ocity
[m
/s]
Maximum point of belt slip
Time [s]
Input torque
Output torque
Primary Secondary
Primary Secondary
Rapidly decreaseof input torque
µ
µ µ
Fig. 5 Friction coefficient at a belt slip limit.
dynamic behavior, which hitherto have not beenclearly understood (for example, changes in inputtorque and in speed), will be clarified.
3. Measurement technology
3. 1 Belt element strain measurementWith an understanding of the load that acts on the
each element part during one belt rotation cycle, themeasurement of belt element strain is an effectivemeans for analyzing the torque transmissionmechanism and for estimating element strength. Inaddition, it is possible to use strain to examineminute movements (for instance, interference in thenose during element alignment and posture changein the pulley) by examining strain of themeasurement part.
The usual methods for measuring strain in arotating body are wired measurement using a slipring and wireless measurement using a telemeter.For the following reasons, we used the new data-logger system3) to measure element strain. First, theeffect on object behavior is small, and high-speedmeasurements can be made because the system iswireless and light (approximately 5g). Second,installation of a slip ring or an antenna is notrequired, and measurements can be made asnecessary in actual transmissions.
The measurement system employing a strainsensor and the data-logger system is shown in Fig. 6.The strain sensor has a slit around the nose of the
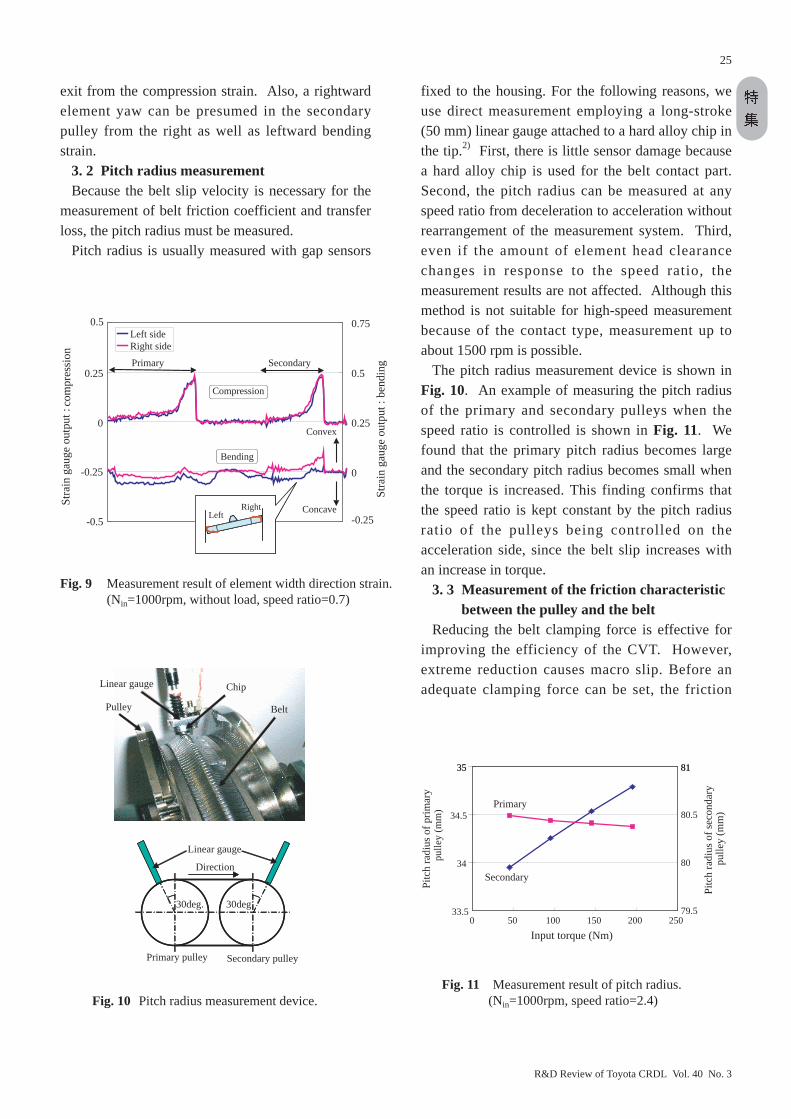
element to enable measurement of the load acting onthe nose. As an example, Fig. 7 shows the results ofa measurement at deceleration. In the string ofcompression area in this figure, the compressionload characteristic of the push type belt is confirmed.Also in this figure, interference in the nose isconfirmed at the starting point and the terminal onthe string of slack area. Figure 8 shows the strainsensor in which gauges are placed on the right andleft and on the inside and outside to measurecompression and bending that act on the direction ofthe element width. The result of the accelerationmeasurement is shown in Fig. 9. A large clampingforce can be presumed in the vicinity of the pulley
24
R&D Review of Toyota CRDL Vol. 40 No. 3
Top
Back
Gauges
Gauges
Right
RightLeft
Left
Fig. 8 Width direction load sensor.
-20
-10
0
10
20
Nos
e pr
essi
ng fo
rce
(N)
SecondaryPrimaryCompression side Slack side
Compression force Nose interference
Fig. 7 Measurement result of element nose strain.(Nin=500rpm, Tin=150Nm, speed ratio=2.4)
Battery
Data-logger
Sensor
SlitGauges
Nose
Fig. 6 Nose load sensor and data-logger system.
exit from the compression strain. Also, a rightwardelement yaw can be presumed in the secondarypulley from the right as well as leftward bendingstrain.
3. 2 Pitch radius measurement Because the belt slip velocity is necessary for the
measurement of belt friction coefficient and transferloss, the pitch radius must be measured.
Pitch radius is usually measured with gap sensors
fixed to the housing. For the following reasons, weuse direct measurement employing a long-stroke(50 mm) linear gauge attached to a hard alloy chip inthe tip.2) First, there is little sensor damage becausea hard alloy chip is used for the belt contact part.Second, the pitch radius can be measured at anyspeed ratio from deceleration to acceleration withoutrearrangement of the measurement system. Third,even if the amount of element head clearancechanges in response to the speed ratio, themeasurement results are not affected. Although thismethod is not suitable for high-speed measurementbecause of the contact type, measurement up toabout 1500 rpm is possible.
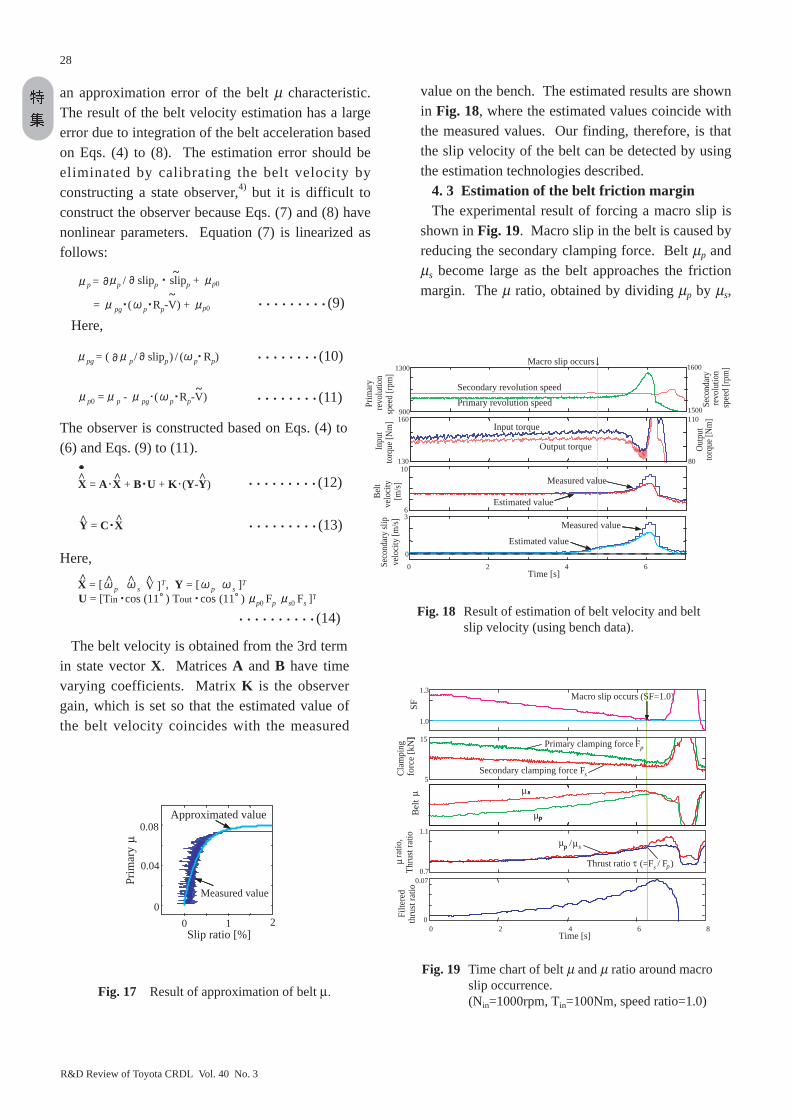
The pitch radius measurement device is shown inFig. 10. An example of measuring the pitch radiusof the primary and secondary pulleys when thespeed ratio is controlled is shown in Fig. 11. Wefound that the primary pitch radius becomes largeand the secondary pitch radius becomes small whenthe torque is increased. This finding confirms thatthe speed ratio is kept constant by the pitch radiusratio of the pulleys being controlled on theacceleration side, since the belt slip increases withan increase in torque.
3. 3 Measurement of the friction characteristic between the pulley and the belt
Reducing the belt clamping force is effective forimproving the efficiency of the CVT. However,extreme reduction causes macro slip. Before anadequate clamping force can be set, the friction
25
R&D Review of Toyota CRDL Vol. 40 No. 3
33.5
34
34.5
35
0 50 100 150 200 250Input torque (Nm)
Pitc
h ra
dius
of p
rimar
y
79.5
80
80.5
81
Pitc
h ra
dius
of s
econ
dary
pulle
y (m
m)
Primary
35
pulle
y (m
m)
81
Primary
Secondary
Fig. 11 Measurement result of pitch radius.(Nin=1000rpm, speed ratio=2.4)
Linear gauge
30deg. 30deg.
Belt
Direction
Chip
Primary pulley Secondary pulley
Linear gauge
Pulley Belt
Chip
Fig. 10 Pitch radius measurement device.
-0.5
-0.25
0
0.25
0.5
Stra
in g
auge
out
put :
com
pres
sion
-0.25
0
0.25
0.5
0.75
Stra
in g
auge
out
put :
ben
ding
Left sideRight side
Primary Secondary
Convex
Concave
Compression
Bending
LeftRight
LeftRight
Fig. 9 Measurement result of element width direction strain.(Nin=1000rpm, without load, speed ratio=0.7)
characteristic between the pulley and the belt and thetorque margin of the belt must be understood. Inaddition, the belt is subject to being overpowered bydisturbance torque such as engine cyclic torquefluctuations or by tire torque on an uneven road.Accordingly, the effects of the disturbance torque onthe friction characteristic must also be understood.The following describes the characteristic of the beltfriction coefficient (referred to hereafter as belt µ)according to the static input torque and the torquefluctuations.
Belt µ and slip velocity between the pulley and thebelt are calculated as follows:
where the following variables are used:T : Given torque for pulley [Nm]θ : Flank angle of pulley [deg]2 : Number of pulley faces contacting beltR : Pitch radius of pulley [m]F : Clamping force of pulley [N]ω : Revolution speed of pulley [rad/s]V : Belt velocity [m/s]
The suffixes p and s indicate primary and secondary.In Eqs. (1) to (3), torque is measured by a torque
meter, rotation speed is measured by revolutionpick-up, and the radius pitch of belt is measuredusing the method described earlier. The clampingforce is obtained from compensation of thecentrifugal hydraulic pressure for the measuredvalue from the hydraulic pressure sensor. Beltvelocity is obtained from measurement of the beltcyclic time using the response of a gap sensor on ametal chip attached to the ear part of a belt element.The result of measuring static belt µ (slip sidepulley) is shown in Fig. 12. This result is obtainedby increasing the input torque while keeping thespeed ratio and secondary clamping force constant.The relation between slip velocity and belt µ foreach speed ratio is shown in Fig. 13. As shown inthe figure, the slip velocity becomes large and thebelt µmax becomes small at γ = 2.30 (high speedratio).
A method for investigating belt slip by inputtorque fluctuations is shown in Fig. 14. Theamplitude of the vibration torque gradually increasesuntil macro slip occurs. The secondary clampingforce is set just enough for average torque. Theexperimental parameter is vibration frequency. Theratio of the vibration amplitude to the average torquewhen macro slip occurs is shown in Fig. 15. Thetorque margin for macro slip becomes large as thefrequency and the revolution speed become high.
4. Estimation technology
The motions of the working belt should beinvestigated not only in the CVT but also in avehicle. However, it is difficult to put avehicle on the sensors described above. This
26
R&D Review of Toyota CRDL Vol. 40 No. 3
0.01 0.1 10.8
1.0
Belt slip velocity ∆v [m/s]
=0.65
=1.50
=2.30
max
*(=
max
/m
axat
γ=0
.65)
µ
γµ
γ
γ
µ
µ
Fig. 13 Relation between slip velocityand belt µ.(Nin =1000rpm, Tin =100Nm)
Fig. 12 Measurement result of static belt µ.(speed ratio=0.65, Nin=1000rpm)
section describes estimation methods that can besubstituted for measurements. There are twomethods: one for estimating belt velocity in thecalculation of belt slip velocity and the other forestimating the friction margin of the belt in the
analysis of the friction characteristic.4. 1 Sensors usedThe sensors used to make the estimations are
hydraulic pressure sensors and revolution speedsensors. The input torque signal is estimated usingthe throttle opening, vehicle speed, and air-fuel ratioinstead of torque sensing. The estimated torque hasan approximate error of 10%. The output torquesignal is obtained as the product of the estimatedtorque and the speed ratio. The pitch radius of thepulleys are determined by the center distance, beltlength, and speed ratio.
4. 2 Estimation of belt velocityThe belt velocity is estimated by using a physical
model that describes the balance between beltfriction forces and torque (Fig. 16). The belt mass isdriven by the difference of the friction force betweenthe two pulleys. The motion is expressed as follows:
• • • • • • (4)
• • • • • • (5)
• • • • • • (6)
In the equations, the symbols ~ and ^ indicateunknown parameters and estimated values,respectively. The differential term of the beltvelocity is included on the left side of Eq. (6).Equations (4) to (6) are the basic equations for theestimation. By reducing the number of unknownparameters the accuracy of the estimation can beimproved. The friction characteristic is used as anapproximated characteristic in the followingequation:
• • • • • • • (7)
Here,
• • • • • • • (8)
Although Eqs. (7) and (8) apply to the primarypulley, they are the same for the secondary pulley.The result of the approximation using Eq. (7) isshown in Fig. 17, and nearly coincides with the truecharacteristic of belt µ shown in Fig. 17. Equations(4) to (6) schematically express the motion betweenthe belt and the pulleys, and Eqs. (7) and (8) include
slipp = ( p Rp - V) / p Rp) ~~
p= p max (1- exp (- p slipp )) ~
M V = 2 p Fp -2 s Fs ~ ~~
Js s = 2 s Fs Rs - Tout cos (11 ) ~ ^
Jp p = -2 p Fp Rp + Tin cos (11 ) ~ ^
27
R&D Review of Toyota CRDL Vol. 40 No. 3
Secondary
M 2 F2 s
Primary
+
Rp
Tin, p
Slip ratio
Prim
ary
p+
Rs
Slip ratioSeco
ndar
y
Inertia J s Inertia J p
M 2
+
R
p
p+
R
Inertia J
s
Inertia J
Tout,
Belt massV
F
µ µ
µ
µ
ω
p
ps
s
s s
ω
µp
Fig. 16 Model based on belt velocity estimation.
0 20 40 60 80Rate
of a
mpl
itude
Ta /
Tav
e[%
]
0
20
40
60
80
100
Torque oscillating frequency [Hz]100
Nin = 2000rpm
Nin =1000rpm
Experimental result
Fig. 15 Ratio of vibration amplitude to the averagetorque at macro slip occurrence.(Tave = 100Nm, speed ratio = 0.65)
time [s]
Tave
Ta
Drive side (Torque control)
Belt slip speed
µ
Absorbing side
Friction characteristics
(Rotation speed control)
[rad
/s] constant
time [s]
Tin
Tout
Primary pulley
Secondary pulley(Fs = constant)
Increasing
Tin
[Nm
]
]ω
s
ωs
ωp
Fig. 14 Method to investigate belt slip by input torquefluctuations.
an approximation error of the belt µ characteristic.The result of the belt velocity estimation has a largeerror due to integration of the belt acceleration basedon Eqs. (4) to (8). The estimation error should beeliminated by calibrating the belt velocity byconstructing a state observer,4) but it is difficult toconstruct the observer because Eqs. (7) and (8) havenonlinear parameters. Equation (7) is linearized asfollows:
• • • • • • • • • (9)Here,
• • • • • • • • (10)
• • • • • • • • (11)
The observer is constructed based on Eqs. (4) to(6) and Eqs. (9) to (11).
• • • • • • • • • (12)
• • • • • • • • • (13)
Here,
• • • • • • • • • • (14)
The belt velocity is obtained from the 3rd termin state vector X. Matrices A and B have timevarying coefficients. Matrix K is the observergain, which is set so that the estimated value ofthe belt velocity coincides with the measured
X = [ p s V ]T, Y = [ p s ]T
U = [Tin cos (11 ) Tout cos (11 ) p0 Fp s0 Fs ]T
^ ^^ ^
Y = C X ^ ^
X = A X + B U + K (Y-Y)^ ^ ^
p0 = p - pg ( p Rp-V) ~
pg = ( p / slipp) / ( p Rp)
p = p / slipp slipp + p0
= pg ( p Rp-V) + p0
~
~
value on the bench. The estimated results are shownin Fig. 18, where the estimated values coincide withthe measured values. Our finding, therefore, is thatthe slip velocity of the belt can be detected by usingthe estimation technologies described.
4. 3 Estimation of the belt friction margin The experimental result of forcing a macro slip is
shown in Fig. 19. Macro slip in the belt is caused byreducing the secondary clamping force. Belt µp andµs become large as the belt approaches the frictionmargin. The µ ratio, obtained by dividing µp by µs,
28
R&D Review of Toyota CRDL Vol. 40 No. 3
Primary clamping force Fp
5
15
Clam
ping
forc
e [k
N]
0.7
1.1
ratio
, Th
rust
ratio
0
0.07
Filte
red
thru
st ra
tio
0 2 4 6 8Time [s]
1.0
1.3
SF
Macro slip occurs (SF=1.0)
p /
Thrust ratio (=Fs / Fp)
Secondary clamping force Fs
s
p
Bel
t ]
p s
s
p
s
pµ
τ
µ
µ
µ
µ
µ
Fig. 19 Time chart of belt µ and µ ratio around macroslip occurrence.(Nin=1000rpm, Tin=100Nm, speed ratio=1.0)
6
10
1500
1600
900
1300
130
160
80
110
Measured value
Estimated value
Measured value
Estimated value
Belt
velo
city
[m/s]
0 2 4 6
0
3
Seco
ndar
y sli
pve
locit
y [m
/s]
Time [s]
Macro slip occursPr
imar
yre
volu
tion
spee
d [rp
m]
Seco
ndar
y re
volu
tion
spee
d [rp
m]
Inpu
t to
rque
[Nm
]
Outp
ut
torq
ue [N
m]
Primary revolution speed
Secondary revolution speed
Input torque
Output torque
Fig. 18 Result of estimation of belt velocity and beltslip velocity (using bench data).
0 1 20
0.04
0.08
Slip ratio [%]
Prim
ary
Approximated value
Measured value
µ
Fig. 17 Result of approximation of belt µ.
also becomes large because there is a difference ofcharacteristic between belt µp and µs . The macroslip can be forecast by monitoring the increase ofbelt µ or the µ ratio. Belt µ monitoring cannot beused because belt µ is calculated using the torquemeasurement value. However, the µ ratio can becalculated as the ratio of the clamping force of bothpulleys without torque. The µ ratio can be obtainedfrom deformation of Eq. (1), as follows:
• • • • • • • (15)
Here, η is the torque transmitting efficiency, and itsvalue is assumed to be 1.0. Using the relation Rs = γ .Rp,Eq. (15) can be transformed as follows:
• • • • • • • • • • (16)
The ratio of clamping forces is defined as thrustratio τ. Thrust ratio τ coincides with the µ ratio untilmacro slip occurs. Thrust ratioτ is treated by aband-pass filter because its steady-state valuechanges due to the belt working condition. FromFig. 19, it can be determined by monitoring of thefiltered value of the thrust ratioτ that the belt frictionis at the end of the margin.
5. Conclusion
(1) We used a test apparatus consisting of a lowinertia dynamo and various belt measurementtechnologies. The belt behavior in its actualworking conditions has been clarified, and the datanecessary for the analysis of power transmissioncharacteristics have been obtained.
(2) The application of a state estimationtechnology has been examined for belt behavior,which is difficult to measure when a vehiclerunning. The result is that it is clear that the beltvelocity and the friction margin of the belt can beestimated, and that the technology can be used as atool for effective analysis in actual systems.
µ / µ F / F τp p ss
Tin
Tout Tin
Tin
2 s R F2 p R F
= = s
p
s
p
References
1) Yamaguchi, H., et al. : "Development of BeltSaturation Detection Method for V-Belt Type CVT",SAE Tech. Pap. Ser., No.2004-01-0479(2004)
2) Nishizawa, H., et al. : "Friction CharacteristicsAnalysis for Clamping Force Setup in Metal V-BeltType CVT", SAE Tech. Pap. Ser., No.2005-01-1462(2005)
3) Kimura, M. : "An Ultra-small Sized Data-loggerSystem for High-speed Rotation Measurement",Toyota Central R&D Rev., 40-1(2005), 57<http://www.tytlabs.co.jp/japanese/review/rev401pdf/401_057kimura.pdf>
4) Middleton, R. H. and Goodwin, G. C. : DigitalControl and Estimation: A Unified Approach, (1990),Prentice Hall
(Report received on July 12, 2005)
29
R&D Review of Toyota CRDL Vol. 40 No. 3
Hiroyuki YamaguchiResearch fields : Control and state
estimation of power transmissionsystem
Academic society : Jpn. Soc. Mech. Eng.,Soc. Autom. Eng. Jpn.