Date post: | 22-Dec-2015 |
Category: |
Documents |
Upload: | kevin-alexander |
View: | 214 times |
Download: | 0 times |
Measuring Child Poverty
Bob StephensSenior Research Associate,
Institute of Governance and Policy Studies, New Zealand Poverty Measurement Project (NZPMP)Member, Expert Advisory Group, Solutions to Child
Poverty,Office of the Children’s Commissioner
19 September 2012
Lecture Overview
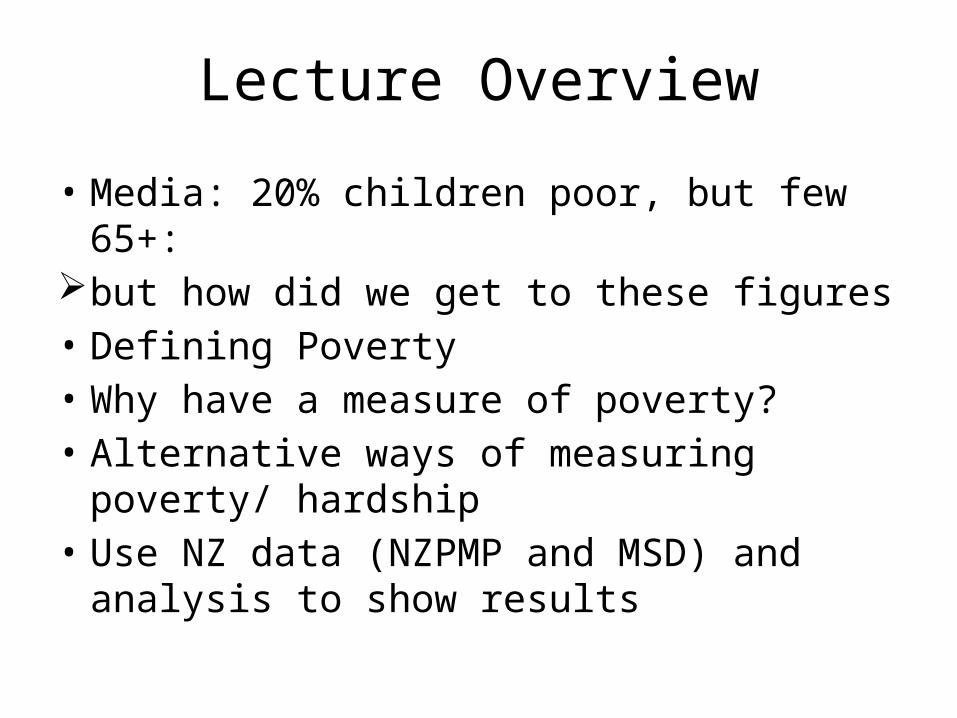
• Media: 20% children poor, but few 65+: but how did we get to these figures• Defining Poverty• Why have a measure of poverty? • Alternative ways of measuring poverty/
hardship• Use NZ data (NZPMP and MSD) and analysis to
show results
Definitions, Quotes• Children living in poverty are those who experience deprivation
of income and material resources to develop and thrive, leaving them unable to enjoy their rights, achieve their full potential and participate as full and equal members of New Zealand society.(EAG,OCC)
• ‘Counting the poor is an exercise in the art of the possible. For deciding who is poor, prayers are more relevant than calculations because poverty, like beauty, lies in the eyes of the beholder’ (Orshansky 1958)
• The afflictions of poverty are not addressed by moving over the threshold, and some people under the poverty threshold are resilient and escape the problems of poverty
• ‘Societies that are more unequal generally have worse social outcomes’ (Wilkinson and Pickert)
• ‘He who has the gold gets to rule; he who rules gets the gold’, (Machiavelli)
The Need for a Poverty Measure• Social commitment to alleviate, provide long-term
solution • Monitor/evaluate impact of policy changes on
standards of living of poor• Another organization will measure• Provide basis for determining adequacy of benefits,
including family assistance• Determine relative incidence, severity and persistent
of poverty among social groups• Mix of cash and in-kind benefits, or adequate wages• Determine causes of poverty to develop long term
policies to reduce incidence, severity and persistence, especially when children become adults
• Calculate costs to government of policies to alleviate and eradicate poverty
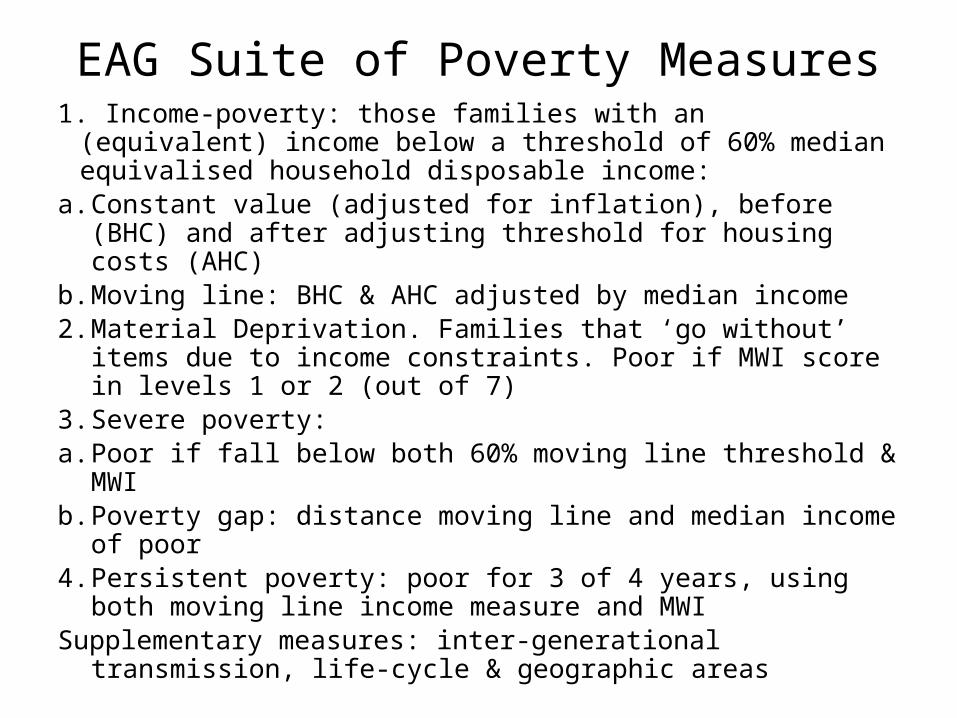
EAG Suite of Poverty Measures1. Income-poverty: those families with an (equivalent) income
below a threshold of 60% median equivalised household disposable income:
a. Constant value (adjusted for inflation), before (BHC) and after adjusting threshold for housing costs (AHC)
b. Moving line: BHC & AHC adjusted by median income2. Material Deprivation. Families that ‘go without’ items due to
income constraints. Poor if MWI score in levels 1 or 2 (out of 7)
3. Severe poverty:a. Poor if fall below both 60% moving line threshold & MWIb. Poverty gap: distance moving line and median income of poor4. Persistent poverty: poor for 3 of 4 years, using both moving
line income measure and MWISupplementary measures: inter-generational transmission, life-
cycle & geographic areas
Income PovertyIssues: a) Poverty Threshold: *How to set initial income threshold: arbitrary; focus groups on ‘minimum
adequate income’, e.g. adequate nutrition, warm house. - result: 60% median equivalent household disposable income* How to update threshold through time: i. by CPI (constant value), but poor fall behind (reset every 5/10 years?)ii. by median earnings (moving line): maintain real value of threshold, but
in NZ gives ‘wrong’ results: poverty rises in booms, falls recessionsb) Equivalence Scales: adjust for household size – Couple 3 children need
more income than couple to achieve same standard of livingc) Before/after housing costs: housing costs independent of income: 65+
low income, mortgage free, cf. family 3 children, rentingd) Primary/secondary poverty: ‘free’ school mealse) Severity: how far below poverty line, using poverty gapf) Effectiveness of tax/transfer system in reducing market income poverty
2007 Data 60% Moving
Market Income
DisposableIncome
Incidence Effectiveness
Structure: Disposable
Poverty Gap $ H’hold Effect
All People 25.9 18.8 27.4 100.0 $21 79.0All Children 29.6 22.1 25.3 27.8 71.9 Child Couple 22.4 15.2 32.1 11.3 $65 67.8Child Lone Pare 74.8 63.2 15.5 16.5 $80 78.9All Adults 24.9 18.8 28.9 72.2 82.5 Adults 15-64 16.1 13.6 15.5 46.8 55.0 Adults 65+ 72.7 40.7 44.0 25.4 $80 90.5WORKFORCE
Beneficiary/NZS 100.0 86.1 13.9 50.6 $96 82.9Some income + benefits
67.8 25.0 63.1 12.0 $48 87.3
1 Adult, no bene 26.5 18.3 30.9 21.3 $23 48.72 Adults, no bene 5.1 4.2 17.6 8.6 $20 32.03+ Adults, no be 5.4 6.5 -20.4 7.6 $15 32.1
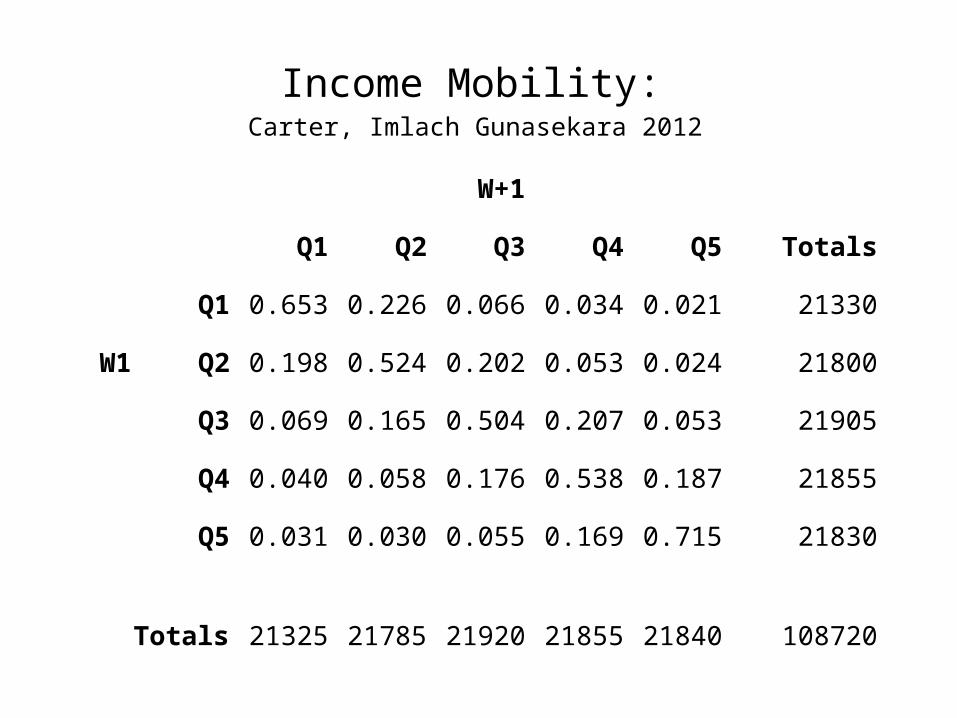
Living Standards (MSD) 2001 & 2004• Only 50% overlap of individuals between income and
MWI, though same groups poor: due to assets, health status, duration of low income, family break-up
• Outcome measure, based on deprivation• Go without due to income constraint, not choice• Items range from necessities to luxuries• Ownership restrictions, social participation,
economising, financial, accommodation • Problems in aggregating separate items to total • 7 groupings, most restrictions poorest
Economising Total 2 Parents + Kids
1 Parent + Kids
65+ 65+ Maori
Less/cheaper meats
23 28 52 36 62
Older clothes 10 11 30 12 30
Postponed doctor visit
8 9 18 8 21
No glasses 5 6 11 10 24
Not got prescription
2 3 7 2 10
Kids share bedroom
- 8 17 - -
Financial Problems
Borrowed money
14 13 27 1 7
Can’t pay utilities
10 12 36 2 11
Relied on charity
5 6 21 0.5 6
Accommodation Problems
Dampness 19 20 19 - -
Plumbing 11 11 12 - -
Roof 12 13 9 - -
32
6
31
5
25
16
33
6
15
24
9
17 17 17
19
10
21
6
28
2 2
26
01
0
7
11
15
0
5
10
15
20
25
30
35
Sole-parent beneficiaries Sole-parent marketincomes
Two-parent beneficiaries Two-parent marketincomes
Family type and income source
Popu
latio
n pe
rcen
tage
MWI: Children in Low cf. High Income Households, 2008. Adapted from Perry (2012)
Low Income Middle Income High Income All children
Help from charity
20% 3% 1% 8(>once)
Dampness, mould
32% 13% 9% 17%
Lack of Heating in main rooms
18% 8% 9% 9%
Postponed child doctor visits
7% 2% 0% 2%
Lack Computer 30% 10% 4% 8%
5. Poverty Dynamics• Persistence: length of time household is in poverty- One year (transient)may have little impact on
outcomes- Some movement in/out of poverty: boundary
hopping, or student into work, or retire. - Over 5 years, 65% remain bottom 20%, only 5% to
top 40% income distribution; - 71% remain in top 20%, 6% to bottom 40% income- But persistent, chronic and permanent - Data: !! SOFIE!!
Income Mobility: Carter, Imlach Gunasekara 2012
W+1
Q1 Q2 Q3 Q4 Q5 Totals
Q1 0.653 0.226 0.066 0.034 0.021 21330
W1 Q2 0.198 0.524 0.202 0.053 0.024 21800
Q3 0.069 0.165 0.504 0.207 0.053 21905
Q4 0.040 0.058 0.176 0.538 0.187 21855
Q5 0.031 0.030 0.055 0.169 0.715 21830
Totals 21325 21785 21920 21855 21840 108720
Number of waves in low incomeCarter, Imlach Gunasekara 2012
0 1 2 3 4 5 6 70
10
20
30
40
50
60
AllAge 0-17
Number of Waves in low income
Perc
enta
ge
Bryan Perry, March 2012
Poverty persistence
Years in poverty 0 1-2 3-4 5-8
Total 68% 21% 8% 5%
With both parents in 2001 73% 18% 4% 4%
With one parent in 2001 44% 26% 21% 9%
OCC EAG
• Australia – HILDA survey, 2001 to 2008• children aged under 12 in wave 1 (2001), 60% BHC … ~18%
• UK – BHPS, 1991 to 2007• children aged under 17 in first wave of the 4• 60% BHC …. ~ 22%
91-94 96-99 00-03 04-07
% in poverty in at least 3 of the 4 years
19% 17% 14% 10%
Inter-generational transference:
• Are children who grow up in poor families more likely to be poor themselves when adults?
• Limited NZ data: Dunedin and Christchurch cohort studies have poor income data
• Limited inter-generational mobility – about ½ children remain in same income bracket as parents
• Less mobility for parents with low education, teenage parenting, unemployment -> poorer child performance
Bryan Perry, March 2012OCC EAG
Which trajectory?
0
20
40
60
80
100
0 1 2 3 4 5 6 7 8Year
Po
pu
lati
on
inco
me
per
cen
tile
on and off benefit
benefit to low paid work
benefit to 'good job'
relationship breakdown, trauma, child-care
Poverty line
Incidence of Income-Poverty, Relative and Constant-Value
0.0
5.0
10.0
15.0
20.0
25.0
1984 1986 1988 1989 1990 1991 1992 1993 1994 1995 1996 1997 1998 2001 2004 2007
Inci
denc
e %
50% 60% Constant-value
Labour National Labour-led
Comparison Constant Value and Relative Value Measures of Poverty, New Zealand, 1984-2007
19841986
19881989
19901991
19921993
19941995
19961997
19982001
20042007
0
10
20
30
40
50
60
70
Constant Value Poverty, 1993
Children Child Sole Parent Child CoupleAdults 65+ People
19841986
19881989
19901991
19921993
19941995
19961997
19982001
20042007
0
10
20
30
40
50
60
70
80
Relative Value Poverty 60%
All children Child Sole Parent Child CoupleAdults 65+ People
COUNTRY POPULATION CHILDREN ADULTS 65+Circa 2010 50% 60% 50% 60% 50% 60%OECD/EU average
11 16 12.3 20 15.1 18
New Zealand – Moving Line
11.0 18 12.2 20 23.5 36
-CV (1993 base) 8.2 12.9 3.9Australia 14.6 20 14.0 22 39.2 45UK 11.3 17 13.2 21 12.2 22USA 17.3 24 21.6 29 22.2Canada 11.4 20 14.8 25 4.9Ireland 9.8 15 11.0 19 13.4 17Germany 8.9 16 8.3 15 10.3 15Sweden 8.4 13 7.0 13 9.9 18Netherlands 7.2 11 9.6 15 1.7 8Spain 13.7 20 17.2 24 20.6 25Italy 11.4 18 15.3 24 8.9 20Czech 5.4 9 8.8 13 3.6 7
MAORI HOUSEHOLDS - 1993Minimum Adequate H’d Exp Fair Adeq
Participation 2 Adults + 3C 1 Adult +2C 2 Adults + 3C$ % $ % $ %
• Food 100 21.0 70 18.7 150 23.7 • H’hold Op 10 2.1 10 2.7 25 3.9• Housing 150 31.6 150 40.1 150 23.7• Power 30 6.3 20 5.3 30 4.7• Phone 11 2.4 11 3.0 11 1.6• Transport 40 8.4 30 8.0 58 9.1• Activities/Rec 15 3.2 10 2.7 38 6.0• Insurance 12 2.4 12 3.1 13 2.1• Life Insurance 20 4.2 15 4.0 20 3.2• Exceptional 10 2.1 10 2.7 25 4.0• Appliances 10 2.1 4 1.0 19 3.0• Furniture 9 2.0 4 1.0 19 3.0• Medical 15 3.2 5 1.3 15 2.3• Clothing/Foot 38 7.9 20 5.3 48 7.6• Education 6 1.2 4 1.1 12 1.8
TOTAL 475 100.0 374 100.0 634 100.0
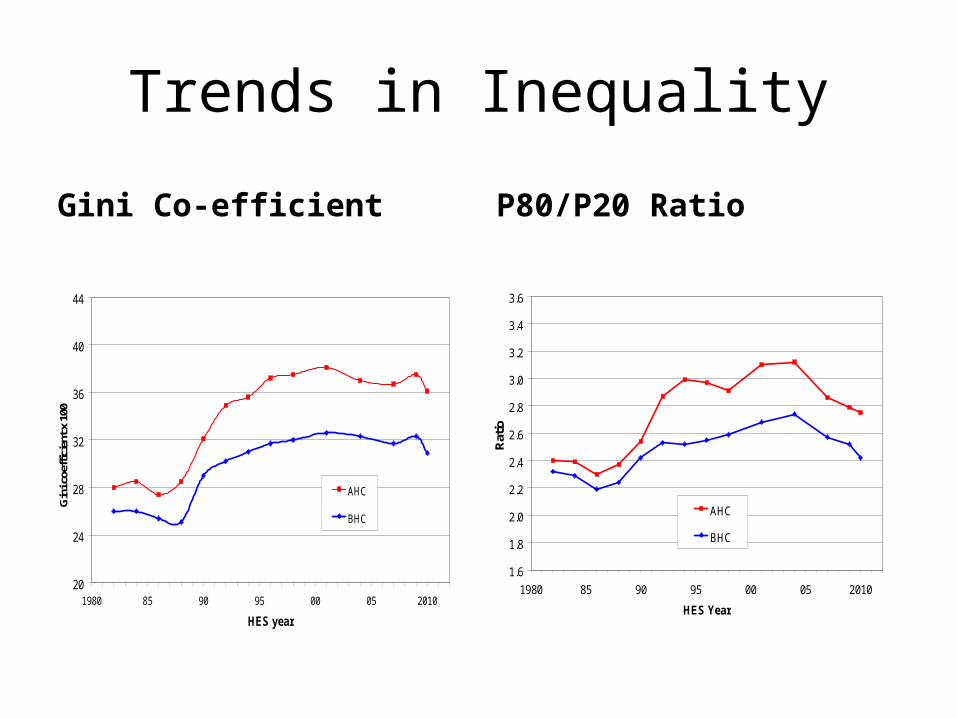
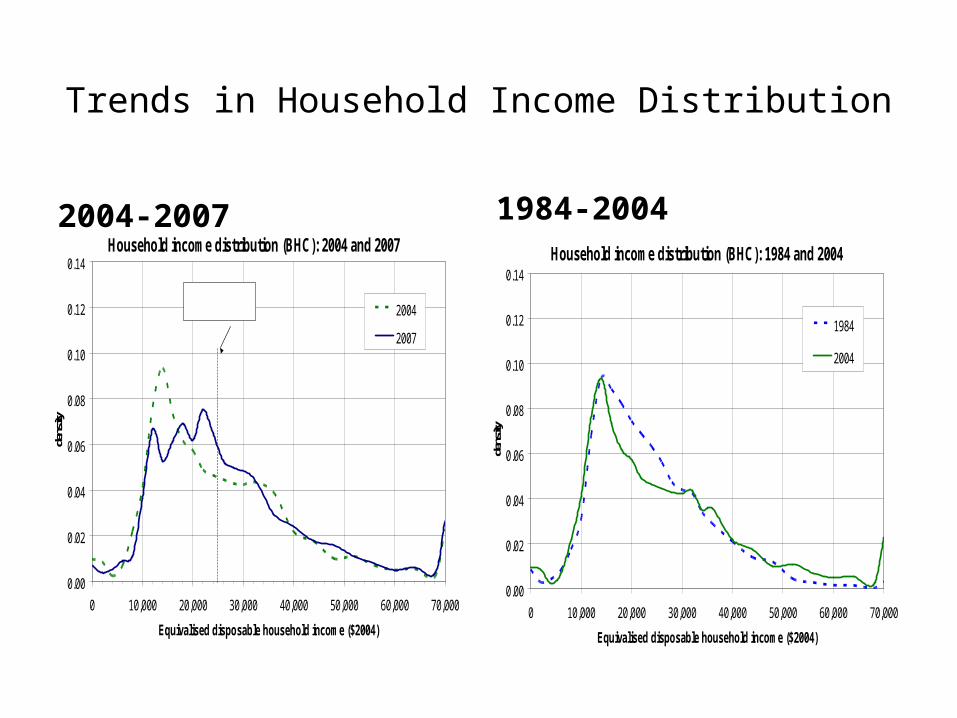
Trends in Inequality• NZ largest increase inequality 1984-2000, then flat, fall with full
employment, Working for Families• Measures: Gini Co-efficient, P80/P20CAUSES• Tax cuts: 1986 [66%->48% then 33%], but base broadening, GST;
2000 39%, 2009 33%• Rise in proportion dual income households• Benefit cuts 1991 – 5% IB, 15+% UB• Post 1991, fall benefit level [CPI] cf. average earnings:• Employment trends: benefit numbers increase 1984-1997; fall to
2008; post 2008 rise• Increasing wage inequality, esp. at top• Working for Families: FTC, back to 1986 level, IWTC• Globalisation, market liberalisation, change views on ethics
Real household income trends (BHC), 1982 to 2011 ($2011)
0
10
20
30
40
50
60
70
1980 1985 1990 1995 2000 2005 2010HES Year
Eq
uiv
HH
dis
p in
com
e in
$20
10 (
000s
)
P10
P30
P20
P80
P70
P60
P50
P40
P90
Trends in InequalityBy Household Type
0
10
20
30
40
50
60
1980 1985 1990 1995 2000 2005 2010
HES year
Equi
valis
ed H
H inc
ome i
n $2
010 (
000s
)
Couple <65
Single <65
TOTAL
2P + deps
SP+ deps
By Ethnicity
0
10
20
30
40
1986 88 90 92 94 96 98 00 02 04 06 08 10 2012
HES Year
Equi
valis
ed H
H in
com
e in
$201
0 (00
0's)
European
Overall
Maori
Pacific
Other
Trends in Inequality
Gini Co-efficient
20
24
28
32
36
40
44
1980 85 90 95 00 05 2010
HES year
Gin
i coe
ffici
ent x
100
AHC
BHC
P80/P20 Ratio
1.6
1.8
2.0
2.2
2.4
2.6
2.8
3.0
3.2
3.4
3.6
1980 85 90 95 00 05 2010
HES Year
Rat
ioAHC
BHC
Poverty Incidence – Before/After Housing Costs (%)
People Adults 16-64
Adults 65+
Children
Before Housing Costs
19.7 15.0 40.2 22.4
After Housing Costs
21.3 18.8 25.3 26.2
Poverty before/after Housing Costs – tenure type
Owned Mortgage
Owned No mortgage
Rent HNZC
Rent Private
Before Housing Costs
9.2 23.8 58.1 25.1
After Housing Costs
14.2 15.2 54.6 33.8
Trends in Household Income Distribution
2004-2007Household income distribution (BHC): 2004 and 2007
0.00
0.02
0.04
0.06
0.08
0.10
0.12
0.14
0 10,000 20,000 30,000 40,000 50,000 60,000 70,000
Equivalised disposable household income ($2004)
dens
ity
2004
2007
+-
2007 median in $2004
1984-2004Household income distribution (BHC): 1984 and 2004
0.00
0.02
0.04
0.06
0.08
0.10
0.12
0.14
0 10,000 20,000 30,000 40,000 50,000 60,000 70,000
Equivalised disposable household income ($2004)
dens
ity
1984
2004
+-