+ All Categories
Home > Documents > MEASURING COMMUNITY STRENGTH AND SOCIAL CAPITAL by Robert Stimson, John Western

MEASURING COMMUNITY STRENGTH AND SOCIAL CAPITAL by Robert Stimson, John Western

Date post: 11-Feb-2022
Category:
Upload: others
View: 1 times
Download: 0 times
Share this document with a friend
39
1 MEASURING COMMUNITY STRENGTH AND SOCIAL CAPITAL by Robert Stimson, John Western, Scott Baum and Yolanda Van Gellecum Centre for Research into Sustainable Urban and Regional Futures (CR-SURF) and The UQ Centre for Social Research The University of Queensland Brisbane, Australia (corresponding author R Stimson, email: [email protected] ) The European Regional Science Association ERSA 2003 Congress Jyväskylä, Finland August 27–30, 2003 ABSTRACT In 2001/02 a number of case study communities in both metropolitan and regional urban locations in Australia were chosen as test sites to develop measures of ‘community strength’ on four domains: Natural Capital; Produced Economic Capital; Human Capital; and Social and Institutional Capital. Secondary data sources were used to develop indicators to measure community strength on the first three domains, using official data that is readily accessible, including census information. For the fourth domain—Social and Institutional Capital—primary data collection was undertaken through sample surveys of households. A structured approach was devised, involving developing a survey instrument using scaled items relating to four elements—formal norms; informal norms; formal structures; and informal structures—which embrace the concepts of trust, reciprocity, bonds, bridges, links and networks in the interaction of individuals with their community inherent in the notion social capital. Exploratory principal components analysis was used to identify factors that measure those aspects of social and institutional capital, with confirmatory analysis conducted using the Cronbach’s Alpha. This enabled the construction of four primary scales and 15 sub- scales as a tool for measuring social and institutional capital. Further analysis reveals that two measures—Anomie and perceived quality of life and wellbeing—relate to certain primary scales of social capital.
Transcript

1

MEASURING COMMUNITY STRENGTH AND SOCIAL CAPITAL

by

Robert Stimson, John Western, Scott Baum and Yolanda Van Gellecum

Centre for Research into Sustainable Urban and Regional Futures (CR-SURF)

and

The UQ Centre for Social Research

The University of Queensland

Brisbane, Australia

(corresponding author R Stimson, email: [email protected])

The European Regional Science Association

ERSA 2003 Congress

Jyväskylä, Finland

August 27–30, 2003

ABSTRACT

In 2001/02 a number of case study communities in both metropolitan and regional urban

locations in Australia were chosen as test sites to develop measures of ‘community

strength’ on four domains: Natural Capital; Produced Economic Capital; Human

Capital; and Social and Institutional Capital. Secondary data sources were used to

develop indicators to measure community strength on the first three domains, using

official data that is readily accessible, including census information. For the fourth

domain—Social and Institutional Capital—primary data collection was undertaken

through sample surveys of households. A structured approach was devised, involving

developing a survey instrument using scaled items relating to four elements—formal

norms; informal norms; formal structures; and informal structures—which embrace the

concepts of trust, reciprocity, bonds, bridges, links and networks in the interaction of

individuals with their community inherent in the notion social capital. Exploratory

principal components analysis was used to identify factors that measure those aspects of

social and institutional capital, with confirmatory analysis conducted using the

Cronbach’s Alpha. This enabled the construction of four primary scales and 15 sub-

scales as a tool for measuring social and institutional capital. Further analysis reveals

that two measures—Anomie and perceived quality of life and wellbeing—relate to

certain primary scales of social capital.

2

1 INTRODUCTION

How to analyse and benchmark community performance is a long established concern

of regional scientists. In Australia the recent literature includes: a study of patterns of

community opportunity and vulnerability (Baum et al. 1999, 2002; Stimson et al. 2001a;

Stimson et al. 2001b) which identifies localities by their level of performance across a

wide range of socio-economic transition measures; a study of the changing roles of

Australia’s metropolitan cities (O’Connor and Stimson 1995); a study of patterns of

change in regional cities (Beer et al. 1994); and a study of the functional roles of

regional urban centres (Beer 1999; Beer and Maude 1995). There are also examples of

research focusing more narrowly on more specific aspects of socio-economic

performance, including: income (Hunter and Gregory 1996); poverty (Fincher and

Nieuwenhuysen 1998); and unemployment (Stimson 1997; Stimson et al. 1998). In

addition, there is a gathering interest in the nature and measurement of social capital

(Onyx and Bullen 1997, 2000; Stone 2001).

In 1999 the Commonwealth Government released its Stronger Families and

Communities Strategy (FaCS 1999), earmarking in the 1999–2000 federal budget

AU$240 for prevention, early intervention and capacity building initiatives. The

development of policy has drawn attention to the various facets of strong communities,

such as firm leadership, strong partnerships between the public and private sector, and a

solid core of volunteers. The concern is that, in circumstances where the characteristics

of a strong community are missing, members of that community have ‘less capacity to

meet the challenges of economic change and to cope with the pressures that lead to

family and social breakdown’ (FaCS 1999:4).

As part of its response, the Commonwealth Department of Families and Community

Services initiated the Community Strength Indicators and Measurement Project. The

first phase of that project was to undertake a review to develop a framework to analyse

community strength and outcomes (Black and Hughes 2001). The second phase of the

project, undertaken by the authors (SERC 2002), took that framework and developed an

instrument(s) to measure community strength which comprises a comprehensive and

practical set of indicators. This paper provides an overview of the outcomes of that

project, focusing on methodological issues in the approach used to measure community

3

strength with respect to four domains of community performance: (1) Natural Capital;

(2) Produced Economic Capital; (3) Human Capital; and (4) Social and Institutional

Capital. Particular attention is given to Domain (4).

2 CASE STUDY COMMUNITIES AND INFORMATION COLLECTION

Assessing community strength is complex not least because of the different meanings

frequently given to the term ‘community’, which can, for example, be constructed in

terms of a ‘community of location’ or a ‘community of interest’. Where secondary

data—such as census information—is being used to provide variables to help measure

community strength, one is restricted by the spatial units of aggregation/disaggregation

for which data is available. In Australia the Statistical Local Area (SLA)—which

typically equates with a local government area or sometimes with a suburb—is the

spatial unit for which a wide range of census and other secondary data is available,

including change-over-time as well as point-in-time information. In this study the SLA

is used as a proxy for ‘community’.

Six case study SLAs were chosen to represent different types of communities that were

also places of interest for FaCS as locales where program intervention has occurred or

may be likely to occur. Five were in metropolitan or regional urban settings, namely:

• Auburn, a middle western suburban area in metropolitan Sydney, New South Wales

• Richmond, an old industrial suburb undergoing gentrification in inner metropolitan

Melbourne, Victoria

• Zillmere, an outer northern suburban in metropolitan Brisbane, Queensland

• Boonah, a small town in a rural setting beyond the southeastern fringe of

metropolitan Brisbane, Queensland

• Eaglehawk, part of Bendigo, a large regional urban centre in inland Victoria.

The sixth was a remote indigenous community, Wadeye (Daly SLA), located in the

Northern Territory. However, this community is not included in the detailed discussion

in this paper as it was decided that different methodologies were required to address and

measure community strength in predominantly indigenous communities.

4

A summary profile of these communities is given in Table 1.

Table 1: Summary profiles of the case study communities

Auburn, located in metropolitan Sydney, is generally considered to be a lower socio-economic community. It had a population of 50,959 at the 1996 census of which 51.5 per cent were born overseas. The community has only a small indigenous population (0.8 per cent) a trait common to many metropolitan communities. 14 per cent of Auburn’s labour force are unemployed. The median weekly household income is AU$593. Richmond, located in the inner suburbs of Melbourne, had a population of 23,175 people with 37.7 per cent being born overseas, with the majority of these (85 per cent) being born in countries other than Canada, Ireland, New Zealand, South Africa, the United Kingdom and the United States of America. Again this community has only a small indigenous population (0.3 per cent), and of the 12,836 people in the labour force, 1,611 were unemployed, representing an unemployment rate of 12.5 per cent. Median household income in Richmond is AU$644. Zillmere is located in the northern suburbs of Brisbane. It had a population of 7,651, of which only 17.7 per cent were born overseas, with a further 3.4 per cent being indigenous Australians. Of those born overseas almost half were born in Canada, Ireland, New Zealand, South Africa, the United Kingdom or the United States of America. Zillmere’s unemployment rate is 10.1 per cent, and it has a median weekly income of AU$531. Boonah, located on the fringe of the Brisbane metropolitan area, is a rural community with a population of 6,879 in 1996. Only 7.5 per cent of the population were born overseas, with a further 1 per cent being indigenous Australians. 245 of the labour force or 8.8 per cent are unemployed, and the median weekly household income is AU$464. Eaglehawk is a community within the large regional centre of Bendigo in inland country Victoria. It had a population of 8,054, with only 3.8 per cent being born overseas and 1.2 per cent indigenous Australians. Eaglehawk has a labour force of 3,148 and of these 16.6 per cent are unemployed. The median level of household income in AU$451 per week. Wadeye is a remotely located indigenous community located on the coastline of the Northern Territory towards the border with Western Australia. It had a population of 1,290 in 1996, of which 91.7 per cent are indigenous Australians. 10.4 per cent of the labour force are unemployed, and the level of median household income is AU$866 per week1. Note:1 Median household income in this community is high possibly due to (a) the large average household size and/or (b) the presence of highly paid non-indigenous workers in the town. Source: The authors, derived from ABS census data.

Census and other secondary data readily available from the Australian Bureau of

Statistics (ABS) and other public agencies was used to measure community strength

vis-a-vis Domains (1), (2) and (3), whereas for Domain (4) it was necessary to develop

an instrument(s) for primary data collection to gather the information necessary to

measure the Social and Institutional Capital aspects of community strength. That

involved conducting focus groups with stakeholder representatives from each

community, and then developing, testing and validating an instrument(s) for collation of

information to measure performance on that Domain, through a survey instrument(s)

5

administered to a random a sample of approximately 100 households in five of the case

study communities using the Computer Assisted Telephone Interview (CATI) mode.

3 SECONDARY DATA ANALYSIS AND INDICATORS FOR DOMAINS

(1), (2) AND (3)

3.1 The approach

The approach was to develop relatively simple measures of community strength

regarding the three Domains—(1) Natural Capital; (2) Produced Economic Capital; and

(3) Human Capital—using data on SLAs available from the ABS and other public

agencies. All the data sources used are readily available and may be readily accessed by

any community. In the majority of cases the measures developed are presented as

percentages or as rates per 10,000 population and are benchmarked against the

comparable figure for Australia as a nation vis-a-vis an indicator. In other cases a

location quotient (LQ) is produced, which compares the incidence of a phenomenon for

a SLA (community) against the equivalent measure of the incidence of that

phenomenon for Australia as a whole; thus where LQ≥1 there is an equal or greater

incidence of that phenomenon in a community vis-à-vis Australia, and where LQ<1 the

incidence of that phenomenon in a community is lower than it is for Australia as a

whole.

The initial task associated with secondary data analysis was to identify suitable

measures (indicators) to operationalise Domains (1), (2) and (3). Measures had to be: (a)

available at the SLA level; (b) readily accessible; and (c) easily understood.

3.2 Measuring Domain (1): Natural Capital

According to Hart (2000), Natural Capital assets of a community include: (a) natural

resources; (b) ecosystems services; and (c) the authenticity or beauty of nature. Natural

resources are those things a community can take from the natural environment and use

either as raw materials or in the production process. Ecosystems services are natural

processes on which we depend; for example, the processes whereby trees convert

carbon dioxide into oxygen and sequester the carbon. The third form of Natural Capital

consists of those natural attributes which are admired; for example, wilderness,

6

mountain ranges or native wildlife. All of these contribute to the strength of local

communities. However, the challenge is to use and develop Natural Capital in ways that

sustain and enhance that Natural Capital.

Among the ways to conceptualise this Domain is to refer to the Condition-Pressure-

Response framework, as suggested by Black and Hughes (2001), and as commonly used

in state of environment reporting (Newton et al. 2001). The problem is that for many of

the indicators proposed in such approaches, data is not available at the disaggregated

level of scale of the SLA, and nor is it readily available (e.g. social quality, fish stocks,

per capita water consumption, emissions of air pollutants, availability of recycling, etc.).

Comprehensive national databases at a standardised disaggregated level of scale simply

do not exist. It is indeed important that comprehensive measures of Natural Capital are,

in the future, developed at the SLA level, but currently there exist very considerable

restrictions on what aspects of Natural Capital can be measured according to the criteria

set out above. Those measures used are given in Table 2, along with the measures

derived for the case study communities.

Gross population density is used to measure an aspect of the condition of the

environment. The pressures on the environment are measured by three indicators—

population and household growth over the decade 1986 to 1998, and an in-migration

indicator. Population in-movement can impact on the condition of the Natural Capital

Domain, but it also impacts on other measures of local community performance (for

instance, a community with a higher level of population turnover may witness a lower

level of social capital and community cohesion).

It is certainly difficult to measure the condition of the Natural Capital in a community

based on a single indicator or the restricted set of indicators listed in Table 2. However,

even on those restricted indicators used, there are substantial differences even among

the case study communities. The indicators of pressure suggest there is likely to be more

pressure on the Natural Capital Domain of a community that is experiencing population

growth; however, balancing that is the fact that fast growing communities are growing

from a relatively small population base, and hence the subject of population growth may

not be as significant as in other places.

7

Table 2: Natural Capital (Domain 1)

Auburn Richmond Zillmere Boonah Eaglehawk Daly (Wadeye)

Australia

Gross population density (2000) 1 1796.70 3970.20 2061.80 4.64 699.90 0.10 4.85

Annual average rate of population growth (1986–96) 2 0.75 –0.04 0.59 1.29 0.24 4.90 1.28

Annual average rate of household growth (1986–96) 2 0.60 0.60 2.20 2.20 1.90 5.00 2.20

In-migration surrogate 2, 3 37.18 48.82 42.30 34.75 36.28 23.60 39.91

Persons per dwelling 2 3.30 2.30 2.50 2.00 2.80 4.70 2.80 Notes:

1. Taken from Australian Bureau of Statistics, Regional Population Growth, Cat. No. 3218.0.

2. Taken from Australian Bureau of Statistics, CData96.

3. The in-migration indicator was derived from the Census question relating to previous place of residence.

8

4.3 Measuring Domain (2): Produced Economic Capital

Black and Hughes (2001:50) define Produced Economic Capital as being all products

harvested and manufactured, the built environment and physical infrastructure, financial

resources, and cultural and intellectual property. An impact issue is the extent to which it is

owned within, or is available to, a community, and the degree to which there is an equitable

distribution of resources throughout the community. The Domain relates to three areas: (a)

economic resources associated with individuals, families and households; (b) economic

resources associated with business and other organisations; and (c) infrastructure and public

facilities within a community.

Hustedde et al. (1995) review a range of tools suitable for assessing community performance

with respect to Produced Economic Capital, including econometric and spatial analytic tools

to calibrate economic multipliers, and to measure trade areas, employment shifts and the

efficiency of firms. The data required to operationalise tools such as input-output analysis and

shift-share analysis are rarely available at the level of disaggregation applicable to a

community such as a SLA. Thus, may of the indicators of Produced Economic Capital as

proposed by Black and Hughes (2001:42–55) cannot be used at the level of the SLA.

The indicators used for this Domain and the measures for the case study SLAs are given in

Table 3. They were chosen as representing measures relating to the above three areas of

Produced Economic Capital. Economic resources of individuals and households were

measured using the indicators home ownership; a measure of housing related financial stress;

per capita household income; households without a motor vehicle; the incidence of recipients

of government benefits; the rate of household income tax to benefits received; and the

percentage point change over time (1986–1996) in the incidence of high and low income

households. Economic resources associated with business and other organisations were

measured by the ratio of the shares of non-residential investment in construction to the share

of national population; and the total value of non-residential construction investment over the

period 1989–1998. Infrastructure and public facilities are measured by: the ratio of the shares

of public sector construction investment to the share of national population; the Accessibility

Remoteness Index of Australia (ARIA) for localities; the number of banks and financial

institution establishments per 10,000 resident population; medical services per 10,000

population; and preschools and schools per 10,000 population.

9

Table 3: Produced Economic Capital (Domain 2)

Auburn Richmond Zillmere Boonah Eaglehawk Daly (Wadeye) Australia

Economic resources of individuals and households

• Home owners1 (%) 63.0 45.8 56.3 78.4 71.8 25.4 69.0

• Housing stress1 (%) 26.3 18.3 16.9 22.4 20.0 4.8 19.3

• Per capita household income2 242.0 393.0 265.0 221.0 213.0 171.0 310.0

• Households without a motor vehicle 1 (%) 20.9 27.4 18.2 7.0 13.5 35.6 11.6

• Government benefit recipients (16 yrs +)3 (%) 41.4 33.8 27.4 44.1 51.6 25.9 32.1

• Tax: benefits ratio3 0.8 1.6 1.3 0.7 0.5 1.2 1.6

• Point change in high-income households4 8.1 15.1 4.3 5.2 1.4 12.5 9.3

• Point change in low-income households4 1.1 –2.8 6.1 –0.6 5.0 –3.8 –1.3

Economic resources associated with business and other organisations

• Share of non-residential investment—share of total investment to population share4

4.3 2.1 0.25 0.25 0.25 1.0

• Total investment ($000,000)4 1652 374 19 17 14 3 130,909

Infrastructure and public facilities

• Share of public sector construction—share of total investment to population share4

8.9 0.46 0.25 0.25 0.5 3.5

• Remoteness index5 0.0 0.0 0.0 2.1 0.36 8.2

• Banks and financial institutions per 10,000 persons6 1.6 7.2 3.9 6.0 – – 5.0

• Medical services per 10,000 persons (doctors surgeries)6 11.9 103.6 106.6 10.8 2.2 – 21.1

• Pre-schools and schools per 10,000 persons6 3.0 5.6 53.3 18.1 7.8 54.3 10.1

Notes: 1. Taken from Australian Bureau of Statistics, CData96. 2. Taken from Australia in Profile: A Regional Analysis 1996, Australian Bureau of Statistics. 3. Taken from Rob Bray and William Mudd 1998 The Contribution of DSS Payments to Regional Income , DSS Technical Paper No. 2. 4. Taken from unpublished ABS data. 5. Taken From GISCA 1999 Measuring Remoteness: Accessibility/Remoteness Index of Australia, Department of Aged Health Care, Occasional Paper No. 6. 6. Taken from Marketing Pro database.

10

These indicators are seen to differ markedly across the case study SLAs. Home ownership

rates are an important measure as home ownership represents a significant, if not the most

significant asset of households. The housing related stress measure is a good indicator of

socio-economic disadvantage as it measures the proportion of households in the bottom 40%

of the income distribution who are paying more than 30% of gross income on housing costs.

The other income and related measures used represent indicators showing the degree to

which households in a community are dependent on transfer payments as well as the

transition over time in the incidence of households in the top and bottom quintiles of the

household income distribution. Lack of household access to a car is a useful measure of

transport flexibility which may effect the welfare of household individuals. The ARIA index

measures the remoteness of a community. The various measures of community shares of non-

residential construction investment by the public and private sectors are useful proxies of

investment in economic ability and infrastructure, and the indicators of per capita provision

of community services and facilities are self-evident.

The data in Table 3 indicate that all communities perform strongly on at least one of the

measures of Produced Economic Capital relating to households, but there exists considerable

variability in the mix of performance on those indicators. Measures of Produced Economic

Capital associated with businesses and organisations, and infrastructure and public facilities,

tend to show that the metropolitan-based communities do better than the rural and regional

communities.

3.4 Measuring Domain (3): Human Capital

Black and Hughes (2001:3) define Human Capital as ‘the capacity of people to contribute to

, and this is important as it relates to the ability of a community to undertake

activities in which the other forms of capital domains can be developed or produced. Human

Capital can be measured with respect to: (a) skills and knowledge; (b) capacity to adjust to

changing circumstances; (c) ability to contribute through participation; (d) social interaction

and decision-making; and (e) management of health and disability. The first of these is

readily measured through census data; but the degree to which other aspects of this domain

are measurable using secondary data at the SLA level is not at all clear.

11

Table 4 sets out the indicators selected to measure the Human Capital Domain and gives the

scores for the case study SLAs. These relate to: (a) measures of local labour force skills and

ability using: data on the incidence of degrees and vocational qualifications; the proportion

of people who left school before 15 years of age; and the participation rate in tertiary

education; and (b) measures of the size and quality of the labour force, including data on:

labour from participation rates; female labour force participation rates; unemployment rate;

change over time, 1956–1996, in labour force participation; the incidence of part-time work;

and the concentration of employment in broad occupation groupings.

The data in Table 4 show that the measures relating to skills, expertise and ability of the

labour force do tend to differentiate between the case study SLAs, while for those indicators

relating to the size and quality of the labour force tend to display less variability. However,

the occupational characteristics of the labour force bring out differences between

communities. As with the indicators of Produced Economic Capital, the Human Capital

indicators are not necessarily interpreted in terms of their contribution to community strength.

3.5 Appraising the framework for Domains (1), (2) and (3)

The framework for the three Domains proposed by Black and Hughes (2001) discussed above

is conceptually appealing, but it has proven to have some operational difficulties. Data

limitations impose considerable constraints and it is not always possible to obtain secondary

data at the SLA level to develop explicit indicators that truly reflect the intent of the implied

measures for all components of the Domains as discussed by Black and Hughes. This is a

particular problem with respect to Natural Capital. But there is also a difficulty with respect

to the measurement of the infrastructure and public facility provision component of Produced

Economic Capital. The utility of the measures contained presupposes that the use of the

infrastructure facilities occurs within a given bounded area; the measure of community

adopted—the SLA—is an administrative statistical unit, not a functional area. In metropolitan

areas this becomes a significant problem for interpretation because a lower measure on an

indicator might be an artifact of boundary definition and not of actual access opportunity for

the resident population, with respect to the proximate provision of that facility. This is less a

problem in rural and regional SLAs where the SLAs are more likely to be functional

geographic areas encompassing a whole urban area (and perhaps its hinterland as well).

12

Table 4: Human Capital (Domain 3)

Auburn Richmond Zillmere Boonah Eaglehawk Daly (Wadeye)

Australia

Level of skill, expertise and ability

• Workforce with degree qualifications 1 8.90 21.30 5.90 5.40 3.60 4.70 10.40

• Workforce with vocational training1 19.90 21.00 21.90 18.20 21.70 14.00 25.70

• Persons who left school before 15 years1 28.90 19.90 44.60 55.90 41.10 29.50 33.30

• Tertiary education participation rate1 27.80 52.30 21.70 11.90 12.90 4.90 30.50

Size and quality of the labour force

• Labour force participation rate1 54.00 67.00 56.00 55.80 51.70 42.70 61.90

• Female labour force participation1 32.30 51.20 38.40 33.40 32.80 20.80 40.60

• Change in the labour force1 0.80 8.40 4.30 6.80 2.30 31.00 14.70

• Unemployment rate1 14.30 12.50 10.10 8.80 16.60 14.40 9.20

• % Professionals/para-professionals1

(location quotient) 20.80 (0.73)

40.09 (1.41)

21.24 (0.74)

19.61 (0.69)

21.54 (0.75)

31.47 (1.11)

28.42

• % Clerical based workers1

(location quotient) 35.15 (1.21)

26.94 (0.92)

34.15 (1.17)

24.60 (0.83)

30.52 (1.05)

16.74 (0.57)

28.99

• % Routine production/old economy workers1

(location quotient) 36.80 (1.19)

22.10 (0.72)

38.50 (1.25)

33.10 (1.08)

41.60 (1.36)

38.20 (1.24)

30.70

• % Part time employment (location quotient) 23.50 (0.79)

25.90 (0.87)

27.00 (0.90)

27.80 (0.93)

35.10 (1.17)

23.30 (0.78)

29.90

Notes:

1. Taken from Australian Bureau of Statistics, CData96.

13

There is also a degree of overlap between these three Domains, and in particular between the

Produced Economic Capital and Human Capital measures. For example, there is an

interdependency between measures of household service and levels of labour force skills.

For universal meaning to be derived from the measures of community strength relating to

these three Domains, the use of a small number of case studies the project funding restricted

us to is inadequate. A full national analysis of performance across all SLAs is needed in order

to both categorise and differentiate between categories of like communities and to determine

the range of values across the nation for each indicator. The use of the LQ to benchmark is of

limited value in this regard. More meaningful results could be obtained through a nation-wide

approach such as that used by Baum et al. (1999) in their study of community opportunity

and vulnerability based on SLAs and using multi-variate analytical modelling tools (cluster

analysis and discriminant analysis).

4 PRIMARY DATA COLLECTION, ANALAYSIS AND INDICATORS FOR

DOMAIN (4): SOCIAL AND INSTITUTIONAL CAPITAL

To address Domain (4), primary data collection was required in the case study communities.

The objective was to measure community performance on this domain through a structured

approach and to produce a survey instrument that has been tested in the case study

communities, and which is suitable for application in any community.

4.1 Defining and conceptualising ‘social capital’

The concept social capital has been gaining wide interest among researchers and policy

makers, and a push is evident also from the general community to use social capital as a way

to both describe and understand community well-being. As a concept, social capital has been

around for some time, and its origins can be traced to as early as the 1910s. In the 1980s

Coleman (1988) put the notion of social capital firmly on the intellectual agenda, arguing that

it is embodied in the relations among people, and that it can facilitate productive activity, and

that it is manifest in the trustworthiness and trust. Woolcock (1998) suggests that social

capital is a ‘broad term encompassing the norms and networks facilitating collective action

for mutual benefit’. Putnam (2000:19) suggests that ‘social capital refers to connections

14

among individuals—social networks and the norms of reciprocity and trustworthiness that

arise from them’.

There are two aspects to social capital: (a) social structure, or social networks; and (b) the

norms governing behaviour in those social structures and social networks. A high level of

social capital is seen in situations where there are cohesive networks of considerable density

and where interactions are governed by norms of trust and reciprocity. Cohesive and strong

communities therefore are characterised by high levels of social capital, whereas weak

communities are characterised by low levels of social capital.

A starting point is thus to view social capital as a two-dimensional construct: one structural;

the other normative. The structural identifies networks of social relations, while the

normative includes norms of trust and reciprocity. Networks of social relations may be large

or small and formal or informal. These social structures are, in a sense, overlaid by normative

structures that contribute to their relative stability. Putnam (1998) makes a further distinction

amongst these dimensions in highlighting a difference between informal and formal

networks. Informal networks include relationships people have with their families, partners,

friends and neighbours; whereas formal networks include relationships at work, within

community groups and churches, and with formal bodies such as businesses and

governments. In this way social capital can be thought of as four broad groupings: Informal

Structures, Formal Structures, Informal Norms, and Formal Norms.

Thus, it is possible to conceptualise social capital in terms of the framework set out in Figure

1, which gives a four-fold cross classification of norms and structures, and formal and

informal networks. The combination of formal structures and formal norms defines formal

social networks, while the combination of informal structures and informal norms defines

informal social networks. Networks characterised by formal norms and informal structures

and informal norms and formal structures as defined by the remaining two cells are mixed

networks.

15

Figure 1: Structures and norms in social capital

NORMS

STRUCTURES

Informal

Formal

Informal Formal

Informal networks (Informal Structures + Informal

Norms)

Mixed networks (Informal Structures + Formal

Norms)

Mixed networks (Formal Structures + Informal

Norms)

Formal networks (Formal Structures + Formal Norms)

Note: In developing the measurement approach to social capital for the community strengths project

focuses on the outer categorisations of the table rather than the cells of the table, that is : (a) Formal Norms;

(b) Informal Norms; (c) Formal Structures; and (d) Informal Structures.

Traditionally social capital has been measured in one of two broad ways by measuring (a) the

physical structure of a network or (b) its normative attributes (Stone, 2001). Mapping the

structure of a network is done by measuring attributes such as size, capacity, openness,

homogeneity and density (Coleman 1988, 1990; Krishna and Shrader 1999; Gluckman 1967).

Size equates to the number of people that are part of a network and even their geographical

dispersion. Capacity, on the other hand, relates to quality of the network and to the ability to

draw favours from people within a given network. Openness of a network is probably best

understood by its opposite sense, closedness. A closed network is one in which social

relations exist amongst all members of the network and is particularly effective in creating a

strong sense of culture, and shared norms and sanctions amongst group members (Coleman

1988, 1990). Homogeneity measures how similar network members are on a social construct

such as class, religion, gender, wealth and the like. And finally density relates to overlapping

of networks: the affinity of members of a network to be part of other networks.

Norms governing network behaviour relate to trust, unity and reciprocity. Within informal

networks individuals have what is called particularised trust, a trust that is specific to the

individual a person knows (Uslaner 1999; Cox and Caldwell 2000). This is different to the

trust people have for strangers since the probity of a stranger can not be predicted with the

same certainty as it can of a person known to the individual. The trust afforded to strangers is

by its very nature generalised and is termed generalised trust (Putnam, 1998; Dasgupta, 1988;

Uslaner, 1999). Trust in formal networks, (institutional trust) is similarly general because it is

16

not aimed at individuals but rather institutions and relates to, for example, trust of ‘the

government’, of ‘the police’ or of ‘the church’ (Giddens 1990; Stone 2001; Black and

Hughes 2001). Closely related to trust are unity and reciprocity. Unity is a feeling of

belonging to a network together with the feeling that a two-way relationship exists between

the individual and the network. An example of unity within a formal context is when

governments are inclusive of citizens in decision making, creating a sense of mutual

ownership of the task and a two-way relationship between the institution and individuals.

Reciprocity concerns the exchanges that take place within a network. Individuals are likely to

offer assistance to others if they believe that in the future the assistance will be reciprocated.

Volunteering is a good example of reciprocity within a formal context where an individual

may feel that he or she is ‘giving something back’ to the community.

For the normative dimension, a high level of social capital is indicated by particularised trust,

generalised trust, unity and reciprocity. High levels of social capital are associated with high

levels of trust, unity and reciprocity in informal networks, such as family and friendship

networks, and in formal networks such as the community at large, local groups and

associations and institutions. The standard aspects which support this normative structure are

initially the presence of networks, such as size and capacity. Also present will be the ability

to intermix networks through open-minded, diverse and overlapping interactions with other

networks (Coleman 1985; Granovetter 1973; Gluckman 1967).

Both normative and structural aspects of social capital tap into what are termed bonds,

bridges and links. Bonds refer to the internal dynamics of a network (measured by size,

capacity, homogeneity and openness), and as well they focus on normative aspects such as

trust, unity and reciprocity, particularly within informal networks. Bridges equate to the

density of networks, and the capacity of people within one particular network to draw on

other networks, both informal and formal. Bridges are characterised by heterogeneity of

membership that entails ties that cut across characteristics of social groups such as gender,

wealth, religion and so forth (Krishna and Shrader 1999; Putnam 1998; Narayan 1999;

Woolcock and Narayan 2000). Links are merely a special case of bridges, and are measures

of the bridges people have with authorative organisations (Black and Hughes 2001; Putnam

2000; Putnam et al. 1993).

17

4.2 Approaches to measurement: qualitative assessment

An exploratory approach, using focus group techniques and informant interviewing, to assess

social capital, was used to provide background to the more structured survey techniques on

which computation of systematic measures could be based. The focus groups in each of the

case study communities addressed: (a) awareness of community events; (b) perceptions of the

community (what it is like to live there, assessing strengths and weaknesses); (c) community

activities (opportunities to help others), civic activity and participation, attitudes to formal

institutions); and (d) perceptions of what residents want/do not want in their community.

Consultations (through telephone interviews) were also conducted with representatives of key

community organisations, including service clubs, parents and citizens associations,

chambers of commerce, local councils, and community development officers. A semi-

structured schedule of questions was used. An objective was to gain information on

assessments of the working of the community and participation in and contribution to

community activities.

These two mechanisms provided useful qualitative assessment of community performance,

strengths and weaknesses and on the roles of community organisations. These consultative

processes provided results that support the codification proposed by Gauntlett et al. (2001)

that strong and health communities will: (a) provide a clean and safe physical environment;

(b) meet the basic needs of residents; (c) comprise residents that respect and support each

other; (d) involve the community in local government; (e) promote and celebrate its historical

and cultural heritage; (f) provide easily accessible health services; (g) possess a diverse,

innovative economy; and (h) rest on a sustainable ecosystem.

The case study communities in general tended to provide through these processes a positive

picture of the contribution that organisations make to community strength, what might be

expected and could represent a bias in this qualitative methodology, not the least because of

the incomplete representation of all interests and groups across the community. However, not

surprisingly the information gained from that qualitative approach was to prove useful in

helping identify topics and frame questions for the structured survey approach discussed

below.

18

4.3 Approaches to measurement: a structured survey approach

The development of a structured approach to measure a Social and Institutional Capital

Domain sought to develop explicit measures of community strength with respect to the four

marginal elements of Figure 1—which may be thought of as comprising the four conceptual

cells of social capital:

• Informal Structures represent the extent of networks people have with family, friends and

neighbours, and can be assessed by measuring the size of a given network on the basis of

the number of people that belong to it, the geographical dispersion of the networks, and

assessing people’s capacity to draw on networks for help.

• Formal Structures represent the same kind of network measures but with respect to more

formalised groups, such as community groups, associations, businesses, and institutions

such as schools, police and the various levels of government, and even the community as a

whole.

• Informal Norms are the norms that govern Informal Structures and generally concern

levels of trust that exist between network members, reciprocity, and feelings of belonging

or unity within the network.

• Formal Norms represent the qualities associated with Formal Structures, and again

involve trust, reciprocity and unity although not necessarily with individuals only but

more generally with institutions as a whole.

Information gained from the qualitative consultations discussed above, along with the

consideration of the survey instruments and their question contents developed by other

researchers investigating social capital, led to the development of specific questions for a

survey instrument which were grouped into the four primary scales named after the cells of

the theoretical notion of social capital (as per Figure 1). Smaller clusters of questions, or sub-

scales, that tapped specific micro-concepts relevant to the primary scales were also

considered. (For example, subscales of ‘openness to diversity’ and ‘place attachment’ were

conceived as components of the primary scale of formal norms.) A questionnaire with a total

of 95 questions was thus compiled as a survey instrument. In addition, four outcome

measures were developed as part of the questionnaire. These were: (a) Anomie1; (b)

1 A measure of normlessness experienced by disenchanted individuals

19

Perceived Quality of Life and Well Being; (c) Perceived Natural and Human Capital; and (d)

Perceived Economic Capital.

In the first phase of measurement development, the exploratory analysis, the instrument was

tested in a survey of a random sample of 100 adult individuals in three of the case study

communities (Boonah, Eaglehawk and Zillmere) with interviews conducted through a CATI

mode. The data relating to community strength measures were subjected to a principal

components analysis followed by a scale reliability analysis based on the Cronbach’s Alpha

procedure. The second phase of measure development, the confirmatory analysis, involved

administering the modified questionnaire to a sample of 100 adult individuals in the Auburn

and Richmond case study communities. The Cronbach’s Alpha was used to validate results

from the confirmatory phase, and further principal components analysis was undertaken to

clarify some outstanding issues.

4.4 Exploratory phase of scale construction

The exploratory procedures used in developing measures of social capital using principal

components analysis of the data derived from 95 questions relating to social capital identified

five factors for further examination. The extent to which those factors resembled measures

constructed by other researchers (Christakopoulou et al. 2001; Stone and Hughes 2001; Onyx

and Bullen 2000; Stewart-Weeks and Richardson 2001) was examined. Scales and subscales

from the five factors were identified, and the Cronbach’s Alpha as a measure of scale

reliability was calculated for each. The scales and subscales were then assigned to the

appropriate cells in the conceptual framework of social capital set out in Figure 1. Through

this process the initial set of 95 questions was reduced to 61.

The five factors identified explained 33.6 per cent of the total variance, of which the first

factor accounted for 11.6 per cent, with the remaining four factors accounting for between 6.5

and 4.2 per cent of that variance.

• Factor 1 was described as formal growth structures and normative considerations. From a

conceptual point of view some of the questions relating to this factor originated in the

Formal Structures cell of the theoretical matrix, while others came from the Formal Norms

cell. It comprises questions concerning people’s participation in the local community,

20

friends and institutional links. As well it comprises questions relating to trust of links and

a generalised trust and unity within the community, as well as relating to issues of

personal safety.

• Factor 2 is described as reciprocity in a formal context, and comprises questions relating

to benefits of participation or exchange in a given formal network and fell into the Formal

Norms cell of the theoretical matrix. Those questions tap some of the rationale between

people’s involvement in community groups and associations and the benefits thus gained.

• Factor 3 is described as trust and reciprocity amongst informal groups, and coincides with

the Informal Norms cell of the theoretical matrix. It comprises questions relating to

particularised trust and informal reciprocity, combined with questions that identify trust

and reciprocity in informal networks of family, friends, neighbours and work associates.

• Factor 4 is described as informal group dynamics, which is coextensive with the Informal

Structures cell of the theoretical matrix. It comprises questions assessing negative aspects

of social capital relating to intergroup dynamics and friction caused by homogenous group

structures that can lead to community divisions and questions which measure individual

agency in informal settings, referring to a person’s capacity to plan and initiate action.

• Factor 5 is described as trust of authority and adds to the Formal Norms cell of the

theoretical matrix. It comprises questions we (SERC 2002) had developed to measure

peoples’ trust of links based upon the focus group data, and which are indicators of

generalised trust of formal initiatives, particularly with respect to various levels of

government.

It thus became evident that particular groupings of the questions in the identified factors fall

into one or other of the four cells in the theoretical matrix in Figure 1. For each of those four

categories—a Cronbach’s Alpha was calculated for all the questions. This is set out in Table

5 (note that Factor 1 has been split between the Formal Norms and the Formal Structures

categories in that analysis).

The structural cells were conceptualised as mapping the structure of networks and the types

of capacities drawn from those networks. The Informal Structure cell is informed by Krishna

and Shrader’s (1999) exclusion items or ‘community divisions’, which measures potential

conflict between groups as a result of differences created by bonding structures of overly

21

Table 5: Factors grouped according to the conceptual matrix

Informal Structures Alpha .8073

Source & concept

Subscale Question Factor loading

6a Importance of differences between men and women in dividing the community

.586

6b Importance of differences between younger and older generations in dividing the community

.596

6c Importance of differences in re ligious beliefs in dividing the community

.552

6d Importance of differences in ethnic background in dividing the community

.680

6e Importance of differences in education in dividing the community .658

6f Importance of differences in political party affiliations in dividing the community

.635

6g Importance of differences between long term residents and new arrivals in dividing the community

.591

Krishna & Shrader

(Exclusion)

Alpha .8561

Factor 4 alpha .7823

“Community divisions”

6h Importance of differences in income in dividing the community .494

20b Often go outside local community to visit family .361

20d If had a dispute with neighbour would be willing to seek mediation .307

20e At work frequently take the initiative to what needs to be done .371

Onyx & Bullen

(Factor B: Social

agency)

Alpha .6087

“Particularised social

agency”

20f At work frequently help workmates even though not in job description .327

Formal Structures Alpha .5755

7a How often help out a local group as a volunteer -.521

7b Number of local community events attended in the past 6 months -.552

7c Number of local organisations or clubs an active member of -.432

7d Number of local organisations or clubs on which on a management committee or organising committee

-.366

7e Number of times in the past 3 years in which have joined a local community project or working bee

-.372

Onyx & Bullen

(Factor A:

Participation in

the local community)

Alpha .8183

Factor 1 (Structural

aspects)

Alpha .5755

“Part icipation in the local

community” 7f Number of times have been part of a project to organise a new service

in your local community -.632

9c Personally know someone in the media 532

9d Personally know someone in the state government .391

9e Personally know someone in the local government .554

9f Personally know someone in political parties .497

Stone

& Hughes (Friends:

institutional

networks)

Alpha .7577

“Friends in institutional networks”

Informal Norms Alpha .7349

10a To what extent would you trust close family and other relatives with whom you don’t live

.520

10b To what extent would you trust your friends .449

10c To what extent would you trust your neighbours .283

Stone & Hughes (Particularised

trust)

Alpha .6654

Factor 3

Alpha .7349

“Particularised trust” 10d To what extent would you trust your workmates or associates .327

11a How often do you and your close family and other relatives with whom you don’t live exchange practical help or advice

.593

11b How often do you and your friends exchange practical help or advice .543

11c How often do you and your neighbours exchange practical help or advice

.485

11d How often do you and your current work mates or associates exchange practical help or advice

.420

Stone & Hughes

(Friends: Health & related services, informal

reciprocity)

Alpha .6169

“Informal reciprocity and

exchange”

Note: Negative loadings due to reverse scaling of items.

22

Table 5: Factors grouped according to the conceptual matrix (continued)

Formal Norms Alpha .8428

Source & concept

Subscale Question Factor loading

14a Feel safe walking down street after dark .481

14b Most people can be trusted .439

14c Someone’s car breaks down outside house, generally would invite them into home to use the phone

.554

14d Local community has a reputation for being a safe place .545

15a Feel safe being at home alone during the day .339

Onyx & Bullen

(Factor C:

Feelings of trust and safety) &

Christakopoulou et al.

(Personal safety)

Alpha .8081

Factor 1 (Normative

aspects)

Alpha .8950

“Feelings of safety and generalised

trust" 15b Feel safe walking alone in the street during the day .413

17a Confidence in churches .332

17b Confidence in schools .343

17c Confidence in police force .396

17d Confidence in local media .356

17e Confidence in government .429

Stone & Hughes

Civic

networks and

participation:

Confidence in

institutions)

Alpha .7407

“Confidence in links”

17f Confidence in local council .307

19a People around here really willing to help each other out .523

19b People around here share the same values .387

19c Feel a strong sense of identity with local community .664

Stone & Hughes (Civic

networks and

participation)

Alpha .7577

“Community spirit”

19d Well informed about local affairs .579

21a Feel emotionally attached to the local community .701

21b Feel that belong to the local community .650

21c Would like to be living in the local community in 3 years time .464

21d Proud to live in the local community .571

Christakopoulou et al.

(Place

attachment)

Alpha .8075

“Place attachment”

18b Because I enjoy the activity .525

18c Wanted to give something back to the group/community .641

18d To meet people and make friends .663

18e A series of coincidences and unexpected connections .695

18f Forced to do it .688

18g Friends were involved .677

Stewart-Weeks

& Richardson

(Benefits of

participation or

exchange in a

given network)

Alpha .9111

Factor 2

Alpha .9111

“Formal reciprocity”

16a In a local major development extent believed that the local federal member of parliament would take local people’s views into account

.385

16b In a local major development extent believed that the local state member of parliament would take local people’s views into account

.423

16c In a local major development extent believed that the local council would take local people’s views into account

.333

16d In a local major development extent believed that the government department running the development would take local people’s views into account

+

16e In a local major development extent believed that the developer would take local people’s views into account

+

SERC (Trust of links)

Alpha .8541

Factor 5

Alpha .8101

“Trust of links”

+ Factor loadings low but question included on the basis of Cronbach’s Alpha analysis

homogenous groups. Onyx and Bullen’s (2000) ‘particularised social agency , which

examines individual proactivity amongst family, neighbours and workmates. The Cronbach’s

Alphas for the two components are .8501 and .6087 respectively. When the scales are

combined, the internal consistency remains robust at .8073. Conversely, the Formal

23

Structures cell reaches an acceptably high level of internal consistency when aggregated

(Cronbach’s Alpha .5755) but higher levels where the two components are kept separate.

Onyx and Bullen’s (2000) ‘participation in the local community’, which measures individual

‘participation in the community’ (.8153), and Stone and Hughes’ (2001) ‘friends in

institutional networks’, which measures capacity drawn from links (.7577), comprise two

distinct subgroups. Note there are negative factor loadings for the ‘participation in the local

in institutional networks’ a low number

indicates connectedness to formal structures and a high number indicates lack of

connectedness.

The normative cells concern the qualities of networks, which are also thought to differ

between informal and formal groups. The Stone and Hughes (2000) items that formed Factor

3 represent the Informal Norm cells. These tap ‘particularised trust’ of family, friends,

neighbours and workmates, as well as ‘reciprocity’ amongst the same groups. The

Cronbach’s Alpha for each group of items is acceptably high at .6654 and .6169 respectively,

but when combined reliability increases to .7349. The Formal Norms cell is defined by the

largest set of questions which provide a strong Cronbach’s Alpha of .8428. The cell is

represented by a portion of Factor 1 and the whole of Factors 2 and 5, with Cronbach’s

Alphas of .8950, .9111 and .8101 respectively. Factor 1 questions which contribute to this

cell include: the Onyx and Bullen (2000) ‘feelings of trust and safety’, and the

Christakopoulou et al. (2001) ‘personal safety’ questions, which together form the subscale

‘feelings of safety and generalised trust’ (Cronbach’s Alpha .8051); Christakopoulou et al

(2001) ‘place attachment’ (.8075); and the Stone and Hughes (2001) ‘confidence in links’

(.7577) and ‘community spirit’ (.8075). Factor 2 and Factor 5 questions, which are included

in this cell, are respectively the Stewart-Wecks and Richardson (1998) ‘formal reciprocity’

(.9111) and the SERC’s (2002) ‘trust of links’ (.7577) scales.

The exploratory analysis thus led to the development of four measures of social capital: (a)

the first concerned the Informal Structures component of social networks; (b) the second

concerned the Formal Structures component; (c) the third concerned the Informal Norms

component; and (d) the fourth concerned the Formal Norms component.

24

4.5 Confirmatory phase of scale construction

Confirmatory analysis was then pursued to determine the extent to which the above measures

could be reproduced in the analysis of the surveys of residents in the remaining two

communities—Auburn and Richmond. The procedure was first to calculate measures of scale

reliability (the Cronbach’s Alpha) for each of the primary scales and the subscales

contributing to them, and then second to undertake a principal components analysis to clarify

any outstanding issues.

The results of the Cronbach’s Alpha analysis for the primary scales is shown in Table 6. It is

evident that the Alpha values for both the exploratory and confirmatory analyses are

encouragingly similar. For Informal Structures the exploratory analysis had a high

Cronbach’s Alpha of .8073 than it did in the confirmatory analysis where the Alpha was

.7566. Formal Structures has a slightly higher Alpha in the exploratory analysis at .5755

compared with the confirmatory analysis results of .4466. Reliability is marginally increased

between the two analysis for Informal Norms (from .7349 to .7713) and remains virtually the

same for formal norms (.8428 for exploratory and .8525 for confirmatory analysis).

Table 6: Cronbach’s Alpha for theoretical indexes over two phases

Exploratory phase three communities

Confirmatory phase two communities

Informal Structures .8073 .7566 Formal Structures .5755 .4466 Informal Norms .7349 .7713 Formal Norms .8428 .8525

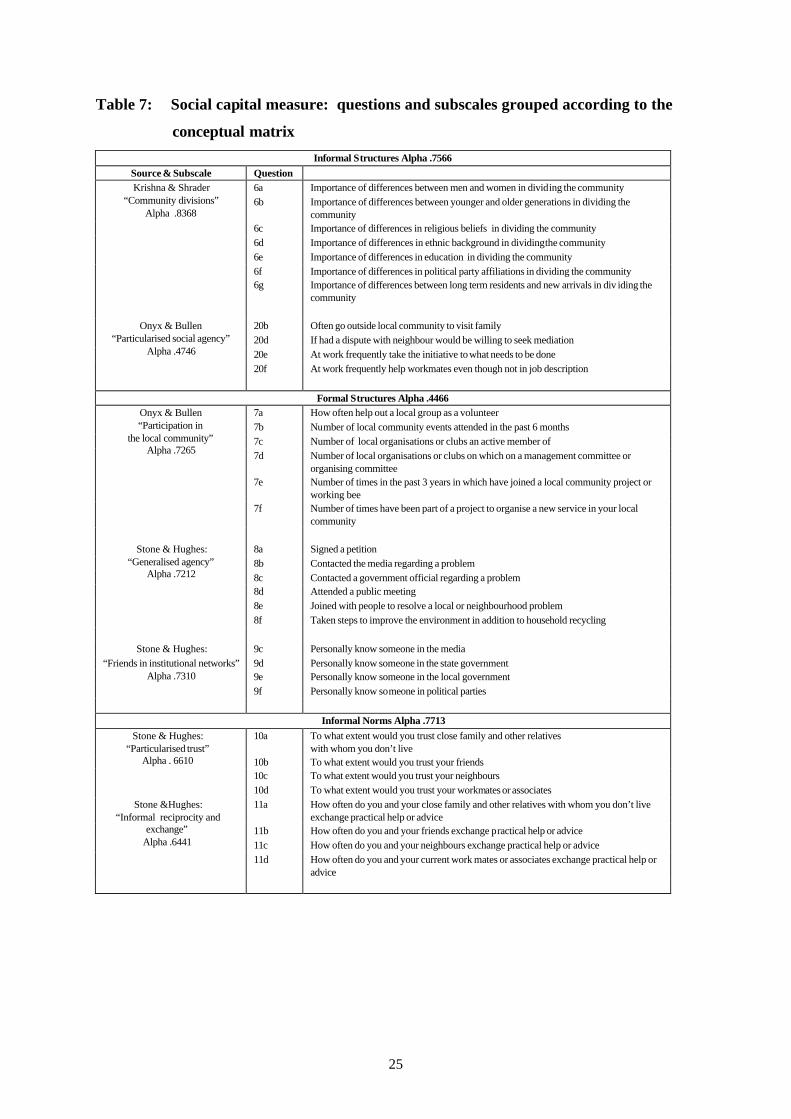
However, to achieve these results the deletion of certain questions from particular scales was

found to be necessary (see SERC 2002:67–69 for a discussion). The results are given in Table

7.

4.6 Finalised measures of social capital

From the results of the above analysis it was possible to construct four primary scales and 15

subscales. But for those scales to be used in determining the relative levels of social capital of

different communities, a method of constructing scale scores had to be developed.

25

Table 7: Social capital measure: questions and subscales grouped according to the

conceptual matrix

Informal Structures Alpha .7566

Source & Subscale Question 6a Importance of differences between men and women in dividing the community 6b Importance of differences between younger and older generations in dividing the

community 6c Importance of differences in religious beliefs in dividing the community 6d Importance of differences in ethnic background in dividing the community 6e Importance of differences in education in dividing the community 6f Importance of differences in political party affiliations in dividing the community

Krishna & Shrader “Community divisions”

Alpha .8368

6g Importance of differences between long term residents and new arrivals in div iding the community

20b Often go outside local community to visit family 20d If had a dispute with neighbour would be willing to seek mediation 20e At work frequently take the initiative to what needs to be done

Onyx & Bullen “Particularised social agency”

Alpha .4746

20f At work frequently help workmates even though not in job description

Formal Structures Alpha .4466 7a How often help out a local group as a volunteer 7b Number of local community events attended in the past 6 months 7c Number of local organisations or clubs an active member of 7d Number of local organisations or clubs on which on a management committee or

organising committee 7e Number of times in the past 3 years in which have joined a local community project or

working bee

Onyx & Bullen “Participation in

the local community” Alpha .7265

7f Number of times have been part of a project to organise a new service in your local community

8a Signed a petition 8b Contacted the media regarding a problem 8c Contacted a government official regarding a problem 8d Attended a public meeting 8e Joined with people to resolve a local or neighbourhood problem

Stone & Hughes: “Generalised agency”

Alpha .7212

8f Taken steps to improve the environment in addition to household recycling

Stone & Hughes: 9c Personally know someone in the media 9d Personally know someone in the state government 9e Personally know someone in the local government

“Friends in institutional networks” Alpha .7310

9f Personally know someone in political parties

Informal Norms Alpha .7713

10a To what extent would you trust close family and other relatives with whom you don’t live

10b To what extent would you trust your friends 10c To what extent would you trust your neighbours

Stone & Hughes: “Particularised trust”

Alpha . 6610

10d To what extent would you trust your workmates or associates 11a How often do you and your close family and other relatives with whom you don’t live

exchange practical help or advice 11b How often do you and your friends exchange practical help or advice 11c How often do you and your neighbours exchange practical help or advice

Stone &Hughes: “Informal reciprocity and

exchange” Alpha .6441

11d How often do you and your current work mates or associates exchange practical help or advice

26

Table 7: Social Capital Measure: Questions and Subscales Grouped According to the

Conceptual Matrix (continued)

Formal Norms Alpha .8525

Source & Subscale Question

12a Our community should welcome ideas from outside cultures

12b Rather than staying separate it’s better if all groups adapt and blend in to our community

12c We should be cautious about accepting certain groups into our community

13a Multiculturalism makes life in my local community better

SERC and Onyx & Bullen “Openness and tolerance of

diversity” Alpha .6713

13b I enjoy living amongst people of different lifestyles

14a Feel safe walking down street after dark

14b Most people can be trusted

14c Someone’s car breaks down outsid e house, generally would invite them into home to use the phone

14d Local community has a reputation for being a safe place

15a Feel safe being at home alone during the day

Onyx & Bullen and Christakopoulou et al.

“Feelings of safety & generalised

Alpha .7603

15b Feel safe walking alone in the street during the day

17a Confidence in churches

17b Confidence in schools

17c Confidence in police force

17d Confidence in local media

17e Confidence in government

Stone & Hughes “Confidence in links”

Alpha .7328

17f Confidence in local council

19a People around here really willing to help each other out

19b People around here share the same values

19c Feel a strong sense of identity with local community

Stone & Hughes “Community spirit”

Alpha .7107

19d Well informed about local affairs

21a Feel emotionally attached to the local community

21b Feel that belong to the local community

21c Would like to be living in the local community in 3 years time

Christakopoulou et al. “Place attachment”

Alpha .8672

21d Proud to live in the local community

18c Wanted to give something back to the group/community

18d To meet people and make friends

18e A series of coincidences and unexpected connections

18f Forced to do it

Stewart-Weeks & Richardson “Formal reciprocity”

Alpha .9478

18g Friends were involved

16a In a local major development extent believed that the local federal member of parliament would take local people’s views into account

16b In a local major development extent believed that the local state member of parliament would take local people’s views into account

16c In a local major development extent believed that the local council would take local people’s views into account

16d In a local major development extent believed that the government department running the development would take local people’s views into account

SERC “Trust of links”

Alpha .7944

16e In a local major development extent believed that the developer would take local people’s views into account

27

To do so a relatively simple procedure was followed. Each of the questions in each subscale

was rated on a four-point rating scale, or in the case of two subscales a two-point rating scale,

with one extreme indicating an important contribution to social capital while the other

extreme indicated no important contribution to social capital. By simply summing the ratings

of each question comprising a scale, scale scores could be obtained. The ratings can vary

from a minimum when none of the questions in the scale is judged as contributing to social

capital or where they are judged as having a negative effect, to a maximum when all are

judged as contributing to social capital. Thus with the Informal Structures scale with 11

questions, scores could range from 11 to 44, while for the Formal Norms scale with 35

questions, scores could range from 35 to 140. To facilitate comparisons, once those initial

scales were determined, scores were re-scaled on a ten-point scale (1 to10) where 10

indicates a highly significant contribution to social capital and 1 indicates little or no

contribution. The means and standard deviations for each of the four primary scales are given

in Table 8, while the same statistics for the subscales are shown in Table 9.

Table 8: Primary scale means for five communities

Primary scale Mean Standard deviation

Informal Structures 7.3455 1.6030

Formal Structures 3.7511 1.9621

Informal Norms 6.9592 1.4954

Formal Norms 6.3076 1.0864

Table 10 shows that while intercorrelations between the primary scales were generally significant,

the correlations are not high, which suggests that while the four primary measures of social

capital are to a degree related, high scores on any one of these is not likely to predict strongly a

high score on others.

28

Table 9: Subscale means grouped by primary scale for five communities

Subscale Mean Standard Deviation

Informal Structures subscales

Community divisions 6.9825 2.3470

Particularised social agency 8.0271 1.3662

Formal Structures subscales

Participation in the local community 3.6180 2.2067

Generalised agency 3.6534 2.3780

Friends in institutional networks 4.4370 3.2848

Informal Norms subscales

Particularised trust 7.5276 1.7676

Informal reciprocity and exchange 6.3574 1.7219

Formal Norms subscales

Openness to diversity* 6.8073 1.5982

Tolerance of diversity 7.1616 1.9402

Feelings of safety and generalised trust 6.7838 1.7176

Confidence in links 6.7349 1.6827

Community spirit 6.5844 2.0908

Place attachment 6.9923 2.1395

Formal reciprocity 4.8846 1.5421

Trust of links 6.1525 2.2338

*Based on confirmatory sample of Auburn and Richmond.

Table 10: Intercorrelations between the four primary factors of social capital

Informal structures Formal structures Informal norms Formal norms Informal structures 1 Formal structures .103 1 Informal norms .164** .256** 1 Formal norms .244* .130 .090 1 **Correlation is significant at the 0.01 level (2-tailed). *Correlation is significant at the 0.05 level (2-tailed).

A final factor analysis of the scores on the subscales was conducted (principal components

analysis with varimax rotation). It was found that the subscales measuring Formal Norms all had

high factor loadings on factors 1 and 2. The subscales measuring Formal Structures loaded

equally highly on factor 3. One of the scales measuring Informal Structures had a high loading on

factor 4, whereas the other subscales loaded highly on factor 2. The subscales for Informal Norms

all had high factor loadings on factor 5. As a result of this factor analysis the question is raised

concerning the possibility of using a ‘scaled down’ measure—a selection of subscales from one

or two of the primary measures of which they are components—for use across a range of

communities where shortened measures may be derived. Appropriate candidates for such an

29

approach include: (a) ‘community divisions’, a subscale of Informal Structures; (b) ‘generalised

agency’, part of Formal Structures; (c) ‘particularised trust’ and ‘informal reciprocity and

exchange’, subscales of Informal Norms; and (d) ‘formal reciprocity, a subscale of Formal

Norms.

However, as a result of the exploratory and confirmatory analyses discussed above, we were able

to propose the four primary scales and the associated 14 subscales as measures of social capital as

set out in Table 11.

Table 11: Primary scales and corresponding subscales

Informal Structures Formal Structure Informal Norms Formal Norms

♦ Community divisions*+

♦ Particularised social agency

♦ Participation in the local community

♦ Generalised agency *+

♦ Friends in institutional networks

♦ Particularised trust*+

♦ Informal reciprocity and exchange*

♦ Openness to and Tolerance of diversity*

♦ Formal reciprocity

♦ Feelings of safety and generalised trust

♦ Community spirit

♦ Place attachment*+

♦ Confidence in links

♦ Trust of links *If reduced measure of five subscales is selected use this subscale to represent the primary scale. +If reduced measure of four subscales is selected use this subscale to represent the primary scale.

Ideally, a comprehensive assessment of Domain (4) should be based on the four primary scales.

But if time and cost constraints mitigate against the use of the comprehensive measures, then two

alternatives might be considered:

• The first alternative involves selecting five stipulated sub-scales from the primary scales,

including the following: (a) Informal Structures – ‘community divisions’; (b) Formal

Structures – ‘generalised agency’; (c) Informal Norms – ‘particularised trust’; and (d) Formal

Norms – ‘openness and tolerance of diversity’, and ‘place attachment’.

• The second alternative involves the selection of just one subscale from each primary scale as

follows: (a) Informal Structures – ‘community divisions’; (b) Formal Structures – ‘generalised

agency’; (c) Informal Norms – ‘particularised trust’; and (d) Formal Norms – ‘place

attachment’.

30

4.7 Measuring outcomes and correlates of social capital

So far the discussion relating to Domain (4) as a measure of community strength has focused on

addressing the framework proposed by Black and Hughes (2001). However, differences in

community strength are also likely to be related to other aspects of social life. Thus it was decided

as well to explore through the surveys how community strength may be related to: (a) Anomie;

(b) Perceived Quality of Life and Well-Being; (c) Perceived Natural and Human Capital; and (d)

Perceived Economic Capital. Measures were taken from existing studies (Health Development

Agency 2001; Western et al. 1999).

In the exploratory phase of the analysis, a total of 32 items were used to measure these five

factors, and factor analysis of those items resulted in six factors explaining 59 per cent of the total

variance being identified for further analysis. Next, the degree to which those factors reflected the

outcome measures was explored. Finally, Cronbach’s Alphas were calculated for each of the

scales constructed.

The factors identified were:

• Factor 1 (22 per cent of the total variance), which reproduces the Anomie measure totally.

• Factor 2 (12 per cent) which comprises the majority of Perceived Quality of Life and Well-

being measures with the exception of two dealing with economic well-being which appear

together in Factor 5.

• Factor 3 (10 per cent) which is less clearly defined, and includes one overall measure of

Perceived Quality of Life and Well-being and three dealing with Perceived Natural and

Human Capital.

• Factor 4 (6 per cent), which is more clear cut, including all of the Perceived Natural Capital

items with the exception of those found in Factor 3.

• Factor 5 (4 per cent), which deals with Perceived Economic Capital.

• Factor 6 (4 per cent), which is defined by three items dealing with Perceived Economic

Capital but relating specifically to quality of services.

When reliability measures on the original conceptual desired scales were calculated, the

Cronbach’s Alpha range from .9305 for Anomie to .7394 for Perceived Natural and Human

31

Capital. In the confirmatory phase of the analysis, the Cronbach’s Alpha for Anomie is lower at

.784, but the Alphas are consistent with respect to the other derived scales.

To explore the relationship between the measures of Anomie, Perceived Quality of Life and

Well-being, Perceived Natural and Human Capital, and Perceived Economic Capital, a series of

ordinary least squares analysis (OLS) were conducted in which the four primary social capital

scales (discussed previously) are used as predictors. Table 12 summaries the results. The R2

column in the table shows the amount of variance in the measures explained by the predictors.

This technique indicates how good an explanation predictor variables provide in accounting for

variability in the outcome and correlate measures. It is evident that the primary scales better

explain Anomie (R2 = .201) and Perceived Quality of Life and Well-being (R2 = .229) than they

do variability in Perceived Natural and Human Capital (R2 = .151) and Perceived Economic

Capital (R2 = .156). The strongest predictor variables were Informal Structures and Informal

Norms (significant at better than p≤ .0001) for Anomie and Perceived Quality of Life and Well-

being. For Perceived Quality of Life and Well-being, Formal Norms were the next strongest

predictor (at better than p≤ .01). Formal Structures and Informal Norms were significant

predictors of Anomie (at better than p≤ .05).

Table 12: Significant predictors of the outcomes and correlates of social capital

Outcomes and correlates of social capital

R2 Significant predictors

B Standardised beta

Anomie .201 Informal Structures Formal Structures Informal Norms

.328

.113

.177

.323***

.142*

.164*

Perceived quality of life and well-being

.229 Informal Norms Formal Norms+

.327

.210 .378*** .186**

Perceived natural and human capital

.151 -

Perceived economic capital .156 -

***Coefficient is significant at the 0.0001 level (2-tailed). ** Coefficient is significant at the 0.01 level (2-tailed). * Coefficient is significant at the 0.05 level (2-tailed). +Question 12a,b and c “0penness to diversity” excluded from analysis as not used in the exploratory communities.

-No significant predictors.

32

These findings lead us to suggest that, in communities in which Informal Structures and Formal

Structures are strong, and in which Informal Norms are strong, then Anomie will be less likely

than in communities in which Structures and Norms are not as strong. Similarly, in communities

in which both Informal Norms and Formal Norms are strong, then Perceived Quality of Life and

Well-being is less likely to be greater than in communities in which Informal Norms and Formal

Norms are not strong. But it is perhaps significant that social capital variables are not strong

predictors of Perceived Natural and Human Capital and Perceived Economic Capital. Those

factors may perhaps be more appropriately seem as additional measures of community strength,

and they address some of the issues of Domains (1), (2) and (3).

4.8 Community profiles on Domain (4)

Scores for five of the case study communities, derived from the analysis of survey data as

outlined above, were calculated on all four of the primary scales to measure the Social and

Institutional Capital Domain. These scores are plotted in Figure 2. The bars in the figure represent

the mean scores (1 to 10) for survey respondents on each primary scale for each community. A

one way analysis of variance (ANOVA) may be used to test for statistically significant

differences between the communities on any of the measures. While not included here, additional

graphics plotting the scores for communities on the subscales relating to the four primary scales

(as listed in Table 11) can readily be produced.

Focusing just on the data presented in Figure 2, it is evident that all five of the case study

`communities, with the exception of Auburn, had higher scores on Informal Structures than on

the three remaining primary scales. All five communities had lower scores on Formal Structures

than any of the other scales. Recalling that all measures have been rescaled to provide scales of

the same magnitude (1 to 10), the data suggest that all but one of the communities have stronger

Informal Structures than Formal Structures, and except for Auburn, all have stronger Informal

Structures than either Informal or Formal Norms.

33

Figure 2: Social capital scale scores by community

Auburn is significantly weaker than the other communities with respect to Informal Structures

(p≤.0001). With respect to Formal Structures, Boonah and Eaglehawk are stronger than the other

three communities (Boonah at p≤.0001 respectively; and Eaglehawk p≤.0001 for Zillmere, p≤.01

for Richmond, and p≤.05 for Auburn). There are no community differences with respect to

Informal Norms. But for Formal Norms, Boonah is significantly stronger than all the other

communities (p≤.0001), with Eaglehawk and Richmond being significantly stronger than

Zillmere (p≤.05).

The data thus show the strongest communities on the primary scales of the Social and

Institutional Capital Domain are Boonah and Eaglehawk with respect to Formal Structures, and

Boonah with respect to Formal Norms. The weakest communities are Auburn for Informal

Structures and Zillmere for Formal Norms.

For a close examination of community differences on both the primary scales and the subscales

and with respect to the outcomes of social capital, see the discussion in SERC (2001:104–111).

What those extended analyses show is the following:

• Boonah is generally the strongest community on the Social and Institutional Capital Domain.

It is strongest on seven subscales—participation in local community; friends in institutional

networks; particularised trust; confidence in links; trust of links; community spirit; feelings of

1

3

5

7

9

Zillmere Eaglehawk Auburn

Community

Mea

n sc

ore

1 to

10

(poo

r to

goo

d)

Informal Structures Formal Structures Informal Norms Formal Norms

Boonah Richmond

34

safety and generalised trust—and it is weakest on only one, tolerance of diversity. Boonah is a

rural urban community.

• Auburn is weak on five of the subscales—community divisions; particularised social agency;

community spirit; place attachment; and feelings of safety and generalised trust. it is an inner

to middle suburban community in Australia’s largest city.

• Zillmere is not far behind Auburn in showing a lack of community strength on this Domain. It

is not strong on any subscale, and is relatively weak on community spirit, place attachment,

and feelings of safety and particularised trust. It is an outer industrial area in a large

metropolitan area.

• Richmond comes between these extremes. It has highest ratings on the openness to diversity

and tolerance of diversity subscales, but it is weak on formal reciprocity. Richmond is an old

inner city industrial suburb undergoing transformation with gentrification.

• Eaglehawk is also between the extremes, showing no inherent weaknesses, but it is only strong

on one subscale, participation in local community. It is part of a large inland regional city.

The overall results are further supported by the outcome of measures and correlates. Auburn is

the weakest of the communities on each of the four subscales of Anomie, Perceived Quality of

Life and Well-being, Perceived Natural and Human Capital, and Perceived Economic Capital. No

significant differences are evident amongst the remaining communities.

From this case study approach it is not possible to draw definitive conclusions. However, low

community strength as measured by the Social and Institutional Capital Domain scales appears to

be associated with relatively high levels of Anomie, low levels of Perceived Quality of Life and

Well-being, and low levels of Perceived Natural and Human Capital and of Perceived Economic

Capital. However, those preliminary indications need further detailed investigation across a much

larger number of different types of communities.

5 CONCLUSION

This paper has discussed an approach to development of measures of community strength,

developing indicators on three domains—(1) Natural Capital; (2) Produced Economic Capital; (3)

35

Human Capital—using secondary data analysis, and on a fourth Domain—(4) Social and

Institutional Capital—using primary data collection through the design of a survey instrument to

collect information and derive measures of community performance on four primary scales and

14 subscales. The study has sought to operationalise the framework proposed by Black and

Hughes (2001), and to provide a ‘toolkit’ which communities may use to assess its own strengths

and weaknesses, enabling them to perhaps then identify opportunities for community growth and

development. The outcomes of the study outlined here may be useful to FaCS to pursue the

Commonwealth Government’s agenda of building stronger families and communities.

The study proposes a number of indicators that may readily be derived from secondary data,

including census information, to measure performance on the first three Domains. However, as

discussed elsewhere (SERC 2002), more robust measures of community performance with

respect to Domains (2) and (3) may need to be derived from a global analysis of the performance

of SLAs (communities) across all of Australia, using multivariate analytic tools as demonstrated

by the work of Baum et al. (1999). Major data deficiencies do exist at the level of the SLA which

preclude the developing of effective measures of performance on Domain (1) in the context of the

implied intent of that domain as per the proposals by Black and Hughes (2001). The SERC

(2002) report proposes a national approach to secondary data analysis and modelling along the

lines undertaken by Baum et al. (1999) to rigorously derive benchmarked measures of

community performance on aspects of Domain (1) and with respect to Domains (2) and (3), with

access to the results being via an Internet website.

Perhaps the most interesting and certainly the most innovative aspect of the work has been the

attempt to develop a validated survey instrument to measure community strength vis-à-vis a

series of dimensions on Domain (4). The structured analytical measurement and outcomes

approach developed and overviewed in the bulk of this paper provides a tested and validated

methodology and survey instrument which a community may use to measure its performance on

four primary and 14 subscales of the Social and Institutional Capital Domain. It must be stressed

that we do not believe that the instrument and methods to derive scales of community

performance on that Domain are suitable for application to predominantly indigenous

communities, and an alternative approach has been developed and proposed from our work in the

Wadeye community (see SERC 2002:89–101). Space does not permit that approach to be

discussed here.

36

The report by SERC (2002) makes a series of recommendations as to how the measurement tools

developed in this project might be applied and effectively managed in pursuing the agenda of

strengthening communities across Australia.

ACKNOWLEDGMENT

This paper draws on research conducted by the authors and others in a team put together in 2001

to undertake Phase 2 of the FaCS Community Strength Indicators and Measurement Project. The

research was undertaken under a grant from the Commonwealth through FaCS to SERC at the

University of Queensland. The contents of this paper are derived from the SERC (2002) report to

FaCS.

REFERENCES

Baum, S., Mullins, P., Stimson, R. and O’Connor, K. 2002, Communities of the post-

industrial city, Urban Affairs Review, vol. 37, no. 3, pp. 322–357.

Baum, S. Stimson, R. O’Connor, K. Mullins, P. and Davis, R. 1999, Community Opportunity

and Vulnerability Across Australia’s Cities and Towns: Characteristics, Patterns and

Implications, University of Queensland Press for the Australian Housing and Urban

Research Institute, Brisbane.

Beer, A. 1999, Regional cities within Australia’s evolving urban system, 1991–96,

Australasian Journal of Regional Studies, vol. 5, no. 3, pp. 329–348.

Beer, A. Bolam, A. and Maude, A. 1994, Beyond the Capitals: Urban Growth in Regional

Australia, Australian Government Publishing Service, Canberra.

Beer, A. and Maude, A. 1995, Regional cities within the Australian urban system, 1961 to

1991, Urban Policy and Research, vol. 13, no. 3, pp. 135–148.

Black, A. and Hughes, P. 2001, The Identification and Analysis of Indicators of Community

Strength and Outcomes, Occasional Paper no. 3, Department of Family and

Community Services, Canberra.

Christakopoulou, S., David, J. and Aikaterini, 2001, The community well-being

questionnaire: theoretical context and initial assessment of its reliability and validity,

Social Indicators Research, vol. 56, pp. 321–351.

Coleman, J.S. 1988, Social capital and the creation of human capital, American Journal of

Sociology, vol. 94, pp. S95–S120.

37

Coleman, J.S. 1990, Foundations of Social Theory, Harvard University Press, Cambridge,

Mass.

Cox, E. and Caldwell, P. 2000, Making social policy, in I. Winter (ed), Social Capital and

Public Policy in Australia, Australian Institute of Family Studies, Melbourne, pp. 43–

73.

Dasgupta, P. 1998, Trust as a commodity, in D. Gambetta (ed), Trust, Basil Blackford,

Oxford.

FaCS, 1999, Stronger Families and Communities Strategy Information Paper,

http://www.facs.gov.au (16 January 2001).

Fincher, R. and Nieuwenhuysen, J. (eds.) 1998, Australian Poverty: Then and Now,

Melbourne University Press, Melbourne.

Gauntlett, E., Hugman, R., Kenyon, P. and Logan, P. 2001, A Meta-Analysis of the Impact of

Community-Based Prevention and Early Intervention Action, Department of Family

and Community Services, Canberra.

Giddens, A. 1990, The Consequences of Modernity, Stanford University Press, Stanford, Ca.

Gluckman, M. 1967, The Judicial Process Among the Barotse of Northern Rhodesia,

Manchester University Press, Manchester.

Granovetter, M. 1973, The strength of work ties, American Journal of Sociology, vol. 78, pp.

1360–1380.

Hart, M. 2000, Sustainable Measures, http://www.sustainablemeasures.com.

Health Development Agency, 2001, United Kingdom General Household Survey: Assessing

People’s Perceptions of their Neighbourhood and Community Involvement, (Part 1),

Health Development Agency.

Hunter, B. and Gregory, R.1996, An exploration of the relationship between changing

inequality of individual, household and regional inequality in Australian cities, Urban

Policy and Research 14(3): 171–182.

Hustedde, R., Schaffer, R. and Pulver, G. 1995, Community Economic Analysis: A How to

Manual, North Central Regional Centre for Rural Development, Iowa State

University, Iowa.

Krishna, A. and Shrader, E. 1999, Social capital assessment tool, Conference on Social

Capital and Poverty Reduction, The World Bank, Washington, DC.

Narayan, D. 1999, Bonds and bridges: social capital and poverty, Poverty Group, The World

Bank, Washington DC, pp. 1–52.

38

O’Connor, K. and Stimson, R. 1995, Convergence and divergence of demographic and

economic trends, in P. Newton and M. Bell (eds.), Population Shift, Australian

Government Publishing Service, Canberra.

Onyx, J. and Bullen, P. 1997, Measuring Social Capital in Five Communities in NSW: An

Analysis, Centre for Community Organisations and Management Working Paper

Series No. 41, University of Technology, Sydney.

Onyx, J. and Bullen, P. 2000, Sources of social capital, in I. Winter (ed.), Social Capital and

Public Policy in Australia, Australian Institute of Family Studies, Melbourne.

Putnam, R.D. 1998, Foreword to the housing policy debate issue on ‘social capital’: its

importance to housing and community development, Housing Policy Debate, vol. 9,

pp. v–viii.

Putnam, R.S. 2000, Bowling Alone: The Collapse and Revival of American Community,

Simon and Schuster, New York.

Putnam, R.D. Leonardi, R. and Nanetti, R. 1993, Making Democracy Work: Civic Traditions

in Modern Italy, Princeton University Press, Princeton.

Uslaner, E.M. 1999, Trust but verify: social capital and moral behaviour, Social Science

Information, vol. 38, pp. 29–56.

SERC, 2002, Assessing Community Strength: A Proposed Set of Indicators and Measures,

Report fro the Department of Family and Community Services, Social and Economic

Research Centre, in association with the Aboriginal Environments Research Centre,

University of Queensland, Brisbane, October, pp. 158.

Stewart-Weeks, M. and Richardson, C. 1998, Social Capital Stories: How 12 Australian

Households Live their Lives, Centre for Independent Studies, St Leonards, NSW.

Stimson, R. 1997, Labour markets in Australia: trends and spatial patterns in the context of

global and local processes, in P. Rimmer (ed.), Pacific Rim Development: Integration

and Globalisation in the Asia Pacific Economy, Allen and Unwin, Sydney.

Stimson, R., Baum, S., Mullins, P. and O’Connor, K. 2001a, A typology of community

opportunity and vulnerability in metropolitan Australia, Papers in Regional Science,

vol. 80, no. 1, pp. 45–66.

Stimson, R., Baum, S., Mullins, P. and O’Connor, K. 2001b, Australia’s regional cities and

towns: modelling opportunity and vulnerability, Australasian Journal of Regional

Studies, vol. 7, no. 1, pp. 23–62.

39

Stimson, R. Shuaib, F. and O’Connor, K. 1998, Population and Employment in Australia:

Regional Hot Spots and Cold Spots1986 to 1996, University of Queensland Press, for

the Australian Housing and Urban Research Institute, Brisbane.

Stone, W. 2001, Measuring Social Capital: Towards a Theoretically Informed Measurement

Framework for Researching Social Capital in Family and Community Life, Research

Paper No. 24, Australian Institute of Family Studies, Canberra, February.

Stone, W. and Hughes, J. 2001, Families, social capital and citizenship survey, Australian

Institute of Family Studies, Melbourne.

Western, J.S., Gransver, B. and Attleslander, P.M. 1999, Comparative Anomie Research: Hidden

Barriers, Hidden Potential for Social Development, Ashgate, Aldershot.

Woolcock, M. 1998, Social capital and economic development: toward a theoretical synthesis

and policy framework, Theory and Society, vol. 27, pp. 151–208.

Woolcock, M. and Narayan, D. 2000, Social capital: implications for development theory,

research and policy, The World Bank Research Observer, vol. 15, pp. 225–249.


Recommended