33
© Rich Gordon 2013 What Gets Measured Gets Done: Web and Social Analytics for Publishers Local Media Association – May 15, 2013 Rich Gordon @richgor
| Date post: | 13-Jul-2015 |
| Category: |
Business |
| Upload: | rich-gordon |
| View: | 147 times |
| Download: | 1 times |

© Rich Gordon 2013
What Gets Measured Gets Done:Web and Social Analytics for Publishers
Local Media Association – May 15, 2013
Rich Gordon
@richgor

© Rich Gordon 2013
The problem for publishers
• The Web: “the most measurable medium ever”
• We are awash in measurement data
• What should we keep track of?
• Publishers have unique measurement needs
Use of phrase “Key Performance Indicators” in books 1990-2008
Source: books.google.com ‘ngram viewer’
© Rich Gordon 2013
Key Performance Indicatorsfor publishers
• Based on three years of classes in which I had Medill students examine “networked audience development practices” – and metrics – for locally focused websites:– Links & content referrals– SEO
– Social media
• Based mostly on Google Analytics
• A work in progress – I welcome your feedback

© Rich Gordon 2013
Propositions for today
• Every publisher should have a set of KPI’s that are tracked consistently and regularly
• These KPI’s should be shared throughout the organization
• Performance on KPI’s should be factored into personnel decisions
• KPI’s should align to business goals – they will be different for every publisher
© Rich Gordon 2013
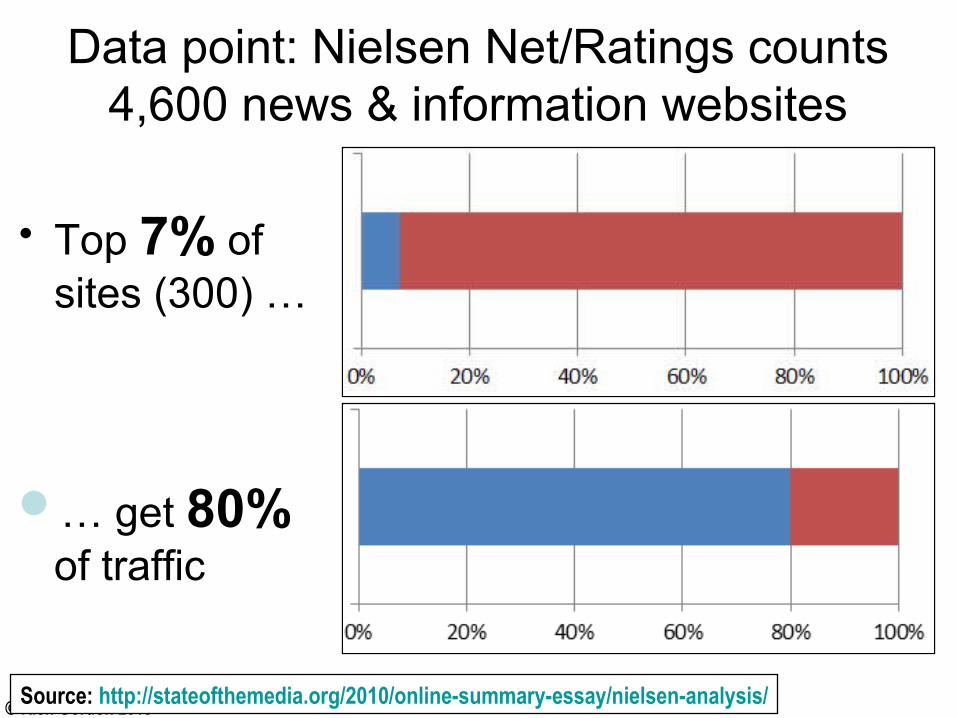
Data point: Nielsen Net/Ratings counts4,600 news & information websites
• Top 7% of sites (300) …
… get 80% of traffic
Source: http://stateofthemedia.org/2010/online-summary-essay/nielsen-analysis/

© Rich Gordon 2013
Why are category leadersso dominant?
• Network effects from links, search, social media: “the rich get richer”
• Networks tend to produce “power law distributions” of attention
• The “80/20” rule: A small fraction of the total number of nodes in the network gets a disproportionate share of the attention

© Rich Gordon 2013
Basic metrics
• Which of these metrics is best for measuring audience over time?– Size/scale– Loyalty/frequency
– Audience engagement

© Rich Gordon 2013
User clickson link,
requests page
Contentserver
delivers page
Ad requestsgo to
ad server
To understand online metrics and audiences,consider how the technology works

© Rich Gordon 2013
Your browser assembles files,presents them to the user as a page
Each server that delivers a file(HTML page, image, ad banner, Google Analytics code) can also deliver a “cookie”

© Rich Gordon 2013
Audience vocabulary,for starters
• Unique Visitors (Unique Audience): The total number of unique persons visiting a Web site at least once in a time period (usually one month). Persons visiting the same site more than one time in the reporting period are counted only once.
• Visit (Session): A continuous series of URL/page requests. A gap of 30 minutes between URL requests ends a session/visit.
• Page views: The total number of times a Web page is requested by a user. Counted only when page fully loads in browser window.
• Bounce Rate: Portion of visits that are exactly one page view.
computers visiting

© Rich Gordon 2013
Unique visitors vs. visits• Remember that what’s really being counted here
is cookies• A visit happens any time the server delivers a
new cookie or reads an existing cookie on the user’s computer.
• Unique visitors are counted each time a cookie to a new user/computer (or a user/computer the server believes is new)
• A new visitor is a computer/browser that has not been seen before in the given time period (typically a month)
© Rich Gordon 2013
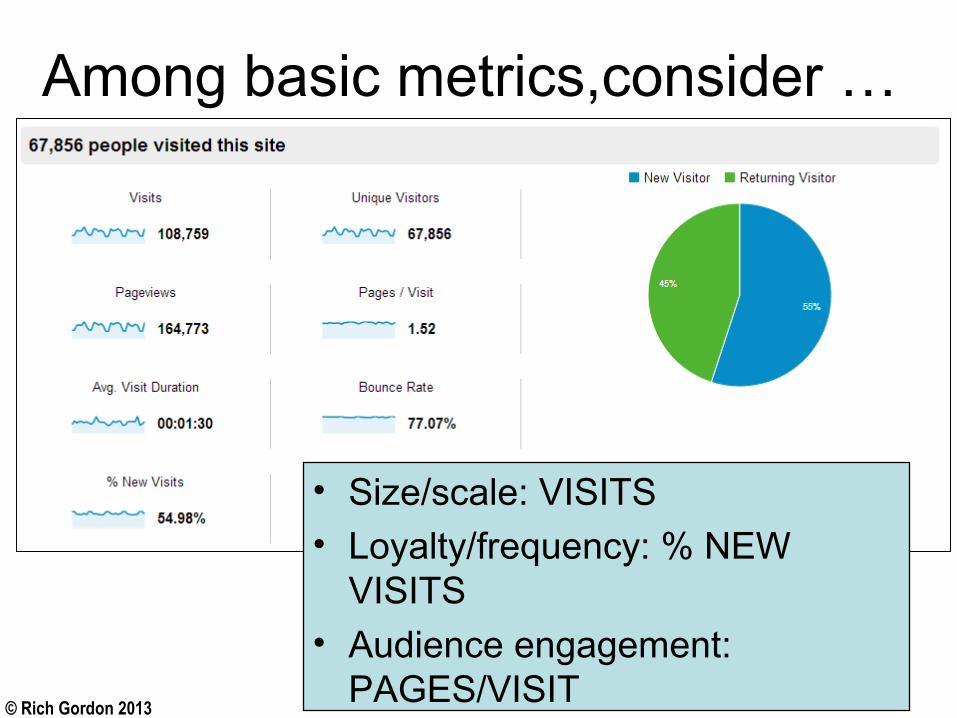
Among basic metrics,consider …
• Size/scale: VISITS• Loyalty/frequency: % NEW
VISITS• Audience engagement:
PAGES/VISIT
© Rich Gordon 2013
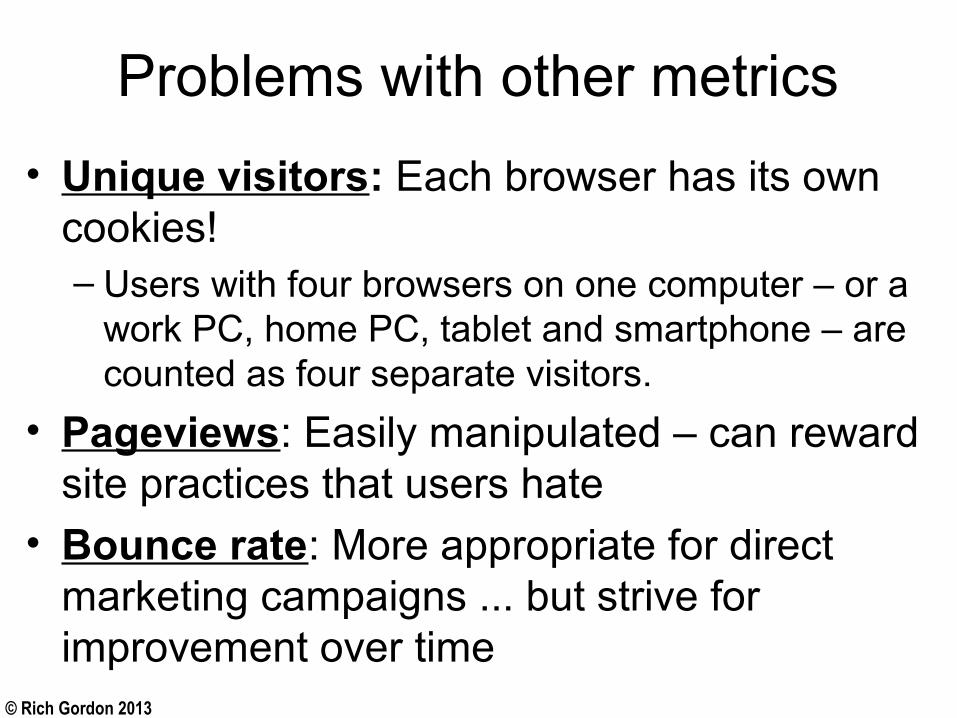
Problems with other metrics
• Unique visitors: Each browser has its own cookies! – Users with four browsers on one computer – or a
work PC, home PC, tablet and smartphone – are counted as four separate visitors.
• Pageviews: Easily manipulated – can reward site practices that users hate
• Bounce rate: More appropriate for direct marketing campaigns ... but strive for improvement over time
© Rich Gordon 2013
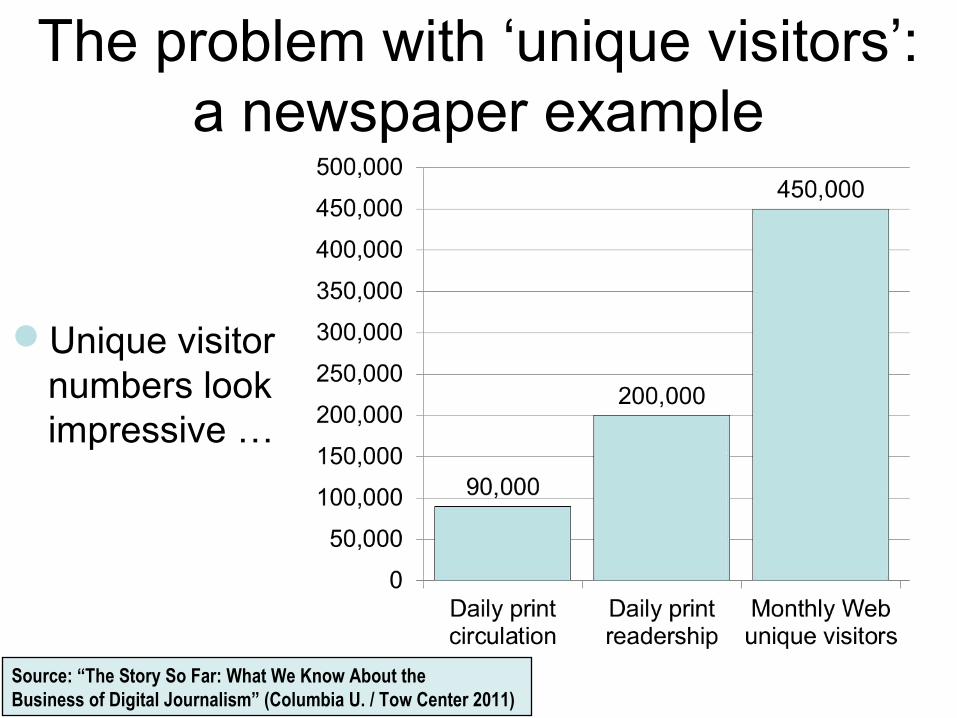
The problem with ‘unique visitors’:a newspaper example
Unique visitor numbers look impressive …
Source: “The Story So Far: What We Know About the Business of Digital Journalism” (Columbia U. / Tow Center 2011)

© Rich Gordon 2013
… but most users don’t visit very often
Number of visits per month 1 2 3-6 7-9 10+
Source: Nielsen Company and PEJ Research

© Rich Gordon 2013
Newspaper example:core users drive vast majority of traffic
Source: “The Story So Far: What We Know About the Business of Digital Journalism” (Columbia U. / Tow Center 2011)
(>2 visits/week)
(1-2 visits/week)
(2-3 visits/mo.)
(1 visit/mo. or less)
25% of the visitorsgenerate 80%
of the page views
Page views per mo.
143
31
10
3

© Rich Gordon 2013
The real sizeof the core, loyal audience
Source: “The Story So Far: What We Know About the Business of Digital Journalism” (Columbia U. / Tow Center 2011)

© Rich Gordon 2013
http://www.kaushik.net/avinash/2008/01/standard-metrics-revisited-time-on-page-and-time-on-site.html
The problem with visit duration:How it’s calculated

© Rich Gordon 2013
Visit duration with browser tabs:How it’s calculated
http://www.kaushik.net/avinash/2008/01/standard-metrics-revisited-time-on-page-and-time-on-site.html

© Rich Gordon 2013
Where does site traffic come from?Search, links, social media

© Rich Gordon 2013
Where does site traffic come from?
• Search: from Google, etc.
• Referral: links on other sites
• Direct: type URL or bookmark
• Campaigns: you define in GA; often an e-newsletter
Traffic Sources | Overview

© Rich Gordon 2013
“Branded visits”: Direct + search for <sitename>
• A significant share of search-driven visits are really direct visits “in disguise”
• Add these to Direct, deduct from Search
Traffic Sources | Sources | Search Overview | Keyword
© Rich Gordon 2013
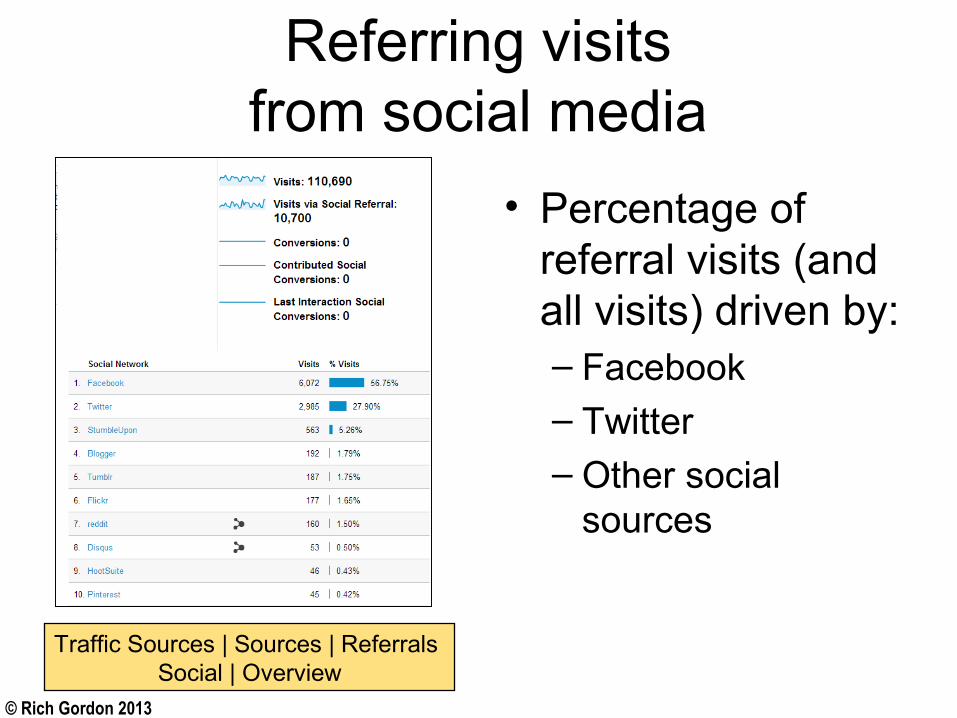
Referring visitsfrom social media
• Percentage of referral visits (and all visits) driven by:– Facebook– Twitter– Other social
sources
Traffic Sources | Sources | Referrals Social | Overview

© Rich Gordon 2013
Which referrals are most valuable:Pages/visit by source
Traffic Sources | Sources | All Traffic
Compare pages/visit from:•Direct
•Search
•Social media•Other key referring sites
© Rich Gordon 2013
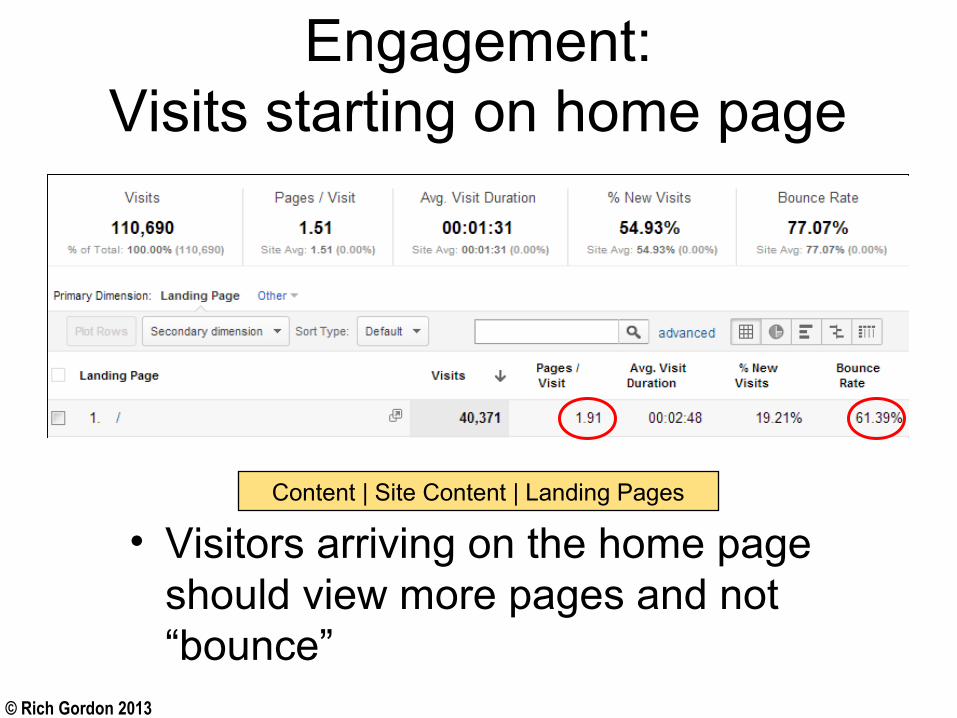
Engagement:Visits starting on home page
• Visitors arriving on the home page should view more pages and not “bounce”
Content | Site Content | Landing Pages

© Rich Gordon 2013
Engagement:Mobile vs. computer
• Pages/visit for mobile will likely be lower• Mobile-friendly (“responsive”) design should
reduce this difference• Can drill down to specific devices (phone vs
tablet)
Audience | Mobile | Overview

© Rich Gordon 2013
Social media:Facebook Insights
• Total reach: People who have seen any content associated with your page
• People talking about this: People who have created a “story” (like, comment, share, answer question, respond to event)

© Rich Gordon 2013
Social media:Facebook Insights
• Engaged users: People who have clicked on your post
• Virality: People talking about this divided by total daily reach

© Rich Gordon 2013
Social media:Facebook Insights
• Likes
• Growth in likes
• Likes per 1,000 visits
• Over 28 days:– Engaged users– People talking
about this– Virality

© Rich Gordon 2013
Social media:Twitter
• Followers
• Growth in followers
• Followers per 1,000 visits
• Retweets / month

© Rich Gordon 2013
Social media:Twitter
Follower : following ratio•High: Many people are listening to you
– Using Twitter mostly for distribution
•Low: You’re listening to many people
– Using Twitter to monitor your community

© Rich Gordon 2013
Social media:“Influence” scores
• Klout
• TweetLevel
• PeerIndex
• Many others
Each seeks to measure your “influence” on social media channels