+ All Categories
Home > Documents > Measuring Health Care Micro-Economic Efficiency: A Case ...

Measuring Health Care Micro-Economic Efficiency: A Case ...

Date post: 07-Nov-2021
Category:
Upload: others
View: 3 times
Download: 0 times
Share this document with a friend
50
Wright State University Wright State University CORE Scholar CORE Scholar Economics Student Publications Economics 1999 Measuring Health Care Micro-Economic Efficiency: A Case Study Measuring Health Care Micro-Economic Efficiency: A Case Study of Massachusetts Hospital's Quality and Value Measurement with of Massachusetts Hospital's Quality and Value Measurement with Risk Adjustments Risk Adjustments Yanling Zhang Wright State University - Main Campus Follow this and additional works at: https://corescholar.libraries.wright.edu/econ_student Part of the Business Commons, and the Economics Commons Repository Citation Repository Citation Zhang, Y. (1999). Measuring Health Care Micro-Economic Efficiency: A Case Study of Massachusetts Hospital's Quality and Value Measurement with Risk Adjustments. . https://corescholar.libraries.wright.edu/econ_student/96 This Master's Culminating Experience is brought to you for free and open access by the Economics at CORE Scholar. It has been accepted for inclusion in Economics Student Publications by an authorized administrator of CORE Scholar. For more information, please contact [email protected].
Transcript

Wright State University Wright State University

CORE Scholar CORE Scholar

Economics Student Publications Economics

1999

Measuring Health Care Micro-Economic Efficiency: A Case Study Measuring Health Care Micro-Economic Efficiency: A Case Study

of Massachusetts Hospital's Quality and Value Measurement with of Massachusetts Hospital's Quality and Value Measurement with

Risk Adjustments Risk Adjustments

Yanling Zhang Wright State University - Main Campus

Follow this and additional works at: https://corescholar.libraries.wright.edu/econ_student

Part of the Business Commons, and the Economics Commons

Repository Citation Repository Citation Zhang, Y. (1999). Measuring Health Care Micro-Economic Efficiency: A Case Study of Massachusetts Hospital's Quality and Value Measurement with Risk Adjustments. . https://corescholar.libraries.wright.edu/econ_student/96

This Master's Culminating Experience is brought to you for free and open access by the Economics at CORE Scholar. It has been accepted for inclusion in Economics Student Publications by an authorized administrator of CORE Scholar. For more information, please contact [email protected].

MEASURING HEALTH CAME MICRO-ECONOMIC EFFICIENCY: A CASE STUDY OF MASSACHSETTS HOSPITAL'S QUALITY AND VALUE MEASUREMENT WITH RISK ADJUSTMENTS

An internship report submitted in partial fulfillment Of the requirements for the degree of

Master of Science

By

Yaaling Zhang BA, Shandong University, P. R. China, 1988

MBA, Wright State University, 1997

1999Wright State University

WMIGMT STATE UMI7 EESETY

DEPARTMENT OF ECONOMICS

Augiacii 27 1999

I HEREBY RECOMMEND THAT THE INTERNSHIP REPORT PREPARED UNDER MY SUPERVISION BY Yanling Zhang ENTITLED Measuring Health Care Microeconomic Efficiency: A Case Study of Massachusetts Hospital's Quality and Value Measurement with Adjustment BE ACCEPTED IN PARTIAL FULFILLMENT OF THE REQUIREMENTS FOR THE DEGREE OF Master of Science.

John Blair, Ph.D. Faculty Supervisor

Evan Osborne, Ph.D. Faculty Reader

Roger Sylvester, Director

M.S. in Social and Applied Economics

ABSTRACT

Zhang, Yanling. M. S., Department of Economics, Wright State University, 1999. Measurissg Health Care Micro-Economic Efficiency: A Case study of Massachusetts Hospital's Quality and Value Measurement with Risk Adjustment.

This report has four main parts: 1) Introduction: The healthcare phenomenon,

considerations and economic implications; 2) A case study of measuring health care

quality and value for methodology investigation; 3) conclusions and 4) policy

implications. The principal aim of this report is to discuss methods of measuring micro-

economic efficiency in healthcare. In the introduction, economic theories including

elasticity, demand and supply, competition, market failure and so on are applied to

healthcare. Next the role of this report is placed within the context of organization I

worked for with a case study to show how to measure quality and value with risk

adjustment related to the issues raised in the introduction. Conclusions are drawn from

the case study, and limitations and other issues are raised for further study. The final

section discusses policy implications. At the end of the report, reference articles and

books are listed. And an appendix with the sample SAS (Statistical Analysis System)

programming and outputs written and generated during the intern research period are also

attached.

This internship was performed at CareGroup, an organized system of quality healthcare

serving the individual, family, and community, which includes teaching hospitals for

Harvard Medical School, located at Boston, Massachusetts.

TaMe ®ff €®mtesits

I. Introduction: Health Care Phenomenon, Consideration and Economic Implication... 1

XI . A Case Study of Measuring Health Care Quality and V alue ........... .7

Physician Performance Profile with Risk adjustment................. 7

Goals ....... 7

Background.... ...... 7

Methods for Risk Adjustment to Compare Cost Utilization ...... 9

Description of the BCGs................. 10

Research Progress to Date ....... 14

Key Findings and Application... ........... 16

Recaliberation by Service Category ........ ...30

Conclusions .................... 33

III. Conclusion. ...... 35

IV. Policy Implications............... 37

V. Reference:............... 41

VI. Appendix:......... .42

List ©ff Figures

Figure Page

2.5 Report Card Example. .............................................. 18

2.6 Predicated cost estimate by recaliberating categories ..........................31

Lisfi ©if Tables

Table Page

2.1 Summary Comparisons Using DCG3 Model On the Full Sample

Frequencies and Means for Benchmark & Current Sample ............... 22

2.2 Summary of Age and Sex ........ 23

2.3 Number of Individuals by Aggregated Condition Category (ACC) ..........23

2.4 Actual & Predicted Expenditures and Efficiency Indices by Risk Unit

-Weighted by Eligible Months............... 25

2.5 Distribution by Aggregated DCG (ADCG)....................... 26

2.6 Distribution by DCG Concurrent DCG3 Model, Predicting 1998..................27

2.7 Percentage Distribution of Aggregated DCG (ADCG)..................... 27

2.8 Distribution by Aggregated DCG(ADCG)......................................................28

2.9 Distribution by DCG ........................................................................ .28

2.10 Percentage Distribution of Aggregated DCG(ADCG) by Risk Unit

Prospective DCG3 Model, Predicting 1999............................................. ..29

L Imtr®dffletkiK BfeaMl Care PSieiiomenffim9 Consideration and Eeomomk Implication

More than ever, we feel a sense of urgency to improve health care quality and value.

Efficiency problems have significant economic implications and prompted this urgency.

Health care is unlike most consumer goods. When you go shopping, you usually can

compare the quality and price and then buy the one either with better quality or with

lower price according to your preference. However, when you are sick and need to visit a

doctor, it seems that you have no choice or you never think about making choices. You

just make an appointment to visit your primary-care physician. The vast majority of

patients lack the information necessary for informed choice. This information failure is

one of the characteristics of the health market. This information failure is one of the

characteristics of the health market. Hence, patients are compelled to delegate, to varying

degrees, treatment decisions to medical professionals who also supply the services

demanded -creating a potential conflict of interest. Even within the medical profession,

there are pervasive uncertainties about treatment options and consequences. For example,

an experienced doctor is used to prescribing the medicine with which he/she is familiar

when faced with a patient with a certain diagnosis, although there are many newly

released medicines of lessor prices and maybe more effective. Another example is that an

emergency doctor trained from a certain medical school is taught to do a radiology scan

on the patients who came to the emergency room with a complaint of ankle pain. This

may be justified, but it inevitably causes higher costs to those who do not have ankle

fractures. This suggests considerable variability in accepted medical practice.

Another issue we need to consider is the problem of moral hazard. On the demand side,

this may be reflected in an increase in the demand for covered health care because

patients do not face the full marginal cost. But moral hazard is not limited to demand.

On the supply side, for example, the incentive to over-supply medical services may be

heightened when a third party (insurance company) pays the bulk of any services that

doctors choose to provide. These effects may be strongest under fee-for-service payment

arrangements.

These are the efficiency issues. In health care, microeconomic efficiency emphasizes that

quality of care and consumer satisfaction should be maximized at minimum cost. Micro-

efficiency has two aspects: productive efficiency associated with producing a fixed set of

services at minimum cost; and effectiveness, defined as maximizing services provided for

a fixed set of inputs or maximizing the impact on health goals, defined as the length and

quality of life. Costs ought to include administrative expenses. Micro-efficiency also

requires taking into account “spill-over” effects (e.g., due to communicable diseases and

productivity-related effects on the labor force). Dynamic efficiency considerations

include searching for organizational forms and technological advances that improve the

productivity of health resources. More broadly, in assessing the most efficient ways to

improve health “outcomes”(or health status), governments need to consider whether

increased resources channeled into mainstream health services are not draining resources

from other, more effective, programs. These could include, for example, housing,

education, income maintenance, and nutrition and hygiene programs, all of which could

influence the population’s health1. Alain Enthoven (1988) makes this point nicely,

writing, “ An efficient allocation of health care resources to and within the health care

sector is one that minimizes the social cost of illness, including its treatment. This is

achieved when the marginal dollar spent on health care produces the same value to

society as the marginal dollar spent on education, defense, personal consumption, and

other uses. Relevant costs include the suffering and inconvenience of patients, as well as

the resources used in producing health care. This goal should not be confused with

minimizing or containing health care expenditures. Policy makers focus much attention

on the total amount of spending on health care services, often as a share of gross national

product (GNP). But, a lower percentage of GNP spent on health care does not necessarily

mean greater efficiency. If the reduced share of GNP is achieved by denial or

postponement of services that consumers would value at more than their marginal cost,

then efficiency is not achieved or enhanced by the cut in spending”(p. 11).2

From hospital perspective, they are faced with an environment of growing competition,

changing payment mechanisms, and consolidation. These factors and others challenge

hospital executives to respond with better quality and value management. Hospitals face

growing challenges to maintain or expand their share of a decreasing market by achieving

these capabilities. By not responding to the changes, they risk their very survival to an

' Howard Oxley and Maitland MacFarlan: "Health Care Reform Controlling Spending and Increasing Efficiency".

acquisition or merger. Hospitals also have objectives common to other businesses. For

example, they must remain profitable in order to serve their communities effectively and

to embrace capital markets for plant and technology modernization. The services they

deliver must be of high quality to attract and retain customers in a competitive

marketplace. Finally, they have significant human resource and management systems

issues to address.

Given these changes, it is more critical than ever for hospitals to examine their

environment — today and projected into the future — and to plan courses of action to

ensure their survival. For some hospitals, the competitive marketplace has caused major

problems. Their ability to react has been severely constrained by antiquated management

structures and information systems. This has forced them into a position of reaction

instead of proaction —making it difficult for them to improve their market, operational, or

financial position. However, a growing number of hospitals are taking aggressive and

innovative postures in the health care marketplace. These hospitals are developing

effective management and information structures to secure their positions, today and

tomorrow. A key feature of these new management and information structures is an

enhanced ability to manage hospital costs.

Before the Medicare Prospective Payment System (PPS) and the influx of fixed-price

payment schemes, hospitals were more concerned with increasing revenues. Since many

insurers paid published charges and Medicare reimbursed hospitals based on costs, the

2 Thomas Rice: "The Economics o f Health Reconsidered".

cost of operations was of secondary concern. However, in order to retain or increase their

profitability levels today, providers need to focus on the cost of operations to manage

their profitability—revenue and cost of operations. The key issue here is the quality

measurement and reporting. In the March 1998 report to the President, the Advisory

Commission on Consumer Protection and Quality in the Health Care Industry noted that

substantial work is required to develop and refine measures of health care quality. In

Chapter 4 "Advancing Quality Measurement and Reporting" of part II "Establishing

Health Care Quality as a National Priority", the report pointed that:" Establishing national

aims for improvement alone will not lead to better quality health care. Standardized

measures of quality are needed to track the health-care industry's progress in reaching the

aims established for the Nation and to guide public health planning and policy making.

Comparative information on quality also is needed for individual consumers, group

purchasers, and others to use in selecting health care providers and health plans.

Furthermore, valid and stable quality measures are integral to health plans' and providers’

efforts to improve performance, and, when standardized, encourage health care

organizations to learn from each other through a process of benchmarking.

Despite a growing number of efforts to measure and report on health-care quality, useful

information is neither uniformly nor widely available. Improving our ability to measure

quality has been the object of significant public and private sector activity over the last

decade, reflecting the expectation that measurement can serve both as a catalyst and a tool

for improvement. While considerable advancements have been made in the quality-

measurement field in recent years, current efforts fall short of fully meeting users' needs,

and often are duplicative and unduly burdensome on health care providers, plans, and

others.3 At C-areGroup Center for Quality and Value, we are conducting path-breaking

research to devise new and creative quality measures and cost management. In another

words, we are measuring health care microeconomic efficiency. Hospitals are

experiencing financial difficulties; insurance companies are losing money; doctors are

complaining the insurance companies are controlling too much of the freedom of care

they provide to patients. Patients are complaining that there are not enough spending on

them. Where does all the money go? What is the bottleneck to prevent from efficiency?

Efficiency is hard to measure.

The principal aim of this paper is to discuss microeconomic efficiency using a method

that measures the spending with risk adjustment for the managed care population for

CareGroup hospitals in the physician performance measurement profile project. These

projects involve investigation of methods to improve health-care quality and value. These

methods will have a significant impact on health-care policy making and improvement.

Thus, they will also have impact on the economy since health care is a large part of our

economy.

3 http://www.hcqualitycommission.gov/fmal/chap04.html

II. Case Study ©ff Me&surimg Mealtto Care QuiaMty ami Value

Phym&an P®rfmmarn&§ Pmfile with Risk adjustment

w3@als

The purpose of this profile is to develop a set of provider profiles for physicians

throughout the CareGroup health care network. These profiles will be used to guide the

behavior of clinicians and the decisions of practice groups, to identify and promote the

use of best practices. In order to achieve meaningful comparisons of outcomes across

groups of patients, I will perform risk adjustment using the Diagnostic Cost Groups-

Hierarchical Condition Category (DCG-HCC) methodology on assessments of resource

consumption and relative resource needs of patients across CareGroup's risk units for

CareGroup and Primary Care Physicians of Provider Service Network (PSN).

Background

Comparing outcomes is now central to changing the American health care delivery system

and responding to competitive market forces. Patients' outcomes are compared across

hospitals, groups of doctors (e.g., group practices, multi-specialty clinics), individual

doctors, or health plans (e.g., health maintenance organizations, managed care companies).

The comparisons are variously called performance or practice profiles, report cards,

scorecards, and outcomes reports. As Dr. Dennis S. O'Leary, 1993 President of Joint

Commission on Accreditation of Health Care Organizations said, “Report card day is

coming in the health care world". Methods for producing profiles generate considerable

controversy and raise numerous challenging conceptual and statistical questions.4 Different

hospitals and doctors see different types of patients. Many factors produce these

differences, ranging from patients' individual health needs (e.g., acuity and severity of

illness) to financial considerations to geographic location to patients' preferences and

expectations. These differences have consequences. Most importantly, patients with

complex illnesses, multiple coexisting diseases, significant disabilities, and other important

risk factors are generally more costly and likely to do poorly, even with the best care, than

healthy persons. Patients' outcomes and resource needs vary, sometimes widely, across

doctors and hospitals.

For examining resource consumption (e.g., use of captivated dollars), risk adjustment aims

to account for the higher costs of treating sick and disabled patients. Here, "risk" relates to

expected costs for a period of care, and "risk adjustment" means adjusting assessments of

resource use to reflect different levels of risk. For example, risk adjustment recognizes that

patients with lung cancer typically generate higher costs than do patients with hypertension.

Adjusting for the financial risks posed by varying health status should make physicians and

hospitals more willing to accept chronically ill persons, fostering high-quality care across

the spectrum of disease and disability.

4 Goldfield, N. and P. Boland, Eds. 1996 "Physician Profiling and Risk Adjustment" Gaithersburg, MD: Aspen Publishers, Inc.

For performance measurement, risk adjustment assumes that outcomes result from complex

interactions among various treatments, patient characteristics affecting response to

treatment, physician characteristics, quality of care, and random chance. Risk adjustment

controls for intrinsic patient characteristics, facilitating judgments about relative quality

when comparing outcomes across providers. Thus, residual differences in patient outcomes

across providers may reflect quality.

Methods for Risk Adpjstm@rut t© Compare Cost Utilization

In most profiles, utilization and expenditure are compared among risk units or physicians.

However, sicker patients tend to consume more resources than healthy patients who only

have physical examinations each year. Many health plans, including Medicare, adjust for

risk using primarily age and sex. Age and sex adjustment alone, however, explains only

about 1% of differences in annual resource consumption across patients.

Efforts to adjust risk using more clinical information are hampered by limitations of

available information. Clinical data on disease severity and patients' physical functioning

are not available. Therefore, the only current option for risk adjustment across panels of

patients uses diagnostic data from claims and encounter records submitted by physicians

and hospitals. While several methods exist for diagnosis-based risk adjustment, one of the

leaders is the Diagnostic Cost Groups (DCGs). A version of the DCGs, the Principal In-

Patient DCGs (or PIP-DCGs) has been selected by the Health Care Financing

Administration (HCFA) as the method they will implement for risk adjusting Medicare

capitation payments starting January 1, 2000.

D®serip4ion ©tf ftlh<§ DC'Ss

The Diagnostic Cost Groups Hierarchical Condition Categories (DCGs-HCCs) are among

several models for predicting future costs first developed under contract to HCFA by

investigators at Boston and Brandeis Universities in the mid-1980s. Early DCG methods

were hampered by using only inpatient Medicare claims, such as the PIP-DCGs mentioned

above. Afterwards, the DCGs-HCCs were created, using ambulatory and inpatient

encounter records for Medicare beneficiaries. Developers used three data sets: a commercial

database representing 1.4 million persons with private insurance indemnity and HMO

records from 200,000 Massachusetts state employees, and data on 1 million Michigan

Medicaid recipients.

For the CareGroup analyses, we use a version of the DCGs-HCCs developed explicitly for

working-age adults and families. To derive the DCGs-HCCs, we need to feed in 2 final big

datasets, the diagnosis file and persons file. First the diagnosis file is derived from the

claims data from 3 payers (Blue Cross Blue Shield, Harvard Pilgrim Health Care and Tufts

Health Plan). The persons file is from the eligibility tables from the above-mentioned

payers. The DxCG software designed by the DxCG company will use the 2 main files we

input and the macro derived from the regression model to assign diagnosis codes to 543

mutually exclusive "diagnostic groups," aiming to create clinically coherent categories with

adequate sample sizes. Based on regression analyses and clinical judgment, these

"diagnostic groups" collapsed into 136 condition categories, which are then used to predict

expected costs. Hierarchies within conditions aim to prevent additional diagnoses, within

related conditions, from adding to cost predictions. Thus, the DCG-HCCs assign each

person a "risk score" based on the combined effect of age, sex, and all diagnoses reported

within the last year on inpatient and outpatient claims. "Risk scores" indicate the predicted

costliness of people compared to a CareGroup sample population average of 1,0. For

example, a "risk score" of 1.5 indicates 50% higher predicted costs than average. To

examine the "risk" associated with a particular hospital or physician group, the risk scores

across all patients for that provider are added, then divided by the number of patients. This

produces an average risk score that can be compared to average scores for other groups.

Models and Variants: The DxCG program implements three DCG regression model

variants distinguished by the information used to make predictions and the way in which the

information is used:

Age-sex models use age and sex demographic information only. These models use more

traditional measures of risk assessment and are meant to serve as a base line to the other

DCG models for comparative purposes.

PIPDCG models use age, sex and principal inpatient or "PIP" diagnoses to classify an

individual according to the single most significant medical problem detected. "Most

significant" means having the highest future cost implications. Secondary diagnosis codes

appearing on impatient claims are not used in these models as are diagnoses appearing on

physician and outpatient claims. PIPDCG models are fully hierarchical, single-condition

models.

DCG/HCC models use age, sex and all diagnoses -both inpatient and outpatient -recorded

on claims involving contact with clinically trained medical providers. Hierarchical

Condition Categories (HCCs) are groupings of diagnostic codes based on clinical condition

and expected resource. Hierarchies are imposed to assure that each individual receives

credit for only the most costly of related condition categories. DCG/HCC models are

multiple-condition models meaning that they recognize the cumulative effect of multiple

problems.

According to numerous tests, both DCG/HCC and PIPDCG models predict annual resource

use much better than age/sex models. In general, DCG/HCC models have higher predictive

power than PIPDCG models. However, PIPDCG models have the advantage of

significantly simpler data requirements (only inpatient hospital bills are required) and are

generally less sensitive to diagnostic coding completeness than DCG/HCC models.

Required data input files consist of two files: The Diagnosis Input File contains all

International Classification of Diseases 9th Revision Clinical Modification (ICD-9-CM)

diagnoses, Current Procedural Terminology 4th revision (CPT-4) procedure codes, and

expenditures recorded on "at-risk" claims from the managed-care claims files. Each of these

quantities is associated with a unique enrollee. The Enrollment Input File contains age, sex,

primary care physician and provider unit for all eligibles.

Time Periods: DCG models use information from the base year, or "Year 1", to generate

predictions of resource use for two different one-year time periods: Prospective models use

Year 1 diagnoses to predict Year 2 expenditures. They are sometimes called "payment"

models because they can be used to set payment levels (capitation rates) on a prospective

basis. Prospective DCG models emphasize measuring future expenditures resulting from

chronic illness. They are particularly useful in measuring the extent of chronic illness

burdens among enrollees in a health plan or patients treated by a group of providers.

Concurrent models use Year 1 diagnoses to predict Year 1 expenditures. They are

sometimes called "retrospective" or "profiling" models in that they offer a complete profile

of the diagnoses receiving treatment within a population. They are often used to profile

providers. Concurrent models predict better than prospective models because the same

patient generates diagnosis codes in Year 1, simultaneously generate costs in Year 1.

Due to their greater explanatory power, concurrent models are more suitable for predicting

expenditures for small groups of enrollees or patients, or when measuring acute health

status. For example, concurrent models are useful when acute-care patients are triaged

among providers according to severity of illness. In the CareGroup context, since we do not

have enough claims data, we only use nine months of claims data for 1998.

Data populations: DCG models have been developed for three populations, reflecting the

three major types of health insurance coverage in the United States:

The Medicare population, includes the aged (age 65 and over) and disabled (under age 65),

and dual Medicare/Medicaid eligibles, but excluding End Stage Renal Disease enrollees.

The Medicaid population, includes children, pregnant women, disabled (SSI) and

medically needy, but excluding Medicaid enrollees age 65 and over. The Commercial,

privately insured under-age-65 population includes both children and adults. This

population includes enrollees of Commercial insurance plans, Blue Cross; Blue Shield

Plans, PPOs and self-insured employer sponsored plans.

Rjssearolh Progress to Date

We use the DCG-HCC methodology to examine resource consumption across "risk

units"(hospitals) within CareGroup. We applied the DCG-HCC methodology to 1998 data

from capitated Blue Cross/Blue Shield (BCBS) and Harvard Pilgrim Health Care (HPHC)

and 1997 and 1998 data from the Tufts Health Plan. These analyses demonstrate that we

can successfully apply the DCG-HCC approach to our insurance claims data and produce

meaningful information. Several analyses have been done for Tufts, HPHC and Blue

Cross payers stratified by time period of a half year, 9 months for 1998 current data

(about 9 months), Jan.-June 98 and Tufts 1997 (12 months), and found that the risk scores

do change as more claims add on. Compared with the first half year, BC seems have

sicker patients, however, add the recent 3 months' claims data, Tufts' risk scores are

higher than BC. Plus, the DxCG program is designed to require 12 months of claims data

with payers updating their data daily. The decision to which payer have sicker patients

should not be made before reviewing one year’s data. The analyses results do show that

different providers within CareGroup had very different risk profiles based on the DCG-

HCC risk assessments. The PSN leadership found that DCG-HCC-based assessments

about especially efficient versus inefficient risk units meet their prior expectations. We are

applying these risk measurements to produce provider profiles, focus case management

efforts, and refine disease-management projects.

The lengths of eligibility time are also tested for sensitivity purposes. Although they are

designed to be sensitive at each individual level to determine the risk score, they are not

designed to be sensitive if everyone has the same length of eligible time at risk at unit

level. The program is required to default into 12 months, however using 6 or 9 months

make no difference in the results of the risk scores for risk units when we use the

snapshot eligibility tables and the eligible-months variable is not available. Later, when

we created the eligible months from the historical eligibility tables, we learned that the

risk scores are sensitive and should be weighted by the eligible months. For example,

when you want to compare two doctors' patient's severity characteristics, the following

formula is used to calculate each doctor's patients' risk score:

The doctor's risk score=[sum of (patients' risk score* eligible months)]/[sum of eligible

months] .

Thus, the number of eligible patients and their number and degree of claims and also their

eligible length of time determine the risk scores either by patients or by primary care

physician or by risk units.

After all kinds of data cleaning and sensitivity testing, we performed several tests running

the DCG-HCC model with the 3 payer’s input files respectively. We decided to combine

the 3 payers for our CareGroup context as whole using the merged 1998-9 months claims

data and do the analyses by risk units and doctors for mainly three purposes: Physician

performance profile risk adjustment for quality and cost improvement; case management;

and disease management.

F M m g s m 4 Appll€ato©Bi

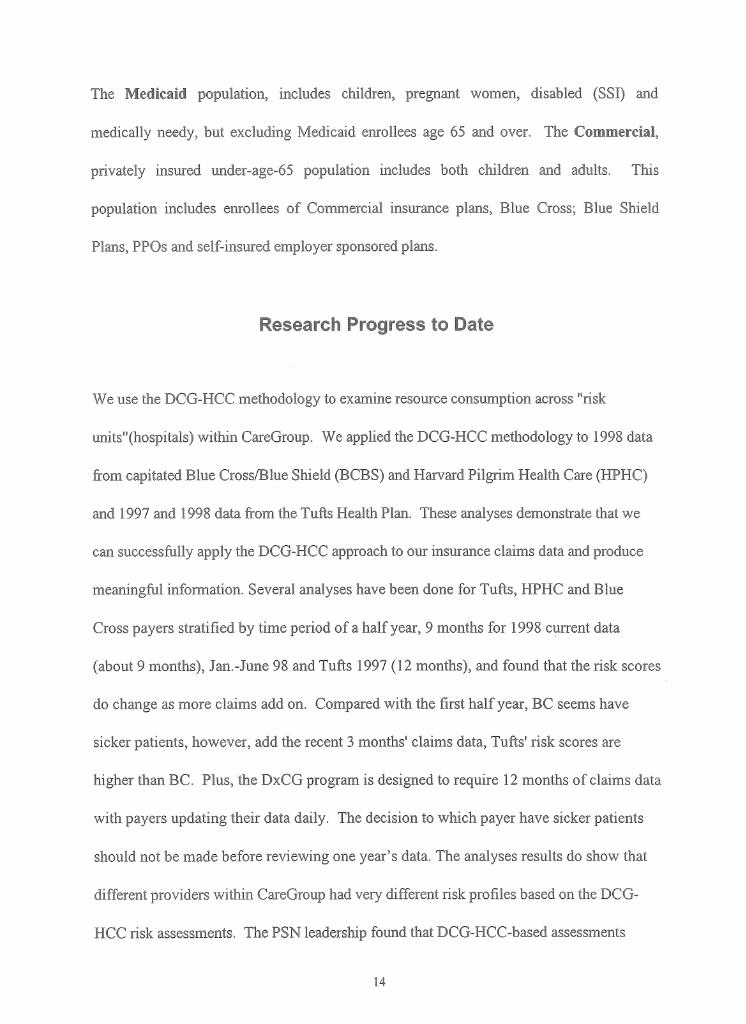
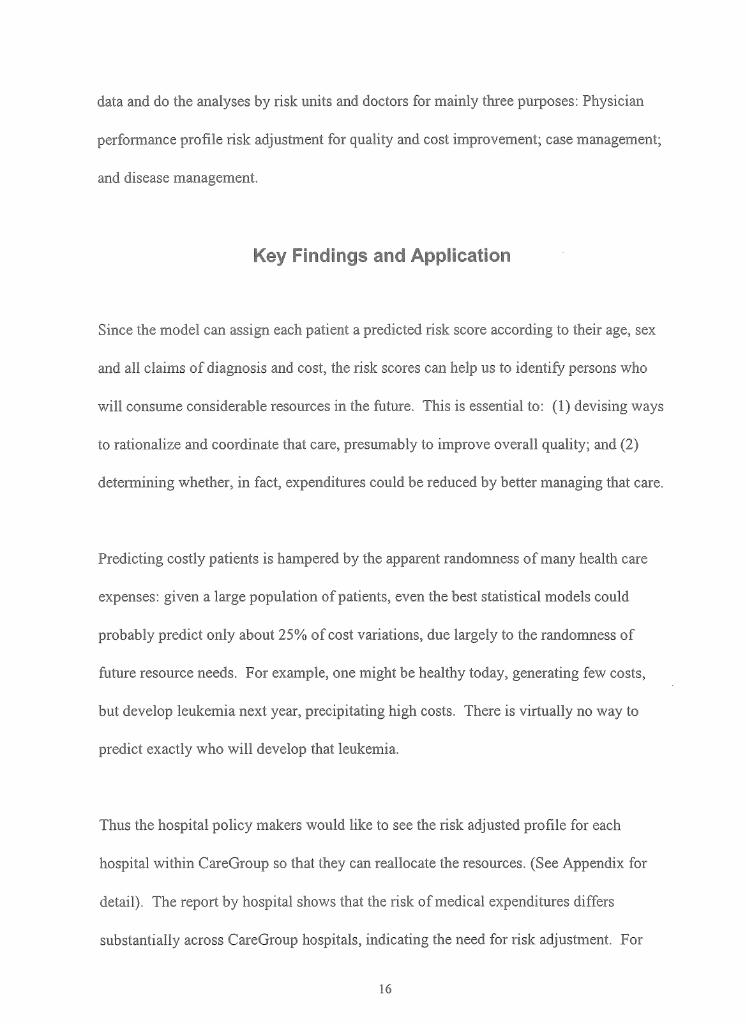
Since the model can assign each patient a predicted risk score according to their age, sex

and all claims of diagnosis and cost, the risk scores can help us to identify persons who

will consume considerable resources in the future. This is essential to: (1) devising ways

to rationalize and coordinate that care, presumably to improve overall quality; and (2)

determining whether, in fact, expenditures could be reduced by better managing that care.

Predicting costly patients is hampered by the apparent randomness of many health care

expenses: given a large population of patients, even the best statistical models could

probably predict only about 25% of cost variations, due largely to the randomness of

future resource needs. For example, one might be healthy today, generating few costs,

but develop leukemia next year, precipitating high costs. There is virtually no way to

predict exactly who will develop that leukemia.

Thus the hospital policy makers would like to see the risk adjusted profile for each

hospital within CareGroup so that they can reallocate the resources. (See Appendix for

detail). The report by hospital shows that the risk of medical expenditures differs

substantially across CareGroup hospitals, indicating the need for risk adjustment. For

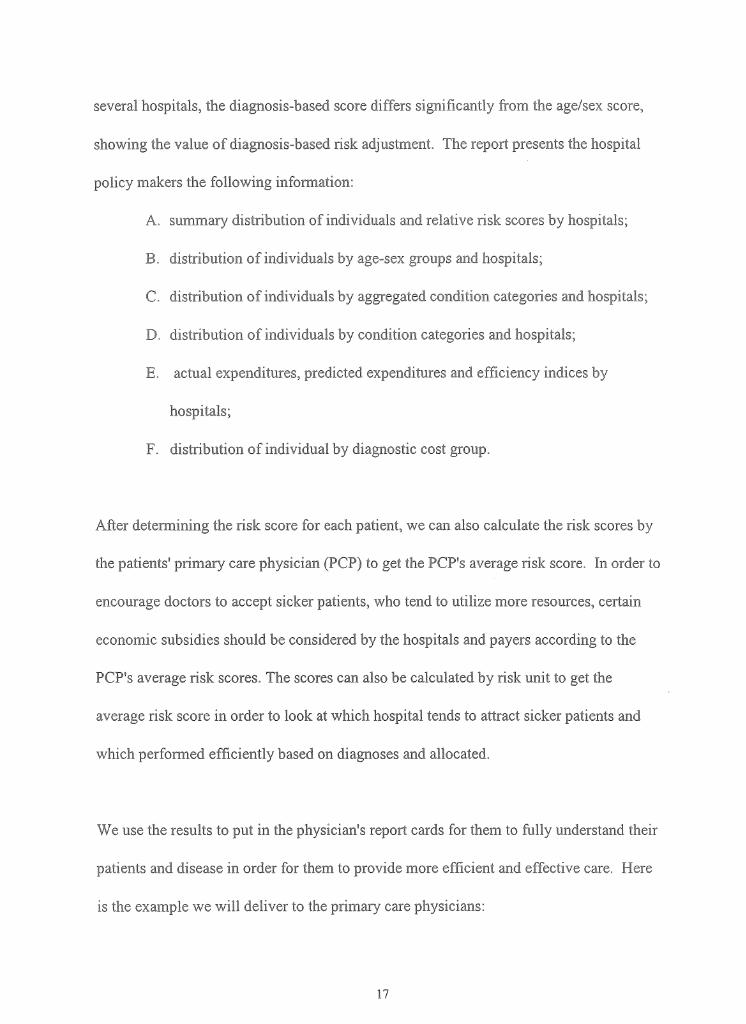
several hospitals, the diagnosis-based score differs significantly from the age/sex score,

showing the value of diagnosis-based risk adjustment. The report presents the hospital

policy makers the following information:

A. summary distribution of individuals and relative risk scores by hospitals;

B. distribution of individuals by age-sex groups and hospitals;

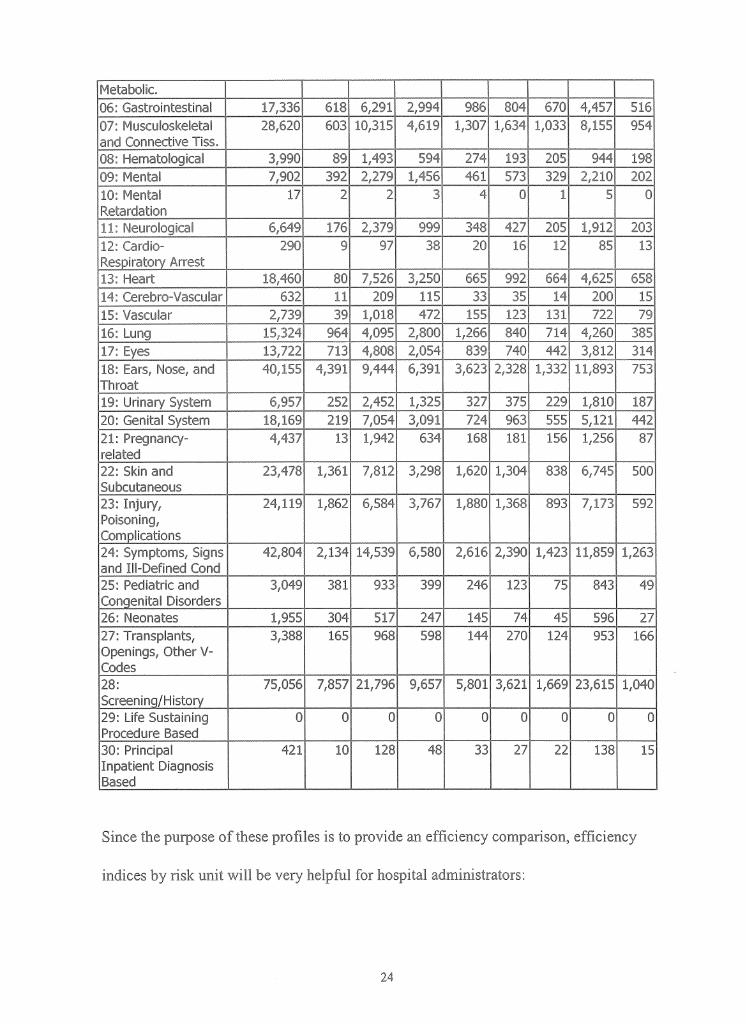
C. distribution of individuals by aggregated condition categories and hospitals;

D. distribution of individuals by condition categories and hospitals;

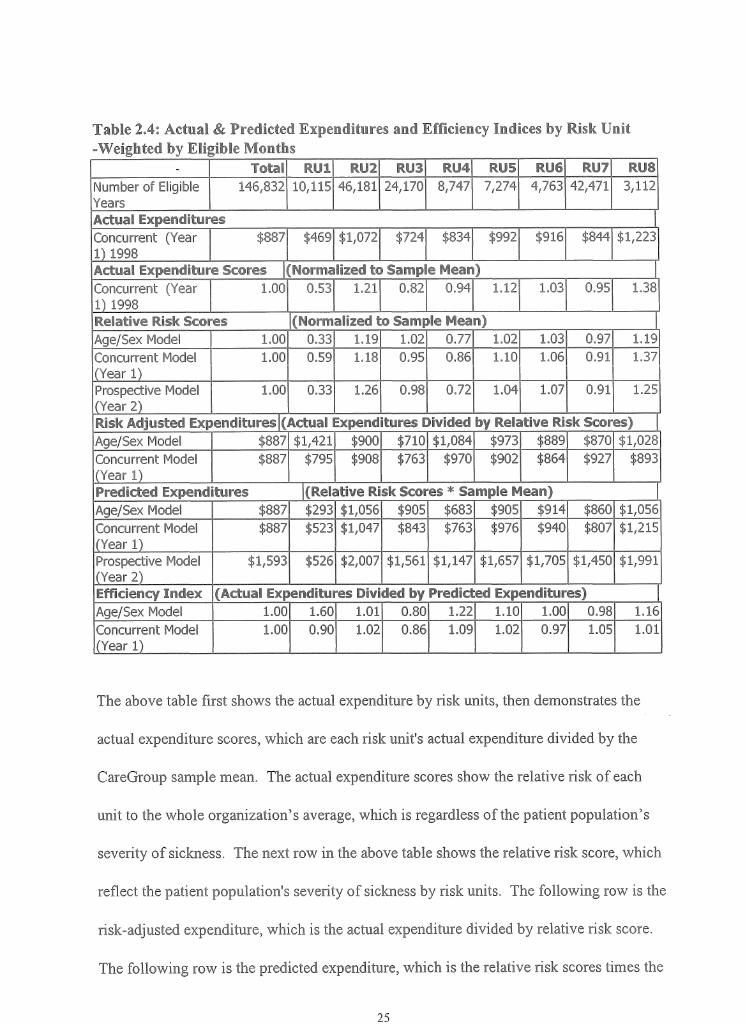
E. actual expenditures, predicted expenditures and efficiency indices by

hospitals;

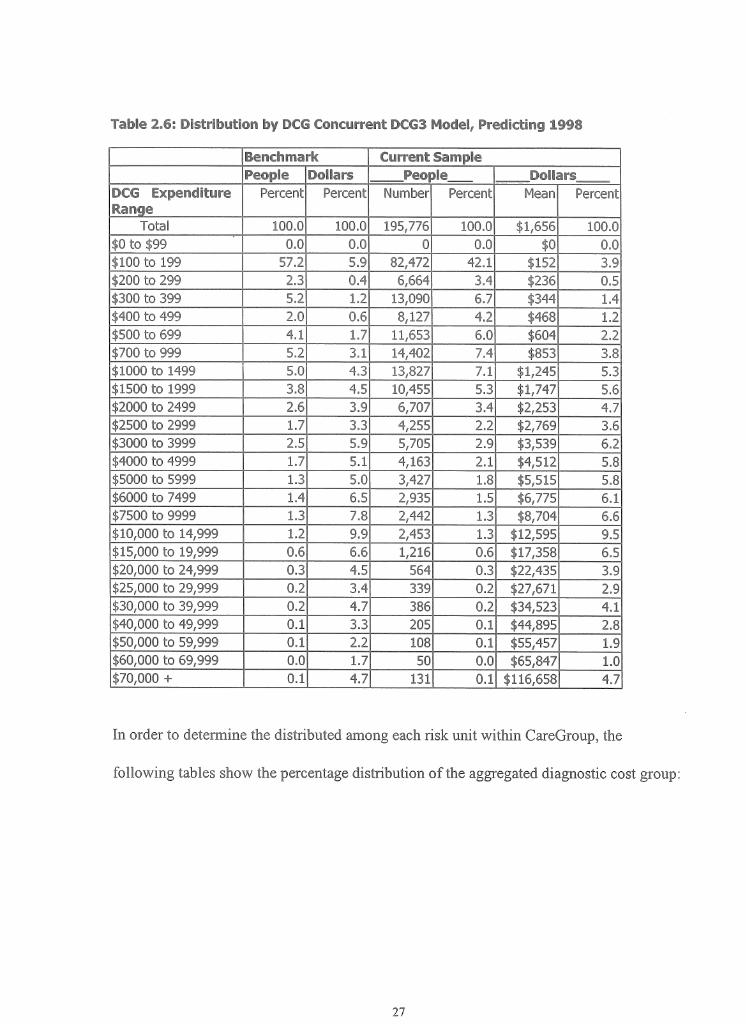
F. distribution of individual by diagnostic cost group.

After determining the risk score for each patient, we can also calculate the risk scores by

the patients' primary care physician (PCP) to get the PCP's average risk score. In order to

encourage doctors to accept sicker patients, who tend to utilize more resources, certain

economic subsidies should be considered by the hospitals and payers according to the

PCP's average risk scores. The scores can also be calculated by risk unit to get the

average risk score in order to look at which hospital tends to attract sicker patients and

which performed efficiently based on diagnoses and allocated.

We use the results to put in the physician's report cards for them to fully understand their

patients and disease in order for them to provide more efficient and effective care. Here

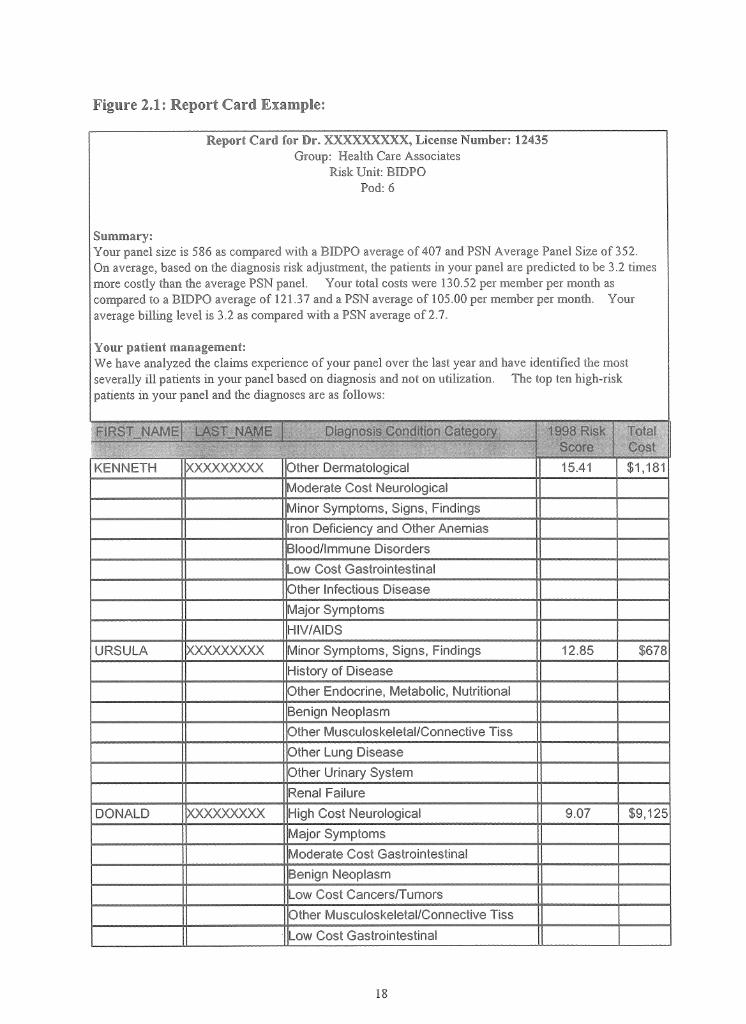
is the example we will deliver to the primary care physicians:

Report Card for Dr. XXXXXXXXX, License Number: 12435Group: Health Care Associates

Risk Unit: BIDPO Pod: 6

Summary:Your panel size is 586 as compared with a BIDPO average of 407 and PSN Average Panel Size of 352.On average, based on the diagnosis risk adjustment, the patients in your panel are predicted to be 3.2 times more costly than the average PSN panel. Your total costs were 130.52 per member per month as compared to a BIDPO average of 121.37 and a PSN average of 105.00 per member per month. Your average billing level is 3.2 as compared with a PSN average of 2.7.

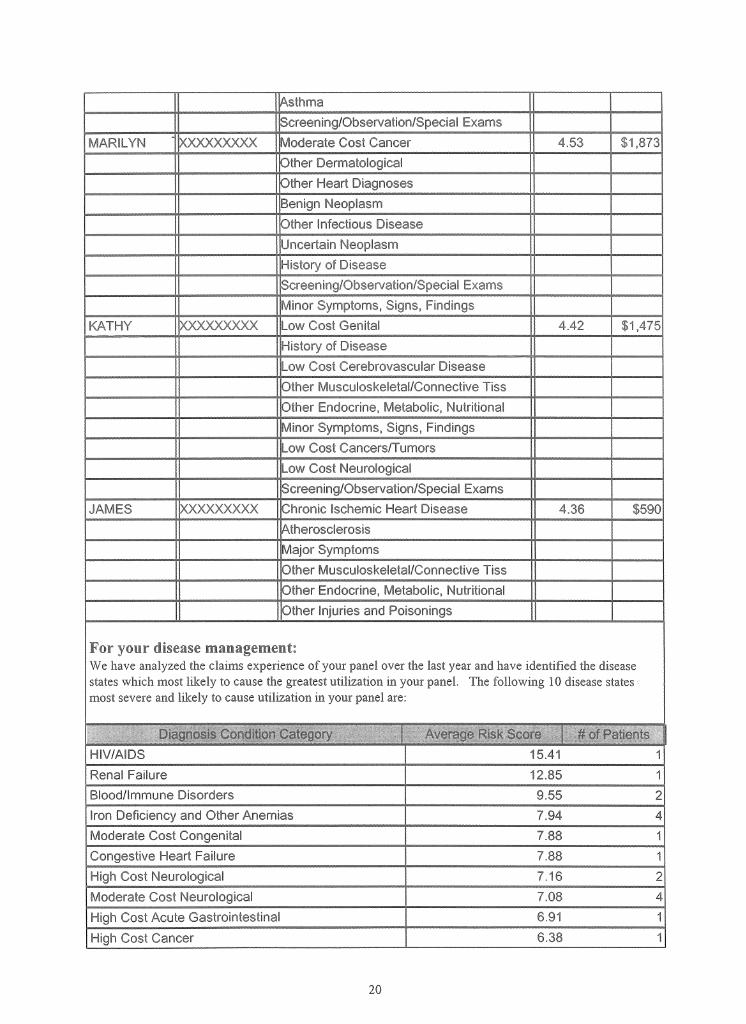
Your patient management:We have analyzed the claims experience o f your panel over the last year and have identified the most severally ill patients in your panel based on diagnosis and not on utilization. The top ten high-risk patients in your panel and the diagnoses are as follows:

KENNETH XXXXXXXXX Other Dermatological 15.41 $1,181Moderate Cost NeurologicalMinor Symptoms, Signs, FindingsIron Deficiency and Other AnemiasBlood/Immune DisordersLow Cost GastrointestinalOther Infectious DiseaseMajor SymptomsHIV/AIDS

URSULA XXXXXXX)(X Minor Symptoms, Signs, Findings 12.85 $678History of DiseaseOther Endocrine, Metabolic, NutritionalBenign NeoplasmOther Musculoskeletal/Connective TissOther Lung DiseaseOther Urinary SystemRenal Failure

DONALD XXXXXXXXX High Cost Neurological 9.07 $9,125Major SymptomsModerate Cost GastrointestinalBenign NeoplasmLow Cost Cancers/TumorsOther Musculoskeletal/Connective TissLow Cost Gastrointestinal

Iron Deficiency and Other AnemiasModerate Cost Neurological

* Minor Symptoms, Signs, FindingsOther Infectious DiseaseOther Endocrine, Metabolic, Nutritional

PAUL xxxxxxxxx Valvular and Rheumatic Heart Disease 7.88 $1,847Moderate Cost CongenitalScreening/Observation/Special ExamsOther Mental and Substance AbuseOther Musculoskeletal/Connective TissHigh Cost EyeLow Cost GenitalOther Endocrine, Metabolic, NutritionalOther Infectious DiseaseCongestive Heart FailureLow Cost Gastrointestinal

EDWARD B )00(XXXXX)( Minor Symptoms, Signs, Findings 6.91 $7,660Major SymptomsOther DermatologicalOther Urinary SystemHigh Cost Acute GastrointestinalOther Heart DiagnosesScreening/Observation/Special ExamsLow Cost GastrointestinalModerate Cost GastrointestinalHigh Cost Ear, Nose, and Throat

ERNST xxxxxxxxx High Cost Cancer 6.38 $73ROBERT xxxxxxxxx Low Cost Pneumonia 6.22 $24,445

Moderate Cost CancerMajor SymptomsLow Cost Cancers/TumorsLow Cost Ear, Nose, and ThroatOther Infectious DiseaseOther Injuries and PoisoningsLow Cost GastrointestinalIron Deficiency and Other AnemiasMinor Symptoms, Signs, Findings

LINDA xxxxxxxxx Other Musculoskeletal/Connective Tiss 5.24 $1,307Benign NeoplasmOther Urinary SystemLow Cost Ear, Nose, and ThroatHigh Cost Neurological

AsthmaScreening/Observation/Special Exams

MARILYN xxxxxxxxx Moderate Cost Cancer 4.53 $1,873Other DermatologicalOther Heart DiagnosesBenign NeoplasmOther Infectious DiseaseUncertain NeoplasmHistory of DiseaseScreening/Observation/Special ExamsMinor Symptoms, Signs, Findings

KATHY xxxxxxxxx Low Cost Genital 4.42 $1,475History of DiseaseLow Cost Cerebrovascular DiseaseOther Musculoskeletal/Connective TissOther Endocrine, Metabolic, NutritionalMinor Symptoms, Signs, FindingsLow Cost Cancers/TumorsLow Cost NeurologicalScreening/Observation/Special Exams

JAMES XXXX)OC(XX Chronic Ischemic Heart Disec 4.36 $590AtherosclerosisMajor SymptomsOther Musculoskeletal/Connective TissOther Endocrine, Metabolic, NutritionalOther Injuries and Poisonings

For your disease management:We have analyzed the claims experience of your panel over the last year and have identified the disease states which most likely to cause the greatest utilization in your panel. The following 10 disease states most severe and likely to cause utilization in your panel are:

D^aanosis Cojdioo^ Cataoofv : Ht-K Scwe : .# or f■Yhecr*HIV/AIDS 15.41 1Renal Failure 12.85 1Blood/Immune Disorders 9.55 2Iron Deficiency and Other Anemias 7.94 4Moderate Cost Congenital 7.88 1Congestive Heart Failure 7.88 1High Cost Neurological 7.16 2Moderate Cost Neurological 7.08 4High Cost Acute Gastrointestinal 6.91 1High Cost Cancer 6.38 1

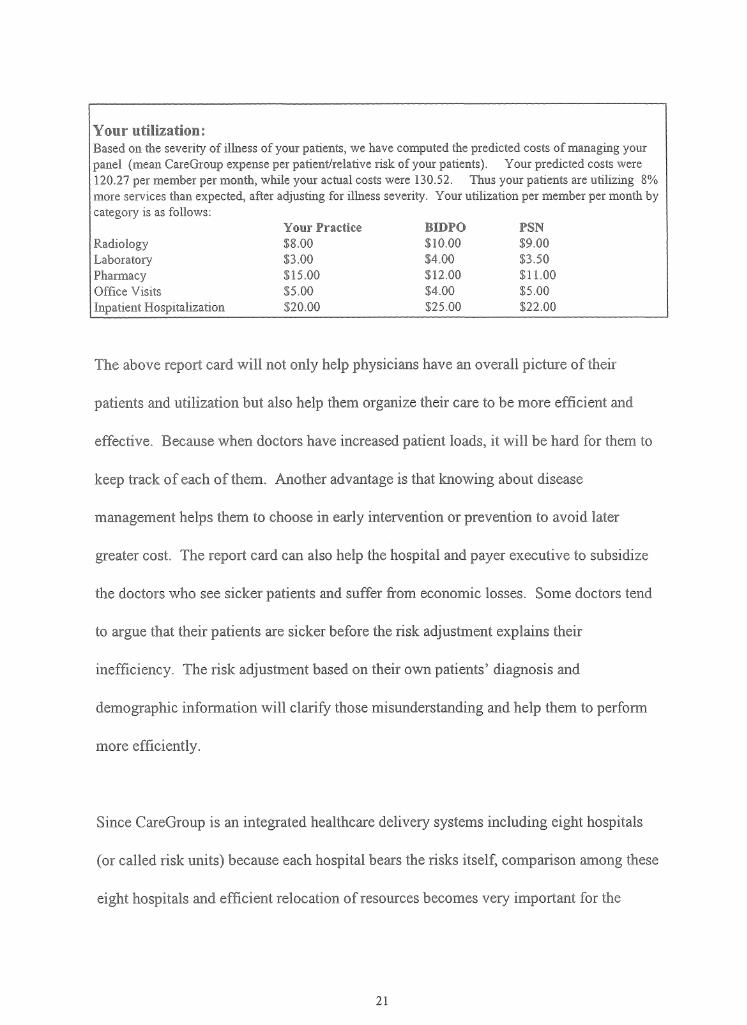
Your utilization:Based on the severity of illness of your patients, we have computed the predicted costs of managing your panel (mean CareGroup expense per patient/relative risk of your patients). Your predicted costs were 120.27 per member per month, while your actual costs were 130.52. Thus your patients are utilizing 8% more services than expected, after adjusting for illness severity. Your utilization per member per month by category is as follows:

Your Practice BXDPG PSNRadiology $8.00 $10.00 $9.00Laboratory $3.00 $4.00 $3.50Pharmacy $15.00 $12.00 $11.00Office Visits $5.00 $4.00 $5.00Inpatient Hospitalization $20.00 $25.00 $22.00

The above report card will not only help physicians have an overall picture of their

patients and utilization but also help them organize their care to be more efficient and

effective. Because when doctors have increased patient loads, it will be hard for them to

keep track of each of them. Another advantage is that knowing about disease

management helps them to choose in early intervention or prevention to avoid later

greater cost. The report card can also help the hospital and payer executive to subsidize

the doctors who see sicker patients and suffer from economic losses. Some doctors tend

to argue that their patients are sicker before the risk adjustment explains their

inefficiency. The risk adjustment based on their own patients’ diagnosis and

demographic information will clarify those misunderstanding and help them to perform

more efficiently.

Since CareGroup is an integrated healthcare delivery systems including eight hospitals

(or called risk units) because each hospital bears the risks itself, comparison among these

eight hospitals and efficient relocation of resources becomes very important for the

score can be assigned to see which hospital have sicker patients:

Table 2.1: Summary Comparisons Using DCG3 Model On the Full Sample Frequencies and Means for Benchmark & Current Sample

Saraci'a ma i i i

Total m i §4U2 KU3 R.U4 RU5 RU7 RU8

Distribution of IndividualsEligible years (Year 2)

1,379,023 195,778 13,488 61,575 32,226 11,662 9,699 6,351 56,628 4,149

Percent of Sample

100.0 100.0 6.9 31.5 16.5 6.0 5.0 3.2 28.9 2.1

Relative Risk ScoresNormalized to Benchmark Sample

Age/Sex Model 1.00 1.02 0.33 1.21 1.04 0.79 1.04 1.05 0.99 1.21Concurrent (Year 1) 1998

1.00 1.10 0.65 1.29 1.05 0.94 1.20 1.16 1.00 1.50

Prospective (Year 2) 1999

1.00 1.11 0.37 1.40 1.08 0.80 1.16 1.19 1.01 1.38

Relative Risk ScoresNormalized to Current Sampie

Age/Sex Model 1.00 0.33 1.19 1.02 0.77 1.02 1.03 0.97Concurrent (Year 1) 1998

1.00 0.59 1.18 0.95 0.86 1.10 1.06 0.91 1.37

Prospective (Year 2) 1999

1.00 0.33 1.26 0.98 0.72 1.04 1.07 0.91 1.25

The above table shows each hospital's numbers of patients for 1998 and consists of the

percent of overall CareGroup sample size. It also shows three different relative risk scores

generated from the DxCG models- age/sex model, diagnostic cost group concurrent

predict model and diagnostic cost group prospective predict model with comparison with

national benchmark and normalized to CareGroup sample size. From the above table, we

can see that RU2 hospital has the biggest population size among all the hospitals.

CareGroup overall has a sicker population than the national benchmark population.

Among CareGroup hospitals, RU8 has the sickest population, which may result in more

resource utilization.

Demographics sometimes are correlated with the risks:

Table 2.2: Summary of Age and Sex

larychmarl? Total PJM RU2 RU3 RU4 RUS RU6 640? RU8All Eligibles 100.0 100.0 100.0 100.0 100.0 100.0 100.0 100.0 100.0 100.0Female 52.9 53.5 48.1 56.0 53.8 52.6 49.4 44.8 53.8 55.3Male 47.1 46.5 51.9 44.0 46.2 47.4 50.6 55.2 46.2 44.7Child: Age 0 to 17 26.7 21.9 92.6 2.6 19.6 47.9 19.7 13.9 24.8 2.7Young Adult: Age18 to 44

45.0 49.9 7.3 61.3 51.3 33.2 48.5 57.1 48.8 59.6

Older Adult: Age45 to 64

28.3 26.6 0.0 34.2 27.6 17.5 30.5 27.3 24.6 35.6

Senior: Age 65+ 0.0 1.6 0.0 1.8 1.5 1.4 1.2 1.8 1.9 2.0Mean Age 31.8 33.1 8.7 39.8 33.8 24.3 34.5 35.4 32.1 40.0

RU8 hospital has the highest mean age and an older population, which is positively,

correlated with its highest relative risk score. On the other hand, RU1, which is a

children's hospital, has the youngest population and also has relatively low risk scores.

In order for the whole CareGroup to efficiently re-allocate resources, determining which

hospital attracts what kinds of patients is the key. The following Diagnostic profile will

help achieve this goal:

Table 2.3: Number of Individuals by Aggregated Condition Category (ACC)

AggregatedConditionCategory (ACC)

Total RU1 RU2 RU3 RU4 RU5 RU6 RU7 RU8

All Eligibles 195,: 13,488 61,575 32,226 11,662 9,699 6,351 56,628 4,149No Claims or Valid

Diagnosis in Sample47,298 2,715 15,012 9,682 2,020 2,115 1,705 13,063 986

01: Infectious and Parasitic

16,190 2,076 4,296 1,847 1,532 681 517 4,969 272

02: Malignant Neoplasm

3,156 23 1,449 454 120 139 84 804 83

03: Benign/In Situ/Uncertain Neoplasm

14,503 267 5,980 1,811 790 774 430 4,092 359

04: Diabetes 4,896 29 2,225 834 120 218 237 1,105 12805: Nutritional, and 19,162 154 8,191 2,993 976 1,118 681 4,275 774

Metabolic.06: Gastrointestinal 17,336 618 6,291 2,994 986 804 670 4,457 51607: Musculoskelel and Connective Tiss.

28,620 603 10,315 4,619 1,307 1,634 1,033 8,155 954

08: Hematological 3,S 89 1,493 594 274 193 205 944 19809: Mental 7,9 392 2,279 1,456 461 573 329 2,210 20210: Mental Retardation

2 2 3 4 0 1 5 0

11: Neurological 6,649 176 2,379 999 348 427 205 1,912 20312: Cardio- Respiratory Arrest

290 9 97 38 20 16 12 85 13

13: Heart 18,460 80 7,526 3,250 665 992 664 4,625 65814: Cerebro-Vascular 632 11 209 115 33 35 14 200 1515: Vascular 2,739 39 1,018 472 155 123 131 722 7916: Lung 15,324 964 4,095 2,800 1,266 840 714 4,260 38517: Eyes 13,722 713 4,808 2,054 839 740 442 3,812 31418: Ears, Nose, and Throat

40,155 4,391 9,444 6,391 3,623 2,328 1,332 11,893 753

19: Urinary System 6,957 252 2,452 1,325 327 375 229 1,810 18720: Genital System 18,169 219 7,054 3,091 724 963 555 5,121 44221: Pregnancy- related

4,437 13 1,942 634 168 181 156 1,256 87

22: Skin and Subcutaneous

23,478 1,361 7,812 3,298 1,620 1,304 838 6,745 500

23: Injury, Poisoning, Complications

24,119 1,862 6,584 3,767 1,880 1,368 893 7,173 592

24: Symptoms, Signs and Ill-Defined Cond

42,804 2,134 14,539 6,580 2,616 2,390 1,423 11,859 1,263

25: Pediatric and Congenital Disorders

3,049 381 933 399 246 123 75 843 49

26: Neonates 1,955 304 517 247 145 74 45 596 2727: Transplants, Openings, Other V- Codes

3,388 165 968 598 144 270 124 953 166

28:Screening/History

75,056 7,857 21,796 9,657 5,801 3,621 1,669 23,615 1,040

29: Life Sustaining Procedure Based

0 0 0 0 0 0 0 0 0

30: Principal Inpatient Diagnosis Based

421 10 128 48 33 27 22 138 15

Since the purpose of these profiles is to provide an efficiency comparison, efficiency

indices by risk unit will be very helpful for hospital administrators:

Table 2.4: Actual & Predicted Expenditures and Efficiency Indices by Risk Unit -Weighted by Eligible Months

- Weiifl 71U3 RU4 RU5 RU6 RU7 RU8Number of Eligible Years

146,832 10,115 46,181 24,170 8,747 7,274 4,763 42,471 3,112

Actual ExpendituresConcurrent (Year 1)1998

$£. $469 $ $724 $834 $992 $916 $844 $1,223

Actual Expendifcw® S ssres Normalised to Samp a fleam)Concurrent (Yeai 1 )1998

1.00 0.53 1.21 0.82 0.94 1.12 1.03 0.95 1.38

Relative Risk Scares (Normalized to Sample Mean)Age/Sex Model 1.00 0.33 1.19 1.02 0.77 1.02 1.03 0.97 1.19Concurrent Model (Year 1 j

1.00 0.59 1.18 0.95 0.86 1.10 1.06 0.91 1.37

Prospective Model (Year 2)

1.00 0.33 1.26 0.98 0.72 1.04 1.07 0.91 1.25

Risk Adjusted Expenditures (Actual 1Expenditures Divided by Relative Risk Scores)Age/Sex Model $887 $1,421 $900 $710 $1,084 $973 $889 $870 $1,028Concurrent Model (Year 1)

$887 $795 $908 $763 $970 $902 $864 $927 $893

Predicted Expend itures (Relative Risk Scores * Sample Mean)Age/Sex Model $887 $293 $1,056 $905 $683 $905 $914 $860 $1,056Concurrent Model (Year 1)

$887 $523 $1,047 $843 $763 $976 $940 $807 $1,215

Prospective Model (Year 2)

$1,593 $526 $2,007 $1,561 $1,147 $1,657 $1,705 $1,450 $1,991

Efficiency Index (Actual Expenditures Divided by PrelT-re H d.-;.Age/Sex Model 1.00 1.60 1.01 0.80 1.22 1.10 1.00 0.98 1.16Concurrent Model (Year 1)

1.00 0.90 1.02 0.86 1.09 1.02 0.97 1.05 1.01

The above table first shows the actual expenditure by risk units, then demonstrates the

actual expenditure scores, which are each risk unit's actual expenditure divided by the

CareGroup sample mean. The actual expenditure scores show the relative risk of each

unit to the whole organization’s average, which is regardless of the patient population’s

severity of sickness. The next row in the above table shows the relative risk score, which

reflect the patient population's severity of sickness by risk units. The following row is the

risk-adjusted expenditure, which is the actual expenditure divided by relative risk score.

The following row is the predicted expenditure, which is the relative risk scores times the

CareGroup sample mean. These expenditures demonstrate the amount of money that

should spent on a certain patient population taking its sickness into consideration. In the

last row is the key point: the efficiency index, which is actual expenditures divided by

predicted expenditures. The CareGroup sample mean is the benchmark, which is 1.

Those who are less efficient are higher than 1; the lower the score, the more efficient the

risk unit is.

After we know how efficient each risk unit is, we would also like to know the

distribution of the patient population's aggregated diagnostic cost group.

Table 2.5: Distribution by Aggregated DC® (AO>C«a)

Concurrent DCG3 Model, Predicting 1998

Benchmark Current SamplePeople Dollars People

ADCG Expenditure Range

Percent Percent Number Percent Mean 'cent

Total 100.0 100.0 195,776 100.0 $1,656 100.0$0 to $999 76.0 12.8 136,408 69.7 $306 12.9$1000 to 4999 17.3 27.0 45,112 23.0 $2,247 31.3$5000 to 9999 4.1 19.3 8,804 4.5 $6,820 18.5$10,000 to 24,999 2.0 21.0 4,233 2.2 $15,274 19.9$25,000 or more 0.7 19.9 1,219 0.6 $46,328 17.4

Table 2.5 shows most of the patients (93%) have spending falling into the category

between no cost and less than $10,000. Less than 7% of the patients have cost of $10,000

or more. This can serve the purpose of case management which can capture those 5% of

patients who spend 95% of the spending and provide better preventive care for these

patients to save some spending so that can better serve other 95% patients.

If we want to look at more detailed spending, the next table can serve this purpose:

Benchmark Current SamplePeop Dollars !MBar§

DCG Expenditure Range

Percent Percent Number Percent Mean Percent

Total 100.0 100.0 195,776 100.0 $1,656 100.0$0 to $99 0.0 0.0 0 0.0 $0 0.0$100 to 199 57.2 5.9 82,472 42.1 $152 3.9$200 to 299 2.3 0.4 6,664 3.4 $236 0.5$300 to 399 5.2 1.2 13,090 6.7 $344 1.4$400 to 499 2.0 0.6 8,127 4.2 $468 1.2$500 to 699 4.1 1.7 11,653 6.0 $604 2.2$700 to 999 5.2 3.1 14,402 7.4 $853 3.8$1000 to 1499 5.0 4.3 13,827 7.1 $1,245 5.3$1500 to 1999 3.8 4.5 10,455 5.3 $1,747 5.6$2000 to 2499 2.6 3.9 6,707 3.4 $2,253 4.7$2500 to 2999 1.7 3.3 4,255 2.2 $2,769 3.6$3000 to 3999 2.5 5.9 5,705 2.9 $3,539 6.2$4000 to 4999 1.7 5.1 4,163 2.1 $4,512 5.8$5000 to 5999 1.3 5.0 3,427 1.8 $5,515 5.8$6000 to 7499 1.4 6.5 2,935 1.5 $6,775 6.1$7500 to 9999 1.3 7.8 2,442 1.3 $8,704 6.6$10,000 to 14,999 1.2 9.9 2,453 1.3 $12,595 9.5$15,000 to 19,999 0.6 6.6 1,216 0.6 $17,358 6.5$20,000 to 24,999 0.3 4.5 564 0.3 $22,435 3.9$25,000 to 29,999 0.2 3.4 339 0.2 $27,671$30,000 to 39,999 0.2 4.7 386 0.2 $34,523$40,000 to 49,999 0.1 3.3 205 0.1 $44,895$50,000 to 59,999 0.1 2.2 108 0.1 $55,457$60,000 to 69,999 0.0 1.7 50 0.0 $65,847 1.0$70,000 + 0.1 4.7 131 0.1 $116,658 ■; '

In order to determine the distributed among each risk unit within CareGroup, the

following tables show the percentage distribution of the aggregated diagnostic cost group:

Bencli)mark

Current Sample-

ADCGExpenditureRange

Percent Total! RU1 RU2 RU3 fi«4 RU5 RU6 HUT RU8

Total 100.0 100.0 100.0 100.0 100.0 100.0 100.0 100.0 100.0 100.0

$0 to $999 76.0 69.7 82.9 65.1 71.3 71.8 67.1 67.4 71.7 58.0$1000 to 4999 17.3 23.0 13.7 25.9 22.0 22.3 24.4 24.2 22.0 31.2$5000 to 9999 4.1 4.5 2.1 5.4 4.2 3.7 5.4 5.4 4.0 6.8$10,000 to 24,999

2.0 2.2 1.0 2.8 1.8 1.7 2.3 2.5 1.9 3.2

$25,000 ormore

0.7 0.6 0.3 0.8 0.6 0.5 0.7 0.5 0.6 0.8

All the previous tables show the profile for the current year, but how about our next year's

patient population? Can we predict their spending according to their chronicled

conditions? The following tables tell us the story:

Table 2.8: Distribution by Aggregated DCG (ADCG)

Prospective BCG3 Model, Predicting 1999

Benchmark Current SamplePeople Dollars Peo ale Dollars

ADCGExpenditureRange

Percent Percent Number Percent Mean Percent

Total 100.0 100.0 195,776 100.0 $1,765 100.0$0 to $999 48.4 14.6 82,559 42.2 $490 11.7$1000 to 4999 46.6 54.0 101,247 51.7 $1,852 ■$5000 to 9999 3.7 15.6 8,796 4.5 $6,554 16.7$10,000 to 24,999 1.0 9.6 2,615 1.3 $15,593 11.8$25,000 or more 0.3 6.2 559 0.3 $34,270 5.5

Table 2.8 shows the number of people in each expenditure category given their chronic

condition. Other unpredicted injuries and disease will not be taken into consideration.

ProspeeHwe EC'S® Maid®!, (Predicting 1999

Benchmark emn-en! SamplePeople D eters Pe@pS<& DeSlars

DCG Expenditure Range

Percent Percent Number Percent Mean Percent

Total 100.0 100.0 195,776 100.0 $1,765 100.0

$0 to $99 0.0 0.0 0.0 $0 0.0$100 to 199 0.0 0.0 0.0 $0 0.0$200 to 299 2.2 21,204 10.8 $267 1.6$300 to 399 8.1 1.8 12,549 6.4 $339 1.2$400 to 499 8.0 2.4 9,792 5.0 $472 1.3$500 to 699 11.4 4.3 23,062 11.8 $586 3.9$700 to 999 7.8 3.9 15,952 8.2 $779 3.6$1000 to 1499 27.4 21.3 58,217 29.7 $1,216 20.5$1500 to 1999 4.8 5.3 9,847 5.0 $1,730 4.9$2000 to 2499 5.6 7.7 11,599 5.9 $2,149 7.2$2500 to 2999 2.2 3.8 6,230 3.2 $2,693 4.9$3000 to 3999 3.8 8.3 9,735 5.0 $3,387 9.5$4000 to 4999 2.7 7.6 5,619 2.9 $4,444 7.2$5000 to 5999 1.6 5.6 3,909 2.0 $5,368 6.1$6000 to 7499 1.2 5.1 2,776 1.4 $6,673 5.4$7500 to 9999 0.9 4.9 2,111 1.1 $8,595 5.3$10,000 to 14,999 0.6 4.8 1,498 0.8 $11,997 5.2$15,000 to 19,999 0.2 2.4 497 0.3 $17,160 2.5$20,000 to 24,999 0.2 2.4 620 0.3 $23,024 4.1$25,000 to 29,999 0.1 1.9 258 0.1 $27,059 2.0$30,000 to 39,999 0.1 2.0 191 0.1 $33,895 1.9$40,000 to 49,999 0.0 1.1 66 0.0 $44,011 0.8$50,000 to 59,999 0.0 0.6 22 0.0 $53,854 0.3$60,000 to 69,999 0.0 0.3 13 0.0 $63,515 0.2$70,000 + 0.0 0.3 9 0.0 $87,387 0.2

As did Table 2.8, Table 2.9 gives us a more detailed picture for our patient population's

1999 spending by diagnostic cost group according to their chronic conditions. Again

other unpredicted injuries and disease will not be take into consideration.

PraspecS^B ©CtSS 64©daS, Predicting 1999

Benchmark Cu&re&it Samp eADCG Expenditure Range

% Total R ill RU2 RU3 RU4 RU5 RU6 RU7 RU8

Total 100 100 1 100 100 100 100 100 100 100$0 to $999 48.4 42.2 9 27.5 41.9 58.3 41.8 42.9 44.3 28.1$1000 to 4999 46.6 51.7 64.1 52.4 38.0 51.5 49.6 50.6 63.3$5000 to 9999 3.7 4.5 0.3 5.9 4.3 2.7 4.9 5.9 3.9 6.4$10,000 to 24,999 1.0 1.3 0.4 2.0 1.2 0.8 1.5 1.4 1.0 1.9$25,000 or more 0.3 0.3 0.0 0.4 0.2 0.1 0.3 0.2 0.2 0.3

Table 2.10 shows the CareGroup 8 hospital’s patient population's spending distribution.

This table can help the hospital administrators to set a rough budget for 1999 according to

the chronic conditions of their current populations without taking into new patients and

unpredicted disease and injuries into consideration.

Re-calibration by Service Category

Since CareGroup would also want to evaluate how much a new normalization affects

things, and make a decision about whether to use the single relative cost factor

(PRED31c) or use recalibrated ones, the intent was to focus on simple adjustments, and

use perhaps only a linear model.

After some thought, I found out that it is much better to use the DCG categorical

variables for recalibration instead of doing the linear model a + b*pred31c that was

initially prepared. The reason is that the linear model will most likely make negative

predictions for lots of people, and this is a big problem if it is to be used in a denominator

for normalizing. So we decided to use a Generalized Linear Model, with DCG31c as a

class variable. Our databases have enough observations to do this.

This normalization works well only if the risk score is not too close to zero to create a

normalized value of the variable being predicted for each person. So instead of

normalizing each person alone, we normalize it for groups. Hence for each doctor or

practice groups or hospitals are as follows:

Adjusted average spending - (mm o f actual costs)/(sum o f normalized risk scores)

This will be better than using

Average adjusted spending = sum o f (actual costs/(normalized risk score))

The first variable is much more stable with respect to outliers. The following figure

shows us the recalibrated predicted result for service categories by cost groups which

proves how well the single model performs:

Figure 2.2 Predicated cost estimate by recaliberating category:

P r e d i c t e d C o s t f o r T h r e e S e r v i c e s

- R adiolog y ------S’----- Lab

/ </ / </J f ^ ^ ^ 4? ^ ^ ^ ^ ^ ^ ^ &'c f s ? c f s ? j a - !S~ "P ^ ^o1 ,< ? .JJ ,j> -P ,-P A 0 A ° A ° A ° !>“ £^ i f ^ ^ ^ ^ ^ ^ ^ ^ ^ ^ ^

D C G C o s t in t e r v a ls

After running the recalibration program based on the data we have, the model fits the

three services well. The coefficients were generally monotonic, and did well over most

of the DCGs with the exception of the very highest values where there just are not enough

people to predict spending reliably. It would be also helpful to know how well the model

also does in predicting the total spending, not just the three components, since this

provides a nice benchmark.

There are some pros and cons for this recalibrations. The pros are: The main thing that

this recalibration buys us is a better fit at the tails, reflecting better the nonlinear pattern

of low costs for most, and very high predicted costs for a few. Possibly this impresses

our clinicians. The second argument in favor is that the model might do better on smaller

panel sizes. The comparisons that I have done so far are for panels with several thousand

patients. The nonlinearities would not be expected to affect the means when averages of

this size are computed. The third argument in favor is that doctors seeing the method

might PREFER a more complicated to a simpler model since it may have more clinical

credibility. The complicated model will provide more targeted predictions toward certain

service categories, which is comparing apples to apples.

The cons are that the recalibrated models are rather complicated and tedious and it does

not seem credible that all costs simply grow in the same proportion.

However, since the recalibrated models have proved that the single model performs very

well in predicting for each specific category, for simplifying purposes, we decided to use

the single model score as the multiplier.

Cornell $i©oii© fro fh© Gas® M ©1

A variety of methodological issues are raised when developing or interpreting provider

profiles that compare patient outcomes. In most instances, conclusions must be drawn

tentatively due to small sample sizes and the difficulty of adjusting adequately for patient

risk. Despite these challenges, however, profiles are increasingly generated around the

country and are used as an important tool in ensuring healthcare "value" - a melding of

cost and quality.

We believe that comparing patient outcomes across providers is valuable, but much

depends on how the profiles are used. Given the state of the art, it is inappropriate to use

such profiles alone to make "all or nothing" business decisions: for example, telling an

"outliner" provider that unless their profile rating improves, business will be withdrawn.

In this context, profiles are likely to generate criticism —often based on well-founded

methodological concerns— and heighten adversarial relationships among providers,

payers, and policymakers. Similarly, if such profiles are disseminated to a public

unaware of the need to draw conclusions tentatively, further controversy will likely

follow, impeding opportunities for productive dialogue and improvements. If profiles are

released to providers without appropriate education about how to use them to identify

areas for improvement, they are likely to be ignored.

Profiles comparing patient outcomes are most valuable in an environment of cooperation

and collaboration, with incentives for learning and improvement.

IIL Conclusion

Many projects I was involved in involving data mining and modeling are like most of the

initial programs to compare provider performance focused on hospitalizations, examining

mortality, Length of Stay, and charges. While these are clearly important outcomes, they

are fairly limited, especially from many consumers' perspectives—death is not an

immediate prospect for most persons, and the public may be more interested in functional

outcomes or quality of life. In addition, most persons, particularly those of working age,

are not hospitalized during a given year. Outcomes relating to outpatient and preventive

services are therefore more applicable to their concerns. Especially as managed care

increasingly constricts the reimbursable services available to consumers, the burden of

proof about quality shifts somewhat from the provider alone to encompass the health plan

as well. This is the reason I choose to talk about Physician profiles with Risk Adjustment

from the patients’ claims diagnosis files. This kind of study will be very helpful to

hospital executives, payers and working-class patients. The social and economic value of

these kinds of studies should never be underestimated.

There are many limitations for such studies, such as different views of stakeholders,

concerns about the risk-adjustment methodology, incomplete data, small sample size,

limited study length, confidentiality issues, side effects, etc.

In this study, one of the most troubling consequences of publishing the report cards—

especially byindividual doctor —is the possibility that providers will avoid high-risk

patients. These patients are, by definition, more likely to suffer bad outcomes, thereby

potentially decreasing their provider's performance. Thus, besides doing these profiles,

methods must be figured out to encourage doctors to accept sicker patients and at the

same time to provide more efficient and effective care to all the patients. This is a

question to all healthcare economics researchers, hospital administrators, stakeholders,

payers as well as the providers and patients themselves.

F/o P©Ifcy Implfcak©ms

Change in our healthcare system is increasingly fragmented into diverse regional

marketplaces Locally, competition is fierce among health plans and providers, with

constant jockeying measurement efforts, including comparisons of outcomes using

various risk-adjustment methodologies. A bewildering array of reports is produced, even

in neighboring cities. For example, in the case study of this paper, we use the DxCG

methodology, which has been used by HCFA (Health Care Financial Administration). In

Ohio alone, Cleveland uses its own, home-grown risk adjustment (developed by Michael

Pine & Associates); Cincinnati uses Iameter's AIM; and the Dayton employer coalition

chose MedStat's Disease Staging .5

Without common methods, comparisons are meaningless. Calls are therefore increasing

for national standards to enhance the consistency of quality measures and permit

comparisons across regions. As a representative of a midsize manufacturing firm

asserted, " The government should prescribe some standards and force providers to

adhere to these standards in the publishing of information. The government should say,

'You're going to code this disease this way, and you do it consistently and uniformly'".6

5 Vema, G. 1996. "Dayton Hospitals Link to Perform Cost Study." Cincinnati Business Courier 13(4):8C6 United States General Accounting Office; Health, Education, and Human Services Division (USGAO), 1995. Employers and Individual Consumers Want Additional Information on Quality. (GAO/HEHS-95- 201) Washington, D.C.

Nonetheless, experience suggests that local stakeholders in different marketplaces do

differ in their-interests and emphasis. Achieving a balance between standardizing

measures to facilitate widespread comparisons and customizing measures to address local

needs the current challenge.

However, even in regions with longer experience in this endeavor, two questions remain

unanswered: what do risk-adjusted outcomes (mostly mortality rates) mean about the

quality of care; and what is the aggregate effect of these initiatives on total healthcare

costs? As the GAO observed, the staples of most hospital reports (mortality and length of

stay)" are considered too narrow to truly reflect quality".7 "Some of the cost savings

employers attribute to efficiency improvements in inpatient hospital care are partially

offset by higher expenditures for ambulatory care".8 This situation has not stopped

purchasers from using report-card findings. Nonetheless, it heightens concerns about

balancing reservations about the actual implications of most risk-adjusted outcome

information. Harvard Medical School Professor Dr. Lisa Iezzoni suggests several factors

that must be addressed: "First, the participants in this activity should understand that they

are jointly entering a large, applied experiment. In an experiment —as opposed to an

endeavor using well accepted, rigorous methods with clearly understood benefits—

evaluation is critical. If providers and business coalitions jointly recognize the

7 United States General Accounting Office; Health, Education, and Human Services Division (USGAO), 1994. Employers Urge Hospitals to Battle Costs Using Performance Data Systems. (GAO/HEHS-95-1) Washington, D.C. (p i2).

8 United States General Accounting Office; Health, Education, and Human Services Division (USGAO), 1994. Employers Urge Hospitals to Battle Costs Using Performance Data Systems.. (GAO/HEHS-95-1) Washington, D.C. (p9).

experimental nature of their undertaking, tensions between the two groups may lessen. It

also would allow them to unify around the common objective of learning the value of

severity-derived data for interpreting hospital cost and quality figures.

Second, the participants in the discourse about severity-derived information must

understand better the goals and concerns of the other sides. Providers could learn more

about the desire of local businesses to quantify hospital quality, permitting more prudent,

better-informed decisions—purchasers reasonably no longer accept vague promises about

quality monitoring, without concrete evidence of its results. In turn, business leaders

could explore the legitimate reservations of providers about the limitations of severity

data and the outcomes that are being studied Providers need to be intimately involved in

selecting the risk adjusters, to ensure—at a minimum — face validity. By working in

concert, the common goal of improving quality and efficiency may be achieved.

Third, given the uncertainty surrounding interpretation of much of these data, it is

important to weigh what actions may reasonably be founded on the information.

Fourth, in times of increasingly constrained resources, concerns about costs and trade-off

inevitably arise.

Finally, the Institute of Medicine observed: 'The public interest is materially served when

society is given as much information on costs, quality, and value for healthcare dollar

expended as can be given accurately and provided with educational materials that aid

interpretation of the at information. Public disclosure is acceptable only when it: (1)

involves information and analytic results that come from studies that have been well

conducted, (2) is based on data that can be shown to be reliable and valid for the purposes

intended, and (3) is accompanied by appropriate educational material.'"9

Thus, to provide efficient and effective care of people and the study of it will be a long­

term task for all of us.

9 Donaldson, M.S., and K.N.Lohr. 1994, Health Data in the Information Age. Use, Disclosure, and Privacy. Washington, D.C.: National Academy Press.

Vo Reference:

1. Lisa Iezzoni. 1997. "Risk Adjustment for Measuring Healthcare Outcomes", Health Administration Press, Chicago, Illinois.

2. Thomas Rice. 1998. "The Economics of Health Reconsidered", Health Administration Press, Chicago, Illinois.

3. John G. Nachel, George M. J. Kis and Paul J. Fenaroli. 1987. "Cost Management For Hospitals", Aspen Publishers, Inc.

4. Steven F. Isenberg. 1997. "Managed Care, Outcomes, and Quality - A Practical Guide", Thieme Medical Publishers, Inc. 1998

5. Donaldson, M.S., and K.N.Lohr. 1994, 'Health Data in the Information Age. Use, Disclosure, and Privacy", Washington, D.C.: National Academy Press.

6. Howard Oxley and Maitland MacFarlan:"Health Care Reform Controlling Spending and Increasing Efficiency".

7. March 1998 report to the President, the Advisory Commission on Consumer Protection and Quality in the Health Care Industry,http ://www.hcqualitycommission. gov/finahchap04.html

8. United States General Accounting Office; Health, Education, and Human Services Division (USGAO), 1994. "Employers Urge Hospitals to Battle Costs Using Performance Data Systems." (GAO/HEHS-95-1) Washington, D.C.

9. United States General Accounting Office; Health, Education, and Human Services Division (USGAO), 1995. "Employers and Individual Consumers Want Additional Information on Quality". (GAO/HEHS-95-201) Washington, D.C.

10. Verna, G. 1996. "Dayton Hospitals Link to Perform Cost Study." Cincinnati Business Courier 13(4):8C.

VIo Appendix:

Sample SAS programs and outputs;


Recommended