20
Measuring quality in education Simon Ellis
| Date post: | 16-Aug-2015 |
| Category: |
Education |
| Upload: | hesham-a-elsunni |
| View: | 83 times |
| Download: | 6 times |

Measuring quality in education
Simon Ellis
Dimensions of quality Learning outcomes Education process
Classroom conditions Teaching
Inputs ICTs Textbooks and other material Governance Finance

Learning outcomes
Measured against national standard
Assessing individual skills in comparison to other
individuals, schools, provinces, countries

Classroom processes
Several existing well-defined international indicators PTR, Survival, repetition
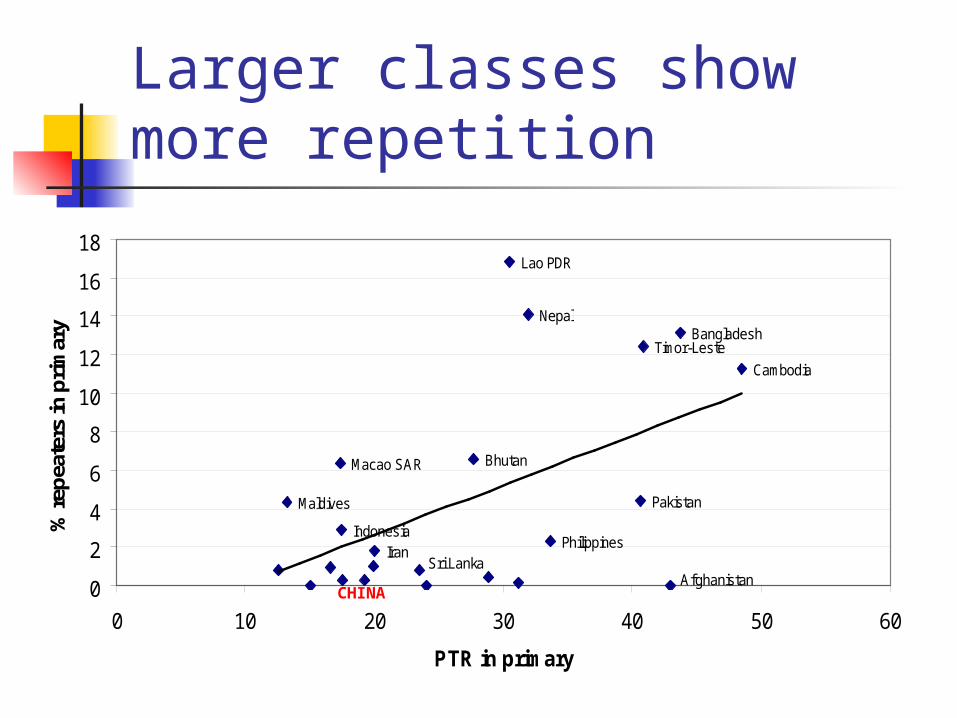
Larger classes show more repetition
Cambodia
Macao SAR
Indonesia
Lao PDR
Philippines
Timor-LesteBangladesh
Bhutan
Iran
Maldives
Nepal
Pakistan
Sri LankaAfghanistan0
2
4
6
8
10
12
14
16
18
0 10 20 30 40 50 60
PTR in primary
% re
peat
ers
in p
rimar
y
CHINA

Smaller classes keep children in school longer
Mongolia
Cambodia
Hong Kong SARIndonesia
Lao PDR
Malaysia
Myanmar
Philippines
Rep. of Korea
Singapore
Timor-Leste
Bhutan
Sri Lanka
0
10
20
30
40
50
60
40 60 80 100 120
Survival rate to the final grade of primary
PT
R in
pri
mar
y
CHINA

Larger classes tend to have more over-age children
MongoliaBrunei Daruss.
Cambodia
Macao SAR
Indonesia
Lao PDR
Malaysia Rep. of Korea
Timor-Leste
Bangladesh
Bhutan
Maldives
Pakistan
Sri Lanka
Iran
Philippines
Thailand0
5
10
15
20
25
30
0 10 20 30 40 50 60
PTR in primary
% o
f o
ve
r-a
ge
stu
de
nts
in
pri
ma
ry

Survival rate to the last grade of primary and transition rate to secondary, most recent year
0
20
40
60
80
100
120
Cam
bodi
a
Nep
al
Lao
PD
R
Indi
a
Phi
lippi
nes
Indo
nesi
a
Bhu
tan
Vie
t N
am
Mal
aysi
a
Mon
golia
Sri
Lank
a
Bru
nei
Rep
. of
Mal
dive
s
Chi
na
Mac
ao
Hon
g
Sin
gapo
re
Tim
or-
Tha
iland
%
Survival rate to the last gradeTransition rate to secondary

Pupils-teacher ratio, primary, 1990,2000 and most recent year
0
10
20
30
40
50
60
Cam
bodi
a
Nep
al
Phi
lippi
nes
Pak
ista
n
Mya
nmar
Mon
golia
Rep
. of
Kor
ea
Afg
hani
stan
Lao
PD
R
Vie
t N
am
Sri
Lank
a
Iran
Indo
nesi
a
Hon
g K
ong
SA
R
Japa
n
Tha
iland
Mal
aysi
a
Bru
nei D
arus
s.
PT
R in
pri
ma
ry
1990 2000 Most recent year
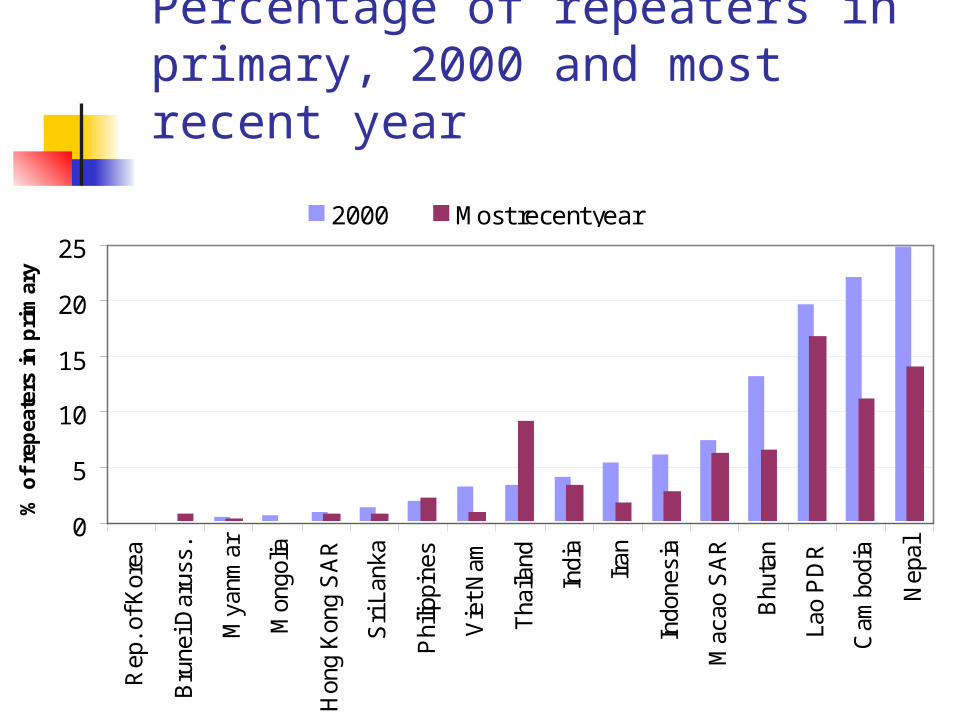
Percentage of repeaters in primary, 2000 and most recent year
0
5
10
15
20
25
Rep
. of K
orea
Bru
nei D
arus
s.
Mya
nmar
Mon
golia
Hon
g K
ong
SA
R
Sri
Lank
a
Phi
lippi
nes
Vie
t Nam
Tha
iland
Indi
a
Iran
Indo
nesi
a
Mac
ao S
AR
Bhu
tan
Lao
PD
R
Cam
bodi
a
Nep
al
% o
f re
pea
ters
in
pri
mar
y
2000 Most recent year
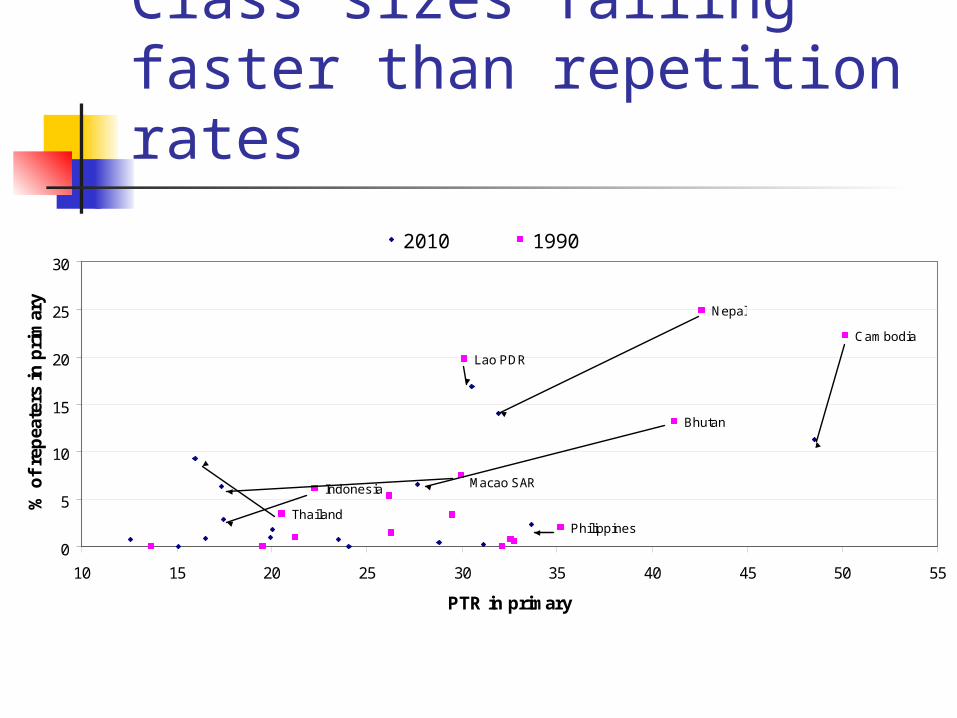
Class sizes falling faster than repetition rates
Bhutan
Thailand
Macao SAR
Cambodia
Philippines
Nepal
Lao PDR
Indonesia
0
5
10
15
20
25
30
10 15 20 25 30 35 40 45 50 55
PTR in primary
% o
f re
pea
ters
in
pri
mar
y
2010 1990

School life expectancy (primary and secondary, ISCED1-3), 1990, 2000 and most recent year
0
2
4
6
8
10
12
14
Afg
hani
stan
Mya
nmar
Cam
bodi
a
Lao
PD
R
Indi
a
Tha
iland
Mon
golia
Chi
na Iran
Phi
lippi
nes
Mal
aysi
a
Mac
aoS
AR
Indo
nesi
a
Japa
n
Hon
g K
ong
SA
RR
ep. o
fK
orea
Bru
nei
Dar
uss.
Sch
oo
l lif
e ex
pec
tan
cy (
in y
ear)
1990 2000 Most recent year

Teaching Processes – usually documented by
qualitative observation and recording Eg amount of teacher attention given to each
pupil
Proxy indicators Teachers trained in appropriate pedagogical
techniques (average) years of experience of teachers % of teachers trained to national standards
[current international education indicator]

TEACHERSMean values of indices of learning approaches
Inputs

FINANCESalaries as a percentage of total public education expenditure (ISCED 1-4, most recent year)
32.8
54.858.4
62.8
76.079.3 79.4 79.7
83.1
0
10
20
30
40
50
60
70
80
90L
ao
PD
R
Tim
or-
Le
ste
Ba
ng
lad
esh
Re
p.
of
Ko
rea
Ind
on
esi
a
Ma
lays
ia
Ph
ilip
pin
es
Jap
an
Ind
ia% o
f ed
uca
tio
nal
exp
end
itu
re o
n s
alar
ies
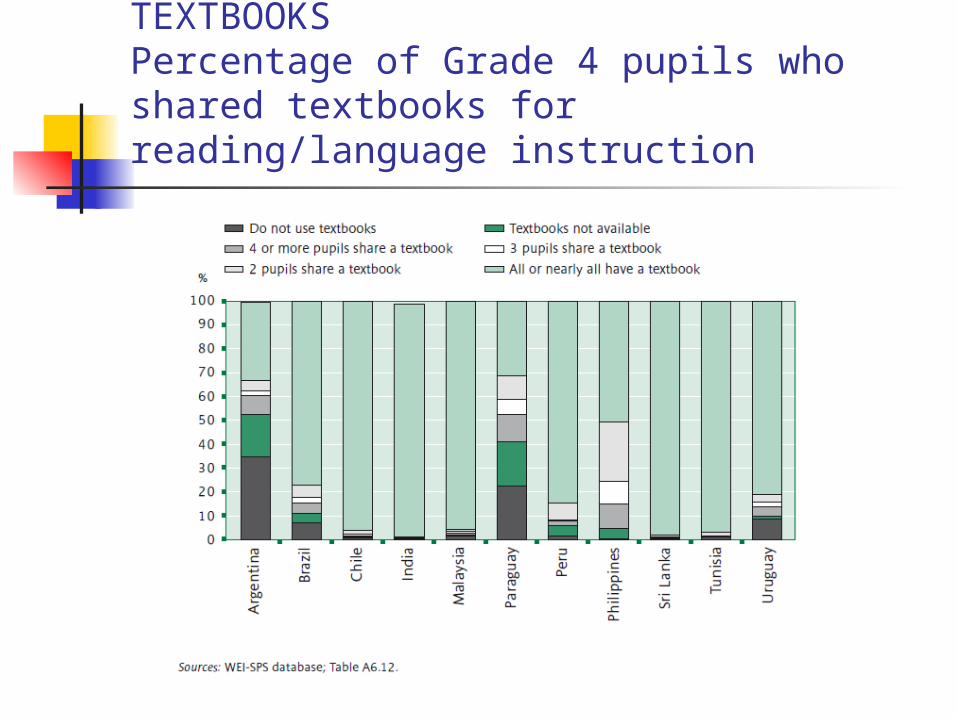
TEXTBOOKSPercentage of Grade 4 pupils who shared textbooks for reading/language instruction
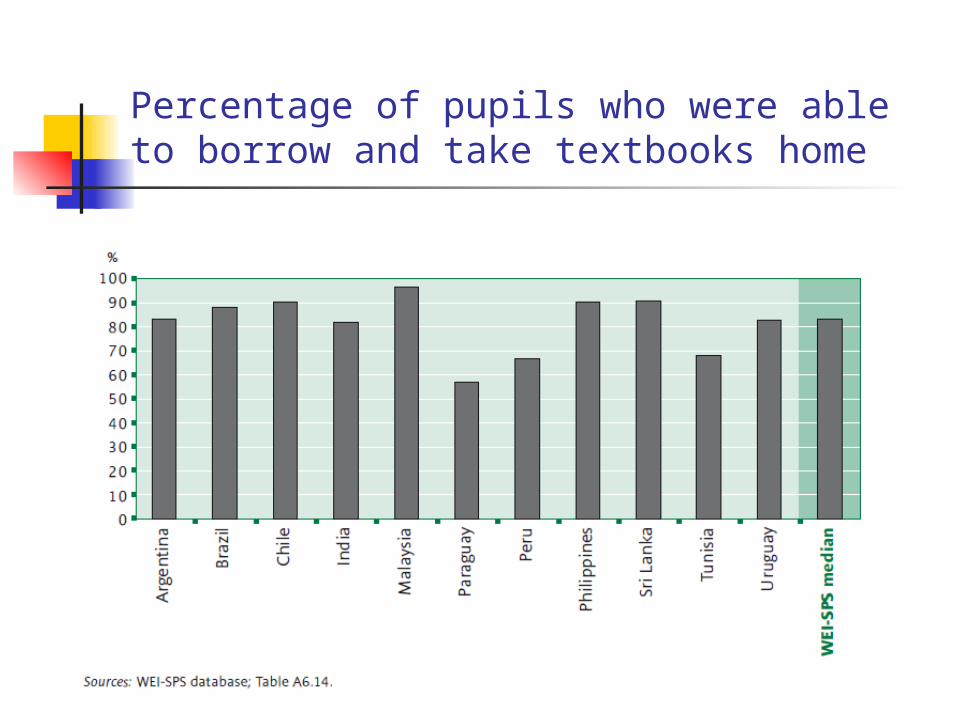
Percentage of pupils who were able to borrow and take textbooks home

ICTs Every country has a ‘pilot’ impact study Few (no?) countries have nationwide impact
studies Major determinants of school achievement are
Intelligence IQ Education of parents
Mixed results of ICT impact studies. Computers have more impact on education
when in the home than when at school
BUT ICT skills are a basic requirement for all roles in society

Conclusions Many different approaches to measuring
quality Statistics only part of story, also requires qualitative
observation Classroom processes very important but
difficult to measure Some standard indicators; PTR, survival,
repetition rates are useful Most important are learning outcomes as the
ultimate aim of schooling National and international assessment needed In assessing learning outcomes inputs and processes
need to be taken into account


