67
Measuring scope 3 carbon emissions – water and waste Report to HEFCE by Arup and De Montfort University January 2012
Measuring scope 3 carbon emissions – water and waste Report to HEFCE by Arup and De Montfort University January 2012
1
Table of contents Executive summary ............................................................................................................... 2
1. Introduction .................................................................................................................... 4
2. Stakeholder engagement ............................................................................................... 6
3. Water use (supply and wastewater treatment) ............................................................... 7
Methodology to estimate water-related GHG emissions .................................................... 8
Current practices in data collection .................................................................................... 9
4. Waste management ..................................................................................................... 11
Waste generation in the higher education sector ............................................................. 11
Methodologies to estimate GHG emissions related to waste ........................................... 13
Current practices in data collection .................................................................................. 21
5. Conclusions ................................................................................................................. 28
6. Proposed EMS definitions ............................................................................................ 28
New EMS definition: Water supply GHG emissions ......................................................... 29
New EMS definition: Wastewater treatment GHG emissions ........................................... 29
Proposed changes to existing waste EMS definition D73 ................................................ 30
Proposed new EMS definition related to hazardous waste .............................................. 30
Proposed new EMS definition related to GHG emissions from waste .............................. 31
7. Recommendations ....................................................................................................... 36
Annex A. Acknowledgements ............................................................................................. 39
Annex B. Calculation of emissions from recyclable materials .............................................. 41
Annex C. Greenhouse gas data provided by waste management contractors ..................... 42
Annex D. Water and waste online survey results ................................................................ 44
D1. Online survey ............................................................................................................ 44
D2. Results ...................................................................................................................... 55
Annex E. Resource efficiency recommendations ................................................................ 58
Terms and acronyms .......................................................................................................... 64
2
Executive summary 1. Higher Education Funding Council for England (HEFCE) is proactively driving and
supporting higher education institutions (HEIs) to measure, manage and reduce their greenhouse gas (GHG) emissions. In January 2011 HEFCE commissioned work to assist in measuring scope 3 emissions from HEIs in England. Ove Arup and Partners Ltd (Arup) and De Montfort University (DMU) were appointed under Lot C: estates: water and waste to provide: • A set of draft data definitions to measure scope 3 GHG emissions from waste and
water within the Estate Management Statistics (EMS) reporting system • Good practice guidance supporting the draft definitions that help HEIs adopt efficient
and effective data collection practices in order to measure their scope 3 emissions • A report that provides necessary background information, findings, justification for the
choice of definitions and recommendations. 2. This document presents the background report noted above on measuring and
monitoring scope 3 emissions from water and waste, which forms the evidence base for the revised EMS data definitions.
3. The evidence and findings in this report have been formulated through extensive research and a consultative approach involving a variety of stakeholders through a range of media. Based on the analysis of the EMS data, a questionnaire was developed to understand in more detail the existing practices of data collection for waste and water in the HEIs and to provide recommendations to estimate the scope 3 emissions related to these sources in the most accurate and comprehensive way possible.
4. The selected calculation approaches for GHG emissions associated with water and
waste are based on the guidelines for GHG company reporting of the Department for Environment, Food and Rural Affairs (Defra) and the Department of Energy and Climate Change (DECC) 1
as it was considered that this methodology would allow consistency and the ability to monitor changes in practices within the HE sector in the long term as it moves towards improved resource efficiency.
5. Most of the institutions report water and wastewater data through the EMS, and data coverage and reporting is of good quality. Therefore calculating GHG emissions associated with water and wastewater is likely to be relatively straightforward for HEIs.
6. In contrast, the scope of data collection amongst HEIs in relation to waste and recycling
data are varied. As a result of this diversity in quantity and quality of data, it was considered that the best option to measure GHG emissions from waste would involve a
1 Defra/DECC (2010). 2010 Guidelines to Defra / DECC’s GHG Conversion Factors for Company Reporting, EA, Defra, DECC, UK available at http://www.defra.gov.uk/publications/files/pb13625-emission-factor-methodology-paper-110905.pdf.
3
tiered approach, as this would be accessible to institutions with very limited data on waste through to institutions with good quality data.
7. It is important to highlight that the selected methodology to estimate GHG emissions
from water and waste, including the tiered approach, was pilot tested through webinars. 8. The method proposed for measuring GHG emissions associated with water and waste is
based on the guidelines for GHG company reporting of the Department for Environment, Food and Rural Affairs (Defra) and the Department of Energy and Climate Change (DECC).2
It was considered that this methodology would provide consistency and the ability to monitor changes in practices within the HE sector in the long term towards resource efficiency.
9. Pilot testing the approaches enabled the institutions to provide feedback on the methods and validate the recommendations in this report. This is integral to the consultative approach adopted by Arup and DMU.
10. To support institutions in calculating their scope 3 emissions in accordance with the final
data definitions, there is a Good Practice Guide3
which is a ‘sister’ document to this research report which should be referred to.
2 Defra/DECC (2010). 2010 Guidelines to Defra / DECC’s GHG Conversion Factors for Company Reporting, AEA, Defra, DECC, UK. 3 ‘Measuring scope 3 carbon emissions – waste and water. A guide to good practice’ (2012/01). Available at www.hefce.ac.uk.
4
1. Introduction 1.1 This document presents a report to Higher Education Funding Council for England
(HEFCE) on measuring and monitoring scope 3 emissions from water and waste. Its aim is to collate the evidence base which underpins the set of proposed data definitions to measure scope 3 GHG emissions from waste and water within the Estate Management Statistics (EMS) reporting system
1.2 The report has been written by Ove Arup and Partners Ltd (Arup) and De Montfort University (DMU). As such, it presents the views of the project team, and provides a basis for HEFCE to undertake further consultation with the higher education (HE) sector for the review of the Estate Management Statistics (EMS) definitions to be conducted by the Higher Education Statistics Agency (HESA).
Context 1.3 In February 2009, HEFCE published an updated strategic statement and action plan on
sustainable development.4
In these documents the Council set out its vision that the sector would become and be recognised as ‘a major contributor to society’s efforts to achieve sustainability – through the skills and knowledge that its graduates learn and put into practice, and through its own strategies and operations’.
1.4 Through wide spread consultation with the HE sector the Council facilitated the setting and adoption of carbon reduction targets.5
• 12 per cent by 2012
Based on a 2005 baseline the following scope 1 and 2 emissions sector-level targets were agreed:
• 29 per cent by 2017 • 43 per cent by 2020.
1.5 Whilst HEIs are expected to set their own targets for carbon reduction, the Council has
encouraged HEIs to adopt and progress carbon management plans by making a direct link between progress of these plans and future Capital Investment Fund (CIF) funding,6
which was introduced from 2011.
1.6 In relation to scope 3 emissions, the Council commits to undertake work to monitor and report scope 3 emissions, including: • Measurement of a baseline of carbon emissions from procurement by December
2012 • Set a sector-level scope 3 emissions reduction target by December 2013.
1.7 Including scope 3 emissions is important as previous studies are consistently showing
that these emissions are the majority of GHG emissions within organisations in the public
4 ‘Sustainable Development in Higher Education: 2008 updated to strategic statement and action plan’ (HEFCE 2009/03). Available at www.hefce.ac.uk. 5 ‘Carbon reduction target and strategy for higher education in England’ (HEFCE 2010/01). Available at www.hefce.ac.uk. 6 Arrangements for the second Capital Investment Framework (HEFCE circular letter 17/2010). Available at www.hefce.ac.uk.
5
sector.7
Moreover, the Council has linked performance in carbon to future funding, effectively ‘moving the game on’ for public sector institutions in the UK.
Background to the project 1.8 In January 2011, HEFCE commissioned work to assist in measuring scope 3 emissions
from HEIs in England. The objectives were to: • Measure a baseline of procurement emissions at sector level using scientifically
based methods • Produce definitions for measuring scope 3 emissions at institutional level for use
within the EMS from 2012/13 • Provide guidance that helps HEIs to adopt efficient and effective data collection
practices. 1.9 The project was split into three Lots:
• Lot A: procurement • Lot B: travel: commuting and business travel • Lot C: estates: water and waste.
1.10 Arup and its project partners De Montfort University and the Centre for Sustainability
Accounting (CenSA) completed the work on procurement (Lot A), and water and waste (Lot C). JMP Consultants Ltd completed the work on travel (Lot B).
Lot C: outputs 1.11 The following outputs were produced:
• Draft definitions: a set of draft definitions to feed into the HESA review of the EMS • Good Practice Guidance: a good practice guidance report supporting the draft
definitions that helps HEIs to adopt efficient and effective data collection practices in order to measure their scope 3 emissions
• Report: a report that provides necessary background information, findings, justification for the choice of definitions and recommendations.
Structure of the document 1.12 Following an introduction section, this document sets out the results of the research
conducted for this project in the following sections:
7 NHS Sustainable Development Unit and Stockholm Environment Institute (2008) NHS England Carbon Emissions Carbon Footprinting Report. Available at http://www.sd-ommission.org.uk/data/files/publications/NHS_Carbon_Emissions_modelling1.pdf; NHS Sustainable Development Unit, Stockholm Environment Institute and Arup (2010) NHS England Carbon Emissions Carbon Footprinting Modelling to 2020. Available at http://www.sdu.nhs.uk/documents/publications/1232983829_VbmQ_nhs_england_carbon_emissions_carbon_footprint_mode.pdf; Sustainable Development Commission (2008). Carbon Emissions from Schools: Where they arise and how to reduce them. SDC, UK. Available at http://www.sd-commission.org.uk/publications/downloads/Publish_Schools_Carbon_Strategy.pdf and Centre for Sustainability Accounting and Department for Environment Food and Rural Affairs (2010). A Greenhouse Gas Footprint Analysis of UK Central Government 1990-2008. London, UK. Available at http://randd.defra.gov.uk/Document.aspx?Document=EV0464_9812_FRP.pdf.
6
• Section 2: provides an overview of the stakeholder process and analysis describing the main activities conducted during the project
• Section 3: contains an analysis of the current practices of data collection related to water in HEIs and the methodologies to estimate water-related GHG emissions
• Section 4: contains an overview of waste generation in HEIs followed by an analysis of the existing waste management data collection practices and the methodologies to estimate waste-related GHG emissions
• Section 5: provides our recommendations to HEFCE related to EMS definitions for measuring and monitoring scope 3 GHG emissions from water and waste in advance of the HESA review due to conclude in spring 2012.
1.13 This report also contains the following Annexes:
• Annex A: acknowledges and thanks individuals and institutions who contributed to this project
• Annex B: describes the calculation of emissions from recyclable materials based on the methodology for estimating waste-related emissions recommended in this document
• Annex C: presents anecdotal evidence of the GHG data provided by waste management contractors to HEIs derived from telephone interviews
• Annex D: displays the complete questionnaire developed for the online survey and a summary of the results
• Annex E: provides resource efficiency recommendations related to water and waste minimisation.
2. Stakeholder engagement 2.1 This section provides a brief overview of the main activities conducted during the project. Estate management statistics (EMS) 2.2 EMS were introduced in 1996. The comprehensiveness of definitions and statistics for
the HE sector and the institutions’ response rate to EMS have been gradually increasing with the EMS currently covering 160 HEIs. The EMS analysis, presented in sections 3 and 4, is based on the most recent EMS data definitions8
and statistics reported for the year 2008/09.
Online survey 2.3 Based on the analysis of the EMS data, a questionnaire was developed to understand in
more detail the existing practices of data collection for water and waste in HEIs. The results of the questionnaire have been analysed to provide recommendations to estimate the scope 3 emissions related to water and waste in the most accurate and comprehensive way.
8 Available at www.hesa.ac.uk/index.php/component/option,com_datatables/Itemid,121/task,show_category/catdex,4/.
7
2.4 The responses to the questionnaire identified what water and waste data (water consumption, wastewater volume, waste composition, etc.) are currently collected and the method by which data are collected (monitoring systems, waste management contractors’ bills, etc.). The questionnaire asked about the waste mass of different materials sent to different treatment/disposal methods in order to be able to estimate a national average waste composition for waste sent to each treatment/disposal method for the HE sector in non-residential and residential buildings. Finally, the questionnaire also attempted to understand why institutions are not currently recording data and to identify existing barriers.
2.5 The questionnaire was available online during March and April 2011. Responses and
feedback were gratefully received from 94 HEIs (listed in Annex A) and the main results are summarised in sections 3 and 4. It is important to note that in a few cases more than one person of the same institution responded to the questionnaire. All responses were kept as they provided valuable information. A total of 99 responses from 94 institutions were analysed. These responses are examined and presented in section 3 for water-related data and section 4 for waste-related data.
Further stakeholder engagement 2.6 Valuable information and feedback was also provided by different institutions through:
• A presentation on the project progress at different conferences: the 2011 Environmental Association for Universities and Colleges (EAUC) annual conference at the University of York (12th April 2011) and the Association of University of Estates (AUDE) conference (19th
• Telephone interviews with some of the institutions that responded to the online survey
April 2011)
• Telephone interviews with waste management contractors • Pilot test webinars (May 24th and June 9th
2011).
2.7 It is important to mention that the webinars were useful in the stakeholder engagement process, not only for pilot testing the approaches and recommendations proposed, but also to validate our results. In addition, it also provided participants the opportunity to exchange experiences about their waste and water management practices as well as advise on the project’s direction. Some of this information is presented respectively in section 3 and section 4 of this document.
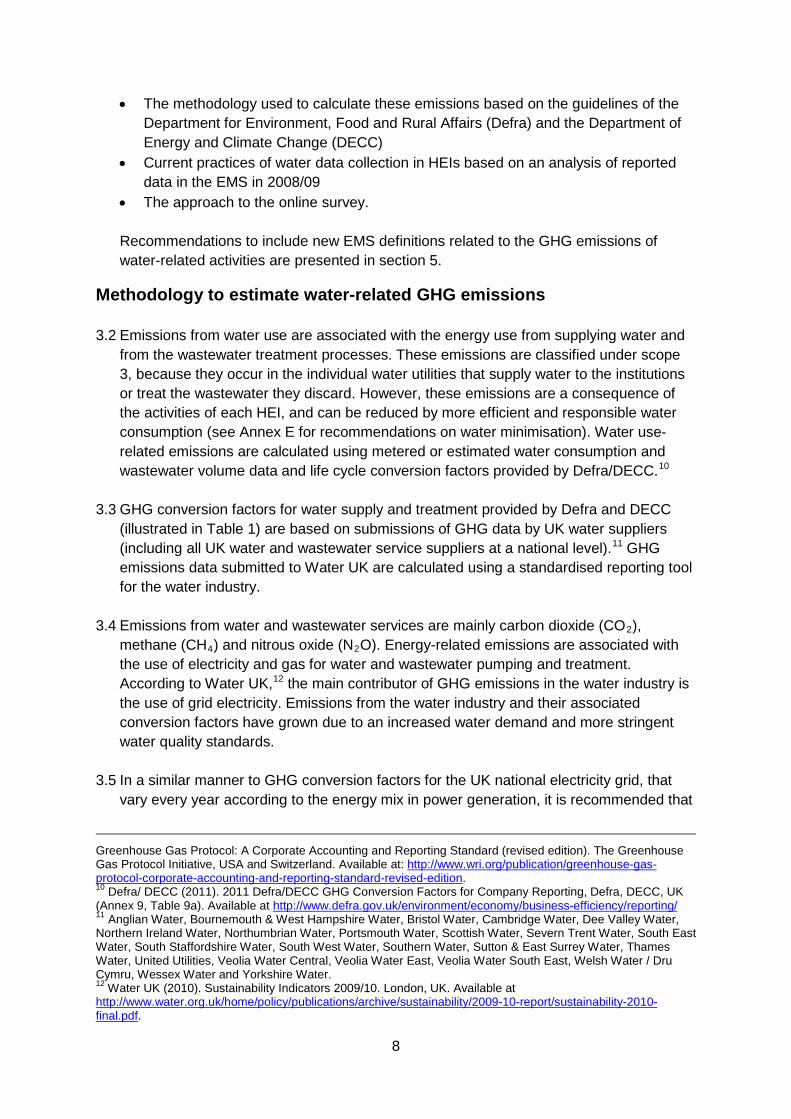
3. Water use (supply and wastewater treatment) 3.1 This section explains:
• Why GHG emissions from water use and wastewater are within the scope 3 category of the GHG Protocol9
9 World Resources Institute (WRI) and World Business Council for Sustainable Development (WBCSD) (2004). The Greenhouse Gas Protocol: A Corporate Accounting and Reporting Standard (revised edition). The World Resources Institute (WRI) and World Business Council for Sustainable Development (WBCSD) (2004). The
of the World Resources Institute (WRI) and World Business Council for Sustainable Development (WBCSD)
8
• The methodology used to calculate these emissions based on the guidelines of the Department for Environment, Food and Rural Affairs (Defra) and the Department of Energy and Climate Change (DECC)
• Current practices of water data collection in HEIs based on an analysis of reported data in the EMS in 2008/09
• The approach to the online survey. Recommendations to include new EMS definitions related to the GHG emissions of water-related activities are presented in section 5.
Methodology to estimate water-related GHG emissions 3.2 Emissions from water use are associated with the energy use from supplying water and
from the wastewater treatment processes. These emissions are classified under scope 3, because they occur in the individual water utilities that supply water to the institutions or treat the wastewater they discard. However, these emissions are a consequence of the activities of each HEI, and can be reduced by more efficient and responsible water consumption (see Annex E for recommendations on water minimisation). Water use-related emissions are calculated using metered or estimated water consumption and wastewater volume data and life cycle conversion factors provided by Defra/DECC.10
3.3 GHG conversion factors for water supply and treatment provided by Defra and DECC (illustrated in Table 1) are based on submissions of GHG data by UK water suppliers (including all UK water and wastewater service suppliers at a national level).11
GHG emissions data submitted to Water UK are calculated using a standardised reporting tool for the water industry.
3.4 Emissions from water and wastewater services are mainly carbon dioxide (CO2), methane (CH4) and nitrous oxide (N2O). Energy-related emissions are associated with the use of electricity and gas for water and wastewater pumping and treatment. According to Water UK,12
the main contributor of GHG emissions in the water industry is the use of grid electricity. Emissions from the water industry and their associated conversion factors have grown due to an increased water demand and more stringent water quality standards.
3.5 In a similar manner to GHG conversion factors for the UK national electricity grid, that vary every year according to the energy mix in power generation, it is recommended that
Greenhouse Gas Protocol: A Corporate Accounting and Reporting Standard (revised edition). The Greenhouse Gas Protocol Initiative, USA and Switzerland. Available at: http://www.wri.org/publication/greenhouse-gas-protocol-corporate-accounting-and-reporting-standard-revised-edition. 10 Defra/ DECC (2011). 2011 Defra/DECC GHG Conversion Factors for Company Reporting, Defra, DECC, UK (Annex 9, Table 9a). Available at http://www.defra.gov.uk/environment/economy/business-efficiency/reporting/ 11 Anglian Water, Bournemouth & West Hampshire Water, Bristol Water, Cambridge Water, Dee Valley Water, Northern Ireland Water, Northumbrian Water, Portsmouth Water, Scottish Water, Severn Trent Water, South East Water, South Staffordshire Water, South West Water, Southern Water, Sutton & East Surrey Water, Thames Water, United Utilities, Veolia Water Central, Veolia Water East, Veolia Water South East, Welsh Water / Dru Cymru, Wessex Water and Yorkshire Water. 12 Water UK (2010). Sustainability Indicators 2009/10. London, UK. Available at http://www.water.org.uk/home/policy/publications/archive/sustainability/2009-10-report/sustainability-2010-final.pdf.
9
GHG emissions for water supply and wastewater treatment are calculated based on annual conversion factors that reflect the actual emissions per volume unit occurring in the water utilities.
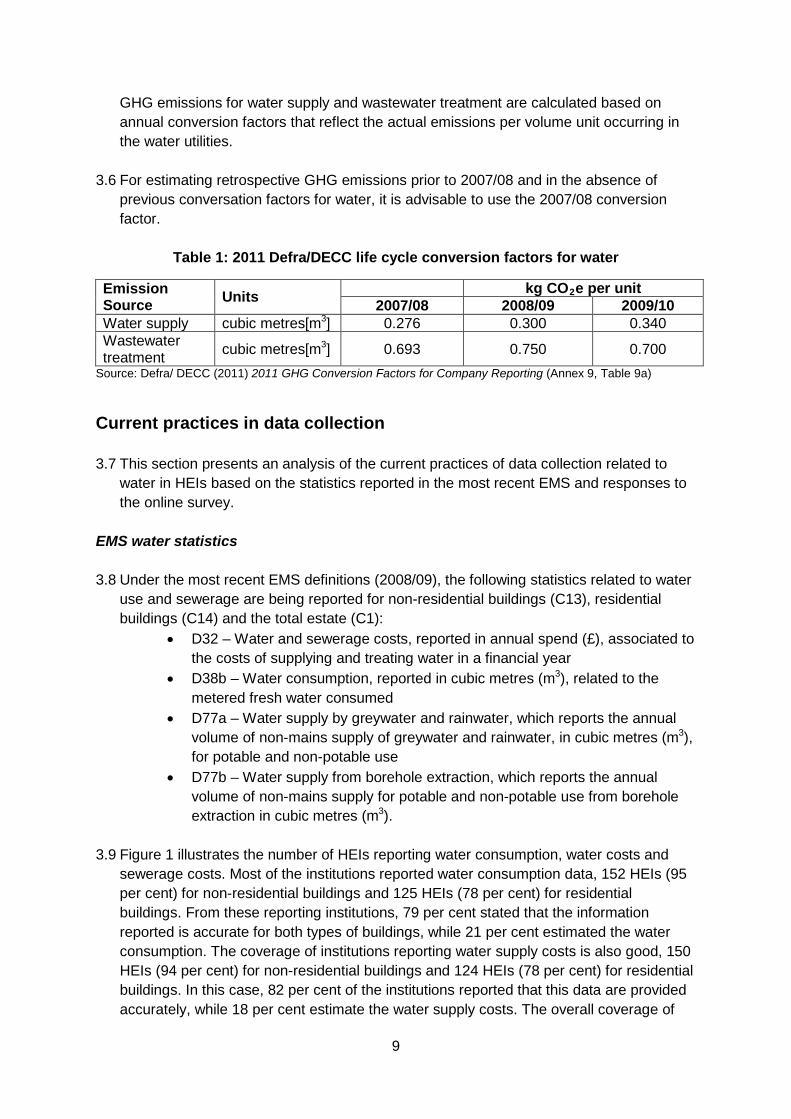
3.6 For estimating retrospective GHG emissions prior to 2007/08 and in the absence of
previous conversation factors for water, it is advisable to use the 2007/08 conversion factor.
Table 1: 2011 Defra/DECC life cycle conversion factors for water
Emission Source Units kg CO2
2007/08 e per unit
2008/09 2009/10 Water supply cubic metres[m3 0.276 ] 0.300 0.340 Wastewater treatment cubic metres[m3 0.693 ] 0.750 0.700
Source: Defra/ DECC (2011) 2011 GHG Conversion Factors for Company Reporting (Annex 9, Table 9a)
Current practices in data collection 3.7 This section presents an analysis of the current practices of data collection related to
water in HEIs based on the statistics reported in the most recent EMS and responses to the online survey.
EMS water statistics 3.8 Under the most recent EMS definitions (2008/09), the following statistics related to water
use and sewerage are being reported for non-residential buildings (C13), residential buildings (C14) and the total estate (C1):
• D32 – Water and sewerage costs, reported in annual spend (£), associated to the costs of supplying and treating water in a financial year
• D38b – Water consumption, reported in cubic metres (m3
• D77a – Water supply by greywater and rainwater, which reports the annual volume of non-mains supply of greywater and rainwater, in cubic metres (m
), related to the metered fresh water consumed
3
• D77b – Water supply from borehole extraction, which reports the annual volume of non-mains supply for potable and non-potable use from borehole extraction in cubic metres (m
), for potable and non-potable use
3
).
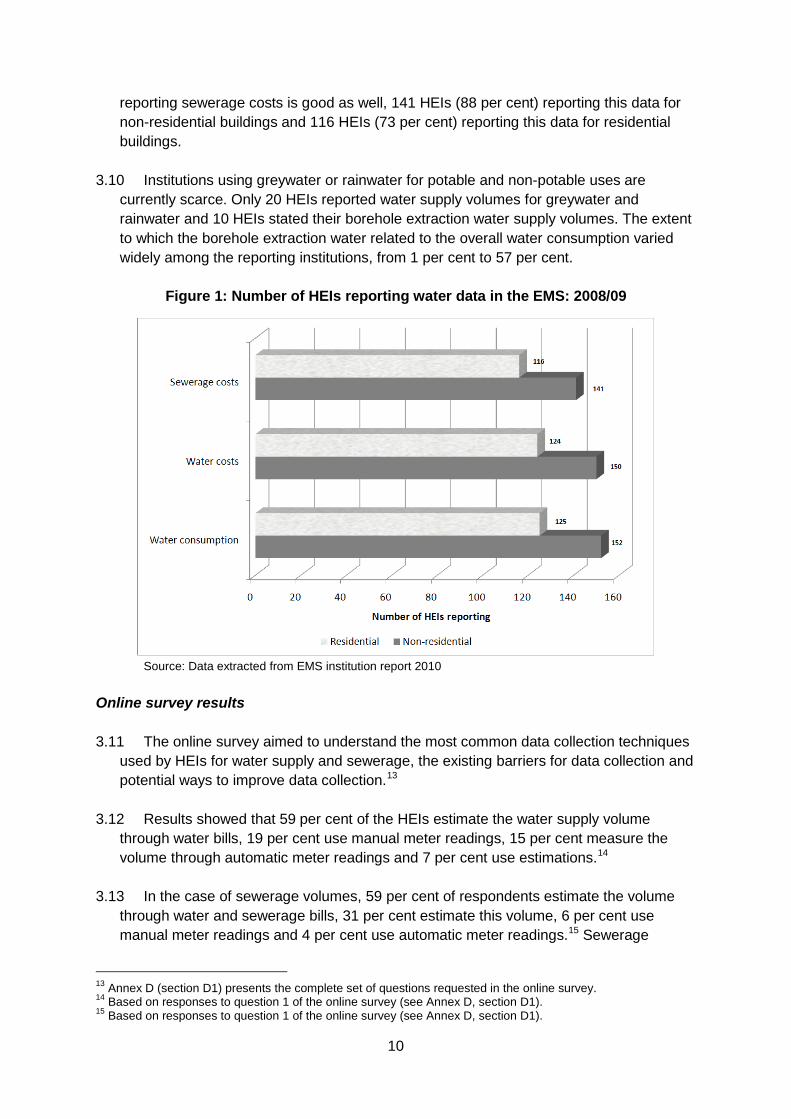
3.9 Figure 1 illustrates the number of HEIs reporting water consumption, water costs and sewerage costs. Most of the institutions reported water consumption data, 152 HEIs (95 per cent) for non-residential buildings and 125 HEIs (78 per cent) for residential buildings. From these reporting institutions, 79 per cent stated that the information reported is accurate for both types of buildings, while 21 per cent estimated the water consumption. The coverage of institutions reporting water supply costs is also good, 150 HEIs (94 per cent) for non-residential buildings and 124 HEIs (78 per cent) for residential buildings. In this case, 82 per cent of the institutions reported that this data are provided accurately, while 18 per cent estimate the water supply costs. The overall coverage of
10
reporting sewerage costs is good as well, 141 HEIs (88 per cent) reporting this data for non-residential buildings and 116 HEIs (73 per cent) reporting this data for residential buildings.
3.10 Institutions using greywater or rainwater for potable and non-potable uses are
currently scarce. Only 20 HEIs reported water supply volumes for greywater and rainwater and 10 HEIs stated their borehole extraction water supply volumes. The extent to which the borehole extraction water related to the overall water consumption varied widely among the reporting institutions, from 1 per cent to 57 per cent.
Figure 1: Number of HEIs reporting water data in the EMS: 2008/09
Source: Data extracted from EMS institution report 2010
Online survey results 3.11 The online survey aimed to understand the most common data collection techniques
used by HEIs for water supply and sewerage, the existing barriers for data collection and potential ways to improve data collection.13
3.12 Results showed that 59 per cent of the HEIs estimate the water supply volume through water bills, 19 per cent use manual meter readings, 15 per cent measure the volume through automatic meter readings and 7 per cent use estimations.14
3.13 In the case of sewerage volumes, 59 per cent of respondents estimate the volume through water and sewerage bills, 31 per cent estimate this volume, 6 per cent use manual meter readings and 4 per cent use automatic meter readings.15
13 Annex D (section D1) presents the complete set of questions requested in the online survey.
Sewerage
14 Based on responses to question 1 of the online survey (see Annex D, section D1). 15 Based on responses to question 1 of the online survey (see Annex D, section D1).
11
volumes are not metered in institutions, except from one HEI that partially measures the volume in its main sewage pumping station. Most respondents mentioned that sewerage volumes are estimated by their water utility company based on a percentage of the water supply volume, which varies from 90 per cent to 95 per cent according to the water company.
3.14 Although few barriers for collecting water supply volumes emerged, some
respondents suggested that funding for automatic metering systems throughout the estate would improve data collection.
3.15 For sewerage volumes, the main barriers for data collection were prohibitive costs of
additional equipment and staff time; lack of cooperation from water utilities who usually provide inaccurate data and dealing with properties with no meters in residential buildings. Several respondents mentioned that the support required to improve data collection would be in the form of a monitoring tool for collating data (13 responses) and guidance on how to measure and monitor this data (12 responses).16
3.16 Based on the existing water-related EMS definitions, the quality of data reporting and the results of the online survey, our recommendations for the new EMS definitions related to the GHG emissions of water-related activities are presented in section 5.
4. Waste management 4.1 This section explains:
• Where waste is commonly generated in HEIs • Why GHG emissions from waste management are within the scope 3 category of the
GHG Protocol of the WRI and WBCSD • The methodologies used to calculate these emissions and the rationale of selecting
the guidelines of Defra and DECC to calculate these emissions • The current practices of waste mass data collection in HEIs based on an analysis of
reported data in the EMS in 2008/09 and the online survey. Recommendations for modifying existing EMS definitions and the inclusion of new definitions related to the GHG emissions associated with waste are presented in section 5.
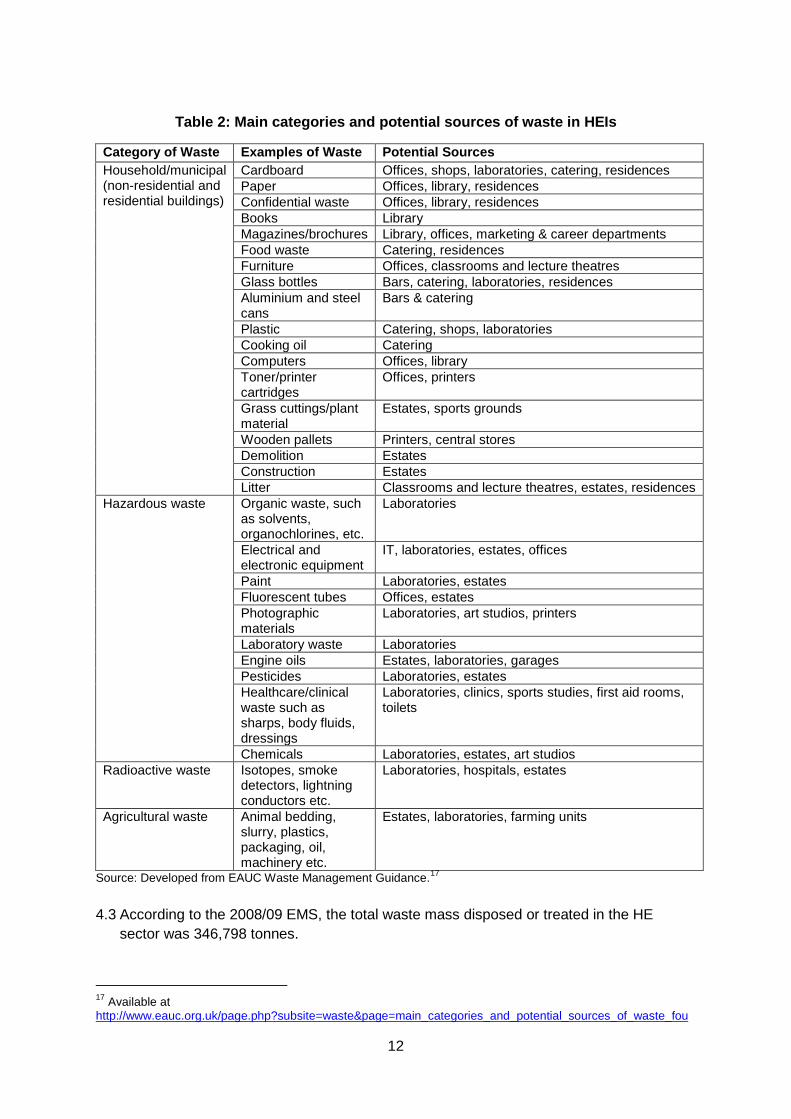
Waste generation in the higher education sector 4.2 It is important to understand which waste streams arise in HEIs and where the different
types of waste are likely to be generated. Table 2 illustrates the categories of waste produced in HEIs (municipal, clinical, hazardous waste, radioactive and agricultural), the potential waste streams generated within these categories and the potential sources of these types of waste within HEIs.
16 Based on question 1 of the online survey (see Annex D, section D1).
12
Table 2: Main categories and potential sources of waste in HEIs
Category of Waste Examples of Waste Potential Sources Household/municipal (non-residential and residential buildings)
Cardboard Offices, shops, laboratories, catering, residences Paper Offices, library, residences Confidential waste Offices, library, residences Books Library Magazines/brochures Library, offices, marketing & career departments Food waste Catering, residences Furniture Offices, classrooms and lecture theatres Glass bottles Bars, catering, laboratories, residences Aluminium and steel cans
Bars & catering
Plastic Catering, shops, laboratories Cooking oil Catering Computers Offices, library Toner/printer cartridges
Offices, printers
Grass cuttings/plant material
Estates, sports grounds
Wooden pallets Printers, central stores Demolition Estates Construction Estates Litter Classrooms and lecture theatres, estates, residences
Hazardous waste Organic waste, such as solvents, organochlorines, etc.
Laboratories
Electrical and electronic equipment
IT, laboratories, estates, offices
Paint Laboratories, estates Fluorescent tubes Offices, estates Photographic materials
Laboratories, art studios, printers
Laboratory waste Laboratories Engine oils Estates, laboratories, garages Pesticides Laboratories, estates Healthcare/clinical waste such as sharps, body fluids, dressings
Laboratories, clinics, sports studies, first aid rooms, toilets
Chemicals Laboratories, estates, art studios Radioactive waste Isotopes, smoke
detectors, lightning conductors etc.
Laboratories, hospitals, estates
Agricultural waste Animal bedding, slurry, plastics, packaging, oil, machinery etc.
Estates, laboratories, farming units
Source: Developed from EAUC Waste Management Guidance.17
4.3 According to the 2008/09 EMS, the total waste mass disposed or treated in the HE sector was 346,798 tonnes.
17 Available at http://www.eauc.org.uk/page.php?subsite=waste&page=main_categories_and_potential_sources_of_waste_fou
13
4.4 As explained in the Good Practice Document (section 3),18
Methodologies to estimate GHG emissions related to waste
the waste categories, waste streams and volume vary widely amongst institutions, due to their size, geographical location, areas and degrees of specialism and their relative balance between research and teaching.
4.5 Emissions from waste disposal are mainly associated with CH4 and N2
O emissions from landfills or solid waste disposal sites (SWDS), which are typically the largest source of GHG emissions in the waste sector. These emissions are classified under scope 3, because they occur in landfills or treatment facilities operated by private companies, often in partnership with the local authorities. In a similar manner to other scope 3 emissions, these are also a consequence of the activities of the HEI, which can be reduced through waste minimisation, reuse and recycling (see Annex E for recommendations on waste minimisation and reduction of waste-related GHG emissions).
4.6 The following sub-sections explain 3 different GHG calculation approaches that are used to estimate emissions from waste: • The Defra/DECC guidelines for company reporting based on a life cycle assessment
(LCA) approach • The Entreprises pour l’Environnement (EpE) Protocol for the quantification of
greenhouse gas emissions from waste management activities (mainly used by waste management contractors)
• Calculations based on supply chain conversion factors using an environmental extended input-output (EE-IO) approach.
It is important to highlight that the recommended approach to estimate GHG emissions from waste in this document (see section 5) and in the Good Practice Guidance19
is based on the Defra/DECC guidelines for Company Reporting based on an LCA approach.
Defra/DECC Guidelines to estimate GHG emissions from waste 4.7 GHG emissions associated with waste management operations arise from a number of
activities in the waste management cycle, such as: • Waste transportation (e.g. from households to transfer stations, recyclables from
material recovery facilities to re-processors, etc.) • Waste treatment (e.g. gasification processes, mechanical biological treatment,
recycling and composting, etc.) • Waste disposal (landfill).
4.8 The methodology followed by Defra and DECC is based on the Waste & Resources
Action Programme (WRAP) Methodology for assessing the climate change impacts of
18 Arup and DMU (2012/01). Measuring scope 3 carbon emissions – water and waste. A guide to good practice (section 3). 19 Arup and DMU (2012/01). Measuring scope 3 carbon emissions – water and waste. A guide to good practice (section 3 and Annex A).
14
packaging optimisation under the Courtauld Commitment.20
Using WRAP’s calculation methodology, emissions derived from all these activities are estimated and a GHG benefit is attributed to the recovery of energy and the displacement of materials through recycling. The objectives of WRAP’s methodology are to identify the consequences of changes in the system, to quantify the environmental impacts of different waste treatment routes and to highlight the potential benefits of recycling compared to alternative options.
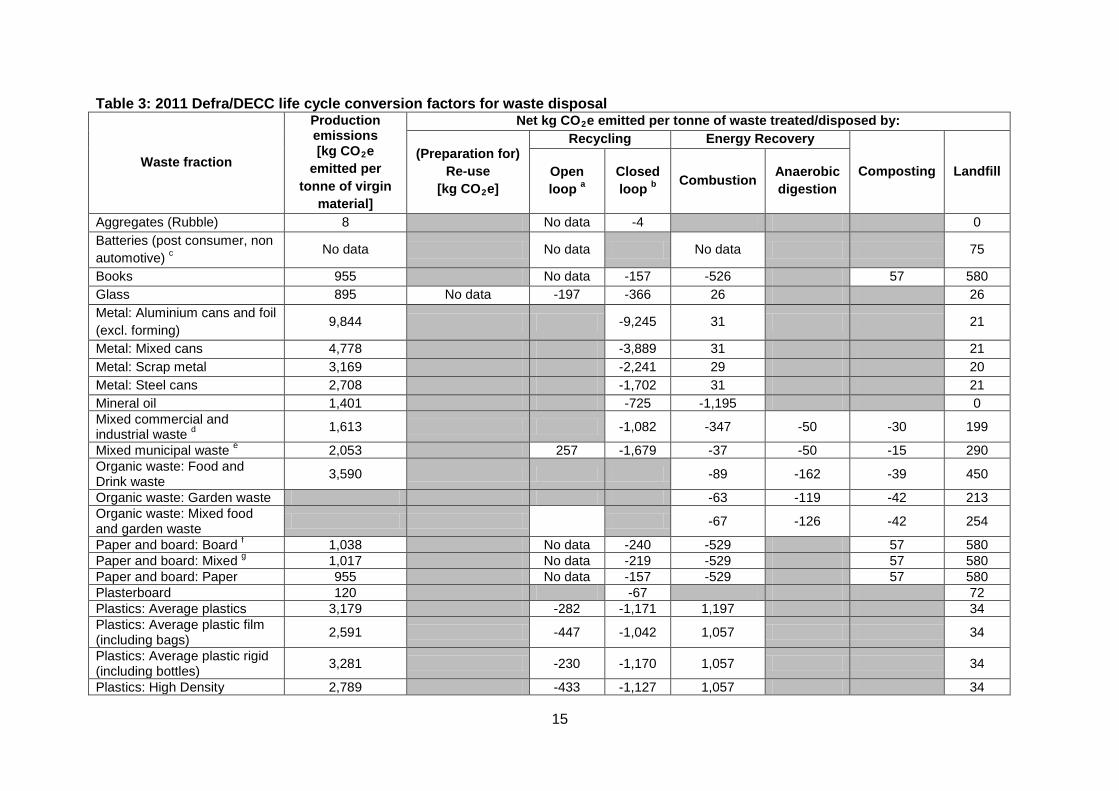
4.9 The Defra/DECC life cycle GHG conversion factors21
Table 3
are determined based on the mass of GHG released or avoided for every tonne of waste with a particular composition arising in the waste management cycle. The conversion factors, shown in , are calculated considering the different life cycle stages (embedded emissions) of the waste streams, such as extraction and primary processing of virgin materials, manufacturing of goods containing these materials (energy and process emissions), transportation and distribution of goods, re-use and/or recycling as well as waste transport, treatment and disposal (e.g. energy from waste, open-loop recycling, landfill). Some life cycle stages are excluded such as the use phase (e.g. energy used in cooking food or electricity use in electric appliances) to avoid double-counting in the scopes 1 and 2 emissions of the individual reporting organisations. Biogenic CO2 is also excluded.22
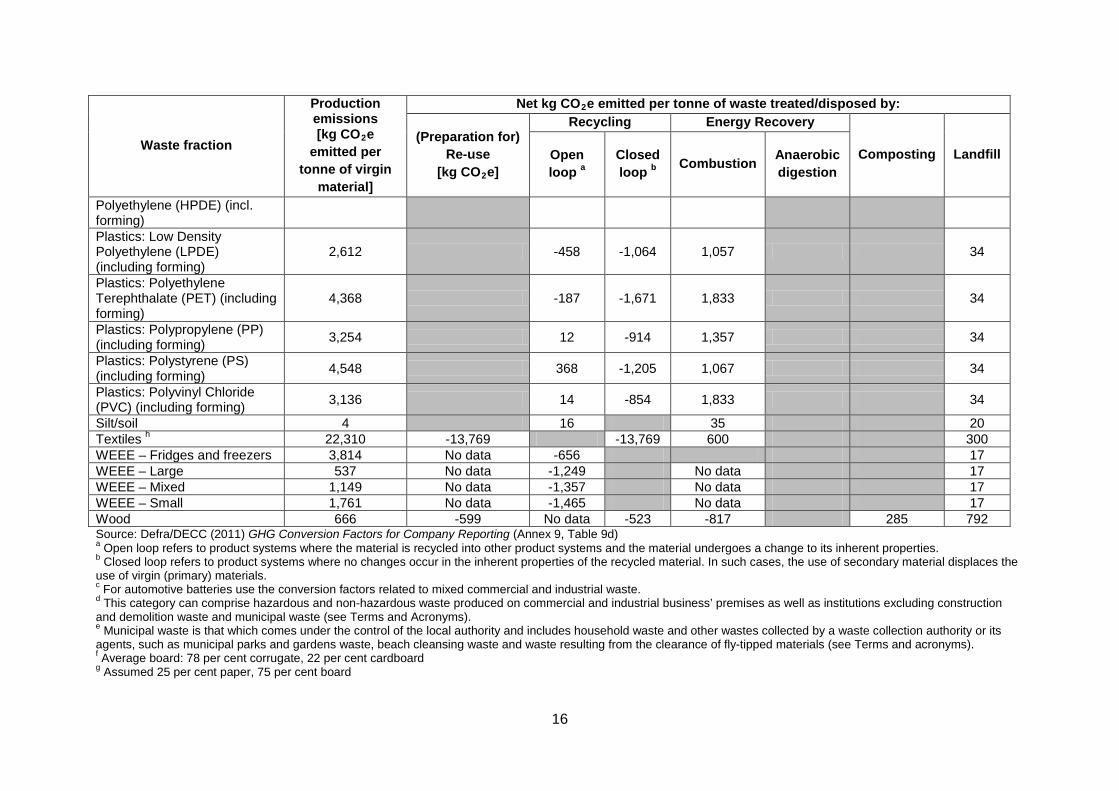
4.10 The conversion factors related to the production from virgin material, displayed in the second column of Table 3, represent an approximation of the GHG impacts of the goods that institutions procure. The estimates are based on a range of products at the national level rather than a specific product. These factors are unlikely to be the same as those estimated for specific products manufactured by a company, for example, through a product carbon footprint compliant to the PAS 205023 or other standards24. However, the data used by WRAP can be considered to be representative at a UK level. For further information on the assumptions behind these estimates, please refer to the Defra/DECC conversion factors guidance and the WRAP Courtauld Carbon Methodology.25
20 WRAP (2010). Methodology for assessing the climate change impacts of packaging optimisation under the Courtauld Commitment Phase 2, Oxon, UK. Available at http://www.wrap.org.uk/downloads/Carbon_Methodology_-_Nov_2010_V101.1fccf9f5.10324.pdf 21 Defra/DECC (2011). 2011 Guidelines to Defra / DECC’s GHG Conversion Factors for Company Reporting, AEA, Defra, DECC, UK. Available at http://www.defra.gov.uk/environment/economy/business-efficiency/reporting/ (Annex 9, Table 9d) 22 Biogenic CO2 refers CO2 emissions from the combustion of biogenic origin sources, such as biomass or in this case the combustion of methane associated with the decomposition of organic materials in landfills or anaerobic digesters. It is considered that when biomass is combusted, these emissions are considered to be equivalent to the CO2 absorbed in the growth of biomass and there is no net increase in the CO2 atmospheric concentrations (consistent with the methodologies of the IPCC and the WRI/WBCSD GHG Protocol). 23 British Standards Institute (BSI) (2010). PAS 2050 Specification for the assessment of the life cycle of greenhouse gas emissions of goods and services 24 For example, the GHG Protocol Product Standard: WRI/WBCSD (2010). Product Accounting and Reporting Standard. Draft for Stakeholder Review – November 2010. The Greenhouse Gas Protocol Initiative, USA and Switzerland. Available at: http://www.ghgprotocol.org/files/ghgp/public/ghg-protocol-product-standard-draft-november-20101.pdf. 25 Defra/DECC (2011). 2011 Guidelines to Defra / DECC’s GHG Conversion Factors for Company Reporting, AEA, Defra, DECC, UK. Available at http://www.defra.gov.uk/environment/economy/business-efficiency/reporting/ and WRAP (2010). Methodology for assessing the climate change impacts of packaging optimisation under the Courtauld Commitment Phase 2, Oxon, UK. Available at http://www.wrap.org.uk/downloads/Carbon_Methodology_-_Nov_2010_V101.1fccf9f5.10324.pdf
15
Table 3: 2011 Defra/DECC life cycle conversion factors for waste disposal
Waste fraction
Production emissions [kg CO2
Net kg CO
e emitted per
tonne of virgin material]
2
(Preparation for)
e emitted per tonne of waste treated/disposed by:
Re-use [kg CO2
Recycling
e]
Energy Recovery
Composting Landfill Open loop
Closed loop a Combustion b
Anaerobic digestion
Aggregates (Rubble) 8 No data -4 0 Batteries (post consumer, non automotive) No data c No data No data 75
Books 955 No data -157 -526 57 580 Glass 895 No data -197 -366 26 26 Metal: Aluminium cans and foil (excl. forming) 9,844 -9,245 31 21
Metal: Mixed cans 4,778 -3,889 31 21 Metal: Scrap metal 3,169 -2,241 29 20 Metal: Steel cans 2,708 -1,702 31 21 Mineral oil 1,401 -725 -1,195 0 Mixed commercial and industrial waste 1,613 d -1,082 -347 -50 -30 199
Mixed municipal waste 2,053 e 257 -1,679 -37 -50 -15 290 Organic waste: Food and Drink waste 3,590 -89 -162 -39 450
Organic waste: Garden waste -63 -119 -42 213 Organic waste: Mixed food and garden waste -67 -126 -42 254
Paper and board: Board 1,038 f No data -240 -529 57 580 Paper and board: Mixed g 1,017 No data -219 -529 57 580 Paper and board: Paper 955 No data -157 -529 57 580 Plasterboard 120 -67 72 Plastics: Average plastics 3,179 -282 -1,171 1,197 34 Plastics: Average plastic film (including bags) 2,591 -447 -1,042 1,057 34
Plastics: Average plastic rigid (including bottles) 3,281 -230 -1,170 1,057 34
Plastics: High Density 2,789 -433 -1,127 1,057 34
16
Waste fraction
Production emissions [kg CO2
Net kg CO
e emitted per
tonne of virgin material]
2
(Preparation for)
e emitted per tonne of waste treated/disposed by:
Re-use [kg CO2
Recycling
e]
Energy Recovery
Composting Landfill Open loop
Closed loop a Combustion b
Anaerobic digestion
Polyethylene (HPDE) (incl. forming) Plastics: Low Density Polyethylene (LPDE) (including forming)
2,612 -458 -1,064 1,057 34
Plastics: Polyethylene Terephthalate (PET) (including forming)
4,368 -187 -1,671 1,833 34
Plastics: Polypropylene (PP) (including forming) 3,254 12 -914 1,357 34
Plastics: Polystyrene (PS) (including forming) 4,548 368 -1,205 1,067 34
Plastics: Polyvinyl Chloride (PVC) (including forming) 3,136 14 -854 1,833 34
Silt/soil 4 16 35 20 Textiles 22,310 h -13,769 -13,769 600 300 WEEE – Fridges and freezers 3,814 No data -656 17 WEEE – Large 537 No data -1,249 No data 17 WEEE – Mixed 1,149 No data -1,357 No data 17 WEEE – Small 1,761 No data -1,465 No data 17 Wood 666 -599 No data -523 -817 285 792 Source: Defra/DECC (2011) GHG Conversion Factors for Company Reporting (Annex 9, Table 9d) a Open loop refers to product systems where the material is recycled into other product systems and the material undergoes a change to its inherent properties. b Closed loop refers to product systems where no changes occur in the inherent properties of the recycled material. In such cases, the use of secondary material displaces the use of virgin (primary) materials. c For automotive batteries use the conversion factors related to mixed commercial and industrial waste. d This category can comprise hazardous and non-hazardous waste produced on commercial and industrial business’ premises as well as institutions excluding construction and demolition waste and municipal waste (see Terms and Acronyms). e Municipal waste is that which comes under the control of the local authority and includes household waste and other wastes collected by a waste collection authority or its agents, such as municipal parks and gardens waste, beach cleansing waste and waste resulting from the clearance of fly-tipped materials (see Terms and acronyms). f Average board: 78 per cent corrugate, 22 per cent cardboard g Assumed 25 per cent paper, 75 per cent board

17
h
Benefits of recycling and reuse of textiles is based on 60 per cent reused, 30 per cent recycled (replacing paper towels), 10 per cent landfill. Of the items reused, 80 per cent are assumed to avoid new items.
18
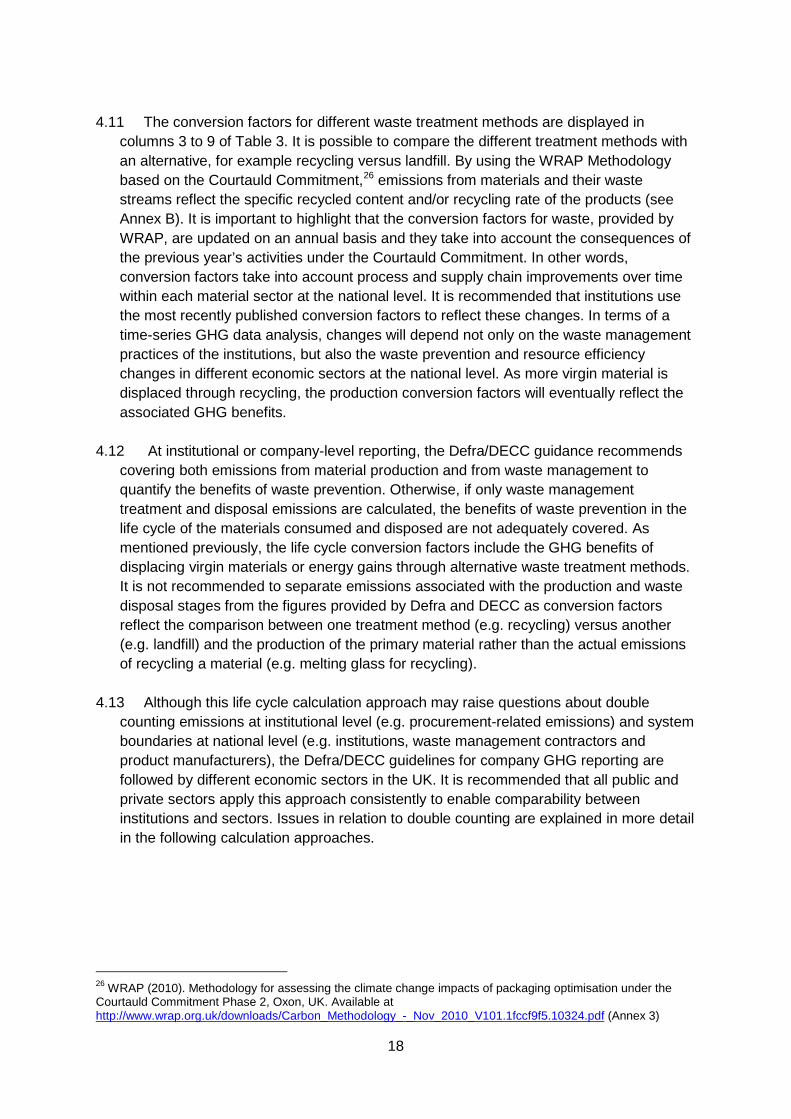
4.11 The conversion factors for different waste treatment methods are displayed in
columns 3 to 9 of Table 3. It is possible to compare the different treatment methods with an alternative, for example recycling versus landfill. By using the WRAP Methodology based on the Courtauld Commitment,26
emissions from materials and their waste streams reflect the specific recycled content and/or recycling rate of the products (see Annex B). It is important to highlight that the conversion factors for waste, provided by WRAP, are updated on an annual basis and they take into account the consequences of the previous year’s activities under the Courtauld Commitment. In other words, conversion factors take into account process and supply chain improvements over time within each material sector at the national level. It is recommended that institutions use the most recently published conversion factors to reflect these changes. In terms of a time-series GHG data analysis, changes will depend not only on the waste management practices of the institutions, but also the waste prevention and resource efficiency changes in different economic sectors at the national level. As more virgin material is displaced through recycling, the production conversion factors will eventually reflect the associated GHG benefits.
4.12 At institutional or company-level reporting, the Defra/DECC guidance recommends covering both emissions from material production and from waste management to quantify the benefits of waste prevention. Otherwise, if only waste management treatment and disposal emissions are calculated, the benefits of waste prevention in the life cycle of the materials consumed and disposed are not adequately covered. As mentioned previously, the life cycle conversion factors include the GHG benefits of displacing virgin materials or energy gains through alternative waste treatment methods. It is not recommended to separate emissions associated with the production and waste disposal stages from the figures provided by Defra and DECC as conversion factors reflect the comparison between one treatment method (e.g. recycling) versus another (e.g. landfill) and the production of the primary material rather than the actual emissions of recycling a material (e.g. melting glass for recycling).
4.13 Although this life cycle calculation approach may raise questions about double
counting emissions at institutional level (e.g. procurement-related emissions) and system boundaries at national level (e.g. institutions, waste management contractors and product manufacturers), the Defra/DECC guidelines for company GHG reporting are followed by different economic sectors in the UK. It is recommended that all public and private sectors apply this approach consistently to enable comparability between institutions and sectors. Issues in relation to double counting are explained in more detail in the following calculation approaches.
26 WRAP (2010). Methodology for assessing the climate change impacts of packaging optimisation under the Courtauld Commitment Phase 2, Oxon, UK. Available at http://www.wrap.org.uk/downloads/Carbon_Methodology_-_Nov_2010_V101.1fccf9f5.10324.pdf (Annex 3)
19
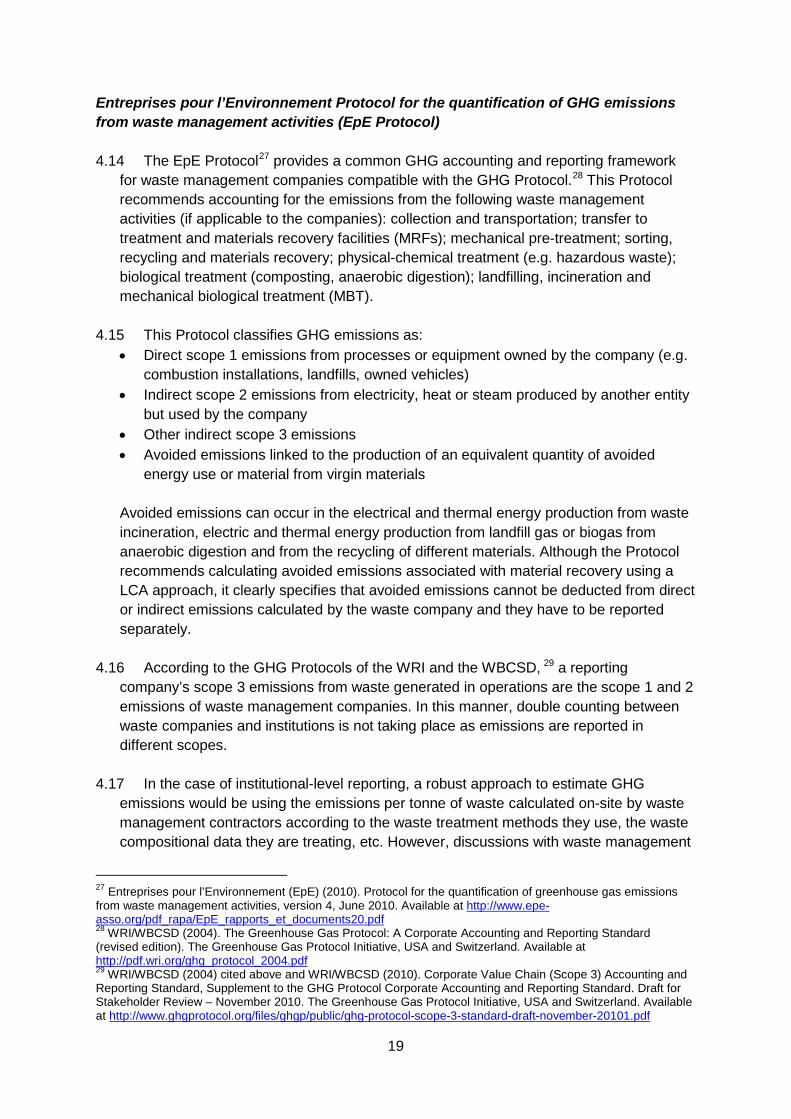
Entreprises pour l’Environnement Protocol for the quantification of GHG emissions from waste management activities (EpE Protocol) 4.14 The EpE Protocol27 provides a common GHG accounting and reporting framework
for waste management companies compatible with the GHG Protocol.28
This Protocol recommends accounting for the emissions from the following waste management activities (if applicable to the companies): collection and transportation; transfer to treatment and materials recovery facilities (MRFs); mechanical pre-treatment; sorting, recycling and materials recovery; physical-chemical treatment (e.g. hazardous waste); biological treatment (composting, anaerobic digestion); landfilling, incineration and mechanical biological treatment (MBT).
4.15 This Protocol classifies GHG emissions as: • Direct scope 1 emissions from processes or equipment owned by the company (e.g.
combustion installations, landfills, owned vehicles) • Indirect scope 2 emissions from electricity, heat or steam produced by another entity
but used by the company • Other indirect scope 3 emissions • Avoided emissions linked to the production of an equivalent quantity of avoided
energy use or material from virgin materials Avoided emissions can occur in the electrical and thermal energy production from waste incineration, electric and thermal energy production from landfill gas or biogas from anaerobic digestion and from the recycling of different materials. Although the Protocol recommends calculating avoided emissions associated with material recovery using a LCA approach, it clearly specifies that avoided emissions cannot be deducted from direct or indirect emissions calculated by the waste company and they have to be reported separately.
4.16 According to the GHG Protocols of the WRI and the WBCSD, 29
a reporting company’s scope 3 emissions from waste generated in operations are the scope 1 and 2 emissions of waste management companies. In this manner, double counting between waste companies and institutions is not taking place as emissions are reported in different scopes.
4.17 In the case of institutional-level reporting, a robust approach to estimate GHG emissions would be using the emissions per tonne of waste calculated on-site by waste management contractors according to the waste treatment methods they use, the waste compositional data they are treating, etc. However, discussions with waste management
27 Entreprises pour l’Environnement (EpE) (2010). Protocol for the quantification of greenhouse gas emissions from waste management activities, version 4, June 2010. Available at http://www.epe-asso.org/pdf_rapa/EpE_rapports_et_documents20.pdf 28 WRI/WBCSD (2004). The Greenhouse Gas Protocol: A Corporate Accounting and Reporting Standard (revised edition). The Greenhouse Gas Protocol Initiative, USA and Switzerland. Available at http://pdf.wri.org/ghg_protocol_2004.pdf 29 WRI/WBCSD (2004) cited above and WRI/WBCSD (2010). Corporate Value Chain (Scope 3) Accounting and Reporting Standard, Supplement to the GHG Protocol Corporate Accounting and Reporting Standard. Draft for Stakeholder Review – November 2010. The Greenhouse Gas Protocol Initiative, USA and Switzerland. Available at http://www.ghgprotocol.org/files/ghgp/public/ghg-protocol-scope-3-standard-draft-november-20101.pdf
20
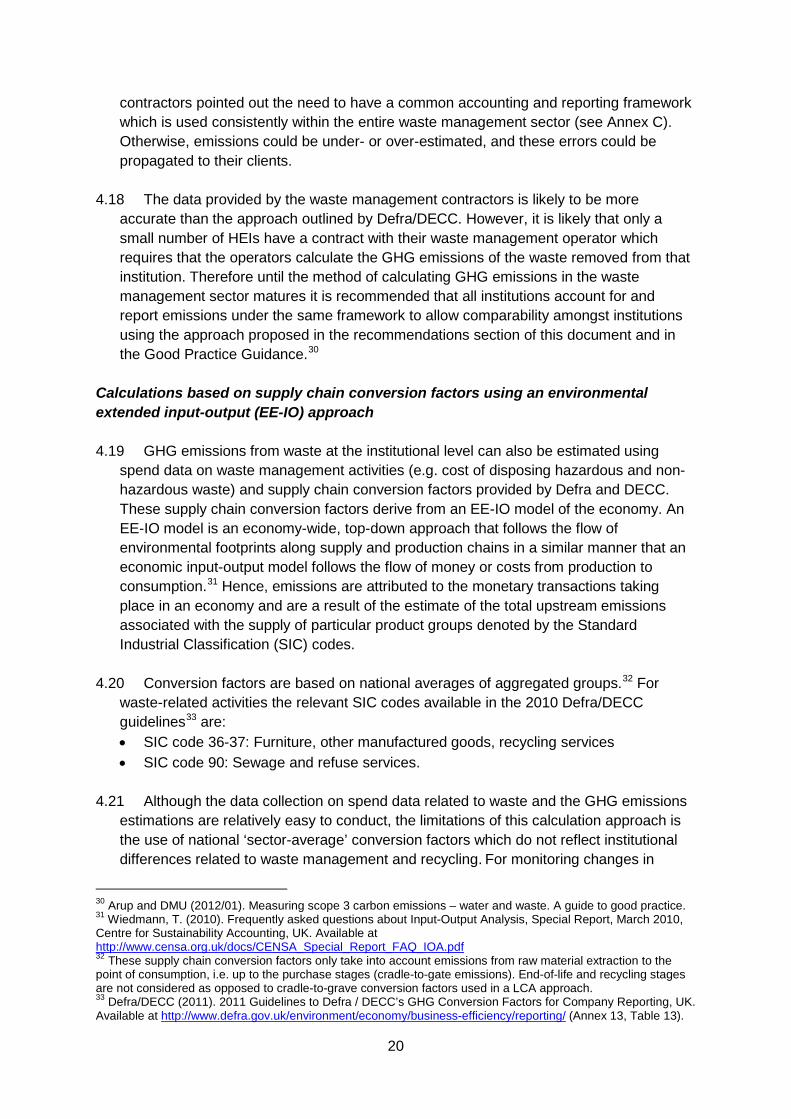
contractors pointed out the need to have a common accounting and reporting framework which is used consistently within the entire waste management sector (see Annex C). Otherwise, emissions could be under- or over-estimated, and these errors could be propagated to their clients.
4.18 The data provided by the waste management contractors is likely to be more
accurate than the approach outlined by Defra/DECC. However, it is likely that only a small number of HEIs have a contract with their waste management operator which requires that the operators calculate the GHG emissions of the waste removed from that institution. Therefore until the method of calculating GHG emissions in the waste management sector matures it is recommended that all institutions account for and report emissions under the same framework to allow comparability amongst institutions using the approach proposed in the recommendations section of this document and in the Good Practice Guidance.30
Calculations based on supply chain conversion factors using an environmental extended input-output (EE-IO) approach 4.19 GHG emissions from waste at the institutional level can also be estimated using
spend data on waste management activities (e.g. cost of disposing hazardous and non-hazardous waste) and supply chain conversion factors provided by Defra and DECC. These supply chain conversion factors derive from an EE-IO model of the economy. An EE-IO model is an economy-wide, top-down approach that follows the flow of environmental footprints along supply and production chains in a similar manner that an economic input-output model follows the flow of money or costs from production to consumption.31 Hence, emissions are attributed to the monetary transactions taking place in an economy and are a result of the estimate of the total upstream emissions associated with the supply of particular product groups denoted by the Standard Industrial Classification (SIC) codes.
4.20 Conversion factors are based on national averages of aggregated groups.32 For waste-related activities the relevant SIC codes available in the 2010 Defra/DECC guidelines33
• SIC code 36-37: Furniture, other manufactured goods, recycling services are:
• SIC code 90: Sewage and refuse services. 4.21 Although the data collection on spend data related to waste and the GHG emissions
estimations are relatively easy to conduct, the limitations of this calculation approach is the use of national ‘sector-average’ conversion factors which do not reflect institutional differences related to waste management and recycling.
30 Arup and DMU (2012/01). Measuring scope 3 carbon emissions – water and waste. A guide to good practice.
For monitoring changes in
31 Wiedmann, T. (2010). Frequently asked questions about Input-Output Analysis, Special Report, March 2010, Centre for Sustainability Accounting, UK. Available at http://www.censa.org.uk/docs/CENSA_Special_Report_FAQ_IOA.pdf 32 These supply chain conversion factors only take into account emissions from raw material extraction to the point of consumption, i.e. up to the purchase stages (cradle-to-gate emissions). End-of-life and recycling stages are not considered as opposed to cradle-to-grave conversion factors used in a LCA approach. 33 Defra/DECC (2011). 2011 Guidelines to Defra / DECC’s GHG Conversion Factors for Company Reporting, UK. Available at http://www.defra.gov.uk/environment/economy/business-efficiency/reporting/ (Annex 13, Table 13).
21
practices in the long term towards a more resource efficient waste management, a life cycle analysis of waste streams, as described in a previous section, is recommended.
4.22 To avoid double counting of waste-related emissions with procurement-related
emissions at the institutional level, emissions from waste, water and sewerage should be removed from the procurement-related emissions as suggested in section 4.4 of the supply chain emissions reporting framework34.
4.23 However, in terms of double counting embedded emissions in the life cycle stages of products that HEIs purchase and dispose of, some procurement-related emissions estimated through an EE-IO approach are double-counted within waste-related emissions category calculated through a LCA approach. To avoid this double-counting, it would be desirable to be able to separate emissions from material production and those from post-disposal waste management. However, due to the way that the Defra/DECC conversion factors are calculated, it is not appropriate to separate emissions as explained earlier. In addition, it is important to note that the waste component in the overall HEIs’ GHG emissions could be very small in magnitude (less than 2 per cent)35
therefore we consider that this overlap will not compromise significantly the accuracy of the overall GHG analysis.
4.24 Due to differences in the methodological approaches to calculating emissions, it is recommended to report emissions from each scope 3 category separately (i.e. waste, water, travel, procurement, etc.) and specify the methodologies used to calculate these emissions as suggested by the GHG Protocol related to scope 3 emissions36
.
4.25 In the future, procurement emissions and the material production of the waste-related emissions may be comparable if they are calculated using the same life cycle emission factors for the wide range of goods and services used in an institution as well as improvements of data collection in HEIs. However, based on current data sources publicly available, the selected methodologies are the best GHG estimation approaches for waste and procurement emissions available.
Current practices in data collection 4.26 This section presents an analysis of the current practices of data collection related to
waste in HEIs based on the statistics reported in the most recent EMS and responses to the online survey.
2008/09 EMS waste management statistics 34 ‘Measuring scope 3 carbon emissions – supply-chain (procurement). Report to HEFCE on an emissions reporting framework by Arup, CenSa and De Montfort University’ (2012/01). Available at www.hefce.ac.uk. 35 Based on assessments of two institutions that have estimated comprehensive scope 1-3 GHG emissions analyses: De Montfort University and University of Lancaster. Available at: http://dmu.ac.uk/Images/De%20Montfort%20University%20Carbon%20Management%20Plan%20BoG1_tcm6-71752.pdf and http://www.lancs.ac.uk/estates/environment/energy.htm. 36 ‘WRI/WBCSD (2010). Corporate Value Chain (Scope 3) Accounting and Reporting Standard, Supplement to the GHG Protocol Corporate Accounting and Reporting Standard. Draft for Stakeholder Review – November 2010. The Greenhouse Gas Protocol Initiative, USA and Switzerland’. Available at: http://www.ghgprotocol.org/files/ghgp/public/ghg-protocol-scope-3-standard-draft-november-20101.pdf.
22
4.27 Under the most recent EMS definitions (2008/09), the following statistics related to waste management are being reported for non-residential buildings (C13), residential buildings (C14) and the total estate (C1):
• D73 – Waste mass reports the annual mass of waste managed by the institutions in different waste disposal/treatment methods: recycling, incineration, energy recovery from waste and others. The category C15 requires information about waste mass in the mentioned disposal/treatment methods for construction, demolition and excavation waste in all works conducted in the institutions.
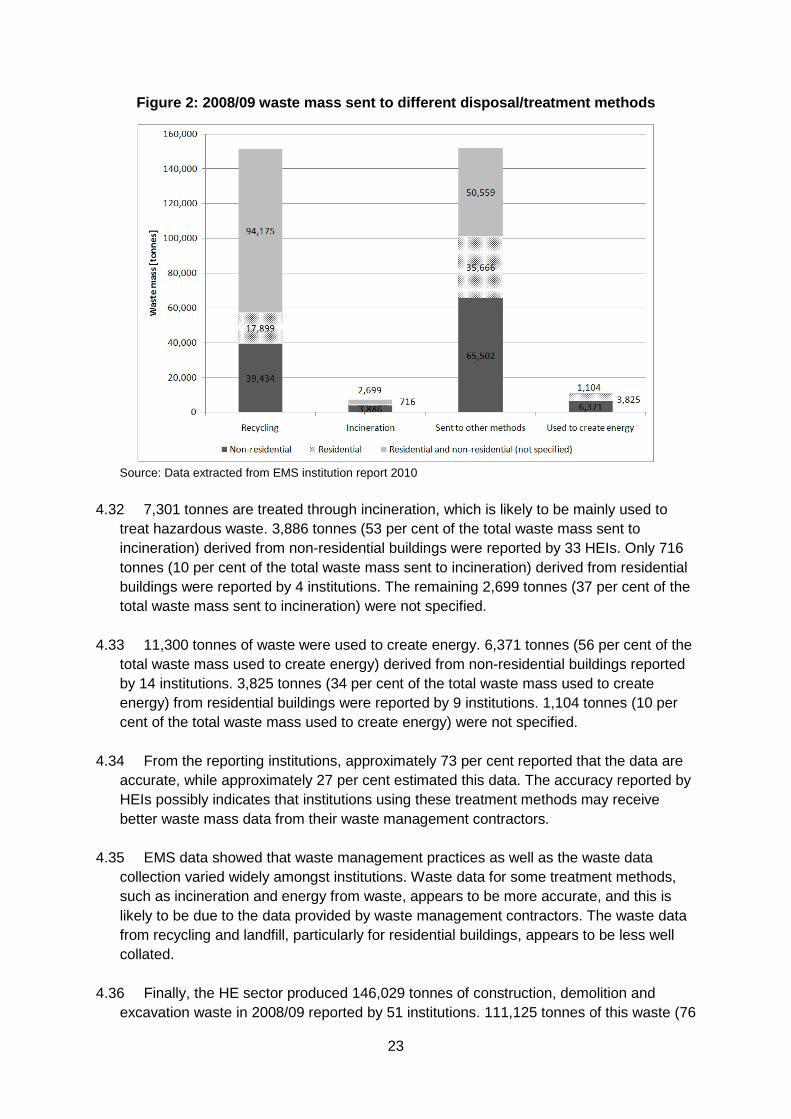
4.28 Based on the EMS waste mass data reported in 2008/09, Figure 2 shows that large
amounts of waste in the HE sector are recycled (47 per cent of the total waste mass reported) and sent to other methods such as landfill (also 47 per cent). In addition, to a lesser extent, HEI’s waste is sent to energy recovery facilities (4 per cent) and incinerators (2 per cent). Data collection of waste mass proved to be more challenging than for water, particularly for residential buildings.
4.29 From the 151,508 tonnes of waste that were sent for recycling, 39,434 tonnes (26 per
cent of the total waste mass sent for recycling) were associated to non-residential buildings and 17,899 tonnes (12 per cent) to residential buildings; however, 94,175 tonnes of the waste mass (62 per cent) was not specified and reported for the total estate. In terms of reporting institutions, 149 HEIs report for the total estate, 116 HEIs (73 per cent) for non-residential buildings and 75 HEIs (47 per cent) for residential buildings. In terms of accuracy, 52-54 per cent of the institutions reported that they classify their waste data in EMS is ‘accurate’, while 48 per cent reported their data was ‘estimated’.
4.30 From the 151,727 tonnes of waste that were sent to other methods, the majority is
sent to landfill with 65,502 tonnes (43 per cent of the total waste mass sent to other methods) derived from non-residential buildings, 35,666 tonnes (24 per cent) from residential buildings and 50,559 tonnes (33 per cent) was not specified. Several institutions sent their waste to landfill, 110 HEIs reported this data for non-residential buildings and 78 HEIs for residential buildings. Similar to recycling, 55 per cent of institutions reported this data was collated in an accurate manner, while 45 per cent estimated it.
4.31 Quantities of waste sent to other treatment methods are low compared to what is
recycled and sent to landfill.
23
Figure 2: 2008/09 waste mass sent to different disposal/treatment methods
Source: Data extracted from EMS institution report 2010
4.32 7,301 tonnes are treated through incineration, which is likely to be mainly used to
treat hazardous waste. 3,886 tonnes (53 per cent of the total waste mass sent to incineration) derived from non-residential buildings were reported by 33 HEIs. Only 716 tonnes (10 per cent of the total waste mass sent to incineration) derived from residential buildings were reported by 4 institutions. The remaining 2,699 tonnes (37 per cent of the total waste mass sent to incineration) were not specified.
4.33 11,300 tonnes of waste were used to create energy. 6,371 tonnes (56 per cent of the
total waste mass used to create energy) derived from non-residential buildings reported by 14 institutions. 3,825 tonnes (34 per cent of the total waste mass used to create energy) from residential buildings were reported by 9 institutions. 1,104 tonnes (10 per cent of the total waste mass used to create energy) were not specified.
4.34 From the reporting institutions, approximately 73 per cent reported that the data are
accurate, while approximately 27 per cent estimated this data. The accuracy reported by HEIs possibly indicates that institutions using these treatment methods may receive better waste mass data from their waste management contractors.
4.35 EMS data showed that waste management practices as well as the waste data
collection varied widely amongst institutions. Waste data for some treatment methods, such as incineration and energy from waste, appears to be more accurate, and this is likely to be due to the data provided by waste management contractors. The waste data from recycling and landfill, particularly for residential buildings, appears to be less well collated.
4.36 Finally, the HE sector produced 146,029 tonnes of construction, demolition and
excavation waste in 2008/09 reported by 51 institutions. 111,125 tonnes of this waste (76
24
per cent) was recycled, 33,585 tonnes (23 per cent) were sent to landfill, 1,226 tonnes (1 per cent) were incinerated and 93 tonnes (0.1 per cent) were sent to energy recovery facilities.
4.37 It is important to note that the construction, demolition and excavation waste was not
analysed further in the context of data collection and GHG emissions estimation due to a number of reasons. Firstly, waste management practices of this type of waste are mainly conducted by the construction contractors and not within direct institutional control. Secondly, the composition of waste arising from the construction, demolition and excavation activities is quite different to municipal waste, and compositional data at a national or sector level are scarce. Therefore developing compositional data for the HE sector would require researching a representative number of construction contractors that are willing to provide data. Finally, within the GHG emissions calculation approach selected for procurement emissions (based on the institutions’ spend data and supply chain conversion factors), emissions derived from construction waste are accounted for in the construction sub-category within the procurement emissions. In order to avoid double counting, spend on construction-related waste should be subtracted from spend-related to works. However, a detailed breakdown of spend for building demolition and construction waste treatment is not commonly available within institutions.
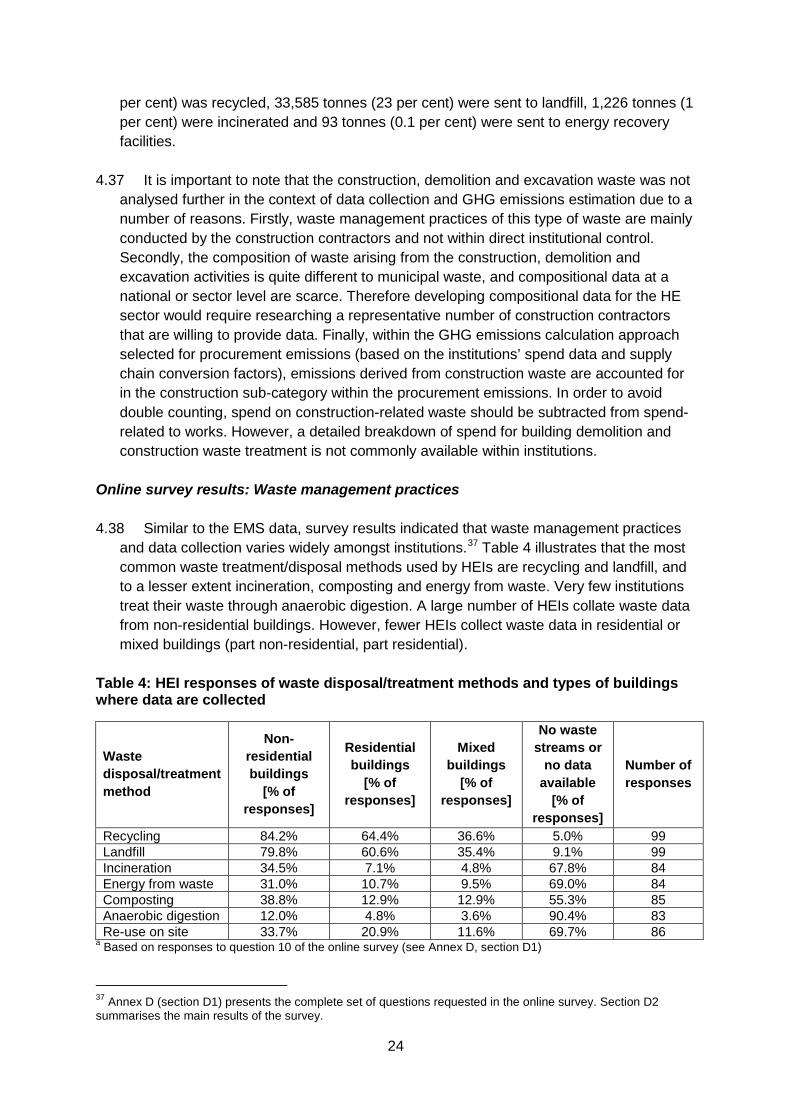
Online survey results: Waste management practices 4.38 Similar to the EMS data, survey results indicated that waste management practices
and data collection varies widely amongst institutions.37 Table 4 illustrates that the most common waste treatment/disposal methods used by HEIs are recycling and landfill, and to a lesser extent incineration, composting and energy from waste. Very few institutions treat their waste through anaerobic digestion. A large number of HEIs collate waste data from non-residential buildings. However, fewer HEIs collect waste data in residential or mixed buildings (part non-residential, part residential).
Table 4: HEI responses of waste disposal/treatment methods and types of buildings where data are collected
Waste disposal/treatment method
Non-residential buildings
[% of responses]
Residential buildings
[% of responses]
Mixed buildings
[% of responses]
No waste streams or
no data available
[% of responses]
Number of responses
Recycling 84.2% 64.4% 36.6% 5.0% 99 Landfill 79.8% 60.6% 35.4% 9.1% 99 Incineration 34.5% 7.1% 4.8% 67.8% 84 Energy from waste 31.0% 10.7% 9.5% 69.0% 84 Composting 38.8% 12.9% 12.9% 55.3% 85 Anaerobic digestion 12.0% 4.8% 3.6% 90.4% 83 Re-use on site 33.7% 20.9% 11.6% 69.7% 86
a
Based on responses to question 10 of the online survey (see Annex D, section D1)
37 Annex D (section D1) presents the complete set of questions requested in the online survey. Section D2 summarises the main results of the survey.
25
4.39 Waste data are mainly collated through waste management contractor invoices and transfer notes, estimations in both non-residential and residential buildings and, to a lesser extent, through annual waste audits or surveys. In the case of residential buildings, some institutions rely on data provided by local authorities (see Table D1 and Table D2 in Annex D). Nineteen HEIs responded that they use a pay-by-weight system to collect waste data.38
Some institutions also mentioned that their waste management contractors provide them detailed monthly reports on waste type and quantity for recycling, landfill, composting, energy from waste, and anaerobic digestion.
4.40 The main barriers highlighted by respondents were limited staff time (40 per cent for non-residential buildings and 35 per cent for residential buildings), lack of perceived benefits (20 per cent for non-residential buildings and 18 per cent for residential buildings) and lack of awareness (20 per cent for non-residential buildings and 12 per cent for residential buildings).39
For residential buildings, some institutions pointed out that there is a lack of willingness of local authorities to provide data, whether by weight or by volume.
4.41 In terms for improving waste data collection, institutions request:40
• A clear guidance on how to measure and monitor waste as well as an agreed methodology to calculate emissions associated with waste (21 respondents)
• A monitoring tool for collating waste data (19 respondents) • Information regarding the financial benefits of monitoring waste (11 respondents) • Information regarding the environmental benefits of monitoring waste (10
respondents) • Support from other HEIs who are monitoring their waste (8 respondents) • Cooperation of local authorities to provide data for residential buildings (2
respondents). Online survey results: Waste mass and compositional data 4.42 Institutions were asked to provide waste mass quantities of different material
streams’ categories that are sent to different waste treatment or disposal methods, i.e. waste mass and compositional data.41 Only 19 institutions provided waste mass data through the online survey or provided raw data directly; however, fewer than this provided ‘true waste compositional data’42
Table D3
for the different treatment methods. In addition to the data provided in the online survey, eight institutions provided further information on their waste management practices including compositional data (see in Annex D, section D2).43
38 Based on responses to questions 11, 12 and 13 (see Annex D, section D1), where respondents added further comments. This figure also includes HEIs that responded follow up emails and telephone interviews.
This suggests that for most HEIs such granular data are currently difficult to produce, but that it is possible to do so.
39 Based on responses to questions 5 and 6 (see Annex D, section D1). 40 Based on responses to question 8 (see Annex D, section D1). 41 Questions 15 to 34 (see Annex D, section D1). 42 Waste composition refers to the material streams within a quantity of waste that are identified and categorised. True waste compositional data should include not only the waste diverted to recycling, composting or other treatment methods, but also residual waste. 43 Liverpool Hope University, London School of Economics, University of Birmingham, University of Derby, University of Leicester, University of Newcastle, University of Sunderland and University of Winchester.
26
4.43 Survey results show the large variations in waste mass and compositional data for
recycling (Table D4 in Annex D), landfill (Table D5 in Annex D) and composting (Table D6 in Annex D) in non-residential and residential buildings reported by HEIs. Due to the large variations and inconsistencies of waste compositional data, it was realised that representative averages of waste compositional data per treatment method for the HE sector could not be estimated. Therefore, national datasets from reliable sources that are representative of the sector and the type of buildings are recommended.
4.44 In order to understand better the waste composition of the HE sector through the
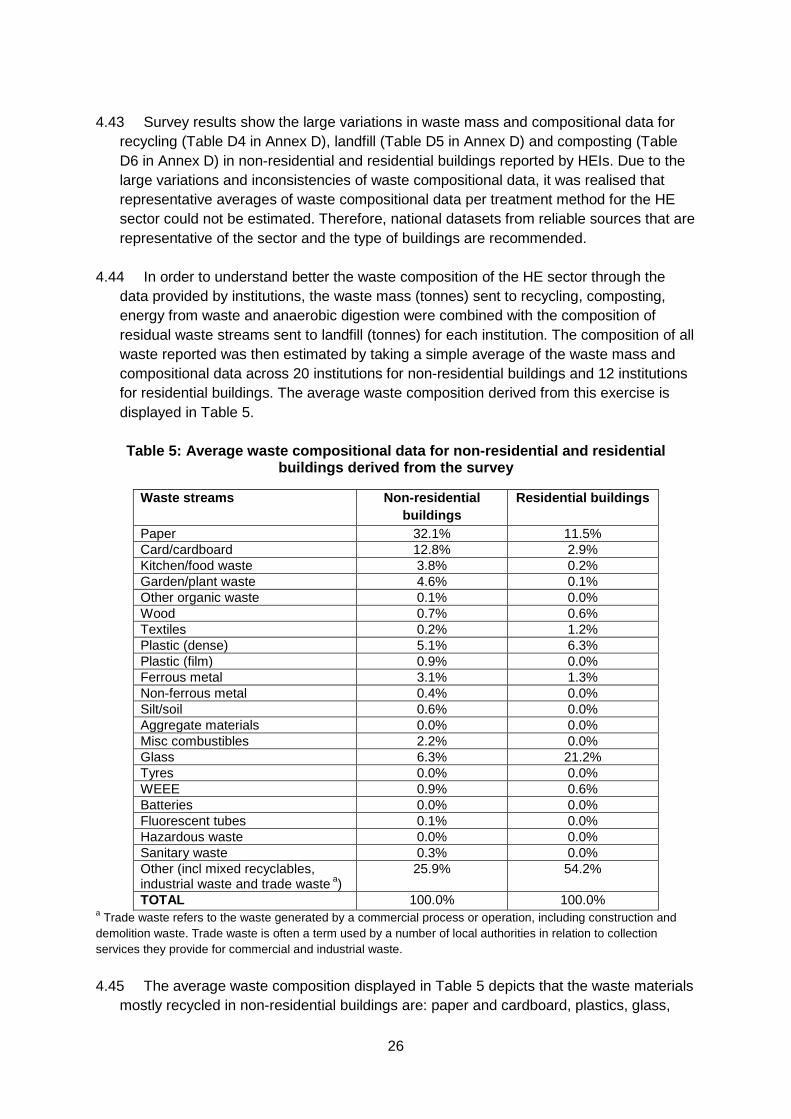
data provided by institutions, the waste mass (tonnes) sent to recycling, composting, energy from waste and anaerobic digestion were combined with the composition of residual waste streams sent to landfill (tonnes) for each institution. The composition of all waste reported was then estimated by taking a simple average of the waste mass and compositional data across 20 institutions for non-residential buildings and 12 institutions for residential buildings. The average waste composition derived from this exercise is displayed in Table 5.
Table 5: Average waste compositional data for non-residential and residential
buildings derived from the survey
Waste streams Non-residential buildings
Residential buildings
Paper 32.1% 11.5% Card/cardboard 12.8% 2.9% Kitchen/food waste 3.8% 0.2% Garden/plant waste 4.6% 0.1% Other organic waste 0.1% 0.0% Wood 0.7% 0.6% Textiles 0.2% 1.2% Plastic (dense) 5.1% 6.3% Plastic (film) 0.9% 0.0% Ferrous metal 3.1% 1.3% Non-ferrous metal 0.4% 0.0% Silt/soil 0.6% 0.0% Aggregate materials 0.0% 0.0% Misc combustibles 2.2% 0.0% Glass 6.3% 21.2% Tyres 0.0% 0.0% WEEE 0.9% 0.6% Batteries 0.0% 0.0% Fluorescent tubes 0.1% 0.0% Hazardous waste 0.0% 0.0% Sanitary waste 0.3% 0.0% Other (incl mixed recyclables, industrial waste and trade waste a
25.9% )
54.2%
TOTAL 100.0% 100.0% a
Trade waste refers to the waste generated by a commercial process or operation, including construction and demolition waste. Trade waste is often a term used by a number of local authorities in relation to collection services they provide for commercial and industrial waste.
4.45 The average waste composition displayed in Table 5 depicts that the waste materials mostly recycled in non-residential buildings are: paper and cardboard, plastics, glass,
27
metals and organic waste (food and garden waste). However, a large amount of waste (25.9 per cent) is sent to recycling as ‘mixed recyclables’44
or general waste sent to landfill for which residual waste composition estimates were not available. Due to the lack of residual waste composition data, these data cannot be used as a representative average for the HE sector.
4.46 In the case of residential buildings, the waste materials mostly recycled are: glass, paper and cardboard and plastics. The percentage of waste sent to recycling as ‘mixed recyclables’ or general waste sent to landfill is higher (54.2 per cent) than in non-residential buildings. This indicates that not only does waste data collection need to be improved in residential buildings, but also a wider deployment of recycling schemes (in collaboration with local authorities) is needed. It is likely that the generation of food waste is higher in residential buildings; however, its capture rate for treatment appears to be low.
Relationship with waste management contractors 4.47 Waste from non-residential buildings is usually collected by contracted private sector
waste management companies, while waste from students’ residences are, on the whole, collected by local authorities or their sub-contractors. Further information about waste management practices and data collection was provided through telephone interviews, follow-up emails and through the webinars. Participating HEIs mentioned their comprehensive and sustainable waste management systems in their institutions as well as their relationship with waste management contractors. Some of the institutions collect detailed waste data for specific waste streams (such as polystyrene) or use highly specialised waste treatment methods (such as autoclave)45. Furthermore, some of these institutions have a ‘zero waste to landfill’ policy being gradually achieved through the waste management practices not only within their institutions, but also within the activities conducted by their waste contractors. This dialogue pointed out best practices in the HE sector; some of these practices are illustrated through case studies in the Good Practice Guidance document.46
4.48 Institutions that have a good relationship with their waste management contractors appear to have good waste management practices in place and reliable waste data. A number of waste management contractors provide the particular recovery rates for materials as they undertake annual 'test runs' through their MRF, when only the waste from the HEIs passes through the facility. One institution also conducts three annual internal waste audits to monitor its contractor’s data and check for consistency.
4.49 Some institutions mentioned that they have experienced problems with getting data
from their waste management contractors. These institutions expressed that within the
44 Several HEIs reported that recyclables are collected in a general manner referred to as ‘commingled’, ‘mixed recyclables’ or ‘dry mixed recycling’ and sent to MRFs. 45 Autoclaving involves the high-pressure sterilisation of waste by steam to destroy any bacteria in the waste. This process is widely used to treat clinical waste, but is now also starting to be used as a treatment for municipal waste. Autoclaving of municipal waste is a form of ‘mechanical heat treatment’, a process that uses thermal treatment in conjunction with mechanical processing. 46 ‘Measuring scope 3 carbon emissions – water and waste. A guide to good practice (2012/01)’
28
renewal of the contract, they will investigate opportunities to source a waste management contractor who can provide waste data.
4.50 One institution also recommended that requirements for construction waste data
reporting (even for small works) are established within the construction contractors’ contract.
5. Conclusions 5.1 Based on the research undertaken the following conclusions can be drawn from the
analysis:
5.2 Stakeholder engagement: there has been an extensive stakeholder engagement programme that has helped inform a robust approach to the proposed waste and water-related GHG emissions definitions in the EMS.
5.3 Water and wastewater data: HEIs reported they had good quality data, which appears adequate for the calculation and reporting of associated GHG emissions.
5.4 Water and wastewater GHG emissions: based on the consultation process, a single methodology can be adopted based on converting volumetric data (m3
) to GHG emissions using the Defra/DECC life-cycle analysis factors.
5.5 Waste data: HEIs reported a wide variety of existing data, both in terms of coverage and robustness of data. Changes to waste reporting definitions will need to reflect this diversity.
5.6 Revised EMS waste definitions: Some revisions to the existing waste EMS category
D73 are appropriate, in order to ‘refresh’ the core waste categories which are most relevant for HEIs. However, requiring ‘true waste compositional data’ in the EMS definitions would be difficult and burdensome not only for the EMS system (because it would add many rows in each of the waste disposal methods) but also for the HEIs. The stakeholder engagement process illustrated that few HEIs would be able to provide this data (only around 20 HEIs out of 99 responses provided these data in the online survey).
5.7 Water and wastewater GHG emissions: A tailored approach for the calculation and reporting of GHG emissions related to waste is therefore appropriate, and the definitions in the next section reflect this need.
6. Proposed EMS definitions 6.1 The following clauses propose changes to the EMS definitions. These proposals are
under review by the HESA EMS Review Group. A period of consultation with the HE sector regarding the proposed changes to EMS is expected to take place in early 2012.
29
6.2 Based on the existing water-related EMS definitions, the quality of data reporting and the results of the online survey, we recommend adding two new EMS definitions related to the GHG emissions of water supply and wastewater treatment to monitor this scope 3 emissions category. These definitions are explained in more detail in section 2 (Table 3) of the Good Practice Guidance report.47
New EMS definition: Water supply GHG emissions 6.3 For estimating the GHG emissions, the water consumption figures returned under the
EMS definition D38b should be multiplied by the life cycle conversion factor (CF) for water supply provided by Defra and DECC illustrated in Table 1. It is recommended to report these emissions in kilograms of carbon dioxide equivalents (kgCO2
e) to be consistent with the reporting of energy-related emissions under the EMS definition D38c.
GHG water supply [kg CO2e] = water supply volume [m3] * CFwater supply [kg CO2e/m3
]
6.4 If data are available for the non-residential (C13) and residential estate (C14), it is recommended to estimate the GHG emissions from water consumption separately and add the emissions for the total estate (C1).
New EMS definition: Wastewater treatment GHG emissions 6.5 The GHG emissions associated with the treatment of wastewater are estimated by
multiplying the wastewater volume by the conversion factor related to wastewater treatment shown in Table 1.
GHG wastewater [kg CO2e] = Total wastewater volume [m3] * CF wastewater [kg CO2e/m3
]
To provide a figure for wastewater volume, we recommend that institutions use the following data sources: • Meter readings from all meters on site related to wastewater volume and trade
effluent (if available) • If the water utility contracted by the institution provides a factor to calculate the
wastewater volume based on the water supply volume, use the factor provided by the water utility. Otherwise, water consumption figures returned under D38b can be multiplied by 95 per cent (as a default value).
6.6 The figure for wastewater volume should be added to values reported in D77a Water
supply greywater and rainwater and D77b Water supply borehole extraction. Taking into account these additional flows include all wastewater flows that go to treatment.
Total wastewater volume = wastewater from water consumption + greywater volume +
rainwater volume + borehole extraction water volume
47 ‘Arup and DMU (2012/01). Measuring scope 3 carbon emissions – water and waste. A guide to good practice’
30
6.7 Water supply data from the EMS definitions D77a and D77b may refer to the total estate (C1) and the assumptions on how much water is used in the non-residential and residential estate may be inaccurate. Therefore, we recommend estimating GHG emissions derived from wastewater for the entire estate (C1).
Proposed changes to existing waste EMS definition D73 6.8 Based on our research and feedback from institutions, it is proposed that the EMS
definitions related to waste (D73) would be refined slightly. Waste treatment/disposal methods that are relevant to the HEIs such as composting, anaerobic digestion, energy from waste (EfW) and landfill are supplemented by ‘other alternative methods’ which encompass new treatment methods that are increasingly being used by HEIs, such as offsite autoclave48
• Incineration, as the use of this treatment method is declining in the UK
and mechanical biological treatment. In this sense, it is proposed to delete the following waste disposal categories in the EMS definition D73:
• Other, as this one category comprises landfill, composting and any other treatment methods which are more relevant for HEIs. This category can therefore be split into new categories as outlined below to record the major waste stream data from HEIs more accurately
6.9 It is also proposed to add the following categories and definitions in D73:
• Composting: the annual mass of organic waste materials, in tonnes, sent for composting.
• Anaerobic digestion: the annual mass of organic waste materials, in tonnes, sent to anaerobic digesters (biological treatment, in the absence of oxygen, of organic waste to generate energy and a soil improver).
• Landfill: the annual mass of waste (in tonnes) disposed in landfills. • Other methods: the mass of waste treated through alternative methods, such as
offsite autoclave, Mixed Biological Treatment, etc.
Proposed new EMS definition related to hazardous waste 6.10 We propose adding a new EMS definition related to the reporting of waste mass of
hazardous and clinical/sanitary waste. Details of this definition are presented in Table 6.
Table 6: Proposed new EMS definition related to hazardous waste
New EMS definitions name
New EMS Definition details:
Hazardous waste (tonnes) The approximate annual mass (tonnes) of hazardous waste managed by the institution. Hazardous waste is defined as the types of waste that are harmful to human health, or to the environment, either immediately or over an extended period of time. Hazardous wastes are identified in the European Waste Catalogue, a list of waste descriptions established by the
48 Offsite autoclave refers to the waste management contractor's autoclave facilities for the treatment of municipal waste. GHG emissions from offsite autoclaves should be accounted under scope 3 emissions. Energy- or process- related GHG emissions from onsite autoclaves to treat clinical or hazardous waste in the institutions should be accounted in scopes 1 and 2 according to the energy source used in the onsite autoclaves.
31
New EMS definitions name
New EMS Definition details:
European Commission. Hazardous waste includes:
• Asbestos • Chemicals • Electrical and electronic equipment • Fluorescent light tubes and energy-saving light bulbs • Healthcare/clinical • Lead acid batteries • Oils • Pesticides • Refrigerators containing ozone-depleting substances • Solvents
Detailed technical guidance on assessing and classifying hazardous waste has been developed by the Environment Agency.49
Hazardous waste needs to be tracked and inventoried throughout the institution to meet regulatory requirements; therefore monitoring and reporting of the annual hazardous waste mass ought to be relatively straightforward.
Although residential buildings will produce waste of a hazardous nature, this type of waste produced by households is not classified as hazardous waste under the Hazardous Waste Regulations 2005. Therefore, it is not necessary for HEIs to collate hazardous waste data from residential properties where it is collected by a local authority. Where HEIs do collate and monitor hazardous waste data from residential buildings this would represent best practice.
Proposed new EMS definition related to GHG emissions from waste 6.11 The scope of data collection amongst HEIs in relation to waste and recycling data as
well as the composition of waste were varied and wide. Institutions and suppliers of waste management services have varying levels of data in relation to waste, waste composition, waste volumes and recyclables composition. As a result of this diversity in quantity and quality of waste data, it was considered that the best option would be to add a new EMS definition related to the GHG emissions from waste through a tiered approach, explained in detail on the Good Practice Guidance document (section 3, sub-section ‘Measuring GHG emissions associated with waste’). The selected calculation approach is based on the Defra/DECC guidelines (previously explained) as it was considered that this methodology would allow the monitoring of changes in practice within the HE sector towards resource efficiency. The proposed tiered approach would allow institutions with very limited waste data to estimate their emissions with a basic level of information, while institutions with good quality waste compositional data would benefit from having a more accurate estimation of their GHG emissions associated with waste. Ideally, HEIs with limited waste data would be encouraged to collect better and good quality data to calculate their emissions in a more accurate manner.
49 Environment Agency (2011). Hazardous waste: Interpretation of the definition and classification of hazardous waste. Available at http://publications.environment-agency.gov.uk/PDF/GEHO0411BTRD-E-E.pdf.
32
6.12 It is important to highlight that the proposed tiered approach and selected
methodology to estimate GHG emissions from waste was pilot tested through the webinars. When possible, feedback and comments from HEIs were incorporated. After this consultation with HEIs, it was considered that the proposed approach was validated and accepted by institutions participating in the webinars.
6.13 During the pilot test and writing up stage, discussions with Defra and WRAP
regarding the GHG conversion factors were conducted. The dialogue with these organisations pointed out that the life cycle conversion factors for waste were under review. The updated guidance was recently released in July 2011. As a result of these changes, some conversion factors were amended and a wider variety of materials were included (35 waste fractions) (as shown in Table 3).
No additional treatments such as autoclave or mechanical biological treatment were included in this revision, nor additional conversion factors for hazardous waste or clinic/sanitary waste. However, the options for these types of waste may be added when the waste GHG emissions factors are updated in future iterations.
6.14 It is recommended to use the 2011 Defra/DECC GHG conversion factors. Guidance
of the typical waste materials generated by HEIs under the waste fractions illustrated in Table 3 is provided in Annex A of the Good Practice Guidance.50
6.15 According to the quantity and quality of waste data,51
• Basic approach: this is to be used where waste data are very limited taking into account waste from both residential and non-residential properties. Due to the lack of waste compositional data, generic municipal waste data are applied.
the proposed tiered approach for calculating GHG emissions from waste is as follows:
• Medium approach: this is to be used where waste and recycling data are available for non-residential and/or residential buildings. In this case, national average waste compositional data are used for residual and general waste data. Wastewatch’s further and higher education institutions waste compositional estimates52 are used for non-residential buildings, while Defra’s municipal waste compositional estimates53
• Detailed approach: this is to be used where good quality waste in-house data are available.
are used for residential buildings.
6.16 The steps to estimate GHG emissions related to waste through the different tiered
approaches are listed and explained in detail in section 3 of the Good Practice Guidance document.54
50 Arup and DMU (2012/01). Measuring scope 3 carbon emissions – water and waste. A guide to good practice.
. The reader should refer to this document in parallel to the clauses below. The following paragraphs focus on explaining the rationale behind the proposals for each
51 Waste data for non-residential and residential buildings, used in the GHG emissions estimations, should be based on the actual figures provided by the waste management contractors according to the length of the contract (for example, 35-42 weeks contract, 50-52 weeks contract). Data should not be extrapolated or averaged out over a year to provide annual figures. 52 Wastewatch (2005). Resource management in the education sector, key findings from a study. 53 Defra (2008). Municipal Waste Composition: A Review of Municipal Waste Component Analyses. Defra, UK. 54 Arup and DMU (2012/01). Measuring scope 3 carbon emissions – water and waste. A guide to good practice.
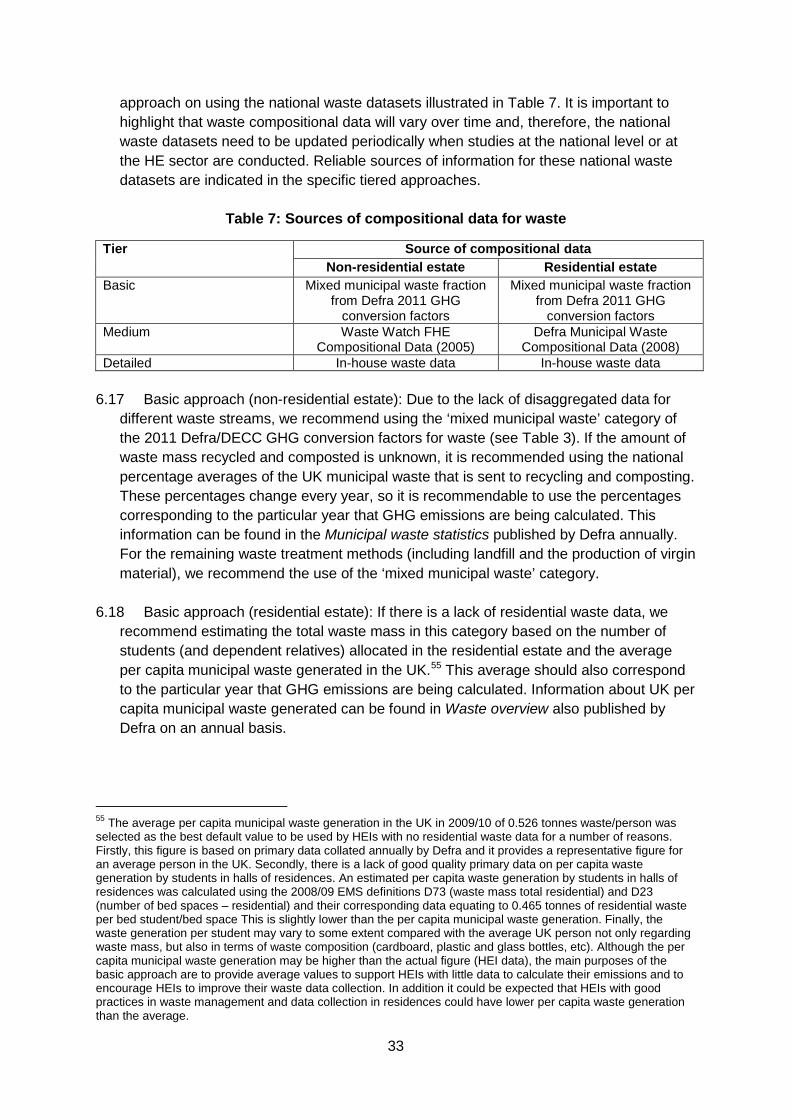
33
approach on using the national waste datasets illustrated in Table 7. It is important to highlight that waste compositional data will vary over time and, therefore, the national waste datasets need to be updated periodically when studies at the national level or at the HE sector are conducted. Reliable sources of information for these national waste datasets are indicated in the specific tiered approaches.
Table 7: Sources of compositional data for waste
Tier Source of compositional data Non-residential estate Residential estate
Basic Mixed municipal waste fraction from Defra 2011 GHG
conversion factors
Mixed municipal waste fraction from Defra 2011 GHG
conversion factors Medium Waste Watch FHE
Compositional Data (2005) Defra Municipal Waste
Compositional Data (2008) Detailed In-house waste data In-house waste data
6.17 Basic approach (non-residential estate): Due to the lack of disaggregated data for
different waste streams, we recommend using the ‘mixed municipal waste’ category of the 2011 Defra/DECC GHG conversion factors for waste (see Table 3). If the amount of waste mass recycled and composted is unknown, it is recommended using the national percentage averages of the UK municipal waste that is sent to recycling and composting. These percentages change every year, so it is recommendable to use the percentages corresponding to the particular year that GHG emissions are being calculated. This information can be found in the Municipal waste statistics published by Defra annually. For the remaining waste treatment methods (including landfill and the production of virgin material), we recommend the use of the ‘mixed municipal waste’ category.
6.18 Basic approach (residential estate): If there is a lack of residential waste data, we recommend estimating the total waste mass in this category based on the number of students (and dependent relatives) allocated in the residential estate and the average per capita municipal waste generated in the UK.55
This average should also correspond to the particular year that GHG emissions are being calculated. Information about UK per capita municipal waste generated can be found in Waste overview also published by Defra on an annual basis.
55 The average per capita municipal waste generation in the UK in 2009/10 of 0.526 tonnes waste/person was selected as the best default value to be used by HEIs with no residential waste data for a number of reasons. Firstly, this figure is based on primary data collated annually by Defra and it provides a representative figure for an average person in the UK. Secondly, there is a lack of good quality primary data on per capita waste generation by students in halls of residences. An estimated per capita waste generation by students in halls of residences was calculated using the 2008/09 EMS definitions D73 (waste mass total residential) and D23 (number of bed spaces – residential) and their corresponding data equating to 0.465 tonnes of residential waste per bed student/bed space This is slightly lower than the per capita municipal waste generation. Finally, the waste generation per student may vary to some extent compared with the average UK person not only regarding waste mass, but also in terms of waste composition (cardboard, plastic and glass bottles, etc). Although the per capita municipal waste generation may be higher than the actual figure (HEI data), the main purposes of the basic approach are to provide average values to support HEIs with little data to calculate their emissions and to encourage HEIs to improve their waste data collection. In addition it could be expected that HEIs with good practices in waste management and data collection in residences could have lower per capita waste generation than the average.
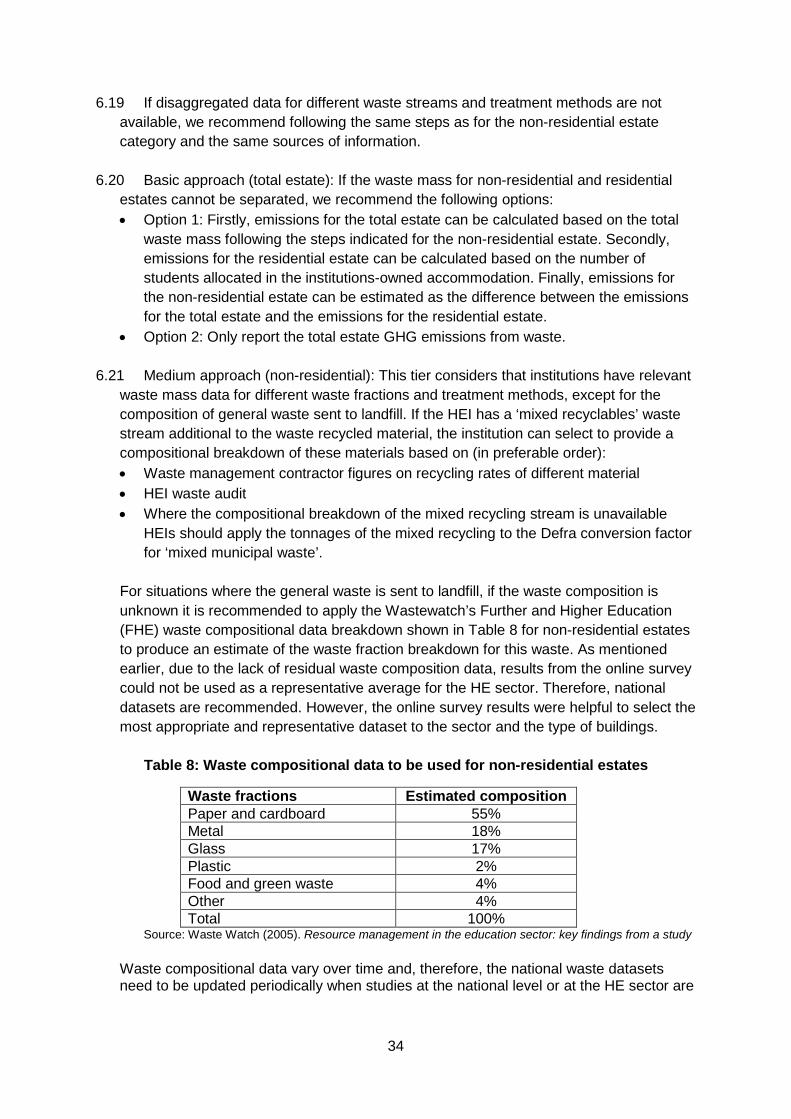
34
6.19 If disaggregated data for different waste streams and treatment methods are not available, we recommend following the same steps as for the non-residential estate category and the same sources of information.
6.20 Basic approach (total estate): If the waste mass for non-residential and residential
estates cannot be separated, we recommend the following options: • Option 1: Firstly, emissions for the total estate can be calculated based on the total
waste mass following the steps indicated for the non-residential estate. Secondly, emissions for the residential estate can be calculated based on the number of students allocated in the institutions-owned accommodation. Finally, emissions for the non-residential estate can be estimated as the difference between the emissions for the total estate and the emissions for the residential estate.
• Option 2: Only report the total estate GHG emissions from waste. 6.21 Medium approach (non-residential): This tier considers that institutions have relevant
waste mass data for different waste fractions and treatment methods, except for the composition of general waste sent to landfill. If the HEI has a ‘mixed recyclables’ waste stream additional to the waste recycled material, the institution can select to provide a compositional breakdown of these materials based on (in preferable order): • Waste management contractor figures on recycling rates of different material • HEI waste audit • Where the compositional breakdown of the mixed recycling stream is unavailable
HEIs should apply the tonnages of the mixed recycling to the Defra conversion factor for ‘mixed municipal waste’.
For situations where the general waste is sent to landfill, if the waste composition is unknown it is recommended to apply the Wastewatch’s Further and Higher Education (FHE) waste compositional data breakdown shown in Table 8 for non-residential estates to produce an estimate of the waste fraction breakdown for this waste. As mentioned earlier, due to the lack of residual waste composition data, results from the online survey could not be used as a representative average for the HE sector. Therefore, national datasets are recommended. However, the online survey results were helpful to select the most appropriate and representative dataset to the sector and the type of buildings.
Table 8: Waste compositional data to be used for non-residential estates
Waste fractions Estimated composition Paper and cardboard 55% Metal 18% Glass 17% Plastic 2% Food and green waste 4% Other 4% Total 100%
Source: Waste Watch (2005). Resource management in the education sector: key findings from a study
Waste compositional data vary over time and, therefore, the national waste datasets need to be updated periodically when studies at the national level or at the HE sector are
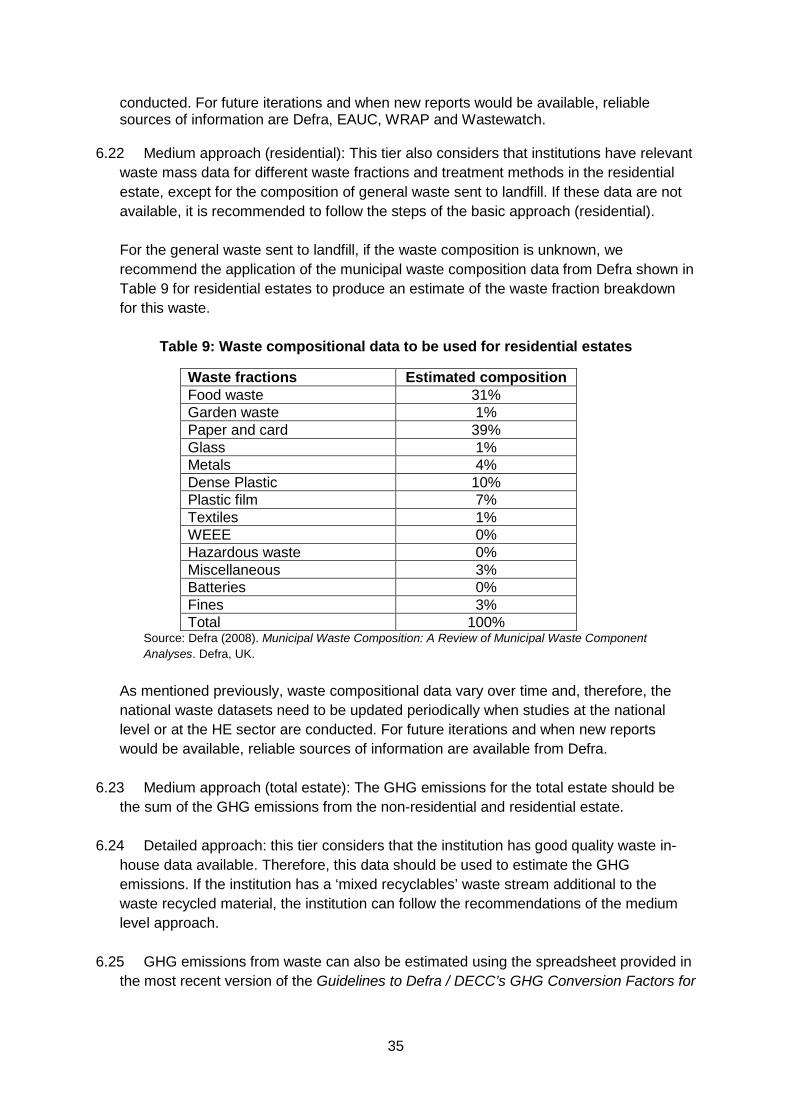
35
conducted. For future iterations and when new reports would be available, reliable sources of information are Defra, EAUC, WRAP and Wastewatch.
6.22 Medium approach (residential): This tier also considers that institutions have relevant
waste mass data for different waste fractions and treatment methods in the residential estate, except for the composition of general waste sent to landfill. If these data are not available, it is recommended to follow the steps of the basic approach (residential). For the general waste sent to landfill, if the waste composition is unknown, we recommend the application of the municipal waste composition data from Defra shown in Table 9 for residential estates to produce an estimate of the waste fraction breakdown for this waste.
Table 9: Waste compositional data to be used for residential estates
Waste fractions Estimated composition Food waste 31% Garden waste 1% Paper and card 39% Glass 1% Metals 4% Dense Plastic 10% Plastic film 7% Textiles 1% WEEE 0% Hazardous waste 0% Miscellaneous 3% Batteries 0% Fines 3% Total 100%
Source: Defra (2008). Municipal Waste Composition: A Review of Municipal Waste Component Analyses. Defra, UK.
As mentioned previously, waste compositional data vary over time and, therefore, the national waste datasets need to be updated periodically when studies at the national level or at the HE sector are conducted. For future iterations and when new reports would be available, reliable sources of information are available from Defra.
6.23 Medium approach (total estate): The GHG emissions for the total estate should be
the sum of the GHG emissions from the non-residential and residential estate. 6.24 Detailed approach: this tier considers that the institution has good quality waste in-
house data available. Therefore, this data should be used to estimate the GHG emissions. If the institution has a ‘mixed recyclables’ waste stream additional to the waste recycled material, the institution can follow the recommendations of the medium level approach.
6.25 GHG emissions from waste can also be estimated using the spreadsheet provided in
the most recent version of the Guidelines to Defra / DECC’s GHG Conversion Factors for
36
Company Reporting’.56
Quantities of waste mass needs to be broken down into the relevant waste fraction mass. Where data are available for the different treatment and disposal routes for each of the waste fractions these can be entered into the relevant column e.g. recycling, composting, energy from waste and landfill. The spreadsheet then calculates the GHG emissions for that waste fraction for the particular treatment and disposal route selected. Institutions should use the Defra/DECC spreadsheet to estimate their emissions related to waste. The spreadsheet should be used in conjunction with the step-by-step guidance described for the tiered approaches to facilitate the emissions calculations in the spreadsheet.
6.26 Alternatively, a central reporting tool could be developed for collecting the raw waste mass data which could be uploaded in support of the GHG calculation value submitted to EMS.
7. Recommendations 7.1 Our main recommendation is that our proposals in the section above for revised and new
definitions in the EMS data system are duly considered and adopted by HESA. Other recommendations based on findings which have emerged during our analysis are set out below.
7.2 Survey results showed that adding a new building type category ‘mixed buildings’ was
too burdensome. There is lack of accurate data for this type of building and, if added, it would not be consistent to the rest of the EMS definitions that request information on non-residential and residential estates. Where HEIs have these types of buildings and would like to gather water and waste data and their associated GHG emissions, perhaps HESA may recommend to HEIs to provide this data based on proportional floor area for non-residential and residential use.
7.3 Although compositional data are not required within the proposed EMS definitions for
waste in the Good Practice Guidance and in this document, institutions are encouraged to collect this data for calculating their GHG emissions related to waste in a more accurate manner.
7.4 There is a forthcoming HESA review of the EMS system next year, and this will consider
revisions to the waste compositional data that is collected in EMS. If a more detailed set of waste streams is considered appropriate then we recommend that the waste fractions are aligned to those included in the 2011 Defra/DECC GHG conversion factors related to waste (Annex 9, Table 9d).
7.5 However, instead of including all 35 waste fractions for all the waste treatment methods,
it is recommended to incorporate those that are relevant for the particular waste treatment methods that HEI could collate in a relatively easy manner and where
56 Defra/DECC (2011). 2011 Guidelines to Defra/DECC’s GHG Conversion Factors for Company Reporting, AEA, Defra, DECC, UK. Available at http://www.defra.gov.uk/environment/economy/business-efficiency/reporting/ (Annex 9, Table 9d).
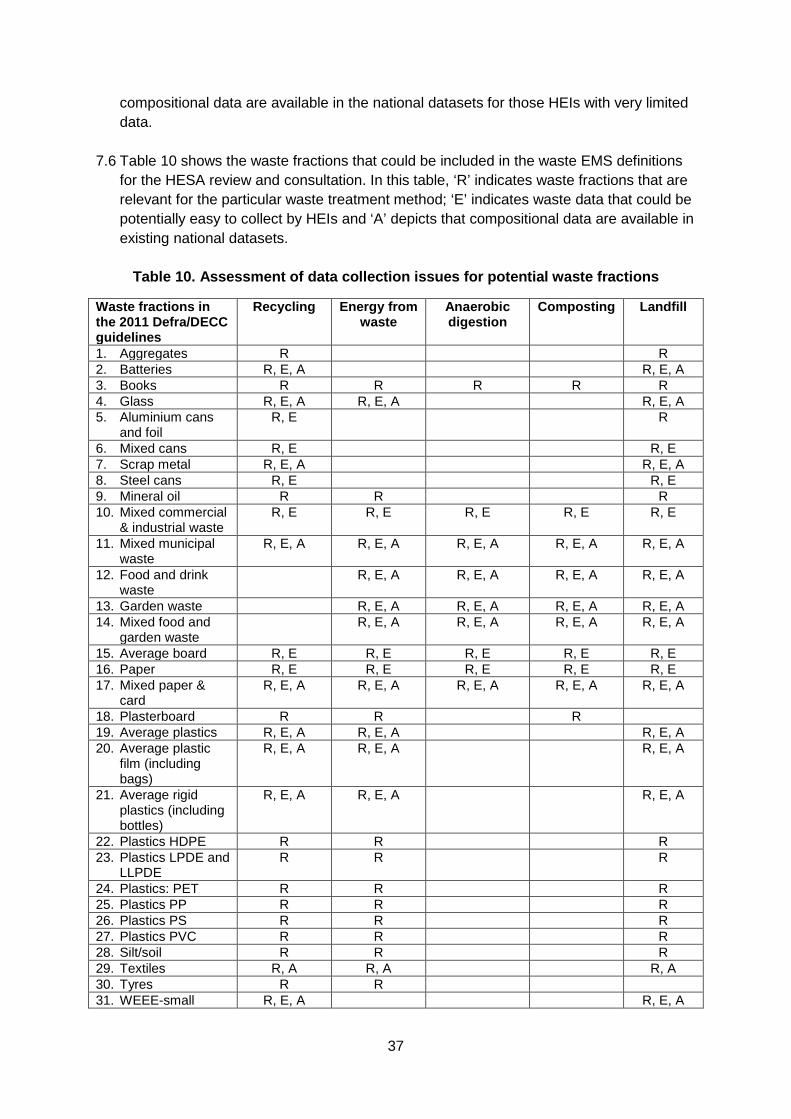
37
compositional data are available in the national datasets for those HEIs with very limited data.
7.6 Table 10 shows the waste fractions that could be included in the waste EMS definitions
for the HESA review and consultation. In this table, ‘R’ indicates waste fractions that are relevant for the particular waste treatment method; ‘E’ indicates waste data that could be potentially easy to collect by HEIs and ‘A’ depicts that compositional data are available in existing national datasets.
Table 10. Assessment of data collection issues for potential waste fractions
Waste fractions in the 2011 Defra/DECC guidelines
Recycling Energy from waste
Anaerobic digestion
Composting Landfill
1. Aggregates R R 2. Batteries R, E, A R, E, A 3. Books R R R R R 4. Glass R, E, A R, E, A R, E, A 5. Aluminium cans
and foil R, E R
6. Mixed cans R, E R, E 7. Scrap metal R, E, A R, E, A 8. Steel cans R, E R, E 9. Mineral oil R R R 10. Mixed commercial
& industrial waste R, E R, E R, E R, E R, E
11. Mixed municipal waste
R, E, A R, E, A R, E, A R, E, A R, E, A
12. Food and drink waste
R, E, A R, E, A R, E, A R, E, A
13. Garden waste R, E, A R, E, A R, E, A R, E, A 14. Mixed food and
garden waste R, E, A R, E, A R, E, A R, E, A
15. Average board R, E R, E R, E R, E R, E 16. Paper R, E R, E R, E R, E R, E 17. Mixed paper &
card R, E, A R, E, A R, E, A R, E, A R, E, A
18. Plasterboard R R R 19. Average plastics R, E, A R, E, A R, E, A 20. Average plastic
film (including bags)
R, E, A R, E, A R, E, A
21. Average rigid plastics (including bottles)
R, E, A R, E, A R, E, A
22. Plastics HDPE R R R 23. Plastics LPDE and
LLPDE R R R
24. Plastics: PET R R R 25. Plastics PP R R R 26. Plastics PS R R R 27. Plastics PVC R R R 28. Silt/soil R R R 29. Textiles R, A R, A R, A 30. Tyres R R 31. WEEE-small R, E, A R, E, A
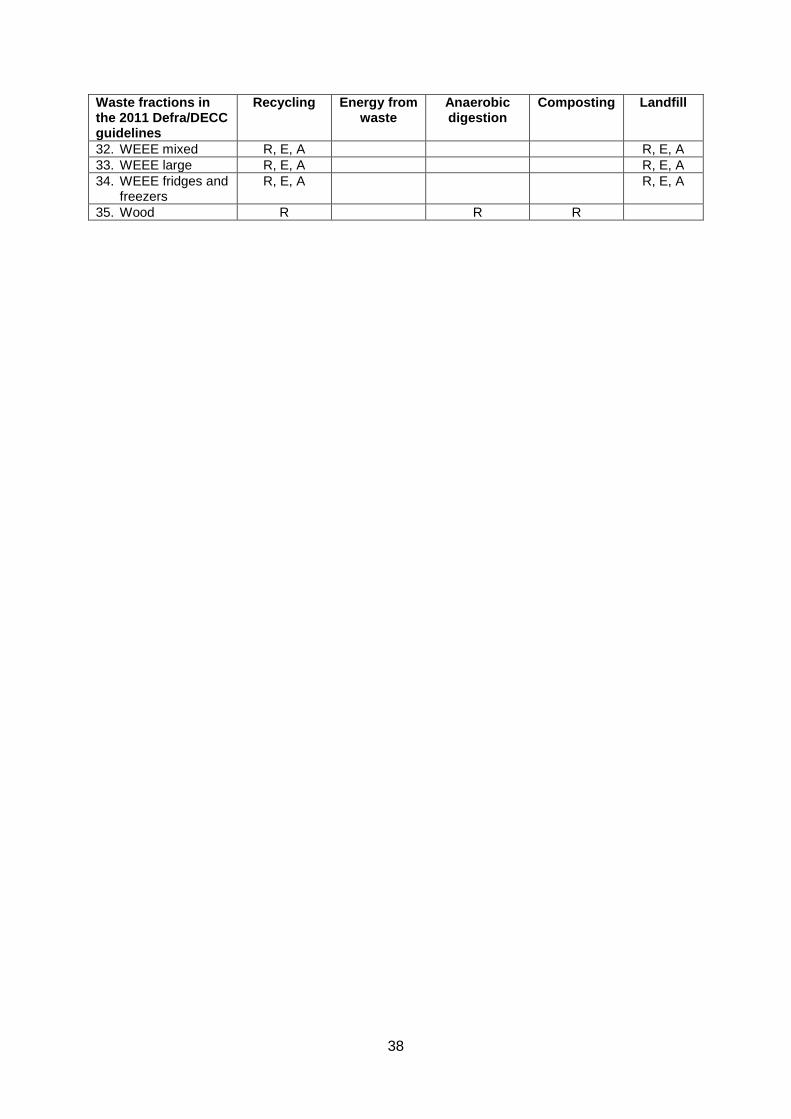
38
Waste fractions in the 2011 Defra/DECC guidelines
Recycling Energy from waste
Anaerobic digestion
Composting Landfill
32. WEEE mixed R, E, A R, E, A 33. WEEE large R, E, A R, E, A 34. WEEE fridges and
freezers R, E, A R, E, A
35. Wood R R R
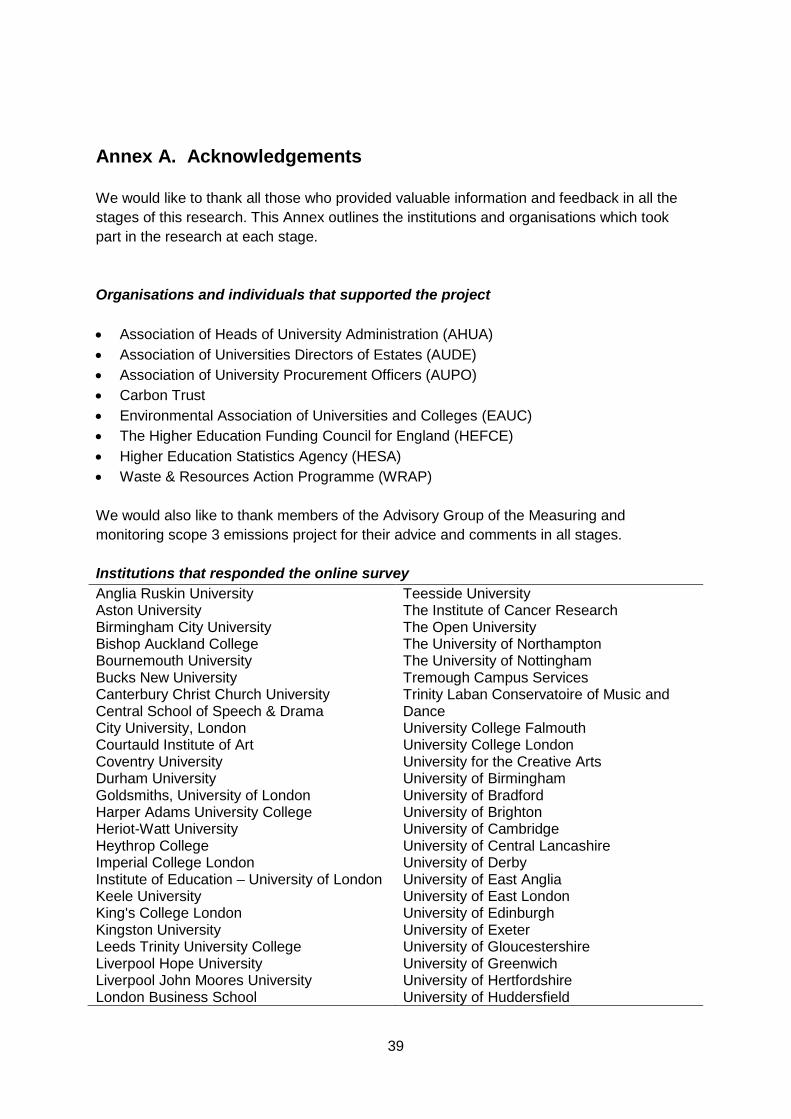
39
Annex A. Acknowledgements We would like to thank all those who provided valuable information and feedback in all the stages of this research. This Annex outlines the institutions and organisations which took part in the research at each stage. Organisations and individuals that supported the project • Association of Heads of University Administration (AHUA) • Association of Universities Directors of Estates (AUDE) • Association of University Procurement Officers (AUPO) • Carbon Trust • Environmental Association of Universities and Colleges (EAUC) • The Higher Education Funding Council for England (HEFCE) • Higher Education Statistics Agency (HESA) • Waste & Resources Action Programme (WRAP) We would also like to thank members of the Advisory Group of the Measuring and monitoring scope 3 emissions project for their advice and comments in all stages. Institutions that responded the online survey Anglia Ruskin University Aston University Birmingham City University Bishop Auckland College Bournemouth University Bucks New University Canterbury Christ Church University Central School of Speech & Drama City University, London Courtauld Institute of Art Coventry University Durham University Goldsmiths, University of London Harper Adams University College Heriot-Watt University Heythrop College Imperial College London Institute of Education – University of London Keele University King's College London Kingston University Leeds Trinity University College Liverpool Hope University Liverpool John Moores University London Business School
Teesside University The Institute of Cancer Research The Open University The University of Northampton The University of Nottingham Tremough Campus Services Trinity Laban Conservatoire of Music and Dance University College Falmouth University College London University for the Creative Arts University of Birmingham University of Bradford University of Brighton University of Cambridge University of Central Lancashire University of Derby University of East Anglia University of East London University of Edinburgh University of Exeter University of Gloucestershire University of Greenwich University of Hertfordshire University of Huddersfield
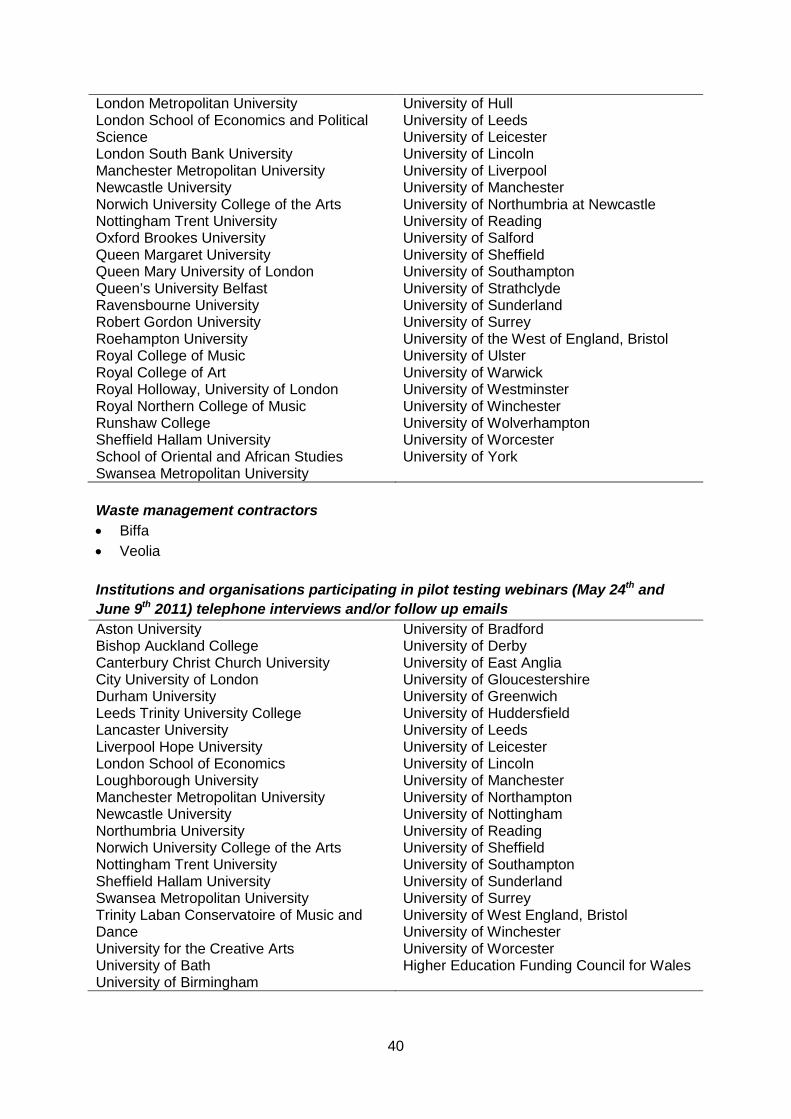
40
London Metropolitan University London School of Economics and Political Science London South Bank University Manchester Metropolitan University Newcastle University Norwich University College of the Arts Nottingham Trent University Oxford Brookes University Queen Margaret University Queen Mary University of London Queen’s University Belfast Ravensbourne University Robert Gordon University Roehampton University Royal College of Music Royal College of Art Royal Holloway, University of London Royal Northern College of Music Runshaw College Sheffield Hallam University School of Oriental and African Studies Swansea Metropolitan University
University of Hull University of Leeds University of Leicester University of Lincoln University of Liverpool University of Manchester University of Northumbria at Newcastle University of Reading University of Salford University of Sheffield University of Southampton University of Strathclyde University of Sunderland University of Surrey University of the West of England, Bristol University of Ulster University of Warwick University of Westminster University of Winchester University of Wolverhampton University of Worcester University of York
Waste management contractors • Biffa • Veolia Institutions and organisations participating in pilot testing webinars (May 24th and June 9th
Aston University 2011) telephone interviews and/or follow up emails
Bishop Auckland College Canterbury Christ Church University City University of London Durham University Leeds Trinity University College Lancaster University Liverpool Hope University London School of Economics Loughborough University Manchester Metropolitan University Newcastle University Northumbria University Norwich University College of the Arts Nottingham Trent University Sheffield Hallam University Swansea Metropolitan University Trinity Laban Conservatoire of Music and Dance University for the Creative Arts University of Bath University of Birmingham
University of Bradford University of Derby University of East Anglia University of Gloucestershire University of Greenwich University of Huddersfield University of Leeds University of Leicester University of Lincoln University of Manchester University of Northampton University of Nottingham University of Reading University of Sheffield University of Southampton University of Sunderland University of Surrey University of West England, Bristol University of Winchester University of Worcester Higher Education Funding Council for Wales
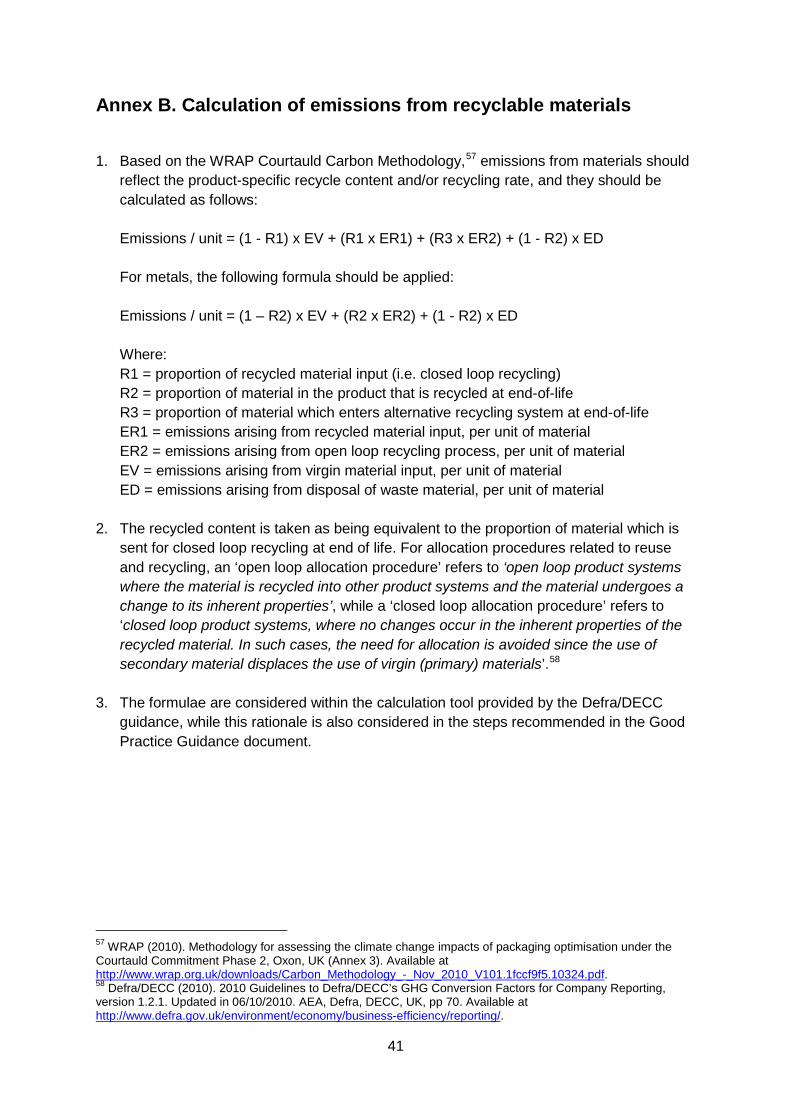
41
Annex B. Calculation of emissions from recyclable materials 1. Based on the WRAP Courtauld Carbon Methodology,57
emissions from materials should reflect the product-specific recycle content and/or recycling rate, and they should be calculated as follows:
Emissions / unit = (1 - R1) x EV + (R1 x ER1) + (R3 x ER2) + (1 - R2) x ED
For metals, the following formula should be applied:
Emissions / unit = (1 – R2) x EV + (R2 x ER2) + (1 - R2) x ED
Where: R1 = proportion of recycled material input (i.e. closed loop recycling) R2 = proportion of material in the product that is recycled at end-of-life R3 = proportion of material which enters alternative recycling system at end-of-life ER1 = emissions arising from recycled material input, per unit of material ER2 = emissions arising from open loop recycling process, per unit of material EV = emissions arising from virgin material input, per unit of material ED = emissions arising from disposal of waste material, per unit of material
2. The recycled content is taken as being equivalent to the proportion of material which is
sent for closed loop recycling at end of life. For allocation procedures related to reuse and recycling, an ‘open loop allocation procedure’ refers to ‘open loop product systems where the material is recycled into other product systems and the material undergoes a change to its inherent properties’, while a ‘closed loop allocation procedure’ refers to ‘closed loop product systems, where no changes occur in the inherent properties of the recycled material. In such cases, the need for allocation is avoided since the use of secondary material displaces the use of virgin (primary) materials’.58
3. The formulae are considered within the calculation tool provided by the Defra/DECC guidance, while this rationale is also considered in the steps recommended in the Good Practice Guidance document.
57 WRAP (2010). Methodology for assessing the climate change impacts of packaging optimisation under the Courtauld Commitment Phase 2, Oxon, UK (Annex 3). Available at http://www.wrap.org.uk/downloads/Carbon_Methodology_-_Nov_2010_V101.1fccf9f5.10324.pdf. 58 Defra/DECC (2010). 2010 Guidelines to Defra/DECC’s GHG Conversion Factors for Company Reporting, version 1.2.1. Updated in 06/10/2010. AEA, Defra, DECC, UK, pp 70. Available at http://www.defra.gov.uk/environment/economy/business-efficiency/reporting/.
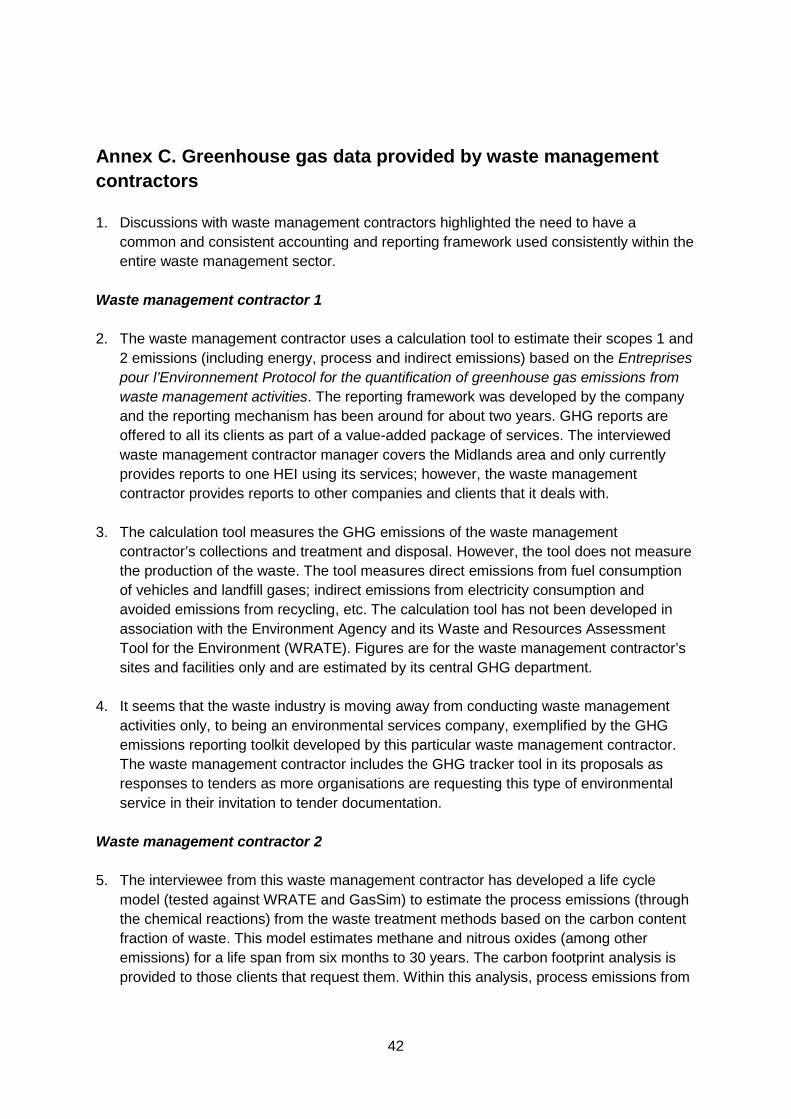
42
Annex C. Greenhouse gas data provided by waste management contractors 1. Discussions with waste management contractors highlighted the need to have a
common and consistent accounting and reporting framework used consistently within the entire waste management sector.
Waste management contractor 1 2. The waste management contractor uses a calculation tool to estimate their scopes 1 and
2 emissions (including energy, process and indirect emissions) based on the Entreprises pour l’Environnement Protocol for the quantification of greenhouse gas emissions from waste management activities. The reporting framework was developed by the company and the reporting mechanism has been around for about two years. GHG reports are offered to all its clients as part of a value-added package of services. The interviewed waste management contractor manager covers the Midlands area and only currently provides reports to one HEI using its services; however, the waste management contractor provides reports to other companies and clients that it deals with.
3. The calculation tool measures the GHG emissions of the waste management
contractor’s collections and treatment and disposal. However, the tool does not measure the production of the waste. The tool measures direct emissions from fuel consumption of vehicles and landfill gases; indirect emissions from electricity consumption and avoided emissions from recycling, etc. The calculation tool has not been developed in association with the Environment Agency and its Waste and Resources Assessment Tool for the Environment (WRATE). Figures are for the waste management contractor’s sites and facilities only and are estimated by its central GHG department.
4. It seems that the waste industry is moving away from conducting waste management
activities only, to being an environmental services company, exemplified by the GHG emissions reporting toolkit developed by this particular waste management contractor. The waste management contractor includes the GHG tracker tool in its proposals as responses to tenders as more organisations are requesting this type of environmental service in their invitation to tender documentation.
Waste management contractor 2 5. The interviewee from this waste management contractor has developed a life cycle
model (tested against WRATE and GasSim) to estimate the process emissions (through the chemical reactions) from the waste treatment methods based on the carbon content fraction of waste. This model estimates methane and nitrous oxides (among other emissions) for a life span from six months to 30 years. The carbon footprint analysis is provided to those clients that request them. Within this analysis, process emissions from
43
landfill and anaerobic digestion are calculated, currently it is planned to include direct emissions from depots, transport and recyclable products.
6. The carbon footprint of the customers is based on their own base data (sample of the customer's waste and differentiated in waste categories) to run the model. MRFs are not included in the analysis, because the waste management contractor only has small facilities, where the electricity-related emissions are quite small.
7. When asked about his experience on waste compositional data in the HE sector
(academic and residential buildings), the interviewee considered that there are still large uncertainties. The interviewee recommended conducting a study at the regional level to analyse the seasonal waste compositional data and their carbon content.
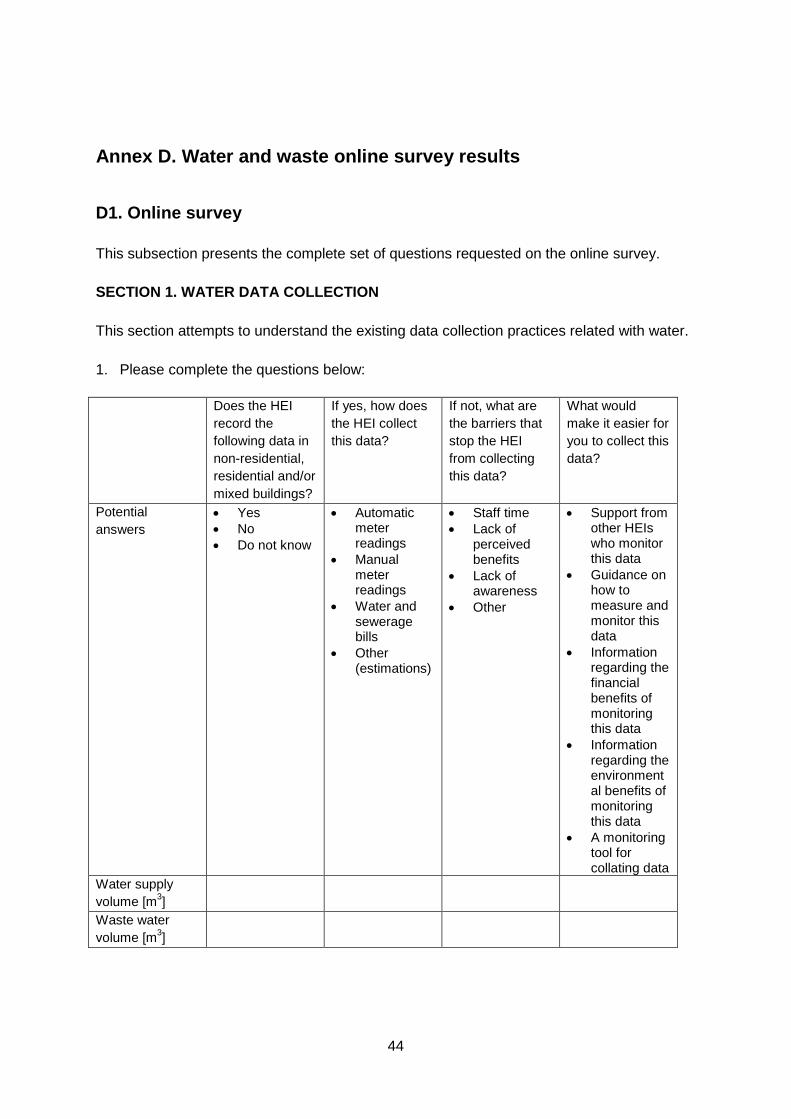
44
Annex D. Water and waste online survey results
D1. Online survey This subsection presents the complete set of questions requested on the online survey. SECTION 1. WATER DATA COLLECTION This section attempts to understand the existing data collection practices related with water. 1. Please complete the questions below: Does the HEI
record the following data in non-residential, residential and/or mixed buildings?
If yes, how does the HEI collect this data?
If not, what are the barriers that stop the HEI from collecting this data?
What would make it easier for you to collect this data?
Potential answers
• Yes • No • Do not know
• Automatic meter readings
• Manual meter readings
• Water and sewerage bills
• Other (estimations)
• Staff time • Lack of
perceived benefits
• Lack of awareness
• Other
• Support from other HEIs who monitor this data
• Guidance on how to measure and monitor this data
• Information regarding the financial benefits of monitoring this data
• Information regarding the environmental benefits of monitoring this data
• A monitoring tool for collating data
Water supply volume [m3
]
Waste water volume [m3
]
45
Please provide any comments on the answers you have given. For example, any assumptions you made for estimating volumes, other barriers or other support to collect data. 2. Who collects the water related data (tick all that apply)? � Environmental/Sustainability Manager � Facilities/Energy Manager � Other, please specify ________________ SECTION 2. WASTE This section focuses on understanding the existing data collection practices related to measuring waste. 3. Has the HEI undertaken any waste audits to understand the composition of waste
arising? � Yes � No � Do not know 4. Does the HEI collect waste data in non-residential, residential or ‘mixed’ (part non-
residential, part residential) buildings? � Yes, in all buildings � Yes, in non-residential buildings only � Yes, in residential buildings only � Yes, in non-residential and residential buildings, but not in ‘mixed’ buildings � No
5. What are the barriers that stop you from collecting the waste data in non-residential
buildings? Please tick all that apply. � Staff time � Lack of perceived benefits � Lack of awareness � Other, please specify _____________ 6. What are the barriers that stop you from collecting the waste data in residential
buildings? Please tick all that apply. � Staff time � Lack of perceived benefits � Lack of awareness � Other, please specify _____________ 7. What are the barriers that stop you from collecting the waste data in mixed buildings?
Please tick all that apply. � Staff time � Lack of perceived benefits � Lack of awareness � Other, please specify _____________
46
8. What would make it easier for you to collect and monitor waste data? Please tick all that apply.
� Support from other Universities who are monitoring their waste � Guidance on how to measure and monitor waste � Information regarding the financial benefits of monitoring waste � Information regarding the environmental benefits of monitoring waste � A monitoring tool for collating data � Other, please specify _____________ 9. Who collects the waste data? Please tick all that apply. � Environmental/Sustainability Manager � Facilities/Energy Manager � Other, please specify ___________________ Data collection in different waste treatment methods The next several sections ask about what and how waste data are collected for different treatment and disposal methods. Where waste data are being collected, the questionnaire provides space for the participant to provide the relevant information. 10. In which type of owned estate buildings is the institution currently collecting data on mass
(tonnes) of waste sent to the different treatment methods? Please tick all that apply. Non-residential
buildings Residential buildings
Mixed buildings
No waste stream is sent to this method
No data are available
Recycling Landfill Incineration Energy from waste (EfW)
Composting Anaerobic digestion
Re-use on site
11. How does the Institution collect the data on mass (tonnes) of waste sent to different
methods in NON-RESIDENTIAL buildings? Please tick all that apply. Waste contractor
transfer notes Annual waste surveys/audits
Estimated No data are available
Recycling Landfill Incineration Energy from waste (EfW) Composting Anaerobic digestion Re-use on site
Other, please specify ___________________
47
12. How does the Institution collect the data on mass (tonnes) of waste sent to different
methods in RESIDENTIAL buildings? (Please tick all that apply) Waste contractor
transfer notes Annual waste surveys/audits
Estimated Local authorities data
No data are available
Recycling Landfill Incineration Energy from waste (EfW)
Composting Anaerobic digestion
Re-use on site
Other, please specify ___________________ 13. How does the Institution collect the data on mass (tonnes) of waste sent to different
methods in MIXED buildings? (Please tick all that apply) Waste contractor
transfer notes Annual waste surveys/audits
Estimated Local authorities data
No data are available
Recycling Landfill Incineration Energy from waste (EfW)
Composting Anaerobic digestion
Re-use on site
Other, please specify ___________________ Waste composition If your institution has waste compositional data through waste audits or your waste contractors, this information will be extremely valuable to our research. Your response will be used to estimate a national average waste composition sent to each treatment/disposal method for the HE sector. This compositional data will help other institutions that do not have the waste composition breakdown to estimate emissions in a more accurate manner. 14. Does the institution record waste composition data for any of the waste treatment
methods in the previous section? � Yes � No � Do not know
48
Recycling – waste composition 15. Is data on waste composition sent to RECYCLING available? � Yes (non-residential, residential or mixed buildings) � No 16. If data on waste sent to RECYCLING are available for NON-RESIDENTIAL BUILDINGS,
please complete the following information: • Paper (tonnes) _____________ • Card (tonnes) _____________ • Wood (tonnes) _____________ • Textiles (tonnes) _____________ • Plastic (dense) (tonnes) _____________ • Plastic (film) (tonnes) _____________ • Ferrous metals (tonnes) _____________ • Non-ferrous metals (tonnes) _____________ • Silt/soil (tonnes) _____________ • Aggregate materials (tonnes) _____________ • Misc combustibles (tonnes) _____________ • Glass (tonnes) ____________ • Tyres (tonnes) _____________ • Other, please specify_________________ • Total (tonnes) ______________ • Please specify year when these data were collected ______________
17. If data on waste sent to RECYCLING are available for RESIDENTIAL BUILDINGS,
please complete the following information: • Paper (tonnes) ______________ • Card (tonnes) ______________ • Wood (tonnes) ______________ • Textiles (tonnes) ______________ • Plastic (dense) (tonnes) ______________ • Plastic (film) (tonnes) ______________ • Ferrous metals (tonnes) ______________ • Non-ferrous metals (tonnes) ______________ • Silt/soil (tonnes) ______________ • Aggregate materials (tonnes) ______________ • Misc combustibles (tonnes) ______________ • Glass (tonnes) ______________ • Tyres (tonnes) ______________ • Other, please specify______________ • Total (tonnes) ______________ • Please specify year when these data were collected
18. If data on waste sent to RECYCLING are available for MIXED BUILDINGS, please
complete the following information: • Paper (tonnes) ______________ • Card (tonnes) ______________ • Wood (tonnes) ______________ • Textiles (tonnes) ______________ • Plastic (dense) (tonnes) ______________
49
• Plastic (film) (tonnes) ______________ • Ferrous metals (tonnes) ______________ • Non-ferrous metals (tonnes) ______________ • Silt/soil (tonnes) ______________ • Aggregate materials (tonnes) ______________ • Misc combustibles (tonnes) ______________ • Glass (tonnes) ______________ • Tyres (tonnes) ______________ • Other, please specify______________ • Total (tonnes) ______________ • Please specify year when these data were collected _________
Landfill – waste composition 19. Is data on waste composition sent to LANDFILL available? � Yes (non-residential, residential or mixed buildings) � No 20. If data on waste sent to LANDFILL are available for NON-RESIDENTIAL BUILDINGS,
please complete the following information: • Paper (tonnes) ____________ • Card (tonnes) ____________ • Kitchen and food waste (tonnes) ____________ • Garden/plant waste (tonnes) ____________ • Other organic (tonnes) ____________ • Wood (tonnes) ____________ • Textiles (tonnes) ____________ • Plastic (dense) (tonnes) ____________ • Plastic (film) (tonnes) ____________ • Ferrous metals (tonnes) ____________ • Non-ferrous metals (tonnes) ____________ • Silt/soil (tonnes) ____________ • Aggregate materials (tonnes) ____________ • Misc combustibles (tonnes) ____________ • Glass (tonnes) ____________ • Tyres (tonnes) ____________ • Other (tonnes) ____________ • Total (tonnes) ____________ • Please specify year when these data were collected ______________
21. If data on waste sent to LANDFILL are available for RESIDENTIAL BUILDINGS, please
complete the following information: • Paper (tonnes) ____________ • Card (tonnes) ____________ • Kitchen and food waste (tonnes) ____________ • Garden/plant waste (tonnes) ____________ • Other organic (tonnes) ____________ • Wood (tonnes) ____________ • Textiles (tonnes) ____________ • Plastic (dense) (tonnes) ____________ • Plastic (film) (tonnes) ____________ • Ferrous metals (tonnes) ____________
50
• Non-ferrous metals (tonnes) ____________ • Silt/soil (tonnes) ____________ • Aggregate materials (tonnes) ____________ • Misc combustibles (tonnes) ____________ • Glass (tonnes) ____________ • Tyres (tonnes) ____________ • Other (tonnes) ____________ • Total (tonnes) ____________ • Please specify year when these data were collected ______________
22. If data on waste sent to LANDFILL are available for MIXED BUILDINGS, please
complete the following information: • Paper (tonnes) ____________ • Card (tonnes) ____________ • Kitchen and food waste (tonnes) ____________ • Garden/plant waste (tonnes) ____________ • Other organic (tonnes) ____________ • Wood (tonnes) ____________ • Textiles (tonnes) ____________ • Plastic (dense) (tonnes) ____________ • Plastic (film) (tonnes) ____________ • Ferrous metals (tonnes) ____________ • Non-ferrous metals (tonnes) ____________ • Silt/soil (tonnes) ____________ • Aggregate materials (tonnes) ____________ • Misc combustibles (tonnes) ____________ • Glass (tonnes) ____________ • Tyres (tonnes) ____________ • Other (tonnes) ____________ • Total (tonnes) ____________ • Please specify year when these data were collected ______________
Incineration / Energy from Waste (EfW) – waste composition 23. Is data on waste composition sent to INCINERATION / ENERGY FROM WASTE
available? � Yes (non-residential, residential or mixed buildings) � No 24. If data on waste sent to INCINERATION / ENERGY FROM WASTE are available for
NON-RESIDENTIAL BUILDINGS, please complete the following information: • Paper (tonnes) ____________________ • Card (tonnes) ____________________ • Kitchen and food waste (tonnes) ____________________ • Garden/plant waste (tonnes) ____________________ • Other organic (tonnes) ____________________ • Wood (tonnes) ____________________ • Textiles (tonnes) ____________________ • Plastic (dense) (tonnes) ____________________ • Plastic (film) (tonnes) ____________________ • Ferrous metals (tonnes) ____________________ • Non-ferrous metals (tonnes) ____________________
51
• Silt / soil (tonnes) ____________________ • Aggregate materials (tonnes) ____________________ • Silt/soil (tonnes) ____________________ • Aggregate materials (tonnes) ____________________ • Misc combustibles (tonnes) ____________________ • Glass (tonnes) ____________________ • Tyres (tonnes) ____________________ • Other (tonnes) ____________________ • Total (tonnes) ____________________ • Please specify year when these data were collected ______________
25. If data on waste sent to INCINERATION / ENERGY FROM WASTE are available for
RESIDENTIAL BUILDINGS, please complete the following information: • Paper (tonnes) ____________________ • Card (tonnes) ____________________ • Kitchen and food waste (tonnes) ____________________ • Garden/plant waste (tonnes) ____________________ • Other organic (tonnes) ____________________ • Wood (tonnes) ____________________ • Textiles (tonnes) ____________________ • Plastic (dense) (tonnes) ____________________ • Plastic (film) (tonnes) ____________________ • Ferrous metals (tonnes) ____________________ • Non-ferrous metals (tonnes) ____________________ • Silt / soil (tonnes) ____________________ • Aggregate materials (tonnes) ____________________ • Silt/soil (tonnes) ____________________ • Aggregate materials (tonnes) ____________________ • Misc combustibles (tonnes) ____________________ • Glass (tonnes) ____________________ • Tyres (tonnes) ____________________ • Other (tonnes) ____________________ • Total (tonnes) ____________________ • Please specify year when these data were collected ______________
26. If data on waste sent to INCINERATION / ENERGY FROM WASTE are available for
MIXED BUILDINGS, please complete the following information: • Paper (tonnes) ____________________ • Card (tonnes) ____________________ • Kitchen and food waste (tonnes) ____________________ • Garden/plant waste (tonnes) ____________________ • Other organic (tonnes) ____________________ • Wood (tonnes) ____________________ • Textiles (tonnes) ____________________ • Plastic (dense) (tonnes) ____________________ • Plastic (film) (tonnes) ____________________ • Ferrous metals (tonnes) ____________________ • Non-ferrous metals (tonnes) ____________________ • Silt / soil (tonnes) ____________________ • Aggregate materials (tonnes) ____________________ • Silt/soil (tonnes) ____________________ • Aggregate materials (tonnes) ____________________
52
• Misc combustibles (tonnes) ____________________ • Glass (tonnes) ____________________ • Tyres (tonnes) ____________________ • Other (tonnes) ____________________ • Total (tonnes) ____________________ • Please specify year when these data were collected ______________
Composting – waste composition 27. Is data on waste composition sent to COMPOSTING available? � Yes (non-residential, residential or mixed buildings) � No 28. If data on waste sent to COMPOSTING are available for NON-RESIDENTIAL
BUILDINGS, please complete the following information: • Paper (tonnes) _______________ • Card (tonnes) _______________ • Kitchen / food waste (tonnes) _______________ • Garden / plant waste (tonnes) _______________ • Other organic waste (tonnes) _______________ • Wood (tonnes) _______________ • Total (tonnes) _______________ • Please specify year when these data were collected
29. If data on waste sent to COMPOSTING are available for RESIDENTIAL BUILDINGS,
please complete the following information: • Paper (tonnes) ______________ • Card (tonnes) ______________ • Kitchen / food waste (tonnes) _________ • Garden / plant waste (tonnes) __________ • Other organic waste (tonnes) ____________ • Wood (tonnes) _________________ • Total (tonnes) _____________ • Please specify year when these data were collected ______________
30. If data on waste sent to COMPOSTING are available for MIXED BUILDINGS, please
complete the following information: • Paper (tonnes) ______________ • Card (tonnes) ______________ • Kitchen / food waste (tonnes) _________ • Garden / plant waste (tonnes) __________ • Other organic waste (tonnes) ____________ • Wood (tonnes) _________________ • Total (tonnes) _____________ • Please specify year when these data were collected ______________
Anaerobic digestion (waste composition) 31. Is data on waste composition sent to ANAEROBIC DIGESTION available? � Yes (non-residential, residential or mixed buildings) � No
53
32. If data on waste sent to ANAEROBIC DIGESTION are available for NON-RESIDENTIAL
BUILDINGS, please complete the following information: • Paper (tonnes) _____________ • Card (tonnes) ______________ • Kitchen / food waste (tonnes) _________ • Garden / plant waste (tonnes) __________ • Other organic waste (tonnes) ____________ • Total (tonnes) _____________ • Please specify year when these data were collected ______________
33. If data on waste sent to ANAEROBIC DIGESTION are available for RESIDENTIAL
BUILDINGS, please complete the following information: • Paper (tonnes) _____________ • Card (tonnes) ______________ • Kitchen / food waste (tonnes) _________ • Garden / plant waste (tonnes) __________ • Other organic waste (tonnes) ____________ • Total (tonnes) _____________ • Please specify year when these data were collected ______________
34. If data on waste sent to ANAEROBIC DIGESTION are available for MIXED BUILDINGS,
please complete the following information: • Paper (tonnes) _____________ • Card (tonnes) ______________ • Kitchen / food waste (tonnes) _________ • Garden / plant waste (tonnes) __________ • Other organic waste (tonnes) ____________ • Total (tonnes) _____________ • Please specify year when these data were collected ______________
Re-use on site 35. Does the institution re-use on site unwanted goods? � Yes � No � Do not know 36. Which type of unwanted goods are being RE-USED ON SITE in the institution? Please
tick all that apply Non-residential
buildings Residential buildings
Mixed buildings No data are available
Furniture Stationery Books Textiles (clothes and bedding)
Crockery Kitchenware Food Electrical equipment
54
Other, please specify ___________________ 37. Does the institution record the data on the mass or quantities of unwanted goods that are
re-used on site? Please tick all that apply � Yes, in non-residential buildings � Yes, in residential buildings � Yes, in mixed buildings � No FURTHER INFORMATION We would be happy to discuss the development of the guidance for estimating Scope 3 greenhouse gas emissions with stakeholders. 38. Would you be willing to be contacted in the future to discuss the survey or other aspects
of the project? If yes, please provide your name, telephone number, email and institution below
� Yes � No 39. Please provide us your contact details:
• Name ___________________________________________________ • Email __________________________________________________ • Telephone ________________________________________________ • Institution _________________________________________________
40. Number of students (optional) Total number of students ______________ Number of students working remotely (distance learning) _______________
41. Number of staff (optional) Number of academic staff ____________ Number of support staff ______________

55
D2. Results This subsection provides the main results of the online survey based on participants’ responses. Table D1: Waste data collection techniques in non-residential buildings by waste treatment method
Waste disposal/treatment method
a
Waste management
contractor transfer notes [% of
responses]
Annual waste audits/surveys
[% of responses]
Estimated [% of
responses]
No data available
[% of responses]
Number of responses
Recycling 75.3% 25.8% 37.1% 3.4% 89 Landfill 70.1% 21.8% 31.0% 6.9% 87 Incineration 39.7% 5.2% 10.3% 53.4% 58 Energy from waste 31.3% 7.5% 13.4% 59.7% 67 Composting 33.3% 9.5% 14.3% 52.4% 63 Anaerobic digestion 9.8% 3.9% 9.8% 76.5% 51 Re-use on site 6.0% 10.4% 20.9% 70.1% 67
a
Based on responses to question 11: How does the institution collect the data on mass (tonnes) of waste sent to different methods in non-residential buildings?
Table D2: Waste data collection techniques in residential buildings by waste treatment method
Waste disposal/ treatment method
a
Waste contractor
transfer notes [% of
response]
Annual waste audits/
surveys [% of
response]
Estimated [% of
response]
Local authorities
data [% of
response]
No data available
[% of response]
Number of responses
Recycling 51.2% 17.1% 39.0% 9.8% 20.7% 82 Landfill 50.0% 13.8% 35.0% 7.5% 22.5% 80 Incineration 12.0% 4.0% 4.0% 6.0% 82.0% 50 Energy from waste 14.8% 3.7% 9.3% 7.4% 79.6% 54
Composting 15.7% 3.2% 3.9% 5.9% 76.5% 51 Anaerobic digestion 2.2% 2.2% 0.0% 6.7% 93.3% 45
Re-use on site 5.3% 10.5% 19.3% 8.8% 75.4% 57
a
Based on responses to question 12: How does the institution collect the data on mass (tonnes) of waste sent to different methods in residential buildings?
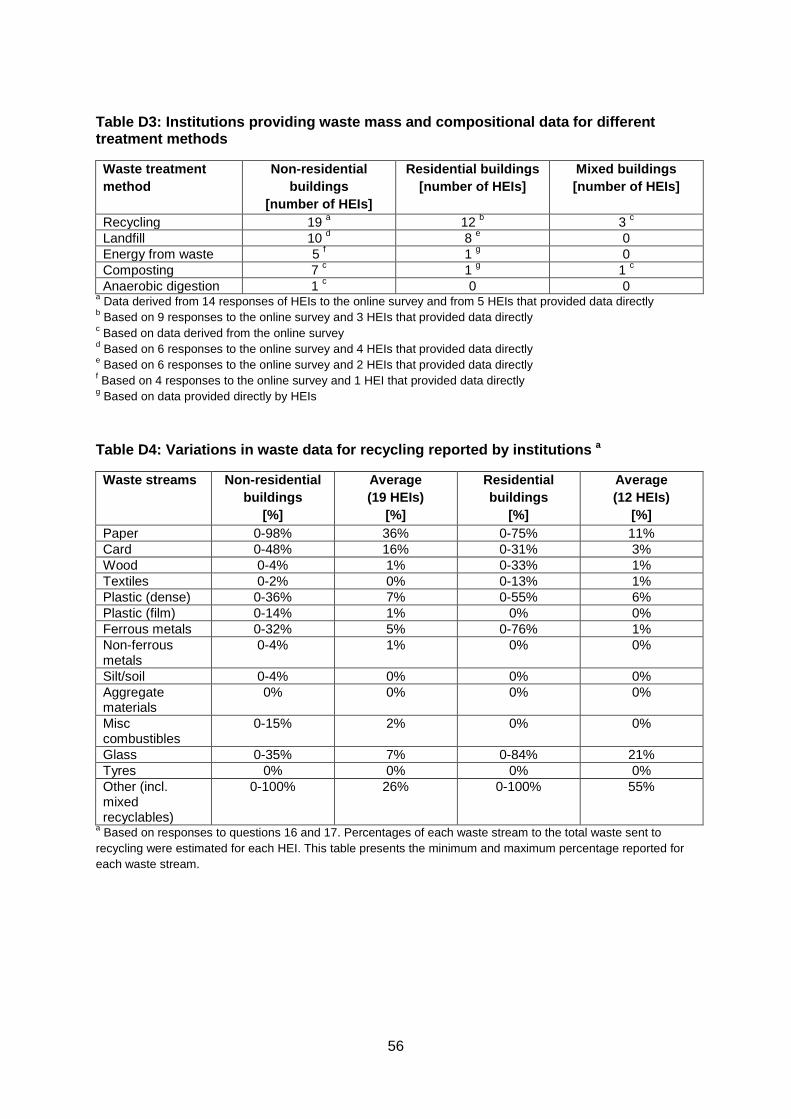
56
Table D3: Institutions providing waste mass and compositional data for different treatment methods
Waste treatment method
Non-residential buildings
[number of HEIs]
Residential buildings [number of HEIs]
Mixed buildings [number of HEIs]
Recycling 19 12 a 3 b Landfill
c 10 8 d 0 e
Energy from waste 5 1 f 0 g Composting 7 1 c 1 g Anaerobic digestion
c 1 0 c 0
a Data derived from 14 responses of HEIs to the online survey and from 5 HEIs that provided data directly b Based on 9 responses to the online survey and 3 HEIs that provided data directly c Based on data derived from the online survey d Based on 6 responses to the online survey and 4 HEIs that provided data directly e Based on 6 responses to the online survey and 2 HEIs that provided data directly f Based on 4 responses to the online survey and 1 HEI that provided data directly g
Based on data provided directly by HEIs
Table D4: Variations in waste data for recycling reported by institutions
Waste streams
a
Non-residential buildings
[%]
Average (19 HEIs)
[%]
Residential buildings
[%]
Average (12 HEIs)
[%] Paper 0-98% 36% 0-75% 11% Card 0-48% 16% 0-31% 3% Wood 0-4% 1% 0-33% 1% Textiles 0-2% 0% 0-13% 1% Plastic (dense) 0-36% 7% 0-55% 6% Plastic (film) 0-14% 1% 0% 0% Ferrous metals 0-32% 5% 0-76% 1% Non-ferrous metals
0-4% 1% 0% 0%
Silt/soil 0-4% 0% 0% 0% Aggregate materials
0% 0% 0% 0%
Misc combustibles
0-15% 2% 0% 0%
Glass 0-35% 7% 0-84% 21% Tyres 0% 0% 0% 0% Other (incl. mixed recyclables)
0-100% 26% 0-100% 55%
a
Based on responses to questions 16 and 17. Percentages of each waste stream to the total waste sent to recycling were estimated for each HEI. This table presents the minimum and maximum percentage reported for each waste stream.
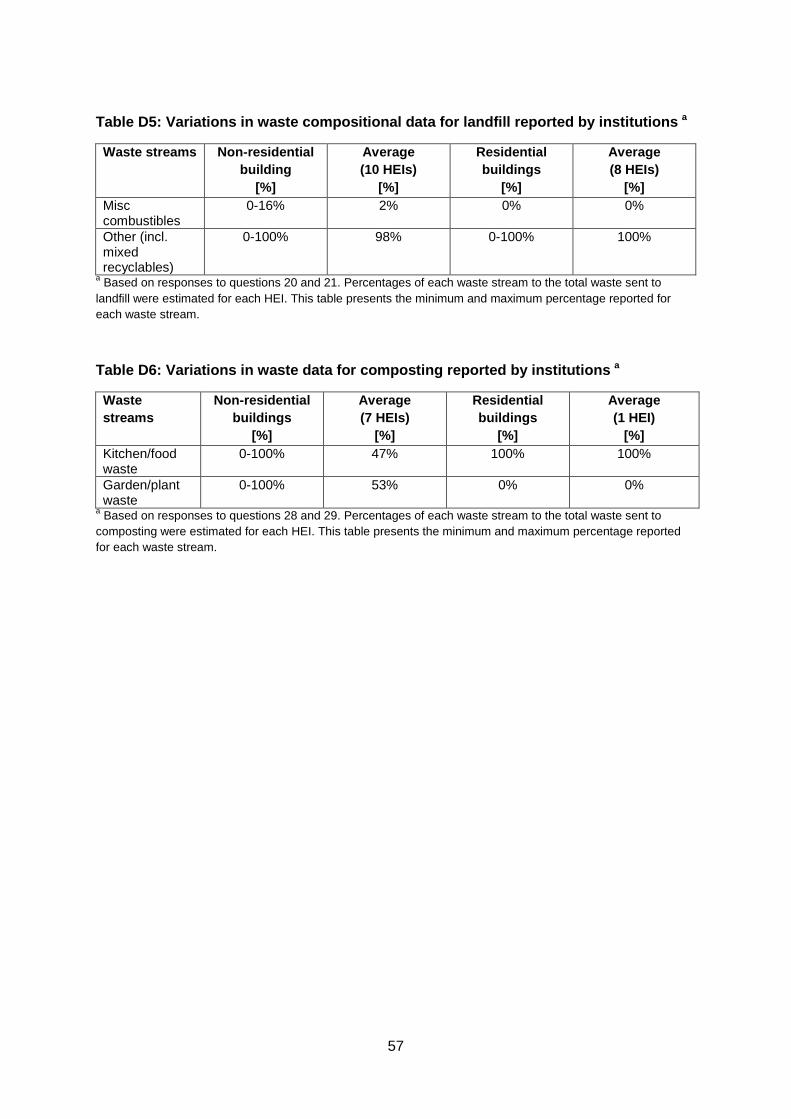
57
Table D5: Variations in waste compositional data for landfill reported by institutions
Waste streams
a
Non-residential building
[%]
Average (10 HEIs)
[%]
Residential buildings
[%]
Average (8 HEIs)
[%] Misc combustibles
0-16% 2% 0% 0%
Other (incl. mixed recyclables)
0-100% 98% 0-100% 100%
a
Based on responses to questions 20 and 21. Percentages of each waste stream to the total waste sent to landfill were estimated for each HEI. This table presents the minimum and maximum percentage reported for each waste stream.
Table D6: Variations in waste data for composting reported by institutions
Waste streams
a
Non-residential buildings
[%]
Average (7 HEIs)
[%]
Residential buildings
[%]
Average (1 HEI)
[%] Kitchen/food waste
0-100% 47% 100% 100%
Garden/plant waste
0-100% 53% 0% 0%
a
Based on responses to questions 28 and 29. Percentages of each waste stream to the total waste sent to composting were estimated for each HEI. This table presents the minimum and maximum percentage reported for each waste stream.
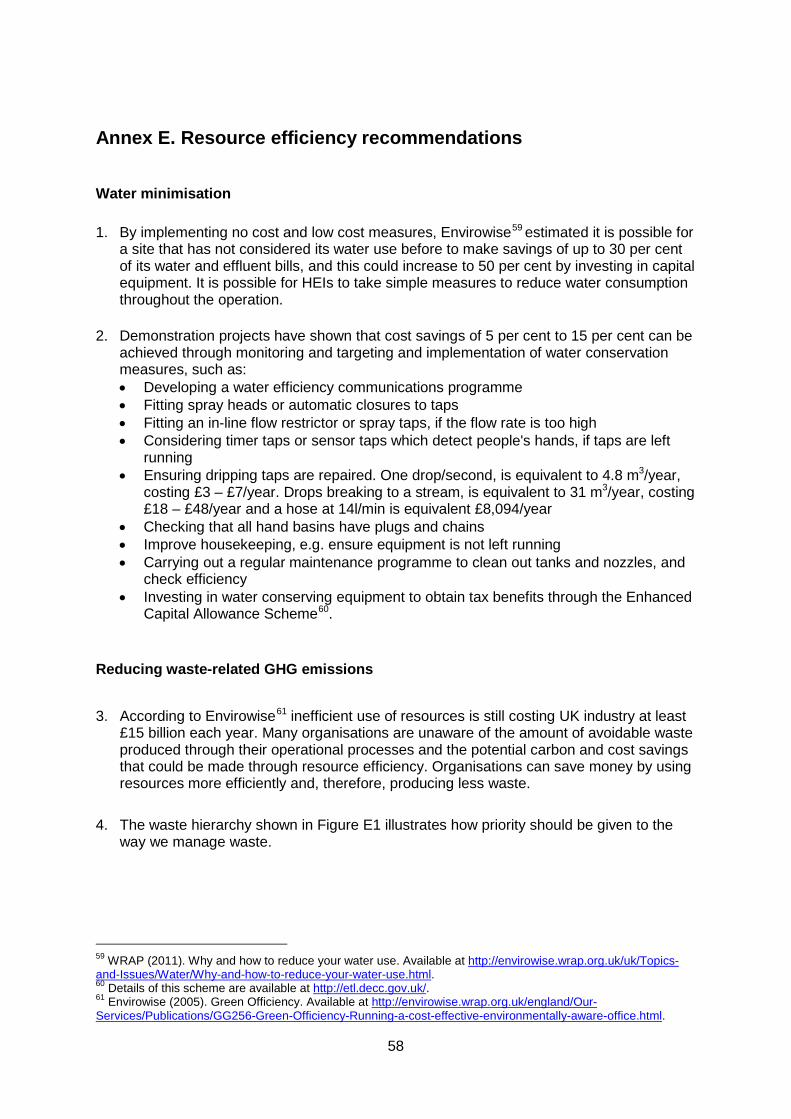
58
Annex E. Resource efficiency recommendations Water minimisation 1. By implementing no cost and low cost measures, Envirowise59
estimated it is possible for a site that has not considered its water use before to make savings of up to 30 per cent of its water and effluent bills, and this could increase to 50 per cent by investing in capital equipment. It is possible for HEIs to take simple measures to reduce water consumption throughout the operation.
2. Demonstration projects have shown that cost savings of 5 per cent to 15 per cent can be achieved through monitoring and targeting and implementation of water conservation measures, such as: • Developing a water efficiency communications programme • Fitting spray heads or automatic closures to taps • Fitting an in-line flow restrictor or spray taps, if the flow rate is too high • Considering timer taps or sensor taps which detect people's hands, if taps are left
running • Ensuring dripping taps are repaired. One drop/second, is equivalent to 4.8 m3/year,
costing £3 – £7/year. Drops breaking to a stream, is equivalent to 31 m3
• Checking that all hand basins have plugs and chains
/year, costing £18 – £48/year and a hose at 14l/min is equivalent £8,094/year
• Improve housekeeping, e.g. ensure equipment is not left running • Carrying out a regular maintenance programme to clean out tanks and nozzles, and
check efficiency • Investing in water conserving equipment to obtain tax benefits through the Enhanced
Capital Allowance Scheme60
.
Reducing waste-related GHG emissions
3. According to Envirowise61
inefficient use of resources is still costing UK industry at least £15 billion each year. Many organisations are unaware of the amount of avoidable waste produced through their operational processes and the potential carbon and cost savings that could be made through resource efficiency. Organisations can save money by using resources more efficiently and, therefore, producing less waste.
4. The waste hierarchy shown in Figure E1 illustrates how priority should be given to the way we manage waste.
59 WRAP (2011). Why and how to reduce your water use. Available at http://envirowise.wrap.org.uk/uk/Topics-and-Issues/Water/Why-and-how-to-reduce-your-water-use.html. 60 Details of this scheme are available at http://etl.decc.gov.uk/. 61 Envirowise (2005). Green Officiency. Available at http://envirowise.wrap.org.uk/england/Our-Services/Publications/GG256-Green-Officiency-Running-a-cost-effective-environmentally-aware-office.html.
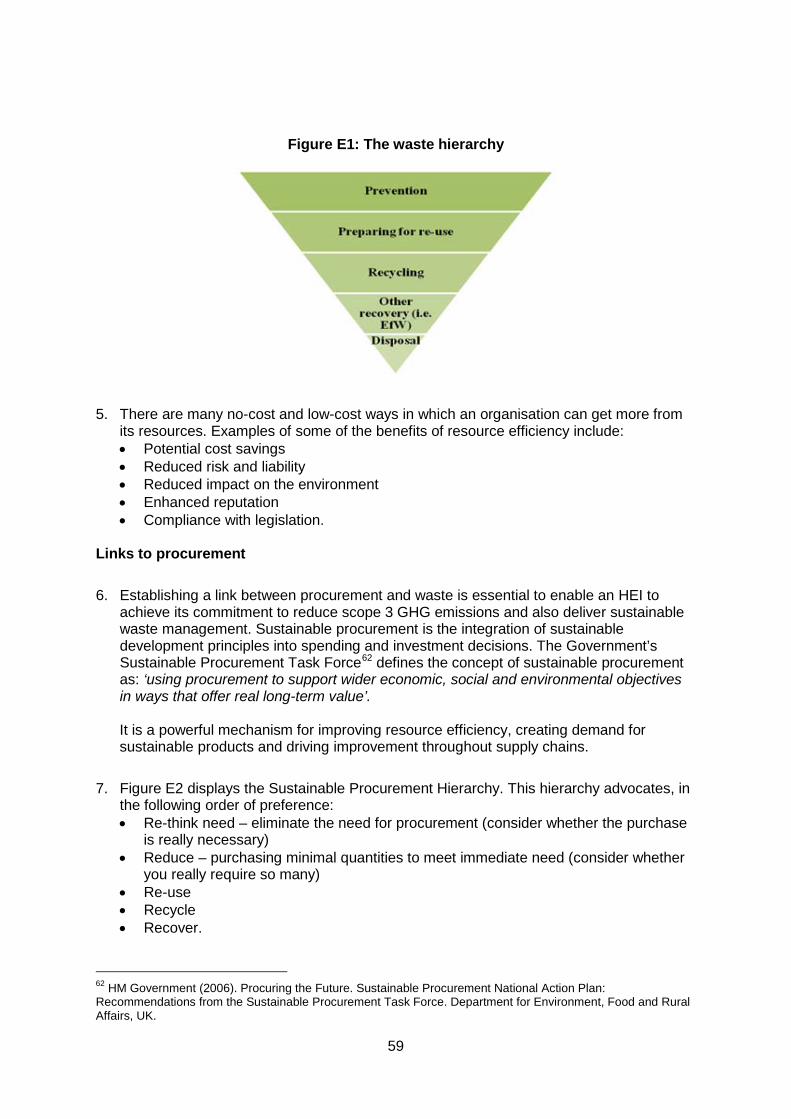
59
Figure E1: The waste hierarchy
5. There are many no-cost and low-cost ways in which an organisation can get more from its resources. Examples of some of the benefits of resource efficiency include: • Potential cost savings • Reduced risk and liability • Reduced impact on the environment • Enhanced reputation • Compliance with legislation.
Links to procurement
6. Establishing a link between procurement and waste is essential to enable an HEI to achieve its commitment to reduce scope 3 GHG emissions and also deliver sustainable waste management. Sustainable procurement is the integration of sustainable development principles into spending and investment decisions. The Government’s Sustainable Procurement Task Force62
defines the concept of sustainable procurement as: ‘using procurement to support wider economic, social and environmental objectives in ways that offer real long-term value’.
It is a powerful mechanism for improving resource efficiency, creating demand for sustainable products and driving improvement throughout supply chains.
7. Figure E2 displays the Sustainable Procurement Hierarchy. This hierarchy advocates, in the following order of preference: • Re-think need – eliminate the need for procurement (consider whether the purchase
is really necessary) • Reduce – purchasing minimal quantities to meet immediate need (consider whether
you really require so many) • Re-use • Recycle • Recover.
62 HM Government (2006). Procuring the Future. Sustainable Procurement National Action Plan: Recommendations from the Sustainable Procurement Task Force. Department for Environment, Food and Rural Affairs, UK.
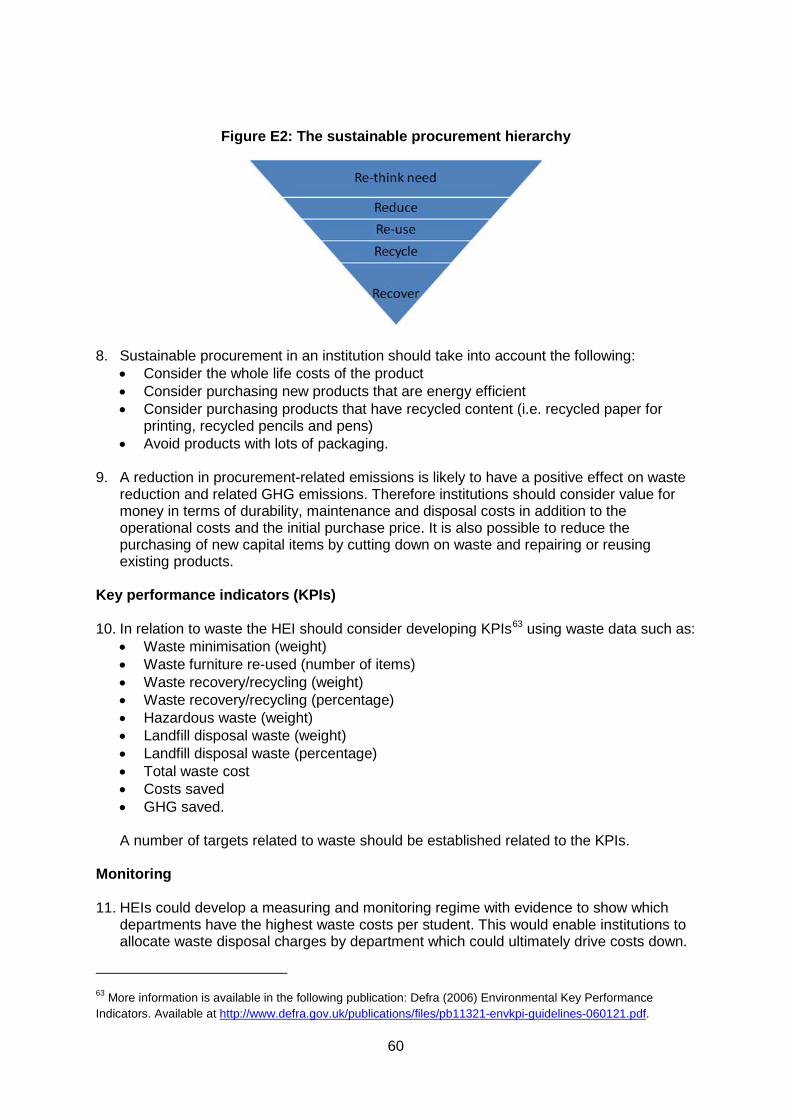
60
Figure E2: The sustainable procurement hierarchy
8. Sustainable procurement in an institution should take into account the following:
• Consider the whole life costs of the product • Consider purchasing new products that are energy efficient • Consider purchasing products that have recycled content (i.e. recycled paper for
printing, recycled pencils and pens) • Avoid products with lots of packaging.
9. A reduction in procurement-related emissions is likely to have a positive effect on waste
reduction and related GHG emissions. Therefore institutions should consider value for money in terms of durability, maintenance and disposal costs in addition to the operational costs and the initial purchase price. It is also possible to reduce the purchasing of new capital items by cutting down on waste and repairing or reusing existing products.
Key performance indicators (KPIs) 10. In relation to waste the HEI should consider developing KPIs63
• Waste minimisation (weight) using waste data such as:
• Waste furniture re-used (number of items) • Waste recovery/recycling (weight) • Waste recovery/recycling (percentage) • Hazardous waste (weight) • Landfill disposal waste (weight) • Landfill disposal waste (percentage) • Total waste cost • Costs saved • GHG saved.
A number of targets related to waste should be established related to the KPIs.
Monitoring 11. HEIs could develop a measuring and monitoring regime with evidence to show which
departments have the highest waste costs per student. This would enable institutions to allocate waste disposal charges by department which could ultimately drive costs down.
63 More information is available in the following publication: Defra (2006) Environmental Key Performance Indicators. Available at http://www.defra.gov.uk/publications/files/pb11321-envkpi-guidelines-060121.pdf.
61
Training 12. Training of staff is important to ensure identification and implementation of waste
minimisation initiatives. 13. Institutions could recruit waste champions from a cross-section of HEI staff and students.
These champions would work on promoting waste minimisation to other staff and students as well as assist with data collection and analysis, review and reporting and project implementation.
14. Consider introducing waste audits across the site to identify opportunities to reduce
waste. Communication 15. Without the buy-in from key staff and students it will be difficult to achieve the full
potential of a successful resource efficiency programme. Raising staff and student awareness about the financial and environmental benefits of reducing waste (plus energy and water) will help encourage active participation.
16. It may also be beneficial to develop a suggestion scheme to encourage employees and
students to propose suggestions to improve environmental performance. It may be worth considering incentivising any suggestion scheme to encourage participation. All suggestions should be acknowledged and ideas that are implemented should be recognised on staff and student notice boards or newsletters. This could be supplemented by information on the intranet, newsletters accompanying payslips, educational DVDs, notice boards or posters.
Waste minimisation programme 17. Institutions should develop a waste minimisation programme to be implemented by staff
and students. This programme should be based on current good practice. 18. Institutions should work with suppliers to reduce or eliminate the use of packaging as
much as possible. For example, catering departments could return cardboard boxes and other packaging to suppliers.
19. Institutions should consider holding a pilot study to investigate the effects of reducing the
amount general waste bins in offices. Envirowise advocates one bin per six people. Over time, consideration should be given to introducing a policy of removing conventional waste bins from all staff offices while increasing the number of communal recycling facilities in corridors. This policy has helped increase recycling rates at the University of Leeds from 16 per cent to over 40 per cent.64
Re-use 20. Re-using materials will reduce the amount of materials that need to be consumed and
ultimately be disposed. HEIs should consider re-using items on site. For example furniture can be re-used in-house or donated to the Furniture Re-use Network65
64 University of Leeds (2011) Waste management and recycling. Available at
or a similar charity.
http://www.leeds.ac.uk/estate_services/environment/recycling.htm. 65 Furniture Re-use Network (2011) Available at http://www.frn.org.uk/.
62
21. There are also a range of national and regional waste exchange type initiatives such as
the National Industrial Symbiosis Programme (NISP)66 and Why Waste67
, which operates in Yorkshire and Humber.
Recycling 22. Many materials in the HEIs’ general waste stream can be recycled, such as paper,
aluminium and steel cans, plastic packaging (such as polythene and shrink wrap). Institutions should consider segregating these waste streams at source to make sure it produces good quality recyclate. Where barriers exist to source segregated recycling (e.g. lack of space, costs, etc.) Institutions should consider ‘commingled’ ‘mixed’ or ‘dry mixed’ recycling services which are available from waste management contractors. Increasing the amount of materials sent to recycling will reduce the amount of waste disposed to landfill and the associated GHG emissions.
23. HEIs should consider introducing coloured recycling bins for internal usage to ensure
staff understand how to segregate commingled recycling bins. Ensure these are clearly labelled. Ensure existing recycling facilities are positioned in the most advantageous locations. Institutions should use local recycling companies to support the local economy and reduce the road miles.
24. HEIs could also investigate the possibility of providing an incentive to recycle, such as
raising charity donations from recycling. Ensure any changes to the recycling scheme are communicated to staff and students.
Organic waste 25. Work in partnership with the catering team to produce an action plan to reduce food
waste. By reducing this waste through a food waste action plan, institutions can achieve significant environmental and cost savings. Catering departments can reduce food waste by planning menus carefully, storing food appropriately, portioning suitably and using any leftovers in other recipes.
26. Institutions should consider implementing a food recycling scheme. A food waste
collection would enable the institution to recover waste food, through treatment method such as composting and anaerobic digestion on-site or off-site as a resource in preference to disposing of it to landfill.
27. Garden waste should also be composted on-site or recovered off-site through a
treatment method such as composting and anaerobic digestion. 28. Any recycling initiatives introduced at an institution should also be incorporated into the
kitchens and dining rooms where many recyclable packaging wastes are often collected as general waste and disposed off in landfill. Institutions should consider holding a series of events to raise awareness of food waste and over-packaged products such as a waste free lunch.
Recovery 29. Where waste cannot be prevented, re-used or recycled energy can be recovered through
technologies such as Energy from Waste (EfW), gasification, autoclave, etc. EfW 66 National Industrial Symbiosis Programme (NISP) (2011) Available at http://www.nisp.org.uk/. 67 Why Waste (2011). Available at: http://www.whywaste.org.uk/.
63
reduces the amount of waste that is disposed to landfill and produces energy in the form of electricity and, often, heat.
Hazardous waste 30. Ensure hazardous waste, such as paints, clinical waste and WEEE, is correctly labelled,
securely contained and disposed of by a certified waste carrier for hazardous waste. HEIs should investigate whether old computer equipment can be: • Upgraded • Returned to manufacture • Re-used in-house • Sold or offered to office staff • Given to local charities or schools • Collected by specialist recycling company.
64
Terms and acronyms
AHUA Association of Heads of University Administration
Anaerobic digestion
Anaerobic digestion is a waste management and renewable energy technology which can reduce greenhouse gas emissions by capturing methane from the decomposition of organic materials such as garden and food wastes. The treatment process produces biogas which can be used to generate heat and power or as a transport fuel. The process output material (digestate) can be used as a fertiliser and soil conditioner.
Arup Ove Arup & Partners Ltd
AUDE Association of University Directors of Estates
AUPO Association of University Procurement Officers
Autoclaving Autoclaving involves the high-pressure sterilisation of waste by steam to destroy any bacteria in the waste. This process is widely used to treat clinical waste, but is increasingly being used as a treatment for municipal waste. Autoclaving of municipal waste is a form of ‘mechanical heat treatment’, a process that uses thermal treatment in conjunction with mechanical processing.
BSI British Standards Institute
CENSA Centre for Sustainability Accounting (CenSA)
CF Greenhouse gas conversion factors
CH Methane 4 CIF Capital Investment Funding
Closed loop Close loop refers to product systems where no changes occur in the inherent properties of the recycled material. In such cases, the use of secondary material displaces the use of virgin (primary) materials.
Commercial and industrial waste
This category can comprise hazardous and non-hazardous waste produced on commercial and industrial business premises as well as institutions excluding construction and demolition waste and municipal waste. This category may include chemical wastes (solvents, acids/alkalis, used oil, catalysts, wastes from chemical preparation, residues and sludge), healthcare wastes, metallic wastes, non-metallic waste (glass, paper & card, rubber, plastic, wood, textiles), discarded equipment (end-of-life vehicles, batteries, waste electronics and other discarded equipment), animal and vegetable waste (food, manure, other animal and vegetable wastes), mixed ordinary waste (undifferentiated waste and sorting residues), common sludges (sludges and dredging wastes) and mineral wastes (combustion residues, contaminated soils, solidified mineral wastes and other mineral wastes). (See http://www.defra.gov.uk/news/2010/11/10/waste-arisings-stats/)
CO Carbon dioxide 2 Composting Composting is a process that can be used to recover waste by
decomposing organic materials and recycling them as a fertilizer and soil conditioner. The use of compost reduces harmful emissions of the
65
greenhouse gas methane from landfills, it reduces the need for scarce natural resources such as peat and it returns organic matter to the soil.
DECC Department of Energy and Climate Change
Defra Department for Environment, Food and Rural Affairs
DMU De Montfort University
EAUC Environmental Association for Universities and Colleges
EE-IO Environmentally Extended Input Output
EfW Energy from Waste
EMS Estate Management Statistics
EpE Entreprises pour l’Environnement
FHE Further and Higher Education
GHG Greenhouse gas
Hazardous waste
Hazardous waste contains materials that provide a risk to the public or to the environment (e.g. batteries, paints, solvents etc.).
HDPE High Density Polyethylene
HE Higher Education
HEIs Higher Education Institutions
HESA Higher Education Statistics Agency
HEFCE Higher Education Funding Council for England
IPCC Intergovernmental Panel on Climate Change
KPIs Key Performance Indicators
Landfill Landfill is shortened term for ‘Landfill sites’ where local authorities and industry take waste to be buried and compacted. Landfill sites produce greenhouse gas emissions such as methane when biodegradable waste decomposes in anaerobic conditions.
LCA Life cycle assessment
m Cubic metres 3 MBT Mechanical biological treatment
Municipal waste
Municipal waste is that which comes under the control of the local authority and includes household waste and other wastes collected by a waste collection authority or its agents, such as municipal parks and gardens waste, beach cleansing waste and waste resulting from the clearance of fly-tipped materials. (See http://www.wrap.org.uk/local_authorities/research_guidance/online_recycling_information_system_oris/glossary_of.html)
MRF Materials recovery facility
N2 Nitrous oxide O NISP National Industrial Symbiosis Programme
Open loop Open loop refers to product systems where the material is recycled into other product systems and the material undergoes a change to its inherent properties.

66
PET Polyethylene Terephthalate
PP Polypropylene
PS Polystyrene
PVC Polyvinyl Chloride
Recycling The process of sorting, cleaning, treating and reconstituting materials for the purpose of using the materials in the manufacture of a new product.
Reuse Making use of a material without altering its form. Materials can be reused on-site or reused on other projects off-site.
Scope 3 emissions
An optional reporting category for an organisation’s indirect GHG emissions which are a consequence of the organisations activities but occur from sources not owned or controlled by the organisation. Examples include ‘upstream’ emissions from the production and transportation of purchased goods, and ‘downstream’ emissions from the use and disposal of the organisation’s products and services.
SIC Standard Industrial Classification
SWDS Solid waste disposal sites
Trade waste Waste generated by a commercial process or operation, including construction and demolition waste. Trade waste is often a term used by a number of local authorities in relation to collection services they provide for commercial and industrial waste.
WBCSD World Business Council for Sustainable Development
WEEE Waste Electrical and Electronic Equipment
WRAP Waste & Resources Action Programme
WRATE Waste and Resources Assessment Tool for the Environment
WRI World Resources Institute


