Page 1
Measuring service quality of online banking in China
Information Systems Science
Master's thesis
Yitian Zhang
2013
Department of Information and Service EconomyAalto UniversitySchool of Business
Powered by TCPDF (www.tcpdf.org)
Page 2
AALTO UNIVERSITY SCHOOL OF BUSINESS ABSTRACT
Department of Information and Service Economy 16.09.2013
Master’s Thesis
Yitian Zhang
ABSTRACT
Objectives of study:
The objective of this thesis is to develop a multiple item scale for measuring service quality of
online banking in Bozhou City, Anhui Province, China. Briefly speaking, the first theoretical
objective of this study is to discuss concept e-service quality as well as related e-service quality
models, especially E-S-QUAL/E-RecS-QUAL (Parasuraman et al. 2005).The second objective is
to define and establish one suitable multiple e-service item scale for China with the help of E-S-
QUAL/E-RecS-QUAL model and other related models. The objective of empirical part is to get
the refined measurement scale for online banking service through data collection and analysis in
Bozhou City, Anhui Province, China.
Academic background and methodology:
Service quality plays an important role as competitive weapon and a significant differentiator for
many service organizations (Parasuraman & Zeithaml, 1988), involving e-banking industry.
According to Wang et. al (2003), good e-service quality offering is the key issue to survive in the
intensively competitive banking market, especially maintain customer satisfaction. As a result of
this phenomenon, a good understanding of service attributes that customers use to evaluate
online banking service quality is needed for banks so that the performance of e-service is able to
be monitored and immediate adjustments and improve can be done as soon as possible.
In this study, an overview of service quality (including e-service quality) and related literature is
discussed, especially in the context of online banking industry that is taken as the case subject.
Moreover, the study adopts E-S-QUAL/E-RecS-QUAL scale (Parasuraman et al. 2005) to
estabilish a suitable multiple e-service item scale for measuring online banking in China. The
target group for this study is limited to young and middle aged people between 19-39, e.g.
university students etc. Survey sending and gathering is chosen as data collection for this thesis.
Findings and conclusions:
Through the process of data collection and factor analysis in the empirical part, the refined scale
for measuring online banking in China was identified, involving 3 dimensions and 14 items:
customer service, privacy and preferential and reliable treatment. This finding indicated that the
dimensions and items from E-S-QUAL/E-RecS-QUAL needed to be reorganized and
reinterpreted for measuring online banking in Bozhou City of China.
Key words: online banking, service quality, E-S-QUAL/E-RecS-QUAL
Page 3
I
TABLE OF CONTENTS
1. INTRODUCTION ....................................................................................................... 1
1.1. Background information .............................................................................................. 1
1.2. Research objectives and methodology ......................................................................... 3
1.3. Thesis structure ............................................................................................................ 4
2. LITERATURE REVIEW ............................................................................................ 6
2.1. Explosive development of online banking in China .................................................... 6
2.2. Defining online banking............................................................................................... 9
2.3. Service quality............................................................................................................ 10
2.3.1. Traditional service quality ......................................................................................... 11
2.3.2. Online service quality ................................................................................................ 14
2.4. Service quality in banking industry ........................................................................... 20
2.4.1. Service quality in traditional banking ........................................................................ 20
2.4.2. Service quality in online banking ............................................................................... 20
3. THEORETICAL MODEL ......................................................................................... 22
3.1. Preliminary theoretical model .................................................................................... 22
3.2. Summary of the theoretical framework ..................................................................... 27
4. RESEARCH METHOD ............................................................................................. 34
4.1. Research approach ..................................................................................................... 34
4.2. Data collection ........................................................................................................... 35
4.3. Target group ............................................................................................................... 36
Page 4
II
4.4. Survey scales .............................................................................................................. 38
4.5. Analysis methods of the survey ................................................................................. 39
4.5.1. Item-to- total correlation and cronbach’s alpha test of reliability .............................. 39
4.5.2. Factor analysis............................................................................................................ 40
4.5.3. Reliability and validity ............................................................................................... 41
5. RESULT..................................................................................................................... 43
5.1. Descriptive analysis ................................................................................................... 43
5.1.1. Summary of demographic information ...................................................................... 43
5.1.2. Analysis concerning the information of using online banking as a user ................... 46
5.2. Cronbach’s alpha test of reliability ............................................................................ 50
5.3. Scale reduction ........................................................................................................... 52
5.4. Reliability and validity ............................................................................................... 69
5.4.1. Reliability ................................................................................................................... 69
5.4.2. Validity....................................................................................................................... 69
5.5. Summary of open questions ....................................................................................... 70
5.6. Summary .................................................................................................................... 71
6. DISCUSSION AND CONCLUSION ........................................................................ 72
6.1. Theoretical and empirical contribution ...................................................................... 72
6.2. Managerial recommendations .................................................................................... 75
6.3. Limitations and further research ................................................................................ 76
Page 5
III
REFERENCES ............................................................................................................................. 78
APPENDICES .............................................................................................................................. 86
Appendix 1 Development of online banking in China .............................................................. 86
Appendix 2 SERVQUAL .......................................................................................................... 87
Appendix 3 Cronbach’s Alpha Test of Reliabilty for the original model ................................. 88
Appendix 4 Cronbach’s Alpha Test of Reliabilty for the refined model .................................. 90
Appendix 5 CFA ....................................................................................................................... 92
Appendix 6 Correlation matrix of the refined service quality scale items ................................ 93
Appendix 7 Survey on Measuring Service Quality in Online Banking .................................... 94
Page 6
IV
LIST OF FIGURES
Figure 1 Transaction Scale of Private Internet Banking 2007-2014 ...................................................... 8
Figure 2 Online banking user scale .......................................................................................................... 8
Figure 3 Classification of online banking services (Centeno, 2003) ..................................................... 10
Figure 4 Users of internet banking .......................................................................................................... 37
Figure 5 Users of internet banking (occupation distribution) .............................................................. 37
Figure 6 Users’ selection of online banks ................................................................................................ 46
Figure 7 Frequency of using online banking services ............................................................................ 46
Figure 8 Reasons for using online banking services .............................................................................. 47
Figure 9 The most frequently used services of online banking ............................................................. 47
Figure 10 Time of using online banking.................................................................................................. 48
Figure 11 Information channel ................................................................................................................ 48
Figure 12 The importance of service quality attributes ........................................................................ 49
Page 7
V
LIST OF TABLES
Table 1 Review of traditional service quality models ............................................................................ 12
Table 2 Review of the main studies of online-perceived service quality .............................................. 17
Table 3 Dimensions of perceived e-SQ .................................................................................................... 23
Table 4 E-S-QUAL scale .......................................................................................................................... 25
Table 5 E-RecS-QUAL scale .................................................................................................................... 25
Table 6 Comparison between E-SERVQUAL instrument in 2000 and E-SQ (including E-S-QUAL
and E-RecS-QUAL scales in 2005............................................................................................................ 26
Table 7 Differences between E-SERVQUAL (2000), E-S-QUAL/E-Rec S-QUAL (2005) and the
revised e-SQ scale for this study .............................................................................................................. 29
Table 8 Internet bank service quality ..................................................................................................... 30
Table 9 Gender distribution ..................................................................................................................... 43
Table 10 Age distribution ......................................................................................................................... 43
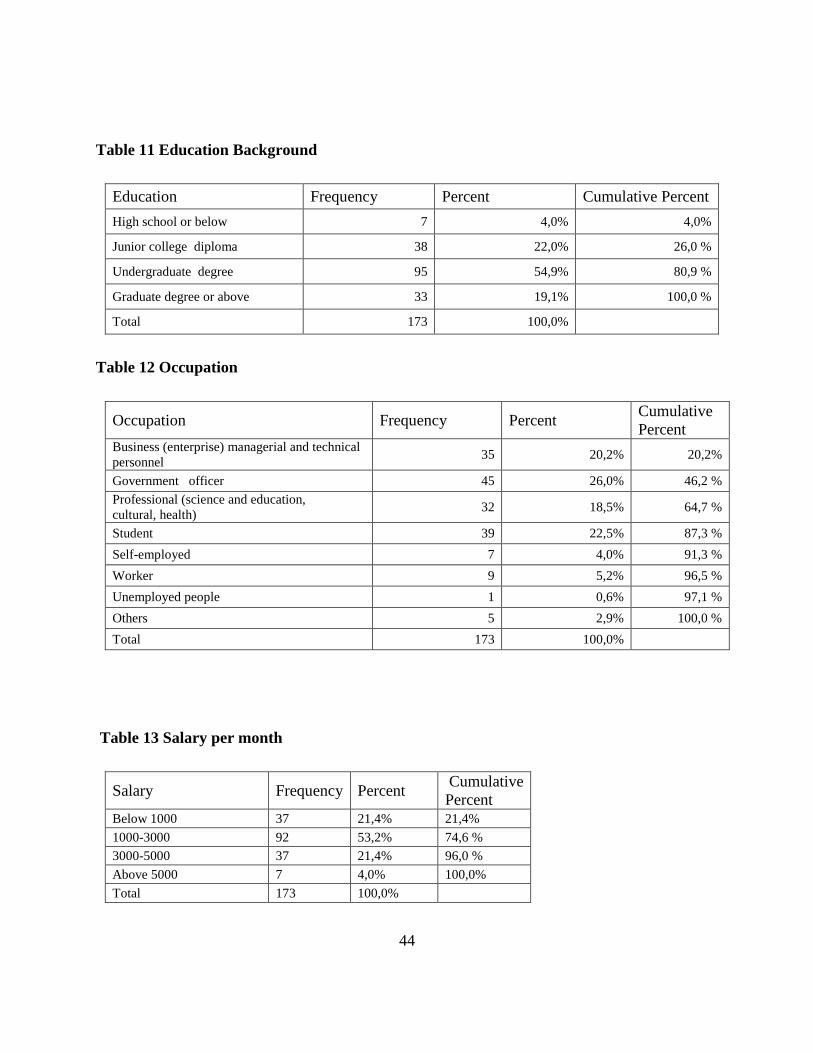
Table 11 Education Background ............................................................................................................. 44
Table 12 Occupation ................................................................................................................................. 44
Table 13 Salary per month ....................................................................................................................... 44
Table 14 Cronbach’s Alpha Test ............................................................................................................. 51
Table 15 Cronbach’s Alpha Test of Reliability ...................................................................................... 52
Table 16 Item-Total Statistics ................................................................................................................. 53
Page 8
VI
Table 17 Item-to-total ............................................................................................................................... 55
Table 18 KMO and Bartlett's Test .......................................................................................................... 56
Table 19 Principal Component Analysis for the first time .................................................................... 57
Table 20 Rotated component matrixa ...................................................................................................... 59
Table 21 Second round of PCA ................................................................................................................ 61
Table 22 Second round rotated component matrixa .............................................................................. 62
Table 23 Third round of PCA .................................................................................................................. 63
Table 24 Third rotated component matrixa ............................................................................................ 64
Table 25 Fourth round of PCA ................................................................................................................ 65
Table 26 Fourth rotated component matrixa .......................................................................................... 66
Table 27 Refined scale for online banking services in China ................................................................ 68
Table 28 Reliability Statistics for refined scale ...................................................................................... 69
Table 29 Differences among E-SERVQUAL, revised e-SQ scale and the refined scale ..................... 74
Page 9
1
1. INTRODUCTION
1.1. Background information
One of the technologies in 21st century that has brought changes almost in every aspect of our
life is digital revolution. With the rapid development and wide application of modern
information and communication technology, the power of internet and World Wide Web is
becoming increasingly significant in our daily life. Nowadays, more and more people prefer to
use self-service technology rather than traditional services because internet technology can bring
convenience and save time. Speak distinctly, but without exaggeration, internet technology is
considered to be the third innovation wave after the first two revolutions: agricultural and
industrial revolution (Khan &Mahapatra*, 2009). Needless to say, we have stepped into the era
of information economy. Specifically speaking, e-commerce is the main and popular form
existing in growing industry of 21st century (Kenova V. and Jonasson P. 2006).
With the rapid development of e-commerce in the era of internet-based network economy, banks
have established new services and expanded more accessible business online, namely online
banking which is following information economy trend. In fact, since the first online banking
service was established by Stanford Federal Credit Union (SFCU) in October 1994 (Business
Wire, 1995), online banking has spread rapidly and became popular around the world. As time
goes by, online banking services have been carried out in many banks of China, such as four
representative state-owned banks: Bank of China, Agricultural of China, Industrial and
Commercial Banks of China ltd. and China Construction Bank etc. In the past few years, the
popularity of online banking has been increased all the time, especially in China. As known to us
all, online banking has been developed for around 10 years with rapid growth of internet banking
users. According to the figure shown from Enfodesk, during the fourth quarter of 2010, China’s
online banking market turnover has reached 173.70 trillion RMB (Yuan), an increase of 17, 6%
comparing with the third quarter of 2010. The market turnover of the whole year 2013 has
reached 553.75 trillion RMB. By the end of 2010, China’s online banking marketing has over
300 million registered users. Therefore, there is no doubt that the trend of online banking
Page 10
2
development cannot be halted and is becoming the new hot spot for banks’ marketing strategy
(Zhao, 2010), especially in China.
Online banking services are becoming mutually attractive for banks and users. From the banks’
perspective, online banking helps them to establish and keep close contact with customers, thus
cut the operating costs and achieve much better financial performance (Zaman,
http://www.arraydev.com/commerce/jibc/2011-08/KhalidZAMAN.pdf, 27.04.2013). From the
customers’ perspective, online banking is becoming an attractive way to provide them
transaction convenience, the round-the-clock availability and avoidance of long time waiting
queues (Meuter et Al. 2000). Currently, different types of services function are available online
that e-banking can offer, like balance inquiries, payment of utility bills and account transfers etc.
when users send information request or conduct online banking transaction via internet instead of
physical visiting to banking department, (Daniel, 1999; Mols, 1998; Sathye, 1999). What’s more,
it is vital to retain the customers in the internet banking space as the switching cost is
significantly lower (Reichheld& Schefter, 2000). In other words, customer-orientated services
play very important roles for competitive market. Good online banking services are becoming
competitive advantage in retailing banking services, involving retaining e-customers.
In order to keep the original users, online banking providers should put themselves in their
customers’ shoes. Only customers’ perception and assessment of online banking services quality
they offered can be understood, then they probably could provide what users’ really needs to
meet customers’ satisfaction. E-service quality is an important factor in determining failure and
success of e-commerce business (Zavareh et al. 2012). Business that have already carried out
online services and been succeed in offering e-services are beginning to realize the important
role that e-services quality plays in addition to low price and web presence (Yang,
2001;Zeithaml, 2002), including online banking. According to Berry, Parasuraman and Zeithaml
(1988), service quality plays an important role as competitive weapon and a significant
differentiator for many service organizations. As a result, service provider including banking
industry should recognize the importance to utilize good service quality in order to distinguish
itself from others.
Page 11
3
From the mentioned above, good e-service quality offering is the key issue for banking to
survive in the intensively competitive banking market, especially maintain customer satisfaction
(Wang et Al. 2003). As a result of this phenomenon, a good understanding of service attributes
that customers use to evaluate online banking service quality is needed for banks so that the
performance of e-service is able to be monitored and immediate adjustments and improve can be
done as soon as possible.
Currently, there are a lot of studies that have been conducted about the measurement of service
quality dimensions of brick and mortar banks, however, there are very few researches about
service quality scale measures in online banking (Cai &Jun, 2001). Online banking, known as
internet banking or e-banking, refers to “the use of technology which allows customers to
perform banking transactions electronically without visiting brick and mortar institutions (Sethi
& Bhatia, 2008) while traditional banking performs services by face-to-face interaction between
cusomters and employees of banks. As can be seen that the most significant difference between
traditional banking and online banking is the interaction between customers and employees of
banks. In other words, the contact and interaction between users and providers is real-time face
to face for traditional banking, while the other one is impersonal. Therefore, it is necessary and
needed for e-banking industry to have a good knowledge of customers’ evaluation and
perception of e-service quality and explore the suitable e-SQ scales, especially in China
mainland. Therefore, it is my intent to show how E-S-QUAL/E-RecS-QUAL can be used to
construct the suitable e-SQ measurement scale for online banking service in Bozhou City of
China.
1.2. Research objectives and methodology
The objective of this thesis is to develop a multiple item scale for measuring service quality of
online banking in Bozhou City of China. In other words, the research question could be defined
as follows:
Which service quality dimensions should banks take in the consideration when assessing the
quality of their online banking services in Bozhou City of China?
Page 12
4
Briefly speaking, the main objectives of this thesis can be described separately as following.
Objectives of theoretical part are:
To have a discussion of concept e-service quality and related e-service quality models,
especially E-S-QUAL/E-RecS-QUAL proposed by Parasuraman et al.(2005)
To define and establish the suitable multiple e-service item scale based on E-S-QUAL/E-
RecS-QUAL model and other related models.
Objective of practical part is to get the refined measurement scale for online banking service
through data collection and analysis.
The target group for this study is limited to the young and middle age group, e.g. university
students or etc. Primary data collection is the data source for this thesis. Moreover, survey, which
is the cost-efficient approach to collect the empirical data, has been chosen for this study.
Through the process of data collection and factor analysis in the empirical part, the refined scale
for measuring online banking in China was identified, involving 3 dimensions and 14 items:
customer service, privacy and preferential and reliable treatment. In addition, the finding
indicated that the dimensions and items from E-S-QUAL/E-RecS-QUAL needed to be
reorganized and reinterpreted for measuring online banking in Bozhou City of China.
1.3. Thesis structure
This thesis is divided into 6 Chapters. First chapter is the brief introduction, including
background information that could be explained as my motivation for the thesis, objectives and
methodology.
The second chapter shows the literature review for this study. One aspect is to provide the
information of online banking development, online banking users’ distribution etc. in China, as
well as the definition of online banking, concept of service quality and the related models
(including e-service quality). Then discussion of service quality in both contexts of online
Page 13
5
banking and traditional banking continues with importance attached to the former one. The third
chapter presents the preliminary theoretical model E-S-QUAL/E-RecS-QUAL proposed by
Parasuraman et al. (2005) as well as our revised e-service quality scale for online banking in
China. The fourth chapter sums up the main methods using in this thesis, including research
approach, data collection and survey scales as well as the analysis methods of the survey.
The fifth chapter is the discussion of the research result based on the questionnaires returned.
Finally, the sixth chapter is the conclusion and key points for the previous chapters of the thesis.
This final chapter focuses on the main contributions of this study, summarizing the delivery of
theoretical part and empirical part as well as the suggestions and recommendation for the future
development and improvement of online banking services in China.
Page 14
6
2. LITERATURE REVIEW
Firstly, the current status of online banking in China will be discussed in this chapter. Secondly,
definition of online banking, concept of service quality and the related models (including e-
service quality) continues. Thirdly, discussion of service quality in both contexts of online
banking and traditional banking continues, especially focuses on the former one.
2.1. Explosive development of online banking in China
First aspect focuses on the explosive development of internet banking of China since this service
began to carry out. Currently, banks are trying to improve and enhance their online services
under the pressure of fierce competition in Chinese market. At the same time, more and more
customers are taking full advantage of online services in order to save time to live in a much
easier and flexible way, gain lower fee e.g. transaction fees. As can be seen, Information
Economy era in China comes much later than some other developed countries in extending the
internet to business. Fortunately, the domestic banks in China have been keenly aware of the
importance of carrying out services of online banking and extending new services to get more
customers, especially retain the old customers, and meanwhile increase the advantage of
competition.
In 1996, Bank of China (BOC) started to make an investment into the development of online
banking services that means that online banking in China was entering into the embryonic stage.
With the rapid spread of online banking, China Merchants Bank (CMB) opened its website soon
in 1997 and then offered the services of online banking in Shenzhen in 1998. Shortly thereafter,
BOC launched the online banking services, providing online information service, account
inquiry, bank transfer, online payment as well as fund collection etc. in 1999. After that, some of
other major commercial banks opened their online services one after another, such as China
Construction Bank, Industrial and Commercial Bank (ICBC), Agricultural Bank of China and so
on. Until the end of 2002, all stated-owned banks and join-banks have established online banking
Page 15
7
services that can show the popularity and the spread of this service. Moreover, 21 banks have
offered the service of online transaction among all these banks. After initial stage of
development between 1998 and 2002 mentioned above, the time for developing was coming in
2003. During the period from 2003 to 2010, banks have paid more attention toward band image
building, improvement and enhancement of products and services offering. In 2003, ICBC
opened the personal online banking service named “financing @ me”. Then, “e-banking” is the
own online banking services for Agricultural Bank of China to explored for image building.
Different banks had their own focus on the development of online banking to gain competitive
advantage. From 2010, the development of online banking stepped into a new stage: mature era.
The development of some major commercial banks has been stable and began to concentrate on
the tendency of internationalization. (iResearch,
http://wenku.baidu.com/view/b2b76b8a680203d8ce2f2451.html, 02.05.2013) The more detailed
development information about online banking services of major commercial banking in
different stage will show as below in Appendix 1.
From the iResearch (2011), the total transaction amount of personal internet banking was 96.5
trillion yuan in 2010, with growth at 80.6% year-on-year. As can be seen from Figure 1 shown as
below, the year-on-year growth rate remains stable from 2007 to 2014. This research was done in
2011. After 2010, it is expected that online banking will enter into the development of a mature
stage that will keep stable of increasing year-on-year rate.
According to iResearch (2011), not only transaction scale of personal online banking but online
banking user scale has been researched. As can be seen from the Figure 2, online banking users
was 260 million in 2010, increasing by 34.7% year-on-year. The year-on-year increase rate was
stable from 2008 to 2010. After 2010, it is expected that the year-on year rate will keep a steady
growth since online banking development will enter into greater maturity.
Page 16
8
Figure 1 Transaction Scale of Private Internet Banking 2007-2014
(iResearch, http://wenku.baidu.com/view/69e48544f7ec4afe04a1df2c.html, 03.05.2013)
Figure 2 Online banking user scale
(iResearch, http://wenku.baidu.com/view/69e48544f7ec4afe04a1df2c.html, 03.05.2013).
17.4 30.5 53.4 96.5
168.4
281
390.7
533.2
0
100
200
300
400
500
600
2007 2008 2009 2010 2011e 2012e 2013e 2014e
TOta
l tra
sact
ion
am
ou
nt
(tri
llio
n y
uan
)
Year
Transaction Scale of Private China's online Banking 2007-2014
1.39 1.93
2.6
3.3 3.82
4.32 4.78
0
1
2
3
4
5
6
2008 2009 2010 2011e 2013e 2013e 2014e
Tota
l use
r am
ou
nt(
10
0 m
illio
n)
Year
Online Banking User Scale 2008-2014
Page 17
9
As can be seen from the rapid development and popularity of online banking, it is easy to
understand why urgent concentration on topic service quality of online banking in China. In
order to have a better development for online banking in the future, service quality of online
banking can bring competitive advantage for banks as well as more convenience for consumers.
2.2. Defining online banking
Online banking which is known as internet banking or e-banking, refers to “the use of
technology which allows customers to perform banking transactions electronically without
visiting brick and mortar institutions (Sethi & Bhatia, 2008).” In other words, online banking
services are the services of banking offering delivered through internet instead of traditional
face-to-face providing. Accordingly, the online banking services can be offered anywhere and
anytime, hence bring a lot of convenience to users.
Moreover, not only can online banking provide the basic services, including accounts checking,
accounts transfer etc., but it also develops into a variety of directional services to meet the
diversified needs of users. It is very common phenomenon to see that almost all the services
provided by branches or even by mobile phone can achieve internet access nowadays. As can be
seen the Figure 3 shown as below, information technology helps banks to achieve the goal,
which is not only offering branch-based services from internet, but also the only online value
added services from internet. It means that online banking has its own unique services offering
that can be differentiated it from traditional services offering from branch, including services of
financial information menu, online load application, investment products (e.g. fund/bond
purchasing), other financing products (e.g. life or traffic insurance purchasing) as well as the
third party services (e.g. online tax payment, online bill payment) and other conveniences
products. (Centeno, 2003)
In all, the attraction for consumers to use online banking can explained mainly in the following
aspects: services offering anywhere and anytime, the round-the-clock availability and avoidance
of long time waiting queues, speed, low price etc. (Mattila et. al, 2002). Bank providers still face
Page 18
10
disadvantage and challenge in order to make profits despite benefits brought by online banking
services. Users are able to choose the service providers freely if their requirements are not met,
given that switching cost is becoming lower because of online banking service offering. As such,
it is really challenge for bank providers to deal with immediately, otherwise the original
customers would be lost. Accordingly, attraction for new coming customers is as important as
retaining the old ones. At this moment, service quality plays a very important role to deal with
the challenge. Good service deliveries are the assurance for meeting customer needs and retain
the customers.
Figure 3 Classification of online banking services (Centeno, 2003)
2.3. Service quality
As mentioned above, service quality is the key element to determine the success or failure of
business, including online banking. As a result, the concept of services, service quality, including
Page 19
11
e-service quality will be introduced in detail. In addition, the related models for traditional
service quality and e-service quality are also discussed in order to have a good understanding of
this paper.
2.3.1. Traditional service quality
As shown in the previous studies of definition and measurement of quality, most of these
researches have been conducted based on tangible products that are different from service
(Crosby, 1979; Garvin, 1983). Because of the unique feature, defining and measuring the quality
of service is in a different way. Fortunately, there has been a lot of research concentrating on
traditional service quality during the past few decades (Ennew, et AL., 1993; Zeithaml et Al.,
1996). Parasuraman et al. (1985) has summarized that service quality is not easy to define
coming from three specific characteristics of services, namely: intangibility, heterogeneity and
inseparability of production and consumption. Accordingly, service quality is described to be an
abstract and elusive construct (Parasuraman et al., 1985). There is no doubt that service quality is
even more difficult to define and evaluate comparing with goods quality.
Even though, service quality is defined and studied by many different researchers and
organizations (Gronroos, 1982; Lewis& Booms, 1993; Parasuraman et.al, 1988). American
Marketing Association defines service quality from two aspects: firstly, it refers to how the
services are delivered by the firm that can lead to the satisfaction from the customers; secondly,
it means excellent service quality delivered by firm resulting in meet or exceeds customers’
expectation. Gronroos (1982) developed the model of “Total Perceived Service Quality” which
he proposes that the comparison of what the customers’ expectation of services offering and their
experience of services delivered is the standard to evaluate service quality. Later, according to
Lewis and Booms (1993), “service quality is a measure of how well the service level delivered
matches customer expectations. Delivering quality service means conforming to customer
expectations on a consistent basis”. To sum up, service quality, perceived by consumers, comes
from the comparison between the expectation (i.e. what they think firms should offer) and
performance (e.g. what they experience and perceive the delivered services). In other words,
Page 20
12
service quality can be defined as the gap or difference between the services they expect and
perceive. Parasuraman et.al (1988, p. 15) have summarized based on previous research, service
quality is “the overall evaluation of a service firm that results from comparing that firm’s
performance with the customer’s general expectations of how firms in that industry should
perform”.
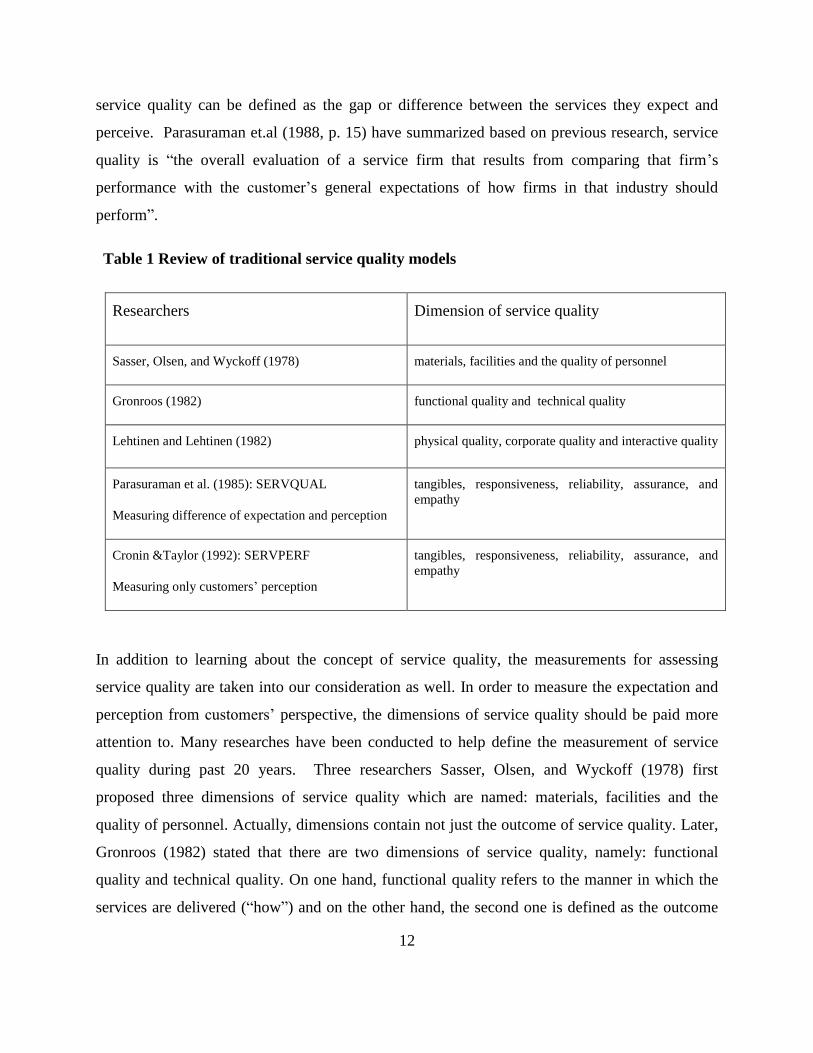
Table 1 Review of traditional service quality models
Researchers Dimension of service quality
Sasser, Olsen, and Wyckoff (1978) materials, facilities and the quality of personnel
Gronroos (1982) functional quality and technical quality
Lehtinen and Lehtinen (1982) physical quality, corporate quality and interactive quality
Parasuraman et al. (1985): SERVQUAL
Measuring difference of expectation and perception
tangibles, responsiveness, reliability, assurance, and
empathy
Cronin &Taylor (1992): SERVPERF
Measuring only customers’ perception
tangibles, responsiveness, reliability, assurance, and
empathy
In addition to learning about the concept of service quality, the measurements for assessing
service quality are taken into our consideration as well. In order to measure the expectation and
perception from customers’ perspective, the dimensions of service quality should be paid more
attention to. Many researches have been conducted to help define the measurement of service
quality during past 20 years. Three researchers Sasser, Olsen, and Wyckoff (1978) first
proposed three dimensions of service quality which are named: materials, facilities and the
quality of personnel. Actually, dimensions contain not just the outcome of service quality. Later,
Gronroos (1982) stated that there are two dimensions of service quality, namely: functional
quality and technical quality. On one hand, functional quality refers to the manner in which the
services are delivered (“how”) and on the other hand, the second one is defined as the outcome
Page 21
13
of the delivered services (“what”). In other words, how the services are delivered can be defined
as the process while what the services are delivered can be defined as outcome. According to the
research from Lehtinen and Lehtinen (1982), there are three dimensions for assessing the service
quality: physical quality, corporate quality and interactive quality. The first one, physical quality,
refers to physical entities such as facilities or equipment. The second one, corporate quality can
be understood easily and considered to be an important one as well which refers to corporate
image and reputation. The last one, interactive quality, means the interaction between consumers
and company as well as between some consumers with the other ones. To sum up, these studies
mentioned above found that the evaluation of service quality includes not only process but also
outcome. In other words, functional quality (process) and technical quality (outcome) are the two
dimensions of service quality from previous studies: “the process that the customer went through
to get to the outcome of the service” (Muyeed, 2012).
However, not only can this method mentioned above be used to evaluate the service quality,
there is also the other method which can be used to define the dimensions of services quality.
This method refers to a judgment of a given service by evaluating the specific features.
(Kenova& Jonasson, 2006) According to Schneider & White (2004, p.51), service quality can be
measured by “a judgment about a service’s overall excellence or superiority”. SERVQUAL
model is one of the most representative examples developed by Parasuraman et al. (1985).
Actually, this study from Parasuraman et al. has been considered to the most prominent in the
field of service quality items scale. SERVQUAL model, which is an instrument for measuring
the perceived service quality by comparing the services what consumers feel firms should offer
and the delivered services what they experience, has developed and purified from 10 dimensions
to five (tangibles, responsiveness, reliability, assurance, and empathy). In a more easily
understandable way, this service quality measurement that can be called disconfirmation method
has been developed according to the gap or difference between the expectation and perception
from consumers’ perspective. The detailed information about SERVQUAL will show as below
in Appendix 2.
SERVQUAL model is most widely used and popular for traditional service quality measurement,
but there have been some different ideas of evaluating perceived service quality in recent years.
Page 22
14
Instead of measuring the gap between customers’ expectation and perception, the method of
evaluating only the perception from consumers is considered to be reliable and more worthy
convinced. At this moment, SERVPERF developed by Cronin &Taylor (1992) is a good
example for supporting this idea. SERVPERF model that uses the same dimensions as
SERVQUAL is an instrument for measuring the perceived service quality based on only the
delivered services what consumers experience and perceive. Comparing with SERVQUAL
instrument mentioned above, the only difference depends on whether the customers’ expectation
of a given service is measured or not. Besides, there have been some other studies done by other
opponents. According to Dabhokar et.al (2000), the measurement only on the customers’
perception from delivered services is more superior to the disconfirmation method. It means that
measuring both customers’ expectation and perception cannot have a better understanding and
evaluation of their intension comparing with only measuring perception. In all, service quality
can be measured by evaluating the service performance.
As can be seen from the text mentioned above, service quality can be defined and measured in
different ways. Consequently, service quality is a multi-dimensional concept (Brady &Cronin.
2001).
Although a lot of researches have been done for service quality measurement, there is still a need
for further study relating more to e-service quality because of its specific characteristics that
traditional service models do not pay attention to. For example, five dimensions of SERVQUAL
model mainly concentrate on consumer-to-employee interaction, but not interaction between
consumer and website. There is no doubt that further study on online service quality
measurement should be done.
2.3.2. Online service quality
It is apparent that online service (e-service) is the web-based service delivered over the internet
which is different from traditional service delivering. In other words, the delivering of online
service depends on the information which is first gathered from consumers and then analyzed by
Page 23
15
providers (Rowley, 2006). As such, the needed and customized service can be offered. With the
rapid development of information technology, online service offering has already changed the
behavior and habit of people in their daily life, especially means of communication between
firms and consumers. The main attraction of online service offering is not only because of its
key roles played in determining the success or failure of e-commerce from providers’ perspective,
but also as a result of its provision of excellent experience for consumers in terms of information
flow interaction (Yang et al.,2001; Santos, 2003).
There have been many several studies on online services. Different scholars defined e-service in
different ways, but different views express the same meaning. Zeithamal et. al (2000)
conceptualized e-service as web-based service delivered over the internet. According to Ghosh
et al. (2004), online service is defined as an interactive information service. As known to us all,
e-service delivery is not face-to face interaction between firms and consumers, but interactive
information flow via technology which plays the role as a mediator, e.g. websites. As such,
online service offering between service providers and consumers have to be fully dependent on
the information technology. Accordingly, Rowley (2006) stated that e-service is described as the
performance or effects whose delivery entirely relies on information technology. Overall, e-
service quality refers to interactive, web-based customer service delivered via information
technology which offered by provider according to customers’ needs; moreover, the offering can
maintain and consolidate the relationship between customers and firms (de Ruyter et al., 2001).
Learning about the concept of online service, it will help to have a better understanding of online
service quality. According to Santos (2003), e-service quality is described as overall judgments
and assessments concerning delivering of e-service from customers’ perspective in the virtual
marketplace. Zeithaml et al. (2000) study have defined e-service quality as the degree to which a
website can promote the whole process of online shopping, including effective and efficient
shopping, purchasing as well as services and products delivery. The competitive advantage is
one of important benefit that good online service quality can offer for e-commerce. To sum up,
e-service quality is considered to have the great potential to bring the benefits from the
perspective of overall strategic as well as to improve running efficiency and profitability (Cronin,
2003).
Page 24
16
Nowadays, online service quality plays a very important role in the era of information economy.
With the popularity of online banking offering in e-commerce, the necessity to develop the
scales for e-service evaluation has been coming to the virtual word. In fact, some of the
researches have been done to define the measurement scales of e-service quality in order to
better further development for e-commerce. In a more easily understandable way, those e-service
quality measurement scales can be divided into two categories according to their research
priorities and tendencies: website design quality and e-retailing service quality.
Page 25
17
Table 2 Review of the main studies of online-perceived service quality
Researchers Dimensions
Website design( interface) quality
Loiacono et al. (2000) WebQual: informational fit to task, interactivity, trust, response time, design appeal,
intuitiveness, visual appeal, innovativeness, flow (emotional appeal), integrated
communication, business process, substitutability
Barnes and Vidgen (2002) WebQual 4.0: usability, design, information, trust, and empathy
Yoo & Donthu (2001) ease of use, aesthetic design, processing speed and security
Liu &Arnett (2000) quality of information, service, security, playfulness perceived by consumers and
design of the website
Yang et al. (2004) usability, usefulness, adequacy of information, accessibility and interaction
van Riel et al. (2001) Core service, supporting services, user interface
Online retailing services
Wolfinbarger & Gilly
(2003)
eTailQ: website design, reliability/fulfillment, privacy/security and customer service
Madu and Madu(2002) performance, features, structure, aesthetics, reliability, storage capacity, serviceability,
security and system integrity, trust, responsiveness, product/service differentiation and
customization, web store policies, reputation, assurance and empathy
Zeithaml, Parasuraman &
Malhotra. (2000)
E-SQ: reliability, responsiveness, access, and flexibility, ease of navigation, efficiency,
assurance/trust, security/privacy, price knowledge, site aesthetics and
customization/personalization
Parasuraman, Zeithaml &
Malhotra.(2005)
E-S-QUAL: efficiency, fulfillment, system availability, privacy
E-RecS-QUAL :responsiveness, compensation and contact
Cox and Dale (2001) Accessibility, communication, credibility, understanding ,appearance, availability
Page 26
18
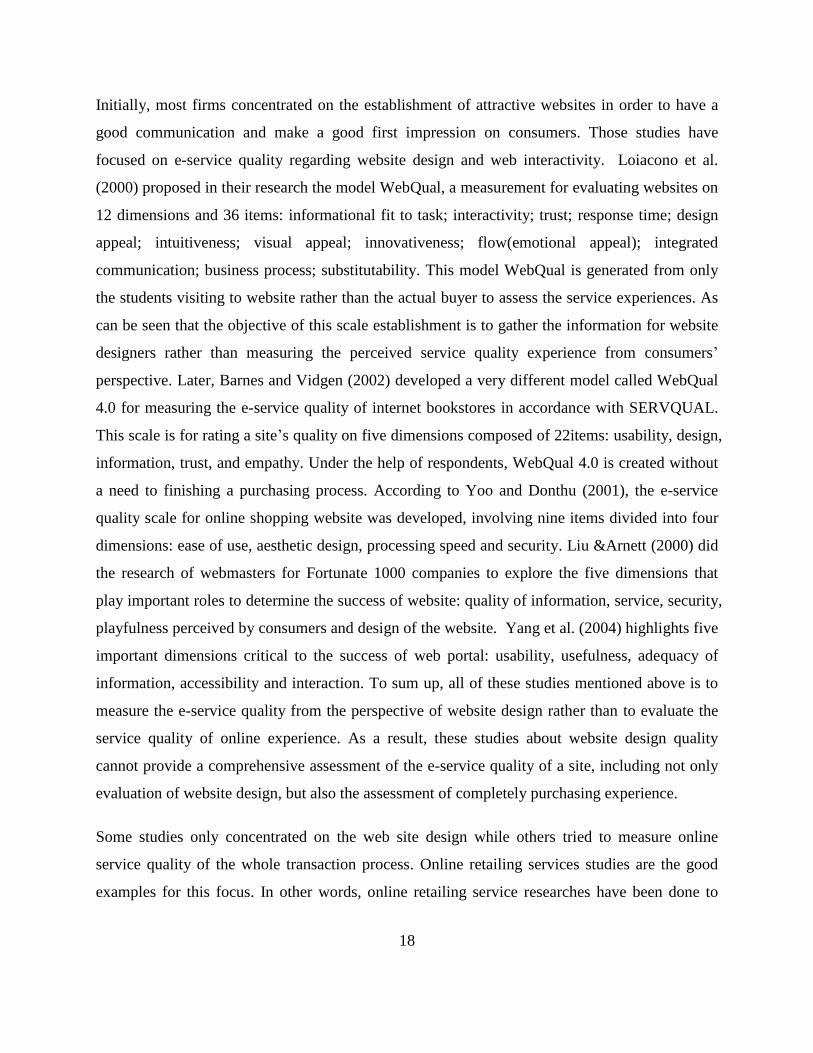
Initially, most firms concentrated on the establishment of attractive websites in order to have a
good communication and make a good first impression on consumers. Those studies have
focused on e-service quality regarding website design and web interactivity. Loiacono et al.
(2000) proposed in their research the model WebQual, a measurement for evaluating websites on
12 dimensions and 36 items: informational fit to task; interactivity; trust; response time; design
appeal; intuitiveness; visual appeal; innovativeness; flow(emotional appeal); integrated
communication; business process; substitutability. This model WebQual is generated from only
the students visiting to website rather than the actual buyer to assess the service experiences. As
can be seen that the objective of this scale establishment is to gather the information for website
designers rather than measuring the perceived service quality experience from consumers’
perspective. Later, Barnes and Vidgen (2002) developed a very different model called WebQual
4.0 for measuring the e-service quality of internet bookstores in accordance with SERVQUAL.
This scale is for rating a site’s quality on five dimensions composed of 22items: usability, design,
information, trust, and empathy. Under the help of respondents, WebQual 4.0 is created without
a need to finishing a purchasing process. According to Yoo and Donthu (2001), the e-service
quality scale for online shopping website was developed, involving nine items divided into four
dimensions: ease of use, aesthetic design, processing speed and security. Liu &Arnett (2000) did
the research of webmasters for Fortunate 1000 companies to explore the five dimensions that
play important roles to determine the success of website: quality of information, service, security,
playfulness perceived by consumers and design of the website. Yang et al. (2004) highlights five
important dimensions critical to the success of web portal: usability, usefulness, adequacy of
information, accessibility and interaction. To sum up, all of these studies mentioned above is to
measure the e-service quality from the perspective of website design rather than to evaluate the
service quality of online experience. As a result, these studies about website design quality
cannot provide a comprehensive assessment of the e-service quality of a site, including not only
evaluation of website design, but also the assessment of completely purchasing experience.
Some studies only concentrated on the web site design while others tried to measure online
service quality of the whole transaction process. Online retailing services studies are the good
examples for this focus. In other words, online retailing service researches have been done to
Page 27
19
constitute a comprehensive evaluation of online service quality, including assessment of the
actual online purchasing experience. In the context of online service experience, Zeithaml et al.
(2000) study have defined e-service quality as the degree to which a website can facilitate the
whole process of online shopping, including effective and efficient shopping, purchasing as well
as services and products delivery. As a result, this type of measurement is used to evaluate the
users’ experiences before (which can be understood as evaluation of website quality), during and
after the transaction process.
Wolfinbarger & Gilly (2003) developed eTailQ, a scale including 14 items which are divided
into four factors: web site design (including items related to website design e.g. color, front, and
attributes associate with product selection and customization as well), reliability/fulfillment
(involving on-time delivery as well as accurate representation of the products and accurate
orders), privacy/security(confidence in using this website), and customer service (interest and
willingness for personnel to provide help and deal with problems as well as quick response to
inquiries). As can be seen from this model, the whole transaction process is involved into the
assessment of perceived e-service quality, especially including fulfillment and customer service.
Then Madu and Madu (2002) presented a scale consisting of 15 dimensions based on
SERVQUAL: performance, features, structure, aesthetics, reliability, storage capacity,
serviceability, security and system integrity, trust, responsiveness, product/service differentiation
and customization, web store policies, reputation, assurance and empathy. Besides, Zeithaml et
al. (2000) made the research of e-service quality measurement, a scale for rating online shopping
experience on 11 dimensions: reliability, responsiveness, access, and flexibility, ease of
navigation, efficiency, assurance/trust, security/privacy, price knowledge, site aesthetics and
customization/personalization. Later, Zeithaml et al. revised this scale based on combination of
different kinds of concepts of online service quality (Loiacono, et al., 2000; Yoo and Donthu,
2001; Wolfinbarger and Gilly, 2002, 2003). The new revised scale E-S-QUAL/E-RecS-QUAL
including E-S-QUAL and E-RecS-QUAL was lowered the dimension to seven: efficiency,
fulfillment, system availability, privacy, responsiveness, compensation and contact (Parasuraman
et al., 2005). In fact, there are still some other studies related the same focus of online service
Page 28
20
quality measurement, such as four dimensions developed by Cox and Dale (2001). In order to
have a more clear understanding of e-service measurement scale, Table 2 will list all of them.
2.4. Service quality in banking industry
2.4.1. Service quality in traditional banking
Many of the researches have been done for traditional banking service quality measurement
based on the model SERVQUAL. The research done by Cowling & Newman(1995) using
SERVQUAL scale in one bank found out that the highest difference between customers’
expectation and perception was reliability, responsiveness, empathy, and the lowest for tangibles.
According to the study carried out by Johnston (1995), there were 18 service quality dimensions
found to evaluation the service quality by examining the customers’ perception: access,
aesthetics, attentiveness/helpfulness, availability, care, cleanliness, comfort, commitment,
communication, competence, courtesy, flexibility, friendliness, functionality, integrity, reliability,
responsiveness and security.
Moreover, Bahia and Nantel (2000) proposed another service quality measurement involving 31
attributes divided in six dimensions: effectiveness, assurance, access, price, tangibles, service
portfolio and reliability. The research was done for retailing banks. Lastly, according to the
research conducted by Oppewal and Vriens (2000), there were 28 items including four
dimensions found to evaluate the service quality of retail banking: accessibility, competence,
accuracy and friendliness as well as tangibles. As can be seen from this study, the most important
element among the four dimensions from customers’ perspective was proved to be accuracy and
friendliness. Next in importance to determine customers’ preference turned out to be competence,
tangibles and accessibility.
2.4.2. Service quality in online banking
Nowadays, with the increasing importance of the information and communication technology,
especially for financial services, researchers and managers have become interested in service
quality measurement of online banking services (Jayawardhena, 2004). Different researches have
Page 29
21
been done regarding different contexts. For example, according to the research carried out by
Jun and Cai (2001), they developed the scale for online banking service quality measurement
divided into three main categories using content analysis: customer service quality, online
system quality as well as banking service product quality. However, in this research, those 17
items were not validated empirically by collecting data from users. Besides, according to
tracking online banking consumers’ usage patterns, the study done by Broderick and
Vachropompuk (2002) found that the most important elements that could have an impact on
service quality evaluation were cues in the service setting, key events in the service encounter
and level and nature of customer participation. Unfortunately, this measurement mentioned
above is still abstract rather than a precise and testable dimension of online service quality.
Fortunately, other researchers conducted more studies in different countries by applying the
formal procedure mentioned detailed in Parasuraman et al., which was used for empirically
online service quality scale validation of banking industry. As can be seen from a lot of examples
mentioned as below. According to the study done by Jayawardhena (2004) in UK, a multiple-
item scale for evaluating e-service quality of online banking was conducted based on revised
SERVQUAL (Parasuraman et al., 1988)model for the internet context, including five dimensions
composed of 21 items: access, website interface, trust, attention , credibility as well. In addition,
Siu & Mou (2005) proposed a measurement scale based on E-SQ instrument (Zeithaml et al.,
2000) by sampling 195 online bank users in Hong Kong, and finally identified four dimensions:
credibility, efficiency, problem handling, and security. Moreover, Ho and Lin (2010) developed
the online banking scale by sampling 500 e-bank users in Taiwan, and identified five dimensions
in the end: efficiency, fulfillment, system availability, privacy, contact, compensation, site
aesthetics, and customization. As can be seen from the reviews mentioned above, different
researches have been done for online banking service quality measurement based on different
scales of traditional service quality (SERVQUAL) and online service quality. In conclusion,
there have already been some researches done for measuring online banking service quality,
however there is still a lack of comprehensive scale in e-banking service measurement is still
shorted. There is a need for further research done for this area, especially for cultural difference.
Page 30
22
3. THEORETICAL MODEL
3.1. Preliminary theoretical model
In this thesis, the model E-S-QUAL/E-Rec S-QUAL developed by Parasuraman et al.(2005) was
applied and modified for measurement establishment in online banking services of Chinese
market. E-S-QUAL/E-Rec S-QUAL was established based on previous literature reviews of
online service quality, involving not only interaction between consumers with website interface,
but also the purchasing process and post interaction services as well. Accordingly, E-S-QUAL/E-
Rec S-QUAL is considered to be one of the most comprehensive measurement to evaluate online
services, involving the users’ experiences before (which can be understood as evaluation of
website quality), during (purchasing process) and after the transaction process (after-sales
service). E-S-QUAL/E-Rec S-QUAL was chosen as the theoretical model of this thesis.
At the first stage, the initial e-SQ scale was formed from 11 dimensions developed by Zeithaml
et al. (2000) which are: reliability, responsiveness, access, flexibility, ease of navigation,
efficiency, assurance/trust, security/privacy, price knowledge, site aesthetics and customization
/personalization. The detailed information and description of perceived e-SQ is shown below
Table 3.
Page 31
23
Table 3 Dimensions of perceived e-SQ
E-Service Quality Dimension Description
Reliability Correct technical functioning of the site and the
accuracy of service promises (having items in stock,
delivering what is ordered, delivering when
promised), billing, and product information.
Responsiveness Quick response and the ability to get help if there is a
problem or question
Access The ability to get on the site quickly and to reach the
company when needed
Flexibility Choice of ways to pay, ship, buy, search for and
return items
Ease of navigation The site contains functions that help customers find
what they need without difficulty, possesses a good
search engine, and allows the customer to maneuver
easily and quickly back and forth through the pages
Efficiency The site is simple to use, structured properly,
requires minimum of information to be input by the
customer
Assurance/trust The confidence the customer feels in dealing with
the site and is due to the reputation of the site and the
products or services it sells as well as clear and
truthful information presented
Security/privacy The degree to which the customer believes the site is
safe from intrusion and personal information is
protected
Price knowledge The extent to which the customer can determine
shipping price, total price and comparative prices
during the shopping process
Site aesthetics The appearance of the site
Customization/personalization How much and how easily the site can be tailored to
individual customers’ preferences, histories and
ways of shopping
Source: Parasuraman, A., Zeithaml, V. and Malhotra A. (2005), “E-S-QUAL: A Multiple-
Item Scale for Assessing Electronic Service Quality”
As can be seen from Table mentioned above, E-SERVQUAL (2000) model is very similar to that
of model SERVQUAL although it has new added dimensions that make differences. The service
quality dimensions of reliability, responsiveness, access, assurance/trust (credibility),
Customization/personalization plays important roles in both internet and traditional service
contexts. Quality dimensions of assurance, responsiveness and security express the same
meaning in both contexts while reliability and access are different. In other words, those two
Page 32
24
dimensions of reliability and access for online services have different attributes underlying which
concentrate on specific online issues (Zeithaml et al., 2000). It is clear to see the difference
between different contexts in order to have a better understanding of e-service quality model. As
can be seen, other perceptual attributes that differs from traditional services, like flexibility, ease
of navigation as well as site aesthetics are related to technology, involving the aspects of website
design and user experience etc. The most important attribute that involved is price knowledge,
which is unique for online shopping studied by Zeithaml et al. 2000. This new feature will be
helpful for establishing our own service quality model.
Then scale reduction and data analysis were done later. Accordingly, the previous 11 dimension
was reduced and refined to 7 dimensions, involving E-S-QUAL scale and E-RecS-QUAL scale
(Parasuraman et al, 2005). E-S-QUAL is considered to be the core service quality measurement
scale while E-RecS-QUAL is for recovery scale. The detailed information and description about
the revised E-S-QUAL/E-Rec S-QUAL is shown as below Table 4 and Table 5.
After the stage of scale development, the newly revised instrument E-S-QUAL/E-Rec S-QUAL
was empirical tested by additional research for reassessment of scale reliability and validity. This
research was done by distributing questionnaires to users randomly who had visited the two
websites: amazon.com and walmart.com most often at that time.
Page 33
25
Table 4 E-S-QUAL scale
E-S-QUAL scale
Dimension Description
Efficiency The ease and speed of accessing and using the website
Fulfillment The extent to which the site’s promises about
order delivery and item availability are fulfilled
System Availability The correct technical functioning of the site
Privacy The degree to which the site is safe and protects
customer information
Source: Parasuraman, A., Zeithaml, V. and Malhotra A. (2005), “E-S-QUAL: A Multiple-
Item Scale for Assessing Electronic Service Quality”, p. 220
Table 5 E-RecS-QUAL scale
E-RecS-QUAL
Dimension Description
Responsiveness Effective handling of problems and returns through the
site
Compensation The degree to which the site compensates the
customers for problems
Contact The availability of assistance through telephone or
online representatives
To sum up, the first stage is the exploration study for dimension development, and another
two phases are the part for empirical data collection and analysis. After the empirical study, the
refined dimension scale is got. In order to capture a better picture of development of E-
SERVQUAL instrument, the comparison between dimensions of online service quality in 2000
and those in 2005 are presented in Table 6 as below clearly.
Page 34
26
Table 6 Comparison between E-SERVQUAL instrument in 2000 and E-SQ (including E-S-
QUAL and E-RecS-QUAL scales in 2005
E-SERVQUAL Instrument dimension
studied by Zeithaml, Parasuraman and
Malhotra (2000)
E-S-QUAL/E-Rec S-QUAL
further studied by Parasuraman, Zeithaml and
Malhotra (2002, 2005)
Reliability Fulfillment, System Availability
Responsiveness Responsiveness
Access Efficiency, contact
Flexibility
Ease of navigation Efficiency
Efficiency Efficiency
Assurance/Trust
Security/Privacy Privacy
Price Knowledge
Site aesthetics
Customization/personalization
Compensation
Source: Kenova V. and Jonasson P. (2006). Quality Online Banking Services, Technical Report,
Jonkoping International Business School.
Page 35
27
As can be seen from Table 6, Reliability means “correct technical functioning of the site and the
accuracy of service promises (having items in stock, delivering what is ordered, delivering when
promised), billing, and product information” (Parasuraman, 2000), involving dimensions of
fulfillment and system availability defined in 2002. Access refers to “the ability to get on the site
quickly and to reach the company when needed” (Parasuraman, 2000), involving dimension of
efficiency and contact defined separately in 2002. Besides, dimensions of flexibility, assurance,
price knowledge, site aesthetics as well as customization are pruned and reduced after the
empirical phases have been done. At the same times, dimension of compensation is added for
better customer service if the problems were happened to customers after transaction.
3.2. Summary of the theoretical framework
This paper have already discussed the concept of service, service quality (including
traditional service quality and e-service quality) as well as the related model of measuring
service quality, especially the related model that have been used in online banking services. The
most popular model SERVQUAL for measuring traditional service quality and E-S-QUAL/E-
Rec S-QUAL for e-service quality have been paid more attention to in this thesis mentioned
above in order to help to have a good understanding of the development of service quality from
traditional service to online service. After the comparison of these two models, the difference
between traditional service and online service can be understood in a better way, especially the
importance of service quality measurement. Besides, the development of service quality and the
changing situation with the increased popularity of online services could be explained and
understood by showing both traditional service quality and online service quality.
In this thesis, the author would like to use E-S-QUAL/E-Rec S-QUAL as a basis to help
establish and develop the suitable model for online banking service quality measurement in
China. Choosing this instrument is not only because of the popularity of its application but also
as a result of involvement of the whole process, such as before, during and after transaction
process. In other words, the post transaction service was paid more attention to. As mentioned
Page 36
28
before, E-S-QUAL/E-Rec S-QUAL model was developed by Zeithaml, Parasuraman and
Malhotra for online service quality scale measurement in 2005.
We all know that E-S-QUAL/E-Rec S-QUAL instrument is initially used for measuring online
service quality rather than concentrating on the special industry area: online banking service. It
means E-S-QUAL/E-Rec S-QUAL could not cover all the aspects of our research. As such, our
established model is not the same as E-S-QUAL/E-Rec S-QUAL instrument. Instead, the model
established in this study is revised based on E-S-QUAL/E-Rec S-QUAL instrument. In addition,
as is presented in Table 6, almost half of dimensions of online service quality from 2000 are not
covered in those from 2005. However, some of those discarded dimensions done in 2005 will be
taken into consideration for online banking industry in China. This is also the purpose for
learning the whole development process of E-S-QUAL/E-Rec S-QUAL instrument and doing
comparison between dimensions of 2000 and those of 2005. As a result, E-S-QUAL/E-Rec S-
QUAL is the basis for model establishment in this study. Besides, the other new dimensions will
be added into the model from other related literature review according to the needs of online
banking in China.
In this thesis, the dimensions of online banking service are composed of Efficiency, privacy,
responsiveness/contact, as well as assurance, empathy and website design. Some of the
dimensions: efficiency, privacy, responsiveness/contact are from the theoretical model E-S-
QUAL/E-Rec S-QUAL L used as a basis while others are from some other related models in
accordance with the needs of online banking services in China. The dimension: assurance is from
the first step development of E-SERVQUAL instrument developed in 2000. Empathy and
website design are the new dimensions added to the model in this study. As can be seen from
Table 7, the difference between E-S-QUAL/E-Rec S-QUAL and revised e-SQ is shown in details.
Besides, all the dimensions will be explained and shown in details in Table 8 that plays very
important roles for our questionnaires.
Page 37
29
Table 7 Differences between E-SERVQUAL (2000), E-S-QUAL/E-Rec S-QUAL (2005) and
the revised e-SQ scale for this study
E-SERVQUAL (2000)
E-S-QUAL/E-Rec S-QUAL
scale (, 2005)
The revised e-SQ scale
Reliability Fulfillment, System Availability _
Responsiveness Responsiveness Responsiveness/contact
Access Efficiency, contact Efficiency(EF3)
Flexibility Website Design (W1)
Ease of navigation Efficiency Efficiency
(EF1, EF2,EF4,EF5,EF6)
Efficiency Efficiency
Assurance/Trust Assurance
Privacy/Trust(P4)
Security/Privacy Privacy Privacy/Trust (P1,P2,P3,P5)
Price Knowledge _
Site aesthetics Website design(W2)
Customization/personalization Empathy(E1)
Compensation Compensation/
preferential treatment(C1,C2)
Page 38
30
Table 8 Internet bank service quality
Service quality
dimensions
Researchers Service quality attributes
Efficiency(6)
Parasuraman et.al (2005);
Ho&Lin (2010)
EF1.This site can process information and transaction
quickly;
Parasuraman et.al( 2005) EF2.A user can get the information from the website
that is needed easily and quickly;
Parasuraman et.al(2005);
Ho&Lin(2010)
EF3.It loads page quickly;
Parasuraman et.al(2005) EF4.It makes it easy to get anywhere on the site;
Kenova & Jonasson(2006) EF5. The information provided by the website is easily
understandable and ease of handling.
Kenova &Jonasson(2006) EF6. It is possible to use online banking utilities
without a lot of effect.
Security/trust(5)
Parasuraman et.al(2005);
Zeithaml et al.(2000)
P1.This site can protect personal information of users
and no misuse;
Parasuraman et.al(2005);
Zeithaml et al.(2000)
P2.This site protects information about my bank cards.
Wolfinbarger et al.(2003);
Kenova &Jonasson(2006)
P3.Transaction can be completed in a safe mode;
Zavareha(2012);
Kenova &Jonasson(2006)
P4.A user is confidence in the online banking services;
_
P5.It offers several of security tools (U dun, dynamic
password). (learnt from internship and users’
experience in China)
Responsiveness(2) Parasuraman et.al(2005) R1.It can deal with and solve the problems promptly;
_ R2.This site can provide adequate remedy to deal with
the problems (e.g. different kinds of solutions).
Assurance (5) Zeithaml et al.(2000);
Ho & Lin (2010);
Kenova &Jonasson(2006)
A1. “The reputation and image of this online banking is
good”;
Parasuraman et.al(2005) A2.The system is stable and reliable which would not
have the situation of transaction termination.
Parasuraman et.al(1988) A3.Customer service personnel have good professional
knowledge and ability;
Parasuraman et.al(1988) A4.Customer service personnel have good service
attitude;
Ho & Lin(2010) A5.The information provided by website is accurate
and reliable;
Page 39
31
Website design(4) Zeithaml et al.(2000);
Kenova &Jonasson(2006)
W1.This website can provide different ways of logging
into online banking which is very flexible (e.g. user
name, account number);
Zeithaml et al.(2000);
Ho & Lin(2010)
W2. “The site map of internet banking portal is clear,
the content and picture of the portal site are user-
friendly”;
Ho & Lin(2010) W3.Matters relating to customer interests and rights are
prominently presented on the website;
Ho & Lin(2010) W4. The information provided by website is always
updated in time.
Empathy(5) Zeithaml et al.(2000);
Ho&Lin(2010);
Wolfinbarger et al.(2003)
E1.This website can provide customized services;
Ho&Lin(2010); E2.Online banking offers full information about
features of various products or services (e.g. fund,
stock);
Aladwani et al.(2002) E3. This site provides the video demo showing how to
use online banking utilities it offers.
_ E4.It offers a variety of electronic statements query
_ E5.Online banking is authorized to support and deal
with a lot of business for consumers online: buying
financial products online;
Compensation/
preferential treatment(2)
Ho & Lin (2010) C1.The online banking can provide preferential rates
and charging fees.
_ C2.The online banking can charge reasonable fees
(transaction fees);
Efficiency: Parasuraman et.al (2005) defined it as “the ease and speed of accessing and using the
website”, including loading pages fast, finding what the users’ need easily and so on. As a result,
there are six items for this dimension that can be seen in the Table 7. In fact, this definition of
efficiency includes “the ease of navigation” and “access” which have mentioned in the first
phase of E-SERVQUAL instrument development.
Privacy/Trust: it was defined as “the degree to which the site is safe and protects customer
information”, such as personal information protection. Finally, there are three items for this
dimension.
Page 40
32
Responsiveness/contact: this dimension combines responsiveness and contact together. It means
“effective handling of problems and returns through the site” as well as “the availability of
assistance through telephone or online representatives”. According to the definition, there are
three items for this dimension.
Assurance: according to Parasuraman et.al (2000), it was defined as “the confidence the
customer feels in dealing with the site and is due to the reputation of the site and the products or
services it sells as well as clear and truthful information presented”, involving reputation of the
site, a guarantee offering as well as rating provided by other customers. From the perspective of
traditional service quality (SERVQUAL instrument), it was defined as “the knowledge and
courtesy of employees and their ability to convey trust and confidence (Parasuraman et al.,
1985).” As can be seen from both definitions, the meaning of assurance in both traditional
service and online service are the same that have mentioned before. Finally, there are six items
for this dimension.
Website design: this concept is very similar to dimension of site aesthetics mentioned in the first
phase development for E-SERVQUAL instrument in 2000. Site aesthetics was defined as “the
appearance of the site” by Parasuraman et.al (2000). According to the research done by Ho &
Lin(2010), website design referred to the design of website, such as content updating coinciding
with dimensions of a lot of previous studies (Aladwania and Palvia, 2002; Yang and Fang, 2004;
Yang et al., 2004), but not limited to technical development, visual design etc. In addition,
availability and accessibility of information is important for website design as well. On one hand,
Wolfinbarger and Gilly (2001) have mentioned that availability of information plays a very
important role of online purchasing. As known to us all, the significant difference between online
shopping and traditional shopping is whether consumers have face-to-face contact with a
salesperson. In other words, customers can get information they want to know from internet for
online shopping instead of direct contact with a salesperson. (Zeithaml et al., 2002) On the other
hand, it helps customer to save more searching-time if all the information is available and
accessible. In general, website design could facilitate information technology application and
access to online banking services for users. There are four items under this dimension.
Page 41
33
Empathy: it was defined as “The providing of caring, individualized attention to customers.”
(Parasuraman et al., 1985). In an easily understanding way, it means that providers standing in
the position of consumers offer the services to consumers. According to the real needs of
consumers, the services and products are produced and offered. At the same times, based on
Parasuraman et.al (2000), customization was defined as “how much and how easily the site can
be tailored to individual customers’ preferences, histories and ways of shopping.” As such, there
is no doubt that customization is the typical characteristics of empathy. In the end, there are four
items for this dimension.
Compensation/preferential treatment: According to Parasuraman et.al (2005), compensation was
defined as “the degree to which the site compensates the customers for problems”. This
dimension is related to dimension of “price knowledge” investigated in the first phase of
development of E-SERVQUAL by Zeithaml et al. (2000). Originally, compensation was used
for measuring online shopping service quality when problem was happening. Instead,
compensation referred to favorable treatment/ preferential treatment for online banking service
quality in Taiwan according to Wu et.al (2008), involving more favorable price offering (such as
the service charge for fund) as well as more preferential/ favorable treatment offering based on
more transaction number of times or amount of money. As a result, compensation can be
explained as preferential treatment as well. Ho & Lin (2010) defined preferential treatment as the
value- added services for online banking such as lower rate or fees comparing with traditional
banking service provided. As such, preferential treatment offering could be the competitive
advantage for using online banking services. Not only more convenience could online banking
provide, but also lower rate or charges is offered that make it different from traditional banking
services. According to the cultural difference and needs of Chinese users, there are two items for
this dimension.
Page 42
34
4. RESEARCH METHOD
As mentioned previously, the objective of this study is to develop a multiple item scale for
measuring service quality of online banking in Bozhou. The objective of the theoretical part is to
define and establish the suitable multiple e-service item scale based on E-S-QUAL/E-Rec S-
QUAL model and other related models which have already done in the previous part. Then the
empirical part is to test the model through data collection and statistical analysis, mainly
concentrating on factor analysis, and finally get the refined item scale for online banking
measurement in Bozhou City of China.
4.1. Research approach
Qualitative research is concerned with exploring a deeper understanding of social phenomenon,
which is usually to help understand the roots of an event or why things are the way they are in
our society (Hancock, 1998). Qualitative research is defined to be “a form of systematic
empirical inquiry into meaning” by Shank (p.5) (as cited by Ospina from Shank, 2004).
“Systematic” means “planed, ordered and public” according to the rules which is recognized by
the members of qualitative research group. “Empirical inquiry” means the inquiry is closely
related to real life experience. As such, qualitative research is aimed at getting an in-depth
understanding meaning of the social phenomenon, e.g. the potential motives. This method tries
to find the answers by asking: why? How? in what way(Hancock,1998)? Normally, qualitative
data collection is based on direct communication with people, e.g. face-to-face interview, or
observation (Hancock, 1998).
Quantitative research is defined as “a systematic investigation of social phenomenon via
statistical, mathematical or computational techniques” (Given, 2008). Or put it in another way,
quantitative research is grounded in the development of mathematic models, theory or testable
hypotheses that is more suitable for phenomenon analysis (Kenova & Jonasson, 2006). This
method tries to find the answers by asking: to what extent? how much? how many? how often?
Page 43
35
and etc. (Hancock, 1998). This approach pays more attention towards data mining which allows
flexibility of treating data so as to insure reliability and validity (Amaratunga et Al, 2002).
Both research methods were taken into consideration to help the data analysis here. In addition,
survey was one of the most important. Qualitative method was helpful for survey design via one
to one interview when I did my internship in ICBC in Bozhou City of China. After collecting all
the surveys back, quantitative method had an important role to play which was used to measure
“what extent” the customer perceive and experience the service quality of online banking
nowadays in China. In addition, the statistical analysis based on the collected data was necessary,
e.g. factor analysis. Furthermore, because of the statistical analysis of the data, the dimensions of
measuring service quality of online banking would be tested and finally developed. As a result,
the mixture of using both qualitative and quantitative methods were found to be appropriate for
the thesis.
4.2. Data collection
Statistical data can be categorized as two parts: primary data and secondary data. The source of
primary data is directly from the investigation or questionnaire, which is gathered by the person
for his/her own purpose. Instead, the data collected by some other people or some agencies calls
secondary data. It means that “data collected by one is used by another”. The most significant
difference is that primary data is original while secondary data is not. (Giri, 2008, 83) Obviously,
primary data collection was suitable for this study.
A pre-test survey was carried out before sending out the questionnaires. Test targets were ten
people who are online banking users, among whom five people are employees of ICBC, while
the rest are customers. The purpose of this pre-test was to check the reliability of the survey
questionnaire as well as exam whether there were some unclear questions that cause
misunderstanding. Fortunately, the survey questions was found to easily understand.
Page 44
36
The paper questionnaire was the data collection method for this study. The survey consisted of
four parts. Part 1 was concerned with the demographic information of respondents including
gender, age, education background, occupation, income per month. Part 2 created the profile
about the information of using online banking as a user: which online banks were used more
often, how often a user used online banking per month, the main reasons a respondent used
online banking, the services a user would like to use most often, the service quality attributes a
user paid most attention to, where a user got the information of online banking and how many
years a user had used online banking services. In addition, the user should prioritize the
maximum 3 important service quality attributes he/she paid most attention to. Part 3 was the
most important containing 29 service quality attributes. According to the users' real life
experience of different online banks in China, they had to help evaluate those attributes based on
Likert scale (5-step scale). Part 4 consisted of two open questions about which online banking a
user consider to be superior in terms of service quality and the advices for improvement in the
future development of online banking in China. There are several articles shown as follows that
are very helpful and useful for the survey design: Wang (2009), Ho & Lin (2010), Wu et.al
(2008), Zavareha et.al (2012).
Data collection lasted for around 3 weeks in the late January of 2013. 200 questionnaires were
sent out for individual online banking users in Bozhou city. Valid questionnaires was 173, and
accounted for 86.5% of the total number.
4.3. Target group
The target group focused on the young and middle age group, especially young age e.g.
university students etc. As could be seen from the following Figure 4, the majority of online
banking users were between 18 and 39 which account for 76, 4% in 2011. Age group below 18
year old was 4,1% while 40 or above was higher at 19,2%. According to this research in 2011
from iResearch Consulting Group, this thesis decided to focus on the age group between 19 and
39.
Page 45
37
Figure 4 Users of internet banking
(iResearch Consulting Group, http://wenku.baidu.com/view/ccc254200722192e4536f6d9.html)
Figure 5 Users of internet banking (occupation distribution)
(iResearch Consulting Group, (http://wenku.baidu.com/view/ccc254200722192e4536f6d9.html,
28.03.2013)
19.50%
16%
19.20%
20.80%
20.50%
4.10%
Users of internet banking: age group (2011)
40 or above
36-39
31-35
25-30
18-24
below 18
68.30%
12.70%
11.90%
1.40%
1.20%
1%
0.20%
3.30%
0.00% 10.00%20.00%30.00%40.00%50.00%60.00%70.00%80.00%
Fixed-employed
Freelancers
Students
Retirees
Housewives
Unemployed
Serving soilders
Others
Users of internet banking (Occupation distribution)
Percent
Page 46
38
Once the target group was determined, the next stage was sample selection considering the
representativeness of study sample. According to the research done by iResearch Consulting
Group in 2011, the occupation distribution of online banking users studied. As could be seen
from the Figure 5 shown as below, the biggest online banking users group is fixed-employed at
68.3%, headed freelancers at 12.7% and students at 11.9%.
In this thesis, Convenience or opportunity sampling was chosen for this thesis belonging to non-
probabilistic sampling which is “characterized by a nonsystematic approach to recruiting
respondents that often allows a potential respondent to self-select into the sample”
(http://www.rand.org/content/dam/rand/pubs/monograph_reports/MR1480/MR1480.ch4.pdf). In
addition, sample selection was based on the occupation distribution. Accordingly, the
questionnaires were sent and gathered from respondents who were interested in joining the
research actively in different areas: Bozhou Teachers College or around, different areas for
fixed-employed (e.g. hospital, police office) as well as ICBC (Industrial and Commercial Bank
of China).
4.4. Survey scales
Five-step Likert scale was used to help measure and evaluate service quality attributes in the
questionnaire for this study. Five-point scale is the most common scale and be considered to be
the simplest. Five step Likert scale represent 5 different level of attitudes. The normal format of
five-point scale could be: “1.strongly disagree”, “2.disagree”, “3.neural”, “4.agree”, and
“5.strongly agree” (Wang, 2009). Accordingly, each number can represent different level of
attitudes. It was more convenience for data analysis of questions by using Likert scale.
Page 47
39
4.5. Analysis methods of the survey
The collected data in this thesis was performed in both Excel and SPSS software. According to
the purpose from the empirical part, descriptive statistics, the item-total correlation, Cronbach’s
Alpha Test of Reliability, exploratory factor analysis by using principal component analysis as
the extraction method and was used for the data management in the survey. Descriptive statistics
was to help understand the basic information of users’ profile, e.g. age distribution. After that,
the model that established in the theoretical part needed to be tested. According to the methods
that was used in the article: “SERVQUAL: A Multiple-Item Scale for Measuring Consumer
Perceptions of Service Quality” written by Parasuramna et.al (1988), the item-to-total correlation
was calculated for pruning the prior list of items and improving the levels of Cronbach’s Alpha.
At the same time, Cronbach’s Alpha Test of Reliability played an important role as well. The
purpose of this test was to evaluate the internal consistency of each of the service quality
attributes. After deleting items for improving the internal reliability, exploratory factor analysis
was used to help explore service quality dimensions of online banking service. Finally, the
refined service quality scale was established through several rounds of repeat of factor analysis.
Even though the finally model was conducted, the most important was to do the test of reliability
and validity for the refined scale. As such, the final scale could be proved to be a good standard.
Here was the brief description of analysis methods of the survey, the more detailed techniques
would be introduced very well.
4.5.1. Item-to- total correlation and cronbach’s alpha test of reliability
The most common and popular method for measuring internal reliability is to use Cronbach’s
Alpha Test of Reliability. Cronbach’s Alpha is the coefficient of internal consistency (reliability).
The most important role played in this test is α-score, a value between 0 and 1. The criteria of
Cronbach α-score is defined to be greater than 0.7, implying the higher internal reliability of
given items in a scale (Nunnally and Bernstein, 1994). At the same times, Garson (2002) states
Page 48
40
that α-score with the value like 0,8 or even 0,6 is adequate for indicating the internal consistency.
In all, the higher the value of α-score, the more reliable it can indicate.
What’s more, item-to-total correlation can help to improve the level of α-score by deleting the
prior items list. The acceptable minimum value of 0,4 for item-total correlation is considered to
be reliable (Nunnally, 1978). Otherwise, the item with value lower than 0,4 should be eliminated
for insuring the whole quality of data.
4.5.2. Factor analysis
The most important stage for this thesis was to test the model established in theoretical part and
explore the scales of service quality of China in online banking. At this time, factor analysis
played important roles for scale refinement.
Factor analysis is defined as a statistical method “used to identify factors that statistically explain
the variation and co-variation among measures” (Green, Salking &Akey, 2000, p.292). Principal
Component Analysis is performed to take choices of initial number of factors in the first stage.
In fact, PCA is used to explain as much as possible of variance. The most popular standard for
extraction of the number of factors depends on the eigen value which should be above 1.0. After
decision making for extraction of factors, Varimax with Kaiser Normalization rotation is used for
the second step. At this stage, the attributes are reorganized into new constructs through rotation.
Although the number of factors is got from process of PCA, it is still difficult to make those
constructs easier to be understood. As such, Varimax Rotation Method provides one way to
explain and give the suitable definition for the factors and make the decision of the number of
new constructs as well (Green, Salkind& Akey, 2000) At this point, the factor loading of retained
variables is preferably higher than 0.5 for further analysis according to the proposal of some
authors (Jayawardhena, 2004). Otherwise, these items with factor loading below 0.5 should be
deleted. At the same time, there is one important criterion for the variables among different
factors. In order to significantly distinguish one factor from another, items with factor loading
above 0.3 on three or more factors should be deleted for better analysis (Doll and Torkzadeh,
Page 49
41
1988). Several iterations of exploratory factor analysis procedure should be done after pruning
those items to get the refined measurement scale.
Before conducting EFA, KMO and Bartlett’s Test should be done to insure whether factor
analysis was considered appropriately for this measurement. As known to us all, the higher the
correlation among all the items is, the better the effect of dimensionality reduction would be.
Accordingly, KMO index above 0.5 is the standard for conducting factor analysis. In addition, it
is better to get the p-value from Bartlett’s Test less than 0.05. Based on these two tests, EFA can
be considered suitable for further measurement.
4.5.3. Reliability and validity
Reliability and validity play important roles in developing measurement and validating
procedure for general research.
Internal reliability measuring was needed and used in this study. Internal reliability refers to
internal consistency that concerns about the extent to which all the items pertaining to one
dimension can measure the same thing and express the same idea. (Michael,
http://michaeljmillerphd.com/res500_lecturenotes/reliability_and_validity.pdf, 19.04.2013)
Furthermore, Cronbach’s Alpha Test of Reliability is the most popular method for measuring
internal reliability that was used in this study.
Validity is defined as “ the ability of a scale or measuring instrument to measure what is intended
to be measured” ( Eriksson& Wiederscheim-Paul, 1997, p.38). Although there are many types of
validity which play important roles involving: face validity, constuct validity, criterion-related
validity and etc, construct validity was the easiest to test statistically in this thesis. Construct
validity is defined as “the degree to which an instrument measures the trait or theoretical
construct that it is intended to measure” (Miller,
http://michaeljmillerphd.com/res500_lecturenotes/reliability_and_validity.pdf, 19.04). In this
study , convergent and discriminatory validity were used for assessing construct validity
Convergent validity refers to measures of items on the same constructs that are in reality related
Page 50
42
to each other should be highly correlated, while discriminatory validity is to measure items from
different constructs that are not related in reality should have lower correlation with each other.
In addition, the discriminatory validity are tested by using the multitrati-multimethod approach,
which was developed by Campbell and Fiske (1959). On one hand, the criterion for Convergent
validity is to test whether the factor loading of the confirmatory model is higher than 0.5(Sanzo
et al., 2003). On the other hand, discriminatory validity is examined by counting the number of
violations that an item has much higher correlation with another constructs than with its own
variable (Doll and Torkzadeh, 1988). Campbell and Fiske (1959) suggested that violations
should be less than 50% of the potential comparisons.
Page 51
43
5. RESULT
Valid questionnaires are 173 among the 200 surveys sending out. This chapter shows data
analysis, providing descriptive analysis, Cronbach’s Alpha Test of Reliability as well as scale
reduction and test of reliability and validity.
5.1. Descriptive analysis
5.1.1. Summary of demographic information
Table 9 Gender distribution
Gender Frequency Percent Cumulative
Percent Male 105 60,7% 60,7%
Female 68 39,3% 100%
Total 173 1
Table 10 Age distribution
Age Frequency Percent Cumulative
Percent 18 or below 4 2,3% 2,3%
19~28 114 65,9% 68,2%
29~38 39 22,5% 90,8%
39 or above 16 9,2% 100,0 %
total 173 100,0%
Page 52
44
Table 11 Education Background
Education Frequency Percent Cumulative Percent
High school or below 7 4,0% 4,0%
Junior college diploma 38 22,0% 26,0 %
Undergraduate degree 95 54,9% 80,9 %
Graduate degree or above 33 19,1% 100,0 %
Total 173 100,0%
Table 12 Occupation
Occupation Frequency Percent Cumulative
Percent Business (enterprise) managerial and technical
personnel 35 20,2% 20,2%
Government officer 45 26,0% 46,2 %
Professional (science and education,
cultural, health) 32 18,5% 64,7 %
Student 39 22,5% 87,3 %
Self-employed 7 4,0% 91,3 %
Worker 9 5,2% 96,5 %
Unemployed people 1 0,6% 97,1 %
Others 5 2,9% 100,0 %
Total 173 100,0%
Table 13 Salary per month
Salary Frequency Percent Cumulative
Percent Below 1000 37 21,4% 21,4%
1000-3000 92 53,2% 74,6 %
3000-5000 37 21,4% 96,0 %
Above 5000 7 4,0% 100,0%
Total 173 100,0%
Page 53
45
What can be seen from Table 8 to Table 12 is the demographic information about users
investigated in this study. As shown in Table 8, there are 60, 7% of male users while 39, 3%
online banking users are female in this research. As can be seen in Table 9, 65, 9% of users are
between age 19 and 28, and 22, 5% in the age between 29 and 38 which is understandable in
accordance with the criterion of target group aged between 19 and 38. Even though, majority of
users are younger age between 19 and 28. According to Table 10, 54, 9% of respondents have
bachelors’ degree, and 22% have junior college diplomas. The proportion of users having
graduate degrees or above is 19, 1% that is almost the same as those having Junior college
diplomas. As a result, online banking services are very popular with users having higher
education background: minimum junior college diploma or equivalent. From Table 11, online
banking services are very popular with users working in different areas because proportion of
each of those users working as business managerial and technical personnel, government
officers and professionals are around 20%. Except students that account for 22, 5%, it seems that
others not having superior and stable job, like self-employed are not interested in online banking
services. As can been seen from Table 12, users of salary higher than 5000 do not show much
interest in using online banking. It is understandable that users with young age normally cannot
get so higher income per month in Bozhou city.
Page 54
46
5.1.2. Analysis concerning the information of using online banking as a user
Figure 6 Users’ selection of online banks
Figure 7 Frequency of using online banking services
96%
21%
6%
0%
10%
20%
30%
40%
50%
60%
70%
80%
90%
100%
State-owned banks Shareholding banks others
Users' seletion of online banks
Percent
30.1%
37.6%
15.0%
17.3%
Frequency of using online banking services per
month
Twice or below
3-5 times
6-8 times
8 times or above
Page 55
47
Figure 8 Reasons for using online banking services
Figure 9 The most frequently used services of online banking
67.6%
20.8%
38.2%
13.3%
0.0%
20.0%
40.0%
60.0%
80.0%
Convenience foronline shopping
Necessity needfor some
transactions
Time saving andconvenience
Inconveniencefor going tobusiness hall
Reasons for using online banking services
percentage
39.9%
2.9%
39.9% 32.9%
87.9%
0.0%
10.0%
20.0%
30.0%
40.0%
50.0%
60.0%
70.0%
80.0%
90.0%
100.0%
The most frequently used services of online
banking
Percent
Page 56
48
Figure 10 Time of using online banking
Figure 11 Information channel
11.0%
49.1%
26.0%
13.9%
0.0%
10.0%
20.0%
30.0%
40.0%
50.0%
60.0%
Below one year 1-3 years 3-5 years Above 5 years
Time of using online banking
Percent
26.2%
39.6% 2.0%
18.3%
0.0% 13.9%
Information channel
Net media
Word-of-mouthadvertising from friends
Advertisement from TV
Promotion from bankingpersonnel
newspapers andmagazines
Others
Page 57
49
Figure 12 The importance of service quality attributes
What can be seen from Figure 6 to Figure 12 creates the profile about the information of using
online banking as a user. From Figure 6, we can see that most of users that account for 96%
would like to choose state-owned banks, and 21% choose shareholding banks. According to
Figure 7, 37, 6% of respondents use online banking 3-5 times per month and 30, 1% use online
services twice or below. Accordingly, most of users do not use online banking so often every
month so that improvement of online banking service needs to be done according to customers’
needs. As can be seen from Figure 8, most of users prefer to use online banking mainly because
of its convenience for online shopping which is 67,6% and time saving which account for 38, 2%.
Figure 9 shows us the most frequently used service of online banking is to view account balances
and recent transactions, followed by fund transfer and self-service payment as well as online bill
payment. The less popular service is investment and financing online which only has 2, 9% of
users. Therefore, investment and financing is promising in developing online banking. Figure 10
presents that 49, 1% of users have 1-3 years’ experience of online banking services and 26% use
it for 3-5 years. This result is quite good as a large portion of respondents in this study have more
0
20
40
60
80
100
120
140
99
8
15
34
8
53
8
The importance of service quality attributes
Moderately important
Very important
Most important
Page 58
50
than 1 years’ using experience of online banking, indicating they have enough experience and be
qualified to evaluate the online banking services. Then from Figure 11, we can see most of
respondents’ acknowledgement of online banking came from friends (39, 6%) and net media (26,
2%), followed by promotion from bank personnel and advertising from TV. Accordingly, we can
see how effective really word-of –mouth advertising from friends and net media is. Besides net
media, it is a good way to do the promotion through the original customers that banks have had
already by providing some preferential treatment. The last one Figure 12 shows us the most
important quality attributes (maximum three) users pay more attention to when they use online
banking. As can be seen from Figure 12, the most important one is security, followed by
convenience and ease of use in users’ mind.
This descriptive analysis shows a picture of users’ profile and their behavior to use online
banking. As can be seen from the previous part, this group represents online banking younger
and middle age (19-39) users in Bozhou. Accordingly, the summary of this part can help to have
a good understanding of the target group. Some data is not so precisely collected due to small
sample.
5.2. Cronbach’s alpha test of reliability
The Cronbach’s Alpha Test of Reliability is conducted on each dimension to test the internal
reliability or consistency of different items pertaining to different dimensions. Application of the
Cronbach’s Alpha Test of Reliability is to ensure whether those items belonging to each
dimension can be used to measure the same construct. As mentioned before, the criteria of
Cronbach α-score is defined to be greater than 0.7, implying the higher internal reliability of
given items in a scale (Nunnally and Bernstein, 1994). As can be seen from Table 9 which is the
summary of the appendix 3, α-score belonging to each construct is tested.
What can be seen from Table 14 that α-score of most of the dimensions, including efficiency,
privacy, assurance/trust, website design as well as empathy are higher than 0.7, indicating that
Page 59
51
items pertaining to those dimensions are internal consistent and reliable enough to measure the
original named dimensions.
However, α-score on dimension: responsiveness is much lower than 0.7 that is only 0.510. As a
result, there are some problems for this dimension when performing the Cronbach’s Alpha Test
of Reliability. In fact, as mentioned before, we have sent and taken 200 questionnaires back in
total but only 173 of them could be used for survey analysis. This is because there are some
missing data on the dimension of responsiveness from around 20 questionnaires. As mentioned
in previous studies (Parasuraman et al., 2005), probably because some users did not experience
the issues related to dimension of responsiveness. In other words, it seems that those users did
not encounter such problem while others had experience of problems provided by online banking.
In addition, the less items it has, the lower α-score it is. As a result, it probably explains why
such lowest α-score on the dimension of responsive could be gotten.
As a whole, the internal reliability of this survey is good based on Cronbach’s Alpha Test. In
other words, items pertaining to those dimensions are internal consistent and reliable to measure
the original named dimensions.
Table 14 Cronbach’s Alpha Test
Dimensions Cronbach’s Alpha
Efficiency 0.802
Privacy/Trust 0.807
Responsiveness 0.510
Assurance 0.801
Website design 0.789
Empathy 0.805
Compensation 0.868
Page 60
52
5.3. Scale reduction
After checking the internal reliability of different items pertaining to different dimensions, the
internal consistency for the whole model is specified in order to check whether all the items
pertaining to service quality of online banking can express the same ideas and measure the same
thing as a whole.
Table 15 Cronbach’s Alpha Test of Reliability
Cronbach's
Alpha
Cronbach's
Alpha Based
on
Standardized
Items N of Items
.946 .947 29
Page 61
53
Table 16 Item-Total Statistics
Scale Mean if
Item Deleted
Scale
Variance if
Item Deleted
Corrected
Item-Total
Correlation
Squared
Multiple
Correlation
Cronbach's
Alpha if Item
Deleted
EF1 100.10 225.329 .426 . .946
EF2 100.26 224.077 .470 . .945
EF3 100.64 220.653 .561 . .944
EF4 100.46 221.922 .590 . .944
EF5 100.37 222.584 .603 . .944
EF6 100.42 218.748 .725 . .943
P1 100.82 216.628 .624 . .944
P2 100.79 218.915 .633 . .943
P3 100.47 220.870 .610 . .944
P4 100.66 220.880 .613 . .944
P5 100.24 227.890 .380 . .946
R1 100.77 220.601 .569 . .944
R2 100.83 214.995 .674 . .943
A1 100.60 221.492 .667 . .943
A2 100.85 223.423 .487 . .945
A3 100.49 220.275 .637 . .943
A4 100.51 220.801 .678 . .943
A5 100.40 219.819 .699 . .943
W1 100.41 221.822 .619 . .944
W2 100.55 220.143 .674 . .943
W3 100.61 217.701 .692 . .943
W4 100.65 222.579 .600 . .944
E1 100.51 221.877 .568 . .944
E2 100.47 221.408 .583 . .944
E3 100.51 220.918 .613 . .944
E4 100.36 222.138 .592 . .944
E5 100.34 224.121 .545 . .944
C1 100.82 216.078 .635 . .944
C2 100.99 216.918 .585 . .944
Page 62
54
Firstly, internal consistency is checked in order to show whether all the items are correlated with
each other. This method for scale reduction of service quality was developed and used by
Parasuraman et.al (1988). As can be seen from Table 15 and Table 16, although the coefficient
α-score is 0.946, much higher than criteria mentioned above, the item-to-total correlation for P5
is lower than the acceptable minimum value of 0.4. On one hand, it means the item P5 (It offers
several of security tools e.g. U dun, dynamic password) cannot play a good role for internal
reliability statistically. On the other hand, Users did not concentrate on how many kinds of
security tools bank could offer or what bank could offer, but cared about whether tools were easy
and ease of use from the experience of my internship. Finally, P5 is deleted to improve the level
of α-score which means reliability. From this first step, the reliability is conducted by checking
the item-to-total correlations and pruning the list of items to improve the level of α-score. After
elimination of item P5, the new Table 17 item-to-total statistics is shown as below. The item-to-
total correlation of other items meets the requirement after deletion of item P5.
Page 63
55
Table 17 Item-to-total
Scale Mean if
Item Deleted
Scale
Variance if
Item Deleted
Corrected
Item-Total
Correlation
Squared
Multiple
Correlation
Cronbach's
Alpha if Item
Deleted
EF1 96.20 217.189 .415 .565 .946
EF2 96.36 215.998 .458 .610 .945
EF3 96.74 212.335 .561 .461 .944
EF4 96.56 213.687 .586 .470 .944
EF5 96.47 214.262 .602 .602 .944
EF6 96.52 210.427 .728 .696 .943
P1 96.92 208.309 .627 .643 .944
P2 96.89 210.707 .630 .602 .944
P3 96.57 212.679 .605 .586 .944
P4 96.76 212.533 .614 .516 .944
R1 96.87 212.233 .572 .478 .944
R2 96.93 206.580 .681 .716 .943
A1 96.70 213.216 .665 .644 .943
A2 96.95 214.980 .490 .375 .945
A3 96.59 211.798 .645 .605 .943
A4 96.61 212.649 .671 .625 .943
A5 96.49 211.550 .698 .624 .943
W1 96.51 213.503 .619 .541 .944
W2 96.65 211.796 .676 .601 .943
W3 96.71 209.365 .696 .628 .943
W4 96.75 214.177 .603 .565 .944
E1 96.60 213.550 .568 .572 .944
E2 96.56 213.066 .583 .570 .944
E3 96.61 212.578 .615 .579 .944
E4 96.46 213.934 .586 .545 .944
E5 96.44 215.874 .539 .567 .944
C1 96.92 207.689 .641 .768 .944
C2 97.09 208.541 .590 .686 .944
Page 64
56
Secondly, the most important part is to test the model established in theoretical part and explore
the scales of service quality in online banking of China through factor analysis. Factor analysis
has been explained in detail in the previous chapter, so here is a brief introduction. There are two
stages for factor analysis: PCA (Principal Component Analysis) as an extraction method and
Varimax with Kaiser Normalization as the rotation method as well. In other words, PCA plays
the role as identifying the initial number of factors while Varimax with Kaiser Normalization is
used to decide the final number of factors and give the suitable interpretation or definition for
them. It is noteworthy that KMO and Bartlett’s Test should be done to insure whether factor
analysis is considered to be appropriate for the research.
As can be seen from Table 18, p-value from Bartlett’s Test is less than 0.05 and KMO index for
this data is 0.914 and is much higher than the acceptable value 0.5. Accordingly, KMO and
Bartlett’s Test is considered as “meritorious” (Hair et al., 1998) for this research. As a result,
factor analysis can be conducted based on this acceptable result from KMO and Bartlett’s Test.
Table 18 KMO and Bartlett's Test
Kaiser-Meyer-Olkin Measure of Sampling Adequacy. .914
Bartlett's Test of Sphericity Approx. Chi-Square 2.794E3
df 378
Sig. .000
Page 65
57
Table 19 Principal Component Analysis for the first time
Com
pone
nt
Initial Eigenvalues
Extraction Sums of Squared
Loadings
Rotation Sums of Squared
Loadings
Total
% of
Variance
Cumulativ
e % Total
% of
Variance
Cumulativ
e % Total
% of
Variance
Cumul
ative
%
1 11.616 41.487 41.487 11.616 41.487 41.487 3.920 13.999 13.999
2 1.924 6.872 48.358 1.924 6.872 48.358 3.584 12.799 26.799
3 1.426 5.092 53.450 1.426 5.092 53.450 3.301 11.788 38.586
4 1.175 4.196 57.646 1.175 4.196 57.646 2.972 10.615 49.202
5 1.149 4.105 61.751 1.149 4.105 61.751 2.410 8.606 57.808
6 1.029 3.675 65.425 1.029 3.675 65.425 2.133 7.618 65.425
7 .979 3.496 68.922
8 .890 3.179 72.101
9 .795 2.840 74.941
10 .699 2.498 77.439
11 .635 2.268 79.707
12 .556 1.986 81.693
13 .545 1.945 83.638
14 .482 1.720 85.358
15 .447 1.598 86.956
16 .421 1.504 88.460
17 .419 1.498 89.958
18 .378 1.349 91.307
19 .354 1.263 92.570
20 .329 1.175 93.745
21 .294 1.050 94.795
22 .280 1.002 95.796
23 .247 .883 96.679
24 .223 .795 97.474
25 .212 .756 98.230
26 .199 .712 98.943
27 .167 .597 99.539
28 .129 .461 100.000
Page 66
58
Next, factor analysis can be conducted. As can be seen from Table 19, PCA helps to make the
initial decision of the number of factors. Six factors are extracted at this stage depending on the
eigen value which should be above 1.0 and those factors can explain 65.425% of the variance.
Furthermore, the factor loading of retained variables is preferably higher than 0.5 for further
analysis through the second stage: rotation according to the proposal of some authors
(Jayawardhena, 2004). The results are shown in Table 20. Those items A4, W4 and EF4 have the
factor loading below 0.5 in accordance with the standard. Firstly, A4 (Customer service
personnel have good service attitude) was found to be less important because users did not get
used to non-face-to-face communication with service personnel in Bozhou. At this point, A4
could be deleted. Secondly, Figure 8 has showed us the most frequently used service of online
banking is to view account balances and recent transactions, followed by fund transfer and self-
service payment as well as online bill payment, thus W4 (The information provided by website
is always updated in time) is not be focused on from users’ view. W4 could be deleted as well.
Thirdly, EF4(It makes it easy to get anywhere on the site) was found to be less important because
customers did not use too many online banking services which could be got from Figure 8. EF4
is deleted. In addition, items with factor loading above 0.3 on three or more factors should be
deleted for better analysis (Doll and Torkzadeh, 1988) in order to improve the distinction.
According to this criterion, items W2, W1, E5, E1 and EF3 are deleted as well. In the end, there
are 20 items left after the first round of factor analysis.
Page 67
59
Table 20 Rotated component matrixa
Component
1 2 3 4 5 6
A3 .749 .215 .198 .142 .059 .143
EF6 .722 .226 .270 .169 .222 .134
W3 .649 .252 .283 .227 .032 .192
A5 .594 .227 .341 .277 .238 .004
W2 .573 .160 .136 .363 .336 .144
A4 .439 .411 .277 .187 .172 .160
W4 .404 .339 .207 .281 .006 .235
P3 .176 .794 .248 .085 .121 .016
P1 .321 .752 .085 .085 .052 .204
P4 .072 .659 .223 .246 .182 .179
P2 .460 .612 -.038 .133 .257 .113
A1 .250 .591 .308 .231 .052 .177
E3 .339 .185 .712 .149 .115 -.016
E2 .085 .254 .694 .304 .158 -.015
E4 .196 .137 .629 .131 .156 .287
EF5 .233 .107 .590 .071 .352 .262
W1 .381 .168 .552 .070 .020 .350
EF4 .282 .190 .417 .023 .271 .388
C1 .304 .265 .118 .727 -.069 .227
C2 .298 .217 .023 .703 -.087 .333
E5 .081 -.018 .314 .662 .430 .054
E1 .159 .149 .316 .592 .336 -.040
R2 .391 .373 .133 .568 -.104 .271
EF2 .158 .106 .170 .128 .812 .030
EF1 .090 .161 .212 -.053 .774 .129
A2 .254 .073 .126 .195 .029 .701
EF3 -.048 .326 .329 .225 .124 .627
R1 .246 .291 .005 .136 .427 .521
Page 68
60
Thirdly, a new round of factor analysis continues using the remaining 20 items. As shown in
Table 21, four dimensions are decided initially explaining 63.393% of variance in the second
round. Then, items W3 and A3 have the factor loading less than 0.5. W3 (Matters relating to
customer interests and rights are prominently presented on the website) is not important
according to national conditions of China. A3 (Customer service personnel have good
professional knowledge and ability) is deleted for the same reason as A4. Besides, items A5, A1
and R1 having the factor loading above 0.3 on three or more factors are also deleted.
Accordingly, there are 15 items left after the second round. The results are shown in Table 22.
Page 69
61
Table 21 Second round of PCA
Com
pone
nt
Initial Eigenvalues
Extraction Sums of Squared
Loadings
Rotation Sums of Squared
Loadings
Total
% of
Variance
Cumulativ
e % Total
% of
Variance
Cumulativ
e % Total
% of
Variance
Cumulativ
e %
1 8.566 42.831 42.831 8.566 42.831 42.831 3.573 17.866 17.866
2 1.811 9.053 51.884 1.811 9.053 51.884 3.499 17.493 35.358
3 1.260 6.298 58.182 1.260 6.298 58.182 3.475 17.377 52.736
4 1.042 5.210 63.393 1.042 5.210 63.393 2.131 10.657 63.393
5 .943 4.717 68.110
6 .865 4.327 72.436
7 .732 3.662 76.098
8 .597 2.984 79.082
9 .575 2.876 81.957
10 .540 2.700 84.658
11 .451 2.256 86.914
12 .395 1.975 88.890
13 .392 1.958 90.847
14 .385 1.925 92.772
15 .297 1.483 94.255
16 .290 1.449 95.704
17 .269 1.345 97.048
18 .235 1.174 98.222
19 .195 .976 99.198
20 .160 .802 100.000
Page 70
62
Table 22 Second round rotated component matrixa
Component
1 2 3 4
E3 .816 .202 .138 .083
E2 .677 .234 .100 .127
EF5 .660 .073 .192 .414
E4 .631 .140 .218 .211
A5 .556 .303 .350 .203
EF6 .538 .331 .421 .230
W3 .475 .411 .438 .042
A3 .430 .380 .411 .076
P1 .155 .807 .260 .067
P3 .304 .786 .083 .081
P2 .111 .712 .294 .235
P4 .244 .651 .204 .184
A1 .338 .530 .328 .137
C2 .129 .168 .858 .031
C1 .220 .187 .823 .047
R2 .274 .325 .761 -.013
A2 .163 .173 .514 .181
EF1 .254 .158 -.059 .814
EF2 .266 .085 .082 .809
R1 .033 .391 .352 .565
Next, a new round of PCA is conducted using the rest of 15 items. As shown in Table 23, the
third round of analysis extracts three factors than can explain 62.085% of the variance. In the
third round of rotation, the factor loading of EF6 is less than 0.5. EF6 (It is possible to use online
banking utilities without a lot of effect) needs to be deleted because it expresses the similar
meaning with the previous two items EF1 and EF2. After this round, there are still 14 items
remaining for further study.
Page 71
63
Table 23 Third round of PCA
Com
pone
nt
Initial Eigenvalues
Extraction Sums of Squared
Loadings
Rotation Sums of Squared
Loadings
Total
% of
Variance
Cumulati
ve % Total
% of
Variance
Cumulati
ve % Total
% of
Variance
Cumulati
ve %
1 6.327 42.177 42.177 6.327 42.177 42.177 3.296 21.976 21.976
2 1.772 11.815 53.992 1.772 11.815 53.992 3.169 21.124 43.100
3 1.214 8.093 62.085 1.214 8.093 62.085 2.848 18.985 62.085
4 .950 6.336 68.422
5 .828 5.519 73.941
6 .672 4.483 78.424
7 .580 3.869 82.292
8 .510 3.400 85.693
9 .430 2.869 88.562
10 .397 2.648 91.210
11 .327 2.178 93.388
12 .291 1.939 95.327
13 .276 1.840 97.167
14 .248 1.655 98.822
15 .177 1.178 100.000
Page 72
64
Table 24 Third rotated component matrixa
Component
1 2 3
EF5 .764 .293 .113
EF2 .733 -.035 .183
EF1 .728 -.185 .247
E3 .644 .348 .183
E4 .611 .366 .109
E2 .576 .282 .176
EF6 .495 .444 .371
C2 .064 .836 .210
C1 .144 .832 .217
R2 .141 .800 .346
A2 .210 .503 .168
P1 .119 .290 .809
P3 .251 .170 .791
P2 .194 .241 .766
P4 .279 .249 .649
Finally, the fourth round of factor analysis is shown in Table 25 and Table 26. In this round of
PCA, three factors are extracted which can explain 62.697% of the variance. Besides, All factor
loading of the remaining 14 items are higher than 0.5. Accordingly, the remaining 14 items are
reorganized into three new dimensions that help to make the final decision.
Page 73
65
Table 25 Fourth round of PCA
Co
mpo
nent
Initial Eigenvalues
Extraction Sums of
Squared Loadings
Rotation Sums of Squared
Loadings
Total
% of
Variance
Cumulati
ve % Total
% of
Variance
Cumulati
ve % Total
% of
Variance
Cumulati
ve %
1 5.795 41.396 41.396 5.795 41.396 41.396 3.064 21.884 21.884
2 1.771 12.647 54.043 1.771 12.647 54.043 2.992 21.371 43.255
3 1.212 8.654 62.697 1.212 8.654 62.697 2.722 19.443 62.697
4 .949 6.776 69.474
5 .818 5.846 75.320
6 .649 4.638 79.958
7 .542 3.869 83.827
8 .466 3.328 87.154
9 .429 3.065 90.220
10 .345 2.462 92.682
11 .293 2.093 94.775
12 .286 2.045 96.820
13 .256 1.828 98.649
14 .189 1.351 100.000
Page 74
66
Table 26 Fourth rotated component matrixa
Component
1 2 3
EF5 .758 .292 .114
EF1 .733 -.179 .250
EF2 .730 -.035 .186
E3 .642 .349 .183
E4 .618 .373 .111
E2 .584 .292 .175
C2 .065 .839 .211
C1 .148 .837 .220
R2 .137 .798 .347
A2 .205 .500 .171
P1 .118 .291 .811
P3 .256 .175 .791
P2 .182 .232 .768
P4 .289 .257 .648
Consequently, three dimensions are got for online banking services in China, it can be shown in
the table below. Items EF5, EF1, EF2, E3, E4, and E2 are the component for the new dimension
defined as customer experience design. In fact, this new dimension is mainly composed of
original two dimensions defined in the theoretical model: efficiency and empathy. Customer
experience design is the renamed dimension relating to the real experience and feeling of online
banking services from customer perspective, such as the speed of information and transaction
processing as well as the speed of accessing to website information needed and “the providing of
Page 75
67
caring, individualized attention to customers” (empathy). Those items C2, C1, R2 and A2 belong
to the new renamed dimension preferential and assurable treatment. As can be seen that
preferential and assurable treatment is related to favorable treatment offering and guarantee
providing for assurance as well as responsiveness to the problems, such as more favorable price
offering (such as the service charge for fund). The last dimension is privacy/trust composed of
items P1, P2, P3and P4. This dimension is related to “the confidence the customer feels in
dealing with the site” (from the first stage development of E-SQ) and “the degree to which the
site is safe and protect customer information” (the same dimension from E-SQ).which is the
combination of assurance/trust and security/privacy. Finally, the refined scale is got and shown
in the Table 27.
Page 76
68
Table 27 Refined scale for online banking services in China
Content of service attributes New Dimensions
EF1.This site can process information and transaction
quickly
Customer experience design
EF2.A user can get the information from the website
that is needed easily and quickly
EF5. The information provided by the website is easily
understandable and ease of handling.
E1.This website can provide customized services;
E2.Online banking offers full information about
features of various products or services (e.g. fund,
stock);
E4.It offers a variety of electronic statements query
R2.This site can provide adequate remedy to deal with
the problems (e.g. different kinds of solutions)”;
Preferential and assurable treatment
A2.The system is stable and reliable which would not
have the situation of transaction termination;
C1.The online banking can provide preferential rates
and charging fees;
C2.The online banking can charge reasonable fees
(transaction fees)
P1 This site can protect personal information of users
and no misuse;
Privacy/trust
P2.The site protects information about my bank cards;
P3.Transaction can be completed in a safe mode;
P4.A user is confidence in the online banking services.
Page 77
69
5.4. Reliability and validity
5.4.1. Reliability
Although the refined scale is gotten, there is still a need to test the reliability and validity of the
refined model. What can be seen from Table 28 is the summary of Appendix 4 that is the α-score
for all the refined dimensions as well as α-score for the whole scale. The Cronbach’s Alpha for
all the new constructs are 0.817, 0.838 and 0.839, indicating the items pertaining to those new
constructs are internal consistent and reliable enough. In addition, the α-score for the whole scale
is 0.888, showing the high internal consistency and reliability among all the items pertaining to
service quality of online banking as a whole. Accordingly, the refined scale is regarded as high
reliable measurement for online banking service in China.
Table 28 Reliability Statistics for refined scale
Dimensions Cronbach’s Alpha
Customer experience design .817
Preferential and assurable treatment .838
Privacy/trust .839
Total .888
5.4.2. Validity
As mentioned in the previous content, construct validity is applied in this thesis. Furthmore,
convergent and discriminatory validity are considered as subsets of construct validity. Firstly,
convergent validity is tested through CFA. Typically, tool: Amos of SPSS is used for
performing convergent validity. The statistical tools used for this study are SPSS(not including
Amos version) and Excel, however, the same result can be gotten by performing process of the
Page 78
70
extraction mentioned previous(numbers of factor=1) (Wu,
http://tx.liberal.ntu.edu.tw/Jx/Methodology/Analy-TxStatisticsCanon-Factor_CFA.htm#PCA,
20.05.2013). As can be seen from Appendix 5, the factor loadings of most of the items are higher
than 0.5 except item EF1 that is a little bit lower than 0.5.
Next, the discriminatory validity is performed for assessing construct validity by using the
multitrati-multimethod approach. According to Doll and Torkzadeh (1988), discriminatory
validity is examined by counting the number of violations that an item’s correlation with another
constructs is quiet higher than with its own variable. As can be seen from Appendix 6, the lowest
correlations within the same construct are shown as below: Correlation(E4,EF1)=0.263,
Correlation(A2,C1)=0.331, Correlation(P4,P2)=0.427. What can be seen from Appendix 6 is that
the total number of comparisons between an item with another constructs and with its own
variable is 128. Besides, the number of violations is 57. Campbell and Fiske (1959) suggested
that violations should be less than 50% of the potential comparisons. Accordingly, the
percentage is 44.5% (57/128*100%) which is less than 50% so that the result is acceptable.
As a whole, although the factor loading of E1 is a littler lower when performing convergent
validity, it can be said that the validity test of the refined scale is acceptable from both aspects of
convergent and discriminatory validity.
5.5. Summary of open questions
This part analysis is composed of two open questions. Although the response rate of this part is
not high, it is still helpful to learn more from users’ perspective. Regarding the first open
question (Which online banking service is considered to be superior in terms of service quality?
Why?), most of the respondents choose four state-owned banks (Bank of China, Agricultural
Bank of China, China Construction Bank and ICBC) and one extra joint-stock bank (China
Merchants Bank). Accordingly, four-sated owned banks and China Merchants Bank can be
considered to be superior in terms of online service quality from users’ view.
Page 79
71
Regarding the second one (any advice for improvement in the future development of online
banking), users have given some good advice for improvement which is shown as below.
Number of customer service personnel of online banking could be increased in order to
serving customers more quickly and better.
It is better to lower the fees of online banking, e.g. fees for intra-and inter-bank transfer,
annual fees etc.
It is better to establish customer feedback system for online banking service quality so
that the real needs of customers could be learnt and updated by time.
Security and ease of use needs to be improved and paid more attention to continually.
5.6. Summary
Survey analysis has been done in this chapter. Descriptive analysis provided the overall
picture of target group comprising of enough experience users. Statistical analysis showed the
process of scale reduction and test of reliability and validity, and finally the refined scale was
identified including 3 dimensions and 14 items: Customer experience design, preferential and
assurable treatment as well as privacy/trust. Open questions offered the chance to learn what the
customers thought and advices for improvement in the future.
Page 80
72
6. DISCUSSION AND CONCLUSION
6.1. Theoretical and empirical contribution
The purpose of this study is to develop service quality dimension for online banking service in
China. The research is based on E-S-QUAL/E-Rec S-QUAL instrument which is considered to
be one of the most comprehensive measurement to evaluate online services, involving the users’
experiences before (which can be understood as evaluation of website quality), during
(purchasing process) and after the transaction process (after-sales service). The empirical data
was collected by sending and gathering questionnaires in Bozhou.
In the theoretical part, information of online banking development in China, the concept of
service quality (including online service quality) and related models as well service quality in
both contexts of online banking and traditional banking continues were discussed, especially E-
S-QUAL/E-Rec S-QUAL instrument. In this study, E-S-QUAL/E-Rec S-QUAL developed by
Parasuraman et.al (2005) has been modified to establish a more suitable model for online
banking in Bozhou. In addition, there are several articles shown as follows that are very helpful
and useful for the survey design: Wang (2009), Ho & Lin (2010), Wu et.al (2008), Zavareha et.al
(2012). In fact, the main purpose of theoretical part is to define and establish the suitable
multiple e-service item scale based on E-SERVQUAL model and other related models.
Then, from empirical part, surveys targeting users in Bozhou focus much on data collection and
analysis. 200 questionnaires were sent out and collected, however, 173 of them were valid due to
the missing data of certain dimensions. Next, according to the method developed by
Parasumaran et al. (1988), scale refinement was done by using item-to-total correlation and
factor analysis. Later, the most important step was to check the reliability and validity of refined
scale. Finally, the multiple item scale for measuring online banking service in China was
identified, including 3 dimensions and 14 items: customer service, privacy and preferential and
reliable treatment.
Page 81
73
As a whole, three dimensions of customer service, privacy and preferential and reliable treatment
were investigated to be the scale for measuring online banking service quality in this study.
From the descriptive analysis, security, followed by convenience and ease of use were found to
be the most important dimensions. In addition, lower fees especially no fees belonging to
preferential treatment were expected to be improved from open question part. As can be seen,
those three factors are similar with refined three dimensions. Accordingly, the refined scale
could be considered more accurate and suitable to measuring online banking service quality in
Bozhou city of China. Table 29 shows the differences among E-SERVQUAL (2000), E-S-
QUAL/E-Rec S-QUAL, revised e-SQ scale and the refined scale.
Page 82
74
Table 29 Differences among E-SERVQUAL, revised e-SQ scale and the refined scale
E-SERVQUAL
(2000)
E-S-QUAL/E-Rec S-QUAL
(2005)
The revised e-SQ
scale
The refined
scale
Reliability Fulfillment, System Availability _ _
Responsiveness Responsiveness Responsiveness/contact Preferential and
assurable
treatment (R2)
Access Efficiency, contact Efficiency(EF3) _
Flexibility Website Design (W1) _
Ease of navigation Efficiency Efficiency
(EF1, EF2,EF4,EF5,EF6)
Customer
experience design
(EF1, EF2, EF5) Efficiency Efficiency
Assurance/Trust Assurance
Privacy/Trust(P4)
Preferential and
assurable
treatment (A2)
Privacy/Trust(P4)
Security/Privacy Privacy Privacy/Trust
(P1,P2,P3,P5)
Privacy/Trust
(P1,P2,P3)
Price Knowledge _ _
Site aesthetics Website design(W2) _
Customization/personalizat
ion
Empathy(E1) _
Compensation Compensation/ preferential
treatment(C1,C2)
Preferential and
assurable
treatment(C1,C2)
Page 83
75
To sum up, there are some new contributions comparing with previous studies:
In this paper, e-service quality instrument: E-S-QUAL/E-Rec S-QUAL was used as a
basis instead of using traditional service quality model. All in all, traditional service is
different from online service. Thus, this method is more suitable and trustful comparing
with previous studies.
This paper developed and established a reliable and valid able multiple item scales for
measuring service quality of online banking in China, taking customers’ points of view.
As a result, service quality could be able to paid more attention towards this three aspects
for better and efficient improvement.
6.2. Managerial recommendations
According to the research, the first managerial recommendation for online banking industry is to
help have a good knowledge of who their customers are and what they pay more attention to.
This knowledge would lay the foundation for further research on relationship between customer
satisfaction and service quality and further help to target the group that is more accurate and
profitable. In addition, such knowledge would help to recognize what services should be
improved according to the real needs. In other words, certain services that customers do not care
are no need to be paid more attention to; otherwise, it is a waste of time and money.
Then the second recommendation for management is to learn that there is a need to establish the
feedback system for online banking service quality measurement, especially from part of open
question. On one hand, it took more time to collect the information of service quality by sending
surveys. On the other hand, doing data collection randomly was not easy for me. However, if
banks could consider to establish this kind of feedback system, it is not only time-saving and
more accurate, but also updated continually following the changes of users’ needs.
Page 84
76
Also, security and ease of use could not be underestimated because these two dimensions were
considered to be most important. In addition, lower fees or even no fees should be paid attention
to because of many complaints about this mentioned in open questions.
As a whole, all of these recommendations mentioned above try to give banks the right direction
for online banking development, and help them have a better understanding of users’ group as
well.
6.3. Limitations and further research
Like all the other papers in academic, this thesis has its own limitations as well. Firstly, the total
number of valid questionnaires that has been collected back via paper delivery is around 180
because of time limitation, so the respondent sample size is too small comparing huge users of
online banking in China. Accordingly, it is better for further study to select much larger sample
so as to gain a more precise analysis result. Secondly, the limitation for this thesis is the target
group, which is only concentrated on age between 19 and 39. In order to gain big profits, bank
providers would take an interest in our target age group, and also pay attention to older age, e.g.
higher educational background. As can be known from the research done by iResearch
Consulting Group in 2011(http://wenku.baidu.com/view/ccc254200722192e4536f6d9.html,
28.03.2013), there is 19.5% of online banking users above 40 years old in China although the
main user group is still younger age. In other words, the target group of this thesis research is not
comprehensive enough so that some of the perception of e-service quality of online banking
could not be covered. Thirdly, accordingly to statistical inference, convenience sampling is no
better than random sampling. Regarding to research about service quality of online banking,
respondents who pay more attention to this issue probably would like to join and answer the
survey more preferably than others
(http://www.rand.org/content/dam/rand/pubs/monograph_reports/MR1480/MR1480.ch4.pdf,
10.08.2013).Accordingly, the result of survey cannot be representative within general population.
Fourthly, factor analysis in this study did not have a comparison point against which to measure
Page 85
77
what the scale is actually measuring. This kind of comparison would provide extra proof for the
validity test. Fifthly, the reliability and validity test was done using the same sample. Instead, it
is better to use different sample to check the reliability and validity, especially for validity test in
order to get the result that is more trustful., The last one is that there is still a lack of
comprehensive academic e-service quality scales for online banking, so our established model is
based on E-SERVQUAL that is e-service quality scales for online shops.
In addition, this study only concentrated on measuring service quality of online banking, but did
not pay attention to impact of service quality on customer satisfaction. It must be interested to do
the further research on relationship between service quality and customer satisfaction.
Page 86
78
REFERENCES
Reports and Books
Business Wire (1995), Stanford federal credit union pioneers online financial services. Business
Wire, June 21.
Centeno, C. (2003) Adoption of Internet Services in the Enlarged European Union. European
Commission Research Center, June.
Crosby P B. (1979) Quality is Free: The Art of Making Quality Certain, New York: McGraw-
Hill.
Garson, D. (2002). Guide to writing empirical papers, theses and dissertations. CRC Press.
Garvin, David A. (1983) "Quality on the Line", Harvard Business Review (September-October),
pp. 64-75.
Giri P.K. and Banerjee.J(2008). Introduction to Statistics, Sixth edition. 83.
Given, Lisa M. (2008) The Sage Encyclopedia of Qualitative Research Methods, Calif.: Sage
Publications, Los Angeles.
Green, S. B, Salkind, N. J. & Akey, T. M. (2000) Using SPSS for Windows: analyzing and
understanding data, NJ, Upper Saddle River: Prentice Hall.
Hair, J.F. Jr, Anderson, R.E., Tatham, R.L. and Black, W.C. (1998), Multivariate Data Analysis,
5th ed., Prentice-Hall, Upper Saddle River, NJ.
Hancock, B (1998). Trent Focus for Research and Development in Primary Health Care: An
Introduction to Qualitative Research.
Hardy, M,&Bryman, A.(2004). Handbook of Data Analysis. SAGE Publication.
Page 87
79
Kenova V. and Jonasson P. (2006) Quality Online Banking Services, Technical Report,
Jonkoping International Business School.
Mann, Prem S. (1995) Introductory Statistics, 2nd Edition, Wiley. ISBN 0-471-31009-3.
Nunnally, J.C.,&Bernstein, I.H.(1994). Psychometric Theory. New York: McGraw-Hill.
Nunnally,J.C. (1978) Psychometric Theory, 2nd
ed., McGraw-Hill, New York, NY.
Reichheld, F.F., & Schefter, P. (2000). E-loyalty: Your Secret Weapon on the Web. Harvard
Business Review, July-August, pp. 105-13.
Schneider, B. & White, S. S. (2004). Service Quality Research Perspectives. Sage, California:
Thousand Oaks.
Sethi, Jyotsna & Bhatia Nishwan (2008). Elements of Banking and Insurance. Asoke K.Ghosh.
pp. 55-67.
Wang X. (2009). Research on Service Quality of Internet Banking and Its Impact on Customer
Satisfaction. Southwestern University of Finance and Economics in China.
Zhao X. (2010). Internet Banking Services in China: Customer Service Quality Delivered Over
the Internet. Technical Report. Lahti University of Applied Sciences.
Articles.
Aladwani, A. M., & Palvia, P. C. (2002). "Developing and Validating an Instrument for
Measuring User-perceived Web Quality", Information & Management, Vol. 39, No. 8, pp. 467-
476.
Page 88
80
Amaratunga, D., Baldry, D., Sarshar, M., & Newton, R. (2002). “Quantitative and Qualitative
Research in the Built Environment: Application of “Mixed” Research Approach”, Work study,
Vol. 51, No. 1, pp. 17-31.
Bahia, K. & Nantel, J. (2000) “A Reliable and Valid Measurement Scale for the Perceived
Service Quality of Banks” International Journal of Bank Marketing, Vol. 18, No.2, pp. 84-91.
Berry, L. L., Parasuraman, A., & Zeithaml, V. A. (1988). “The Service-quality Puzzle”, Business
Horizons, Vol. 31, No. 5, pp. 35-43.
Broderick, A.J. & Vachrapompuk, S. (2002) “Service Quality in Internet Banking: the
Importance of Customer Role” Marketing Intelligence &Planning, Vol. 20, No. 6, pp. 327-335.
Campbell, D.T., & FiskeD.W. (1959) Convergent and Discriminant Validation by the Multitrait-
Multimethod Matrix. Psychological Bulletin, Vol. 56, No. 2, pp. 81-105.
Cowling, A., & Newman, K. (1995). Banking on People: TQM, Service Quality, and Human
Resources. Personnel Review, Vol. 24, No. 7, pp. 25-40.
Cronin, Jr, J. J., & Taylor, S. A. (1992) “Measuring Service Quality: A Reexamination and
Extension”, The Journal of Marketing, Vol.56, pp. 55-68.
Cronin, Jr, J. J. (2003), “Looking Back to See Forward in Services Marketing: Some Ideas to
Consider”, Managing Service Quality, Vol. 13 No. 5, pp. 332-337.
Dabholkar, P. A., Shepherd, C. D. & Thorpe, D. I. (2000) “A Comprehensive Framework for
Service Quality: An Investigation of Critical Conceptual and Measurement Issues Through a
Longitudinal Study” Journal of Retailing, Vol. 76, No. 2, summer, pp. 131-139
Page 89
81
Daniel, E. (1999) “Provision of Electronic Banking in the UK and the Republic of Ireland”
International Journal of Bank Marketing, Vol. 17. No. 2, pp.72-83.
De Ruyter, K., Wetzels, M. & Kleijnen, M. (2001) “Customer Adoption of E-Service: An
Experimental Study”, International Journal of Service Industry Management, Vol. 12 No. 2, pp.
184-207.
Doll.W.J. &Torkzadeh, G. (1988) “The Measurement of End-User Computing Satisfaction”,
MIS Quarterly, Vol. 12, No.2, pp.259-274.
Ennew, C. T., Reed, G. V., & Binks, M. R. (1993).”Importance-performance Analysis and the
Measurement of Service Quality”, European journal of marketing, Vol. 27, No.2, pp. 59-70.
Ghosh, S., Surjadaja, H. and Antony, J. (2004) “Optimization of the Determinants of E-service
Operations”, Business Process Management Journal, Vol. 10 No. 6, pp. 616-635.
Ho, C. T. B., and Lin, W. C. (2010) Measuring the Service Quality of Internet Banking: Scale
Development and Validation. European Business Review, Vol. 22, No. 1, pp.5-24.
Jayawardhena, C. (2004) “Measurement of Service Quality in Internet Banking: the
Development of an Instrument” Journal of Marketing Management, Vol. 20, pp. 185-207.
Johnston, R. (1995) “The Determinants of Service Quality: Satisfiers and Dissatisfies”,
International Journal of Service Industry Management, Vol. 6, No. 5, pp. 53-71.
Jun, M., & Cai, S. (2001). “The Key Determinants of Internet Banking Service Quality: A
Content Analysis”, International Journal of Bank Marketing, Vol. 19, No. 7, pp. 276-291.
Khan, M. S., & Mahapatra, S. S. (2009) “Service Quality Evaluation in Internet Banking: An
Empirical Study in India”, International Journal of Indian Culture and Business Management,
Vol. 2, No. 1, pp. 30-46.
Page 90
82
Meuter, M. L., Ostrom, A. L., Roundtree, R. I., & Bitner, M. J. (2000) “Self-service
Technologies: Understanding Customer Satisfaction with Technology-based Service
Encounters”, The Journal of Marketing, Vol. 64, pp. 50-64.
Mols, N. P. (1998) “The Behavioral Consequences of PC Banking” International Journal of
Bank Marketing, Vol.16, No.5, pp.195–201.
Muyeed, M. A. (2012) “Customer Perception on Service Quality in Retail Banking in
Developing Countries - A Case Study”, International Journal of Marketing Studies. Vol. 4, No.
1, pp.116.
Oppewal, H. & Vriens, M. (2000) “Measuring Perceived Service Quality Using Integrated
Conjoint Experiments” International Journal of Bank Marketing, Vol. 18, No. 4, pp. 154-169.
Parasuraman, A., Zeithaml, V. A. & Berry, L. L. (1985) “A Conceptual Model of Service
Quality and Its Implications for Future Research”, Journal of Marketing, Vol. 49, No. 4, pp. 41-
50.
Parasuraman, A., Zeithaml, V. A. and Berry, L. L. (1988) “SERVQUAL: A Multiple-Item Scale
for Measuring Consumer Perceptions of Services Quality”, Journal of Retailing, Vol. 64 No. 1,
pp. 12-40.
Parasuraman, A., Zeithaml, V. A. & Malhotra, A. (2005) “E-S-QUAL, A Multiple-Item Scale for
Assessing Electronic Service Quality”, Journal of Service Research, Vol.7, No. 3, pp. 213-233.
Rowley, J. (2006) “An Analysis of the E-Service Literature: Towards A Research Agenda”,
Internet Research, Vol. 16 No. 3, pp. 339-359.
Sathye, M. (1999) “Adoption of Internet Banking by Australian Consumers: An Empirical
Investigation” International Journal of Bank Marketing, Vol.17, No.7, pp. 324–334.
Santos, J. (2003), “E-Service Quality: A Model of Virtual Service Quality Dimensions”,
Managing Service Quality, Vol. 13, No. 3, pp. 233-46.
Page 91
83
Siu, N. Y. M., and Mou, J. C. W. (2005) “Measuring Service Quality in Internet Banking: The
Case of Hong Kong” Journal of International Consumer Marketing, Vol. 17 No. 4, pp.99-116.
Tarawneh Al & Khaled A. (2012) “Measuring E-Service Quality from the Customers'
Perspective: An Empirical Study on Banking Services” International Research Journal of
Finance and Economics, Issue 91, pp. 123-137.
Wang, Y., Lo, H. P. & Hui, Y. (2003) “The Antecedents of Service Quality and Their Influences
on Bank Reputation: Evidence from the Banking Industry in China” Managing Service Quality,
Vol. 13, No.1, pp. 72-83.
Yang, Z., Jun, M. & Peterson, R.T. (2004) “Measuring Customer Perceived Online Service
Quality: Scale Development and Managerial Implications”, International Journal of Operations
& Production Management, Vol. 24 No. 11, pp. 1149-1174.
Yang, Z., & Fang, X. (2004) “Online Service Quality Dimensions and Their Relationships with
Satisfaction: a Content Analysis of Customer Reviews of Securities Brokerage Services”
International Journal of Service Industry Management, Vol. 15 No. 3, pp. 302-26.
Yang, Z., Peterson, R.T. & Huang, L. (2000) “Taking the Pulse of Internet Pharmacies”,
Marketing Health Services, Vol. 21, No. 2, pp. 5-10.
Zavareh, F. B., Ariff, M. S. M., Jusoh, A., Zakuan, N., Bahari, A. Z. & Ashourian, M. (2012) “E-
Service Quality Dimensions and Their Effects on E-Customer Satisfaction in Internet Banking
Services”, Procedia-Social and Behavioral Sciences, 40, pp. 441-445.
Zeithaml, A. V., Berry, L. L. & Parasuraman, A. (1996) “The Behavioral Consequences of
Service Quality” Journal of Marketing, Vol. 60, pp.31-46.
Zeithaml,V. A. (2002) “Service Excellent in Electronic Channels”, Managing Service Quality,
Vol. 12, No. 3, pp. 135-138.
Page 92
84
A separate part of a collection, handbook, or conference proceedings
Fredriksson, O. (2003) “Internet-Based Self-Services: Relational Aspects of E-Banking–a
Private Client Survey Analysis”, IMIT Working Paper Series, Institute for Management of
Innovation Technology, Information Systems Department, Karlstad University, Karlstad,
Sweden, pp. 136.
Grönroos, C (1982) Strategic Management and Marketing in the Service Sector, Helsingfors:
Swedish School of Economics and Business Administration.
Lehtinen, U & Jarmo R. L (1982), “Service Quality: A Study of Quality Dimensions”,
unpublished working paper, Helsinki: Service Management Institute, Finland OY.
Lewis, R. C., & Booms, B. H. (1983) “The Marketing Aspects of Service Quality”, In L. Berry,
G. Shostack & G.Upah(eds.), Emerging Perspectives on Services Marketing, pp. 99-107.
Mattila, M., Karjaluoto, H., & Pento, T. (2002) Internet banking adoption factors in Finland.
University of Jyväskylä.
Sasser, W. E., Olsen, R. P. & Wyckoff, D. D. (1978) Management of Service Operations: Text,
Cases and Readings, Boston: Allyn& Bacon.
Wu, Y. L., Chang, M. C., Yang, P. C. & Chen, Y. J. (2008, December). The Use of E-SQ to
Establish the Internet Bank Service Quality Table. In Industrial Engineering and Engineering
Management, IEEM 2008. IEEE International Conference on ieee, pp. 1446-1450
Yang, Z. (2001) “Customer Perceptions of Service Quality in Internet-Based Electronic
Commerce” Proceedings of the 30th EMAC Conference, Bergen, pp. 8-11.
Zeithaml, V.A., Parasuraman, A. and Malhotra, A. (2000), “E-Service Quality: Definition,
Dimensions and Conceptual Model”, working paper, Marketing Science Institute, Cambridge,
MA.
Page 93
85
Internet:
Chen S.Y. Online. Available at
http://www.mcu.edu.tw/department/management/stat/ch_web/etea/SPSS/Applied_Multivariate_
Data_Analysis_ch7.pdf (09.04.2013)
Enfodesk . China's Online Banking Market Monitoring during the Fourth Quarter of 2010.
Online. Available at http://www.enfodesk.com (28.04.2013).
iResearch Consulting Group, Online. Available at
http://wenku.baidu.com/view/ccc254200722192e4536f6d9.html (28.03.2013)
iResearch Consulting Group, Online. Available at
http://wenku.baidu.com/view/b2b76b8a680203d8ce2f2451.html (02.05.2013).
Michael J. M., Ph.D. Online. Available at
http://michaeljmillerphd.com/res500_lecturenotes/reliability_and_validity.pdf (19.04.2013)
Oakshott, L. (1998). Essential Quantitative Methods for Business, Management and Finance.
PALGRAVE. Liang W.M. Online. Available at
http://www2.cmu.edu.tw/~biostat/online/teaching_corner_041-2.pdf (28.03.2013)
Sage Publications. Online. Available at
http://www.sagepub.com/upm-data/40006_Chapter1.pdf (02.04.2013)
Wu T.X. Online. Avaliable at http://tx.liberal.ntu.edu.tw/Jx/Methodology/Analy-
TxStatisticsCanon-Factor_CFA.htm#PCA (20.05.2013)
Zaman K.. Online. Available at http://www.arraydev.com/commerce/jibc/2011-
08/KhalidZAMAN.pdf(27.04.2013)
Page 94
86
APPENDICES
Appendix 1 Development of online banking in China
Source: http://wenku.baidu.com/view/b2b76b8a680203d8ce2f2451.html
Page 95
87
Appendix 2 SERVQUAL
Appendix 2.1 Dimensions of Perceived service quality (SERVQUAL, 1985)
Source: Grönroos, “Service Management and Marketing: A customer Relationship
Management Approach”, 2000, pp.7
Appendix 2.2 Revised Dimensions of Perceived service quality (SERVQUAL, 1988)
Service Quality
Dimension Definition
Tangibles
The appeal of facilities, equipment, material and employees
which the service firm uses to deliver its services to the customer
Reliability Consistency of performance and dependability
Responsiveness Willingness or readiness of employees to provide service
Assurance
The knowledge and courtesy of employees and their ability to
convey trust and confidence
Empathy
The providing of caring, individualized attention to
customers
Source: Grönroos, “Service Management and Marketing: A customer Relationship
Management Approach”, 2000, pp.74
Service Quality
Dimension Definition
Reliability Involves consistency of performance and dependability
Responsiveness
Willingness or readiness of employees to provide service
(timeliness of service, giving prompt service)
Competence Possession of the required skills and knowledge to perform the service
Access Approach ability and ease of contact
Courtesy Politeness, respect, consideration and friendliness of contact personnel
Communication
Keeping customers informed in language they can understand and listening to
them
Credibility
Trustworthiness, believability, honesty, and having the
customers’ best interests at heart
Security Freedom from danger, risk and doubt
Understanding/Knowing
the customer Making the effort to understand the customer’s needs
Tangibles Physical evidence of the service
Page 96
88
Appendix 3 Cronbach’s Alpha Test of Reliabilty for the original model
Appendix 3.1 Reliability test for efficiency
Cronbach's Alpha
Cronbach's Alpha
Based on
Standardized
Items N of Items
.802 .806 6
Appendix 3.2 Reliability test for Privacy/Trust
Cronbach's Alpha
Cronbach's Alpha
Based on
Standardized Items N of Items
,807 ,801 5
Appendix 3.3 Reliability test for Responsiveness/contact
Cronbach's Alpha
Cronbach's Alpha
Based on
Standardized Items N of Items
,510 ,514 2
Page 97
89
Appendix 3.4 Reliability test for Assurance
Cronbach's Alpha
Cronbach's Alpha
Based on
Standardized
Items N of Items
.801 .806 5
Appendix 3.5 Reliability test for website design
Cronbach's Alpha
Cronbach's Alpha
Based on
Standardized
Items N of Items
.789 .789 4
Appendix 3.6 Reliability test for empathy
Cronbach's Alpha
Cronbach's Alpha
Based on
Standardized
Items N of Items
.805 .805 5
Page 98
90
Appendix 3.7 Reliability test for compensation
Cronbach's Alpha
Cronbach's Alpha
Based on
Standardized Items N of Items
.868 .868 2
Appendix 4 Cronbach’s Alpha Test of Reliabilty for the refined model
Appendix 4.1 Reliabilty test for customer experience design
Cronbach's Alpha
Cronbach's Alpha
Based on
Standardized Items N of Items
.817 .818 6
Appendix 4.2 Reliability test for Preferential and assurable treatment
Cronbach's Alpha
Cronbach's Alpha Based
on Standardized Items N of Items
.838 .831 4
Page 99
91
Appendix 4.3 Reliability test for privacy/trust
Cronbach's Alpha
Cronbach's Alpha
Based on Standardized
Items N of Items
.839 .841 4
Appendix 4.4 Reliability test for all the items
Cronbach's Alpha
Cronbach's Alpha
Based on Standardized
Items N of Items
.888 .889 14
Page 100
92
Appendix 5 CFA
Component
1
EF1 .451
EF2 .504
EF5 .645
E1 .612
E2 .600
E4 .627
R2 .744
A2 .511
C1 .711
C2 .665
P1 .704
P2 .691
P3 .695
P4 .691
Page 101
93
Appendix 6 Correlation matrix of the refined service quality scale
items
EF1 EF2 EF5 E2 E3 E4 C1 C2 R2 A2 P1 P2 P3 P4
EF1 1.000 .620 .477 .305 .295 .263 .113 .065 .113 .148 .204 .279 .273 .313
EF2 .620 1.000 .438 .308 .347 .356 .239 .176 .170 .130 .187 .336 .266 .261
EF5 .477 .438 1.000 .450 .555 .561 .339 .286 .382 .299 .312 .314 .326 .372
E2 .305 .308 .450 1.000 .554 .395 .334 .299 .303 .209 .344 .242 .355 .394
E3 .295 .347 .555 .554 1.000 .514 .384 .258 .414 .273 .354 .316 .424 .381
E4 .263 .356 .561 .395 .514 1.000 .314 .307 .384 .353 .288 .313 .396 .313
C1 .113 .239 .339 .334 .384 .314 1.000 .767 .760 .331 .401 .404 .352 .379
C2 .065 .176 .286 .299 .258 .307 .767 1.000 .685 .376 .392 .389 .302 .376
R2 .113 .170 .382 .303 .414 .384 .760 .685 1.000 .388 .493 .466 .444 .455
A2 .148 .130 .299 .209 .273 .353 .331 .376 .388 1.000 .348 .287 .238 .285
P1 .204 .187 .312 .344 .354 .288 .401 .392 .493 .348 1.000 .650 .626 .543
P2 .279 .336 .314 .242 .316 .313 .404 .389 .466 .287 .650 1.000 .586 .427
P3 .273 .266 .326 .355 .424 .396 .352 .302 .444 .238 .626 .586 1.000 .582
P4 .313 .261 .372 .394 .381 .313 .379 .376 .455 .285 .543 .427 .582 1.000
Page 102
94
Appendix 7 Survey on Measuring Service Quality in Online Banking
Part 1. Demographic information
1. Gender
□Male □Female
2. Age (years old)
□18 or below □19~28 □29~38 □39 or above
3. Education background
□High school diploma or below □Junior college diploma □Undergraduate degree
(Bachelor’s degree) □Graduate degree (Master’s degree) or above
4. Occupation
□Business (enterprise) managerial and technical personnel
□ Government officer □ Professional (science and education, cultural, health)
□Student □Self-employed □Worker □Unemployed people □Others
5. Salary per month (RMB)
□Below 1000 □1000-3000 □3000-5000 □Above 5000
Part 2. Concerning the information of using online banking as a user
1. Which online banking are you used more often?
□Bank of China □Agricultural Bank of China □ China Construction Bank
□Industrial and Commercial Bank of China(ICBC) □Bank of Communication
□ China Merchants Bank □China Minsheng Banking Corp.LTD
□China Citic Bank □ Huishang Bank
Page 103
95
2. How often do you use online banking per month?
□twice or below □3-5 times □6-8 times □8 times or above
3. The main reason to use online banking
□Convenience for online shopping □Necessity need for some transactions
□Time saving and convenience □Inconvenience for going to business hall
4. Which services that online banking offers would you like to use most often? (Please
select maximum 3)
□Funds transfer □Investment and financing □Self-service payment
□Online bill payment □Viewing account balances and recent transactions
5. Which service quality attributes do you pay most attention to when using online
banking? (Please select maximum 3 and prioritize them)
□Security □Brand influence □cheap charging and fees (e.g. transaction fees)
□ Qualities of customer service staff □ Convenience and ease of use □Customized
service
6. Where do you get the information of online banking?
□Net media □Word-of-mouth advertising from friends □Advertisement from TV
□Promotion from banking personnel □newspapers and magazines □Others
7. How many years have you used online banking?
□Below one year □1-3 years □3-5 years □ Above 5 years
Page 104
96
Part 3. Service Path
Please evaluate the following service quality attributes according to your
experience of using online banking.
Attributes affecting service quality Strongly
disagree
Disagree Neutral Agree Strongly
agree This site can process information and
transaction quickly;
A user can get the information from the
website that is needed easily and quickly;
It loads page quickly;
It makes it easy to get anywhere on the site;
It is possible to use online banking utilities
without a lot of effect;
The information provided by the website is
easily understandable and ease of handling.
This site can protect personal information of
users and no misuse;
Transaction can be completed in a safe
mode;
It offers several of security tools (U dun,
dynamic password);
This site protects information about my
bank cards;
It can deal with and solve the problems
promptly;
This site can provide adequate remedy to
deal with the problems (e.g. different kinds
of solutions)”.
A user is confidence in the online banking
services;
The system is stable and reliable which
would not have the situation of transaction
termination;
Customer service personnel have good
professional knowledge and ability;
The information provided by website is
accurate and reliable;
Page 105
97
Part 4. Open question
1. Which online banking service is considered to be superior in terms of service quality?
Why?
2. Do you have some advice for improvement in the future development of online banking?
The reputation and image of this online
banking is good;
Customer service personnel have good
service attitude;
This website can provide different ways of
logging into online banking which is very
flexible (e.g. user name, account number);
Matters relating to customer interests and
rights are prominently presented on the
website;
The site map of internet banking portal is
clear, the content and picture of the portal
site are user-friendly;
The information provided by website is
always updated in time.
It offers a variety of electronic statements
query;
This website can provide customized
services;
Online banking offers full information about
features of various products or services (e.g.
fund, stock);
Online banking is authorized to support and
deal with a lot of business for consumers
online: buying financial products online;
This site provides the video demo showing
how to use online banking utilities it offers;
The online banking can charge reasonable
fees (transaction fees);
The online banking can provide preferential
rates and charging fees.