MECHANICAL PROPERTIES OF THE MYOTOMALMUSCULO-SKELETAL SYSTEM OF RAINBOW
TROUT, SALMO GAIRDNERI
BY C. L. JOHNSRUDE AND P. W. WEBB
School of Natural Resources, University of Michigan, Ann Arbor,MI 48109-1115, U.SA.
Accepted 5 June 1985
SUMMARY
Net forces and velocities resulting from in situ contractions of themyotomal musculature on one side of the body were measured at the hypuralbones. Forces, velocities and power were determined with the body bentinto a range of postures typical of those observed during fast-start swim-ming. For trout averaging 0-178 m in length and 0-0605 kg in body mass, themuscle system exerts a maximum normal force of 2-2 N at the base of thecaudal fin. This force is equivalent to 11*8 kN m~2 based on the mean cross-sectional area of the myotomal muscle. The maximum velocity wasl ' l lms" 1 , and the maximum mechanical power output, 0-64W, or42-4 W kg"1 muscle.
Based on estimates of swimming resistance, these results would suggestacceleration rates of 7-5 to 16-5 ms~2, similar to averages observed duringfast-starts. Maximum sprint speeds would range from 6-5 to 17-8 bodylengths s"1, spanning the range of maximum speeds reported in theliterature. It is suggested that maximum speed is limited by interactionsbetween muscle contraction frequency and endurance.
Losses in the mechanical linkages between muscle fibres and propulsivesurfaces were estimated at about 50 % for power with possibly greater lossesin force transmission.
Maximum force and power did not vary over the range of postures tested,supporting Alexander's (1969) suggestions that white muscle shouldcontract over a small portion of the resting length of the fibres.
INTRODUCTION
Most knowledge of fish locomotion is derived from studies of swimming kinematicsand rates of oxygen consumption (Bainbridge, 1958, 1963; Brett, 1964; Brett & Glass,1973) and is usually interpreted within a framework derived from hydromechanicalmodels (Webb, 1975; Wu, 1977; Wu & Yates, 1978; Webb, Kostecki & Stevens,1984). Fairly good agreement has been found between power requirements predictedfrom these models and observed oxygen consumption rates for fish swimming atsteady cruising speeds (Webb, 1971, 1975). However, few data exist for power
Key words: Muscle, rainbow trout, swimming.
72 C. L. JOHNSRUDE AND P. W. WEBB
available and swimming resistance at high swimming speeds and acceleration rates,activities where energy requirements are not immediately met via oxygen consump-tion (Wardle, 1977; Jones, 1982).
High performance activities are powered anaerobically by the myotomal muscles(Hudson, 1973; Blight, 1977; Bone, Kicenuik & Jones, 1978), which comprise up to55% of total body mass (Webb, 1978). Therefore, the dynamic properties of themusculo-skeletal system could be measured to determine power input for fish burstswimming performance, which in turn could be used to evaluate performance limits(Gray, 1936; Wardle, 1975).
However, the geometric arrangement of mechanical components within the fishmuscle system is extremely complex (Nursall, 1956; Willemse, 1966; Alexander,1969. Wainwright, 1983). Although the physiology of fish muscle fibres themselvesdoes not differ substantially from that of other vertebrates (Johnston, 1981, 1983), thefunctional consequences of the complex musculo-skeletal geometry are unknown.Thus, useful forces transmitted through the system cannot be predicted from themuscle properties alone.
The present experiments examine the performance of the myotomal musculo-skeletal system by evaluating net forces and velocities at the body surface resultingfrom in situ contractions of fish axial musculature. The approach treats the myotomalsystem as a black box whose principal action is to bend the body when its isotonicforce-velocity relationships can be quantified for typical swimming postures.
MATERIALS AND METHODS
Fish
Rainbow trout (Salmo gairdneri Richardson) were obtained from a local hatchery.Fish were kept in 200-litre oval tanks, and acclimated to 14 °C, the temperature of thepreparation used in experiments described below, for at least 3 weeks prior to experi-ments. Tanks were continuously flushed with water, and a submerged pumpgenerated a current against which fish swam. Air stones were used to maintain dissol-ved oxygen levels close to air saturation.
ProcedureIndividual fish were carefully netted with minimal chasing and quickly (<ls)
immersed in water containing 1:10000 tricaine methanesulphonate (MS 222). Res-piratory movements ceased in approximately 5 min, and fish did not respond to tactilestimuli. Total body mass was then measured to the nearest 0-01 g and fork length tothe nearest 0-1 cm.
Myotomal muscle was removed from one side of the body and an inelastic threadwas sewn through the centre of the hypural complex. This 'half-myotomal' prepara-tion was placed on its side on a holding apparatus with the intact muscle upwards (Fig.1). The head was clamped firmly up to the cleithrum, while the remainder of the bodylay freely on a rigid aluminium template, 0*64 cm thick. The template was orientedto apply forces and measure velocities normal to the hypural complex. The thread
Trout musculo-skeletal dynamics 73
-1-59
Fig. 1. Holding apparatus used in isotonic experiments showing the half-myotomal preparation ondifferent curved templates. Top:a , fish backbone; 6, headclamp;c, pan for applying a range of loadsto the preparation; d, beam fulcrum; e, adjustable stops;/, isotonic displacement transducer andgrigid Plexiglas base. Bottom: replaceable curved aluminium templates with different curvature radiiand mean L/R values for experimental fish.
attached to the hypural complex passed through a slit in the template and was connec-ted to a low-mass beam parallel to the caudal fin. Muscle contractions lifted loadsattached to the beam close to a fulcrum. Adjustable stops were used to limit caudal
74 C. L. JOHNSRUDE AND P. W. WEBB
Table 1. Morphometric measurements for fish used in isotonic experiments
L/R represents posture as relative radius of curvature.Values are given as mean ± 2 s.E.P values are given from analysis of variance to test for differences between groups.iV = number of fish in each group.
fin excursions to 1 cm to sample discrete postures when contractions would occur oversmall changes in fibre length. An isotonic myograph transducer was connected to thelever to measure tail velocities normal to the caudal fin as muscle contractions bent thebody, raising the tail. Velocities were displayed on an oscilloscope, and were recordedon tape and a pen recorder.
Several template shapes were used to bend the body into a range of curved posturestypical of those seen in burst performances (Fig. 1). These were based on bodypostures during fast-starts when body bending geometry is most simple and perfor-mance is maximal (Weihs, 1973; Eaton, Bombardieri & Meyer, 1977; Webb, 1978).Postures were quantified in terms of relative radius of curvature, L/R, where L ismyotome length measured from the posterior edge of the cleithrum to the point ofthread attachment to the hypural complex, and R is radius of curvature. This alsoprovides an index of relative muscle length. The ratio L/R is zero when the body isstretched-straight, positive when the contracting muscle is on the concave side of abend (muscle fibres are shorter than resting length), and negative when on the convexside (fibres stretched relative to resting length).
Intramuscular electrodes were inserted into the myotomal muscle at 1-cm intervals.Muscle contraction was elicited by a d.c. stimulus of 10 V cm"1 for 10 ms, determinedas the minimum stimulus giving maximum contraction in preliminary experiments.Approximately 20 s was allowed between contractions. Velocities measured for thehypural complex were compared for each stimulus. Velocities for a given load wereconstant for about 8 min before declining due to fatigue. Data from fatigued musclewere rejected. The long period of constant muscle performance in the repeatedcontractions suggests that the small but inevitable amount of swimming by the fish atcapture did not affect the performance of the preparation.
At the end of an experiment the length of the myotome, L, was measured. Tracingswere made of muscle cross-sections at 8 to 11 equal intervals along the myotomelength. Muscle cross-sectional areas were determined from these tracings. Myotomalmuscle was also separated from the vertebral column, spines, abdominal ribs and skin,and weighed to the nearest 001 g. Intramuscular bones were included with the
Trout musculo-skeletal dynamics 75
muscle. There were no significant differences (a —0-2) between classes for mor-phometric measurements that might influence measured muscle properties (Table 1).
AnalystsBest-fit relationships between force and velocity were calculated for each prepara-
tion using linear regression techniques. Maximum force, velocity and power outputwere calculated from force-velocity equations. These data were normalized to obtainvalues of specific velocity (lateral velocity of the hypural bones/L), specific power(power output/muscle mass on one side of the body) and specific force (lateral forceat the hypural bones/mean cross-sectional area of the muscle). Force is commonlynormalized by mean muscle cross-sectional area (McMahon, 1984). This average wasused here as a reproducible area probably correlated with true physiological cross-sectional area. The details of the geometry of the myotomal musculo-skeletal systemare still unclear (Wainwright, 1983) so that the latter is unknown.
Analysis of variance was used to examine the effect of posture on these variables.Simple pairwise comparisons (Scheffe's confidence interval approach) were used toexamine differences between posture classes (Neter & Wasserman, 1974).
RESULTS
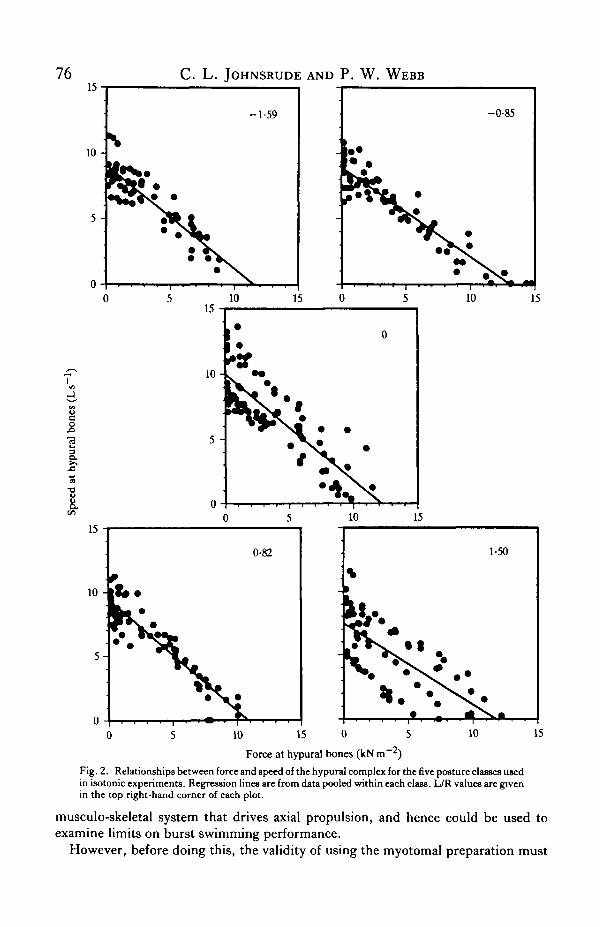
The specific force generated by contraction of the myotome, measured at thehypural bones, was inversely related to velocity measured normal to the hypuralcomplex (Fig. 2). This is consistent with expectations from other studies of musclemechanics (Abbott & Wilkie, 1953; Close, 1965; Lannergren, 1978). The force-velocity relationships were best described by simple linear regressions (f)<0006).Hill's equation, appropriate for single muscle fibres and many muscle preparations,did not describe the force-velocity data well. This departure from Hill's equation isprobably related to the complex geometry of muscle, connective tissue and skeletonin fish myotomes.
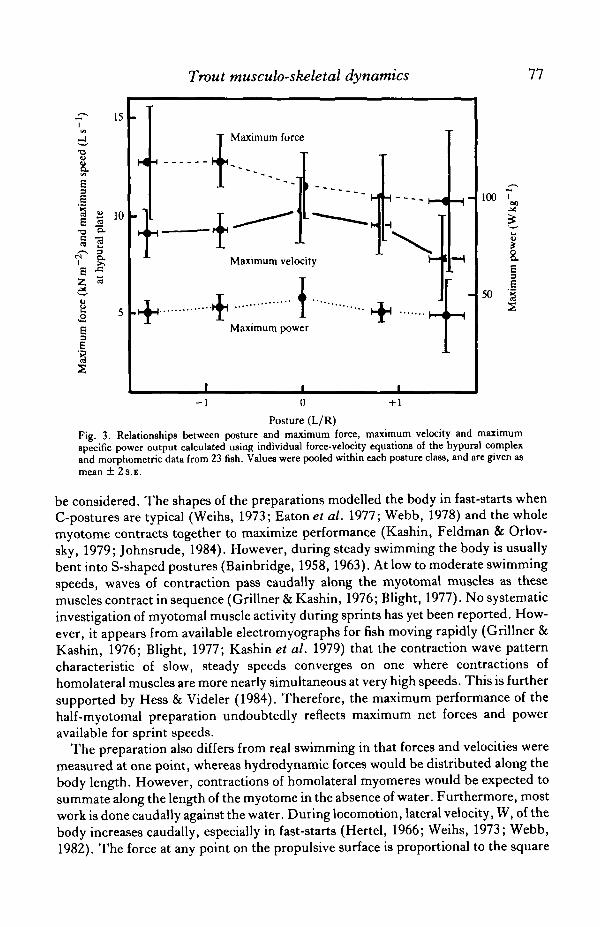
Posture had no significant effects on maximum specific force (P — 0-63), maximumspecific velocity (P = 0-29) or maximum specific power output (P = 0-66) of themusculo-skeletal preparation (Fig. 3). The maximum specific force was 11-8 ±l-02kNm~2
( X ± 2 S . E . ) . The muscle had a mean cross-sectional area of 1*9 X10~4m2, so that the maximum normal force at the hypural complex was 2-2 N.Maximum specific velocity at the hypural plates was 9-2±O08Ls~1 ( l - l lms"1) .Maximum specific power output was 42-4 ± 4-33 W kg"1 muscle or 0-64 W for a half-myotomal muscle mass of 0-0152 kg.
Although these maxima were independent of posture, some trends in the dataoccurred (Fig. 3). Maximum specific velocity and specific power were somewhathigher when the body was stretched-straight compared to curved postures. Maximumspecific force appeared higher when L/R was negative, decreasing as L/R becamepositive. However, these trends were not statistically significant (P< 0-2).
DISCUSSION
The experiments evaluate the net dynamic properties of the fish myotomal
76 C. L. JOHNSRUDE AND P. W. WEBB
o
11I
0
10-
:5 -
0 -
10 15
;
• (
0
1
0
5
10 -
5 -
0 - 1
0
0-82
5 10
-»
15
1-50
•
10 155 10 15 0 5
Force at hypural bones (kN m~2)
Fig. 2. Relationships between force and speed of the hypural complex for the five posture classes usedin isotonic experiments. Regression lines are from data pooled within each class. L/R values are givenin the top right-hand corner of each plot.
musculo-skeletal system that drives axial propulsion, and hence could be used toexamine limits on burst swimming performance.
However, before doing this, the validity of using the myotomal preparation must
Trout musculo-skeletal dynamics 11
Maximum force
100
50
IE3
E
"i
- i 0 + 1
Posture (L/R)Fig. 3. Relationships between posture and maximum force, maximum velocity and maximumspecific power output calculated using individual force-velocity equations of the hypural complexand morphometric data from 23 fish. Values were pooled within each posture class, and are given asmean ± 2s.E.
be considered. The shapes of the preparations modelled the body in fast-starts whenC-postures are typical (Weihs, 1973; Eaton et al. 1977; Webb, 1978) and the wholemyotome contracts together to maximize performance (Kashin, Feldman & Orlov-sky, 1979; Johnsrude, 1984). However, during steady swimming the body is usuallybent into S-shaped postures (Bainbridge, 1958, 1963). At low to moderate swimmingspeeds, waves of contraction pass caudally along the myotomal muscles as thesemuscles contract in sequence (Grillner & Kashin, 1976; Blight, 1977). No systematicinvestigation of myotomal muscle activity during sprints has yet been reported. How-ever, it appears from available electromyographs for fish moving rapidly (Grillner &Kashin, 1976; Blight, 1977; Kashin et al. 1979) that the contraction wave patterncharacteristic of slow, steady speeds converges on one where contractions ofhomolateral muscles are more nearly simultaneous at very high speeds. This is furthersupported by Hess & Videler (1984). Therefore, the maximum performance of thehalf-myotomal preparation undoubtedly reflects maximum net forces and poweravailable for sprint speeds.
The preparation also differs from real swimming in that forces and velocities weremeasured at one point, whereas hydrodynamic forces would be distributed along thebody length. However, contractions of homolateral myomeres would be expected tosummate along the length of the myotome in the absence of water. Furthermore, mostwork is done caudally against the water. During locomotion, lateral velocity, W, of thebody increases caudally, especially in fast-starts (Hertel, 1966; Weihs, 1973; Webb,1982). The force at any point on the propulsive surface is proportional to the square
78 C. L. JOHNSRUDE AND P. W. WEBB
of this velocity and to the local added mass, the latter a function of the square of bodydepth, D (see Lighthill, 1975). The caudal fin, supported by the hypural complex,has a large added mass, associated with the largest lateral velocities. Therefore, theforce exerted at the hypural complex measurement position is expected to representmost of the total muscle force exerted during swimming. The product of W2 timesD was calculated from data available for sprinting fish in Bainbridge (1963) and forfast starts in Weihs (1973) and Webb (1982). It was found that the caudal fincontributed at least 75 % of the total thrust.
The use of the half-myotomal preparation could yield larger forces than are actuallyexerted against water. This is because viscoelastic effects of contralateral tissue(removed in the preparation) would dissipate some energy. In practice the effect ofremoving one side of the myotome is probably negligible.
Overall, the preparation should provide good estimates of the maximum dynamicperformance of the musculo-skeletal system.
PerformanceEstimates of muscle performance have been traditionally important in attempts to
deduce the limits of swimming performance. Earlier attempts assumed that themechanical properties of the fish axial muscle system were the same as for muscle fromtetrapod limbs (see Bainbridge, 1961), implicitly regarding the complex muscle-skeleton geometry as unimportant. The present experiments attempt to address thisassumption, so that the measured forces and power outputs should be moreappropriate to calculate maximum swimming performance.
Fast-startsThe forces measured for the half-myotomal preparation can be used to estimate
performance in fast-starts. Then, acceleration resistance, F, is (Webb, 1982):
F = (Mb + M.)A, (1)
where Mb = total body mass, M, = added mass contributing to net resistance andA = acceleration rate. The sum of (Mb + M,) is the 'apparent mass'. For 0-27-kg troutused by Webb (1982), this was l-2(Mb). It is assumed that the same relationshipapplies to the 0060-kg trout used in the present experiments, so that the inertia of thesystem to be accelerated would be 0-071 kg. The force at the hypural complex was1-1 N at maximum power output, but if the contraction were initially close toisometric, the musculo-skeletal system could deliver about 2 2 N. Based on illustratedfast-start sequences for trout (see Weihs, 1973; Webb, 1976), the thrust componentaverages about 50% of the normal force exerted at the caudal fin base. Then troutwould accelerate at rates of 7-5-16-5 ms~2. These values are similar to average ac-celeration rates observed in fast-starts (Weihs, 1973; Webb, 1976, 1978).
Maximum swimming speed
Maximum swimming speed could be limited by one or more of: (a) force generatedby the musculo-skeletal system; (b) muscle power output (Bainbridge, 1961); (c)maximum tail-beat frequency and stride length (Wardle, 1975). Speeds calculated by
•au
so
.s
Trout musculo-skeletal dynamics
400
300
200
100
0 -
s Force
\
\\
Power^. — -* ~~
/ /
: /
\\
\ Tail-beat frequency
\ x stride length
y
y\\\\\\
79
50 100
Speed at hypural bones (L s )
Fig. 4. Relationships between predicted swimming speeds and the dynamics of the myotomalmusculo-skeletal system based on regression of pooled data for all experiments. Swimming speedswere calculated for the force, power and maximum tail-beat frequencies calculated for each speed ofthe tail.
the three methods are shown in Fig. 4 as a function of the velocity measured at thehypural complex for the half-myotomal preparation.
Sprint speeds associated with the force generated for the range of muscle contrac-tion velocities were calculated by equating force to drag, where drag is given by:
drag = muscle force = $£>SU 2 CDK (COS 8), (2)
where Q = density of water, S = wetted surface area (0-0108 m2 from Webb, 1976),U = swimming speed, CD = drag coefficient for an equivalent flat plate, K = modifierfor drag increments of a self-propelling flexing body. K was taken as 4 (Alexander,1967; Webb, 1975) and 6 = angle subtended by the tail to the direction of motion,which takes values of about 18° (Wu, 1971; Webb, 1975, 1977).
The boundary layer is assumed turbulent. Then,
CD = 0-016ir°-2. (3)
80 C. L. JOHNSRUDE AND P. W. WEBB
Sprint speeds expected for the muscle power output were calculated by equatingpower at various contraction velocities to the power required to overcome drag. Thepower required to overcome drag was obtained from equation 2, with both sidesmultiplied by U and replacing cos 6 with Froude efficiency, assumed to be 0-95 (Wu,1971).
The third method of estimating speed derives from ideas developed by Wardle(1975). He argued that the limit of fish swimming speed is determined by theminimum twitch time of the myotomal muscle. He calculated maximum tail-beatfrequency from the twitch time, which gives swimming speed when multiplied bystride length (the distance travelled per beat, independent of swimming speed).Bainbridge (1958) found the stride length of rainbow trout was about 70% of totallength.
Twitch times were not recorded here. Instead maximum tail-beat frequencies werecalculated from maximum speeds of the hypural bones of the musculo-skeletalpreparation and the expected tail-beat ampitude. The latter data were obtained fromBainbridge (1958) when the amplitude would be 0-03 m for fish of the size used here.This gives a value of tail-beat frequency of 93 Hz at maximum power output. Incontrast, the minimum twitch time measured by Wardle (1975) for fish of the size usedhere and at the same temperature was 27 ms, giving a maximum tail-beat frequencyof 18-5 Hz. These two methods would be expected to give comparable values formaximum tail-beat frequency. The difference suggests that contractions may beprolonged beyond the duration of a single twitch in order to complete a tail beat atmaximum sprint speeds. Webb (1980) also found times required to complete tail beatsin fast-starts were longer than the minimum twitch times measured by Wardle. Thisimplies that the attractively simple method of calculating maximum sprint speeds asdescribed by Wardle is inadequate.
The three approaches to estimating speed limits do not give a common intersection(Fig. 4) and predicted maximum speeds were quite variable, ranging from 6-5 to17*8 L s"1 (body lengths per second). Thus the maximum power output of the muscle(0-64 W) could support a maximum speed of 1-65 ms"1 (9-3 Ls"1), while the thrustat maximum power (1-1 N) is sufficient to propel the fish at 3-17ms~' (17-8Ls~').However, at maximum muscle power, the tail-beat frequency would be 9-3 Hz,sufficient to propel the fish at only 1-lSms"1 (6-5 Ls"1). These speeds are in thepublished range of 2 to 17Ls"1, but sprint speeds for salmonids of the size used inthe present experiments typically fall around 11 Ls"1 (Bainbridge, 1958; Blaxter,1969; Beamish, 1978). Then the maximum speed of 17-8Ls"1, predicted fromforces, seems much too high, while that of 65 Ls"1, obtained from the tail-beatfrequency at maximum power, is too low. Therefore, maximum speeds are presum-ably determined by some combination of muscle force, power and contraction speed.Reconciling sprint speed and the musculo-skeletal system properties is most easilyconsidered at the intersection points of the various curves shown in Fig. 4.
The intersection point of the swimming speed curves based on power and tail sweepspeeds would represent the most obvious combination limiting speed as thisis the only point where speeds possible on the basis of the third factor, force, exceedthat expected of the intersection. Here, the maximum speed would be about8-5 Ls"1 at a tail-beat frequency of 12Hz. However, Bainbridge (1958) showed that
Trout musculo-skeletal dynamics 81
trout of the size used should swim at about 11 L s"1 with a tail-beat frequency of about17 Hz. Therefore, maximum performance is not predicted by an interaction betweenpower and speed of contraction of the muscle.
The intersection between the swimming speed curves based on thrust and tailsweep speeds occurs at 10-3 Ls"1 and a tail-beat frequency of 15 Hz, which is closeto expectations (Bainbridge, 1958). However, the measured power appearsinadequate to support such speeds. In practice, higher power outputs might be poss-ible in swimming fish if the muscle were rapidly stretched prior to contraction (Abbott& Aubert, 1952; Cavagna, Komarek & Mazzoleni, 1971; Cavagna, Citterio & Jacini,1980). Alternatively, power output may be an inappropriate measure of the wayenergy is used. Instead, there could be a finite energy reserve available which can beused over a variable period of time. For example, the muscles of a fish swimming at1-65 ms~' do 064 J of work every second. A speed of l-84ms~1 (10-3 Ls"1) corres-ponds to the same amount of work done in 0-8 s, at an average muscle power outputof 0-8 W. Higher swimming speeds are sustained for shorter periods (Bainbridge,1958; Beamish, 1978), but there are no observations of both speed and endurance forspeeds maintained for very short periods.
Therefore we suggest that speed limits of fish depend on the interplay of musclecontraction speeds, muscle force, and power and endurance, and that no single factorcan be used to predict maximum speed.
Muscle losses in musculo-skeletal connections
The observations on the myotomal musculo-skeletal system can be used to obtaincrude estimates of the effectiveness of transmission of muscle force and power topropulsive surfaces by comparing the performance of the preparation with that ofexcised muscles. Myotomal muscle forces are transmitted through mechanical link-ages of myosepta, horizontal septa, dermis and vertebrae, all of which could modifythe useful muscle force converted into thrust, and waste energy (Wainwright, 1983).Maximum isometric tensions developed by teleost fast fibres range from 40 to186 kNm"2, and maximum power is about 80Wkg~! (Bainbridge, 1961; Flitney &Johnston, 1979; Altringham& Johnston, 1982; Johnston & Salamonski, 1984). Thesecompare to maximum forces of the preparation of 12 kN m~2 and maximum power of42Wkg~', suggesting 70—94% the muscle force is lost in transmission and 47 % ofthe power dissipated. These values are probably somewhat high especially for forcetransmission because appropriate cross-sectional areas for the myotomal preparationare unknown. For example, specific forces based on maximum cross-sectional areainstead of the mean would reduce the force transmission losses by half. Nevertheless,it is apparent that substantial losses in muscle performance occur in the mechanicallinkages between the fibres and the propulsive surfaces.
Muscle dynamics and fibre length
The experiments showed that posture has no significant effect on the dynamics of thewhole myotomal system (Fig. 3). Experimental studies on excised vertebrate musclehave shown an inverted U-shaped curve relating muscle stress and fibre length (Gor-don, Huxley & Julian, 1966; McMahon, 1984). Since muscle length should be relatedto posture, a similar curve might be expected for the fish myotomal preparation.
82 C. L. JOHNSRUDE AND P. W. WEBB
The absence of an inverted U-shape relationship between maximum force andpower with posture probably relates to the organization of muscle fibres in themyotome. In his mathematical analysis of myotomal muscle fibre trajectories, Alexan-der (1969) predicted that teleost fibres should only shorten by a small proportion oftheir resting length over the range of postures seen in steadily swimming and ac-celerating fish. He also suggested that the white muscle should maximize poweroutput. Under these conditions, the myotomal muscle should not only work on theplateau region of the force-length relationship, but changes in length over the normalphysiological range should not substantially change force and power output. Theindependence of maximum force and power with posture of the myotomal preparationconfirms Alexander's suggestions. In addition this indicates that the myotome cansustain delivery of large forces to the caudal fin over the whole range of the amplitudeswept by the tail during normal fish locomotion.
This work was supported by the National Science Foundation, grant numberPCM80-06069.
R E F E R E N C E S
ABBOTT, B. C. & AUBERT, X. M. (1952). The force exerted by active striated muscle during and after a changeof length. 7. Physiol., Land. 117, 77-86.
ABBOTT, B.C. SCWILKIE, D. R. (1953). The relation between velocity of shortening and the tension-length curveof skeletal muscle. J. Physiol., Lond. 120, 214-223.
ALEXANDER, R. M C N . (1967). Functional Design in Fishes. London: Hutchinson University Library.ALEXANDER, R. M C N . (1969). Orientation of muscle fibres in the myomeres of fishes. J. mar. biol. Asi. U.K.
49, 263-290.ALTRINGHAM, J. D. & JOHNSTON, I. A. (1982). The pCa-tension and force-velocity characteristics of skinned
fibres isolated from fish fast and slow muscles. J . Physiol., Lond. 333, 421—449.BAINBRIDGE, R. (1958). The speed of swimming of fish as related to size and the frequency and the amplitude
of the tail bea t .7 exp. Biol. 35, 109-123.BAINBRIDGE, R. (1961). Problems of fish locomotion. Symp. zool. Soc., Lond. 5, 13-32.BAINBRIDGE, R. (1963). Caudal fin and body movements in the propulsion of some fish. J. exp. Biol. 40, 23-56.BEAMISH, F. W. H. (1978). Swimming capacity. In Fish Physiology, Vol. VII, Locomotion, (eds W. S. Hoar
& D. J. Randall), pp. 151-187. New York: Academic Press.BLAXTER, J. H. S. (1969). Swimming speeds of fish. F. A. O. Fish. Rep. 62, 69-100.BLIGHT, A. R. (1977). The muscular control of vertebrate swimming movements. Biol. Rev. 52, 181-218.BONE, Q., KICENUIK, J. & JONES, D. R. (1978). On the role of the different fibre types in fish myotomes at
intermediate swimming speeds. Fishery Bull. Fish Wildl. Serv. U.S. 76, 691-699.BRETT, J. R. (1964). The respiratory metabolism and swimming performance of young sockeye salmon. J. Fish
Res. Bd Can. 21, 1183-1226.BRETT, J. R. & GLASS, N. R. (1973). Metabolic rates and critical swimming speeds of sockeye salmon
(Oncorhyncus nerka) in relation to size and temperature. J. Fish res. Bd Can. 30, 379—387.CAVAGNA, G. M., CITTEJUO, G. & JACINI, P. (1980). Elastic storage: role of tendons and muscles. In Com-
parative Physiology: Primitive Mammals, (eds K. Schmidt-Nielsen, L. Bolis & C. R. Taylor), pp. 231-242.Cambridge: Cambridge University Press.
CAVAGNA, G. A., KOMAREK, L. & MAZZOLENI, S. (1971). The mechanics of sprint running. J. Physiol., Lond.217, 709-721.
CLOSE, R. (1965). The relation between the intrinsic speed of shortening and duration of active state of muscle.J. Physiol., Lond. 180, 542-559.
EATON, R. C , BOMBARDIERI, R. A. & MEYER, D. L. (1977). The Mauthner-initiated startle response in teleostfish. 7. exp. Biol. 66, 65-81.
FLTTNEY, F. W. & JOHNSTON, I. A. (1979). Mechanical properties of isolated fish red and white muscle fibres.J. Physiol., Lond. 295, 49-50.
GORDON, A. M., HUXLEY, A. F. Sc JULIAN, F. J. (1966). The variation in isometric tension with sarcomerelength in vertebrate muscle fibres. 7. Physiol., Lond. 184, 170-192.
Trout musculo-skeletal dynamics 83GRAY, J. (1936). Studies in animal locomotion. VI. The propulsive powers of the dolphin. J. exp. Biol. 13,
192-199.GRILLNER, S. SCKASHIN, S. (1976). On the generation and performance of swimming in fish. In Neural Control
of Locomotion, (eds R. M. Herman, S. Grillner, P. S. G. Stein & D. G. Stuart), pp. 181-201. New York,London: Plenum Press.
HERTEL, H. (1966). Structure, Form and Movement. New York: Rheinhold.HESS, R. & VIDELER, J. J. (1984). Fast continuous swimming of saithe (Pollachiusvirens): a dynamic analysis
of bending moments and muscle power. J. exp. Biol. 109, 229-251.HUDSON, R. C. L. (1973). On the function of the white muscles in teleosts at intermediate swimming speeds.
J. exp. Biol. 58, 509-522.JOHNSRUDE, C. L. (1984). Mechanical properties of the myotomal muscle system of rainbow trout. M. S. thesis,
University of Michigan.JOHNSTON, I. A. (1981). Structure and function of fish muscles. Symp zool. Soc. Land. 48, 71-113JOHNSTON, I. A. (1983). Dynamic properties of fish muscle. In Fish Biomechanics, (eds P. W. Webb & D.
Weihs). pp. 36-67. New York: Praeger.JOHNSTON, I. A. & SALAMONSKJ, J. (1984). Power output and force-velocity relationship of red and white
muscle fibres from the Pacific blue marlin (Makaira nigricans). J. exp. Biol. I l l , 171-177.JONES, D. R. (1982). Anaerobic exercise in teleost fish. Can.J. Zool. 60, 1131-1134.KASHIN, S. M., FELDMAN, A. G. & ORLOVSKY, G. N. (1979). Different modes of swimming of the carp,
Cyprinus carpio L. J. Fish Biol. 14, 403-405.LANNERGREN, J. (1978). The force-velocity relation of isolated twitch and slow muscle fibres oiXenopus laevis.
jf. Physiol., bond. 283, 501-521LiGHTHiLL, M. J. (1975). Mathematical Biofluiddynatnics. Philadelphia: S.I.A.M.MCMAHON, T. A. (1984). Muscles, Reflexes and Locomotion. Princeton, NJ, U.S.A: Princeton University
Press.NETER, J. & WASSERMAN, W. (1974). Applied Linear Statistical Models. Illinois: Richard D. Irwin, Inc.NURSALL, J. R. (1956). The lateral musculature and swimming of fish. Proc. zool. Soc., Land. 126, 127-143.WAINWJUGHT, S. A. (1983). To bend a fish. In Fish Biomechanics, (eds P. W. Webb & D. Weihs), pp. 68-91.
New York: Praeger.WARDLE, C. S. (1975). Limit of fish swimming speed. Nature, Land. 235, 725-727.WARDLE, C. S. (1977). Effects of size on the swimming speeds of fish. In Scale Effects in Animal Locomotion,
(ed. T. J. Pedley), pp. 299—313. London, New York, San Francisco: Academic Press.WEBB, P. W. (1971). The swimming energetics of trout. I. Thrust and power output at cruising. J. exp. Biol.
55, 489-520.WEBB, P. W. (1975). Hydrodynamics and energetics of fish propulsion. Bull. Fish. Res. Bd Can. 190, 1-159.WEBB, P. W. (1976). The effect of size on the fast-start performance of rainbow trout (Sabnogairdneri Richard-
son) and a consideration of piscivorous predator-prey interactions. J. exp. Biol. 65, 157—177.WEBB, P. W. (1977). Effects of size on performance and energetics of fish. In Scale Effects in Animal Locomotion,
(ed. T . J. Pedley), pp. 315—331. London, New York, San Francisco: Academic Press.WEBB, P. W. (1978). Fast-start performance and body form in seven species of teleost fish.J. exp. Biol. 74,
211-226.WEBB, P. W. (1980). Temperature effects of acceleration of rainbow trout, Sabno gairdneri. J. Fish. Res. Bd
Can. 35, 1417-1422.WEBB, P. W. (1982). Fast-start resistance of trout.J. exp. Biol. 93, 93-106.WEBB, P. W., KOSTECKI, P. T. & STEVENS, E. D. (1984). The effect of size and swimming speed on locomotion
kinematics of rainbow trout. J. exp. Biol. 109, 77—95.WEIHS, D. (1973). The mechanism of rapid starting of slender fish. Biorheology 10, 343-350.WILLEMSE, J. J. (1966). Functional anatomy of the myosepta in fishes. Proc. K. ned. Ahad. Wet. 69C, 58-63.Wu, T. Y. (1971). Hydromechanics of swimming fishes and cetaceans. Adv. appl. Math. 11, 1-63.Wu, T. Y. (1977). Introduction to the scaling of aquatic animal locomotion. In Scale Effects in Animal
Locomotion, (ed. T. J. Pedley), pp. 203-232. London, New York, San Francisco: Academic Press.Wu, T. Y. & YATES, G. T. (1978). Hydromechanics of swimming in the tuna-like mode. In The Physiological
Ecology of Tuna, (eds G. D. Sharp & A. E. Dizon), pp. 313-339. New York: Academic Press.


![2UWL] Regulatory Affairs Director · Musculo-skeletal Conventional[4] Musculo-skeletal Superficial Thoracic/Pleural [5] P P P P 7 Exam Type, Means of Access Transesophageal Transrectal](https://static.documents.pub/doc/80x56/5ead3eb59bc84114033056d5/2uwl-regulatory-affairs-director-musculo-skeletal-conventional4-musculo-skeletal.jpg)


