Mechanism, Kinematics and T opographic Effect Analysis on Sandstorm Satellite data in Ningxia: A Case Study Hu Wendong 1,2 Gao Xiaoqing 3 (1Key Laboratory of Meteorological Disaster Preve nting and Reducing in Ningxia, Yinchuan, China 75 0002; 2Ningxia Meteorological Observatory, Yinchu an, China 750002; 3Cold and Arid Regions Environm ent and Engineering Research Institute, Chinese A cademy of Sciences, Lanzhou, China 73000)
Transcript
Mechanism, Kinematics and Topographic Effect Analysis on Sandstorm
Satellite data in Ningxia: A Case Study
Hu Wendong1,2 Gao Xiaoqing3
(1Key Laboratory of Meteorological Disaster Preventing and Reducing in Ningxia, Yinchuan, China 750002; 2Ningxia Meteorological Observatory, Yinchuan, China 750002; 3Cold and Arid Regions Environment and Engineering Research Institute, Chinese Academ
y of Sciences, Lanzhou, China 73000)
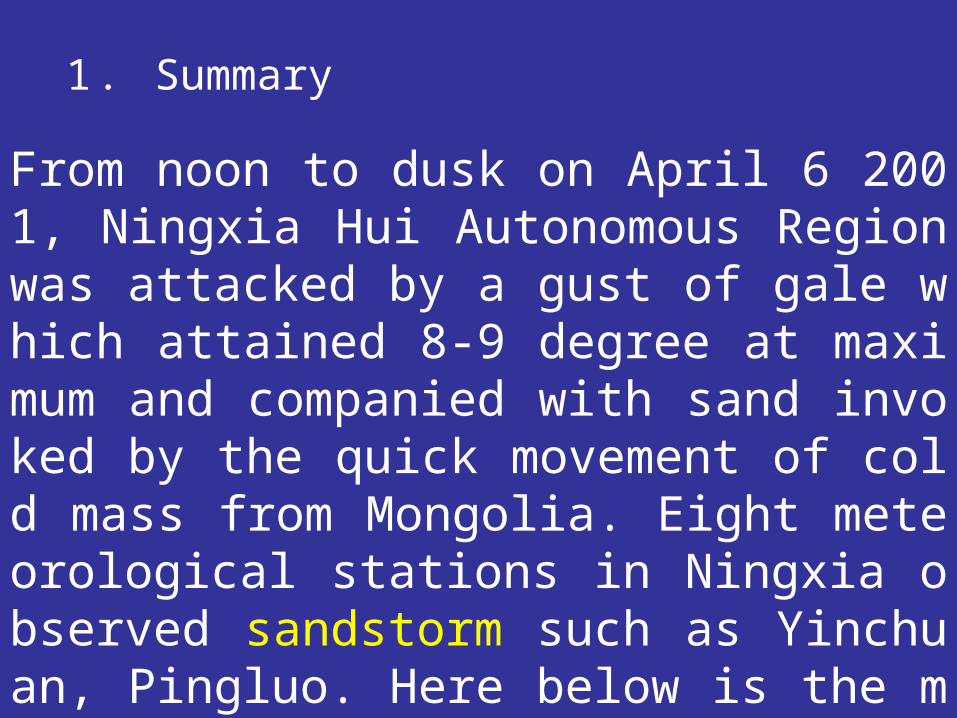
1 . Summary
From noon to dusk on April 6 2001, Ningxia Hui Autonomous Region was attacked by a gust of gale which attained 8-9 degree at maximum and companied with sand invoked by the quick movement of cold mass from Mongolia. Eight meteorological stations in Ningxia observed sandstorm such as Yinchuan, Pingluo. Here below is the meteorological record.
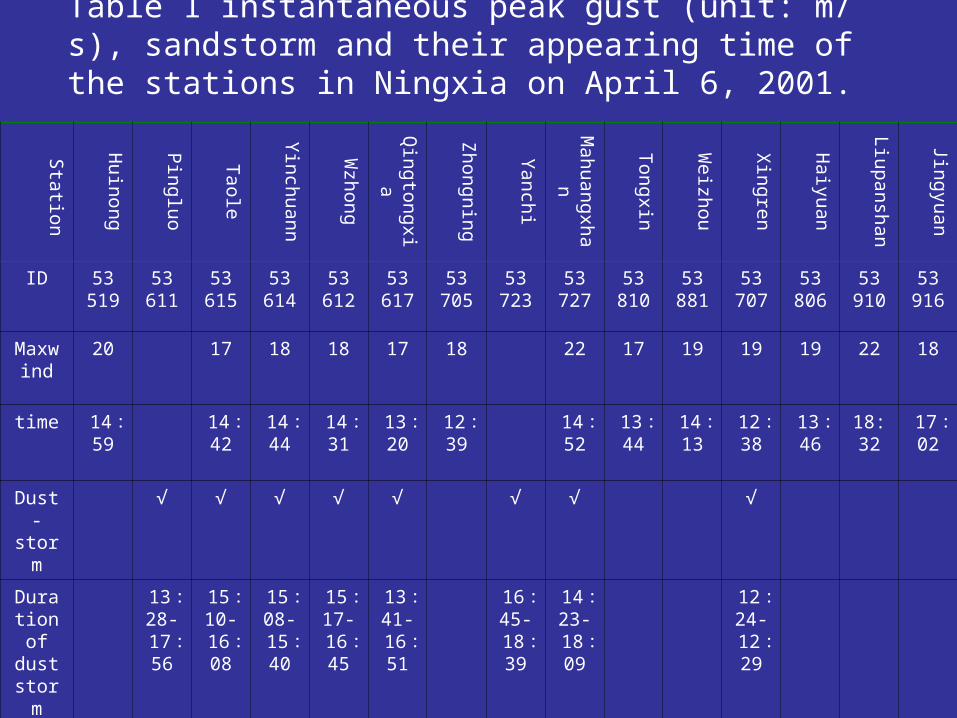
Table 1 instantaneous peak gust (unit: m/s), sandstorm and their appearing time of the stations in Ningxia on April 6, 2001.
Station
Huinong
Pingluo
Taole
Yinchuann
Wzhong
Qingtongxia
Zhongning
Yanchi
Mahuangxhan
Tongxin
Weizhou
Xingren
Haiyuan
Liupanshan
Jingyuan
ID 53519
53611
53615
53614
53612
53617
53705
53723
53727
53810
53881
53707
53806
53910
53916
Maxwind
20 17 18 18 17 18 22 17 19 19 19 22 18
time 14:59
14:42
14:44
14:31
13:20
12:39
14:52
13:44
14:13
12:38
13:46
18:32
17:02
Dust-storm
√ √ √ √ √ √ √ √
Duration of
duststorm
13:28-17:56
15:10-16:08
15:08-15:40
15:17-16:45
13:41-16:51
16:45-18:39
14:23-18:09
12:24-12:29
2 . Synoptic analysis2.1 Prophase features
• At 08:00 BST on April 1st 2001, at 500hP, east Asia trough lay in east Japan, Area expanded from Xinjiang to Siberia was controlled by a high ridge, the strong cold mass followed the trough.
• Because of the ridge, the temperature of Ningxia from April 1st to 5 was higher than that of historical mean. The anomaly was 5.3 over 24 stations, among them the lo℃west was 3.3 at Xiji℃ , and the highest was 6.6 at Daw℃ukuo. The precipitation anomaly was negative except the 4 stations in the southern part of Ningxia. The shortage of precipitation, higher temperature made the topsoil much drier; it was favourable for the sandstorm.
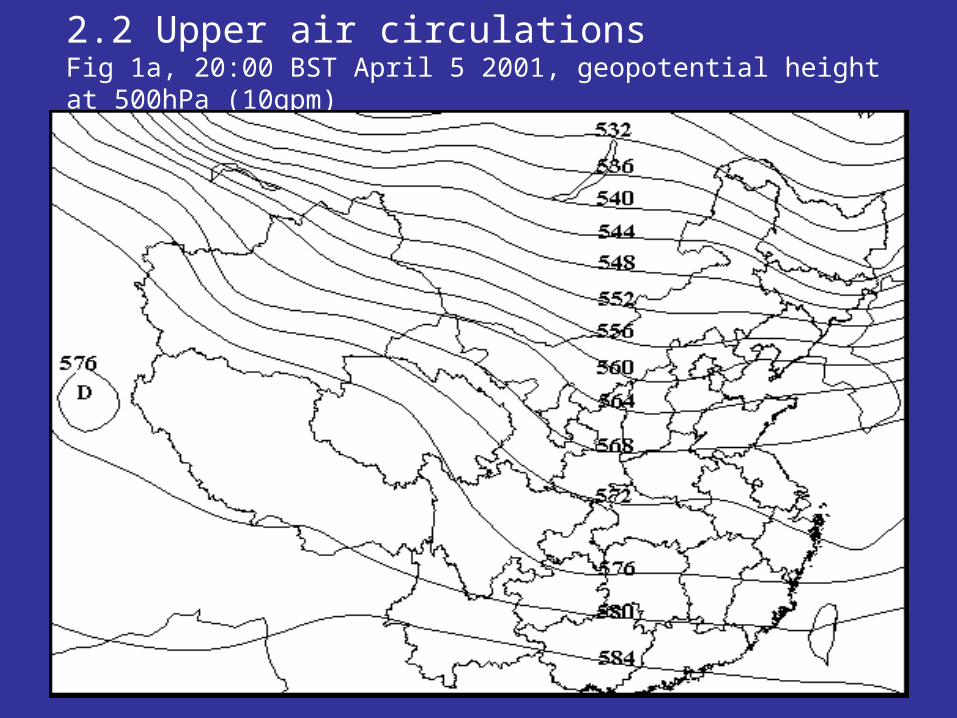
2.2 Upper air circulationsFig 1a, 20:00 BST April 5 2001, geopotential height at 500hPa (10gpm)
2.3 Surface situation
Fig1b, 08:00 BST, April 6 2001, surface analysis
Thin line: sea-level pressure, thick line: allobar in 24h, (hPa).
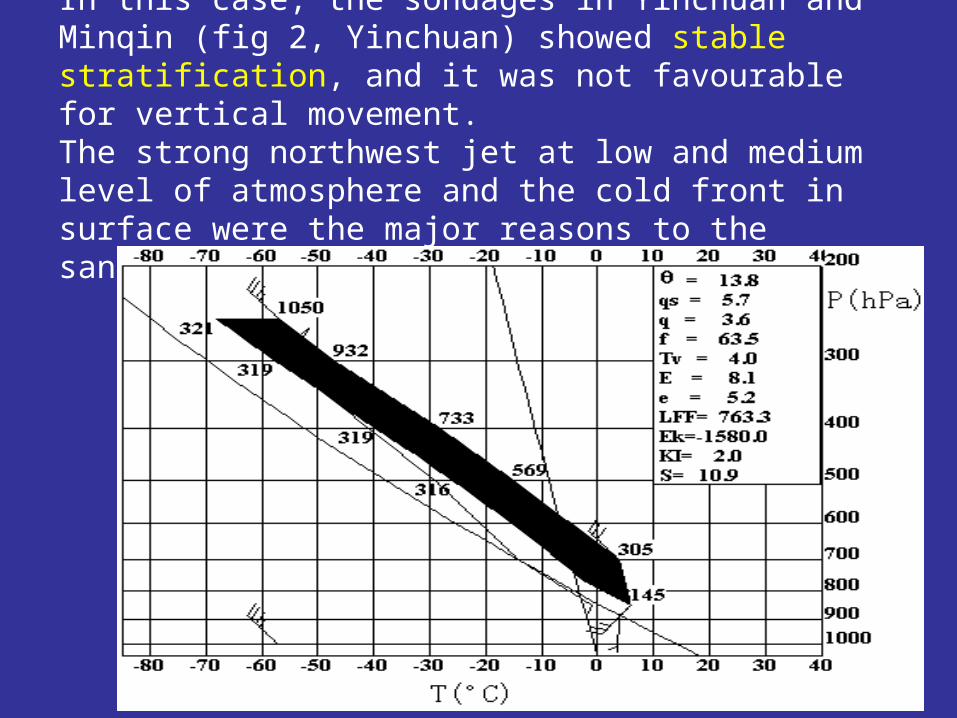
In this case, the sondages in Yinchuan and Minqin (fig 2, Yinchuan) showed stable stratification, and it was not favourable for vertical movement.The strong northwest jet at low and medium level of atmosphere and the cold front in surface were the major reasons to the sandstorm.
3. Development and evolvement of system
• At 08:00 BST April 6, the wind at 500hPa increased. Meanwhile the surface chart indicated the Ningxia was clear with pretty high visibility, it was easy to absorb solar radiation here, and provided energy for the development of weather system. At noon, the cold air coming from Hexi and Alaxar, and invaded Ningxia, cold front made the visibility, temperature and humidity dropped greatly, and the wind speed increased. The flying dust and sandstorm were observed after the cold front passed. Take Yinchuan as an example (fig 3), the cold front was passing around 14:00, instantaneous velocity of wind reached 18.1m/s, the sand with gale made the visibility fell, and during 15:08 to 15:40 attained the standard of sandstorm.
Fig 3, April 6 2001, temporal variations of pressure (a), temperature (b), relative humidity(c), visibility (d), and wind speed (e) in Yinchuan
4. Satellite image features
4.1 Identify and characteristics of satellite image • The humidity at low level in this case was very low. • High humidity areas were high clouds in satellite images. • The positions of high clouds could be identified from vapour
image, and the other high grey level regions in infrared images were sands according to experience.
• In the image at 09:00 BST, the cold front clouds could be found stretching from east part of Alaxar to Hexi, the bright temperature was low and the low clouds covered east and south part of Gansu province.
• Stable stratification• The sand movement was confined to the vicinity of surface, the
even bright temperature in the image is the major feature and the gradient of bright temperature was pretty low.
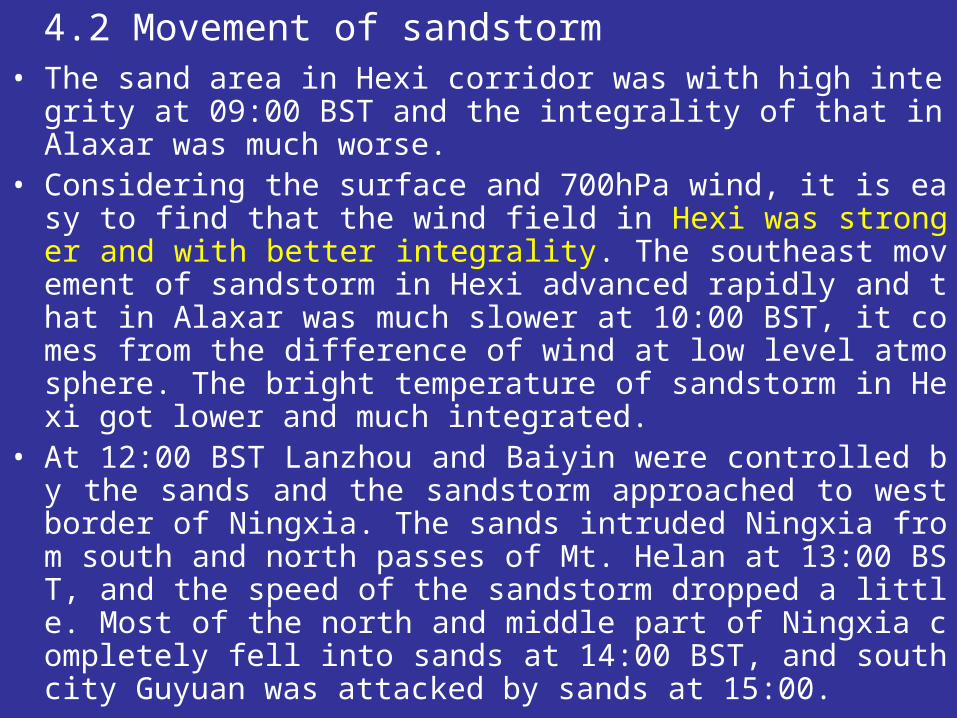
4.2 Movement of sandstorm• The sand area in Hexi corridor was with high integrity at 09:00
BST and the integrality of that in Alaxar was much worse. • Considering the surface and 700hPa wind, it is easy to find that
the wind field in Hexi was stronger and with better integrality. The southeast movement of sandstorm in Hexi advanced rapidly and that in Alaxar was much slower at 10:00 BST, it comes from the difference of wind at low level atmosphere. The bright temperature of sandstorm in Hexi got lower and much integrated.
• At 12:00 BST Lanzhou and Baiyin were controlled by the sands and the sandstorm approached to west border of Ningxia. The sands intruded Ningxia from south and north passes of Mt. Helan at 13:00 BST, and the speed of the sandstorm dropped a little. Most of the north and middle part of Ningxia completely fell into sands at 14:00 BST, and south city Guyuan was attacked by sands at 15:00.
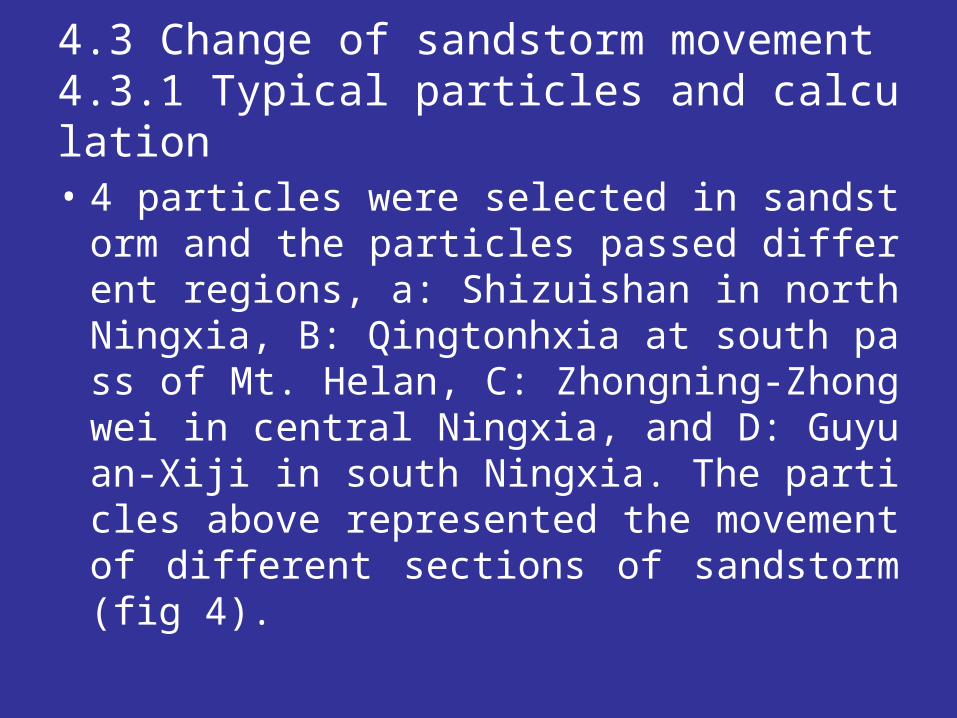
4.3 Change of sandstorm movement4.3.1 Typical particles and calculation
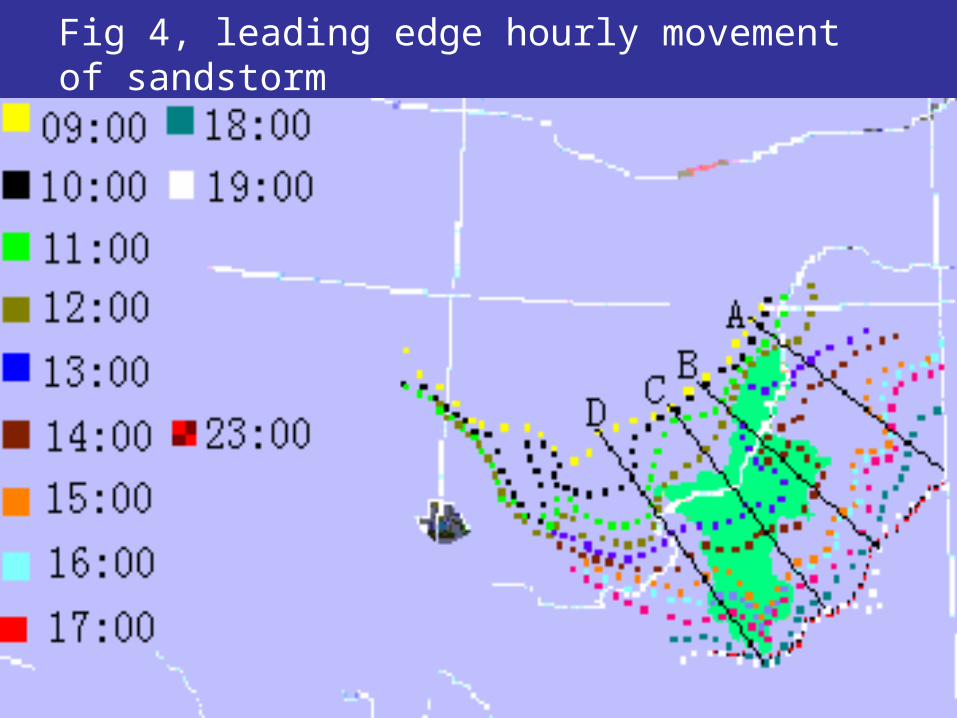
• 4 particles were selected in sandstorm and the particles passed different regions, a: Shizuishan in north Ningxia, B: Qingtonhxia at south pass of Mt. Helan, C: Zhongning-Zhongwei in central Ningxia, and D: Guyuan-Xiji in south Ningxia. The particles above represented the movement of different sections of sandstorm (fig 4).
Fig 4, leading edge hourly movement of sandstorm
Fig 5, speed temporal variations of particles A, B, C and D, which lie from south to north.
0
2040
6080
100
120
10 11 12 13 14 15 16 17 18 19北京时
Km/hr
速度
()
A质点 速度
B质点 速度
C质点 速度
0
20
40
60
80
100
120
10 11 12 13 14 15 16 17 18 19
北京时
Km/hr
速度
()
4.3.2 Analysis• The speeds of 3 particles in north part shared the co
nsistency (fig 5a), low for the initial several hours, and reached their peaks around 14:00 BST, the northern the later of its maximum. The feature of particle C was similar to that of particle D, attained peak velocity earlier.
• It is important to note that the particle B did not go along the line in the figure. The fact is it came from south pass of Mt. Helan laterally.
• The speed of particle D in south most was higher initially (fig 5b), and reduced rapidly afterward. At 18:00 BST its speed regained suddenly because of the geographic move-around. It means the particle went laterally in previous hours and returned the path at 19:00 BST. It is incorrect to think the speed increased abruptly.
• The movement was related with topography. The north particles passed the plain area in the morning and it is much easier to push ahead, but the south particle had to trek in mountain area, and it is much difficult.
• Even though the pursuing and orientating work was carried out by hand work, and there must be errors, the movement tendency of 4 particles were very clear,
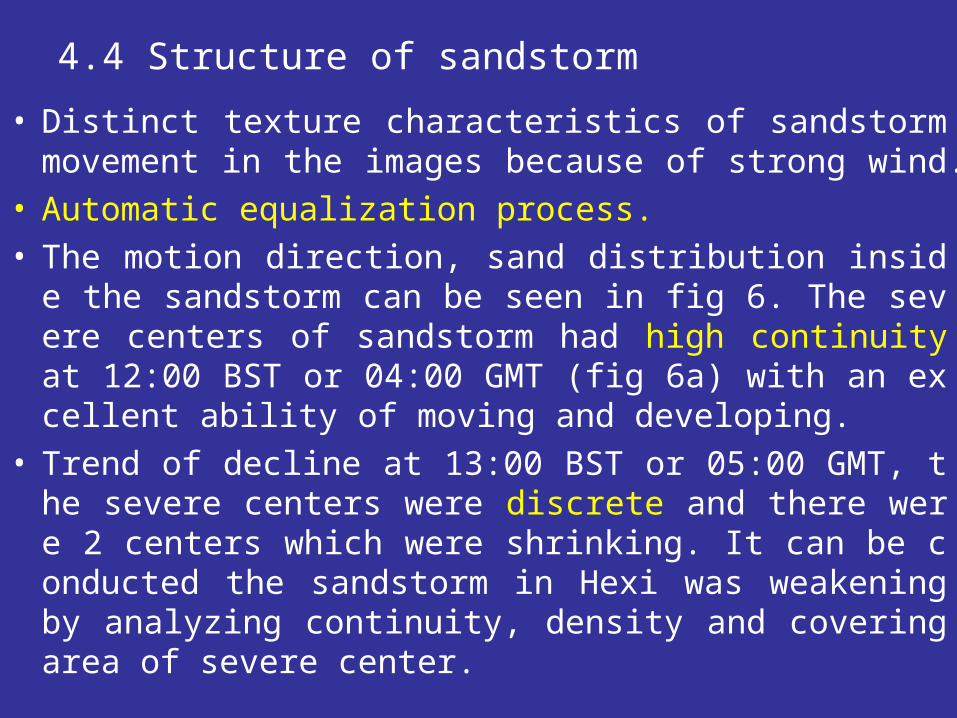
4.4 Structure of sandstorm
• Distinct texture characteristics of sandstorm movement in the images because of strong wind.
• Automatic equalization process.• The motion direction, sand distribution inside the sand
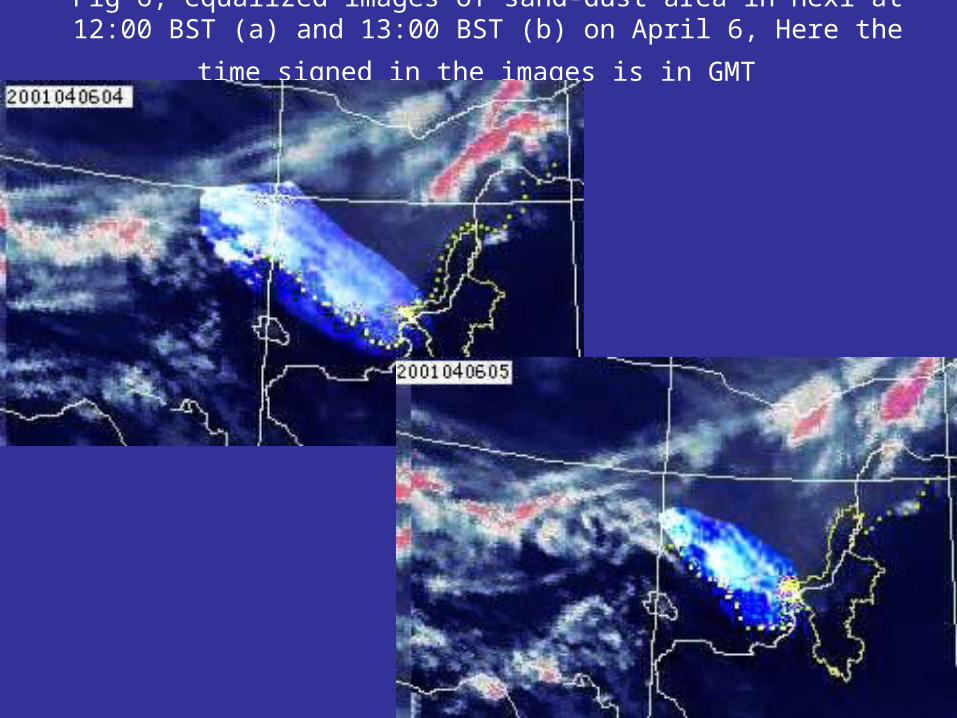
storm can be seen in fig 6. The severe centers of sandstorm had high continuity at 12:00 BST or 04:00 GMT (fig 6a) with an excellent ability of moving and developing.
• Trend of decline at 13:00 BST or 05:00 GMT, the severe centers were discrete and there were 2 centers which were shrinking. It can be conducted the sandstorm in Hexi was weakening by analyzing continuity, density and covering area of severe center.
Fig 6, equalized images of sand-dust area in Hexi at 12:00 BST (a) and
13:00 BST (b) on April 6, Here the time signed in the images is in GMT
5. Discussion and explanation5.1 Weather background
• It is a typical sandstorm, strong jet at low and medium level in atmosphere, quickly moving cold front on surface, high allobar and pressure gradient caused gale. Since the air was dry, it was difficult to form precipitation. Land surface with sand in Hexi and Alaxar was very dry in spring, it is very easy to blow the sand into air and cause sandstorm.
5.2 Dynamic-thermo mechanism discussion
• It is reasonable to consider the vapour condensation heat had little effect. The energy came from atmosphere kinetic and the solar radiation also.
• Kinetic dominating period: In the morning, the solar radiation was weak, the kinetic effect was much more important than that of radiation. The sands activity was violent wherever the wind was strong, so the sand in Hexi where was controlled b northwest gale was intense and the moving speed was higher, and the strip texture and intensity were obvious. Meanwhile the sands activity in Alaxar was relatively weak.
• Thermo enhancing period: • At noon, Ningxia surface had accumulated energy because of
solar radiation. The sandstorm came from Alaxar regained and the velocity increased after passed the Mt. Helan. The sands came from Hexi slowed down as the kinetic dropped.
• Comprehensive waning out period: • The sands covered most part of Ningxia the afternoon. The
visible channel image shows the albedo was high, the radiation energy was reflected by sands, and the thermo mechanism was destroyed. The main body of cold air mass occupied Ningxia, pressure gradient was very low and wind bated, dynamic was losing, there were no mechanisms to maintain sandstorm and it could not go ahead any more.
• At 23:00 BST sands in some sections were blown low and fell down soon after the wind became calm, and these parts of sandstorm retrogressed. The large area swept by sandstorm went to die out because of the energy dissipation.
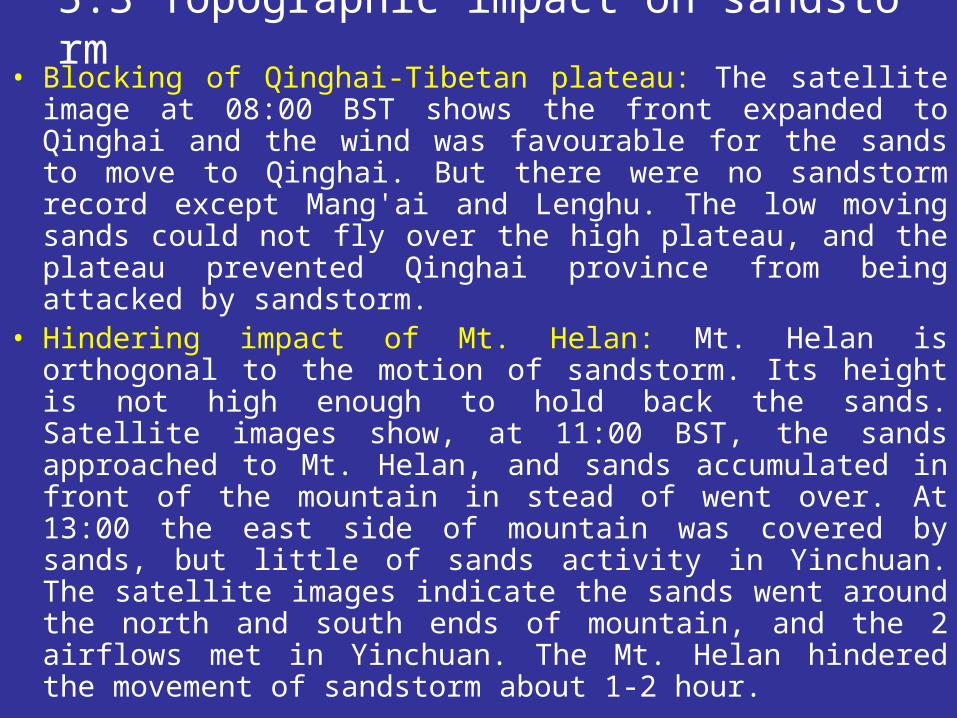
5.3 Topographic impact on sandstorm• Blocking of Qinghai-Tibetan plateau: The satellite image at
08:00 BST shows the front expanded to Qinghai and the wind was favourable for the sands to move to Qinghai. But there were no sandstorm record except Mang'ai and Lenghu. The low moving sands could not fly over the high plateau, and the plateau prevented Qinghai province from being attacked by sandstorm.
• Hindering impact of Mt. Helan: Mt. Helan is orthogonal to the motion of sandstorm. Its height is not high enough to hold back the sands. Satellite images show, at 11:00 BST, the sands approached to Mt. Helan, and sands accumulated in front of the mountain in stead of went over. At 13:00 the east side of mountain was covered by sands, but little of sands activity in Yinchuan. The satellite images indicate the sands went around the north and south ends of mountain, and the 2 airflows met in Yinchuan. The Mt. Helan hindered the movement of sandstorm about 1-2 hour.
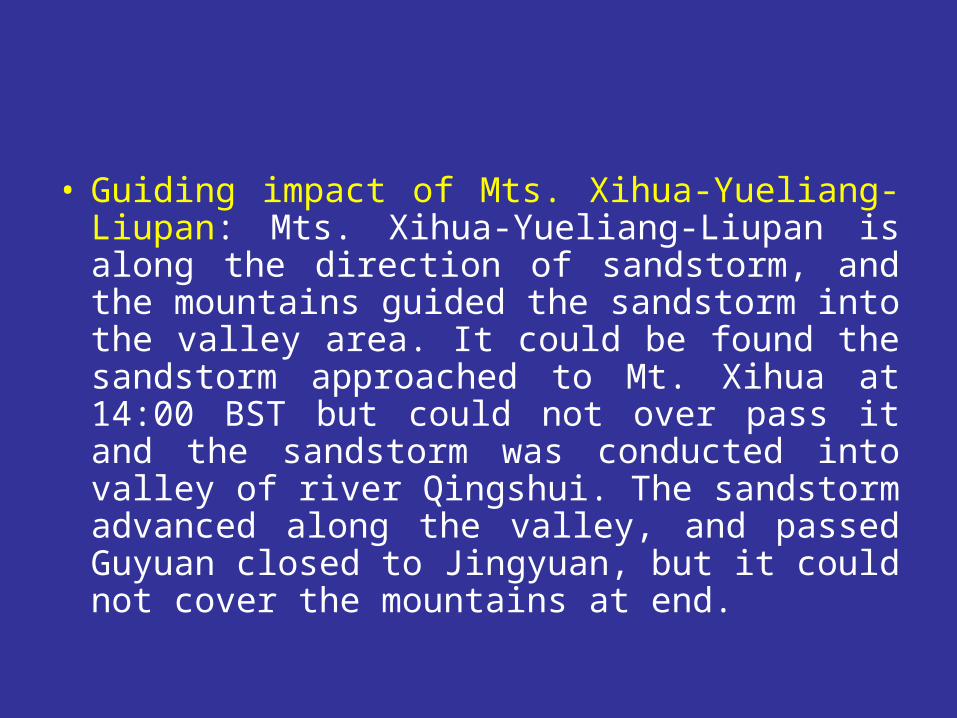
• Guiding impact of Mts. Xihua-Yueliang-Liupan: Mts. Xihua-Yueliang-Liupan is along the direction of sandstorm, and the mountains guided the sandstorm into the valley area. It could be found the sandstorm approached to Mt. Xihua at 14:00 BST but could not over pass it and the sandstorm was conducted into valley of river Qingshui. The sandstorm advanced along the valley, and passed Guyuan closed to Jingyuan, but it could not cover the mountains at end.
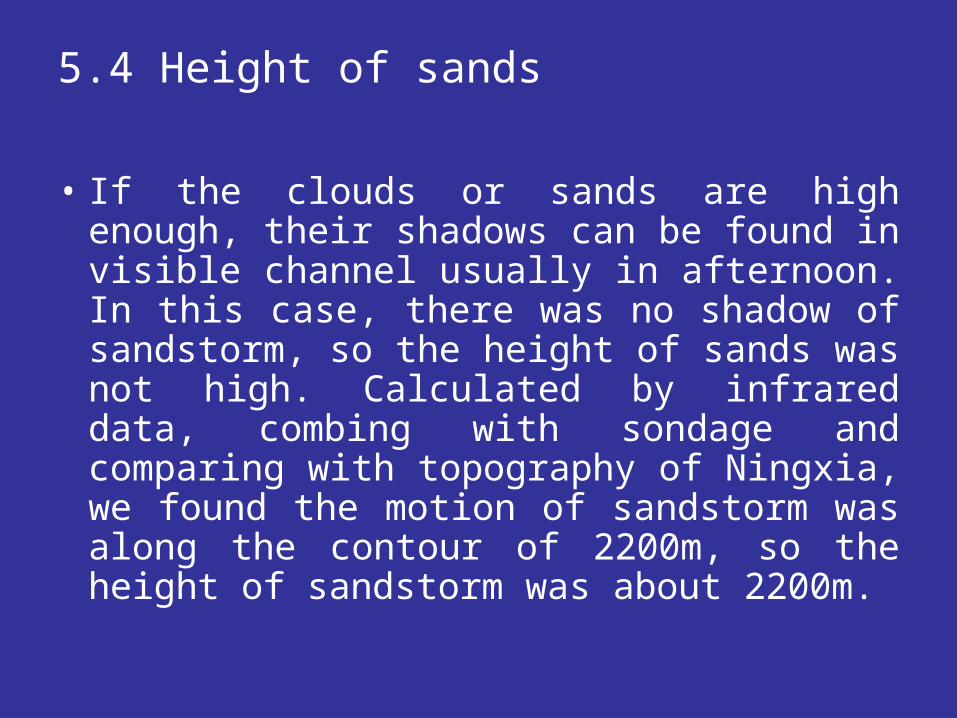
5.4 Height of sands
• If the clouds or sands are high enough, their shadows can be found in visible channel usually in afternoon. In this case, there was no shadow of sandstorm, so the height of sands was not high. Calculated by infrared data, combing with sondage and comparing with topography of Ningxia, we found the motion of sandstorm was along the contour of 2200m, so the height of sandstorm was about 2200m.
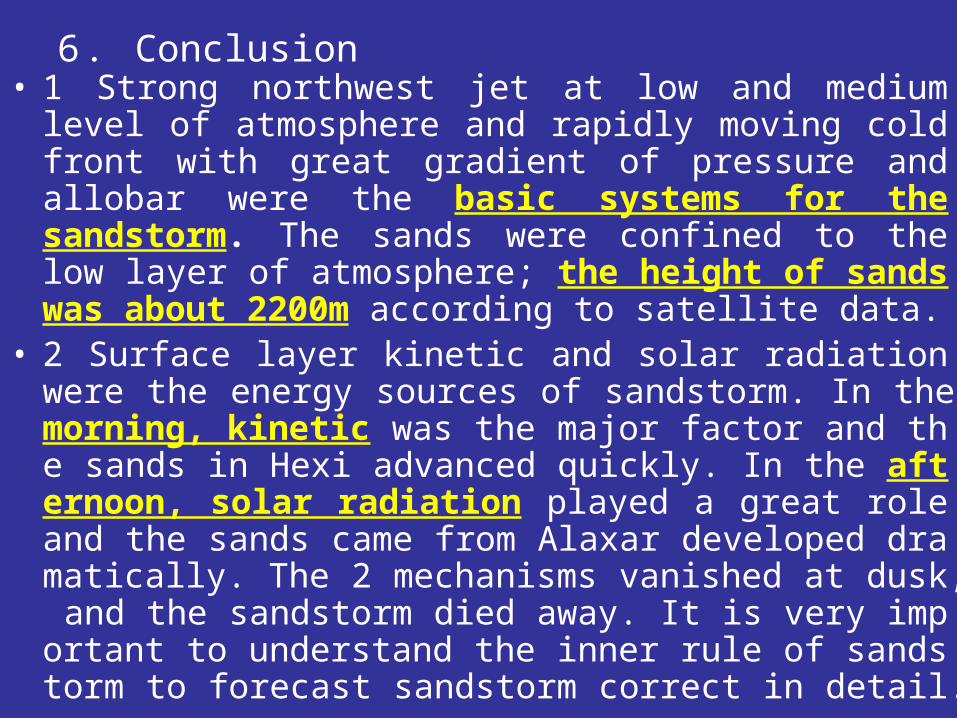
6 . Conclusion• 1 Strong northwest jet at low and medium level of
atmosphere and rapidly moving cold front with great gradient of pressure and allobar were the basic systems for the sandstorm. The sands were confined to the low layer of atmosphere; the height of sands was about 2200m according to satellite data.
• 2 Surface layer kinetic and solar radiation were the energy sources of sandstorm. In the morning, kinetic was the major factor and the sands in Hexi advanced quickly. In the afternoon, solar radiation played a great role and the sands came from Alaxar developed dramatically. The 2 mechanisms vanished at dusk, and the sandstorm died away. It is very important to understand the inner rule of sandstorm to forecast sandstorm correct in detail.
• 3 Satellite images have a perfect capability to monitor the leading edge of sandstorm; the particles in different positions were consistent with the mechanism, the intensity of sands was distinct on the images, and it is crucial for sandstorm warning.
• 4 The interior information could be revealed by image processing, and with this information the motion; evolvement could be shown which is very difficult to get with other methods.
• 5 Landscape impacts on sandstorm. Landform with different directions, scales affected the sandstorm in different ways. Large-scale terrain blocked the sands, smaller one attacked directly hindered the motion of sands, and the mountains share the same direction with the motion of sandstorm guided it into valley area. Topography in different area made different process and intensity of sandstorm.


![Database Design for Clinical Trial Xiaoqing He & Gilsinia Lopez [1,2]](https://static.documents.pub/doc/80x56/56649dc55503460f94ab8521/database-design-for-clinical-trial-xiaoqing-he-gilsinia-lopez-12.jpg)


