Mechanisms by which Imatinib (Gleevec) counteracts type 2 diabetes possible roles of phosphatidylinositol triphosphate phosphatases SHIP2 and PTEN Tingting Li Degree project in biology, Master of science (2 years), 2011 Examensarbete i biologi 45 hp till masterexamen, 2011 Biology Education Centre and Department of Medical Cell Biology, Uppsala University Supervisor: Professor Nils Welsh
Transcript
Mechanisms by which Imatinib (Gleevec)counteracts type 2 diabetes
possible roles of phosphatidylinositol triphosphatephosphatases SHIP2 and PTEN
Tingting Li
Degree project in biology, Master of science (2 years), 2011Examensarbete i biologi 45 hp till masterexamen, 2011Biology Education Centre and Department of Medical Cell Biology, Uppsala UniversitySupervisor: Professor Nils Welsh
2
ABSTRACT Objective: Imatinib mesylate (Gleevec®) was observed to reverse type 2 diabetes in patients suffering from both chronic myeloid leukemia and type 2 diabetes. Meanwhile, other studies support its anti-diabetic effects in animal models. However, the mechanisms by which imatinib counteract type 2 diabetes are unknown. Two phosphoinositide phosphatases SHIP2 and PTEN are negative regulators of phosphatidylinositol 3'-kinase pathway and they are considered as putative targets for imatinib. The aim of this study was to determine whether imatinib affects PTEN and SHIP2 phosphorylation and to study whether such an effect is correlated to improved beta cell survival. Research design and methods: PTEN and SHIP2 were immunoprecipitated from murine insulin producing βTC-6 cells and human embryonic kidney 293T cells, respectively; and the impacts of imatinib and sunitinib on PTEN and SHIP2 tyrosine phosphorylation, PTEN serine phosphorylation, as well as c-Abl co-immunoprecipitation with SHIP2, were studied by immunoblot analysis. Furthermore, the effects of PTEN inhibitor bpV(Hopic) on PTEN tyrosine and serine phosphorylation were analyzed with the same method. Beta cell viability was measured using vital staining and Kodak 4000 MM image station. Results: A significant decrease in SHIP2 tyrosine phosphorylation in response to imatinib treatment for 20 minutes was observed. On the contrary, a significant increase in SHIP2 phosphotyrosine levels induced by sunitinib treatment for both 60 minutes and 180 minutes was shown. c-Abl co-immunoprecipated with SHIP2 and its binding to SHIP2 was largely reduced by imatinib treatment for 20 minutes. However, no obvious effect of sunitinib on c-Abl co-immunoprecipated with SHIP2 was discovered. A significant increase in phosphotyrosine levels of PTEN was observed with both imatinib and sunitinib treatment for 20 minutes. PTEN serine phosphorylation was reduced by the PTEN inhibitor. Imatinib increased βTC-6 viability in vitro in the presence of cytokines (IL-1β+IFN-γ), DETA/NO, and hydrogen peroxide; whereas sunitinib and PTEN inhibitor had negative effects on cell viability. Conclusions: c-Abl rather than PDGFR is likely to activate SHIP2 and PTEN via tyrosine phosphorylation of their catalytic domain. A compensatory activation of PTEN by other kinase would occur when tyrosine phosphorylation of SHIP2 was significantly decreased. Imatinib protected beta cell viability against pro-inflammatory cytokines, DETA/NO and hydrogen peroxide primarily via inhibiting SHIP2 activity.
Diabetes mellitus Diabetes mellitus consists of a variety of metabolic disorders characterized by high glucose levels and is broadly classified into type 1 and 2 diabetes. Type 1 diabetes is an autoimmune disease leading to the death of insulin secreting beta cells and subsequent insulin deficiency. Treatment for type 1 diabetes requires insulin injections or in severe cases transplantation of pancreas or islets. Type 2 diabetes, also known as non-insulin dependent, is the most common form of diabetes. It comprises 90-95% of all cases, the onset of which is primarily due to insulin resistance in insulin-target tissues. The hormone insulin regulates glucose homeostasis by facilitating the uptake of blood glucose and the transfer of glucose to glycogen for storage, as well as inhibiting the release of glucagon, a hormone raises blood glucose levels. Because of insulin resistance, blood glucose is not taken up properly in fat and muscle cells. Meanwhile, decreased glycogen synthesis and storage in liver occurs. Therefore, more insulin needs to be secreted to maintain glucose levels within the normal range. As the disease progresses, beta cells become dysfunctional and are damaged in response to hyperglycemia, hyperlipidemia and pro-inflammatory cytokines (Cnop et al, 2005). Type 2 diabetes is a chronic disease with symptoms including increased thirst and hunger, weight loss, frequent urination, fatigue and blurred vision. Treatment for type 2 diabetes relies on exercise, diet and weight control in the early stage. Imatinib mesylate (Gleevec®, STI571) Imatinib is a 2-phenylaminopyrimidine-based ATP-competitive inhibitor of the Abl tyrosine kinase, targeting the ATP-binding site of this kinase. It binds to and stabilizes the inactive form of Bcr-Abl, eliminating effects of this oncoprotein via inhibiting its autophosphorylation and substrate phosphorylation (Maekawa et al, 2007). In addition to Abl, imatinib specifically inhibits the platelet-derived growth factor receptor (PDGFR), and the transmembrane receptor tyrosine kinase (c-Kit). It is currently used to treat chronic myeloid leukemia (CML), a disease mainly caused by Bcr-Abl oncogene, and gastrointestinal stromal tumors (GIST) that result from c-Kit mutations (David et al, 2001). Meanwhile, the protective effects of imatinib against genotoxic agents, death receptor activation and oxidative stress were observed (Raina 2002, Dan 1999, Kumar 2003), which can be explained by the inhibition of c-Abl activity. Most interestingly, the patients that suffered from both CML and type 2diabetes were cured from not only CML, but also diabetes, when given imatinib (Veneri 2005, Brecia 2004, Couzin 2005). Imatinib was also found to reverse high-fat diet induced insulin resistance and hyperglycemia in rats and to induce remission of diabetes in db/db mouse (Hägerkvist 2008, Han 2009). Sunitinib (Sutent®, SU11248)
Sunitinib is a multi-targeted receptor tyrosine kinase (RTK) inhibitor, which inhibits PDGFRs (PDGFRα, PDGFRβ), vascular endothelial growth factor receptors (VEGFR-1, -2, and -3), KIT (stem-cell factor receptor) and other RTKs (Motzer et al, 2006). It was approved in both
6
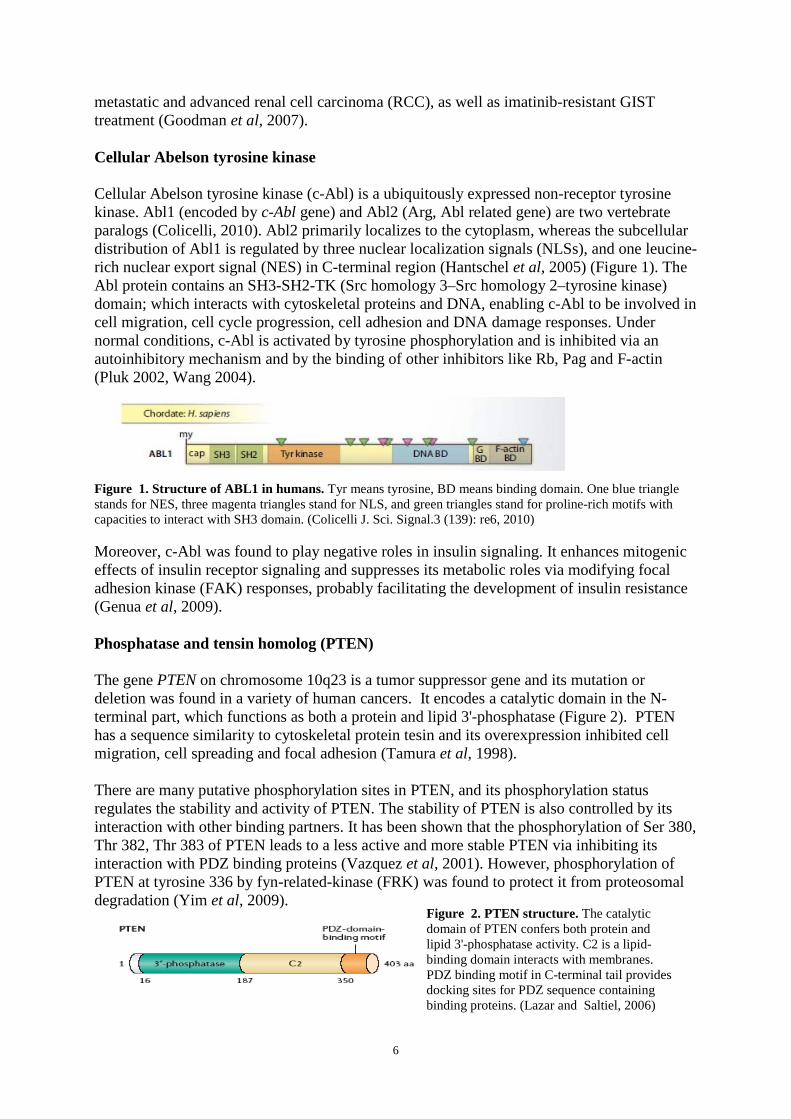
metastatic and advanced renal cell carcinoma (RCC), as well as imatinib-resistant GIST treatment (Goodman et al, 2007). Cellular Abelson tyrosine kinase Cellular Abelson tyrosine kinase (c-Abl) is a ubiquitously expressed non-receptor tyrosine kinase. Abl1 (encoded by c-Abl gene) and Abl2 (Arg, Abl related gene) are two vertebrate paralogs (Colicelli, 2010). Abl2 primarily localizes to the cytoplasm, whereas the subcellular distribution of Abl1 is regulated by three nuclear localization signals (NLSs), and one leucine-rich nuclear export signal (NES) in C-terminal region (Hantschel et al, 2005) (Figure 1). The Abl protein contains an SH3-SH2-TK (Src homology 3–Src homology 2–tyrosine kinase) domain; which interacts with cytoskeletal proteins and DNA, enabling c-Abl to be involved in cell migration, cell cycle progression, cell adhesion and DNA damage responses. Under normal conditions, c-Abl is activated by tyrosine phosphorylation and is inhibited via an autoinhibitory mechanism and by the binding of other inhibitors like Rb, Pag and F-actin (Pluk 2002, Wang 2004). Figure 1. Structure of ABL1 in humans. Tyr means tyrosine, BD means binding domain. One blue triangle stands for NES, three magenta triangles stand for NLS, and green triangles stand for proline-rich motifs with capacities to interact with SH3 domain. (Colicelli J. Sci. Signal.3 (139): re6, 2010) Moreover, c-Abl was found to play negative roles in insulin signaling. It enhances mitogenic effects of insulin receptor signaling and suppresses its metabolic roles via modifying focal adhesion kinase (FAK) responses, probably facilitating the development of insulin resistance (Genua et al, 2009). Phosphatase and tensin homolog (PTEN) The gene PTEN on chromosome 10q23 is a tumor suppressor gene and its mutation or deletion was found in a variety of human cancers. It encodes a catalytic domain in the N-terminal part, which functions as both a protein and lipid 3'-phosphatase (Figure 2). PTEN has a sequence similarity to cytoskeletal protein tesin and its overexpression inhibited cell migration, cell spreading and focal adhesion (Tamura et al, 1998). There are many putative phosphorylation sites in PTEN, and its phosphorylation status regulates the stability and activity of PTEN. The stability of PTEN is also controlled by its interaction with other binding partners. It has been shown that the phosphorylation of Ser 380, Thr 382, Thr 383 of PTEN leads to a less active and more stable PTEN via inhibiting its interaction with PDZ binding proteins (Vazquez et al, 2001). However, phosphorylation of PTEN at tyrosine 336 by fyn-related-kinase (FRK
) was found to protect it from proteosomal degradation (Yim et al, 2009).
Figure 2. PTEN structure. The catalytic domain of PTEN confers both protein and lipid 3'-phosphatase activity. C2 is a lipid-binding domain interacts with membranes. PDZ binding motif in C-terminal tail provides docking sites for PDZ sequence containing binding proteins. (Lazar and Saltiel, 2006)
7
Src homology 2-containing inositol 5'-phosphatase 2 (SHIP2 or INPPL1) SHIP2 is a 142-KD SH2 domain containing 5'-phosphatase expressed in many tissues like human heart, skeletal muscle and placenta (Pesesse et al, 1997). However, the expression of its closely related member SHIP1 is restricted to hematopoietic cells. They both contain a SH2 domain in N-terminal part, a catalytic 5'-phosphatase domain, and a proline-rich domain containing phospho-tyrosine binding consensus sequences (NPXY) (Figure 3). SHIP2 interacts with a variety of binding partners via those domains, enabling it to participate in cell adhesion and spreading, cytoskeleton modulation (Suwa et al, 2010). SHIP2 typically localizes to the cytosol in quiescent cells. Upon tyrosine phosphorylation of NPXY, it relocalizes to plasma membrane via its association with Shc; which is required for its inhibitory effects on insulin signaling (Ishihara et al, 2002). PTEN and SHIP2 in insulin signaling Insulin binds to the insulin receptor and promotes its autophosphorylation and further phosphorylation of insulin receptor substrates (IRS). Then IRS activates phosphatidylinositol 3-kinase (PI3K) via its p85 subunit and thus synthesis of phosphatidylinositol 3,4,5-triphosphate (PIP3). PIP3
recruits and activates phosphoinositide-dependent kinase 1(PDK1), Akt/PKB, contributing to increased glucose uptake and GLUT4 translocation in fat and skeletal muscle.
However, PI (3,4,5) P3 and PI (3,4)P2 are two well-known substrates of PTEN, which removes 3'-phosphate from those lipids and generates PI(4,5)P2As a 5'-phosphatase, SHIP2 dephosphorylates PI (3, 4, 5) P3 into PI (3, 4) P2. They both induce negative effects on the PI3K pathway, which probably inhibits insulin signaling and promotes the development of type 2 diabetes.
and PI(4)P.
Some research showed that SHIP2+/-
mice displayed higher insulin sensitivity and glucose tolerance than wild type ones, which was due to increased glucose uptake and glycogen synthesis in skeletal muscles (Clément et al, 2001). Furthermore, increased PTEN expression was found in islets of high fat diet (HFD) fed and db/db mice and deletion of PTEN in pancreatic beta cells was beneficial for maintaining beta cell mass, function and PI3K pathway, suggesting PTEN and SHIP2 as a putative therapeutic target for type 2diabetes (Wang et al, 2010).
Mechanisms of pancreatic beta cell death The loss of beta cell mass and increased beta cell apoptosis are common features of type 2 diabetes, and are probably caused by increased expression of pro-inflammatory cytokines,
Figure 3. Protein structures of SHIP1 and SHIP2. They both contain SH2-domain, catalytic phosphatase domain, and proline rich domain. Sterile alpha-motif (SAM) is unique to SHIP2. (Suwa et al, 2010)
8
such as interleukin-1β (IL-1β), tumor necrosis factor (TNF-α) or γ-interferon (IFN-γ) (Mandrup-Poulsen et al, 2003). IL-1β binds to IL-1R1 and leads to recruitment of adaptor proteins and activation of TGF-beta activated kinase 1 (TAK1), which is capable of stimulating NF-κB and mitogen-activated protein/stress-activated protein kinase (MAP/SAPK) pathways, leading to gene transcription. MAP/SAPKs consist of ERK, p38, and c-jun N-terminal kinase (JNK). The transcription of iNOS leads to production of NO, a toxic chemical to beta cells. IL-1β also activates protein kinase Cδ and its mechanism for β-cell apoptosis is not clear, possibly through iNOS expression. Furthermore, enhanced Fas expression on beta cells makes them more sensitive to FasL, resulting in accelerated apoptosis (Donath et al, 2003). A recent study suggests that IL-1β increased murine beta TC6 cells apoptosis partly via inhibiting the IRS-2/Akt signaling pathway. In response to hyperglycemia, IL-1β induced the expression of suppressors of cytokine signalling (SOCS-1
) in cells and the activation of FOXO transcription factors, which were associated with enhanced caspase-3 activity (Panagiotis et al, 2010).
IFN-γ leads to beta cell apoptosis in combination with IL-1β, TNF-α or dsRNA (double-stranded RNA). When it binds to corresponding receptor and forms a complex, it recruits and activats JAK1/2, which further activates STAT1. Activated STAT1 translocates to the nucleus and binds to DNA. One the other hand, it activates also interferon regulatory factor-1 (IRF-1), which plays critical roles in downstream pathway. It was found that deletion of STAT1 rather than IRF-1 confers resistance against beta-cell death both in vivo and in vitro, indicating a dual role of IFN-γ in beta-cell destruction (Gysemans et al, 2008). There are two receptors, p60 and p80, for TNF-α signaling. P60 is expressed on all cell types, as compared to restricted expression in immune and endothelial cells of p80. TNF-α binds to the receptor and leads to recruitment and activation of TNF receptor-associated factor 2 (TRAF-2), and further contributes to stimulating NF-κB-iNOS-NO and JNK and p38 MAP/SAPK pathways. The ERK/p38 pathway is required but not sufficient for iNOS expression. JNK causes beta cell death in a NO-independent pathway, probably via suppressing the anti-apoptotic function of Bcl-2 related proteins; activating FOXO transcription factors (Weston & Davis, 2002). Some research shows that reactive oxygen and nitrogen species generate oxidative stress and lead to beta cell death via opening KATP channels, which disrupts mitochondrial membrane potential in beta cells; resulting in depletion of ATP and a release of cytochrome c and pro-apoptotic proteins. This redox imbalance also leads to lipid peroxidation, oxidation of proteins, and DNA damage (Gier et al, 2009).
Figure 4. Mechanisms of beta cell apoptosis caused by cytokines. Details are described in the text (Donath et al. 2003).
9
MATERIALS AND METHODS
Cell culture Murine βTC-6 cells were cultured in RPMI 1640 medium (Sigma Chemicals) supplemented with 10% (vol/vol) fetal bovine serum (FBS- Sigma- Aldrich, US), 2 mM L-glutamine, benzylpenicillin (100 U/mL), and streptomycin (0.1 mg/mL). Lenti-X™ 293T cells were grown in DMEM medium (Gibco,Grand Island, NY) with 10% (vol/vol) FBS (Sigma- Aldrich, US), 2 mM L-glutamine, benzylpenicillin (100 U/mL) and streptomycin (0.1 mg/mL). All cells were kept at 37°C in a humidified air incubator with 5 % CO2. Immunoprecipitation and Western blot After treatment with drugs, cells were put on ice and were washed with cold phosphate buffered saline (PBS) for 3 times, then cell pellets were collected and were lysed in RIPA-SDS sample buffer (50mM Tris⋅Cl, PH 7.4, 150mM NaCl, 0.1% SDS, 0.5% sodium deoxycholate, 1% Igepal CA-630) supplemented with 1mM PMSF and Halt TMprotease and phosphatase inhibitor cocktail for half an hour. After centrifugation, supernatant was separated into two parts, one was positive control for western blot, and the other was supplemented with PTEN (A2B1) or SHIP2 (C76A7) antibodies and was kept on ice for one hour. Recombinant proteins were then precipitated by Protein G sepharose and were washed 3 times with RIPA-SDS buffer and once with pure water. Those samples were boiled for 5 mins in water bath and were separated by SDS-PAGE. Proteins were then electrophoretically transferred onto a polyvinylidene difluoride (PVDF) membrane (GE Healthcare, UK). Membranes were blocked in 0.1%TBST (Tris-Buffered Saline Tween-20) containing 2 % bovine serum albumin (BSA)(Sigma- Aldrich, US) and followed by incubation with primary antibodies: Anti-phosphotyrosine antibody (Millipore, MA, USA), PTEN, c-Abl antibodies (Santa Cruz Biotechnology, Santa Cruz, CA, USA), anti-phospho PTEN, SHIP2 antibodies (Cell Signaling Technology, Danvers, MA, USA). After that, those membranes were briefly washed and the antibody-antigen complexes were identified using anti-rabbit/mouse IgG-HRP (immunoglobulin G-horseradish peroxidase) secondary antibody (Sigma- Aldrich). Immunoreactivity was detected with Amersham ECLTM immunoblotting detection system (GE healthcare, UK) or ImmobilonTM
Western chemiluminescent HRP substrate (Millipore, MA, USA). The intensity of bands was quantified by densitometry using Kodak image analysis software version 3.6. In order to remove bound antibodies and reprobe with new antibodies, a harsh stripping was conducted by incubating those filters in stripping solution (2% SDS, 50mM Tris⋅Cl, PH 6.8, 0.8% β-mercaptoenthanol) at 50°C for 30 mins; whereas a gentle stripping for only 15-20 mins.
Evaluation of cell viability Murine βTC-6 cells were cultured in 96-well plates and were treated with imatinib (10 µM), sunitinib (10 µM), PTEN inhibitor (100 nM) for 6 hours, and then were incubated with the cell death agents IL-1β (50 U/mL), IFN-γ (1000 U/mL), DETA/NO (1 mM), hydrogen peroxide (0.1 mM) for about 24 hours. Cell viability was measured by staining cells with propidium iodide (20 µg/mL) and bisbenzimide (5 µg/mL) for 10 mins at 37°C. Then the medium was replaced with PBS and the red and blue fluorescence detection was done using Kodak 4000 MM image station. Red signals represent dead cells, whereas blue signals stand for all cells. Therefore, the ratio of red to blue was taken as a relative measure of cell viability by using Kodak Digital Science ID software (Eastman Kodak, Rochester, NY).
10
RESULTS
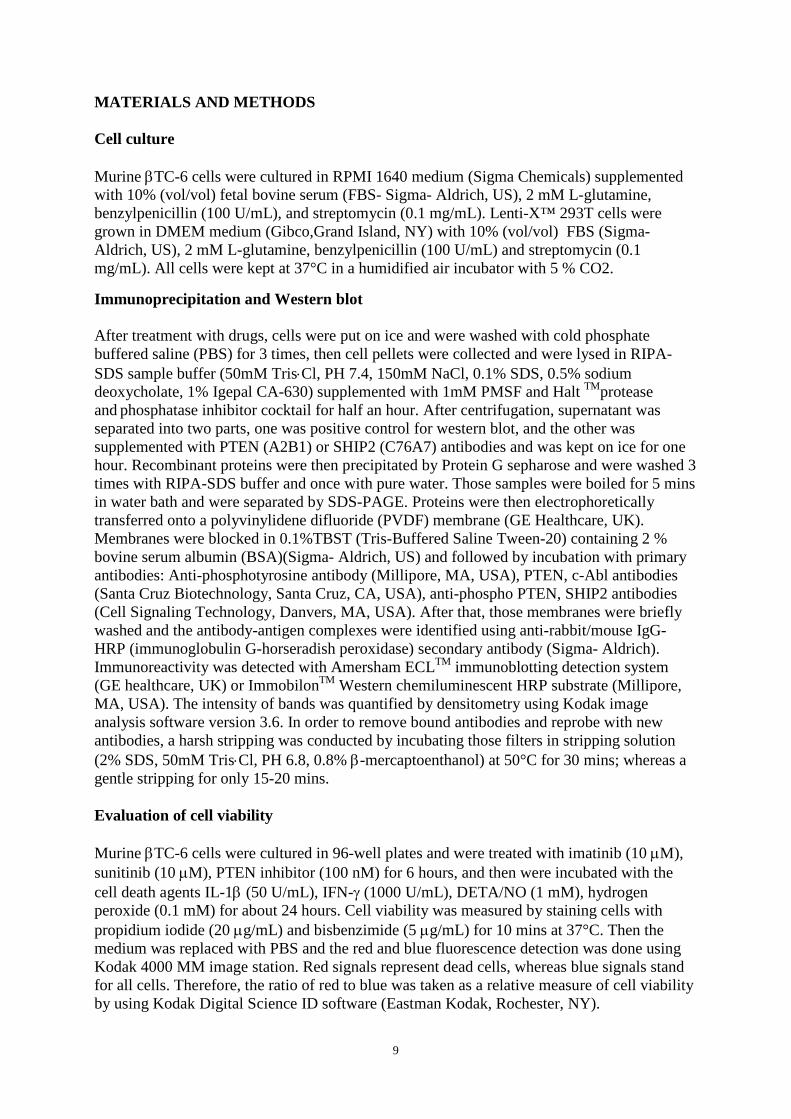
The effects of Gleevec and sunitinib on tyrosine and serine phosphorylation of PTEN in murine βTC-6 cells. To study the effects of Gleevec and sunitinib on tyrosine and serine phosphorylation of PTEN, βTC-6 cells were either left untreated or treated with Gleevec or sunitinib for 20 min, 60 min and 180 min. PTEN phosphorylation was analyzed by immunoprecipitation and immunoblotting. A significant increase in PTEN tyrosine phosphorylation was observed after treatment with Gleevec and sunitinib for 20 min, but not for serine phosphorylation (Figure 5) A.
B.
Figure 5. The effects of Gleevec and sunitinib on tyrosine and serine phosphorylation of PTEN in murine βTC-6 cells. A:βTC-6 cells were either left untreated or treated with Gleevec (10 µM) or sunitinib (10 µM) for 20 min, 60 min and 180 min. Cells were lysed and proteins were immunoprecipitated with PTEN antibody, separated by SDS-PAGE and transferred onto a PVDF membrane. PTEN phosphorylation was analyzed by immunoblotting with phosphotyrosine, phospho-PTEN and PTEN antibodies. A representative blot is shown. B: Results from immunoblots were quantified using densitometry. Values of phospho-protein bands were related to that of PTEN bands. Data are presented as means ±SEM for 3-4 experiments. *denotes p < 0.05 using Student’s paired t-test.
*
00.20.40.60.8
11.21.41.61.8
2
Control 20 min 60 min 180 min
P-T
yr/P
ten
Gleevec
0
0.2
0.4
0.6
0.8
1
1.2
1.4
1.6
1.8
2
Control 20 min 60 min 180 min
P-t
yr/p
ten
Sunitinib
*
00.20.40.60.8
11.21.41.61.8
22.22.42.6
Control 20 min 60 min 180 min
P-P
ten/
Pte
n
Sunitinib
0
0.2
0.4
0.6
0.8
1
1.2
1.4
1.6
1.8
2
Control 20 min 60 min 180 min
P-P
ten/
Pte
n
Gleevec
11
Effects of Gleevec and sunitinib on SHIP2 tyrosine phosphorylation in human embryonic kidney 293T cells. To study the effects of Gleevec and sunitinib on SHIP2 tyrosine phosphorylation, human embryonic kidney 293T cells were either left untreated or treated with Gleevec or sunitinib for 20 min, 60 min and 180 min. Because SHIP2 antibody is only available for human cells and the supply of human islets is very limited, human embryonic kidney 293 T cells were chose as an alternative. Tyrosine phosphorylation of SHIP2 was analyzed by immunoprecipitation and immunoblotting. A significant decrease with about 60% in SHIP2 tyrosine phosphorylation was observed after treatment with Gleevec for 20 min. On the contrary, about 50% and 85% significant increases in tyrosine phosphorylation of SHIP2 was observed after treatment with sunitinib for 60 min and 180 min respectively (Figure 6). A. B.
Figure 6. The effects of Gleevec and sunitinib on tyrosine phosphorylation of SHIP2 in human embryonic kidney 293T cells. A: Human embryonic kidney 293T cells were either left untreated or treated with Gleevec (10 µM) or sunitinib (10 µM) for 20 min, 60 min and 180 min. Cells were lysed and proteins were immunoprecipitated with SHIP2 antibody, separated by SDS-PAGE and transferred onto a PVDF membrane. SHIP2 tyrosine phosphorylation was analyzed by immunoblotting with anti-phosphotyrosine and SHIP2 antibodies. B: Results from immunoblots were quantified using densitometry. Values of phosphor-protein bands were related to that of SHIP2 bands. Data are presented as means ±SEM for 3-4 experiments. *denotes p < 0.05 using Student’s paired t-test. Effects of Gleevec and sunitinib on c-Abl co-immunoprecipitation with SHIP2. To study whether c-Abl co-immunoprecipated with SHIP2 and whether that was affected by Gleevec or sunitinib, human embryonic kidney 293T cells were either left untreated or treated with Gleevec or sunitinib for 20 min, 60 min and 180 min. c-Abl co-immunoprecipitation with SHIP2 was analyzed by immunoprecipitation and immunoblotting. The results showed that c-Abl co-immunoprecipated with SHIP2 and its binding to SHIP2 was largely reduced by
0
0.2
0.4
0.6
0.8
1
1.2
1.4
1.6
1.8
2
2.2
2.4
2.6
Control 20 min 60 min 180 min
P-Ty
r/SH
IP2
Sunitinib
*
*
*
0
0.2
0.4
0.6
0.8
1
1.2
1.4
Control 20 min 60 min 180 min
P-Ty
r/SH
IP2
Gleevec
12
imatinib treatment for 20 min. However, no obvious effect of sunitinib on c-Abl binding to SHIP2 was discovered (Figure 7).
Figure 7. Effects of Gleevec and sunitinib on c-Abl co-immunoprecipitation with SHIP2. Human embryonic kidney 293T cells were either left untreated or treated with Gleevec (10 µM) or sunitinib (10 µM) for 20 min, 60 min and 180 min. Cells were lysed and proteins were immunoprecipitated with SHIP2 antibody, separated by SDS-PAGE and transferred onto a PVDF membrane. c-Abl co-immunoprecipitation was detected with c-Abl antibody. A representative blot is shown. Effect of PTEN inhibitor on PTEN phosphorylation in murine βTC-6 cells. To study the effects of PTEN inhibitor on PTEN phosphorylation, βTC-6 cells were either left untreated or treated with PTEN inhibitor for 20 min. Tyrosine and serine phosphorylation of PTEN was analyzed by immunoprecipitation and immunoblotting. A significant decrease with about 40% in PTEN serine phosphorylation was observed after treatment with PTEN inhibitor for 20 min (Figure 8). A.
B.
Figure 8. Effects of PTEN inhibitor on PTEN phosphorylation in murine βTC-6 cells. A:βTC-6 cells were either left untreated or treated with PTEN inhibitor bpv(Hopic) (100 nM) for 20 min. Cells were lysed and proteins were immunoprecipitated with PTEN antibody, separated by SDS-PAGE and transferred onto a PVDF membrane. PTEN phosphorylation was analyzed by immunoblotting with phosphotyrosine, phospho-PTEN and PTEN antibodies. A representative blot is shown. B: Results from immunoblots were quantified using densitometry. Values of phosphor-protein bands were related to that of PTEN bands. Data are presented as means ±SEM for 3-4 experiments. *denotes p < 0.05 using Student’s paired t-test.
0
0.2
0.4
0.6
0.8
1
1.2
Control PTEN inhibitor20 min
P-Ty
r/Pt
en
0
0.2
0.4
0.6
0.8
1
1.2
Control PTEN inhibitor20 min
P-p
ten/
Pte
n
*
13
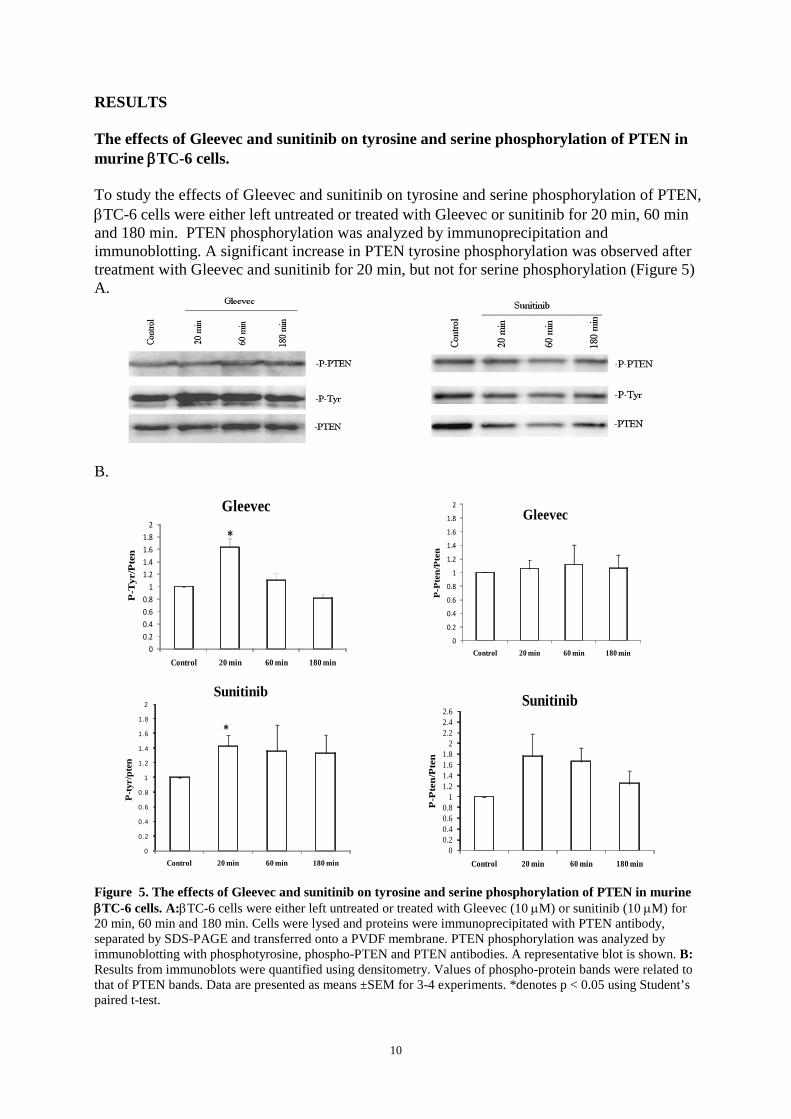
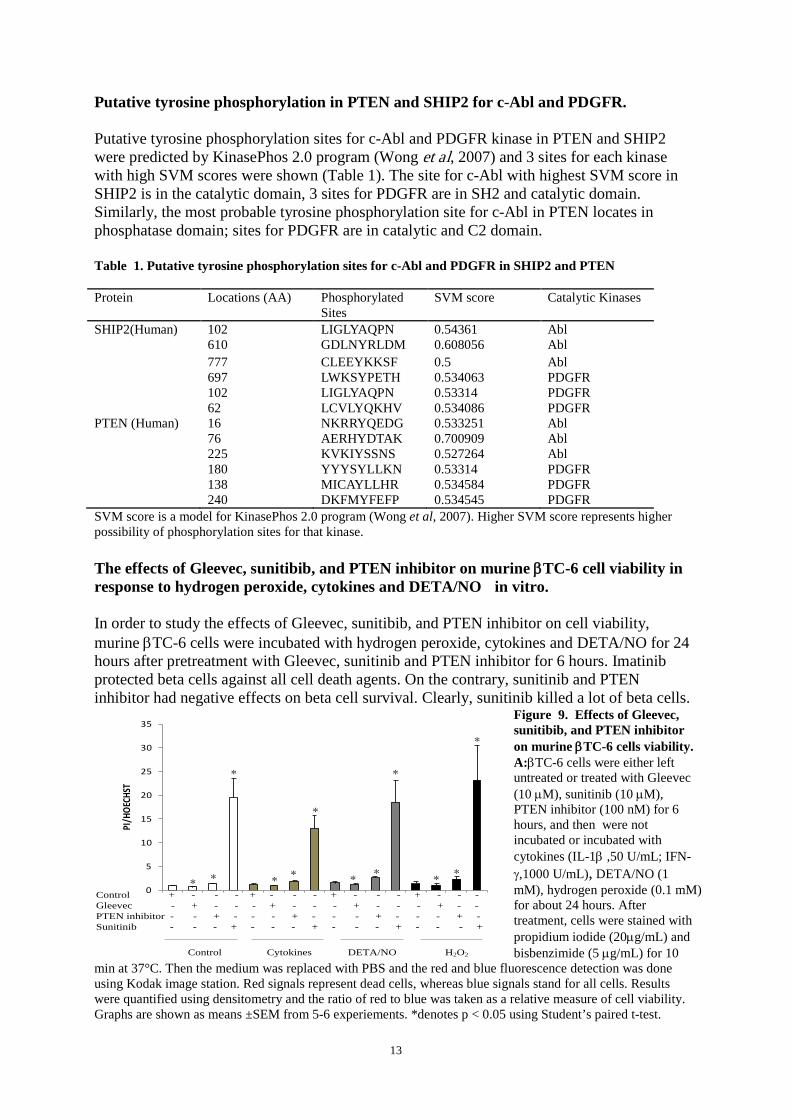
Putative tyrosine phosphorylation in PTEN and SHIP2 for c-Abl and PDGFR. Putative tyrosine phosphorylation sites for c-Abl and PDGFR kinase in PTEN and SHIP2 were predicted by KinasePhos 2.0 program (Wong et al, 2007) and 3 sites for each kinase with high SVM scores were shown (Table 1). The site for c-Abl with highest SVM score in SHIP2 is in the catalytic domain, 3 sites for PDGFR are in SH2 and catalytic domain. Similarly, the most probable tyrosine phosphorylation site for c-Abl in PTEN locates in phosphatase domain; sites for PDGFR are in catalytic and C2 domain. Table 1. Putative tyrosine phosphorylation sites for c-Abl and PDGFR in SHIP2 and PTEN Protein Locations (AA) Phosphorylated
Sites SVM score Catalytic Kinases
SHIP2(Human) 102 LIGLYAQPN 0.54361 Abl 610 GDLNYRLDM 0.608056 Abl 777 CLEEYKKSF 0.5 Abl 697 LWKSYPETH 0.534063 PDGFR 102 LIGLYAQPN 0.53314 PDGFR 62 LCVLYQKHV 0.534086 PDGFR PTEN (Human) 16 NKRRYQEDG 0.533251 Abl 76 AERHYDTAK 0.700909 Abl 225 KVKIYSSNS 0.527264 Abl 180 YYYSYLLKN 0.53314 PDGFR 138 MICAYLLHR 0.534584 PDGFR 240 DKFMYFEFP 0.534545 PDGFR SVM score is a model for KinasePhos 2.0 program (Wong et al, 2007). Higher SVM score represents higher possibility of phosphorylation sites for that kinase. The effects of Gleevec, sunitibib, and PTEN inhibitor on murine βTC-6 cell viability in response to hydrogen peroxide, cytokines and DETA/NO in vitro. In order to study the effects of Gleevec, sunitibib, and PTEN inhibitor on cell viability, murine βTC-6 cells were incubated with hydrogen peroxide, cytokines and DETA/NO for 24 hours after pretreatment with Gleevec, sunitinib and PTEN inhibitor for 6 hours. Imatinib protected beta cells against all cell death agents. On the contrary, sunitinib and PTEN inhibitor had negative effects on beta cell survival. Clearly, sunitinib killed a lot of beta cells.
Figure 9. Effects of Gleevec, sunitibib, and PTEN inhibitor on murine βTC-6 cells viability. A:βTC-6 cells were either left untreated or treated with Gleevec (10 µM), sunitinib (10 µM), PTEN inhibitor (100 nM) for 6 hours, and then were not incubated or incubated with cytokines (IL-1β ,50 U/mL; IFN-γ,1000 U/mL), DETA/NO (1 mM), hydrogen peroxide (0.1 mM) for about 24 hours. After treatment, cells were stained with propidium iodide (20µg/mL) and bisbenzimide (5 µg/mL) for 10
min at 37°C. Then the medium was replaced with PBS and the red and blue fluorescence detection was done using Kodak image station. Red signals represent dead cells, whereas blue signals stand for all cells. Results were quantified using densitometry and the ratio of red to blue was taken as a relative measure of cell viability. Graphs are shown as means ±SEM from 5-6 experiements. *denotes p < 0.05 using Student’s paired t-test.
Immunoprecipitation is a technique mainly used to purify a known protein with a specific antibody. PTEN and SHIP2 are two negative regulators of PI3K pathway, which play critical roles in insulin signaling. In this project, PTEN and SHIP2 were considered as putative targets for imatinib and other tyrosine kinase inhibitors. The effects of imatinib and sunitinib on tyrosine phosphorylation of PTEN and SHIP2, as well as PTEN serine phosphorylation were studied. Tyrosine phosphorylation of SHIP2 and PTEN contributes to their activation (Ishihara 2000, Yim 2009). First of all, a significant decrease with about 60% in SHIP2 tyrosine phosphorylation was observed after treatment with Gleevec for 20 mins. Meanwhile, c-Abl co-immunoprecipitated with SHIP2 and its binding to SHIP2 was largely reduced after the same treatment. On the contrary, sunitinib induced a significant increase in the tyrosine phosphorylation of SHIP2 and no obvious effect of it on c-Abl-SHIP2 binding was discovered. Moreover, sunitinib could not inhibit c-Abl kinase; indicating c-Abl rather than PDGFR is responsible for the activation of SHIP2. c-Abl is likely to activate SHIP2 directly via tyrosine phosphorylation of its catalytic domain. It has been observed that both Gleevec and sunitinib increased PTEN activity in DAOY and D556 human medulloblastoma cells (Abouantoun 2009, Abouantoun 2011). Therefore, increased tyrosine phosphorylation of PTEN in beta cells by both Gleevec and sunitinib was probably due to the inhibition of PDGFR. Bpv (Hopic) is a protein phosphotyrosine phosphatase inhibitor and it has been established as a PTEN inhibitor (Schmid et al, 2004). It bound to active sites of PTEN, which might drive beta cell to activate PTEN by itself, leading to significant decrease in serine and threonine phosphorylation of PTEN. Imatinib conferred protective effects against beta cell death in the presence of pro-inflammatory cytokines, DETA/NO and hydrogen peroxide. On the contrary, sunitinib had a negative effect on beta cell viability in the presence of those cell death agents, suggesting that imatinib increased beta cell viability possibly by inhibiting SHIP2 activity rather than by increasing PTEN activity. It has been shown that PTEN deletion in pancreatic beta cells is beneficial for beta cell proliferation and maintaining beta cell mass (Stiles et al, 2006). Sunitinib increased PTEN activity, resulting in more beta cell death. Decreased beta cell viability associated with the PTEN inhibitor was probably because the PTEN inhibitor suppressed the activity of other critical phosphatases that are essential for beta cell survival.
15
ACKNOWLEDGEMENTS
This project was carried out at the Department of Medical Cell Biology (Faculty of Medicine), Uppsala University. I wish to express my sincere gratitude to: Prof. Nils Welsh, my supervisor, for giving me a chance to work here and sharing his vast knowledge in both theoretical and practical aspects of research with me as well as his endless patience. Prof. Michael Welsh, whose great enthusiasm and conscientious attitude set an example for me. Dariush Mokhtari, for finding clue for this project and funny talking; created a happy atmosphere in the lab. Xuan Wang for giving me a lot of help in lab work and joys during lunch and spare time, Andreea Barbu for giving me Lenti 293 cells, Kyrill Turpaev for his discussion and nice chat, Rikard Fred, Ebrahim Anvari, Guangxiang Zang, Björn Åkerblom and Karin Gustafsson for some help in past seven months. My parents, who always love and support me greatly.
16
REFERENCES Abouantoun TJ, Castellino RC, MacDonald TJ. 2011. Sunitinib induces PTEN expression and inhibits PDGFR signaling and migration of medulloblastoma cells. J Neurooncol.101(2):215-26. Abouantoun TJ, MacDonald TJ. 2009. Imatinib blocks migration and invasion of medulloblastoma cells by concurrently inhibiting activation of platelet-derived growth factor receptor and transactivation of epidermal growth factor receptor. Mol Cancer Ther.8(5):1137-47. Breccia M, Muscaritoli M, Aversa Z, Mandelli F, Alimena G. 2004. Imatinib Mesylate May Improve Fasting Blood Glucose in Diabetic Ph+ Chronic Myelogenous Leukemia Patients Responsive to Treatment. J. Clin. Onocol. 22:4653-4655. Clément S, Krause U, Desmedt F, Tanti JF, Behrends J, Pesesse X, Sasaki T, Penninger J, Doherty M, Malaisse W, Dumont JE, Le Marchand-Brustel Y, Erneux C, Hue L, Schurmans S. 2001. The lipid phosphatase SHIP2 controls insulin sensitivity. Nature 409(6816):92-97. Cnop M, Welsh N, Jonas J-C, Jorns A, Lenzen S, Eizirik DL. 2005. Mechanisms of pancreatic beta-cell death in type 1 and type 2 diabetes: many differences, few similarities. Diabetes, 54 (Suppl. 2): S97-S107. Colicelli J. 2010. ABL tyrosine kinases: evolution of function, regulation, and specificity. Sci. Signal.3(139): re6. Couzin J. 2005. Diabetes research. Researchers puzzle over possible effect of Gleevec. Science 307:1711. Dan S, Naito M, Seimiya H, Kizaki A, Mashima T, Tsuruo T. 1999. Activation of c-Abl tyrosine kinase requires caspase activation and is not involved in JNK/SAPK activation during apoptosis of human monocytic leukemia U937 cells. Oncogene 18(6):1277-1283. David T, Nicholas W, Tyler J, James G, Samuel S, Christopher F, Jonathan F and George D. 2001. STI571 inactivation of the gastrointestinal stromal tumor c-KIT oncoprotein: biological and clinical implications. Oncogene 20, 5054-5058. Donath MY, Storling J, Maedler K, Mandrup-Poulsen T. 2003. Inflammatory mediators and islet β-cell failure: a link between type 1 and type 2 diabetes. J Mol Med 81:455-470. Genua M, Pandini G, Cassarino MF, Messina RL, Frasca F. 2009. c-Abl and insulin receptor signalling. Vitam Horm 80:77-105. Gier B, Krippeit-Drews P, Sheiko T, Aguilar-Bryan L, Bryan J, Düfer M, Drews G. 2009. Suppression of KATP channel activity protects murine pancreatic beta cells against oxidative stress. J Clin Invest.119(11):3246-3256. Goodman VL, Rock EP, Dagher R, Ramchandani RP, Abraham S, Gobburu JV, Booth BP, Verbois SL, Morse DE, Liang CY, Chidambaram N, Jiang JX, Tang S, Mahjoob K, Justice R, Pazdur R. 2007. Approval summary: sunitinib for the treatment of imatinib refractory or intolerant gastrointestinal stromal tumors and advanced renal cell carcinoma. Clin Cancer Res.13(5):1367-1373. Gysemans C, Callewaert H, Overbergh L, Mathieu C. 2008. Cytokine signalling in the beta-cell: a dual role for IFNgamma. Biochem Soc Trans. 36(Pt 3):328-333. Hägerkvist R, Jansson L, Welsh N. 2008. Imatinib mesylate improves insulin sensitivity and glucose disposal rates in rats fed a high-fat diet. Clin Sci (Lond). 114(1):65-71. Han MS, Chung KW, Cheon HG, Rhee SD, Yoon CH, Lee MK, Kim KW, Lee MS. 2009. Imatinib mesylate reduces endoplasmic reticulum stress and induces remission of diabetes in db/db mice. Diabetes.58(2):329-336. Hantschel O, Wiesner S, Güttler T, Mackereth D, Remsing Rix L, Mikes Z, Dehne J, Görlich D, Sattler M, Superti-Furga G. 2005. Structural basis for cytoskeletal association of Bcr-Abl/c-Abl. Mol. Cell, 19(4), 461-473.
17
Ishihara H, Sasaoka T, Ishiki M, Wada T, Hori H, Kagawa S, Kobayashi M. 2002. Membrane localization of Src homology 2-containing inositol 5'-phosphatase 2 via Shc association is required for the negative regulation of insulin signaling in Rat1 fibroblasts overexpressing insulin receptors. Mol Endocrinol.16(10):2371-2381. Kumar S, Mishra N, Raina D, Saxena S, Kufe D. 2003. Abrogation of the cell death response to oxidative stress by the c-Abl tyrosine kinase inhibitor STI571. Mol Pharmacol 63(2):276-282. Lazar DF, Saltiel AR. 2006. Lipid phosphatases as drug discovery targets for type 2 diabetes. Nat Rev Drug Discov. 5(4):333-42. Maekawa T, Ashihara E, Kimura S. 2007. The Bcr-Abl tyrosine kinase inhibitor imatinib and promising new agents against Philadelphia chromosome positive leukemias. Review. Int J Clin Oncol 12(5):327-340. Mandrup-Poulsen T. 2003. Beta cell death and protection. Ann. N. Y. Acad. Sci. 1005
: 32-42.
Motzer RJ, Michaelson MD, Redman BG, Hudes GR, Wilding G, Figlin RA, Ginsberg MS, Kim ST, Baum CM, DePrimo SE, Li JZ, Bello CL, Theuer CP, George DJ, Rini BI. 2006. Activity of SU11248, a multitargeted inhibitor of vascular endothelial growth factor receptor and platelet-derived growth factor receptor, in patients with metastatic renal cell carcinoma. J Clin Onc. 24: 16–24. Panagiotis V, Garyfalia D, Katerina K, Effie T, Paraskevi K. 2010. High glucose induces suppression of insulin signalling and apoptosis via upregulation of endogenous IL-1β and suppressor of cytokine signalling-1 in mouse pancreatic beta cells. Cellular Signalling, 22(5):791-800. Pesesse X, Deleu S, De Smedt F, Drayer L, Erneux C. 1997. Identification of a second SH2-domain-containing protein closely related to the phosphatidylinositol polyphosphate 5-phosphatase SHIP. Biochem Biophys Res Commun. 239(3):697-700. Pluk H, Dorey K, Superti-Furga G. 2002. Autoinhibition of c-Abl. Cell, 108, 247-259. Raina D, Mishra N, Kumar S, Kharbanda S, Saxena S, Kufe D. 2002. Inhibition of c-Abl with STI571 Attenuates Stress-Activated Protein Kinase Activation and Apoptosis in the Cellular Response to 1-β-D-Arabinofuranosylcytosine. Mol Pharmacol 61(6):1489-1495. Schmid AC, Byrne RD, Vilar R, Woscholski R.2004. Bisperoxovanadium compounds are potent PTEN inhibitors. FEBS Lett. 566(1-3):35-38. Stiles BL, Kuralwalla-Martinez C, Guo W, Gregorian C, Wang Y, Tian J, Magnuson MA, Wu H. 2006. Selective deletion of Pten in pancreatic beta cells leads to increased islet mass and resistance to STZ-induced diabetes. Mol Cell Biol. 26(7):2772-2781. Suwa A, Kurama T, Shimokawa T. 2010. SHIP2 and its involvement in various diseases. Expert Opin Ther Targets14(7):727-737. Tamura M, Gu J, Matsumoto K, Aota S, Parsons R, Yamada KM. 1998. Inhibition of cell migration, spreading, and focal adhesions by tumor suppressor PTEN. Science 280(5369):1614-1617. Vazquez F, Grossman SR, Takahashi Y, Rokas MV, Nakamura N, Sellers WR. 2001. Phosphorylation of the PTEN tail acts as an inhibitory switch by preventing its recruitment into a protein complex. J Biol Chem. 276(52):48627-48630. Veneri D, Franchini M, Bonora E. 2005. Imatinib and Regression of Type 2 Diabetes. N Engl J Med. 352(10):1049-1050. Wang L, Liu Y, Yan Lu S, Nguyen KT, Schroer SA, Suzuki A, Mak TW, Gaisano H, Woo M. 2010. Deletion of Pten in pancreatic ß-cells protects against deficient ß-cell mass and function in mouse models of type 2 diabetes. Diabetes. 59(12):3117-3126. Wang, J.Y.J. 2004. Controlling Abl: auto-inhibition and co-inhibition? Nature Cell Biol. 6: 3-7.
18
Weston CR, Davis RJ. 2002. The JNK signal transduction pathway. Curr Opin Genet Dev. 12(1):14-21. Wong YH, Lee TY, Liang HK, Huang CM, Wang TY, Yang YH, Chu CH, Huang HD, Ko MT, Hwang JK. 2007. KinasePhos 2.0: a web server for identifying protein kinase-specific phosphorylation sites based on sequences and coupling patterns. Nucleic Acids Research. 35:W588-594. Yim EK, Peng G, Dai H, Hu R, Li K, Lu Y, Mills GB, Meric-Bernstam F, Hennessy BT, Craven RJ, Lin SY. 2009. Rak functions as a tumor suppressor by regulating PTEN protein stability and function. Cancer Cell. 15(4):304-314.