Page 1
MECHANISMS OF CYTOTOXICITY OF THREE NEW
CATECHOLS AND ONE NAPHTHALENEDIOL
by
ALEXANDRU CHICHIRAU, M.Sc.
A thesis submitted to the Faculty of Graduate Studies and Reesearch
in partial fulfillment of the requirements for the degree of
Master of Science
Department of Chemistry
CARLETON UNIVERSITY
Ottawa, Ontario, Canada
January 2008
©copyright
2008, Alexandru Chichirau
Page 2
1*1 Library and Archives Canada
Published Heritage Branch
395 Wellington Street Ottawa ON K1A0N4 Canada
Bibliotheque et Archives Canada
Direction du Patrimoine de I'edition
395, rue Wellington Ottawa ON K1A0N4 Canada
Your file Votre reference ISBN: 978-0-494-40655-7 Our file Notre reference ISBN: 978-0-494-40655-7
NOTICE: The author has granted a nonexclusive license allowing Library and Archives Canada to reproduce, publish, archive, preserve, conserve, communicate to the public by telecommunication or on the Internet, loan, distribute and sell theses worldwide, for commercial or noncommercial purposes, in microform, paper, electronic and/or any other formats.
AVIS: L'auteur a accorde une licence non exclusive permettant a la Bibliotheque et Archives Canada de reproduire, publier, archiver, sauvegarder, conserver, transmettre au public par telecommunication ou par Plntemet, prefer, distribuer et vendre des theses partout dans le monde, a des fins commerciales ou autres, sur support microforme, papier, electronique et/ou autres formats.
The author retains copyright ownership and moral rights in this thesis. Neither the thesis nor substantial extracts from it may be printed or otherwise reproduced without the author's permission.
L'auteur conserve la propriete du droit d'auteur et des droits moraux qui protege cette these. Ni la these ni des extraits substantiels de celle-ci ne doivent etre imprimes ou autrement reproduits sans son autorisation.
In compliance with the Canadian Privacy Act some supporting forms may have been removed from this thesis.
Conformement a la loi canadienne sur la protection de la vie privee, quelques formulaires secondaires ont ete enleves de cette these.
While these forms may be included in the document page count, their removal does not represent any loss of content from the thesis.
Canada
Bien que ces formulaires aient inclus dans la pagination, il n'y aura aucun contenu manquant.
Page 3
ABSTRACT
Catechols (o/fho-hydroxyphenols) are widely distributed in nature, and
can also be produced in animals by biosynthetic pathways. Catechols found in
foods play important roles as antioxidants. In this thesis several synthetic
catechols, a naphthalenediol and the known compounds menadiol/menadione
will be discussed. Inside cells catechols can be metabolized to electrophilic
quinones, which cause cell death by several mechanisms. Determining which
mechanism of toxicity is dominant in adrenal pheochromocytoma (PC12) cells
is the focus of this work.
Several assays were used to monitor toxic effects on the cells. These
included use of catalase as a probe of peroxide presence, monitoring of GSH
levels, and measurement of the initial rates of peroxide and quinone
production. These observations showed that extracellular autoxidation is the
main mechanism of toxicity for the synthetic catechols. The naphthalenediol
studied showed a different mechanism, the induction of lipid peroxidation.
Both menadiol and menadione were shown to severely deplete GSH. Thus,
small variations in the diol structure led to significant differences in the
cytotoxicity of this family of compounds.
in
Page 4
ACKNOWLEDGEMENTS
Firstly and foremost I have to thank my supervisor, Dr. James Wright,
for teaching me how to always think and plan ahead, to come up with
hypothesis and to discuss results and ideas. He is always supportive and
helpful, kind and generous. By seeking the real answer and the meaning and
usefulness of our work, he pushed me to become a better and true
researcher. I will always be inspired by his professionalism, attention to
details, hard work and patience.
For always being there to answer my questions, to talk about science
and work, to advise on research and writing, to help with ideas and solution,
to constantly support and mentor, I am nothing but deeply thankful to my co-
supervisor, Dr. William Willmore.
For being good colleagues and sharing the graduate student life with
me, many thanks to Mihaela Flueraru, Leonid Chepelev, Dr. Hooman
Shadnia, Remmick So, Eman Ahmed -Muhsin from the Wright's lab and
Angie, Mohamed, Jacques and Ahmed from Willmore's lab.
All my work could not have been completed without the help of Dr.
Steffany Bennett from the University of Ottawa for providing the PC 12-AC
cells and Dr. Tony Durst and his hard working group (Dr. Helmi Hussain and
Martin Charron) for synthesizing the new compounds.
Sincere thanks for the all the people of QBM Cell Science, Ottawa, in
particular Queade and Kenji, for just being the best bunch of people to work
with.
IV
Page 5
I can't finish without thanking from the bottom of my heart to my mom
who always supported me and even far away from me she was always near
me and in my heart and life. Thanks to Clark for supporting me during my
student life and understanding the duties of a grad student without
understanding the science behind it.
Thank you all again and my deepest gratitude for your help!
v
Page 6
TABLE OF CONTENT
Title page i
Copyright form ii
Abstract iii
Acknowledgments iv
Table of content vi
List of abbreviations viii
List of tables xi
List of figures xii
Chapter 1 - INTRODUCTION 1
1.1. Phenolic antioxidants as a class 2
1.2. Synthetic phenols 4
1.3. Effect of substituents 5
1.4. Naturally occurring catechols 6
1.5. Catechols as metabolites of benzene and phenol 7
1.6. Catechols react fast with DPPH radical 7
1.7. Catechols as prooxidants 9
1.8. Mechanisms of diol toxicity 10
1.8.1. Reactions of quinones with intracellular thiols 12
1.8.2. Reactions of quinones with DNA bases 13
1.8.3. ROS generation by quinones through redox cycling 15
1.9. Effects of diols on intracellular GSH content 17
1.10. Menadione 19
vi
Page 7
1.11. Hypothesis and aims 23
Chapter 2 - MATERIALS AND METHODS 25
2.1. Chemicals 26
2.2. Cell culture 26
2.3. Tested compounds 26
2.4. Text for toxicity - cell viability 29
2.5. Hydrogen peroxide (FOX- ferric oxidase) assay 30
2.6. Extracellular quinone assay 31
2.7. Glutathione assay 32
2.8. Protein determination 33
2.9. Statistics 34
Chapter 3 - RESULTS 35
3.1. Cytotoxicity 36
3.2. Hydrogen peroxide production 39
3.3. Quinone quantification 43
3.4. GSH cellular content 44
3.5. Menadiol - Menadione 46
Chapter 4 - DISCUSSIONS 54
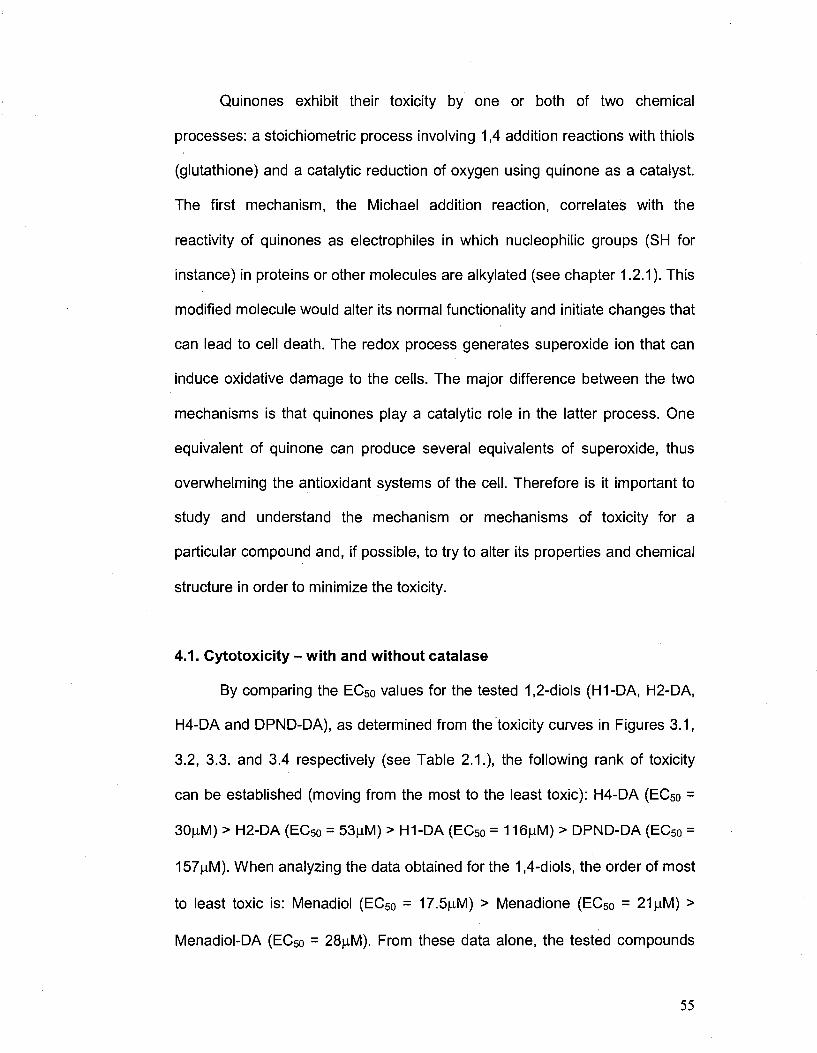
4.1. Cytotoxicity - with and without catalase 55
4.2. Correlation between cytotoxicity and intracellular GSH levels 57
4.3. Cytotoxicity is correlated with hydrogen peroxide generation 59
REFERENCES 67
vn
Page 8
LIST OF ABBREVIATIONS
yGCL - y-glutamyl-cystein ligase
yGCS - y-glutamyl cystein synthese
2-OHE - 2-hydroxyestrone
4-OHE - 4-hydroxyestrone
4-OHEN- 4-hydroxyequilenin
4-OHEQ - 4-hydroxyequilin
ADP - adenosine diphosphate
ATP - adenosine triphosphate
BHA - tert-butyl-4-hydroxyanisole
BHT - 2,6-di-tert-butyl-p-cresol
BSO - buthionine sulfoximine
DA - diacetate
DMSO - dimethyl sulfoxide
DNA - deoxyribonucleic acid
DPND - 1,4-dipropyl-naphthalene-2,3-diol
DPPH -1,1 -diphenyl-2-picrylhydrazyl
DTNB - 5,5'-dithiobis(2-nitrobenzoic acid
EC50 - effective concentration that reduced viability of PC-12AC cells by 50%
of controls
EDTA - ethylenediamine tetraacetic acid
EGCG - epigallocatechin gallate
ESR - electron spin resonance
Vlll
Page 9
FOX- ferric oxidase
GR - glutathione reductase
GSH - glutathione, reduced form
GSSG - glutathione, oxidized
GS-SPr - glutathione-thiol protein disulfide
H2O2 - hydrogen peroxide
HAT - hydrogen-atom transfer
HBSS - Hank's balanced salt solution
HO- - hydroxyl radical
HRT - hormone replacement therapy
KP| - potassium phosphate buffer
L-DOPA - 3,4-dihydroxy-L-phenylalanine
LOO" - lipid peroxyl radical
LOOH - lipid peroxide
MTT-3-(3,5-dimethylthiazol-2-yl)-2,5-diphenyltatrazoliumbromide
NADH - nicotinamide adenine dinucleotide, reduced form
NADP* - nicotinamide adenine dinucleotide phsphate, oxidized form
NADPH - nicotinamide adenine dinucleotide phosphate, reduced form
NQ01 - NAD(P)H quinone oxidoreductase
O2'" - superoxide radical anion
PAH - polycyclic aromatic hydrocarbons
PBS - phosphate buffer saline
PC12-AC - adherent line of rat adrenal pheochromocytoma cells
QSAR - quantitative structure - activity relationship
ROS - reactive oxygen species
IX
Page 10
RPM11640 - Roswell Park Memorial Institute medium
RS" - thiol anion
SEM - standard error of the mean
SOD - superoxide dismutase
X
Page 11
LIST OF TABLES
1.1. Classes of phenolic compounds in plants 3
2.1. EC50 values for all the tested compounds in presence and absence of 50
catalase
XI
Page 12
LIST OF FIGURES
1.1. Chemical structures of BHA and BHT 4
1.2. Generic structure of a flavonoid molecule 5
1.3. Chemical structure of EGCG 6
1.4. Schematic representation of benzene metabolism 8
1.5. Two-step oxidation of catechol 11
1.6. Catechol as terminator of lipid peroxidation 11
1.7. Formation of superoxide radical anion by H-atom transfer from 12
semiquinone
1.8. Electrophilic 1,4-addtion to 1,4-benzoquinone 13
1.9. Formation of unstable depurinating adducts from the reaction of 4- 14
hydroxyestrone-o-quinone with deoxyguanosine
1.10. Synthesis of Catechol-4-N7Guanine and Catechol-4-N3Adenine by 15
reaction of Catechol quinone with 2'-Deoxyguanosine or Adenine
1.11. Generation of reactive oxygen species (ROS) by redox cycling 16
2.1. Chemical structures of H1 and H1-DA 27
2.2. Chemical structures of H2 and H2-DA 27
2.3. Chemical structures of H4 and H4-DA 28
2.4. Chemical structures of DPND and DPND-DA 28
2.5. Chemical structures of Menadiol, Menadiol-DA and Menadione 28
3.1. Toxicity of H1-DA to PC12-AC cells in the presence and absence of 36
added catalase
xu
Page 13
3.2. Toxicity of H2-DA to PC12-AC cells in the presence and absence of 37
catalase
3.3. Toxicity of H4-DA to PC12-AC cells in the presence and absence of 38
catalase
3.4. Toxicity of DPND-DA to PC12-AC cells in the presence and absence 39
of catalase
3.5. Extracellular hydrogen peroxide in the medium when PC12-AC cells 40
were incubated with 100 | M of each of the test compounds
3.6. Hydrogen peroxide time course for the autoxidation of 100 jJVI of 41
each of the tested componds in HBSS
3.7. Time course for the extracellular levels of quinones measured after 43
incubating 100 \M of each of the catechols with PC12-AC cells in
HBSS
3.8. Total glutathione (GSH and GSSG) response curves to increasing 45
concentrations of tested compounds in their DA form
3.9. Menadiol-DA toxicity to PC12-AC after 24 hours of incubation at 47
37°C in the presence and absence of added catalase
3.10. Menadiol toxicity to PC12-AC. PC12-AC were incubated, with or 48
without catalase
3.11. Toxicity of Menadione to PC12-AC in the presence and absence of 49
catalase
3.12. Total glutathione response curves to treatment with different 51
concentrations of menadiol for 3 and 24 hours at 37°C.
3.13. Total glutathione (GSH and GSSG) response curves as function of 53
menadione concentration for 3 and 24 hour incubations at 37°C.
xiii
Page 14
4.1. Dihydroxy, semiquinone and quinone forms of 1,2-naphthalenediol 62
4.2. Dihydroxy, semiquinone and quinone forms of 1,4-naphthalenediol 62
4.3. Dihydroxy, semiquinone and quinone forms of 2,3-naphthalenediol 63
xiv
Page 15
Chapter 1
INTRODUCTION
Page 16
1.1. Phenolic antioxidants as a class
During normal physiological processes reactive oxygen species (ROS)
are constantly produced but the antioxidant defence mechanisms of the
organism remove and annihilate them (Halliwell, 1992). When there is an
imbalance between the ROS levels and the native antioxidant defence
mechanisms, a state of oxidative stress occurs that can lead to damage at the
cellular membrane level and to modification of the intracellular molecules (El-
Habit, 2000)
Phenolic compounds are biosynthesised in plants and vegetables as
secondary metabolites from the pentose phosphate, polyketide and shikimic
acid pathways. They play a wide range of physiological roles such as
antioxidant, anti-allergenic, anti-atherogenic, anti-inflammatory, anti-microbial,
cardioprotective, anti-thrombotic etc (Manach, 2005, Puupponen-Pimaja,
2001).
The consumption of high levels of fruits and vegetables are associated
with health benefits (Parr, 2000). These beneficial effects of the phenolic
compounds were associated with their antioxidant activity (Heim, 2002).
Structurally, phenolic compounds are aromatic rings bearing one of
more hydroxyl groups and vary in complexity from simple molecules
(catechol) to polymerized compounds (eg. tannins) (Bravo, 1998).
2
Page 17
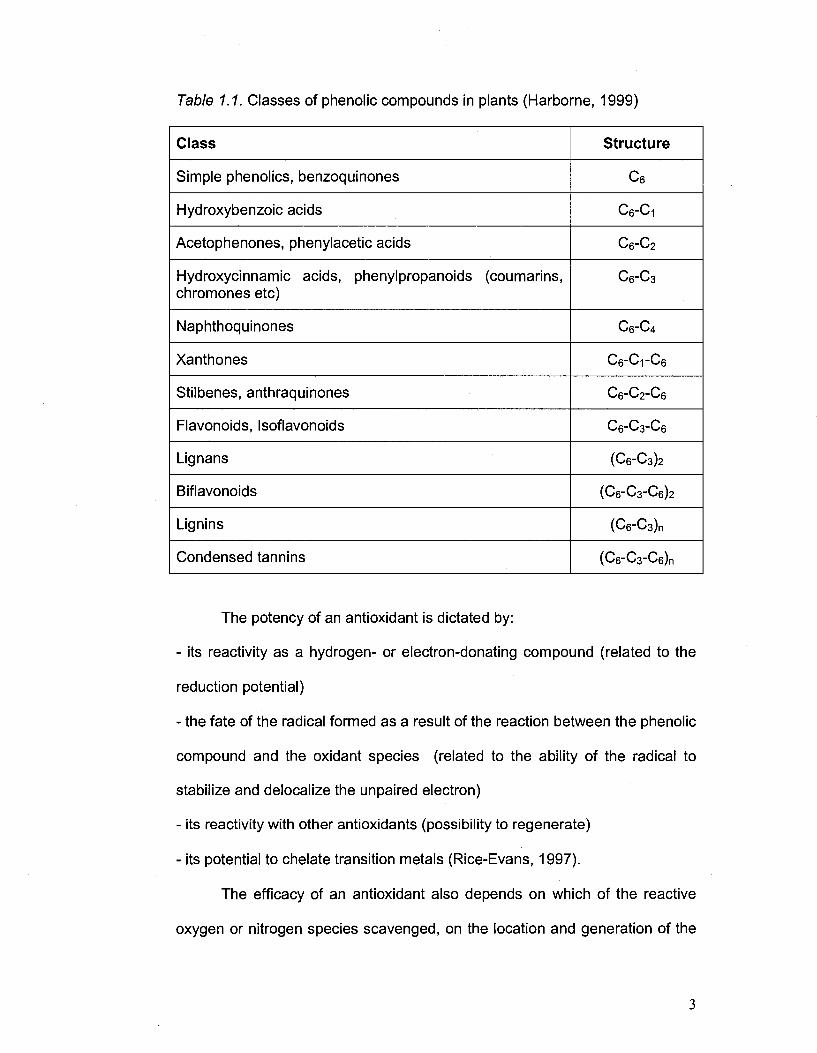
Table 1.1. Classes of phenolic compounds in plants (Harborne, 1999)
Class
Simple phenolics, benzoquinones
Hydroxybenzoic acids
Acetophenones, phenylacetic acids
Hydroxycinnamic acids, phenylpropanoids (coumarins, chromones etc)
Naphthoquinones
Xanthones
Stilbenes, anthraquinones
Flavonoids, Isoflavonoids
Lignans
Biflavonoids
Lignins
Condensed tannins
Structure
c6
C6-C1
C6-C2
C6-C3
C6-C4
C6-C1-C6
C6-C2-C6
C6-C3-C6
(C6-C3)2
(C6"C3-C6)2
(C6-C3)n
(C6-C3-Ce)n
The potency of an antioxidant is dictated by:
- its reactivity as a hydrogen- or electron-donating compound (related to the
reduction potential)
- the fate of the radical formed as a result of the reaction between the phenolic
compound and the oxidant species (related to the ability of the radical to
stabilize and delocalize the unpaired electron)
- its reactivity with other antioxidants (possibility to regenerate)
- its potential to chelate transition metals (Rice-Evans, 1997).
The efficacy of an antioxidant also depends on which of the reactive
oxygen or nitrogen species scavenged, on the location and generation of the
3
Page 18
oxidative stress and on the accessibility of the antioxidant to the site of
damage. For instance, a water-soluble compound will be less active in
protecting against oxidative stress that occurs in lipid particles or cell
membranes (Morton, 2000).
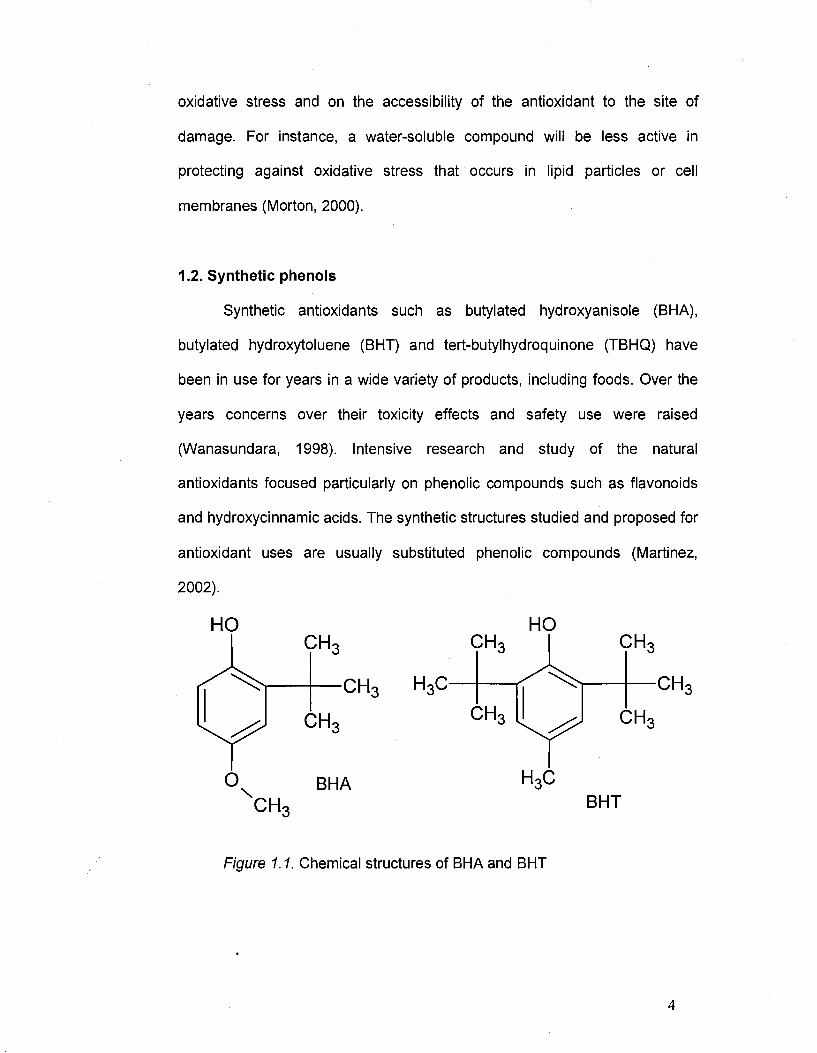
1.2. Synthetic phenols
Synthetic antioxidants such as butylated hydroxyanisole (BHA),
butylated hydroxytoluene (BHT) and tert-butylhydroquinone (TBHQ) have
been in use for years in a wide variety of products, including foods. Over the
years concerns over their toxicity effects and safety use were raised
(Wanasundara, 1998). Intensive research and study of the natural
antioxidants focused particularly on phenolic compounds such as flavonoids
and hydroxycinnamic acids. The synthetic structures studied and proposed for
antioxidant uses are usually substituted phenolic compounds (Martinez,
2002).
HO HO CH< CH<
-CH< HoC-
CH<
^
CH< CH<
-CH<
^ CH<
O \
BHA HoC
CH< BHT
Figure 1.1. Chemical structures of BHA and BHT
4
Page 19
1.3. Effect of substituents
The antioxidant activity of the phenols was the object of many
structure-activity studies, all of which focused on the aromatic OH groups. It
was even proposed that the potency of a given flavonoid is proportional to the
number of hydroxyl groups (Cao, 1997).
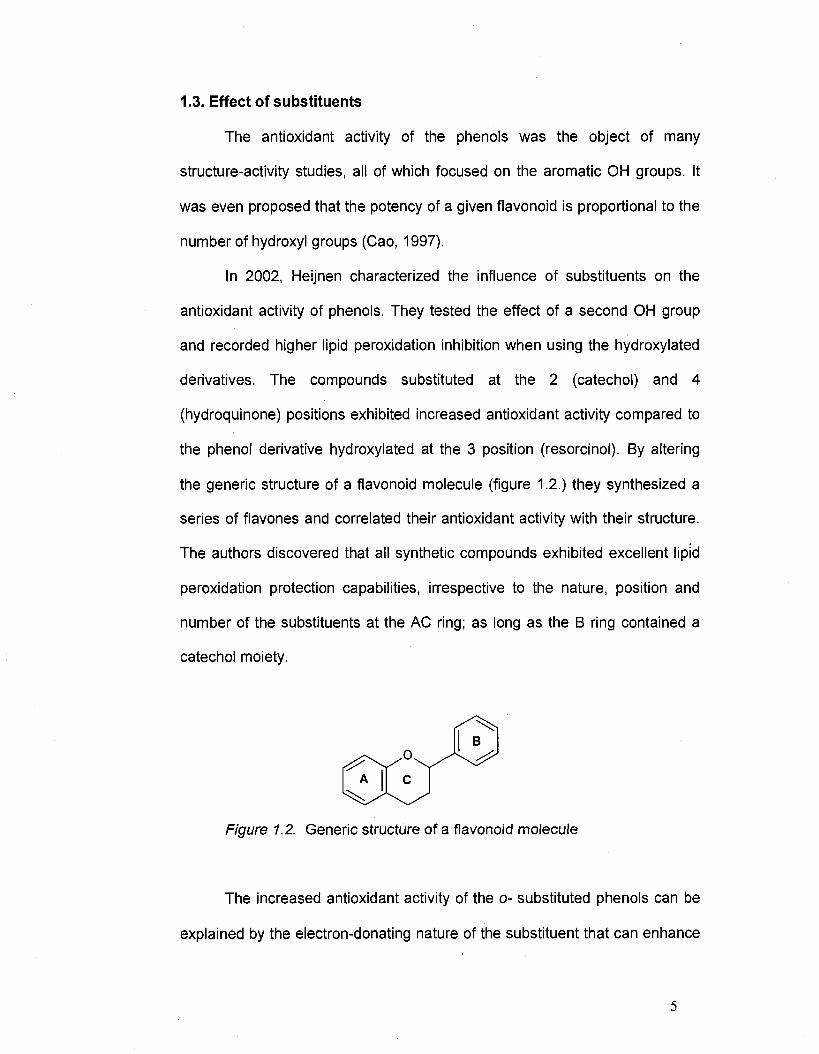
In 2002, Heijnen characterized the influence of substituents on the
antioxidant activity of phenols. They tested the effect of a second OH group
and recorded higher lipid peroxidation inhibition when using the hydroxylated
derivatives. The compounds substituted at the 2 (catechol) and 4
(hydroquinone) positions exhibited increased antioxidant activity compared to
the phenol derivative hydroxylated at the 3 position (resorcinol). By altering
the generic structure of a flavonoid molecule (figure 1.2.) they synthesized a
series of flavones and correlated their antioxidant activity with their structure.
The authors discovered that all synthetic compounds exhibited excellent lipid
peroxidation protection capabilities, irrespective to the nature, position and
number of the substituents at the AC ring; as long as the B ring contained a
catechol moiety.
Figure 1.2. Generic structure of a flavonoid molecule
The increased antioxidant activity of the o- substituted phenols can be
explained by the electron-donating nature of the substituent that can enhance
5
Page 20
the electron density at the oxygen of the phenol and by the strong internal H-
bond formed in the radical (Matsuura, 2000).
1.4. Naturally occurring catechols
Recently, the antioxidant properties of polyphenol compounds like
catechins, flavonols, EGCG (epigallocatechin gallate) (Figure 1.3) have been
intensively studied (Higdon, 2003 and Fraga, 2007). Their role as antioxidants
in red wine as well as green and black tea is the focus of much media
attention. The "French paradox" which refers to the extreme longevity and
absence of heart disease in the south of France is explained by the
consumption of red wine that contains polyphenols (De Lange, 2007).
Figure 1.3. Chemical structure of EGCG
Catechols can be endogenously found in humans and mammals as
neurotransmitters and their precursors - adrenaline, noradrenaline, dopamine
and L-DOPA (L-3,4-dihydroxyphenulanaline) (Schweigert, 2001). The
6
Page 21
presence of phenols in the body can be due also to tobacco smoke that
contains catechol, catechol quinones and polymerized catechols (Pryor,
1998).
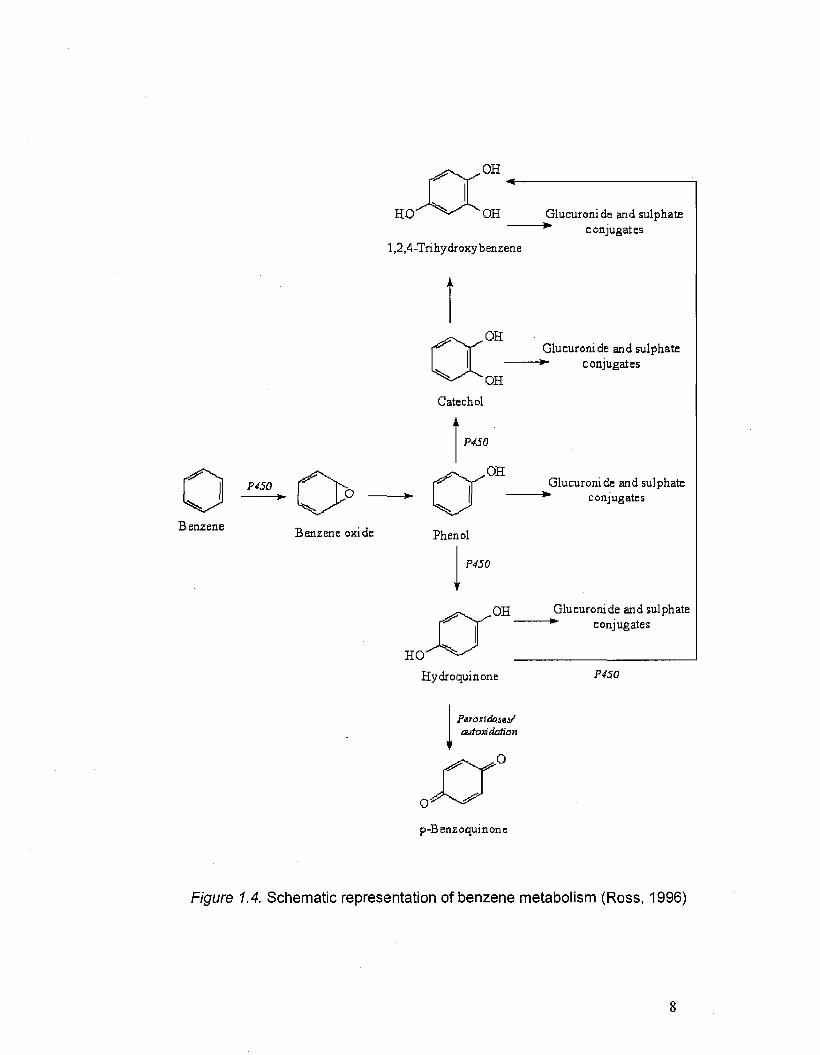
1.5. Catechols as metabolites of benzene and phenol
The presence of catechols in the body is not only due to the direct
uptake from different sources, but to the in vivo formation of this class of
compounds from exogenous chemicals. It is well known (Schlosser, 1993 and
Tsao, 1998) that catechols are formed during benzene metabolism (Figure
1.4). In this process, other OH-bearing compounds are synthesized, such as
phenols, hydroquinones and trihydroxybenzene.
1.6. Catechols react fast with DPPH radical
A commonly used method for the prediction of antioxidant activity is
based on the scavenging of 2,2-diphenyl-1-picrylhydrazyl radical (DPPH) - a
stable radical whose decrease in absorbance at 519nm due to reaction with
an antioxidant species is measured (Brighente, 2007).
Wang (2006) reported that quercitin, myricetin and fustin, all flavonoids
that contain a catechol moiety in the B ring (position 3' and 4') have a much
higher DPPH scavenging activity when compared to kaempherol (4'-OH) and
morin (2',4'-di-OH). Their results suggest once again that in order to design a
potent flavonoid antioxidant that will quickly react with the DPPH radical, the
catechol moiety is a prerequisite. Other studies (Furusawa, 2005) support the
conclusion that rapid reaction with DPPH correlates with high scavenging
activity of the 3',4'- catechol motif.
7
Page 22
HO"
OH
'OH Glucuronide and sulphate conjugates
1,2,4-Trihydroxy benzene
P450
Benzene Benzene oxide
.OH
•OH
Catechol
i t
P45Q
OH
u> — u Phenol
P4SQ
.OH
HO"
Hydro qui none
Glucuronide and sulphate -*• conjugates
Glucuronide and sulphate conjugates
Glucuronide and sulphate "*•• conjugates
P45Q
Peroxidases/ eutoxidation
o , ^ N ^
p-Benzoquinone
Figure 1.4. Schematic representation of benzene metabolism (Ross, 1996)
8
Page 23
1.7. Catechols as prooxidants
Despite numerous studies that have demonstrated the antioxidant
abilities of catechols, there is an increasing amount of scientific literature that
provides evidence for the prooxidant, cytotoxic effect of these compounds
(Galati, 2004). The products of phenol oxidation - quinones - can arylate
reduced glutathione and/or other cellular thiols, protein thiols, nucleophiles
(e.g. DNA bases) (Boots, 2005). Catechols and other polyphenols autooxidize
in aqueous media and can form toxic hydroxyl radicals if transition metals like
iron or copper are present (Said Ahmad, 1992). They can also be substrates
for enzymes like peroxidases and other metalloenzymes being converted to
quinines; known prooxidants and/or alkylating agents (Moridani, 2001).
Moridani (2003) performed a QSAR study on the toxicity of phenols in
rat hepatocytes and concluded that their cytotoxicity is a combination of
mechanisms i.e. phenoxy radicals and/or phenol metabolism to quinones.
Schweigert (2001) concluded that the mechanisms most cited to explain the
cytotoxicity of the catecholic compounds are: generation of ROS by redox
cycling, DNA damage by oxidative stress or arylation and protein damage by
oxidation or thiol arylation.
In 2002, Boots et al. published their results on the anti and prooxidant
activity of 4-methylcatechol. The authors confirmed that the catechol moiety is
a potent antioxidant pharmacophore by preventing microsomal lipid
peroxidation. At the same time they also reported the prooxidant activity of the
quinone (4-methyl-ortho-benzoquinone) formed as a result of the catechol
antioxidant action. The proposed mechanism of toxicity is protein sulphydryl
arylation. Thus, despite the protection against lipid peroxidation promoted by
9
Page 24
the catechol-containing antioxidant, indirectly (by means of the quinone by
product) they can also induce thiol arylation, which can stimulate lipid
peroxidation by inactivating GSH-dependent reductases, which are the native
defence against lipid peroxidation.
The other mechanism of catechol toxicity (oxidative damage by
hydrogen peroxide generation) on human erythrocytes was the focus of the
research done by Bukowska in 2004. After performing a wide range of
measurements ranging from reduced and total GSH levels, lipid peroxidation
damage, glutathione reductase, catalase and superoxide dismutase activities,
the authors concluded that is it the hydrogen peroxide production that plays
the most important role in the toxicity process. At lower concentrations,
catechol lowered the reduced glutathione levels, at moderate doses a
decresed catalase activity was recorded while glutathione reductase and
other enzyme are affected only at high doses.
1.8. Mechanisms of diol toxicity
In order to explain the toxicity of catechols, several mechanisms were
proposed, all of them related to the quinone toxicity. The catechols by
themselves are not toxic. The products of their metabolism, quinines, are
responsible for the toxicity.
Once inside the cells, the catechols undergo a 2-step oxidation, with a
quinone as final product (see Figure 1.5.).
Hydrogen Atom Transfer (HAT) Mechanism - the first step is HAT with
the formation of a semiquinone, which is an unstable radical species. After a
10
Page 25
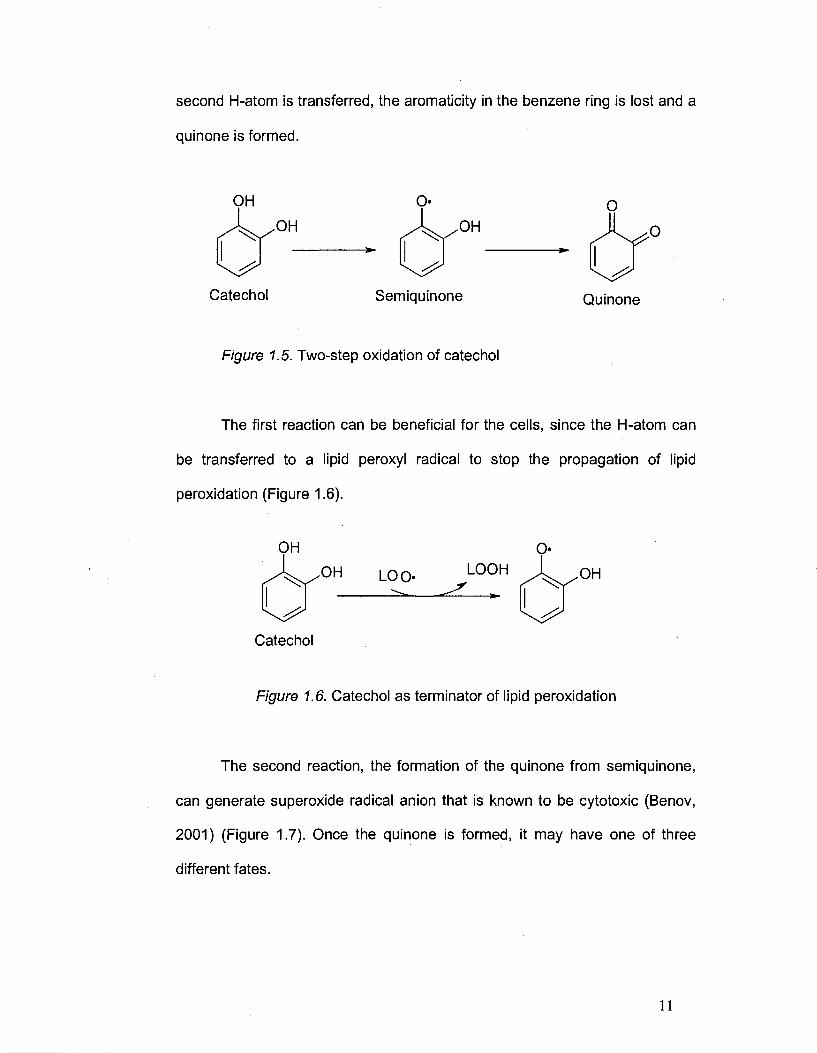
second H-atom is transferred, the aromaticity in the benzene ring is lost and a
quinone is formed.
OH
OH
Catechol
O-
OH
Semiquinone
O
.0
Quinone
Figure 1.5. Two-step oxidation of catechol
The first reaction can be beneficial for the cells, since the H-atom can
be transferred to a lipid peroxyl radical to stop the propagation of lipid
peroxidation (Figure 1.6).
OH O
OH LOO- LOOH OH
Catechol
Figure 1.6. Catechol as terminator of lipid peroxidation
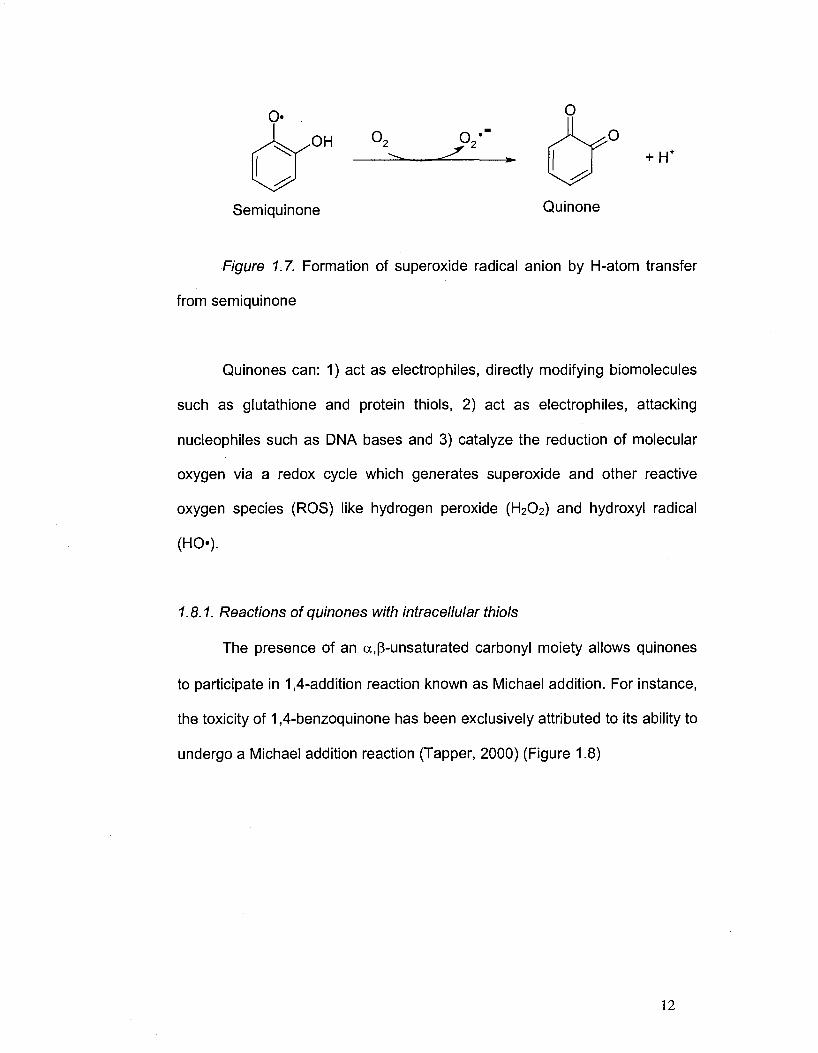
The second reaction, the formation of the quinone from semiquinone,
can generate superoxide radical anion that is known to be cytotoxic (Benov,
2001) (Figure 1.7). Once the quinone is formed, it may have one of three
different fates.
11
Page 26
o. . 9 ,0
+ H+
i i j
Semiquinone Quinone
P/gare 17. Formation of superoxide radical anion by H-atom transfer
from semiquinone
Quinones can: 1) act as electrophiles, directly modifying biomolecules
such as glutathione and protein thiols, 2) act as electrophiles, attacking
nucleophiles such as DNA bases and 3) catalyze the reduction of molecular
oxygen via a redox cycle which generates superoxide and other reactive
oxygen species (ROS) like hydrogen peroxide (H202) and hydroxyl radical
(H0-).
1.8.1. Reactions of quinones with intracellular thiols
The presence of an a,p-unsaturated carbonyl moiety allows quinones
to participate in 1,4-addition reaction known as Michael addition. For instance,
the toxicity of 1,4-benzoquinone has been exclusively attributed to its ability to
undergo a Michael addition reaction (Tapper, 2000) (Figure 1.8)
12
Page 27
o"
Figure 1.8. Electrophilic 1,4-addition to 1,4-benzoquinone
The mechanism of toxicity due to alkylation of critical cellular
components by quinones was supported by studies involving substituted
benzoquinones. In 1986 Rossi compared methyl-substituted 1,4-
benzoquinones and reported that their cytotoxicity was correlated with the
ability to alkylate cellular thiols in isolated rat hepatocytes. Based on the EC50
values, the degree of methyl substitution.was inversely proportional to the
cytotoxicity. The same trend was reported by Gant in 1988 when studying
naphthoquinones and their ability to take part in 1,4-Michael addition reactions
with cellular thiol components.
1.8.2. Reactions of quinones with DNA bases
Another target for the quinones to attack can be DNA with which
quinones can form covalent adducts. There are two types of DNA adducts:
stable ones that can only be removed through a repair mechanism and
depurinating ones that are released from the DNA by destabilization of the
glycosyl bond (Cavalieri, 2002). It had been proposed that the depurinating
adducts formed by catechol-estrogen quinones reacting with DNA are of
major importance in initiating the breast or other types of cancers. When
13
O
+ R-S
0 R-S
Page 28
released from the DNA the adducts leave apurinic sites that can generate
cancer leading mutations (Cavalieri, 1997).
Figure 1.9. Formation of unstable depurinating adducts from the
reaction of 4-hydroxyestrone-o-quinone with deoxyguanosine
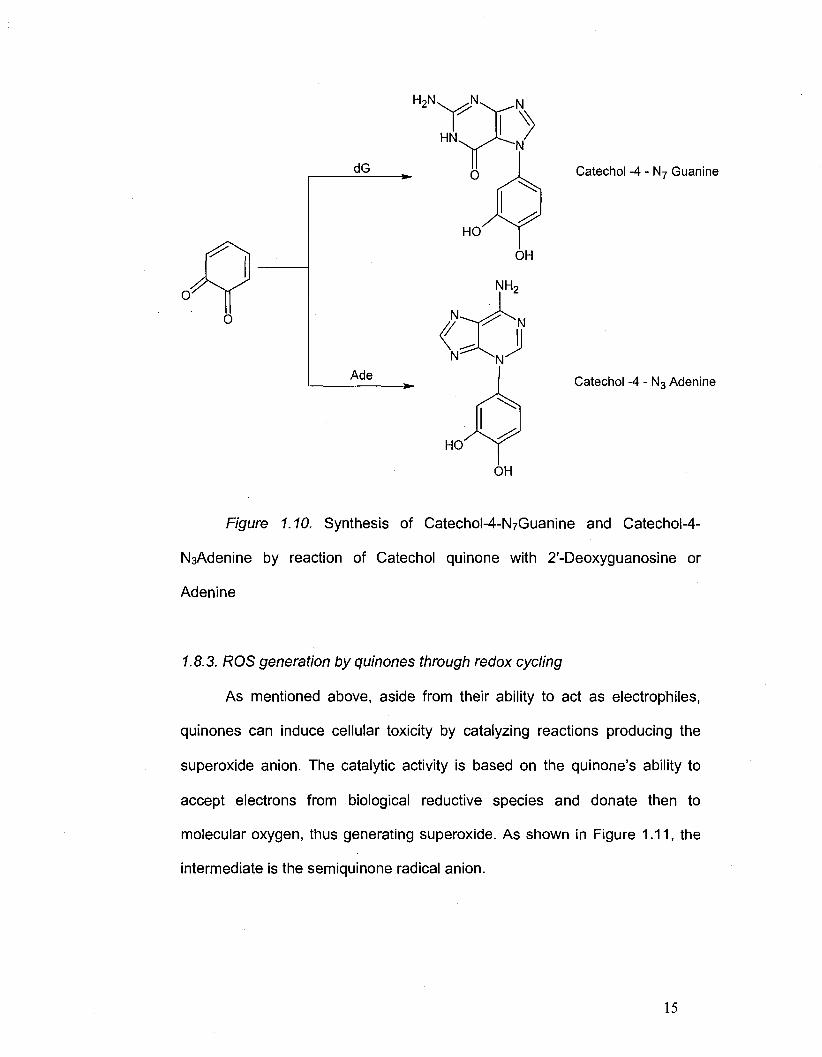
Cavalieri (2002) showed that in both chemical and enzymatic systems
catechol and dopamine derived ortho-quinones react with DNA bases to form
predominantly depurinating adducts similar to those formed by the catechol-
estrogen-3,4- quinones (Figure 1.10).
Levay (1992) studied the formation of DNA adducts in HL-60
promyelocytic leukemia cells when treatyed with hydroquinone, catechol and
other benzene metabolites. The results show that hydroquinone is 7 to 9
times more potent than catechol at initiating DNA adduct formation. At the
same time the authors found a good correlation between the adduct formation
and the cytotoxicity of hydroquione and catechol. Their results suggest that
the production of DNA adducts may play a significant role in the toxicity of
benzene in vivo.
14
Page 29
^ ^
0 />
o
dG
Ade
YY) 0
HO
N
HO
OH
NH2
N
J
OH
Catechol -4 - N7 Guanine
Catechol -4 - N3 Adenine
Figure 1.10. Synthesis of CatechoM-NzGuanine and Catechol-4-
NsAdenine by reaction of Catechol quinone with 2'-Deoxyguanosine or
Adenine
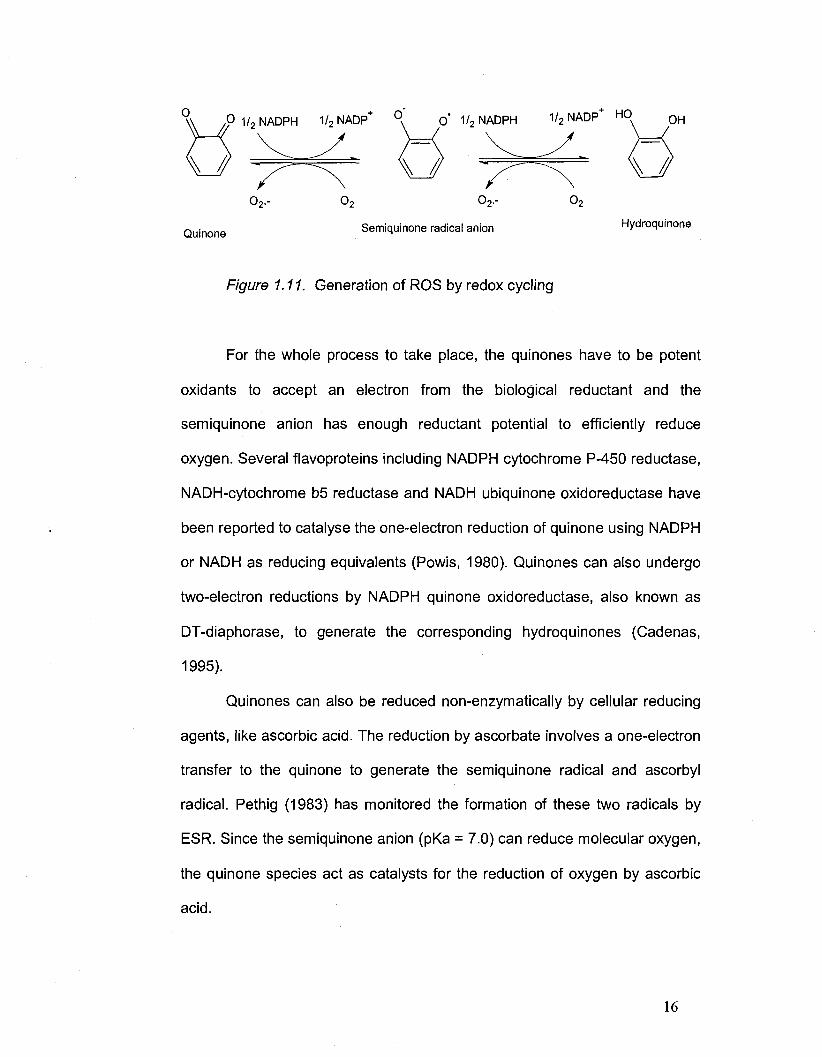
1.8.3. ROS generation by quinones through redox cycling
As mentioned above, aside from their ability to act as electrophiles,
quinones can induce cellular toxicity by catalyzing reactions producing the
superoxide anion. The catalytic activity is based on the quinone's ability to
accept electrons from biological reductive species and donate then to
molecular oxygen, thus generating superoxide. As shown in Figure 1.11, the
intermediate is the semiquinone radical anion.
15
Page 30
\ ,p 1/2 NADPH 1/2 NADP+ \ 0* 1/2 NADPH ^2NADP+ H 0 \ OH
W ^ ^x ' \ // " ^ ^ ' \ /
Quinone
02.- 0 2 02.- 0 2
Semiquinone radical anion Hydroquinone
Figure 1.11. Generation of ROS by redox cycling
For the whole process to take place, the quinones have to be potent
oxidants to accept an electron from the biological reductant and the
semiquinone anion has enough reductant potential to efficiently reduce
oxygen. Several flavoproteins including NADPH cytochrome P-450 reductase,
NADH-cytochrome b5 reductase and NADH ubiquinone oxidoreductase have
been reported to catalyse the one-electron reduction of quinone using NADPH
or NADH as reducing equivalents (Powis, 1980). Quinones can also undergo
two-electron reductions by NADPH quinone oxidoreductase, also known as
DT-diaphorase, to generate the corresponding hydroquinones (Cadenas,
1995).
Quinones can also be reduced non-enzymatically by cellular reducing
agents, like ascorbic acid. The reduction by ascorbate involves a one-electron
transfer to the quinone to generate the semiquinone radical and ascorbyl
radical. Pethig (1983) has monitored the formation of these two radicals by
ESR. Since the semiquinone anion (pKa = 7.0) can reduce molecular oxygen,
the quinone species act as catalysts for the reduction of oxygen by ascorbic
acid.
16
Page 31
The redox cycling process affects the cytotoxicity mechanism in two
ways. Firstly it consumes the cellular reducing power (NADPH or NADH)
taking it away from regular cellular processes. Secondly it generates
superoxide anion that can irreversibly change functional cellular
macromolecules (i.e. lipid peroxidation). By disproportionation, superoxide
anion quickly produces hydrogen peroxide which is a known oxidant in
biological systems.
1.9. Effects of diols on intracellular GSH content
Glutathione (L-gamma-glutamyl-L-cysteinylglycine) is a tripeptide
present in very high concentration inside the cells; up to 10 mM. (Syrus,
2000). It represents the major low molecular weight thiol in the cell and is also
the first line of defence against endogenous and exogenous electrophiles
(Dickinson, 2002). It is located in cytoplasm, mitochondria, cytosol and
nucleus (Ault, 2003). Glutathione is present in three forms: reduced (GSH)
and oxidized as disulfide with itself (GSSG) or thiol-protein (GS-SProtein).
Under physiological conditions, the ratio between reduced and oxidized varies
from ten to a hundred (Filomeni, 2002).
Glutathione has numerous biological functions such as: cysteine
storage, redox buffer, reducing power and conjugation with xenobiotics as
part of the detoxification process. Alterations in GSH concentration can induce
cellular apoptosis or play roles in neurodegenerative disease like Parkinson's
or Alzheimer's (Syrus, 2000).
Under oxidative stress, a total glutathione depletion occurs (Mytilineou,
2002). To cope with this situation, the cells try to maintain their redox status
17
Page 32
by different mechanisms: 1) de novo synthesis of glutathione by activation of
y-GCS (y-glutamyl cysteine synthese) - the rate limiting enzyme of glutathione
biosynthesis or 2) the recycling of GSH from GSSG by activation of
glutathione reductase (GR). If the oxidative attack is too long or too strong,
then the cells will not be able to produce continuously GSH, fast enough or
reduce it quickly enough and the cells will die (Filomeni, 2002 and Ault, 2003).
An increase in intracellular glutathione is a common response towards
extracellular toxins. Ishige (2001) showed that quercitin, fisetin, propyl gallate
and methyl caffeate, after 10 hours of incubation, increase the intracellular
levels of glutathione between 30 and 80% with respect to the control cells.
Dickinson (2003) suggested a correlation between the changes in the GSH
levels and different polyphenols from an adaptive point of view. The "adaptive
response" is the way the cells subjected to non-toxic stimuli react to future
stresses that would usually kill the cells. It has been proposed that some
compounds, like dietary constituents or nitric oxide, are protecting against
oxidative stress by inducing an "adaptive response" in cells, preparing them
for the possible subsequent oxidative event. Eftekhat (2000), while studying
the effect of t-butylhydroquinone on neuronal cells, observed that astrocytes
respond to this oxidant by doubling the amount of glutathione in 24 hours. In
2002, Bharath published his results concerning the effect of R-lipoic acid on
GSH levels in PC12 cells. Under two different sets of conditions, lipoic acid
was able to upregulate cellular glutathione. When cells were treated with the
compound alone, an almost 1.6 fold increase was observed but, at the same
time, no increase in yGCL (y-glutamyl-cysteine ligase) activity was recorded.
They explained this behaviour based on the antioxidant activity of lipoic acid
18
Page 33
that can spare the glutathione. When the cells were first treated with BSO
(buthionine sulfoximine), an irreversible inhibitor of yGCL, to lower the
intracellular GSH content and then subjected to the lipoic acid, the
upregulation of glutathione and an increase in yGCL activity was observed.
This confirms the results of Han (1997) that showed an increase in the de
novo synthesis of GSH by treatment with lipoic acid. A very comprehensive
study on the glutathione up-regulation effect of various phenolic compounds
was done in 1996 by Han. Catechol and hydroquinone were both able to
elevate cellular GSH content; up to almost twice the amount in the control
cells. On the other hand, resorcinol did not have any effect. Both dopamine
and L-DOPA markedly increased glutathione levels in mesencephalic
cultures. By comparing the structure of the different tested compounds, the
authors reached the conclusion that the ability to elevate intracellular GSH
content is correlated to their capacity to autooxidize. The fact that, as a result
of oxidation of catechols and other diols, free radicals (semiquinones,
superoxide anion, etc) and stable oxidants (quinones, hydrogen peroxide) are
produced supports the idea that the up-regulation of glutathione is initiated by
an oxidative process.
1.10. Menadione
Menadione (2-methyl-1,4-naphthoquinone), also known as Vitamin K3,
is one of the simplest biologically relevant quinones and, by far, the most
studied one. The intensive studies were in part connected to its therapeutic
applications. Menadione has multiple uses: in multivitamin supplements,
hypothrombinemia therapeutic agents, anti-inflammatory and anticancer drugs
19
Page 34
(Chung, 1997 and Lee, 2001). At the same time, these studies have shown
that menadione is a cytotoxic agent in different cell and tissue types. Its
harmful effects are the result of both redox cycling and alkylation of cellular
components via Michael addition reactions. (Lee, 2001). During redox cycling,
menadione permeates easily through the cell membrane and, under the
action of cytochrome P450 or ubiquinone-oxidoreductase, undergoes a one-
electron reduction to the semiquinone radical. The semiquinone then begins
to redox cycle (Bergmann, 1992).
Many studies have shown in most of the cases that treatments with
menadione cause a decrease in the intracellular GSH levels. This effect was
attributed to the conjugation of menadione with glutathione. The arylation
mechanism of toxicity for menadione is not limited to GSH. Menadione can
also attach to proteins, thus altering their enzymatic activities (McAmis, 2003).
May (2003) found that menadione induced a two-fold increase in oxidative
stress in endothelial cells compared to the control cells, as measured by the
intracellular oxidation of 2',7'-dichlorodihydrofluorescein. The oxidative stress
was accompanied by a significant decrease in the cellular GSH content. Thor
(1982) reported a similar effect in hepatocytes. At concentrations greater than
35|aM, menadione induced a rapid decrease in glutathione levels in rat
hepatocytes. At lower concentrations, the cells were quite resistant to
menadione while at 40 JIM and above, the intracellular GSH content reached
close to zero values. When incubated with menadione, endothelial cells
suffered a huge decrease in the cellular GSH levels. Ten to fifteen uM
menadione reduced the glutathione by 90% with respect to the untreated
cells. Likewise, GSSG exhibited a similar decrease. These data support the
20
Page 35
idea that menadione's cytotoxicity is due mainly to the dramatic changes in
cellular GSH content and less to ROS generation by redox cycling (McAmis,
2003). To further investigate the connection between menadione and
glutathione, Chang (1992) studied the toxicity of menadione on endothelial
cells in both the absence and presence of extracellular GSH. As expected,
menadione caused a time-dependent depletion of glutathione, followed by a
dose and time-dependent loss of intracellular ATP. Since the formation of
GSH adducts with menadione seems to be omnipresent and an important
cause of toxicity, the authors measured the formation and elimination in the
medium of the conjugates that, once eliminated, did not diffuse back into the
cells. The increase in extracellular adducts was directly correlated to the
decrease in intracellular glutathione levels. Moreover, the authors were able
to observe a time and dose-dependent accumulation of hydrogen peroxide in
the culture media. The loss of intracellular GSH can be explained by the
formation of adducts with menadione and by the reaction with the hydrogen
peroxide produced as a result of redox cycling. Conjugation with glutathione
does not hinder menadione's ability to redox cycle but the rapid elimination of
the resulting adducts in the medium limits the relative importance of oxidation
on the whole mechanism of menadione cytotoxicity. The findings together with
the good correlation between GSH depletion and conjugates accumulation in
the extracellular space suggest that the latter process accounts for most of
the cellular glutathione loss.
Extracellular GSH can protect the cells from menadione by forming
adducts before entering the cells, thus limiting the exposure, or by helping
intracellular glutathione production. Chang, 1992, observed both the
21
Page 36
extracellular formation of GSH conjugates with menadione in the absence of
cells and maintenance of the cellular glutathione pool mediated by y-glutamyl
transpeptidase. The most important mechanism is proposed to be the
extracellular conjugation of menadione with GSH. Other studies (Gant, 1988;
Chung, 1997) support the general idea that the formation of Michael adducts
between glutathione and menadione plays a more important role than redox-
cycling-induced oxidative stress.
Only few studies were carried out on the antioxidant activity and
cytotoxicity of menadiol, menadione's parent hydroquinone. Tampo (1996)
has measured the antioxidant action of menadiol in a chemical system.
Menadiol proved to be more effective than oc-tocopherol in scavenging free
radicals generated by 1,1-diphenyl-2-picrylhydrazyl (DPPH). In a biochemical
system (liposomes) menadiol showed initially an antioxidant effect, followed
by a marked prooxidant effect. Addition of SOD (superoxide dismutase) was
able to counteract the prooxidant action, the antioxidant effect persisting for
longer time.
Watanabe (2003) studied the cytotoxicity of hydroquinones in general
using as models menadiol and menadione. To explain their results, they
proposed a mechanism by which the quinone (menadione) enters the cells
and under the effect of NQ01 (NADPH quinone oxidoreductase or DT-
diaphorase), it is reduced to the hydroquinone (menadiol). Menadiol diffuses
outside the cells and autooxidizes yielding hydrogen peroxide and
semiquinone radical that can reduce molecular oxygen to superoxide anion,
thus regenerating the quinone that can re-enter the cells and close the cycle.
Extracellular disproportionation between quinone and hydroquinone can
22
Page 37
generate semiquinone radical. The semiquinone can reduce O2 to O2",
inducing even more oxidative stress.
1.11. Hypothesis and aims
Initially the study started as part of a multidisciplinary and
multilaboratory collaboration aimed at developing new synthetic antioxidants.
Once several structures were proposed and synthetized, the question of their
biological effects was asked. Preliminary tests were encouraging, the tested
diols exhibiting antioxidant activity in vivo. The biological effects were not
limited to testing their antioxidant potency, but also their toxicity, comparing
natural and synthetic antioxidants currently on the market.
The present thesis initially tested the cytotoxicity of the de novo diols
and expanded to research their mechanisms of toxicity and how to improve
the design in order to reduce their negative biological impact. The goal of the
thesis was to try to pinpoint the primary, most important mechanism of toxicity
of the benzene diols and naphthalenediols tested. The thesis further proposes
structural motifs that would improve the cellular tolerance to future related
compounds.
By designing new diols in which the possible sites for adduct formation
are blocked, their ability to take part in Michael addition- type reactions was
eliminated, thus allowing us to hypothesize that formation of ROS would be
the major cause of cytotoxicity of synthetic diols and naphthalenediols. It was
also hypothesized that hydrogen peroxide was the major ROS involved and
that added catalase will dramatically reduce the observed cellular toxicity.
23
Page 38
The main hypothesis of the thesis is, therefore, that unblocked
diols generate ROS (primarily hydrogen peroxide) and that this is the
primary source of cellular toxicity. It was proposed that quenching of
ROS generated by diols will ameliorate cell death upon diol treatment.
The early observation that there is a structural hinderence in the
formation of the quinone product, and thus ROS, of the 2,3-naphthalenediol
derivative suggested that new compounds with reduced overall detrimental
effects to the cells (i.e. lower toxicity and reduced hydrogen peroxide levels)
can be designed.
24
Page 39
Chapter 2
MATERIALS AND METHODS
Page 40
2.1. Chemicals
Phosphate buffered saline (PBS), trypan blue, dimethyl sulfoxide
(DMSO), catalase, 3-(4,5-dimethylthiazol-2-yl)-2,5-diphenyltetrazolium
bromide (MTT), Hank's Balanced Salt Solution (HBSS), xylenol orange,
sorbitol, ferrous sulfate, 5,5'-dithiobis(2-nitrobenzoic acid) (DTNB),
sulfosalicylic acid, gluthathione, nicotinamide adenine dinucleotide phosphate
(reduced form; NAPDH), sodium phosphate and menadione were all
purchased from Sigma (St. Louis, MO). All cell culture media components
were purchased from Invitrogen (Carlsbad, CA)
2.2. Cell culture
An adherent line of rat adrenal pheochromocytoma cells (PC12-AC)
was a kind gift from Dr. Steffany Bennett (Department of Biochemistry,
Microbiology and Immunology, University of Ottawa). Cells were cultivated on
150cm2 tissue culture flasks (VWR) in RPMI 1640 medium supplemented with
10% heat-inactivated horse serum, 5% newborn calf serum and 3% antibiotics
(100U/mL penicillin G sodium salt, 100|j,g/mL streptomycin sulfate and
0.025mg/ml_ Amphotericin B). Cells were grown in a 37°C incubator at in a
humidified atmosphere of 5% C02 in air, being passed twice a week at a
density of 5x10⁵ cells/mL. Cells between approximately 4 and 18 passages
were used in experiments with a doubling time being approximately 24 hours.
2.3. Tested compounds
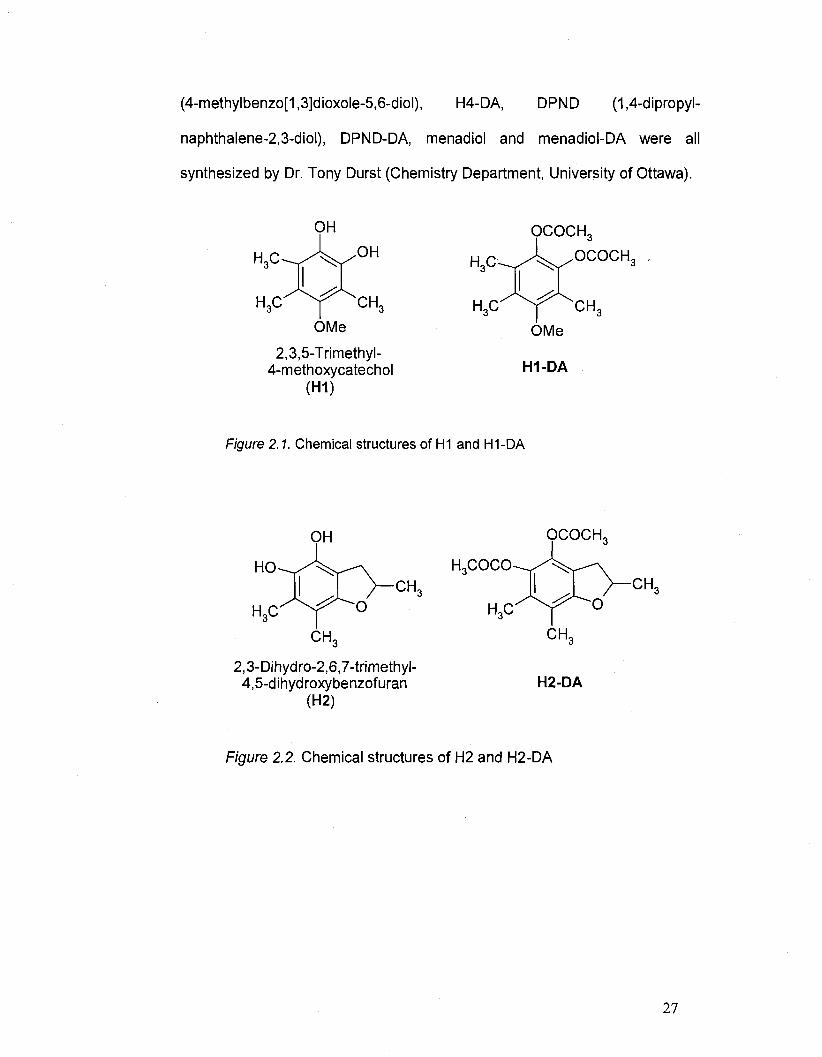
H1 (4-methoxy-3,5,6-trimethylbenzene-1,2-diol), H1-DA (DA =
diacetate), H2 (2,6,7-trimethyl-2,3-dihydroxybenzofuran-4,5-diol), H2-DA, H4
26
Page 41
(4-methylbenzo[1,3]dioxole-5,6-diol), H4-DA, DPND (1,4-dipropyl-
naphthalene-2,3-diol), DPND-DA, menadiol and menadiol-DA were all
synthesized by Dr. Tony Durst (Chemistry Department, University of Ottawa).
OMe
2,3,5-Trimethyl-4-methoxycatechol
(H1)
OCOCH,
OCOCH,
OMe
H1-DA
Figure 2.1. Chemical structures of H1 and H1-DA
OCOCH,
2,3-Dihydro-2,6,7-trimethyl-4,5-dihydroxybenzofuran
(H2)
H3COCO
H2-DA
Figure 2.2. Chemical structures of H2 and H2-DA
27
Page 42
OCOChL
OCOChL
4-Methyl-benzo [1,3]dioxole-5,6-diol
(H4) H4-DA
Figure 2.3. Chemical structures of H4 and H4-DA.
OCOChL
OCOCHU
1,4-Dipropyl-naphthalene-2,3-diol (DPND)
DPND-DA
Figure 2.4. Chemical structures of DPND and DPND-DA
OCOChL
OCOChL
Menadiol-DA 2-Methyl-naphthalene-1,4-diol
Menadiol 2-Methyl-[1,4]naphthoquinone
Menadione
Figure 2.5. Chemical structures of Menadiol, Menadiol-DA and Menadione
28
Page 43
2.4. Test for toxicity
Cell viability (MTT reduction) - PC12-AC cells at 80-100% confluency
were first washed with 10ml_ sterile PBS and then trypsinized for 3 min with 1
ml_ 1 X trypsin 0.5% EDTA (Invitrogen, Carlsbad, CA) at 37°C. The enzymatic
reaction was then stopped with 4mL medium with serum and, in order to
break up the clusters, the mixture was pipetted vigorously in a 1ml_ pipette.
One hundred fxL of cell suspension was added to 250yL (0.4%) trypan blue
and 150|xL PBS and counted on a haemocytometer. Following dilution with
medium to a final concentration of 200,000 cells/mL, 100jaL of cells were
plated on sterile 96-well tissue culture microplates. After allowing the cells to
adhere for 24 hours, the supernatant was removed and replaced with 100|aL
of fresh medium containing the test compounds. One hundred-fold
concentrated stock solutions of test compounds were prepared in 100 %
DMSO and diluted in PBS prior to adding to cells to give the final
concentration used in each experiment. The final concentration of DMSO was
less then 0.8%. Stock solutions of catalase were prepared in PBS and added
to cells to a final concentration of 1000U/ml_. After another 24 hours of
incubation, the medium was removed, the cells washed with 100fil_ of PBS
and 100|J- of fresh medium was added. Ten \xL of MTT (stock concentration =
5mg/mL in PBS) was added and the incubation continued for 2 more hours.
Metabolically active cells (with active mitochondrial dehydrogenases) convert
the yellow MTT to a blue formazan precipitate with a strong absorbance at
570nm. After incubation, the supernatant is removed and the cells are lysed
with 50|a,L DMSO, which solubilizes the formazan precipitate. After 15 min, the
absorbance is recorded at 570nm and corrected by subtracting the
29
Page 44
background absorption at 630nm. Absorbances were read using a
SpectroMAX 340pc microplate reader (Molecular Devices Co., Sunnyvale,
CA). The values are normalized to untreated cells which were considered
100% viable. Data are represented as the mean ± SEM of three individual
experiments, each experiment consisting of 6 subreplicates.
2.5. Hydrogen peroxide (FOX- ferric oxidase) assay
Cells were trypsinized, counted and seeded on microplates at a final
concentration of 400,000 cells/mL. After 24 hours of incubation, the medium
was removed and 100|aL of HBSS containing 100|_iM of the test compounds in
their diacetylated form were added. Stock solutions of the compounds (25mM)
were made in DMSO and diluted one hundred-fold with HBSS to treat cells.
Fourty jaL of this solution was mixed with 60|iL of HBSS and added to the
cells. At different time intervals, 10|uL of supernatant was removed and used
in the FOX assay. The FOX reagent was prepared 30 min prior to running the
assay by mixing 100 parts of color reagent with one part ferrous sulfate
reagent. Color reagent was prepared fresh by dissolving xylenol orange in
100mM sorbitol in double distilled water to a final reagent concentration of
125|^M xylenol orange. The ferrous sulfate reagent consisted of a solution of
25mM FeS04 in 2.5M H2S04 (Anachernia Canada Inc., Lachine, Quebec). To
run the assay, 10^iL of the supernatant was mixed with 100|aL of the FOX
reagent in a separate microplate, incubated for 30 min at room temperature
and then the absorbance at 560nm was read using the microplate reader. The
absorbance was converted into concentration of H202 by means of a
calibration curve of 0 to 80p.M H202 (Caledon Laboratories, Georgetown, ON)
30
Page 45
instead of the supernatant. The concentration of the stock solution of
hydrogen peroxide was determined using its extinction coefficient at 240nm of
0.0394mM_1 (Kulys, 2006)
For autoxidation studies, stock solutions of the compounds (25mM) in
their catecholic (deacetylated) form were prepared in DMSO, followed by a
100-fold dilution HBSS to the working concentrations. A microplate was
prepared with each well containing 100|aM of the test catechols. At different
time intervals, 10|J_ of the solution were removed and used to run the FOX
assay as described above.
2.6. Extracellular quinone assay
Two hundred and fifty \xM deacetylated compound was tested by
diluting the 25mM stock in DMSO by 100-fold with HBSS. After complete
overnight air oxidation and observation of change in colour, full visible spectra
(220 to 800nm) were obtained and the optimum wavelength for each test
compound was as follows: 460nm for H1 (192M"1cm"1), 520nm for H2 (232M"
1cm"1) and 350nm for H4 (500M"1cm"1). Tests were done on microplates using
100|JL samples. Standard curves of compounds were constructed using 0 to
100|nM of the compounds. PC12-AC cells undergoing exponential growth
were washed, trypsinized, counted and seeded on microplates to a final
concentration of 400,000 cells/mL. After 24 hours of incubation at 37°C in 5%
C02 humidified air, the medium was replaced with 100p.L of a 100fxM solution
of diacetylated compound in HBSS. Time course experiments were performed
by removing 100% of the supernatant and by reading the absorbance at the
corresponding wavelength for the studied catechol. Using the calibration
31
Page 46
curves, the extracellular quinone concentrations were determined and plotted
against time.
2.7. Glutathione assay
The assay for reduced glutathione (GSH) is based on the rate of
reaction between GSH and DTNB (Tietze, 1969). PC12-AC cells
(approximately 80-100% confluent on 150cm2 Falcon flasks) were washed
with 10ml_ PBS, trypsinized for 3-5 minutes with 1ml_ of 1 X trypsin-EDTA,
pipetted vigorously with a 1ml_ pipette to break up cell clusters, counted and
diluted to a final concentration of 400,000 cells/mL Eight ml_ of this stock
solution was placed on 10 cm untreated dishes and incubated for 4 hours to
allow cell adherence. After removal of the supernatant, new medium
containing the test compounds (0 to 150^M) was added. As previously
mentioned, the compounds in their DA form were first dissolved in DMSO to
make 25mM stock solutions and further diluted 100-fold with PBS to prepare
working solutions of 250|aM. Cells were incubated for 3 or 24 hours in control
conditions at 37°C and 5% CO2 humidified air. Cells were then washed once
with 5ml_ of PBS, harvested with a cell scraper and collected with 1ml_ PBS in
15ml_ centrifuge tubes. After centrifugation for 5 min at 1,000rpm in a IEC
Multi RF Multipurpose Benchtop Centrifuge (Thermo IEC, Needham Heights,
MA), the supernatant was discarded and cell pellets were quickly lysed in
50nL of 5% iced-cold sulfosalicylic acid, previously bubbled with N2 gas for 15
min. Cell lysates were then transferred to an Eppendorf tube (VWR, West
Chester, PA, USA, bubbled with N2 for 10 sec and centrifuged for 1 minute at
13,000g on a microcentrifuge (Baxter CanlabA/WR, Deerfield IL, USA).
32
Page 47
Supernatants were quickly transferred to new tubes containing 450>L of 0.5M
potassium phosphate (KPi) (pH 6.0). Twenty | L of the neutralized
supernatants were then used in the GSH assay. Cell pellets obtained after
high-speed centrifugation were frozen in liquid nitrogen and stored for protein
determination. For the GSH assay, two microplates were used, one containing
the GSH standard stocks, samples and the glutathione reductase was kept on
ice at all times; another was kept at room temperature on the bench and was
used to assemble the assay to be read on the microplate reader. Five mM
GSH stocks were prepared in 0.5M KPi and then diluted with KPj to 50|nM
working solutions. Other solutions required for the assay included 0.3mM
NADPH prepared fresh in stock buffer containing 125mM NaH2P04'H20, pH
7.5, and 6.3mM sodium EDTA, and 6mM DTNB prepared in stock buffer and
a 50U/mL glutathione reductase (GR) in stock buffer. In separate wells of the
microplate, each assay contained 70|j,L of the NADPH solution, 10>L of the
DTNB solution, a very quick addition of 10(iL of the GR solution and finally
20JIL of either sample (neutralized supernatants) or standard GSH. Samples
were read on the microplate reader using kinetics at 412nm. A standard curve
was composed of the initial rates (slopes) of the standards plotted against
GSH content (0-300pmoles). Standard curves were then used to determine
the amount of GSH present in samples. For comparison purposes, the GSH
content was normalized to the amount of protein measured in the cell pellets.
2.8. Protein determination
Soluble protein in cell pellets was measured by the Coomassie blue
dye-binding method (Bradford, 1976) using the Bio-Rad Protein Assay (Bio-
33
Page 48
Rad, Hercules, CA). Bovine serum albumin was used as a standard (0-30jxg).
Cell pellets were thaw and vortexed with 200(iL of KPi buffer. After
centrifugation at 13,000g for 1 min, the supernatants were transferred to
Eppendorf tubes and used for protein determination. Bio-Rad reagent was
diluted 5-fold with distilled water. Twenty (aL of protein was added to 150|aL of
the protein dye reagent. The absorbance at 595nm was recorded after 10
minutes incubation at room temperature on a microplate reader. The amount
of protein in each sample was determined from the standard curve.
2.9. Statistics
Data are represented as mean ± SEM values. Statistical significance
was determined by performing a one-way ANOVA test. The level of
significance was chosen to be at p < 0.05.
34
Page 49
Chapter 3
RESULTS
Page 50
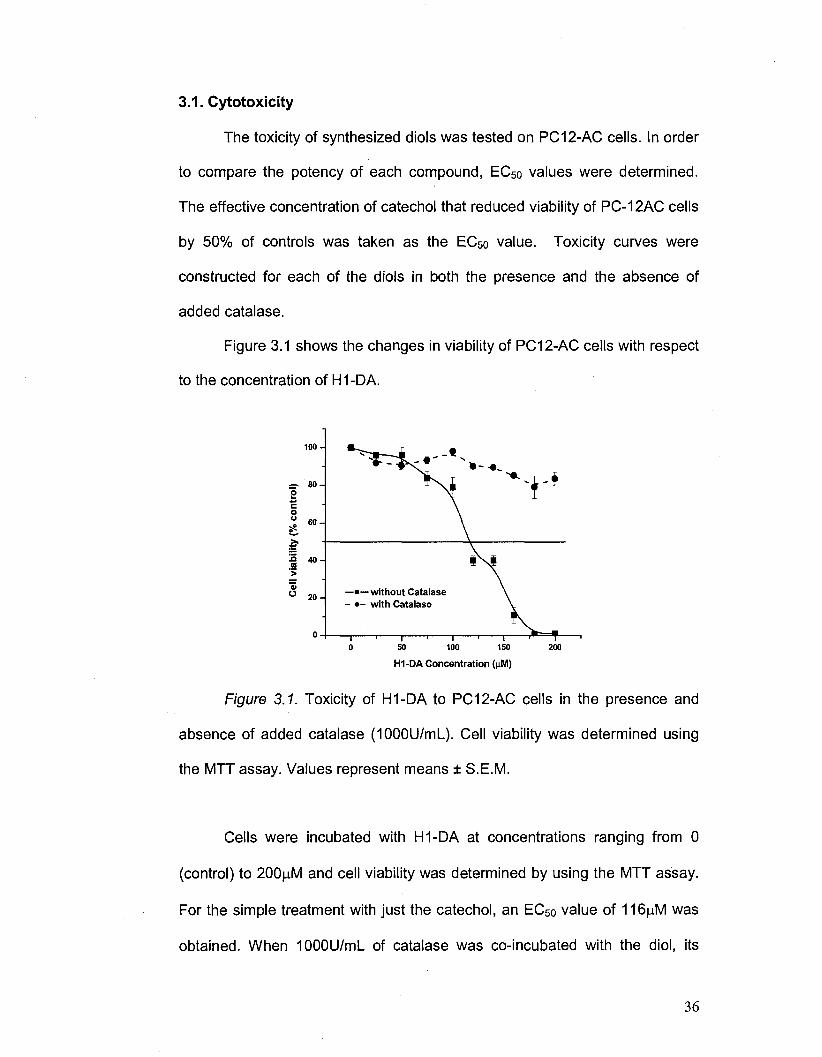
3.1. Cytotoxicity
The toxicity of synthesized diols was tested on PC12-AC cells. In order
to compare the potency of each compound, EC5o values were determined.
The effective concentration of catechol that reduced viability of PC-12AC cells
by 50% of controls was taken as the EC50 value. Toxicity curves were
constructed for each of the diols in both the presence and the absence of
added catalase.
Figure 3.1 shows the changes in viability of PC12-AC cells with respect
to the concentration of H1 -DA.
H1-DA Concentration (jiM)
Figure 3.1. Toxicity of H1-DA to PC12-AC cells in the presence and
absence of added catalase (1000U/mL). Cell viability was determined using
the MTT assay. Values represent means ± S.E.M.
Cells were incubated with H1-DA at concentrations ranging from 0
(control) to 200|Jv1 and cell viability was determined by using the MTT assay.
For the simple treatment with just the catechol, an EC50 value of 116(o.M was
obtained. When 1000U/ml_ of catalase was co-incubated with the diol, its
36
Page 51
toxicity decreased so that the EC50 was not reached; even when up to 200|j,M
concentrations were used.
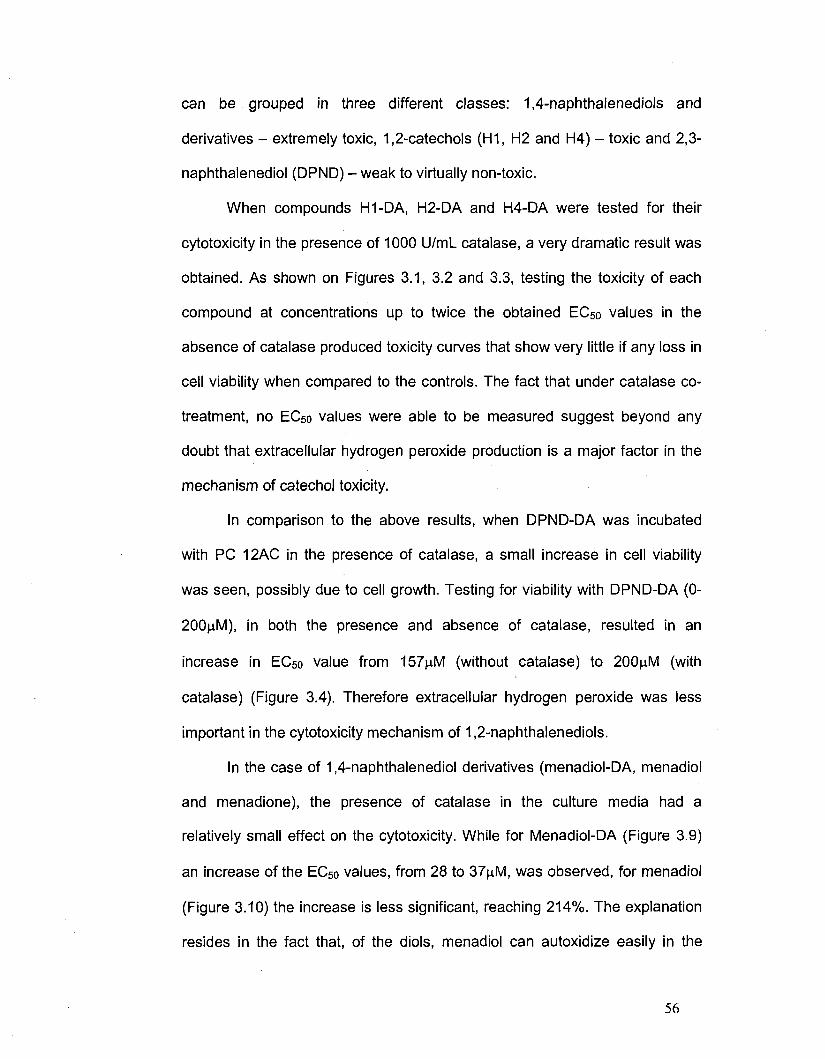
With H2-DA, the concentrations used to test its toxicity ranged from 0
to 60|aM, with the EC5o being determined to be 53(iM, as shown in Figure
3.2.AswithH1-DA.
I f
0 20 40 60
H2-DA Concentration (nM)
Figure 3.2. Toxicity of H2-DA to PC12-AC cells in the presence and
absence of catalase. Cell viability was determined using MTT assay. Values
represent means ± S.E.M.
A significant reduction in toxicity was observed with H2-DA when
treated in presence of 1000U/mL catalase.
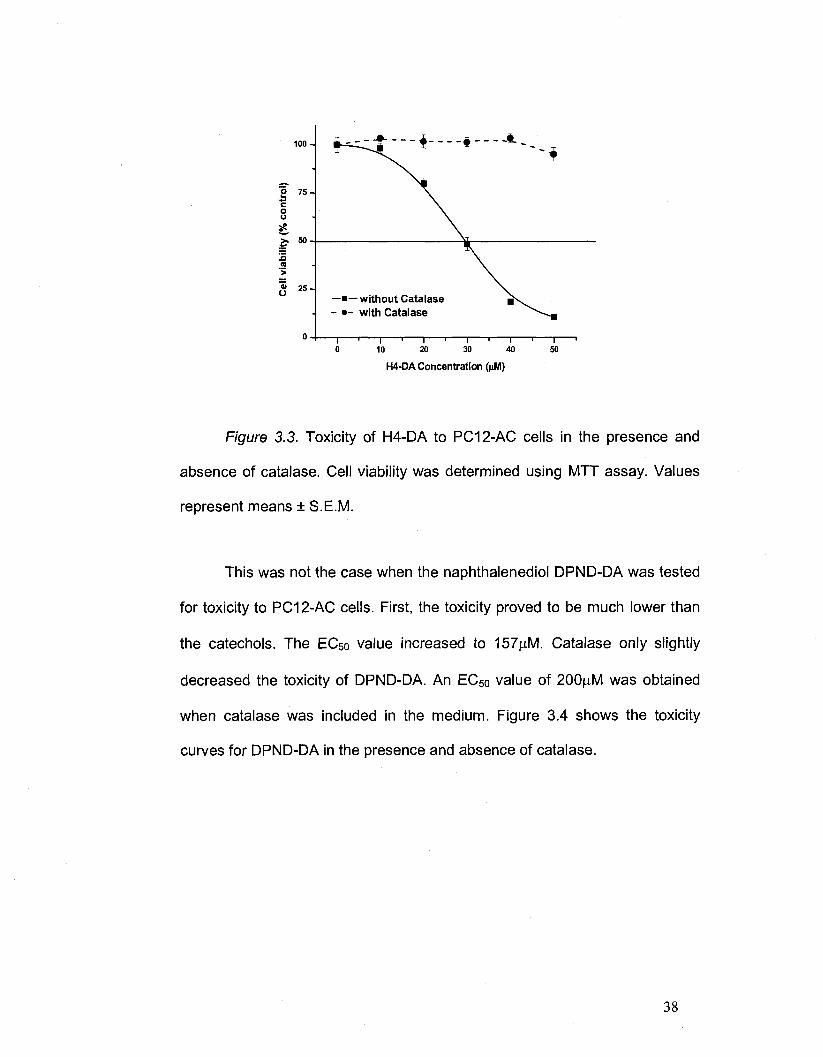
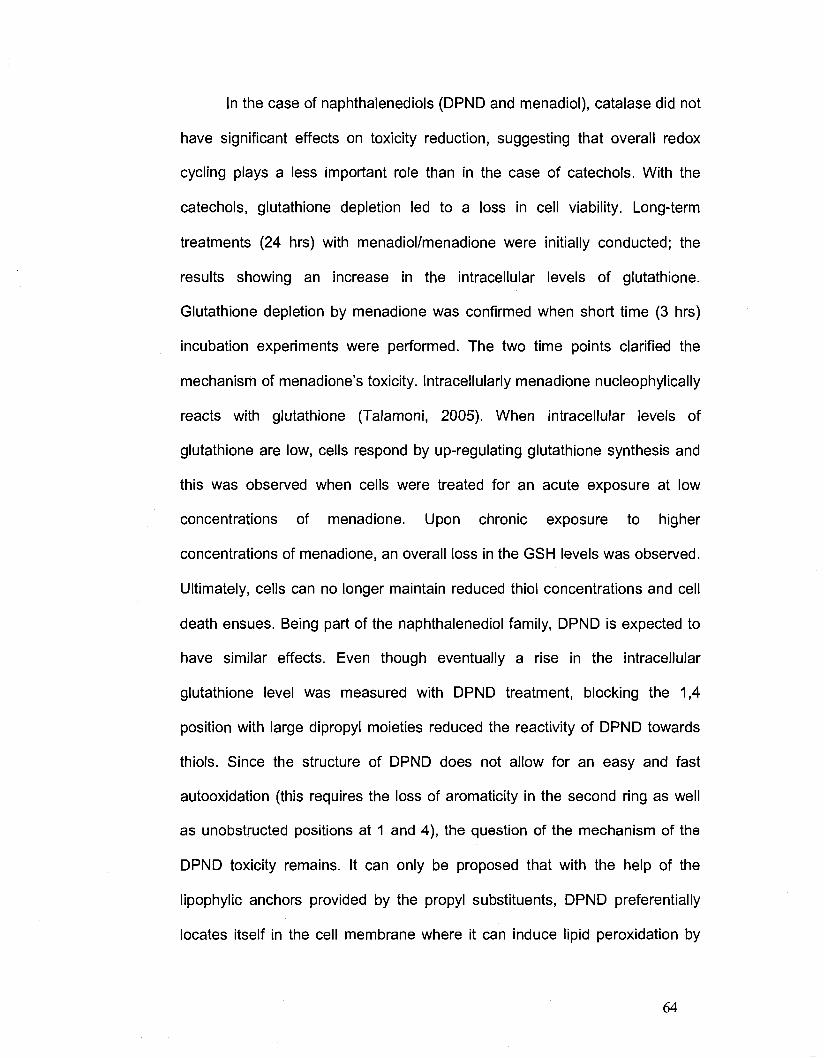
Similarly, the toxicity of H4-DA to PC12-AC was tested both in the
presence and the absence of catalase. The testing was done on a narrower
range; from 0 to 60(aM. As shown in Figure 3.3, the EC50 value was 30p.M in
the absence of catalase and was not reached when it was present. Catalase
was clearly efficient at reducing the cytotoxicity of all catechols tested.
37
—•—without Catalase - • - with Catalase
Page 52
ioo- £-=-^f" ~"""" $ # - - * - .
g 75- \ c \ 0 \
- \ £ 50 - ^ 2 \ « . \ '> \ 1 25- \
—•—without Catalase H"N. - • - with Catalase ^ - ^ B
o - l 1 , 1 , 1 , 1 , 1 1 1 1 0 10 20 30 40 50
H4-DA Concentration (|iM)
Figure 3.3. Toxicity of H4-DA to PC12-AC cells in the presence and
absence of catalase. Cell viability was determined using MTT assay. Values
represent means ± S.E.M.
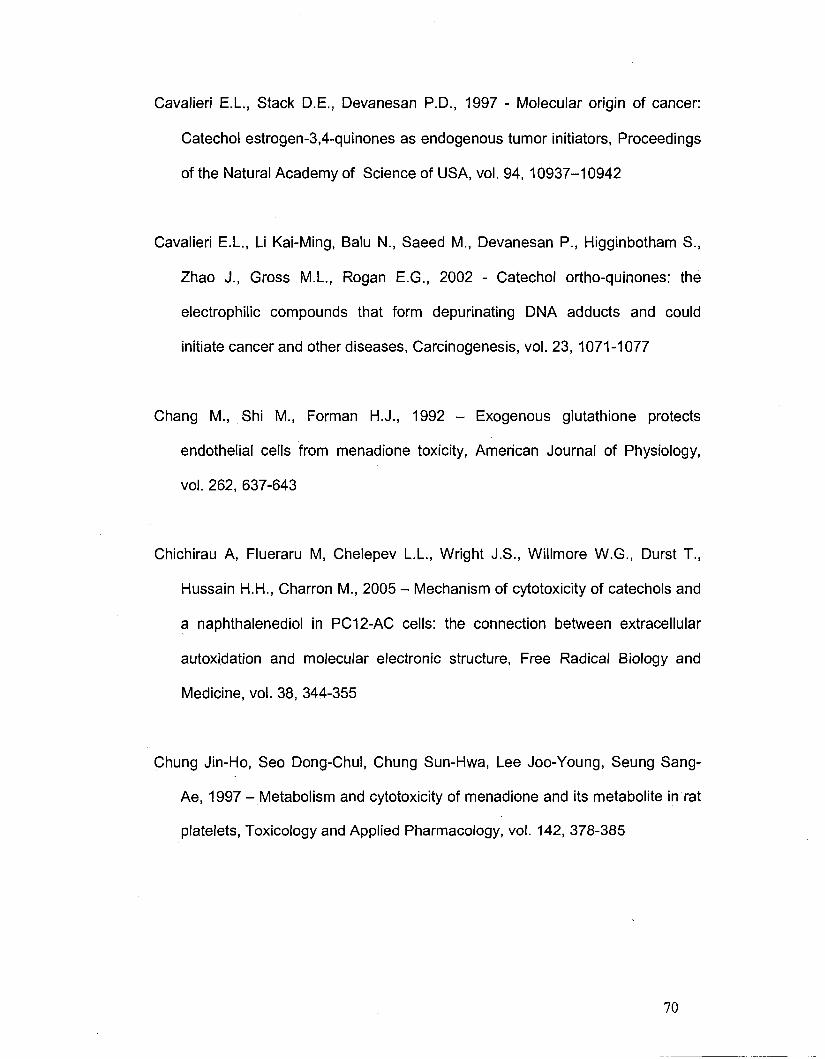
This was not the case when the naphthalenediol DPND-DA was tested
for toxicity to PC12-AC cells. First, the toxicity proved to be much lower than
the catechols. The EC50 value increased to 157|aM. Catalase only slightly
decreased the toxicity of DPND-DA. An EC50 value of 200|aM was obtained
when catalase was included in the medium. Figure 3.4 shows the toxicity
curves for DPND-DA in the presence and absence of catalase.
38
Page 53
—•—without Catalase - • - with Catalase
50 100 150 200
DPND-DA Concentration (nM)
Figure 3.4. Toxicity of DPND-DA to PC12-AC cells in the presence and
absence of catalase. Cell viability was determined using MTT assay. Values
represent means ± S.E.M.
3.2. Hydrogen peroxide production
Since one of the most common mechanisms of catechol/quinone
toxicity is redox cycling, it was imperative to try to quantify its overall
importance in toxicity to cells. Since hydrogen peroxide is the end product of
the redox cycling, its production was measured in the presence of PC12-AC
cells when incubated with synthetic diols. For the ease of experimental
procedure and of comparison between the four test compounds, only one
concentration (100fj.M) of the test compounds was used. The time course for
the production of hydrogen peroxide in the extracellular medium for all four
diols is shown in Figure 3.5.
39
Page 54
—•—H1-DA -A—H4-DA 40 -| —•— H2-DA - T — DPND-DA
Figure 3.5. Extracellular hydrogen peroxide in the medium when PC12-
AC cells were incubated with 100|uM of each of the test compounds.
There was a definitive difference in hydrogen peroxide production
between the catechols and the naphthalenediol. There was a rise in the
amount of extracellular hydrogen peroxide produced over time for all
catechols used while there was a marked decrease in the extracellular
hydrogen peroxide produced when using the naphthalenediol.
H1-DA showed a steady, slow increase of hydrogen peroxide over
time, reaching a maximum of lO^iM H2O2 accumulated in the three hours of
testing. The initial rate (first 20 minutes) of hydrogen peroxide produced when
PC12-AC cells were treated with IOO41M H2-DA was very fast. Hydrogen
peroxide production continued at a steady rate until it reached a maximum of
30>M H2O2 produced in the three hours of testing. H4-DA produced hydrogen
40
Page 55
peroxide at the fastest rate, resulting in 35|aM of hydrogen peroxide being
produced within the first sixty minutes of assaying. It was the only catechol
that showed a drop in extracellular hydrogen peroxide concentration after one
hundred minutes. The drop resulted in only 15jo,M of hydrogen peroxide being
produced at the end of three hours of testing.
Many studies have demonstrated that the autoxidation of catechols, in
the absence of cells, is responsible for a large portion of their toxicity. In order
to take this into consideration, the formation of hydrogen peroxide as a result
of autoxidation in HBSS (the medium used in cellular tests) in a cell-free
system and the FOX assay was run using 100|Jv1 of each of the compounds
in their deacetylated form (so that their free OH groups can take part in the
autooxidation process without being blocked by the acetyl moieties).
U - | , | 1 1 , 1 , 1 1 1 1 , , 1 , 1
0 25 50 75 100 125 150 175 200
Time (min)
Figure 3.6. Hydrogen peroxide time course for the autoxidation of
100(iM of each of the tested compounds in HBSS
41
Page 56
The differences in behaviour observed between the catechols and the
naphthalenediol held true in all experimental results. H1 started with a fast
autoxidation rate, reaching a maximum of 60nM H2O2 produced after only 25
minutes of incubation. Following this increase, a sharp decrease in the
amount of hydrogen peroxide produced was observed, such that after 3
hours, only half of the original levels of hydrogen peroxide were present in the
medium.
Based on the results, it can be concluded that H2 is a very reactive
compound. It is completely oxidized within the first 5 minutes of addition to
HBSS, as indicated by the peak of hydrogen peroxide of approximately 55|iM.
For the next 3 hours a continuous and rapid disappearance of the H2O2 was
observed, with only 20|aM remaining after 3 hours.
The autoxidation of H4 was similar to that of H2. A peak of
approximately 60|iM hydrogen peroxide was observed in the first 5 min of
incubation, indicating a similar rapid rate of autoxidation as H1. The
subsequent depletion in H202 was steady but not as rapid as that of H1. Thirty
|Jvl of H202 remained after 3 hours of incubation and this may have
decreased further if longer incubation times were performed.
As mentioned above, DPND showed a completely different behaviour
compared to the catechols. The first and most striking difference consisted of
the maximum level of hydrogen peroxide reached in the system; which was
only half of the amount produced by the catechols. The maximal amount of
hydrogen peroxide produced by DPND occurred at 5 minutes of incubation
but the overall H2O2 levels were less pronounced than those of the catechols.
42
Page 57
Hydrogen peroxide produced by DPND decreased to 15|iM at the end of 3
hours.
3.3. Quinone quantification
Since the toxicity of catechols is linked to quinone formation, (as
oxidation products), the amount of quinones produced by the cells was
quantified. Cells were incubated with 100>M of each of the catechols in their
acetylated form and the extracellular concentrations of corresponding
quinones were measured using a spectrophotometer. The results are
presented in Figure 3.7.
i — • — i — • — i — • — i — • — i — • — i — • — i — ' — i — ' — i 0 25 SO 75 100 125 150 175 200
Time (min)
Figure 3.7. Time course for the extracellular levels of quinones
measured after incubating lOOpM of each of the catechols with 200,000
cells/ml of PC12-AC in HBSS.
Despite similarities in both the structures and the autoxidation rates,
very significant differences in the efflux of their corresponding quinones were
43
Page 58
observed. In order to measure the quinone, the compounds have to diffuse
into the cell, become hydrolyzed and oxidize either inside or outside of the cell
to form the quinone that is measured. As shown in Figure 3.7, H1-DA is the
slowest to go through the cell. After 3 hours of incubation, only 10% of the
added catechol was measured to be outside the cell in the form of its quinone
product. The results indicated the presence of extracellular quinone after 60
minutes of incubation. For the last 2 hours a steady and slow increase of
quinone production was observed.
In contrast to the first compound, H2-DA was more rapidly oxidized to
its quinone product. Measurable amounts of quinone were detected from the
very first minutes of the experiment. At 5 minutes of incubation, 10p,M quinone
was already present in the system. Following a rapid and continuous increase
in the quinone efflux, a steady level of 60nM is reached after 3 hours of
incubation. Taking into account that the cells were incubated with 100|Jvl
catechol, the results indicated that more than 50% of the compound was
taken up by cells and oxidized to their quinone products.H4-DA had opposite
effects compared to H1-DA. Of all the compounds tested, H4-DA had the
fastest kinetics. After 120 minutes of incubation, all 100|uM of the catechol that
was initially added to the system was oxidized to quinone.
3.4. GSH cellular content
Glutathione, both reduced (GSH) and oxidized (GSSG), is an exact
and sensitive indicator of the redox status of the cells. Since its intracellular
concentration reaches as high as 10mM, glutathione acts as the main redox
buffer of the cells. As one of the first line of defense against oxidative stress,
44
Page 59
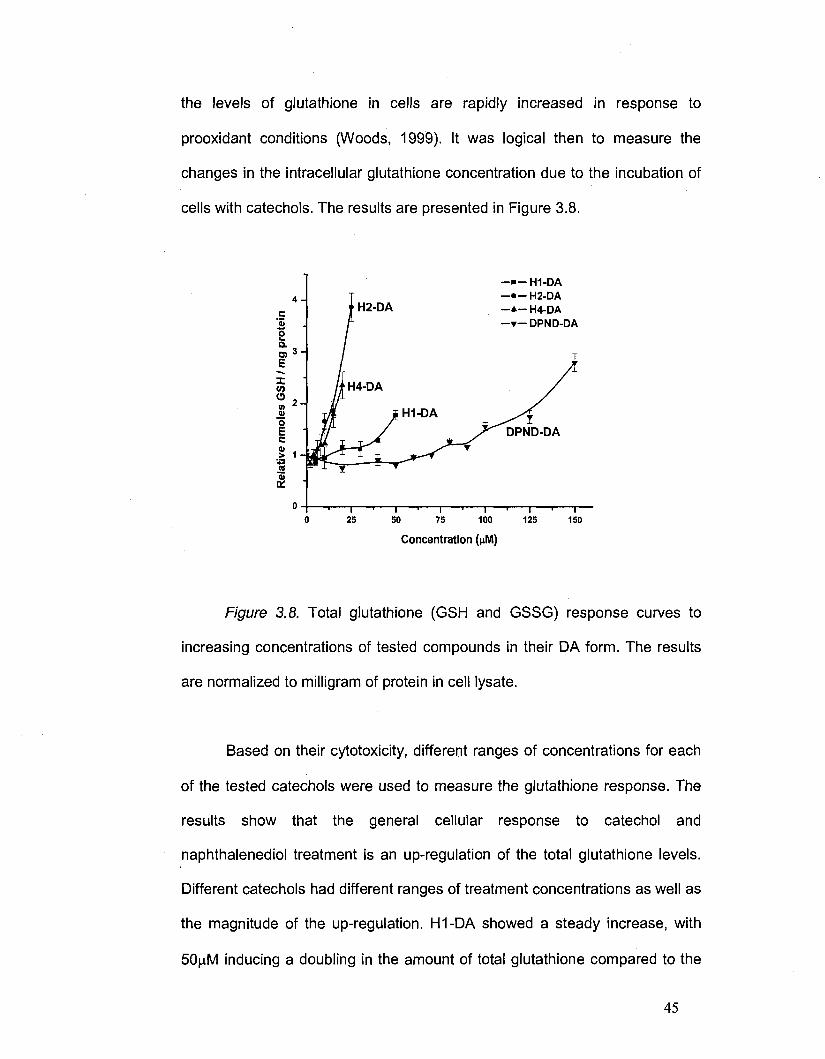
the levels of glutathione in cells are rapidly increased in response to
prooxidant conditions (Woods, 1999). It was logical then to measure the
changes in the intracellular glutathione concentration due to the incubation of
cells with catechols. The results are presented in Figure 3.8.
25 50 75 100 125
Concentration (nM)
Figure 3.8. Total glutathione (GSH and GSSG) response curves to
increasing concentrations of tested compounds in their DA form. The results
are normalized to milligram of protein in cell lysate.
Based on their cytotoxicity, different ranges of concentrations for each
of the tested catechols were used to measure the glutathione response. The
results show that the general cellular response to catechol and
naphthalenediol treatment is an up-regulation of the total glutathione levels.
Different catechols had different ranges of treatment concentrations as well as
the magnitude of the up-regulation. H1-DA showed a steady increase, with
50(iM inducing a doubling in the amount of total glutathione compared to the
45
Page 60
untreated cells. H2-DA and H4-DA were similar in their glutathione induction.
For both catechols, a dramatic rise in total glutathione is observed over time.
After 24 hours of incubation, H2-DA (25 |aM) induced a four-fold increase in
the amount of glutathione produced by the cells, this being the maximum
response of all the tested compounds. For H4-DA, the up-regulation of
glutathione occurred as rapidly as that of H2-DA treatment, but because H4-
DA is more toxic (its EC50 is only 30jJv1 compared to 53(iM for H2-DA), a
much narrower range of concentrations was used. Nevertheless, a more than
two-fold increase in the glutathione level was observed when incubating the
cells with 20nM H4-DA.
DPND-DA was ineffective in up-regulating glutathione over a broad
range of concentrations. No increase in total glutathione was observed until
lOO^M DPND-DA was added to the cells. Concentrations above lOOj M
increased glutathione at a steady rate, showing a two-fold increase over
control (untreated) values at 150nM DPND-DA.
3.5. Menadiol and Menadione
Despite the fact that menadiol is widely used as an oxidative stresser in
cell culture, its mechanism of cytotoxicity is not well understood (De Loecker,
1993). Since our approach is to study the toxicity of catechols, we decided to
apply the same battery of tests to menadiol treatment. The toxicity of
acetylated and non-acetylated menadiol was tested in the presence and
absence of added catalase.
46
Page 61
120 -•
40 50
Menadiol-DA concentration(^M)
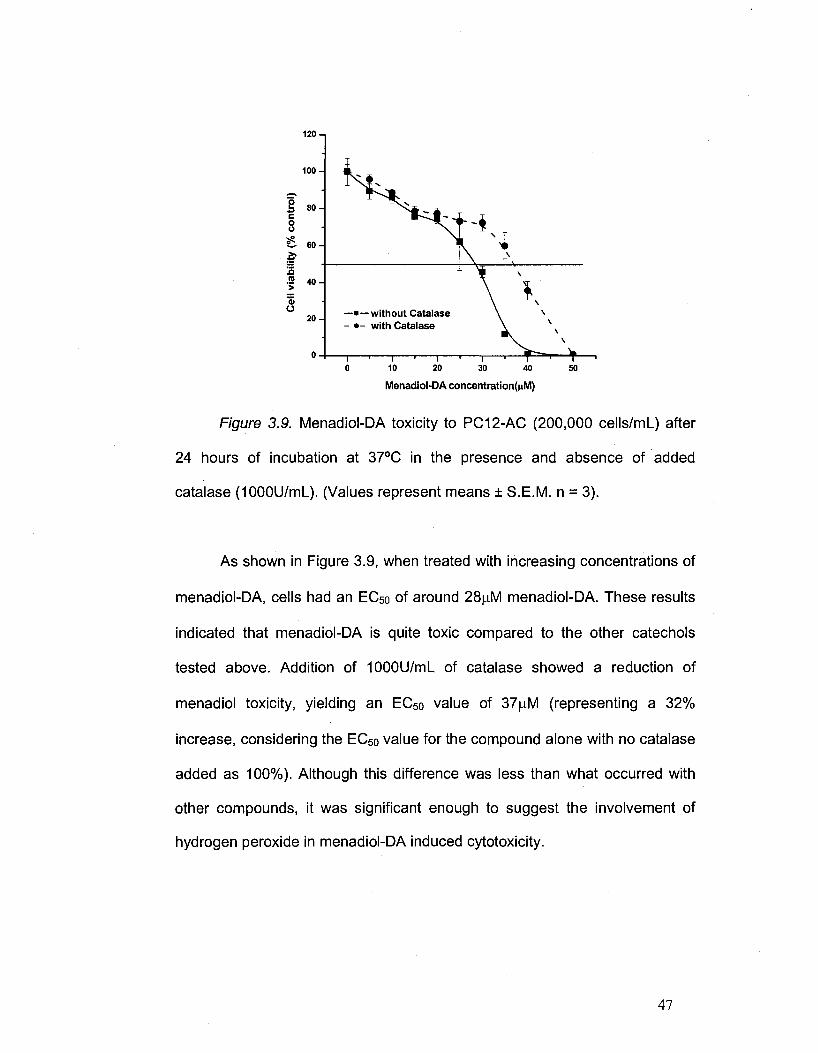
Figure 3.9. Menadiol-DA toxicity to PC12-AC (200,000 cells/mL) after
24 hours of incubation at 37°C in the presence and absence of added
catalase (1000U/ml_). (Values represent means ± S.E.M. n = 3).
As shown in Figure 3.9, when treated with increasing concentrations of
menadiol-DA, cells had an EC50 of around 28|nM menadiol-DA. These results
indicated that menadiol-DA is quite toxic compared to the other catechols
tested above. Addition of 1000U/mL of catalase showed a reduction of
menadiol toxicity, yielding an EC50 value of 37ja,M (representing a 32%
increase, considering the EC50 value for the compound alone with no catalase
added as 100%). Although this difference was less than what occurred with
other compounds, it was significant enough to suggest the involvement of
hydrogen peroxide in menadiol-DA induced cytotoxicity.
47
Page 62
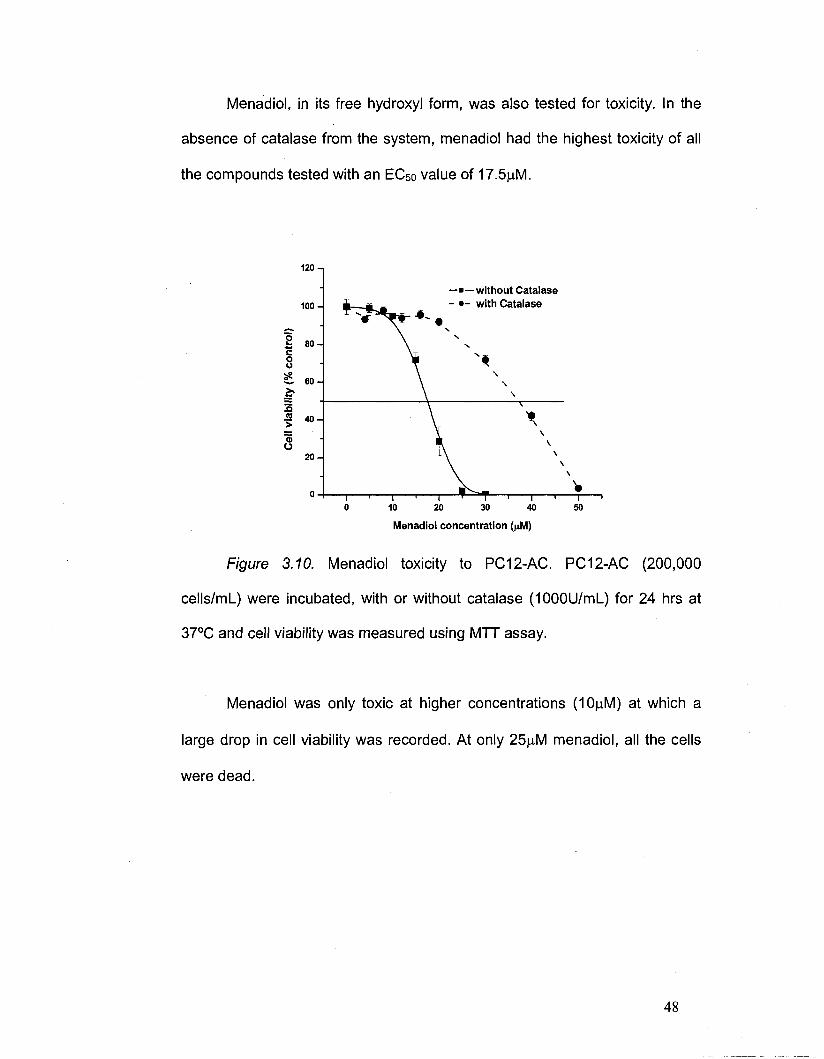
Menadiol, in its free hydroxyl form, was also tested for toxicity. In the
absence of catalase from the system, menadiol had the highest toxicity of all
the compounds tested with an EC50 value of 17.5jaM.
120- ,
—•—without Catalase - • - with Catalase
1 " 1 ' 40 50
Menadiol concentration (jiNI)
Figure 3.10. Menadiol toxicity to PC12-AC. PC12-AC (200,000
cells/mL) were incubated, with or without catalase (1000U/ml_) for 24 hrs at
37°C and cell viability was measured using MTT assay.
Menadiol was only toxic at higher concentrations (10|aM) at which a
large drop in cell viability was recorded. At only 25|Jvl menadiol, all the cells
were dead.
48
Page 63
Catalase has a more pronounced effect on menadiol's toxicity
compared to menadiol-DA. When co-treated with catalase, the EC50 of
menadiol was 37.5fiM, showing a reduction of 214% in cytotoxicity. The drop
in cell viability was less steep in the presence of catalase, occurring over a
wider range of concentrations (from 20 to 50|iM).
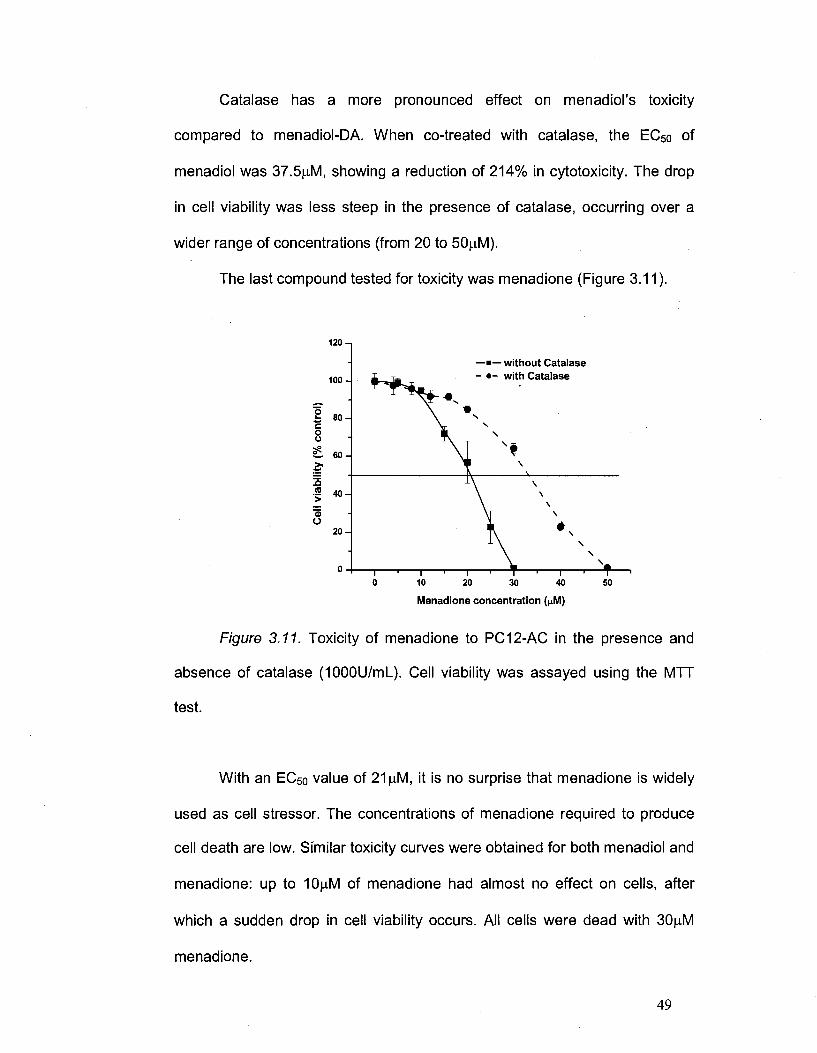
The last compound tested for toxicity was menadione (Figure 3.11).
120 - ,
—•—without Catalase - • - with Catalase
Menadione concentration (nM)
Figure 3.11. Toxicity of menadione to PC12-AC in the presence and
absence of catalase (1000U/ml_). Cell viability was assayed using the MTT
test.
With an EC50 value of 21|iM, it is no surprise that menadione is widely
used as cell stressor. The concentrations of menadione required to produce
cell death are low. Similar toxicity curves were obtained for both menadiol and
menadione: up to 10|iM of menadione had almost no effect on cells, after
which a sudden drop in cell viability occurs. All cells were dead with 30|iiM
menadione.
49
Page 64
Catalase continues to shows its effect of reduction in cytoxicity; in this
case, 33.5|uM of menadione co-incubated with 1000U/mL catalase was
required to kill 50% of the cells, when compared to control. Again, the drop in
cell viability was less dramatic than with menadiol and occurred over a wider
range of concentrations.
Table 2.1. EC50 values for all the tested compounds in presence and
absence of catalase
Compound
H1-DA
H2-DA
H4-DA
DPND-DA
Menadiol-DA
Menadiol
Menadione
EC5o values (|uM)
No catalase
116
53
30
157
28
17.5
21
With catalase
>200
>60
>50
200
37
37.5
33.5
The most proposed mechanism for menadione cytotoxicity is
glutathione depletion. Since we are testing not only the quinone but also the
diol, the levels of glutathione in response to the synthesized compounds was
determined.
50
Page 65
2.5- ,
\ \ s
1 ' 1 ' 0 10 20 30 40
Menadiol concentration (HM)
Figure 3.12. Total glutathione response curves to treatment with
different concentrations of menadiol for 3 and 24 hours at 37°C. (Values
represent means ± S.E.M. n = 3).
First, the cellular response after 24 hours of incubation with menadiol
was tested. As shown in Figure 3.12, the overall response is an increase in
intracellular glutathione; up to two-fold compare to control cells, followed by a
dramatic decrease. When taking into account the extremely high toxicity of
menadiol (EC5o = 17.5nM), it is reasonable to think that at 25 iM menadiol,
when almost 80% of the cells are dead, the glutathione will show a marked
decrease. The results were somehow puzzling in that they contradict the
literature that proposes glutathione depletion as the main mechanism of
toxicity for menadione (Chung, 1997). Despite the fact that menadiol, and not
menadione, was tested at this point in time, the diol form will eventually
oxidize to quinone. Therefore, there should be no significant difference
between their behaviour relative to intracellular glutathione levels. In this case,
2.0-I I
I-r 0.0 -
•— 24hrs incubation • - 3 hrs incubation
51
Page 66
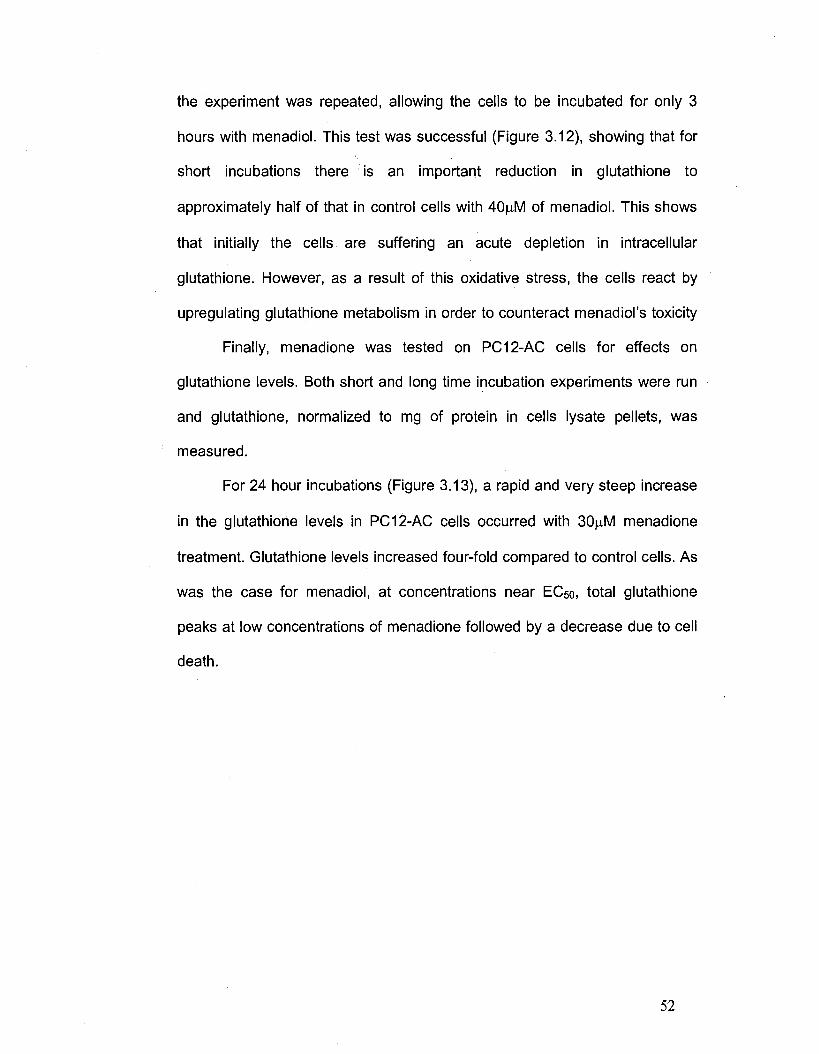
the experiment was repeated, allowing the cells to be incubated for only 3
hours with menadiol. This test was successful (Figure 3.12), showing that for
short incubations there is an important reduction in glutathione to
approximately half of that in control cells with 40nM of menadiol. This shows
that initially the cells are suffering an acute depletion in intracellular
glutathione. However, as a result of this oxidative stress, the cells react by
upregulating glutathione metabolism in order to counteract menadiol's toxicity
Finally, menadione was tested on PC12-AC cells for effects on
glutathione levels. Both short and long time incubation experiments were run
and glutathione, normalized to mg of protein in cells lysate pellets, was
measured.
For 24 hour incubations (Figure 3.13), a rapid and very steep increase
in the glutathione levels in PC12-AC cells occurred with 30|LIM menadione
treatment. Glutathione levels increased four-fold compared to control cells. As
was the case for menadiol, at concentrations near EC50, total glutathione
peaks at low concentrations of menadione followed by a decrease due to cell
death.
52
Page 67
5-1
L r i-
I'
-•—24 hrs incubation • - 3hrs incubation
/N A
10 20 30 40 50
Menadione concentration (nM)
Figure 3.13. Total glutathione (GSH and GSSG) response curves as
function of menadione concentration for 3 and 24 hours incubations at 37°C.
Total glutathione was normalized to mg protein in cell pellets. (Values
represent means ± S.E.M. n = 3).
To verify the literature data, a short time incubation experiment of 3
hours was run. Once again our data support the proposed mechanism of total
glutathione depletion for menadione toxicity. A steady and significant
reduction in glutathione levels was measured. At concentrations higher than
30|j,M menadione, the intracellular pool of total glutathione was reduced to
less than 25% of control values, with more cell death occurring at lower
concentrations of glutathione.
53
Page 68
Chapter 4
DISCUSSION
Page 69
Quinones exhibit their toxicity by one or both of two chemical
processes: a stoichiometric process involving 1,4 addition reactions with thiols
(glutathione) and a catalytic reduction of oxygen using quinone as a catalyst.
The first mechanism, the Michael addition reaction, correlates with the
reactivity of quinones as electrophiles in which nucleophilic groups (SH for
instance) in proteins or other molecules are alkylated (see chapter 1.2.1). This
modified molecule would alter its normal functionality and initiate changes that
can lead to cell death. The redox process generates superoxide ion that can
induce oxidative damage to the cells. The major difference between the two
mechanisms is that quinones play a catalytic role in the latter process. One
equivalent of quinone can produce several equivalents of superoxide, thus
overwhelming the antioxidant systems of the cell. Therefore is it important to
study and understand the mechanism or mechanisms of toxicity for a
particular compound and, if possible, to try to alter its properties and chemical
structure in order to minimize the toxicity.
4.1. Cytotoxicity - with and without catalase
By comparing the EC5o values for the tested 1,2-diols (H1-DA, H2-DA,
H4-DA and DPND-DA), as determined from the toxicity curves in Figures 3.1,
3.2, 3.3. and 3.4 respectively (see Table 2.1.), the following rank of toxicity
can be established (moving from the most to the least toxic): H4-DA (EC50 =
30|^M) > H2-DA (EC50 = 53nM) > H1-DA (EC50 = 116jaM) > DPND-DA (EC50 =
157|j,M). When analyzing the data obtained for the 1,4-diols, the order of most
to least toxic is: Menadiol (EC50 = 17.5|uM) > Menadione (EC50 = 21p.M) >
Menadiol-DA (EC50 = 28|aM). From these data alone, the tested compounds
55
Page 70
can be grouped in three different classes: 1,4-naphthalenediols and
derivatives - extremely toxic, 1,2-catechols (H1, H2 and H4) - toxic and 2,3-
naphthalenediol (DPND) - weak to virtually non-toxic
When compounds H1-DA, H2-DA and H4-DA were tested for their
cytotoxicity in the presence of 1000 U/mL catalase, a very dramatic result was
obtained. As shown on Figures 3.1, 3.2 and 3.3, testing the toxicity of each
compound at concentrations up to twice the obtained EC50 values in the
absence of catalase produced toxicity curves that show very little if any loss in
cell viability when compared to the controls. The fact that under catalase co-
treatment, no EC50 values were able to be measured suggest beyond any
doubt that extracellular hydrogen peroxide production is a major factor in the
mechanism of catechol toxicity.
In comparison to the above results, when DPND-DA was incubated
with PC 12AC in the presence of catalase, a small increase in cell viability
was seen, possibly due to cell growth. Testing for viability with DPND-DA (0-
200| M), in both the presence and absence of catalase, resulted in an
increase in EC50 value from 157|Jvl (without catalase) to 200|uM (with
catalase) (Figure 3.4). Therefore extracellular hydrogen peroxide was less
important in the cytotoxicity mechanism of 1,2-naphthalenediols.
In the case of 1,4-naphthalenediol derivatives (menadiol-DA, menadiol
and menadione), the presence of catalase in the culture media had a
relatively small effect on the cytotoxicity. While for Menadiol-DA (Figure 3.9)
an increase of the EC50 values, from 28 to 37|o,M, was observed, for menadiol
(Figure 3.10) the increase is less significant, reaching 214%. The explanation
resides in the fact that, of the diols, menadiol can autoxidize easily in the
56
Page 71
extracellular space before diffusing inside the cells. In contrast, once
diacetylated, the autoxidation of menadiol is no longer possible.
Menadione, with an increase from 21 to 33.5^M in EC50 values (160%
compared to untreated controls; Figure 3.11), is situated in-between the OH-
free and acetylated form of its parent diol (in terms of change in EC50 values
when treated with catalase compared to control experiments). This
observation can be explained by taking into account that the quinone can be
reduced to its parent, in this case menadione, and that it's not as inert as the
menadiol-DA. Moreover, this fact is confirmed by the ranking in cytotoxicity for
the tests in the absence of catalase.
Overall, we can conclude that hydrogen peroxide plays a much more
important role in the cytotoxicity of 1,2-diols (H1-DA, H2-DA and H4-DA) than
for naphthalenediols (1,2-DPND-DAand 1,4-Menadiol-DA).
4.2. Correlation between cytotoxicity and intracellular GSH levels
For all the compounds tested, the most common cellular response was
the up-regulation of the intracellular total glutathione levels after 24 hrs of
incubation. The magnitude of the increase in glutathione varied from
approximately two-fold for menadiol (Figure 3.12) and H1-DA (Figure 3.8)
after 24 h to almost four-fold for menadione (Figure 3.13) and H2-DA (Figure
3.8).
Since the range of concentrations used for the glutathione assay was
chosen based on the EC50 values specific for each compound, it was more
appropriate to compare the slope of the glutathione response curves (rate of
production) than the maximum level of intracellular glutathione reached,
57
Page 72
relative to the control cells. When analyzing the rates of glutathione up-
regulation, H2-DA and H4-DA proved to induce the fastest increase in the
intracellular glutathione content, followed by H1-DA. DPND-DA exhibited no
increase in intracellular glutathione up to concentrations of 100|aM. Above this
concentration, the cellular levels of glutathione increased with increasing
DPND-DA.
The order in which compounds upregulated glutathione was H2-DA *
H4-DA > H1-DA » DPND-DA which correlated very closely to compound
ranking in cytotoxicity (H4-DA > H2-DA > H1-DA > DPND-DA).
As discussed in the "Introduction" chapter, ROS generated by phenols
and other xenobiotics induce an up-regulation of the intracellular glutathione.
By analyzing the chemical structures of the tested catechols, it is notable that
H4-DA is the only compound that can take part in the Michael addition
reactions. This could cause a decline in the glutathione levels in PC12-AC
cells by alkylation. This mechanism alone contradicts though the observation
that H4-DA induces an overall increase in the intracellular GSH levels (Figure
3.8). The conclusion would be that under oxidative stress induced by the
tested catechols and naphthalenediols the cells are responding by increasing
the amount of reduced GSH available to counteract the damage induced by
the ROS. Since it was the total GSH levels that were measured it cannot be
concluded definitively what mechanisms the cells are using to produce GSH
are.
58
Page 73
4.3. Cytotoxicity is correlated with hydrogen peroxide generation
Since added catalase had a large impact on the cytotoxicity of H1-DA
(Figure 3.1), H2-DA (Figure 3.2) and H4-DA (Figure 3.3) it is reasonable to
conclude that, overall, hydrogen peroxide plays an important role in the
toxicity of catechols.
When measuring the accumulation of hydrogen peroxide in the culture
media of treated cells (Figure 3.5), the initial rate of hydrogen peroxide
generation follows exactly the ranking order of cytotoxicity: H4-DA > H2-DA >
H1-DA.
A parallel indicator of the oxidation process involves the quantification
of the quinone product. The quinone product is produced when the parent
compound enters the cell, becomes hydrolyzed and then oxidized. Oxidation
may occur either inside the cell or extracellularly after transport of the
hydrolyzed product to the outside the cell.
As shown on Figure 3.7, the observed ranking for quinone production
is H4-DA > H2-DA > H1-DA. As expected, this order correlates with hydrogen
peroxide production and cytotoxicity of the compounds.
In order to determine which step of the catechol's cytotoxicity
mechanism (as described above) had the highest contribution to loss of cell
viability, we attempted to quantify the autoxidation process. The time-course
of hydrogen peroxide production, resulting from autoxidation of the four tested
catechols (in their free OH form) in HBSS, is shown in Figure 3.6. Hydrogen
peroxide was produced as early as 5 minutes (the first time point recorded)
after the addition of catechols, at which the maximum level for both H2 and
H4 was reached. It can be concluded that autooxidation occurred very rapidly.
59
Page 74
H1 produced hydrogen peroxide at a much slower rate, reaching a maximum
within 25 minutes of incubation with compound. For DPND, it was noted that
the maximum level of hydrogen peroxide attained was half of that of the other
diols. This correlated with cytotoxicity, as represented by EC50 values (H4 >
H2>H1 >DPND).
The process of autooxidation occurs with the following sequence of
events: 1) cellular uptake of the diol (diffusion of the DA form of the diol into
the cell), 2) hydrolysis of the acetyl groups to free the parent diol, 3) efflux of
the deacetylated product from the cell and 4) autoxidation of the product in the
extracellular space.
If the autooxidation would occur inside the cells then quinones and
hydrogen peroxide would be produced intracellular^. To protect itself against
the toxic effects of the quinones, as part of phase II metabolism, GSH adducts
with the quinones would form and quickly being transported outside the cells.
This would induce an overall loss of glutathione that contradicts the
upregulation observed. Also the hydrogen peroxide produced intracellular^
would start damaging the cells from inside, again contradicting the observed
significant effect of reducing the cytotoxicity of the tested compounds when
extracellular catalase was added. In the case of DPND-DA which cannot
easily autoxidize we can see that extracellular catalase has very little effect. It
is also be possible that the intracellular catalase would decompose the
hydrogen peroxide produced by intracellular autoxidation rendering
autooxidized products harmless.
As discussed by Brunmark (1988) addition of glutathione to quinones
showed an extremely fast loss of quinone specific absorbance peak and
60
Page 75
appearance of two new peaks characteristic for the glutathionylderivatives.
The fact that we were able to spectrophotometrically measure extracellular
quinone levels (in the case of H4-DA account for 100% of the autoxidation
product - Figure 3.7) supports the idea that the autoxidation process occurs
mainly in the extracellular space.
By quantifying the hydrogen peroxide present in the medium (Figure
3.5) and the accumulation of the quinone in the extracellular environment
(Figure 3.7) the overall rate of autooxidation could be measured. Since H2,
H4, and H1 autooxidized rapidly, the dramatic difference between hydrogen
peroxide production and quinone production (Figure 3.7) can be explained in
that either the uptake of the diol or the efflux of the deacetylated product is
rate-limiting. For instance, H4 and H2 are autooxidizing equally fast but H2-
DA is twice as slow as H4-DA at quinone accumulation in the medium. This
observation supports the conclusion that H2 is slower than H4 in crossing the
membrane in both its DA form (into the cells) as well as its OH free form
(outside the cell).
Several parallel observations (the fast autoxidation of the catechols in
the medium (Figure 3.6), the detection of the oxidation products (quinone) in
the extracellular space (Figure 3.7) and dramatic decrease in the cytotoxicity
upon addition of catalase (Figures 3.1, 3.2 and 3.3)) lead to the general
conclusion that extracellular autoxidation of the catechols is a major
mechanism through which these compounds manifest their toxic effects.
The rate at which the compounds are metabolized (uptake, hydrolysis
and efflux) is controlled, ultimately, by the cell. Since uptake and efflux are the
61
Page 76
rate limiting steps, the faster the rate of compound processing, the faster the
rate of extracellular autooxidation and (eventually) cell death.
DPND had a character that differed from both catechols and menadiol.
The lack of effect of catalase on DPND cytotoxicity separated it from the
catechols. The low toxicity of DPND compared to the other naphthalenediol
tested (menadiol) makes it favourable for a potential therapeutic antioxidant.
The chemical nature of DPND reveals the reason for the difference in toxicity.
1,2- (Figure 4.1) and 1,4-naphthalenediol (Figure 4.2) easily form stable
semiquinones and quinones.
Figure 4.1. Dihydroxy, semiquinone and quinone forms of 1,2-
naphthalenediol.
Figure 4.2. Dihydroxy, semiquinone and quinone forms of 1,4-
naphthalenediol.
Compounds with structures related to 2,3-naphthalenediols (DPND
included) easily form semiquinones. The quinone formation, however,
62
Page 77
requires the loss of aromaticity not only in the OH-bearing ring but also in the
adjacent ring as well (Figure 4.3). We estimate that this loss in aromaticity
comes with an energy "price" of approximately 10 kcal/mol (Chichirau, 2005).
Figure 4.3. Dihydroxy, semiquinone and quinone forms of 2,3-
naphthalenediol
It can be concluded then that the rate of autooxidation of the catechol
correlates very well with the cytotoxicity: 1) the extremely fast autoxidative
compounds (H4 and H2) showing the lowest EC50 values, 2) H1 situated
somewhere in the middle and 3) DPND having very slow (if any) autooxidation
and being the least toxic of all the catechols. We have to add to this
conclusion the fact that catalase has an overall effect of drastically reducing
the cellular toxicity. The hydrogen peroxide production correlated with the
quinone chromophore accumulation in the extracellular space. All these
general observations lead to the overall mechanism of H1, H2 and H4 toxicity
which consist of five steps: 1) transport of the DA form of the tested
compounds into the cells, 2) deacetylation to catecholic form, 3) efflux of the
catecholic form to the extracellular space, 4) autooxidation to produce
hydrogen peroxide with the formation of quinone and 5) cell damage resulting
in loss of viability.
63
Page 78
In the case of naphthalenediols (DPND and menadiol), catalase did not
have significant effects on toxicity reduction, suggesting that overall redox
cycling plays a less important role than in the case of catechols. With the
catechols, glutathione depletion led to a loss in cell viability. Long-term
treatments (24 hrs) with menadiol/menadione were initially conducted; the
results showing an increase in the intracellular levels of glutathione.
Glutathione depletion by menadione was confirmed when short time (3 hrs)
incubation experiments were performed. The two time points clarified the
mechanism of menadione's toxicity. Intracellularly menadione nucleophylically
reacts with glutathione (Talamoni, 2005). When intracellular levels of
glutathione are low, cells respond by up-regulating glutathione synthesis and
this was observed when cells were treated for an acute exposure at low
concentrations of menadione. Upon chronic exposure to higher
concentrations of menadione, an overall loss in the GSH levels was observed.
Ultimately, cells can no longer maintain reduced thiol concentrations and cell
death ensues. Being part of the naphthalenediol family, DPND is expected to
have similar effects. Even though eventually a rise in the intracellular
glutathione level was measured with DPND treatment, blocking the 1,4
position with large dipropyl moieties reduced the reactivity of DPND towards
thiols. Since the structure of DPND does not allow for an easy and fast
autooxidation (this requires the loss of aromaticity in the second ring as well
as unobstructed positions at 1 and 4), the question of the mechanism of the
DPND toxicity remains. It can only be proposed that with the help of the
lipophylic anchors provided by the propyl substituents, DPND preferentially
locates itself in the cell membrane where it can induce lipid peroxidation by
64
Page 79
HAT. The cells will detect the oxidative damage and will respond by
upregulating glutathione synthesis.
From the results, it can be concluded that, in order to avoid or at least
minimize the pro-oxidant effect linked to catechols and diols in general, a
good candidate for potent antioxidant with reduced cytotoxicity should
possess such a structure that limits the possibility of autoxidation. As
exemplified with DPND, the requirements would be to choose compounds that
can easily form semiquinones, thus allowing them to quickly act as
antioxidants by HAT to a radical (lipid peroxyl radical for instance) but have
high activation energies for the formation of quinones (i.e. loss of aromaticity
of more then one cycle). Since the presence of quinone is the requirement for
autoxidation and redox cycling, the new formula should avoid or reduce the
chances of the quinone being formed. In order to lessen the occurance of
cytotoxicity by formation of adducts with biological molecules (thiols or DNA
bases), complete blockage of the positions adjacent to the hydroxy
substituents could be applied. By choosing the right substituents, the
hydrophillicity/lipophillicity of the new compounds can be tuned so that they
would distribute preferentially in the desired cellular location (i.e. membrane
vrs. the cytosol).
These observations open the door for the possible usage of
naphthalenediols (2,3 or 1,8) that do not easily form quinones in antioxidant
formulations, for therapeutic applications.
In order to support the prospect of therapeutic use, more testing is
required. This should include the study of toxicity and antioxidant effects on
different cell types, the study of the exact mechanism of cytotoxicity, and the
65
Page 80
study of how alteration of the structure (substituents) of naphthalenediols
alters their antioxidant activity while minimizing their pro-oxidant action.
Page 82
Ault J.G., Lawrence D.A., 2003 - Glutathione distribution in normal and oxidatively
stressed cells, Experimental Cell Research, vol. 285, 9-14
Benov L, 2001 - How superoxide radical damages the cell, Protoplasma, vol. 217,
33-36
Bergmann, B., Dohrmann, J. K., Kahl, R., 1992 - Formation of the semiquinone
anion radical from tert-butylquinone and from tert-butylhydroquinone in rat
liver microsomes, Toxicology, vol. 74, 127-33
Bharath S., Cochran B.C., Hsu M., Liu J., Ames B.N., Andersen J.K., 2002 - Pre-
treatment with R-lipoic acid alleviates the effects of GSH depletion in PC12
cells: implications for Parkinson's disease therapy, NeuroToxicology, vol. 23,
479-486
Boots A.W., Haenen G.R.M.M., Den Hartog G.J.M., Bast A, 2002 - Oxidative
damage shifts from lipid peroxidation to thiol arylation by catechol-containing
antioxidnts, Biochimica et Biophysica Acta, vol. 1583, 279-284
Boots A.W., Bast A., Haenen G.R.M.M., 2005 - No role of DT-diaphorase (NQ01)
in the protection against oxidized quercetin, FEBS Ketters, vol. 579, 677-682
Bradford, M.M., 1976 - A rapid and sensitive method for the quantitation of
microgram quantities of protein utilizing the principle of protein-dye binding,
Analytical Biochemistry, vol. 72, 248-254
68
Page 83
Bravo L, 1998 - Polyphenols: chemistry, dietary sources, metabolism and
nutritional significance, Nutrition Reviews, vol. 56, 317-333
Brighente I.M.C., Dias M., Verdi L.G., Pizzolatti M.G, 2007 - Antioxidant activity
and total phenolic content of some Brazilian species, Pharmaceutical Biology,
vol 45, 156-161
Brunmark A., Cadenas E., 1988 - Reductive addition of glutathione to p-
benzoquinone, 2-hydroxy-p-benzoquinone and p-benzoquinone epoxides.
Effects of the hydroxy- and glutathionyl substituents on p-benzoquinone
autoxidation, Chemico-Biological Interactions, vol. 68, 273-298
Bukowska B., Kowalska S. - Phenol and catechol induce prehemolytic and
hemolytic changes in human erythrocytes, Toxicology Letters, vol. 152, 2004,
73-84
Cadenas E., 1995 - Antioxidant and prooxidant functions of DT-diaphorase in
quinone metabolism, Biochemical Pharmacology, vol. 49, 127-40
Cao G., Sofic E., Prior R.L., 1997 - Antioxidant and prooxidant behavior of
flavonoids: structure-activity relationships, Free Radical Biology and Medicine,
vol. 22, 749-760
69
Page 84
Cavalieri E.L., Stack D.E., Devanesan P.D., 1997 - Molecular origin of cancer:
Catechol estrogen-3,4-quinones as endogenous tumor initiators, Proceedings
of the Natural Academy of Science of USA, vol. 94, 10937-10942
Cavalieri E.L., Li Kai-Ming, Balu N., Saeed M., Devanesan P., Higginbotham S.,
Zhao J., Gross M.L., Rogan E.G., 2002 - Catechol ortho-quinones: the
electrophilic compounds that form depurinating DNA adducts and could
initiate cancer and other diseases, Carcinogenesis, vol. 23, 1071-1077
Chang M., Shi M., Forman H.J., 1992 - Exogenous glutathione protects
endothelial cells from menadione toxicity, American Journal of Physiology,
vol. 262, 637-643
Chichirau A, Flueraru M, Chelepev L.L., Wright J.S., Willmore W.G., Durst T.,
Hussain H.H., Charron M., 2005 - Mechanism of cytotoxicity of catechols and
a naphthalenediol in PC12-AC cells: the connection between extracellular
autoxidation and molecular electronic structure, Free Radical Biology and
Medicine, vol. 38, 344-355
Chung Jin-Ho, Seo Dong-Chul, Chung Sun-Hwa, Lee Joo-Young, Seung Sang-
Ae, 1997 - Metabolism and cytotoxicity of menadione and its metabolite in rat
platelets, Toxicology and Applied Pharmacology, vol. 142, 378-385
70
Page 85
De Lange, D. W., 2007 - From red wine to polyphenols and back: A journey
through the history of the French Paradox, Thrombosis Research, vol. 119,
403-406
Dickinson D.A., Forman H.J., 2002 - Glutathione in defense and signaling:
lessons from a small thiol, Annals of the New York Academy of Science, vol.
1973, 488-504
Dickinson D.A., Moellering D.R., lies K.E., Patel R.P., Levonen A.L., Wigley A.,
Darley-Usmar V.M., Forman H.J., 2003 - Cytoprotection against oxidative
stress and the regulation of glutathione synthesis, Biological Chemistry, vol.
384, 527-537
Eftekhar E., Arne H., Bernhard H.JJ., 2000- Thioredoxin reductase and
glutathione synthesis is upregulated by t-butylhydroquinone in cortical
astrocytes but not in cortical neurons, Glia, vol. 31, 241-248
El Habit O.H., Saada H.N., Azab K.S., 2000 - The modofying effect of beta-
carotene on gamma radiation -induced elevation of oxidative reactions and
genetoxicity in male rats, Mutation Research, vol. 466, 179-186
Filomeni G., Rotilio G., Ciriolo M.R., 2002 - Cell signalling and the glutathione
redox system, Biochemical Pharmacology, vol. 64, 1057-1064
71
Page 86
Fraga C.G., 2007 - Plant polyphenols: How to translate their in vitro antioxidant
actions to in vivo conditions, IUBMB Life, vol. 59, 308-315
Furusawa M., Tanaka T., Ito T., 2005 - Antioxidant activities of hydroxyl
flavonoids, Journal of Health Science, vol. 51, 376-378
Galati G., O'Brien P.J., 2004 - Potential toxicity of flavonoids and other dietary
phenolics: Significance for their chemopreventive and anticancer properties,
Free Radical Biology and Medicine, vol. 37, 287-303
GantT.W., Ramakrishna R.D.N., Mason R.P., Cohen G.M., 1988 - Redox cycling
and sulphydryl arylation: their relative importance in the mechanism of
quinone cytotoxicity to isolated hepatocytes, Chemico-Biological Interactions,
vol.65, 157-173
Gant T.W., Rao D.N., Mason R.P., Cohen G.M., 1988 - Redox cycling and
sulphydryl arylation their relative importance in the mechanism of quinone
cytotoxicity to isolated hepatocytes, Chemico- Biological Interaction, vol. 65,
157-73
Halliwell B., Gutteridge J.M.C., Cross C.E., 1992 - Free radicals antioxidants and
human disease: Where are we now?, Journal of Laboratory and Clinical
Medicine, vol. 119, 598-620
72
Page 87
Han D., Handelman G., Marcoci L, Sen C.K., Roy S., Kobucki H., Tritschler H.J.,
Flohe L, Packer L., 1997 - Lipoic acid increases de novo synthesis of cellular
glutathione by improving cystine utilization, Biofactors, vol. 6, 321-338
Han Shan-Kuo, Mytilineou C, Cohen G., 1995 - L-DOPA up-regulates glutathione
and protects mesencephalic cultures against oxidative stress, Journal of
Neurochemistry, vol. 66, 501-51
Harbome J.B., Baxter H., Miss G.P., 1999 - Phytochemical dictionary: Handbook
of bioactive compounds from plants, Taylor & Francis, London, UK
Heim K.E., Tagliaferro A.R., Bobilya D.J., 2002 - Flavonoid antioxidants:
chemistry, metabolism and structure-activity relationships, The Journal of
Nutritional Biochemistry, vol. 13, 572-584
Keijnen C.G.M., Haenen G.R.M.M., Oostveen R.M., Stalpers E.M., Bast A., 2002
- Protection of flavonoids against lipid peroxidation: the structure activity
relationship revisited, Free Radical Research, vol. 36, 575-581
Higdon, Jane V., Frei B., 2003 - Tea catechins and polyphenols: health effects,
metabolism, and antioxidant functions, Critical Reviews in Food Science and
Nutrition, vol. 43, 89-143
73
Page 88
Ishige K., Schubert D., Sagara Y., 2001 - Flavonoids protect neuronal cells from
oxidative stress by three distinct mechanisms, Free Radical Biology and
Medicine, vol. 30, 433-446
Kulys J., Tetianec L, 2006 - Highly sensitive biosensor for the hydrogen peroxide
determination by enzymatic triggering and amplification, Sensors and
Actuators B: Chemical, vol. 113, 755-759
Lee Joo-Young, Bae Ok-Nam, Chung Seung-Min, Lee Moo-Yeol, Chung Jin-Ho,
2001 - Menadione induces endothelial dysfunction mediated by oxidative
stress and arylation, Chemico-Biological Interactions, vol. 137, 169-183
Levay G., Bodell W.J., 1992 - Potentiation of DNA adduct formation in HL-60 cells
by combinations of benzene metabolites, Proceedings of the Natural
Academy of Sciences of USA, vol. 89, 7105-7109
De Loecker W.; Janssens J.; Bonte J.; Taper H.S., 1993 - Effects of sodium
ascorbate (vitamin C) and 2-methyl-1,4-naphthoquinone (vitamin K3)
treatment on human tumor cell growth in vitro. II. Synergism with combined
chemotherapy action. Anticancer Research, vol. 13, 103-6
Manach C, Williamson G., Morand C, Sclabert A., Remesy C , 2005 -
Bioavailability and bioefficacy of polyphenols in humans.I. Review of 97
bioavailability studies, American Journal of Clinical Nutrition, vol. 81, 230-242
74
Page 89
Martinez V.I., Periago M.J., Provan G., Chesson A., 2002 - Phenolic compounds,
lycopene and antioxidant activity in commercial varieties of tomato, Journal of
the Science of Food and Agriculture, vol. 82, 323-330
Matsuura T., Ohkatsu Y., 2000 - Phenolic antioxidants: effect of ortho-benzyl
substituents, Polymer Degradation and Stability, vol. 70, 59-63
May J.M., Qu Zhi-chao, Li X., 2003 - Ascorbic acid blunts oxidative stress due to
menadione in endothelial cells, Archives of Biochemistry and Biophysics, vol.
411,136-144
McAmis W.C., Schaeffer Jr., Richard C , Baynes J.W., Wolf M.B., 2003 -
Menadione causes endothelial barrier failure by a direct effect on intracellular
thiols, independent of reactive oxidant production, Biochimica et Biophysica
Acta, vol. 1641,43-53
Moridani M.y., Scobie H., O'Brien P.J., 2001 - Catechin metabolism: glutathione
conjugate formation catalysed by tyrosinase, peroxidase and cytochrome
P450, Chemical Research in Toxicology, vol. 14, 841-848
Moridani M.Y., Siraki A., O'Brien P.J., 2003 - Quantitative structure toxicity
relationship for phenol in isolated rat hepatocytes, Chemico-Biological
Interactions, vol. 145, 213-223
75
Page 90
Morton L.W., Caccetta R.A-A., Puddey I.B., Croft K.D., 2000 - Chemistry and
biological effects of dietary phenolic compounds: relevance to cardiovascular
disease, Clinical and Experimental Pharmacology and Physiology, vol. 27,
152-159
Mytilineou C ; Kramer B.C; Yabut J.A., 2002 - Glutathione depletion and oxidative
stress, Parkinsonism & Related Disorders, vol. 8, 385-7
Parr A.J., Bolwell G.P., 2000 - Phenols in the plant and in man. The potential for
possible nutritional enhancement of the diet by modifying the phenols content
or profile, Journal of the Science of Food and Agriculture, vol. 80, 985-1012
Pethig R., Gascoyne P.R., McLaughlin J.A., Szent-Gyorgyi A., 1983 - Ascorbate-
quinones interactions: Electrochemical free radical and cytotoxic properties,
Proceedings of the Natural Academy of Sciences of USA, vol. 80, 129-32
Powis G., Appel P.L., 1980 - Relationship of the single-electron reduction
potential of quinones to their reduction by flavoproteins, Biochemical
Pharmacology, vol. 29, 2567-72
Pryor W.A., Stone K., Zang L-Y., Benmudez E., 1998 - Fractionation of aqueous
cigarette tar extracts: fractions that contain the tar radical cause DNA
damage, Chemical Research in Toxicology, vol. 11, 441-448
76
Page 91
Puupponen Pimaja R., Nohynek L, Meier C , Kahkonen M., Heinonen M., Kopia
A., 2001 - Antimicrobial properties of phenolic compounds from berries,
Journal of Applied Microbiology, vol. 90, 494-507
Rive-Evans C.A., Miller N.J., Pagange G., 1997 - Antioxidant properties of
phenolic compounds, Trends in Plant Science, vol. 2, 152-159
Ross D., 1996 - Metabolic basis of benzene toxicity, European Journal of
Haematology, vol. 57, 111-118
Rossi L, Moore S., Orrenius S., O'Brien P.J., 1986 - Quinone toxicity in
hepatocytes without oxidative stress, Archives of Biochemistry and
Biophysics, vol. 251, 25-35
Said Ahmad M., Fazal F., Rahman A., Hadi S.M., Parish J.H., 1992 - Activities of
flavonoids for the cleavage of DNA in the presence of Cu(ll): correlation with
generation of active oxygen species, Carcinogenesis, vol. 13, 605-608
Schlosser P.M., Bond J.A., Medinsky M.A., 1993 - Benzene and phenol
metabolism by mouse and rat liver microsomes, Carcinogenesis, Vol 14,
2477-2486
Schweigert N., Zehnder A. J.B., Eggen R.I.L., 2001 - Chemical properties of
catechols and their molecular modes of toxic action in cells, from
microorganisms to mammals, Environmental Microbiology, vol. 3, 81-91
77
Page 92
Syrus R. S., Konjetic R.S., Meredith M.J., Freeman M.L., 2000- Multi-faceted
regulation of y- glutamylcysteine synthetase, Journal of Cellular Physiology,
vol. 182, 163-170
Talamoni, NT., Marchionatti A., de Barboza G.D., Perez, A., 2005 - Cellular and
biochemical alterations caused by artificial depletion of glutathione, Current
Enzyme Inhibition, vol. 1, 123-130
Tampo Y., Yonaha M., 1996 - Enzymatic and molecular aspects of the
antioxidant effect of menadione in hepatic microsomes, Archives of
Biochemistry and Biophysics, vol. 334, 163-174
Tapper M.A., Sheedy B.R., Hammermeister D.E., Schmieder P.K., 2000 -
Depletion of cellular protein thiols as an indication of arylation in isolated trout
hepatocytes exposed to 1,4-benzoquinone, Toxicological Sciences, vol. 55,
327-43
Thor H., Smith M.T., Hartzell P., Bellomo G., Jewell S.A., Orrenius S., 1982 - The
metabolism of menadione (2-methyl-1,4-naphthoquinone) by isolated
hepatocytes, The Journal of Biological Chemistry, vol. 257, 12419-12425
Tietze, F., 1969 - Enzymatic method for quantitative determination of nanogram
amounts of total and oxidized glutathione: Applications to mammalian blood
and other tissues. Analytical Biochemistry, vol. 27, 502-522
78
Page 93
Tsao C.W., Song H.G., Dagger R.B., 1998 - Metabolism of benzene, toluene, and
xylene hydrocarbons in soildagger, Applied and Environmental Microbiology,
vol. 64, 4924 - 4929
Wanasundara U.N., Shahidi F., 1998 - Antioxidant and prooxidant activity of
green tea extracts in marine oils, Food Chemistry, vol. 63, 335-342
Wang L, Tu Y.C., Lian T.W., Hung J.T., Yen J.H., Wu M.J., 2006 - Distinctive
antioxidant and antiinflammatory effects of flavonols, Journal of Agricultural
and Food Chemistry, vol. 54, 9798-9804
Watanabe N., Forman H.J., 2003 - Autoxidation of extracellular hydroquinones is
a causative event for the cytotoxicity of menadione and DMNQ in A 549-S
cells, Archives of Biochemistry and Biophysics, vol. 411, 145-157
Woods J.S, Kavanagh T.J, Corral J., Reese A.W., Diaz D., Ellis M.E., 1999 - The
role of glutathione in chronic adaptation to oxidative stress: studies in a
normal rat kidney epithelial (NRK52E) cell model of sustained upregulation of
glutathione biosynthesis, Toxicology and Applied Pharmacology, vol. 160,
207-216
79