MECHANISTIC QUALITY CONTROL/QUALITY ASSURANCE EVALUATION OF SASKATCHEWAN SPECIFIC PAVEMENT STUDIES-9A ASPHALT MIXES Prepared By: Curtis Berthelot, Assistant Professor Bill Crockford, President Stella White, Director, Road Science Gordon Sparks, Professor Presented at: Canadian Technical Asphalt Association Proceedings 42 nd Annual Conference Vol. XLII Pp 201 - 227 ACKNOWLEDGMENTS The authors would like to acknowledge the guidance provided by Dr. R.L. Lytton of Texas A&M University and Mr. Barry Tritt of Industrial Process Controls, Australia. The funding provided by Saskatchewan Highways and Transportation for this research is gratefully acknowledged. In addition, the participation and support provided by Husky Asphalt Marketing, Imperial Oil, Koch Materials, Moose Jaw Asphalt, and the National Science and Engineering Research Council is greatly appreciated.
Transcript
MECHANISTIC QUALITY CONTROL/QUALITY ASSURANCE EVALUATION OF SASKATCHEWAN SPECIFIC PAVEMENT
STUDIES-9A ASPHALT MIXES
Prepared By:
Curtis Berthelot, Assistant Professor
Bill Crockford, President
Stella White, Director, Road Science
Gordon Sparks, Professor
Presented at:
Canadian Technical Asphalt Association Proceedings
42nd Annual Conference
Vol. XLII
Pp 201 - 227
ACKNOWLEDGMENTS
The authors would like to acknowledge the guidance provided by Dr. R.L. Lytton of Texas A&M University and Mr. Barry Tritt of Industrial Process Controls, Australia. The funding provided by Saskatchewan Highways and Transportation for this research is gratefully acknowledged. In addition, the participation and support provided by Husky Asphalt Marketing, Imperial Oil, Koch Materials, Moose Jaw Asphalt, and the National Science and Engineering Research Council is greatly appreciated.
BERTHELOT, CROCKFORD, WHITE & SPARKS 1
ABSTRACT Pavement life-cycle costing, performance-based specifications, and performance-based contractor pay factors require the ability to accurately predict the life-cycle performance of pavement structures. Given recent advancements in thermomechanical characterization of pavement materials, mechanistic mix design methods and mechanistic road performance prediction techniques, Saskatchewan Highways and Transportation (SHT) is evaluating mechanistic methods for possible integration into their asphalt paving operations. However, in order to adopt mechanistic methods into routine paving operations, mechanistic- based quality control/quality assurance test equipment and protocols must be available to augment mechanistic-based design and specifications. This paper summarizes the field evaluation of a prototype triaxial quality control/quality assurance testing apparatus under development by Industrial Process Controls (IPC) of Australia and TSL of Texas. The evaluation is based on testing conducted during the construction of the SHT Specific Pavement Studies-9A test section on Highway 16 near Radisson, Saskatchewan in August 1996. The testing protocol employed frequency sweep tests on gyratory compacted specimens at one stress state at mixing temperature for quality control, and on temperature-conditioned samples at four stress states for quality assurance testing. The results of this field evaluation showed that the QC/QA test apparatus and testing protocols can measure fundamental thermomechanical properties of asphalt mixes. The apparatus is suitable for use in the field and in the lab.
RÉSUMÉ
Le coût du cycle de vie de la chaussée, les spécifications basées sur la performance et les facteurs d’ajustement des prix aux contracteurs basés sur la performance nécessitent la capacité de prédire précisément la performance du cycle de vie des structures de chaussée. Étant donné les récents développements de la caractérisation thermomécanique des matériaux de chaussée, des méthodes mécanistiques de formulation des enrobés et des techniques mécanistiques de prédiction de la performance des routes, Routes et Transports de la Saskatchewan est en train d’évaluer les méthodes mécanistiques pour leur intégration potentielle dans leurs opérations de revêtements bitumineux. Cependant, afin d’adopter les méthodes mécanistiques dans leurs opérations routinières de revêtements bitumineux, les équipements et les protocoles d’essai mécanistiques pour le contrôle ou l’assurance de la qualité doivent être disponibles afin d’accroître la formulation et les spécifications de type mécanistique. Cette présentation résume l’évaluation en chantier d’un prototype d’appareil d’essai triaxial de contrôle ou d’assurance de la qualité en développement par Industrial Process Controls (IPC) de l’Australie et TSL du Texas. L’évaluation est basée sur des essais réalisés durant la construction en août 1996 des sites d’essais des études spécifiques de chaussées SPS-9A de Routes et Transports de la Saskatchewan sur la route 16, à Radisson en Saskatchewan. Le protocole d’essai employait un balayage de fréquence sur des échantillons compactés au giratoire à un seul état de contrainte à la température de malaxage pour le contrôle de la qualité, et sur des échantillons conditionnés à la température à quatre niveaux de contrainte pour les essais de l’assurance de la qualité. Les résultats de cette évaluation de chantier montrent que l’appareil et les protocoles d’essais pour le contrôle ou l’assurance de la qualité peuvent mesurer les propriétés thermomécaniques fondamentales des enrobés bitumineux. L’appareil convient à l’utilisation en chantier et en laboratoire.
2 QC/QA EVALUATION OF SASKATCHEWAN SPS-9 ASPHALT MIXES
1.0 BACKGROUND Pavement life cycle costing, performance/warranty based specifications, and performance/warranty based contractor pay factors require the ability to accurately predict the life cycle performance of pavements. Pavement performance modeling requires accurate characterization of the thermomechanical behavior of road materials to provide the necessary constitutive relations that can be used to predict the primary response, damage, and healing of roads as a function of applied loads, geometry of the road structure, and environmental conditions. The Strategic Highway Research Program (SHRP) made significant progress in developing the theoretical thermomechanical framework for testing, designing, and specifying asphalt mixes based on performance, however, mechanistic based field quality control/quality assurance (QC/QA) test equipment and protocols must be available to augment mechanistic mix design methods. Unfortunately the cost, sophistication, and physical traits of the SHRP asphalt mix test equipment and testing protocols preclude them from being used effectively in the field for QC/QA testing by the organizations for which they were intended (i.e. highway agencies, suppliers, contractors and consulting engineers). As a result, SHT has identified the need to work with others to build on the sound theoretical framework of SHRP to develop a pragmatic and cost-effective testing apparatus and testing protocols that can be used for mechanistic based field QC/QA testing of road materials to augment mechanistic based mix design. In response to the need for improved mechanistic field QC/QA evaluation methods, work has been underway at Texas A&M University under the direction of Dr. R.L. Lytton1 in conjunction with Dr. W. Crockford and Mr. Barry Tritt2, to extend the findings of SHRP and develop an asphalt mix test apparatus and testing protocols that can be readily adopted by the road building industry in the field. These efforts have resulted in a prototype asphalt mix testing apparatus that can measure thermomechanical properties of asphalt mixes related to road behavior (Lytton [1]). The mechanistic QC/QA test apparatus is being developed as per the following functional requirements:
a) employs the fundamental principles of continuum thermomechanics to evaluate the mechanistic
time, temperature, and stress dependent properties of road materials; b) is suitable for research, design, QC/QA, and forensic testing; c) is capable of testing a wide variety of road materials including laboratory prepared and field core
samples of asphalt concrete, unbound coarse grained soils, and fine grained soils; d) provides accurate and repeatable results both in the lab and in the field; e) provides semi-automated near real time data evaluation; f) is portable, rugged, and robust and is suitable for field operations; and g) is user friendly for use by technical staff of highway agencies, asphalt suppliers, contractors, and
consultants.
1 Dr. R.L. Lytton P.E., F.J. Benson Chair, Director of Center for Infrastructure Engineering, Texas Engineering Experimental Station, Texas A&M University.
2 Mr. B Tritt, Managing Director, Industrial Process Controls, Melbourne, Australia
BERTHELOT, CROCKFORD, WHITE & SPARKS 3
2.0 PROJECT OBJECTIVES The objectives of this project were to:
a) evaluate the prototype QC/QA test apparatus and testing protocols for determining thermomechanical properties of asphalt mixes in the field in a QC/QA application; and
b) evaluate the sensitivity of the QC/QA test apparatus across temperature and stress dependent material properties of the asphalt mixes employed in the SHT SPS-9A test site.
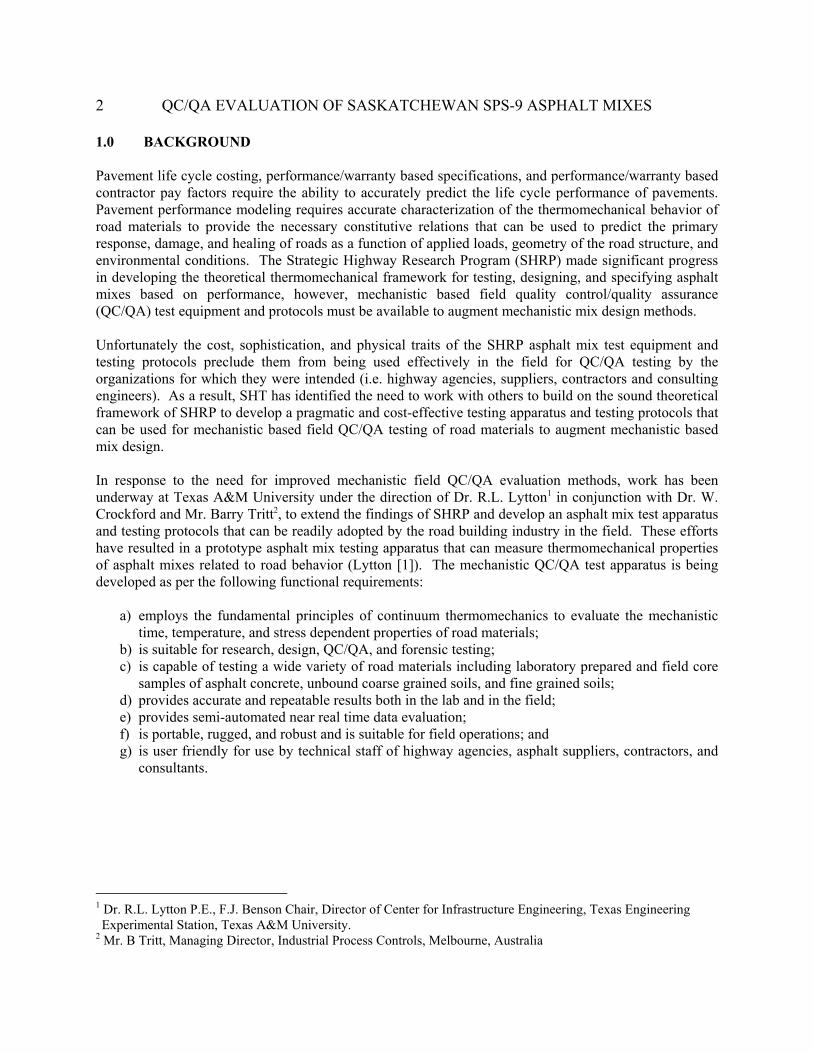
3.0 SHT SPS-9A SITE The QC/QA test apparatus was used in the field for the first time in August 1996 during the construction of the SHT SPS-9A test section located on Highway 16 near Radisson, Saskatchewan. Figure 1 illustrates the layout of the SPS-9A test site, and Table 1 summarizes the asphalt binder grade and mix design method used in each test section.
Basic SPS-9A RequirementsN
Direction of Traffic
3+87
0
900961SHT Marshall200/300A Pen
(PG 52-34)Type 70
900962SUPERPAVE
RecyclePG 52-40
900960SUPERPAVE300/400 Pen(PG 46-34)
900901SHT Marshall150/200 Pen(PG 58-28)
Type 70
900903SUPERPAVE
PG 52-34
900902SUPERPAVE
PG 52-40
900959SUPERPAVE150/200 Pen(PG 58-28)Tr
ansi
tion
Tran
sitio
n
Tran
sitio
n
Tran
sitio
n
Tran
sitio
n
Tran
sitio
n
Tran
sitio
n
Tran
sitio
n3+
916
4+18
84+
257
4+52
94+
617
4+82
94+
953
5+15
0
5+74
7
6+01
96+
082
6+35
4
6+81
7
7+08
97+
135
Figure 1 Saskatchewan Highways and Transportation Specific Pavement Studies-9A Test Site Layout
4 QC/QA EVALUATION OF SASKATCHEWAN SPS-9 ASPHALT MIXES
Table 1 Saskatchewan Highways and Transportation Specific Pavement Studies-9A Asphalt Binder Grade and Mix Design Method
SPS-9A Test Section ID Specified Asphalt Binder Mix Design Method
Figure 2 illustrates the structural cross section of each SPS-9A test section consisting of 120 mm asphalt concrete, 200 mm of soil stabilized base, and 230 mm subbase over a till subgrade with a California Bearing Ratio (CBR) of 6.
Figure 2 Saskatchewan Highways and Transportation Specific Pavement Studies-9A
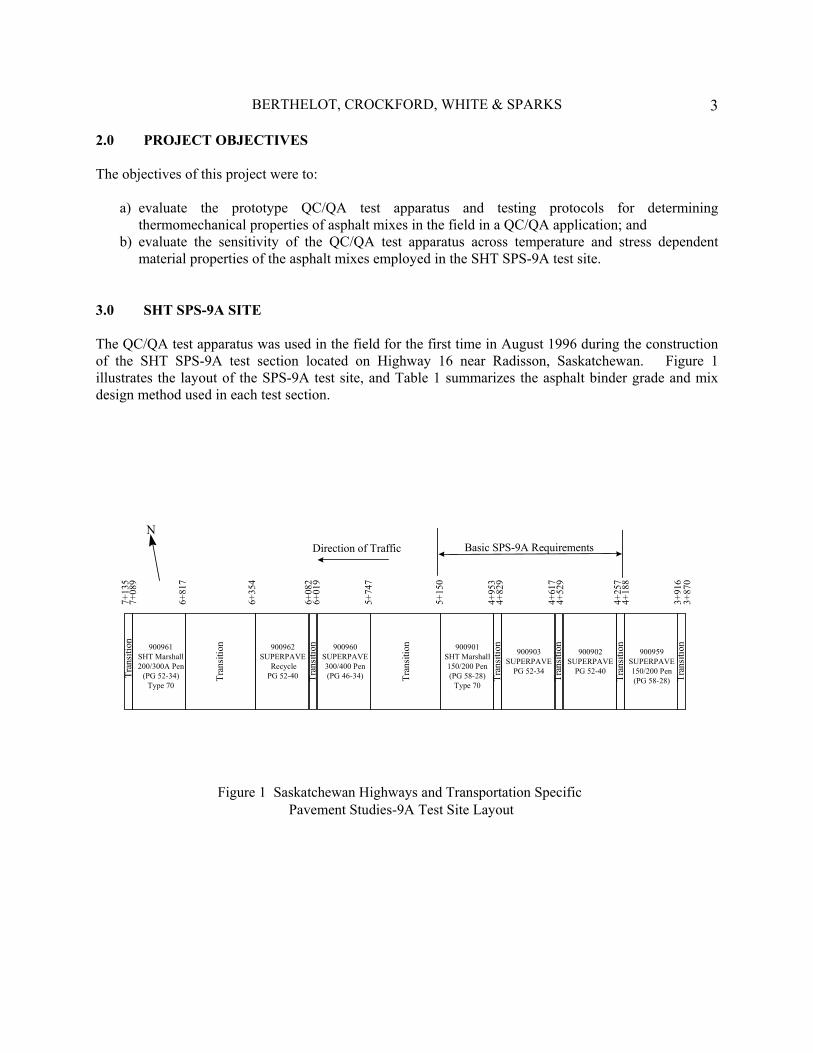
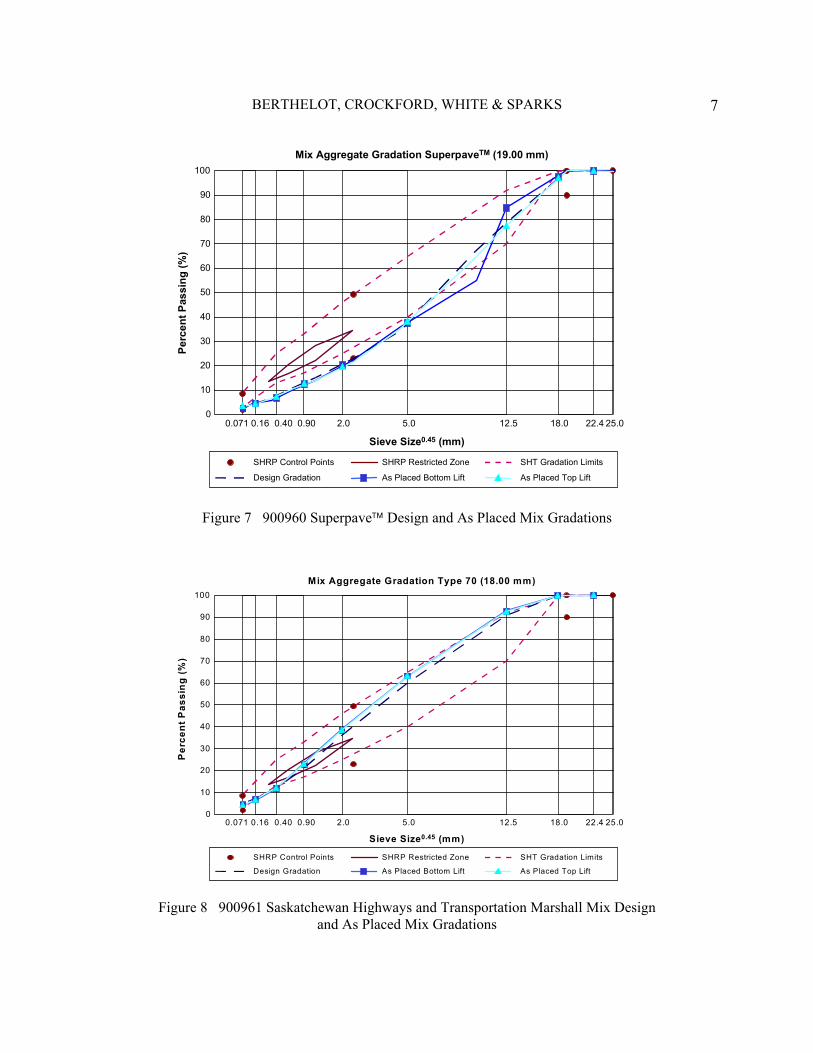
Structural Cross Section Figures 3 to 9 illustrate the specified design, and as placed top lift and bottom lift asphalt mix gradations of each SPS-9A test section. As can be seen in Figures 3 and 8, SPS-9A test sections 900901 and 900961 are standard SHT Type 70 dense graded Marshall mixes and the gradation passes directly through the Superpave restricted zone and hugs the maximum limit of the gradation envelope on the larger sieves. Figures 4, 5, 6, 7, and 9 illustrate the design and as placed asphalt mix gradations for the five Superpave mixes: 900902, 900903, 900959, 900960 and 900962, respectively. All the Superpave gradations run along, or drop below, the lower limit of the gradation envelope. Table 2 summarizes the design and as placed gyratory compacted volumetrics of each SPS-9A asphalt mix.
BERTHELOT, CROCKFORD, WHITE & SPARKS 5
Mix Aggregate Gradation Type 70 (18.00 mm)
Sieve Size0.45 (mm)
Perc
ent P
assi
ng (%
)
SHRP Control Points SHRP Restricted Zone
Design Gradation
SHT Gradation Limits
As Placed Top LiftAs Placed Bottom Lift
22.418.012.52.00.900.160.0710
10
20
30
40
50
60
70
80
90
100
0.40 5.0 25.0
Figure 3 900901 Saskatchewan Highways and Transportation Marshall Design and As Placed Mix Gradations
Sieve Size0.45 (mm)
Perc
ent P
assi
ng (%
)
SHRP Control Points SHRP Restricted Zone
Design Gradation
SHT Gradation Limits
As Placed Top LiftAs Placed Bottom Lift
22.418.012.52.00.900.160.0710
10
20
30
40
50
60
70
80
90
100
0.40 5.0 25.0
Mix Aggregate Gradation SuperpaveTM (19.00 mm)
Figure 4 900902 Superpave Design and As Placed Mix Gradations
6 QC/QA EVALUATION OF SASKATCHEWAN SPS-9 ASPHALT MIXES
Sieve Size0.45 (mm)
Perc
ent P
assi
ng (%
)
SHRP Control Points SHRP Restricted Zone
Design Gradation
SHT Gradation Limits
As Placed Top LiftAs Placed Bottom Lift
22.418.012.52.00.900.160.0710
10
20
30
40
50
60
70
80
90
100
0.40 5.0 25.0
Mix Aggregate Gradation SuperpaveTM (19.00 mm)
Figure 5 900903 Superpave Design and As Placed Mix Gradations
Sieve Size0.45 (mm)
Perc
ent P
assi
ng (%
)
SHRP Control Points SHRP Restricted Zone
Design Gradation
SHT Gradation Limits
As Placed Top LiftAs Placed Bottom Lift
22.418.012.52.00.900.160.0710
10
20
30
40
50
60
70
80
90
100
0.40 5.0 25.0
Mix Aggregate Gradation SuperpaveTM (19.00 mm)
Figure 6 900959 Superpave Design and As Placed Mix Gradations
BERTHELOT, CROCKFORD, WHITE & SPARKS 7
Sieve Size0.45 (mm)
Perc
ent P
assi
ng (%
)
SHRP Control Points SHRP Restricted Zone
Design Gradation
SHT Gradation Limits
As Placed Top LiftAs Placed Bottom Lift
22.418.012.52.00.900.160.0710
10
20
30
40
50
60
70
80
90
100
0.40 5.0 25.0
Mix Aggregate Gradation SuperpaveTM (19.00 mm)
Figure 7 900960 Superpave Design and As Placed Mix Gradations
Mix Aggregate Gradation Type 70 (18.00 mm)
Sieve Size0.45 (mm)
Per
cent
Pas
sing
(%)
SHRP Control Points SHRP Restricted Zone
Design Gradation
SHT Gradation Limits
As Placed Top LiftAs Placed Bottom Lift
22.418.012.52.00.900.160.0710
10
20
30
40
50
60
70
80
90
100
0.40 5.0 25.0
Figure 8 900961 Saskatchewan Highways and Transportation Marshall Mix Design and As Placed Mix Gradations
8 QC/QA EVALUATION OF SASKATCHEWAN SPS-9 ASPHALT MIXES
Sieve Size0.45 (mm)
Per
cent
Pas
sing
(%)
SHRP Control Points SHRP Restricted Zone
Design Gradation
SHT Gradation Limits
As Placed Top LiftAs Placed Bottom Lift
22.418.012.52.00.900.160.0710
10
20
30
40
50
60
70
80
90
100
0.40 5.0 25.0
Mix Aggregate Gradation SuperpaveTM (19.00 mm)
Figure 9 900962 Superpave Design and As Placed Mix Gradations
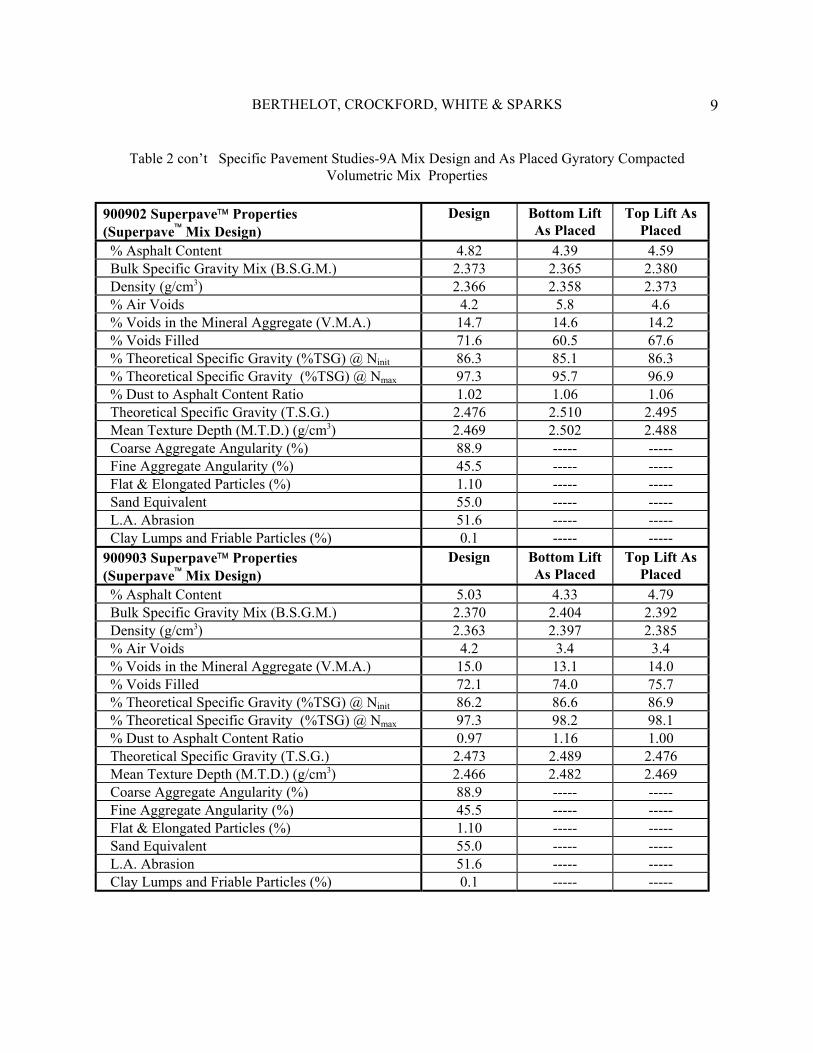
Table 2 Specific Pavement Studies-9A Mix Design and As Placed Gyratory Compacted Volumetric Mix Properties
% Asphalt Content 5.21 5.01 4.73 Bulk Specific Gravity Mix (B.S.G.M.) 2.380 2.408 2.413 Density (g/cm3) 2.373 2.401 2.406 % Air Voids 3.0 1.5 1.9 % Voids in the Mineral Aggregate (V.M.A.) 14.5 13.4 12.9 % Voids Filled 79.1 89.0 85.5 % Theoretical Specific Gravity (%TSG) @ Ninit 89.4 91.2 90.8 % Theoretical Specific Gravity (%TSG) @ Nmax 98.1 99.6 99.2 % Dust to Asphalt Content Ratio 1.10 0.90 1.04 Theoretical Specific Gravity (T.S.G.) 2.455 2.444 2.459 Mean Texture Depth (M.T.D.) (g/cm3) 2.448 2.437 2.452 Coarse Aggregate Angularity (%) 62.8 ----- ----- Fine Aggregate Angularity (%) ----- ----- ----- Flat & Elongated Particles (%) ----- ----- ----- Sand Equivalent 57.8 ----- ----- L.A. Abrasion ----- ----- ----- Clay Lumps and Friable Particles (%) ----- ----- ----- 900962 Superpave Properties (Superpave Mix Design)
Design Bottom Lift As Placed
Top Lift As Placed
% Asphalt Content 4.69 4.76 4.75 Bulk Specific Gravity Mix (B.S.G.M.) 2.388 2.442 2.419 Density (g/cm3) 2.381 2.435 2.411 % Air Voids 4.0 1.8 1.7 % Voids in the Mineral Aggregate (V.M.A.) 13.9 12.1 12.9 % Voids Filled 71.6 85.5 86.9 % Theoretical Specific Gravity (%TSG) @ Ninit 85.5 88.7 88.0 % Theoretical Specific Gravity (%TSG) @ Nmax 97.7 99.5 99.9 % Dust to Asphalt Content Ratio 1.15 1.26 1.02 Theoretical Specific Gravity (T.S.G.) 2.486 2.486 2.460 Mean Texture Depth (M.T.D.) (g/cm3) 2.479 2.479 2.453 Coarse Aggregate Angularity (%) 91.5 ----- ----- Fine Aggregate Angularity (%) 44.0 ----- ----- Flat & Elongated Particles (%) 1.10 ----- ----- Sand Equivalent 59.5 ----- ----- L.A. Abrasion 51.6 ----- ----- Clay Lumps and Friable Particles (%) 0.1 ----- -----
* Measured gyratory void properties at Marshall mix design asphalt content and gradation.
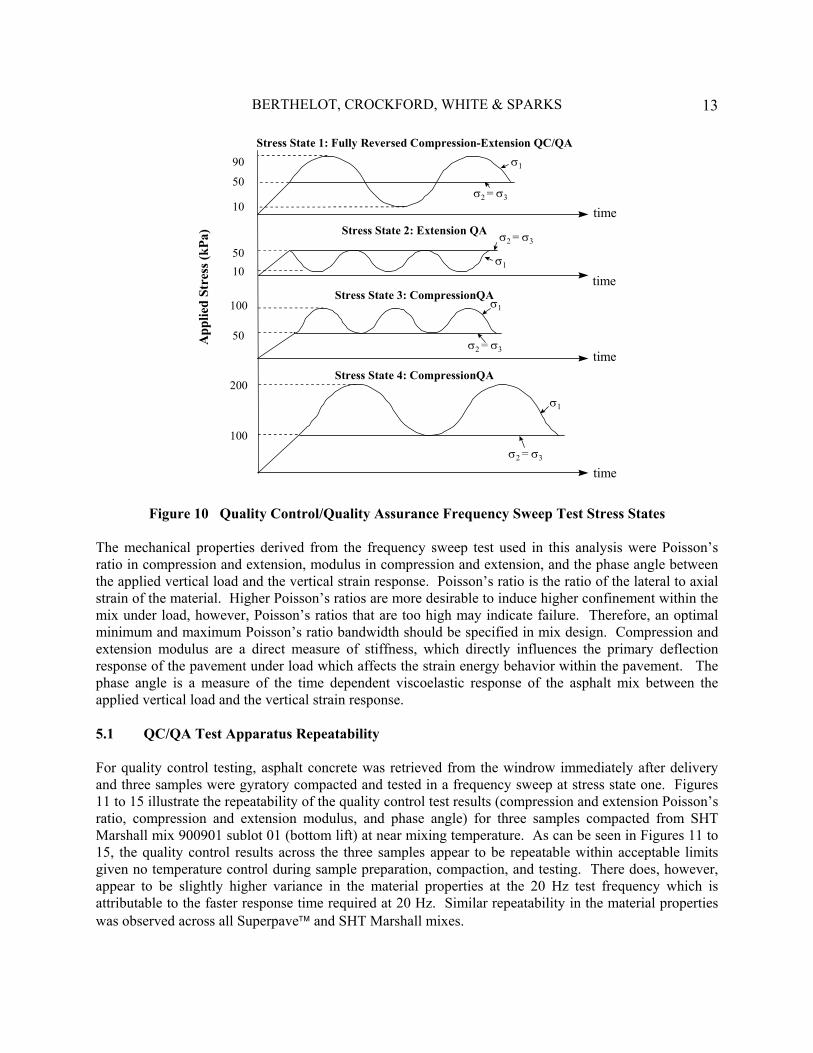
12 QC/QA EVALUATION OF SASKATCHEWAN SPS-9 ASPHALT MIXES 4.0 DESCRIPTION OF QC/QA TEST APPARATUS AND TESTING PROTOCOLS The QC/QA test apparatus is based on a Texas triaxial cell with full feedback instrumentation for vertical and horizontal displacements, axial loads, and confining pressure (Crockford [2]). The confined triaxial test cell was selected because of its ability to characterize all types of bound and unbound road materials (e.g. asphalt concrete, granular soils, subgrade soils, etc.) For operational efficiency and utility in the field, the test apparatus is designed with a small footprint and is light weight to make it easy to move by pickup or small trailer. The confinement chamber is designed to accommodate up to 150mm x 150mm Superpave gyratory compacted specimens without the need for sample trimming, resizing, reshaping, or glue mounting end caps to the sample. The confinement chamber is electronically controlled for ease of sample handling. Testing protocols employ full feedback control, user definable triaxial stress states, user definable load frequencies, and user definable load waveforms such as sinusoidal/haversine, ramp, trapezoidal, triangle, square, and sawtooth. The inherent user definable flexibility enables the test apparatus to be used for a wide spectrum of standard and customized tests including static or dynamic uniaxial and triaxial tests, frequency sweep, creep/recovery, dynamic modulus, and fatigue tests, either in load or displacement control. 5.0 SPS-9A TEST RESULTS During the construction of the SPS-9A site, the QC/QA test apparatus was used to perform mechanistic quality control and quality assurance testing of each asphalt mix in conjunction with SHT Marshall and Superpave volumetric quality control testing. The QC/QA testing protocol employed a frequency sweep test to measure the viscoelastic response of the asphalt concrete over a range of load frequencies: 0.02 to 0.2 Hz. to simulate parking area speeds; 0.2 to 2 Hz. to simulate street and intersection speeds; and 2 to 20 Hz. to simulate highway speeds. Quality assurance testing was performed on temperature conditioned samples and included a suite of four stress states illustrated in Figure 10. In the interest of speed and production proficiency, only stress state one (fully reversed compression and extension loading) was selected for quality control testing. It should be noted that the user may specify more stress states and/or more or less frequencies depending on the specific application and time constraints for testing on site. The average time for gyratory compaction and quality control testing at stress state one was approximately ten minutes per sample, and quality assurance testing took approximately 45 minutes per sample after compaction and temperature conditioning of the samples. As can be seen in Figure 10, the frequency sweep test starts with an applied hydrostatic stress state that is increased uniformly throughout the sample by increasing the confining pressure (σ2 & σ3) and the axial (σ1) stress simultaneously. The four stress states used in the frequency sweep test include one fully reversed compression-extension test cycled from 40 kPa extension to 90 kPa compression, one extension test cycled between 10 kPa and 50 kPa, one compression test cycled from 50 to 100 kPa, and one compression test cycled from 100 kPa to 200 kPa. During a compression test, the axial stress is greater than the confining stress throughout the duration of the test. During an extension test, the confining stress is greater than the axial stress throughout the duration of the test and is analogous to a direct tension test without the need to glue end caps on the sample. During a fully reversed test, the axial stress alternates from being greater than and less than the confining stress. The fully reversed stress state was assigned as stress state one, and was used for both quality assurance and quality control testing.
BERTHELOT, CROCKFORD, WHITE & SPARKS 13
σ2 = σ3
time
50
10
90Stress State 1: Fully Reversed Compression-Extension QC/QA
Stress State 2: Extension QA
Stress State 3: CompressionQA
Stress State 4: CompressionQA
5010
50
100
100
200
σ2 = σ3
time
σ2 = σ3 time
σ2 = σ3
time
σ1
σ1
App
lied
Stre
ss (k
Pa)
σ1
σ1
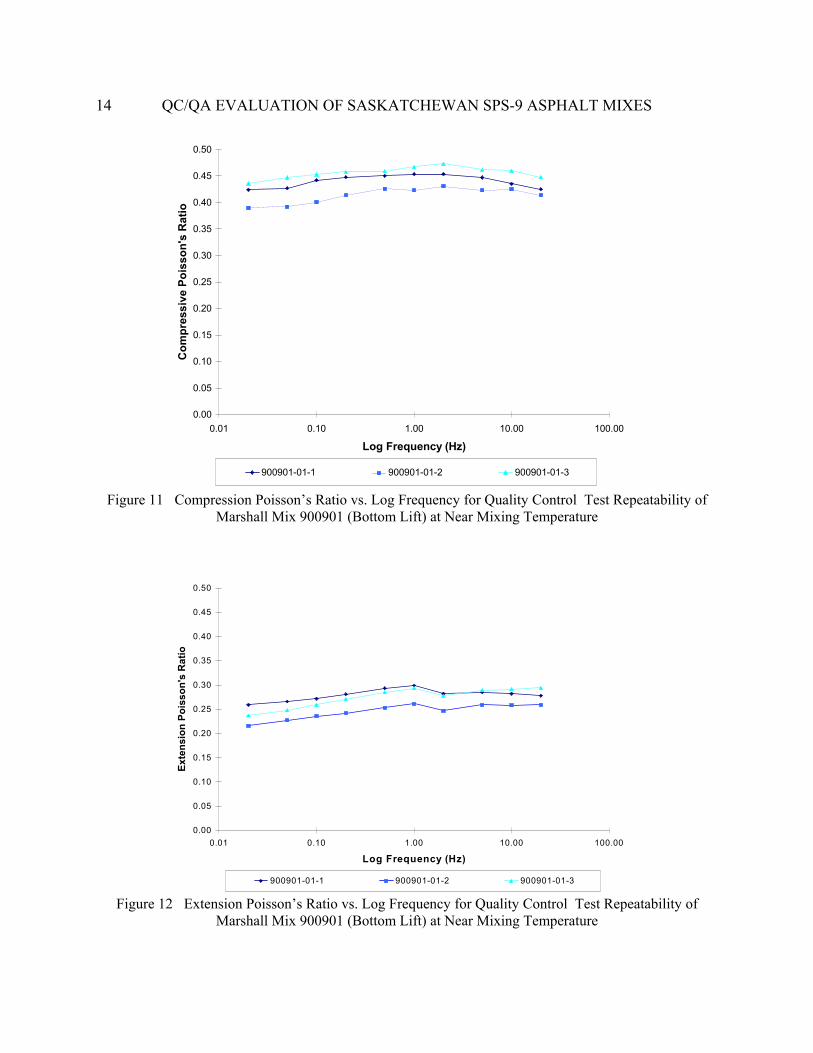
Figure 10 Quality Control/Quality Assurance Frequency Sweep Test Stress States The mechanical properties derived from the frequency sweep test used in this analysis were Poisson’s ratio in compression and extension, modulus in compression and extension, and the phase angle between the applied vertical load and the vertical strain response. Poisson’s ratio is the ratio of the lateral to axial strain of the material. Higher Poisson’s ratios are more desirable to induce higher confinement within the mix under load, however, Poisson’s ratios that are too high may indicate failure. Therefore, an optimal minimum and maximum Poisson’s ratio bandwidth should be specified in mix design. Compression and extension modulus are a direct measure of stiffness, which directly influences the primary deflection response of the pavement under load which affects the strain energy behavior within the pavement. The phase angle is a measure of the time dependent viscoelastic response of the asphalt mix between the applied vertical load and the vertical strain response. 5.1 QC/QA Test Apparatus Repeatability For quality control testing, asphalt concrete was retrieved from the windrow immediately after delivery and three samples were gyratory compacted and tested in a frequency sweep at stress state one. Figures 11 to 15 illustrate the repeatability of the quality control test results (compression and extension Poisson’s ratio, compression and extension modulus, and phase angle) for three samples compacted from SHT Marshall mix 900901 sublot 01 (bottom lift) at near mixing temperature. As can be seen in Figures 11 to 15, the quality control results across the three samples appear to be repeatable within acceptable limits given no temperature control during sample preparation, compaction, and testing. There does, however, appear to be slightly higher variance in the material properties at the 20 Hz test frequency which is attributable to the faster response time required at 20 Hz. Similar repeatability in the material properties was observed across all Superpave and SHT Marshall mixes.
14 QC/QA EVALUATION OF SASKATCHEWAN SPS-9 ASPHALT MIXES
0.00
0.05
0.10
0.15
0.20
0.25
0.30
0.35
0.40
0.45
0.50
0.01 0.10 1.00 10.00 100.00
Log Frequency (Hz)
Com
pres
sive
Poi
sson
's R
atio
900901-01-1 900901-01-2 900901-01-3
Figure 11 Compression Poisson’s Ratio vs. Log Frequency for Quality Control Test Repeatability of Marshall Mix 900901 (Bottom Lift) at Near Mixing Temperature
0.00
0.05
0.10
0.15
0.20
0.25
0.30
0.35
0.40
0.45
0.50
0.01 0.10 1.00 10.00 100.00
Log Frequency (Hz)
Exte
nsio
n Po
isso
n's
Rat
io
900901-01-1 900901-01-2 900901-01-3
Figure 12 Extension Poisson’s Ratio vs. Log Frequency for Quality Control Test Repeatability of Marshall Mix 900901 (Bottom Lift) at Near Mixing Temperature
BERTHELOT, CROCKFORD, WHITE & SPARKS 15
0
10
20
30
40
50
60
70
80
90
100
110
120
130
140
150
0.01 0.10 1.00 10.00 100.00
Log Frequency (Hz)
Com
pres
sion
Mod
ulus
(MPa
)
900901-01-1 900901-01-2 900901-01-3
Figure 13 Compression Modulus vs. Log Frequency for Quality Control Test Repeatability of Marshall Mix 900901 (Bottom Lift) at Near Mixing Temperature
0
10
20
30
40
50
0.01 0.10 1.00 10.00 100.00
Log Frequency (Hz)
Ext
ensi
on M
odul
us (M
Pa)
900901-01-1 900901-01-2 900901-01-3
Figure 14 Extension Modulus vs. Log Frequency for Quality Control Test Repeatability of Marshall Mix 900901 (Bottom Lift) at Near Mixing Temperature
16 QC/QA EVALUATION OF SASKATCHEWAN SPS-9 ASPHALT MIXES
0
10
20
30
40
50
60
70
80
90
0.01 0.10 1.00 10.00 100.00
Log Frequency (Hz)
Phas
e A
ngle
(Deg
rees
)
900901-01-1 900901-01-2 900901-01-3
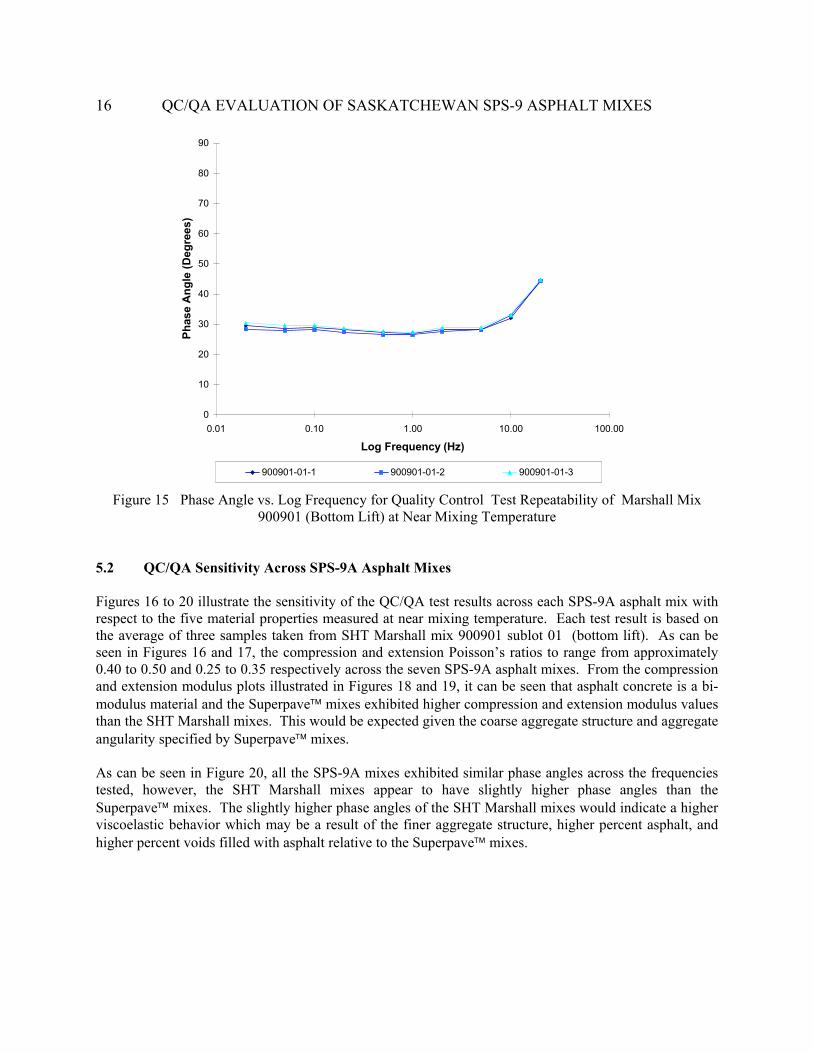
Figure 15 Phase Angle vs. Log Frequency for Quality Control Test Repeatability of Marshall Mix 900901 (Bottom Lift) at Near Mixing Temperature
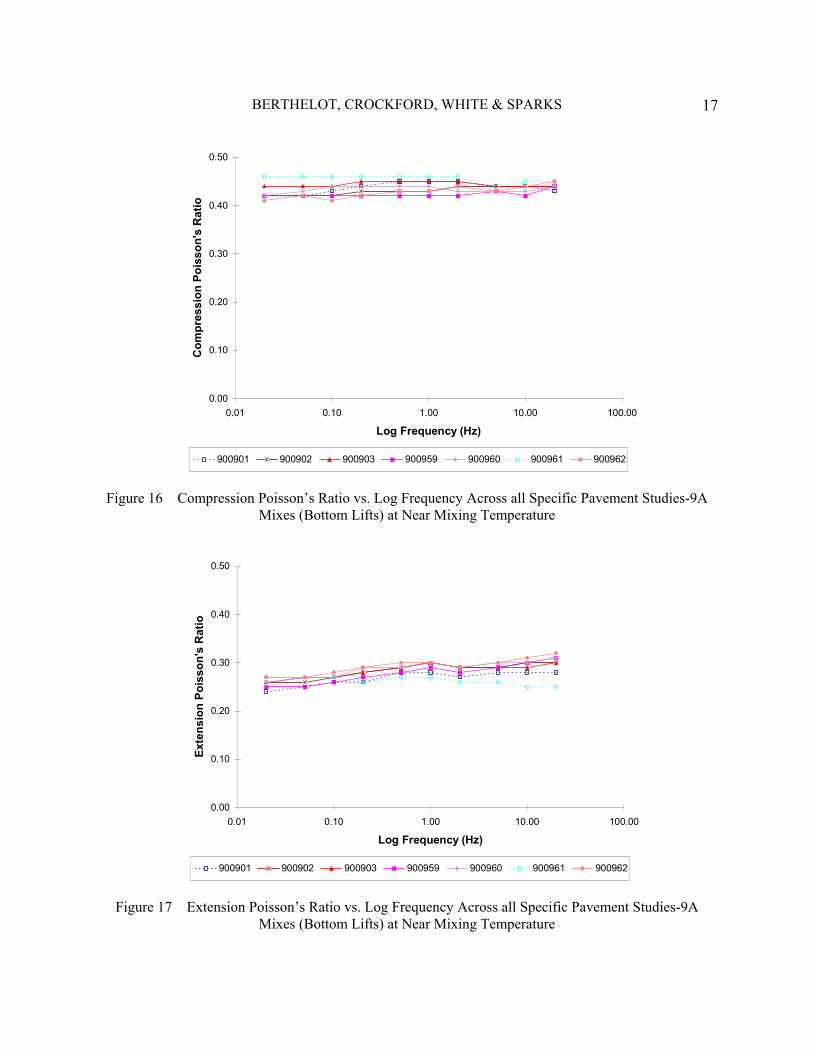
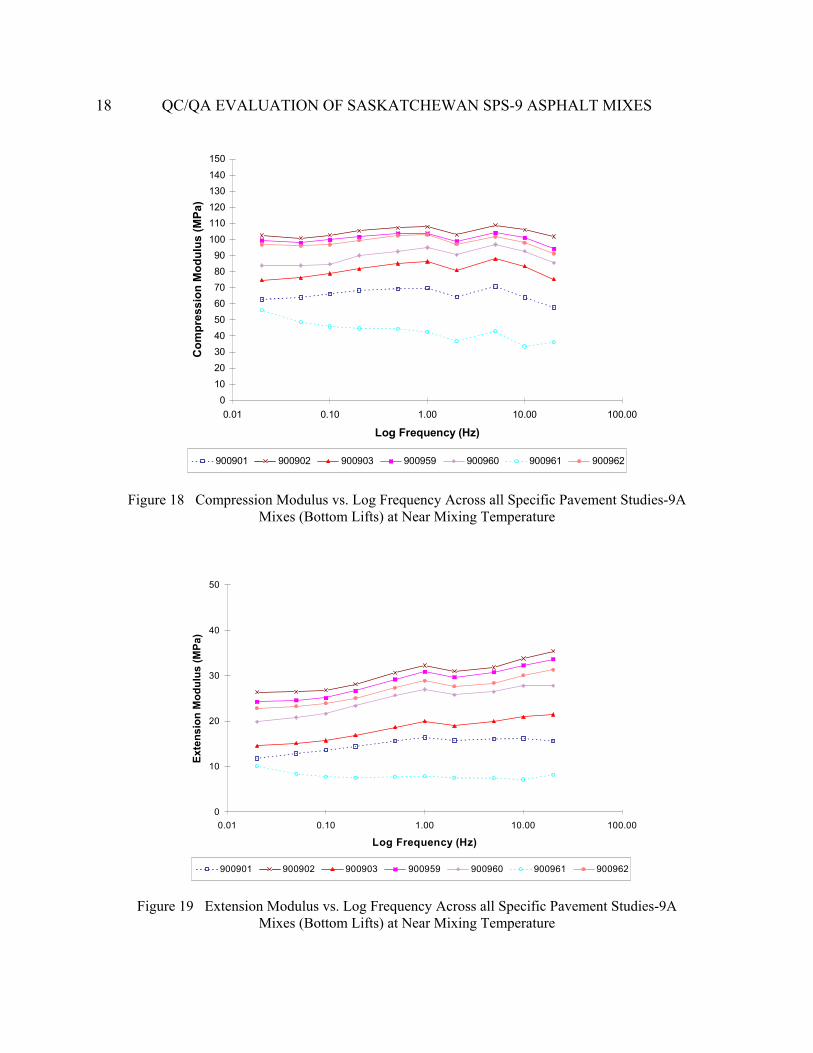
5.2 QC/QA Sensitivity Across SPS-9A Asphalt Mixes Figures 16 to 20 illustrate the sensitivity of the QC/QA test results across each SPS-9A asphalt mix with respect to the five material properties measured at near mixing temperature. Each test result is based on the average of three samples taken from SHT Marshall mix 900901 sublot 01 (bottom lift). As can be seen in Figures 16 and 17, the compression and extension Poisson’s ratios to range from approximately 0.40 to 0.50 and 0.25 to 0.35 respectively across the seven SPS-9A asphalt mixes. From the compression and extension modulus plots illustrated in Figures 18 and 19, it can be seen that asphalt concrete is a bi-modulus material and the Superpave mixes exhibited higher compression and extension modulus values than the SHT Marshall mixes. This would be expected given the coarse aggregate structure and aggregate angularity specified by Superpave mixes. As can be seen in Figure 20, all the SPS-9A mixes exhibited similar phase angles across the frequencies tested, however, the SHT Marshall mixes appear to have slightly higher phase angles than the Superpave mixes. The slightly higher phase angles of the SHT Marshall mixes would indicate a higher viscoelastic behavior which may be a result of the finer aggregate structure, higher percent asphalt, and higher percent voids filled with asphalt relative to the Superpave mixes.
BERTHELOT, CROCKFORD, WHITE & SPARKS 17
0.00
0.10
0.20
0.30
0.40
0.50
0.01 0.10 1.00 10.00 100.00
Log Frequency (Hz)
Com
pres
sion
Poi
sson
's R
atio
900901 900902 900903 900959 900960 900961 900962
Figure 16 Compression Poisson’s Ratio vs. Log Frequency Across all Specific Pavement Studies-9A
Mixes (Bottom Lifts) at Near Mixing Temperature
0.00
0.10
0.20
0.30
0.40
0.50
0.01 0.10 1.00 10.00 100.00
Log Frequency (Hz)
Exte
nsio
n Po
isso
n's
Rat
io
900901 900902 900903 900959 900960 900961 900962
Figure 17 Extension Poisson’s Ratio vs. Log Frequency Across all Specific Pavement Studies-9A
Mixes (Bottom Lifts) at Near Mixing Temperature
18 QC/QA EVALUATION OF SASKATCHEWAN SPS-9 ASPHALT MIXES
0102030405060708090
100110120130140150
0.01 0.10 1.00 10.00 100.00
Log Frequency (Hz)
Com
pres
sion
Mod
ulus
(MPa
)
900901 900902 900903 900959 900960 900961 900962
Figure 18 Compression Modulus vs. Log Frequency Across all Specific Pavement Studies-9A
Mixes (Bottom Lifts) at Near Mixing Temperature
0
10
20
30
40
50
0.01 0.10 1.00 10.00 100.00
Log Frequency (Hz)
Exte
nsio
n M
odul
us (M
Pa)
900901 900902 900903 900959 900960 900961 900962
Figure 19 Extension Modulus vs. Log Frequency Across all Specific Pavement Studies-9A
Mixes (Bottom Lifts) at Near Mixing Temperature
BERTHELOT, CROCKFORD, WHITE & SPARKS 19
0
10
20
30
40
50
60
70
80
90
0.01 0.10 1.00 10.00 100.00
Log Frequency (Hz)
Phas
e A
ngle
(Deg
rees
)
900961 900902 900903 900959 900960 900901 900962
Figure 20 Phase Angle vs. Log Frequency Across all Specific Pavement Studies-9A
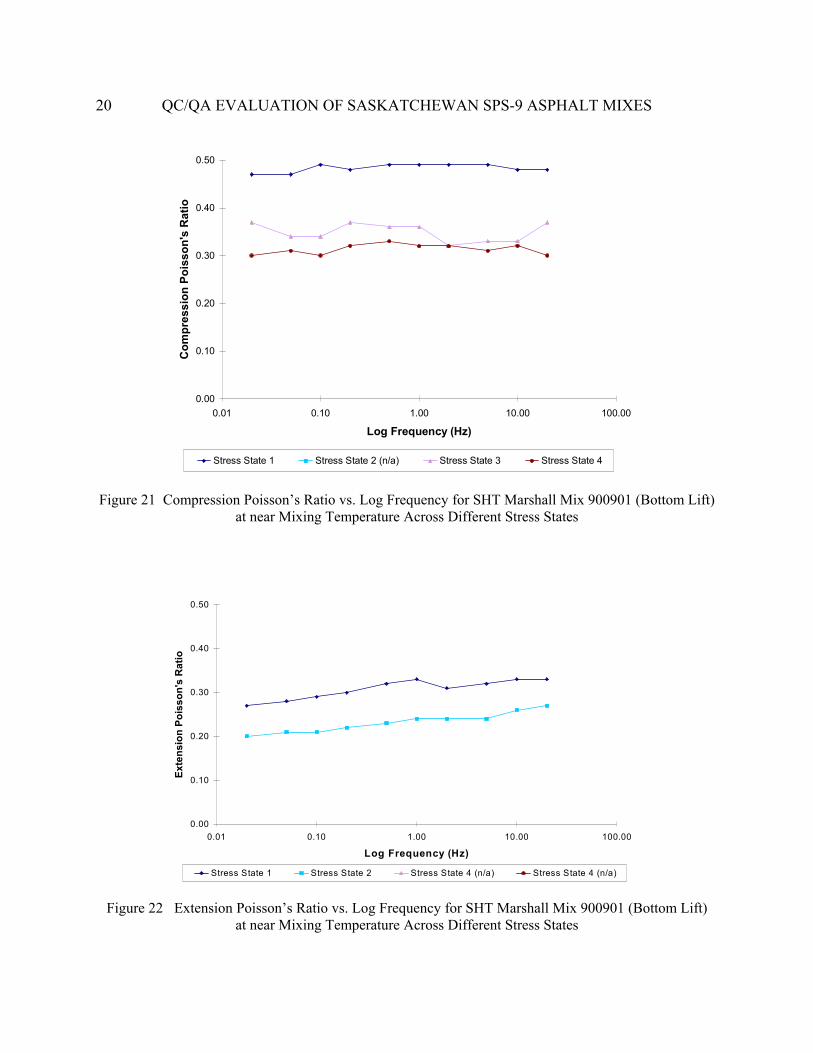
Mixes (Bottom Lifts) at Near Mixing Temperature 5.3 QC/QA Sensitivity to Stress State To demonstrate the sensitivity of the QC/QA test results to applied stress state, quality assurance testing was conducted on samples from each asphalt mix sublot at the four stress states illustrated in Figure 10. Figures 21 to 25 illustrate the mechanical behavior of SHT Marshall mix 900901 sublot 01 (bottom lift) as a function of applied stress state. It should be noted that compression material responses cannot be measured during portions of the tests where only extension stress states are applied, and similarly, extension material responses cannot be measured during portions of the tests where only compression stress states are applied. As can be seen in Figures 21 and 22 respectively, the compression Poisson’s ratio decreased with increasing stress state and the extension Poisson’s ratio was higher for the fully reversed loading in stress state one as compared to the pure extension stress state of the same magnitude as specified by stress state two. As can be seen in Figures 23 and 24 respectively, the compression modulus increased with increasing stress state and the extension modulus was higher for the fully reversed loading in stress state one as compared to the pure extension stress state of the same magnitude as specified by stress state two. As can be seen in Figure 25, the phase angle was the same for stress states one and two, and similarly for stress states three and four. In addition, the phase angle under stress state one and two was greater than that measured under stress states three and four which indicates a lower viscoelastic response under stress states of pure compression as compared to fully reversed and pure extension stress states.
20 QC/QA EVALUATION OF SASKATCHEWAN SPS-9 ASPHALT MIXES
0.00
0.10
0.20
0.30
0.40
0.50
0.01 0.10 1.00 10.00 100.00
Log Frequency (Hz)
Com
pres
sion
Poi
sson
's R
atio
Stress State 1 Stress State 2 (n/a) Stress State 3 Stress State 4
Figure 21 Compression Poisson’s Ratio vs. Log Frequency for SHT Marshall Mix 900901 (Bottom Lift)
at near Mixing Temperature Across Different Stress States
0.00
0.10
0.20
0.30
0.40
0.50
0.01 0.10 1.00 10.00 100.00
Log Frequency (Hz)
Exte
nsio
n Po
isso
n's
Rat
io
Stress State 1 Stress State 2 Stress State 4 (n/a) Stress State 4 (n/a)
Figure 22 Extension Poisson’s Ratio vs. Log Frequency for SHT Marshall Mix 900901 (Bottom Lift)
at near Mixing Temperature Across Different Stress States
BERTHELOT, CROCKFORD, WHITE & SPARKS 21
0
100
200
300
400
500
0.01 0.10 1.00 10.00 100.00
Log Frequency (Hz)
Com
pres
sion
Mod
ulus
(MPa
)
Stress State 1 Stress State 2 (n/a) Stress State 3 Stress State 4
Figure 23 Compression Modulus vs. Log Frequency for SHT Marshall Mix 900901 (Bottom Lift)
at near Mixing Temperature Across Different Stress States
0
5
10
15
20
25
0.01 0.10 1.00 10.00 100.00
Log Frequency (Hz)
Exte
nsio
n M
odul
us (M
Pa)
Stress State 1 Stress State 2 Stress State 3 (n/a) Stress State 4 (n/a)
Figure 24 Extension Modulus vs. Log Frequency for SHT Marshall Mix 900901 (Bottom Lift)
at near Mixing Temperature Across Different Stress States
22 QC/QA EVALUATION OF SASKATCHEWAN SPS-9 ASPHALT MIXES
0
10
20
30
40
50
60
70
80
90
0.01 0.10 1.00 10.00 100.00
Log Frequency (Hz)
Phas
e A
ngle
(Deg
rees
)
Stress State 1 Stress State 2 Stress State 3 Stress State 4
Figure 25 Phase Angle vs. Log Frequency for SHT Marshall Mix 900901 (Bottom Lift)
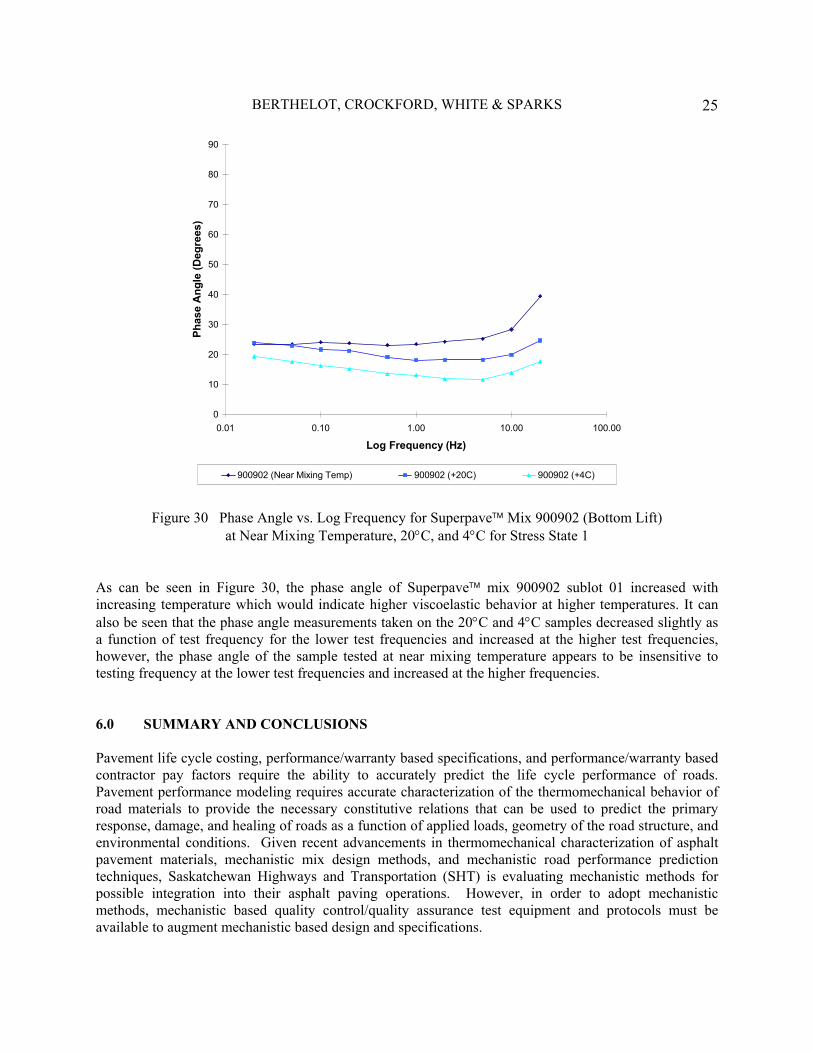
at near Mixing Temperature Across Different Stress States 5.4 QC/QA Sensitivity to Temperature Because asphalt cement is a thermoviscoelastoplastic material, the influence of temperature on asphalt mixes must be quantified. To evaluate the sensitivity of the QC/QA test results to temperature, samples from each asphalt mix were tested at near mixing temperature, 20°C, and 4°C. Samples from each asphalt mix could also have been moisture and freeze-thaw conditioned, however, time limitations during the project prohibited conducting these additional conditioning tests. To demonstrate the sensitivity of the QC/QA test results to temperature, Figures 26 to 30 illustrate the material properties of three Superpave mix 900902 sublot 01 samples (bottom lift). Each sample was tested at one of three temperatures: near mixing temperature, 20°C, and 4°C, under stress state one. As can be seen in Figures 26 and 27, the compression and extension Poisson’s ratios increased with increasing temperature. It can also be seen that the Poisson’s ratio measurements taken on the 20°C and 4°C samples decreased as a function of test frequency, however, the sample tested at near mixing temperature appears to be insensitive to testing frequency. This would imply that the compression and extension Poison’s ratios of asphalt mixes at mixing temperature could be tested at one frequency between 0.02 and 20 Hz and yield the same result. As can be seen in Figures 28 and 29, the compression and extension modulus decreased with increasing temperature. It can also be seen that the modulus measurements taken on the 20°C and 4°C samples increased as a function of test frequency, however, the sample tested at near mixing temperature appears to be insensitive to testing frequency. This may imply that the compression and extension modulus of asphalt mixes at mixing temperature could be tested at one frequency between 0.02 and 20 Hz and yield the same result.
Figure 26 Compression Poisson’s Ratio vs. Log Frequency for Superpave Mix 900902 (Bottom Lift) at Near Mixing Temperature, 20°C, and 4°C for Stress State 1
Figure 27 Extension Poisson’s Ratio vs. Log Frequency for Superpave Mix 900902 (Bottom Lift) at Near Mixing Temperature, 20°C, and 4°C for Stress State 1
24 QC/QA EVALUATION OF SASKATCHEWAN SPS-9 ASPHALT MIXES
Figure 30 Phase Angle vs. Log Frequency for Superpave Mix 900902 (Bottom Lift)
at Near Mixing Temperature, 20°C, and 4°C for Stress State 1
As can be seen in Figure 30, the phase angle of Superpave mix 900902 sublot 01 increased with increasing temperature which would indicate higher viscoelastic behavior at higher temperatures. It can also be seen that the phase angle measurements taken on the 20°C and 4°C samples decreased slightly as a function of test frequency for the lower test frequencies and increased at the higher test frequencies, however, the phase angle of the sample tested at near mixing temperature appears to be insensitive to testing frequency at the lower test frequencies and increased at the higher frequencies. 6.0 SUMMARY AND CONCLUSIONS Pavement life cycle costing, performance/warranty based specifications, and performance/warranty based contractor pay factors require the ability to accurately predict the life cycle performance of roads. Pavement performance modeling requires accurate characterization of the thermomechanical behavior of road materials to provide the necessary constitutive relations that can be used to predict the primary response, damage, and healing of roads as a function of applied loads, geometry of the road structure, and environmental conditions. Given recent advancements in thermomechanical characterization of asphalt pavement materials, mechanistic mix design methods, and mechanistic road performance prediction techniques, Saskatchewan Highways and Transportation (SHT) is evaluating mechanistic methods for possible integration into their asphalt paving operations. However, in order to adopt mechanistic methods, mechanistic based quality control/quality assurance test equipment and protocols must be available to augment mechanistic based design and specifications.
26 QC/QA EVALUATION OF SASKATCHEWAN SPS-9 ASPHALT MIXES This research evaluated a prototype electronic triaxial QC/QA test apparatus which is under development by Industrial Process Controls of Australia and TSL of Texas. The prototype QC/QA test apparatus was used for the first time to perform on site QC/QA testing of seven asphalt mixes placed in the SHT SPS-9A test section on Highway 16 near Radisson, Saskatchewan in August 1996. Quality control/quality assurance testing employed frequency sweep tests over a range of frequencies of 0.02 to 20 Hz. on gyratory compacted specimens. Quality control tests were conducted on samples at near mixing temperature and quality assurance testing was performed on samples at near mixing temperature and samples conditioned at 20°C and 4°C. The results of this field evaluation showed that the QC/QA test apparatus and testing protocols can measure fundamental time, temperature, and stress dependent thermomechanical properties of asphalt mixes. The QC/QA test apparatus was also found to be user friendly and suitable for use in the field. Because of thermal effects on the mechanical behavior of asphalt mixes as shown in this research, future research will integrate a temperature control chamber with the QC/QA test frame. Further testing will also include more detailed sensitivity analysis of the QC/QA test results with respect to changes in the volumetric properties of asphalt mixes in an attempt to begin to bridge the gap between currently specified volumetric based QC/QA and mechanistic based QC/QA. DISCLAIMER
The viewpoints expressed herein are those of the authors, and are not necessarily endorsed by the agencies involved with this research. 7.0 REFERENCES 1. Lytton, R.L.. “NCHRP 9-7 Quarterly Report”. Texas A&M University, (1996). 2. Crockford, W. W. “Rapid Triaxial Testing Approach to Flexible Pavement QC/QA”. TSL