+ All Categories
Home > Documents > Medi-Cal Managed Care Performance Dashboard Sept · PDF fileMedi-Cal Managed Care Performance...

Medi-Cal Managed Care Performance Dashboard Sept · PDF fileMedi-Cal Managed Care Performance...

Date post: 23-Feb-2018
Category:
Upload: trinhdieu
View: 219 times
Download: 3 times
Share this document with a friend
14
Medi-Cal Managed Care Performance Dashboard Glossary Released September 14, 2017 Glossary Page 1 of 3 Quarterly Release Notes Aid Codes M3 and M4 have been reassigned from the ACA population group to the OTHER population group. This reassignment represents a significant difference between this dashboard and previous versions. The label “MO-,” which stands for Medi-Cal Only, has been added by each population type when the metric compares DUAL membership against different aid code populations. Percentage metrics are displayed as whole numbers. Charts may add up to 99%, 100%, or 101%. Population Aid Code Groups Affordable Care Act (ACA): This population consists of the following Adult Expansion aid codes: M1, M2, L1, and 7U. Optional Targeted Low Income Children (OTLIC): This population consists of the following OTLIC aid codes: 2P, 2R, 2S, 2T, 2U, 5C, 5D, E2, E5, E6, E7, H1, H2, H3, H4, H5, M5, T0, T1, T2, T3, T4, T5, T6, T7, T8, and T9. Seniors and Persons with Disabilities (SPD): This population consists of the following SPD aid codes: 10, 13, 14, 16, 17, 1E, 1H, 20, 23, 24, 26, 27, 2E, 2H, 36, 60, 63, 64, 66, 67, 6A, 6C, 6E, 6G, 6H, 6J, 6N, 6P, 6R, 6V, 6W, 6X, 6Y, C1, C2, C3, C4, C7, C8, D2, D3, D4, D5, D6, and D7. Other Populations (OTHER): This population consists of all other aid codes not mentioned above. Medicare Status DUAL: This population consists of any Medi-Cal eligible member who has active Medicare coverage. Active Medicare coverage means one or more of the following Medicare portions are active: Part A, B, or D. Dual members are not identified by an aid code.
Transcript

Medi-Cal Managed Care Performance Dashboard Glossary

Released September 14, 2017

Glossary Page 1 of 3

Quarterly Release Notes

Aid Codes M3 and M4 have been reassigned from the ACA population group to the OTHER population group.

This reassignment represents a significant difference between this dashboard and previous versions.

The label “MO-,” which stands for Medi-Cal Only, has been added by each population type when the metric

compares DUAL membership against different aid code populations.

Percentage metrics are displayed as whole numbers. Charts may add up to 99%, 100%, or 101%.

Population Aid Code Groups

Affordable Care Act (ACA): This population consists of the following Adult Expansion aid codes: M1, M2, L1, and 7U.

Optional Targeted Low Income Children (OTLIC): This population consists of the following OTLIC aid codes: 2P, 2R,

2S, 2T, 2U, 5C, 5D, E2, E5, E6, E7, H1, H2, H3, H4, H5, M5, T0, T1, T2, T3, T4, T5, T6, T7, T8, and T9.

Seniors and Persons with Disabilities (SPD): This population consists of the following SPD aid codes: 10, 13, 14, 16,

17, 1E, 1H, 20, 23, 24, 26, 27, 2E, 2H, 36, 60, 63, 64, 66, 67, 6A, 6C, 6E, 6G, 6H, 6J, 6N, 6P, 6R, 6V, 6W, 6X, 6Y, C1,

C2, C3, C4, C7, C8, D2, D3, D4, D5, D6, and D7.

Other Populations (OTHER): This population consists of all other aid codes not mentioned above.

Medicare Status

DUAL: This population consists of any Medi-Cal eligible member who has active Medicare coverage. Active Medicare coverage means one or more of the following Medicare portions are active: Part A, B, or D. Dual members are not identified by an aid code.

Medi-Cal Managed Care Performance Dashboard Glossary

Released September 14, 2017

Glossary Page 2 of 3

Non-Dual: This population consists of any Medi-Cal eligible member who is Medi-Cal Only (MO) and has no active Medicare coverage. Aid code groups are displayed as Medi-Cal only for the following measures: Utilization, Grievance and Appeals, and State Fair Hearings.

Utilization Measures for Certified Eligible Managed Care Members

Utilization is tracked by aid code population and Medicare status. Utilization metrics displayed by aid code group is Medi-

Cal Only (MO) and does not include Medicare coverage.

Emergency Room (ER) Visits: This measure captures the number of ER visits per month. The results from this measure

are used to calculate ER visits with an inpatient admission. A visit consists of a unique combination between provider,

member. and date of service. This measure is displayed per 1,000 member months.

Emergency Room (ER) Visits with an Inpatient (IP) Admission: This measure captures the number of ER visits that

resulted in an inpatient admission per month. The results of this measure are a subset of ER visits and IP admissions.

The service date and member identification are linked to create this measure. An admission consists of a unique

combination between member and date of admission to a facility. This measure is displayed per 1,000 member months.

Inpatient (IP) Admissions: This measure captures the number of Inpatient Admissions per month. The results from this

measure are used to calculate ER visits with an inpatient admission. An admission consists of a unique combination

between member and date of admission to a facility. This measure is displayed per 1,000 member months.

Outpatient (OP) Visits: This measure captures the number of OP visits per month. A visit consists of a unique

combination between provider, member, and date of service. This measure is displayed per 1,000 member months.

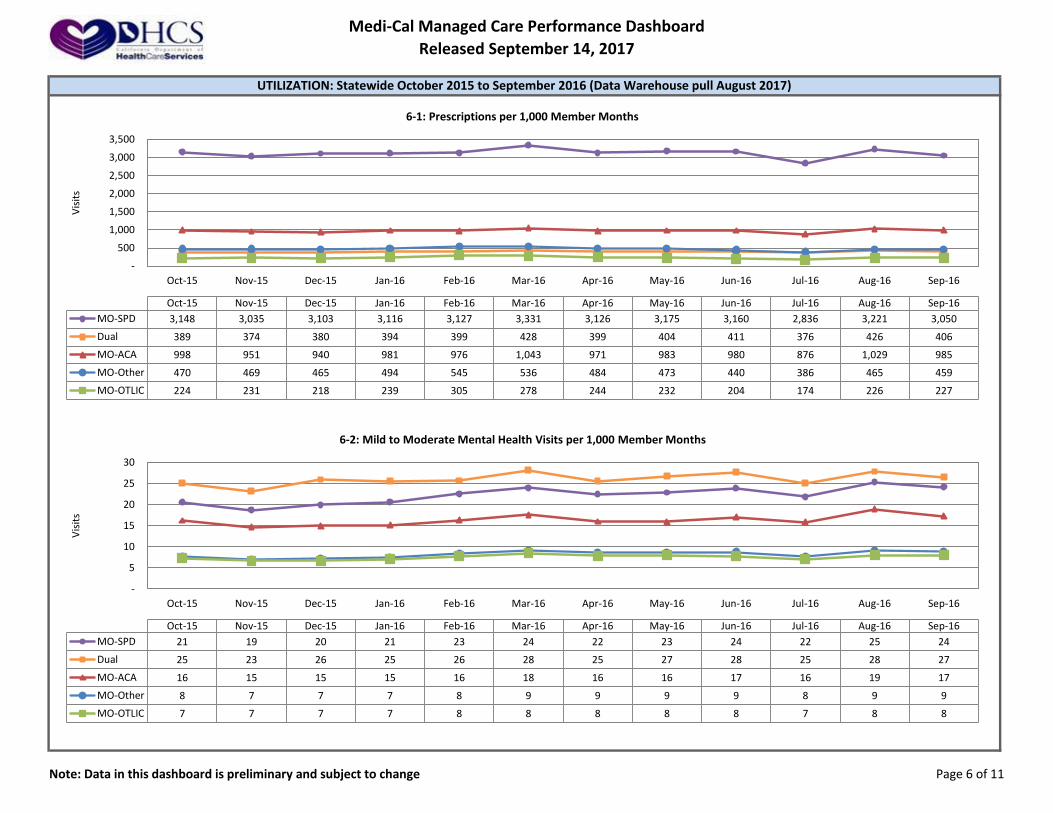
Prescriptions: This measure captures the number of prescriptions per month. A prescription consists of a unique

combination between National Drug Code, member, and date of service. This measure is displayed per 1,000 member

months.

Medi-Cal Managed Care Performance Dashboard Glossary

Released September 14, 2017

Glossary Page 3 of 3

Mild to Moderate Mental Health Visits: This measure captures the number of visits per month related to selected

Psychotherapy Services and Diagnostic Evaluations. The selected procedure codes aim to capture mild to moderate mental health visits. A visit consists of a unique combination between provider, member, and date of

service. This measure is displayed per 1,000 member months.

Grievance, Appeals and State Fair Hearings

Grievance and Appeals: Grievance and Appeals data is plan reported. Metrics displayed by aid code group is Medi-Cal

Only (MO) and does not include Medicare coverage.

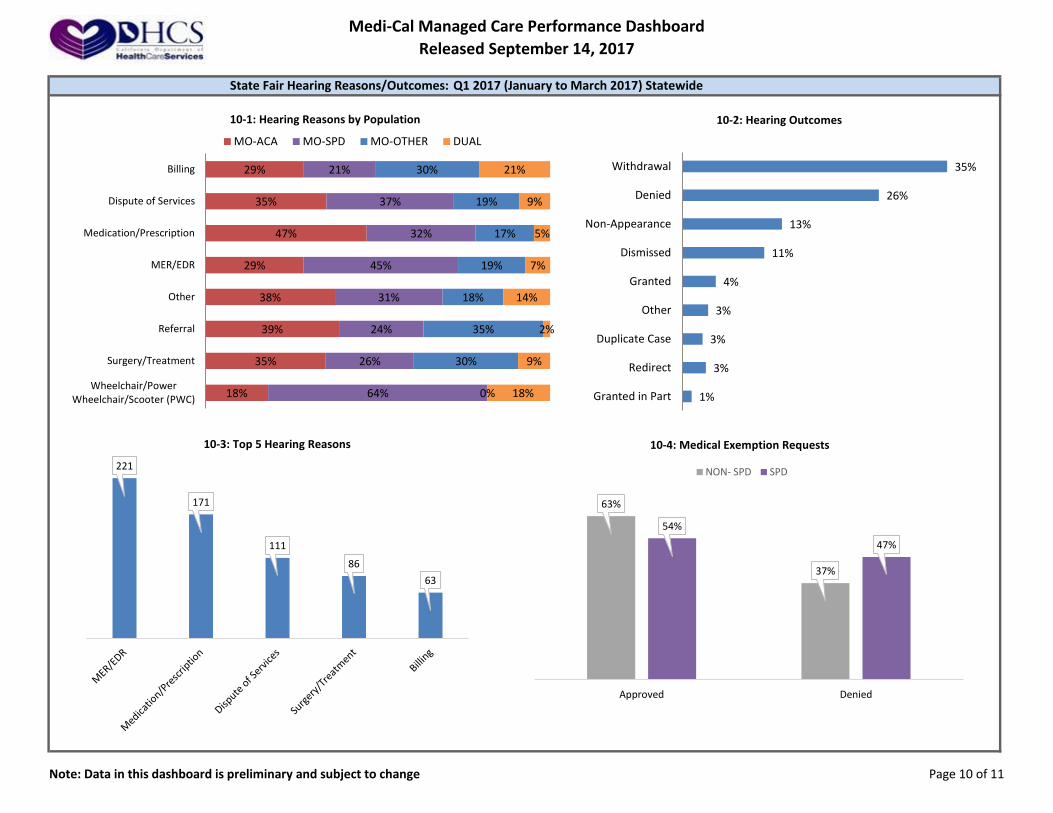
State Fair Hearings: Hearing data is submitted through the Department of Social Services. Metrics displayed by aid code

group is Medi-Cal Only (MO) and does not include Medicare coverage.

Medi-Cal Managed Care Performance Dashboard

Released September 14, 2017

Other Medi-Cal Programs

0%10%20%30%40%50%60%70%80%90%

100%

Per

cen

tage

Apr-16 May-16 Jun-16 Jul-16 Aug-16 Sep-16 Oct-16 Nov-16 Dec-16 Jan-17 Feb-17 Mar-17

OTLIC 1,163,349 1,171,672 1,190,049 1,188,318 1,190,158 1,193,625 1,208,067 1,214,386 1,211,452 1,194,476 1,194,996 1,198,913

SPD 1,551,771 1,548,733 1,551,699 1,551,594 1,566,921 1,565,233 1,567,162 1,563,774 1,570,003 1,595,648 1,613,945 1,617,877

ACA 2,963,445 3,002,382 3,037,042 3,013,263 3,012,359 3,015,635 3,054,097 3,077,406 3,094,880 3,064,869 3,077,708 3,097,027

OTHER 4,861,475 4,855,196 4,887,495 4,915,719 4,954,082 4,940,270 4,964,883 4,949,224 4,943,594 4,920,819 4,934,498 4,935,914

1-1: Managed Care Enrollment by Aid Population

Managed Care Total 10,540,040 10,577,983 10,666,285 10,668,894 10,723,520 10,714,763 10,794,209 10,804,790 10,819,929 10,775,812 10,821,147 10,849,731

Medi-Cal Type Apr-16 May-16 Jun-16 Jul-16 Aug-16 Sep-16 Oct-16 Nov-16 Dec-16 Jan-17 Feb-17 Mar-17

Fee-for-Service 3,059,610 3,048,263 2,958,105 2,860,607 2,806,742 2,756,571 2,680,452 2,694,482 2,707,179 2,730,853 2,659,646 2,607,959

Speciality Plans 20,879 21,022 21,080 21,008 21,025 20,991 21,078 21,166 21,199 21,544 21,662 21,803

Medi-Cal Program Total 13,620,529 13,647,268 13,645,470 13,550,509 13,551,287 13,492,325 13,495,739 13,520,438 13,548,307 13,528,209 13,502,455 13,479,493

CMC COHS GMC RM Two-Plan

OTLIC 0 295,181 141,057 45,597 717,078

SPD 112,156 329,869 158,181 34,559 983,112

ACA 1 627,198 345,182 120,925 2,003,721

OTHER 2,460 948,988 528,343 187,941 3,268,182

0%10%20%30%40%50%60%70%80%90%

100%

Per

cen

tage

1-2: Aid Population by Plan Model

80%

20%

1-3: Medi-Cal ManagedCare vs. FFS/Specialty

MC FFS/Spec.

64%59%

48% 50%

57%53%

60% 58%

51%57% 58%

60%

27%33%

46% 44%

32%38%

30% 32%40% 36% 35% 33%

9% 8% 6% 6%11% 9% 10% 9% 10%

7% 7% 7%

1-4: Choice and Auto-Assignment Rates

Choice Auto-Assigned Passive + Prior

Note: Data in this dashboard is preliminary and subject to change Page 1 of 11

CERTIFIED ELIGIBLE ENROLLMENT: As of March 2017 (Data Warehouse pull August 2017)

Medi-Cal Managed Care Performance Dashboard

Released September 14, 2017

Note: Data in this dashboard is preliminary and subject to change Page 2 of 11

CERTIFIED ELIGIBLE ENROLLMENT: Managed Care demographics for March 2017 (Data Warehouse pull August 2017)

29%

45%

15%

11%

ACA

OTHER

SPD

OTLIC

2-1: Aid Groups "All Managed Care"

Age < 1 Ages 1-5 Ages 6-11 Ages 12-17 Ages 18-20 Ages 21-44 Ages 45-64 Ages 65+

Male 89,802 629,836 807,417 726,871 282,537 1,310,193 900,009 322,797

Female 86,145 601,839 769,362 696,406 295,272 1,748,429 1,059,104 523,712

0%

20%

40%

60%

80%

100%

Per

cen

tage

2-2: Age by Gender "All Managed Care"

2%

11%

15%

13%

5%

28%

18%

8%

Age < 1

Ages 1-5

Ages 6-11

Ages 12-17

Ages 18-20

Ages 21-44

Ages 45-64

Ages 65+

2-3: Age Cohorts "All Managed Care"

47%

21%

13%

12%

8%

Hispanic

White

Asian/Pacific Islander

Other/Unknown

African-American

2-4: Race and Ethnicity "All Managed Care"

97%

3%

0%

Age 0-18

Ages 19-39

Ages 40-64

2-5: Medi-Cal Only "OTLIC" Age

20%

22%

42%

17%

Age 0-18

Ages 19-39

Ages 40-64

Ages 65+

2-6: Medi-Cal Only "SPD" Age

0%

56%

44%

0%

Age 0-18

Ages 19-39

Ages 40-64

Ages 65+

2-7: Medi-Cal Only "ACA" Age

68%

21%

11%

0%

Ages 0-18

Ages 19-39

Ages 40-64

Ages 65+

2-8: Medi-Cal Only "OTHER" Age

Medi-Cal Managed Care Performance Dashboard

Released September 14, 2017

ote: Medi-CalN Only. See glossary.

CERTIFIED ELIGIBLE DEMOGRAPHICS: Dual Eligible Managed Care demographics for March 2017 (Data Warehouse pull August 2017)

Dual Status Apr-16 May-16 Jun-16 Jul-16 Aug-16 Sep-16 Oct-16 Nov-16 Dec-16 Jan-17 Feb-17 Mar-17

Dual 966,351 965,864 968,518 964,686 965,296 962,590 963,711 962,345 971,414 997,225 1,015,186 1,020,021

Non-Dual* 9,573,689 9,612,119 9,697,767 9,704,208 9,758,224 9,752,173 9,830,498 9,842,445 9,848,515 9,778,587 9,805,961 9,829,710

5%

2%

93%

0%

ACA

OTHER

SPD

OTLIC

3-1: Aid Groups "Dual"

31%

50%

7%

12%

ACA

OTHER

SPD

OTLIC

3-2: Aid Groups "Non-Dual"

28%

27%

19%

18%

8%

White

Hispanic

Asian/PacificIslander

Other/Unknown

African-American

3-3: Dual Eligible by Race and Ethnicity

CMC COHS GMC RM Two Plan

Dual 114,601 228,231 89,123 10,867 577,199

Non-Dual 16 1,973,005 1,083,640 378,155 6,394,894

0%

10%

20%

30%

40%

50%

60%

70%

80%

90%

100%

Per

cen

tage

3-4: Plan Model Totals

0%

6%

24%

70%

Age 0-18

Ages 19-39

Ages 40-64

Ages 65+

3-5: Dual Age Cohorts

Note: Data in this dashboard is preliminary and subject to change Page 3 of 11

Medi-Cal Managed Care Performance Dashboard

Released September 14, 2017

UTILIZATION: Statewide October 2015 to September 2016 (Data Warehouse pull August 2017)

-

20

40

60

80

100

120

Oct-15 Nov-15 Dec-15 Jan-16 Feb-16 Mar-16 Apr-16 May-16 Jun-16 Jul-16 Aug-16 Sep-16

Vis

its

Oct-15 Nov-15 Dec-15 Jan-16 Feb-16 Mar-16 Apr-16 May-16 Jun-16 Jul-16 Aug-16 Sep-16

MO-SPD 94 91 96 102 99 100 95 101 99 101 99 96

Dual 42 41 43 47 46 47 45 45 45 44 46 44

MO-ACA 44 42 45 47 46 47 45 47 47 49 48 46

MO-Other 43 42 44 47 51 47 44 46 41 42 43 44

MO-OTLIC 23 22 22 25 29 25 24 25 21 20 22 24

4-1: Emergency Room Visits per 1,000 Member Months

Note: Data in this dashboard is preliminary and subject to change Page 4 of 11

-

5

10

15

20

Oct-15 Nov-15 Dec-15 Jan-16 Feb-16 Mar-16 Apr-16 May-16 Jun-16 Jul-16 Aug-16 Sep-16

Vis

its

Oct-15 Nov-15 Dec-15 Jan-16 Feb-16 Mar-16 Apr-16 May-16 Jun-16 Jul-16 Aug-16 Sep-16

MO-SPD 14 14 17 17 15 15 13 14 14 14 13 13

Dual 5 5 6 6 6 6 5 5 5 5 6 6

MO-ACA 4 4 4 4 4 4 3 4 4 4 3 3

MO-Other 1 1 2 2 1 1 1 1 1 1 1 1

MO-OTLIC 1 1 1 1 1 1 1 1 0 1 1 1

4-2: Emergency Room Visits With an Inpatient Admission per 1,000 Member Months

Medi-Cal Managed Care Performance Dashboard

Released September 14, 2017

UTILIZATION: Statewide October 2015 to September 2016 (Data Warehouse pull August 2017)

-

10

20

30

40

50

60

70

Oct-15 Nov-15 Dec-15 Jan-16 Feb-16 Mar-16 Apr-16 May-16 Jun-16 Jul-16 Aug-16 Sep-16

Vis

its

Oct-15 Nov-15 Dec-15 Jan-16 Feb-16 Mar-16 Apr-16 May-16 Jun-16 Jul-16 Aug-16 Sep-16

MO-SPD 40 39 41 43 39 40 38 40 39 40 41 39

Dual 46 48 48 47 47 46 47 50 45 47 54 60

MO-ACA 9 9 10 10 9 9 9 9 9 9 9 8

MO-Other 6 6 6 6 6 6 6 6 5 6 6 6

MO-OTLIC 2 2 2 2 2 2 2 2 2 2 2 3

5-1: Inpatient Admissions per 1,000 Member Months

-

500

1,000

1,500

2,000

2,500

3,000

Oct-15 Nov-15 Dec-15 Jan-16 Feb-16 Mar-16 Apr-16 May-16 Jun-16 Jul-16 Aug-16 Sep-16

Vis

its

Oct-15 Nov-15 Dec-15 Jan-16 Feb-16 Mar-16 Apr-16 May-16 Jun-16 Jul-16 Aug-16 Sep-16

MO-SPD 2,587 2,348 2,418 2,513 2,588 2,731 2,612 2,681 2,522 2,336 2,552 2,600

Dual 1,569 1,520 1,608 1,657 1,660 1,762 1,684 1,733 1,744 1,658 1,807 1,770

MO-ACA 694 635 669 679 682 741 688 702 722 679 760 706

MO-Other 609 547 559 589 629 650 610 610 555 507 611 613

MO-OTLIC 487 427 416 445 498 500 469 461 397 364 463 490

5-2: Outpatient Visits per 1,000 Member Months

Note: Data in this dashboard is preliminary and subject to change Page 5 of 11

Medi-Cal Managed Care Performance Dashboard

Released September 14, 2017

UTILIZATION: Statewide October 2015 to September 2016 (Data Warehouse pull August 2017)

-

500

1,000

1,500

2,000

2,500

3,000

3,500

Oct-15 Nov-15 Dec-15 Jan-16 Feb-16 Mar-16 Apr-16 May-16 Jun-16 Jul-16 Aug-16 Sep-16

Vis

its

Oct-15 Nov-15 Dec-15 Jan-16 Feb-16 Mar-16 Apr-16 May-16 Jun-16 Jul-16 Aug-16 Sep-16

MO-SPD 3,148 3,035 3,103 3,116 3,127 3,331 3,126 3,175 3,160 2,836 3,221 3,050

Dual 389 374 380 394 399 428 399 404 411 376 426 406

MO-ACA 998 951 940 981 976 1,043 971 983 980 876 1,029 985

MO-Other 470 469 465 494 545 536 484 473 440 386 465 459

MO-OTLIC 224 231 218 239 305 278 244 232 204 174 226 227

6-1: Prescriptions per 1,000 Member Months

-

5

10

15

20

25

30

Oct-15 Nov-15 Dec-15 Jan-16 Feb-16 Mar-16 Apr-16 May-16 Jun-16 Jul-16 Aug-16 Sep-16

Vis

its

Oct-15 Nov-15 Dec-15 Jan-16 Feb-16 Mar-16 Apr-16 May-16 Jun-16 Jul-16 Aug-16 Sep-16

MO-SPD 21 19 20 21 23 24 22 23 24 22 25 24

Dual 25 23 26 25 26 28 25 27 28 25 28 27

MO-ACA 16 15 15 15 16 18 16 16 17 16 19 17

MO-Other 8 7 7 7 8 9 9 9 9 8 9 9

MO-OTLIC 7 7 7 7 8 8 8 8 8 7 8 8

6-2: Mild to Moderate Mental Health Visits per 1,000 Member Months

Note: Data in this dashboard is preliminary and subject to change Page 6 of 11

Medi-Cal Managed Care Performance Dashboard

Released September 14, 2017

Grievance Demographics: Q1 2017 (January to March 2017) Statewide

33%

32%

14%

14%

7%

White

Hispanic

Other/Unknown

African-American

Asian/PacificIslander

7-1: Grievances by Ethnicity

38%

22%

27%

10%

3%

MO-ACA

MO-SPD

MO-OTHER

DUAL

MO-OTLIC

7-2: Grievances by Population

7%

18%

32%

5%

9%

8%

19%

2%

Age 0-18

Ages 19-39

Ages 40-64

Ages 65+

7-3: Grievances by Age

Male Female

0.9

0.4

0.7

1.0

0.3

White

Hispanic

Other/Unknown

African-American

Asian/PacificIslander

7-4: Grievances by EthnicityPer 1,000 Member Months

Note: Data in this dashboard is preliminary and subject to change Page 7 of 11

Medi-Cal Managed Care Performance Dashboard

Released September 14, 2017

Grievance and Appeals Outcomes: Q1 2017 (January to March 2017) Statewide

49%

40%

57%

50%

41%

40%

53%

31%

42%

41%

11%

7%

12%

8%

18%

Accessibility

Benefits

Other

Quality Of Care

Referral

8-1: Grievance Resolution by Type

Resolved in Favor of Member Resolved in Favor of Plan Unresolved

39%

35%

39%

37%

41%

17%

22%

20%

22%

25%

34%

23%

26%

28%

27%

5%

17%

12%

10%

5%

5%

3%

4%

3%

2%

Accessibility

Benefits

Other

Quality ofCare

Referral

8-2: Grievances by Population and Type

MO-ACA MO-SPD MO-OTHER DUAL MO-OTLIC

41%

25%

15%

10%

9%

Quality of Care

Other

Benefits

Accessibility

Referral

8-3: Grievances by Type

0.8

0.7

0.5

0.3

GMC

Two Plan

RM

COHS

8-4: Grievances by Plan Model per 1,000 Member Months

Note: Data in this dashboard is preliminary and subject to change Page 8 of 11

Medi-Cal Managed Care Performance Dashboard

Released September 14, 2017

State Fair Hearing Demographics: Q1 2017 (January to March 2017) Statewide

41%

20%

16%

14%

9%

White

Hispanic

Other/Unknown

African-American

Asian/PacificIslander

9-1: Hearings by Ethnicity

35%

35%

21%

9%

MO-ACA

MO-SPD

MO-OTHER

DUAL

9-2: Hearings by Population

Note: Data in this dashboard is preliminary and subject to change Page 9 of 11

2%

17%

37%

4%

6%

10%

21%

3%

Age 0-18

Ages 19-39

Ages 40-64

Ages 65+

9-3: Hearings by Age

Male Female

2016Q2 2016Q3 2016Q4 2017Q1

MO-ACA 389 421 372 302

DUAL 89 97 77 79

MO-OTHER 136 117 75 177

MO-SPD 280 405 336 301

Total 894 1040 860 859

-

50

100

150

200

250

300

350

400

450

500

Vis

its

9-4: Hearings by Population

0.39

0.35

0.26

0.23

0.21

RM

GMC

Two Plan

CMC

COHS

9-5: Hearings by Plan Model per 10,000 Member Months

Medi-Cal Managed Care Performance Dashboard

Released September 14, 2017

State Fair Hearing Reasons/Outcomes: Q1 2017 (January to March 2017) Statewide

29%

35%

47%

29%

38%

39%

35%

18%

21%

37%

32%

45%

31%

24%

26%

64%

30%

19%

17%

19%

18%

35%

30%

0%

21%

9%

5%

7%

14%

2%

9%

18%

Billing

Dispute of Services

Medication/Prescription

MER/EDR

Other

Referral

Surgery/Treatment

Wheelchair/PowerWheelchair/Scooter (PWC)

10-1: Hearing Reasons by Population

MO-ACA MO-SPD MO-OTHER DUAL

35%

26%

13%

11%

4%

3%

3%

3%

1%

Withdrawal

Denied

Non-Appearance

Dismissed

Granted

Other

Duplicate Case

Redirect

Granted in Part

10-2: Hearing Outcomes

221

171

111

86

63

10-3: Top 5 Hearing Reasons

Note: Data in this dashboard is preliminary and subject to change Page 10 of 11

63%

37%

54%

47%

Approved Denied

10-4: Medical Exemption Requests

NON- SPD SPD

Medi-Cal Managed Care Performance DashboardReleased September 14, 2017

Note: Data in this dashboard is preliminary and subject to change Page 11 of 11

0.00%

10.00%

20.00%

30.00%

40.00%

50.00%

60.00%

70.00%

80.00%

90.00%

100.00%

KP S

outh

- Sa

n Di

ego

KP N

orth

- KP

Nor

thSF

HP -

San

Fran

cisc

oCe

nCal

- Sa

nta

Barb

ara

ABC

- San

Fra

ncis

coHP

SM -

San

Mat

eoPa

rtne

rshi

p - S

outh

east

CalO

ptim

a - O

rang

eCC

HP

- Con

tra

Cost

aAB

C - T

ular

eCe

nCal

- Sa

n Lu

is O

bisp

oCH

G -

San

Die

goCH

W -

Impe

rial

CCAH

- M

onte

rey/

Sant

a Cr

uzM

olin

a - S

an D

iego

ABC

- San

ta C

lara

Part

ners

hip

- Sou

thw

est

Care

Firs

t - S

an D

iego

LA C

are

- Los

Ang

eles

Alam

eda

Allia

nce

- Ala

med

aCa

lViv

a - K

ings

IEHP

- Ri

vers

ide/

San

Bern

ardi

noSC

FHP

- San

ta C

lara

Heal

th N

et -

Tula

reAB

C - M

ader

aHe

alth

Net

- Lo

s Ang

eles

Mol

ina

- Im

peria

lCa

lViv

a - F

resn

oCa

lViv

a - M

ader

aAB

C - A

lam

eda

ABC

- Kin

gsHe

alth

Net

- Sa

n Di

ego

Mol

ina

- Riv

ersi

de/S

an B

erna

rdin

oAB

C - F

resn

oPa

rtne

rshi

p - N

orth

wes

tKF

HS

- Ker

nM

olin

a - S

acra

men

toAB

C - C

ontr

a Co

sta

ABC

- Sac

ram

ento

CCAH

- M

erce

dPa

rtne

rshi

p - N

orth

east

ABC

- Reg

ion

1AB

C - R

egio

n 2

CHW

- Re

gion

2He

alth

Net

- Ke

rnHe

alth

Net

- St

anis

laus

CHW

- Re

gion

1AB

C - -

San

Ben

itoHe

alth

Net

- Sa

cram

ento

GCH

P - V

entu

raHP

SJ -

Stan

isla

usHP

SJ -

San

Joaq

uin

Heal

th N

et -

San

Joaq

uin

11-1: 2017 HEDIS Aggregated Quality Factor Score (AQFS)

AQFS HPL MPL MCMC Weighted Average - 63%

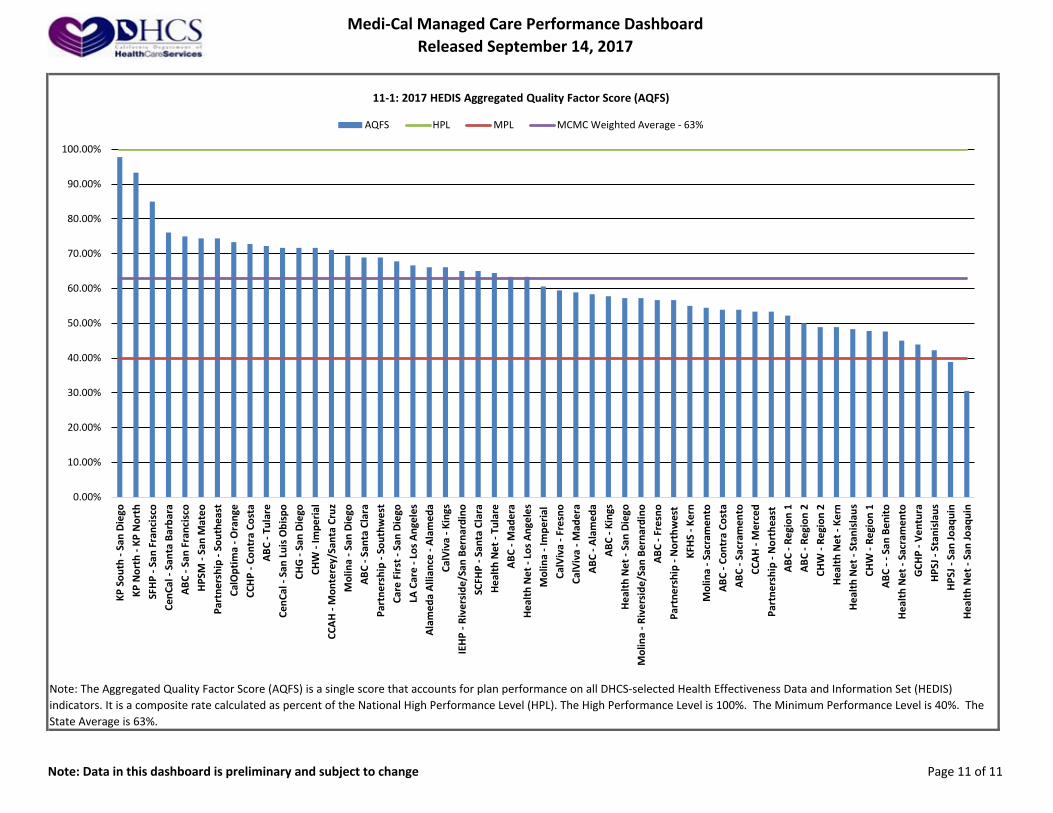
Note: The Aggregated Quality Factor Score (AQFS) is a single score that accounts for plan performance on all DHCS-selected Health Effectiveness Data and Information Set (HEDIS) indicators. It is a composite rate calculated as percent of the National High Performance Level (HPL). The High Performance Level is 100%. The Minimum Performance Level is 40%. The State Average is 63%.


Recommended