22
Medicaid Managed LTSS Presentation at the National HCBS Conference Washington DC Does it work? Debra J. Lipson, Senior Fellow, Mathematica August 31, 2015
Medicaid Managed LTSS
Presentation at the National HCBS Conference
Washington DC
Does it work?
Debra J. Lipson, Senior Fellow, Mathematica
August 31, 2015
2 2
Overview
• What we know about
MLTSS effectiveness
• What we don’t know about
MLTSS effectiveness
• Aims of the national
MLTSS evaluation
3 3
What do we know about MLTSS
and its Effectiveness?
4 4
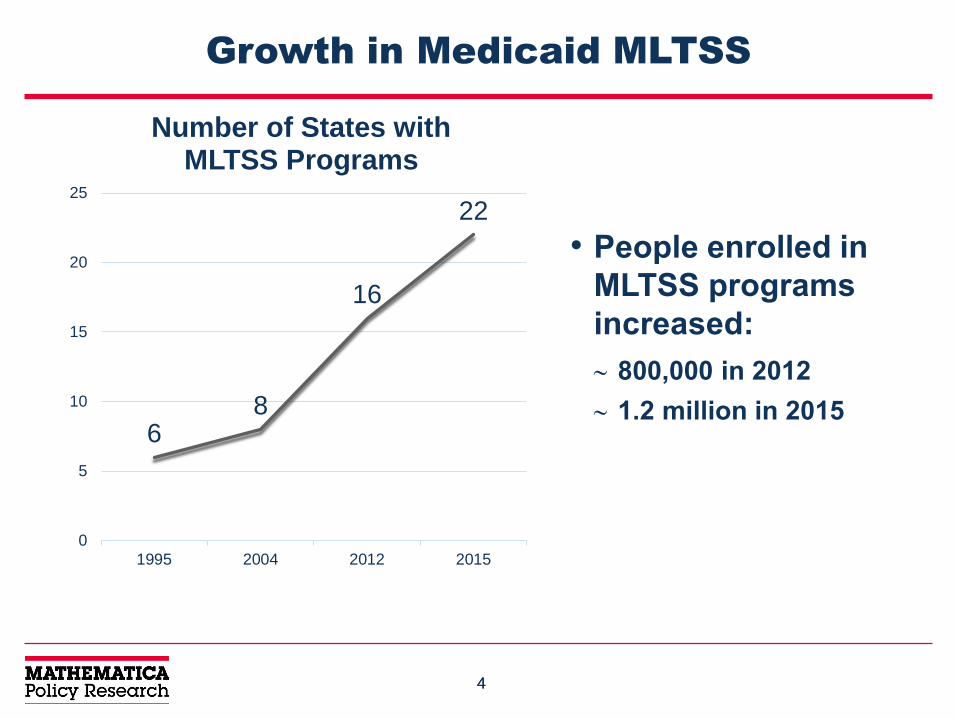
Growth in Medicaid MLTSS
• People enrolled in
MLTSS programs
increased:
800,000 in 2012
1.2 million in 2015 6
8
16
22
0
5
10
15
20
25
1995 2004 2012 2015
Number of States with MLTSS Programs
5 5
Why are more states adopting MLTSS?
• People with disabilities are among the highest cost Medicaid enrollees
• Conventional benefits of Medicaid managed care
– Ability to hold an entity accountable for outcomes (access, quality and costs)
– Budget predictability – per capita rates set in advance
• Plus potential for improved LTSS outcomes
– Improved quality of care and quality of life
– Shift the balance from institutional care to HCBS
– Better care coordination – across providers and across care settings: acute, primary and specialty care, LTSS, sometimes behavioral services
6 6
State Studies
• Health care utilization
– Massachusetts (2009): MLTSS program reduced risk of entering a NF
by 32% over first two years of operation
– Minnesota (2004): Program enrollees had significantly fewer hospital
days and preventable hospital admissions than the control group
– Wisconsin (2005): Primary care visits were 5.6% more frequent
among MCO members than in a comparison group
• Rebalancing
– Tennessee (2013): share of LTSS population using HCBS rose from
17% before program implementation to 30% after first year of the
program
7 7
State Studies
• Access to HCBS & Care Coordination
– New York (2011): Majority of enrollees said providers and services are
always or usually on time and reported high satisfaction for quality
and timeliness for visiting nurses and home health aides
– Minnesota (2013): Share of dual enrollees receiving HCBS increased
from 9.5% before the program to nearly 40% after implementation
– Texas (2011): 74% of members reported usually or always getting
care quickly, compared to the national Medicaid average of 80%
– Arizona (2008): 90% of enrollees say case managers provided help
quickly and 93% say they responded promptly to a request for
information
8 8
State Studies
• Quality of Care
– Massachusetts (2011): In 2009, one MCO scored in the 90th
percentile or above in HEDIS measures for comprehensive
diabetes care, monitoring patients on long term medications,
and access to preventive services
– New York (2012): 90% of enrollees’ reported functional ability
that was stable or improved over a 6-12 month period; 80% of
enrollees were stable or showed improvement in managing
oral medication during the follow up period
9 9
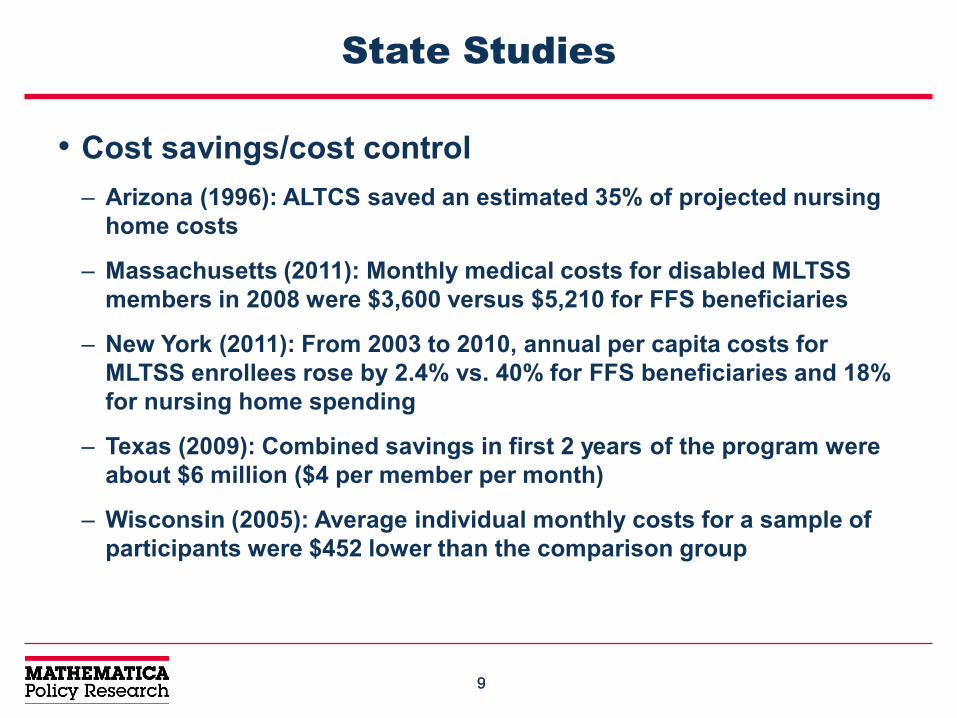
State Studies
• Cost savings/cost control
– Arizona (1996): ALTCS saved an estimated 35% of projected nursing
home costs
– Massachusetts (2011): Monthly medical costs for disabled MLTSS
members in 2008 were $3,600 versus $5,210 for FFS beneficiaries
– New York (2011): From 2003 to 2010, annual per capita costs for
MLTSS enrollees rose by 2.4% vs. 40% for FFS beneficiaries and 18%
for nursing home spending
– Texas (2009): Combined savings in first 2 years of the program were
about $6 million ($4 per member per month)
– Wisconsin (2005): Average individual monthly costs for a sample of
participants were $452 lower than the comparison group
10 10
What we don’t know about MLTSS
effectiveness
11 11
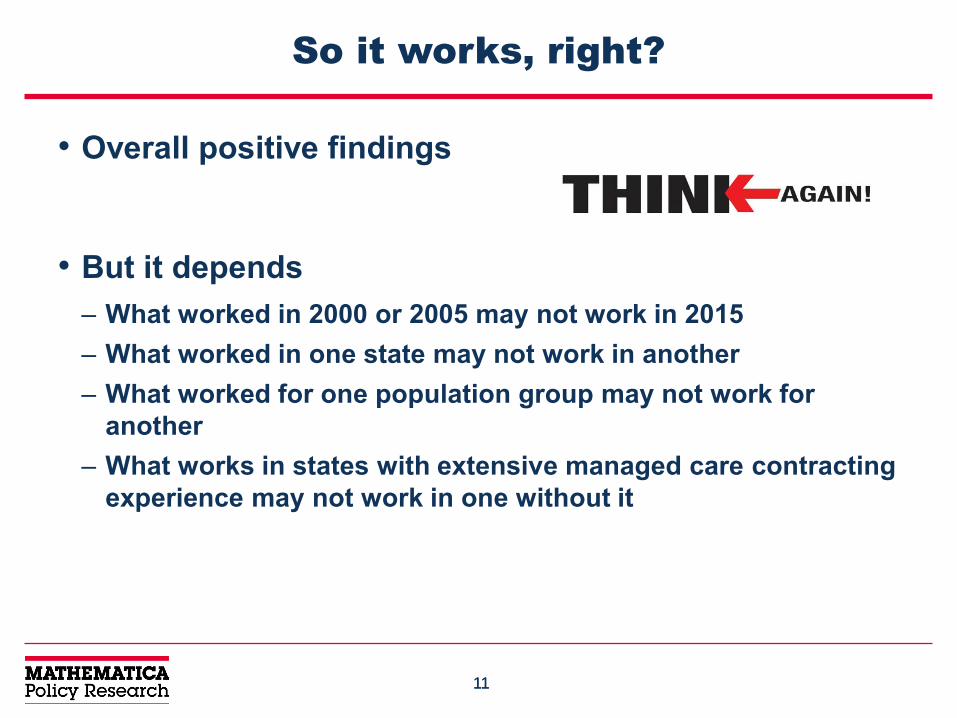
So it works, right?
• Overall positive findings
• But it depends
– What worked in 2000 or 2005 may not work in 2015
– What worked in one state may not work in another
– What worked for one population group may not work for
another
– What works in states with extensive managed care contracting
experience may not work in one without it
12 12
Current evidence on MLTSS
• Few of the recent studies on second generation programs use valid comparison groups; more common in early studies of first generation programs
• State trends do not control for other factors affecting outcomes
• Findings in one state do not necessarily apply to other states due to differences in:
• Enrolled populations; mandatory/voluntary enrollment
• Covered services and degree of Medicare integration
• MCO experience with LTSS and MCO selection criteria
• Capitation rate setting
• Effects are influenced by state oversight
14 14
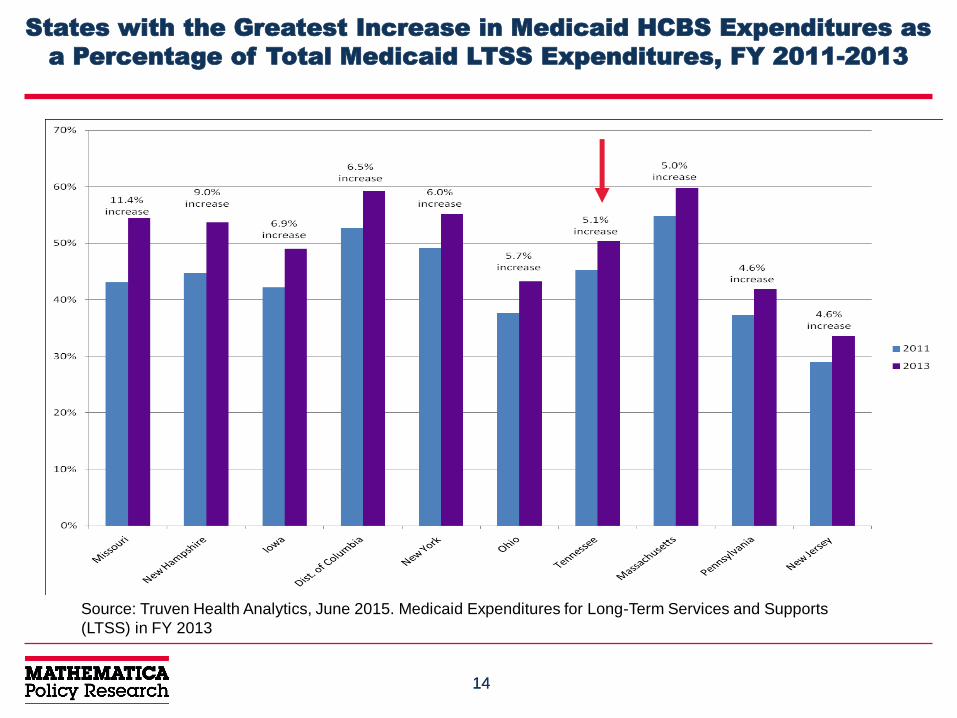
States with the Greatest Increase in Medicaid HCBS Expenditures as
a Percentage of Total Medicaid LTSS Expenditures, FY 2011-2013
Source: Truven Health Analytics, June 2015. Medicaid Expenditures for Long-Term Services and Supports
(LTSS) in FY 2013
15 15
What we need to know
• Elderly and people with disabilities are among the
most vulnerable Medicaid beneficiaries
– Need more services and a wider range of benefits than other
Medicaid enrollees
– Greater potential for managed care financial incentives to
result in under-service
– Do MLTSS enrollees have adequate access?
• In the past, most MLTSS programs were small or
subject to oversight by federal Medicare officials as
well as state Medicaid agencies
– Now, more people are enrolled in programs overseen largely
by state Medicaid agencies – how are they performing?
16 16
What we need to know
• How does MLTSS generally perform relative to FFS
on key outcomes?
– LTSS rebalancing
– LTSS and total Medicaid costs
– Access and care coordination
– Quality of care and quality of life
• What accounts for differences in effectiveness
between MLTSS and FFS?
– Starting point of LTSS system?
– State contracting and oversight?
– MCO experience?
17 17
What we need to know
• How does MLTSS program design affect outcomes?
How do MLTSS programs with different designs and
features compare to each other?
– Different methods used to set capitation rates
– Different models for integrating (or not) with Medicare
– How do provider and consumer protections affect LTSS
utilization rates and continuity of care for beneficiaries?
• Which characteristics of MLTSS programs are
associated with better access, more balanced
systems, and better quality of care? What are best
practices?
18 18
Major Research Questions in the
National MLTSS Evaluation
19 19
State-Level Impact of MLTSS Programs
• Does MLTSS produce more balanced state LTSS
systems than FFS?
– HCBS as share of total LTSS spending
– Rate of growth in per capita LTSS spending
– Share of Medicaid LTSS beneficiaries using HCBS
20 20
Individual-Level Impact of MLTSS Programs
• Do MLTSS programs improve access to services and care
outcomes for people who need and use LTSS when
switching from FFS to MLTSS?
– Changes in access to and use of HCBS
– Changes in patterns of hospital and nursing home use
– Changes in rate at which beneficiaries report usually or always
getting the services and supports they need
– Changes in receipt of appropriate preventive health care
– Changes in quality of care
21 21
Impact of Different MLTSS Features
• How do the effects of MLTSS programs vary by
program features?
– Level of care criteria
– Covered benefits
– Rate setting
22 22
For More Information
• Debra Lipson, MLTSS Evaluation Lead
• Come to the National MLTSS Evaluation session
tomorrow, September 1, 4:00 PM
• Read the Medicaid 1115 Demonstration Evaluation
Design Plan on Medicaid.gov – coming soon
• First issue brief: “Who Enrolls in State MLTSS
Programs? Implications of State Variation in Enrollee
Characteristics for a Cross-State Evaluation” – coming soon


