Medicare Appropriateness of Use Imaging Demonstration Implementation Report Final Report Prepared for: Centers for Medicare & Medicaid Services Prepared by: The Lewin Group, Inc. Contract Number: HHSM-500-2005- 00024I / Order No. HHSM-500-T0002 May 15, 2014
Transcript
Medicare Appropriateness of Use Imaging Demonstration Implementation Report Final Report
Prepared for:
Centers for Medicare & Medicaid Services
Prepared by:
The Lewin Group, Inc. Contract Number: HHSM-500-2005- 00024I /
Order No. HHSM-500-T0002
May 15, 2014
Medicare Imaging Demonstration Report on Pre-Implementation and Implementation Experience
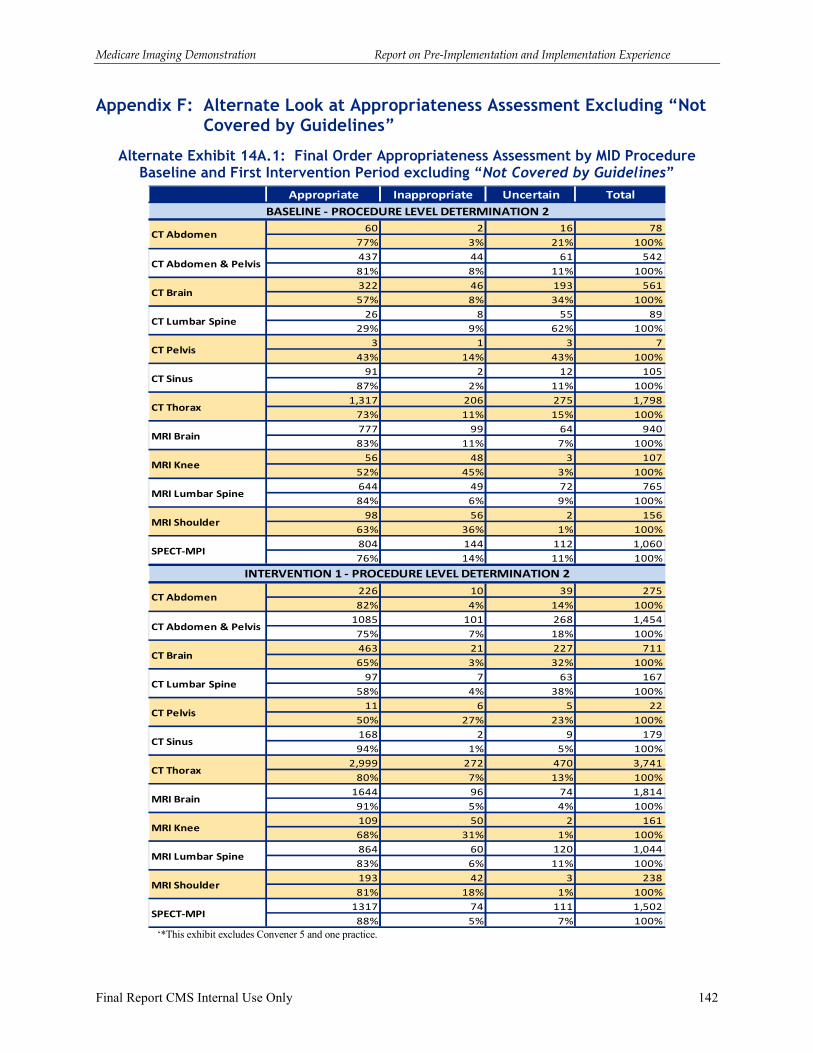
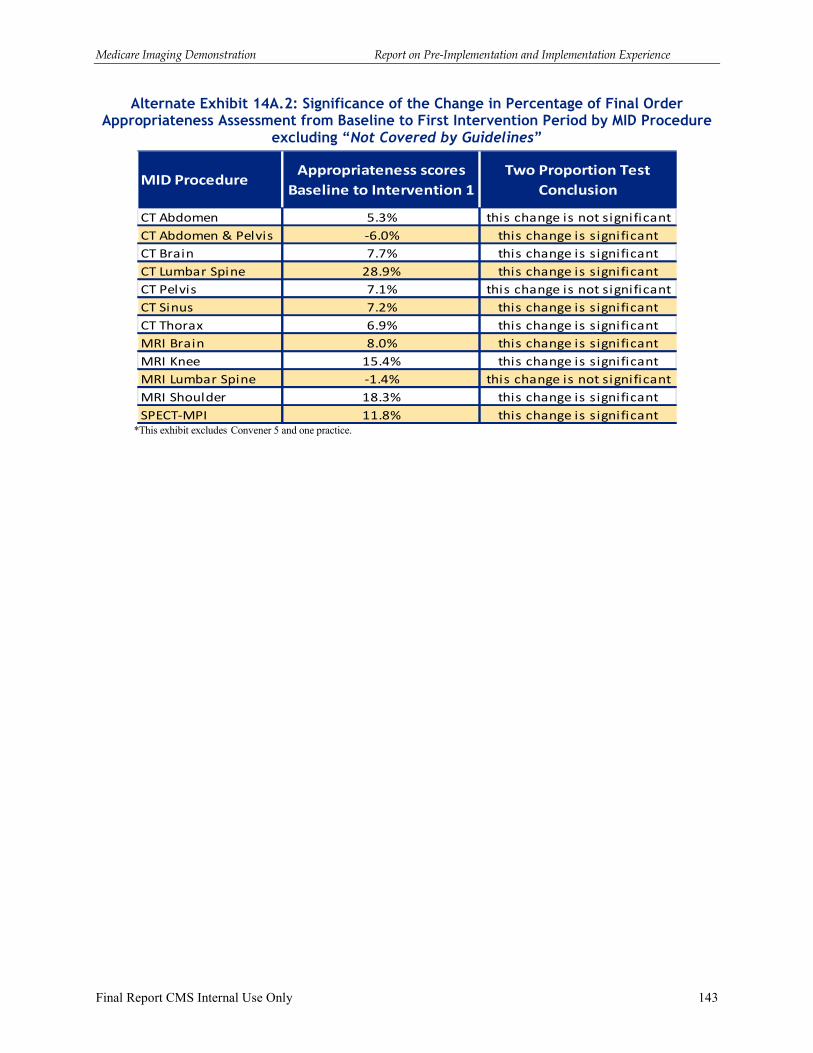
Appendix F: Alternate Look at Appropriateness Assessment Excluding “Not Covered
by Guidelines” ...................................................................................................... 142
Medicare Imaging Demonstration Report on Pre-Implementation and Implementation Experience
Final Report CMS Internal Use Only 1
Executive Summary
The purpose of the Medicare Imaging Demonstration (MID) is to assess whether the use of decision support systems (DSSs) that promote appropriate use of imaging services based on medical specialty society guidelines can improve quality of care and reduce unnecessary radiation exposure for Medicare patients. This report provides a review of the pre-implementation and implementation experience of the Medicare Imaging Demonstration (MID). The pre-implementation period occurred from February 4, 2011 until October 1, 2011, although for some demonstration participants the pre-implementation period extended beyond October 2011. The implementation period for imaging orders covered in this report includes the six-month baseline period of October 1, 2011 through March 31, 2012 and the 18-month intervention period, April 1, 2012 through September 30, 2013. The Lewin Group (Lewin) served as the design and implementation contractor for the MID.
This report provides an overview of the design of the demonstration and background information on the five organizations that were selected for participation. The participants in the MID were referred to as “conveners” as the organizations were responsible for recruiting physician practices for participation in the demonstration. The report includes a high level description of the demonstration design; a separate detailed final Design Report was submitted to the Centers for Medicare & Medicaid Services (CMS). This report describes the requirements of the demonstration relative to decision support systems, data collection requirements, and provision of feedback reports to participants. It also discusses the experience of the conveners in the pre-implementation period during which the decision support systems were adapted for purposes of the demonstration, participants trained, and data collection procedures established. The report reviews the experiences and challenges encountered by conveners in preparing for implementation and launching the demonstration and reviews the incentive payment structure established to compensate organizations for their participation. This final report also reviews the experience of the conveners during the implementation period, and the lessons learned reported by conveners. The report incorporates information related to implementation experience discussed by the MID conveners and CMS at an in-person meeting in February 2014.
The report is organized into the following sections:
� Overview of the Demonstration
� Decision Supports Systems, Demonstration Data Collection Requirements, and Feedback Reporting
� Pre-Implementation and Implementation Baseline and Intervention Period Overview
� Incentive Payments
� Findings from Baseline and Intervention Implementation Experience
Medicare Imaging Demonstration Report on Pre-Implementation and Implementation Experience
Final Report CMS Internal Use Only 2
Highlights of Findings: Pre-Implementation and Implementation Experience
Highlights of key findings from the baseline and intervention implementation experience are listed below with a complete discussion included in Section I C and Section V of the report.
� A total of 18,629 practitioners have been “ever active”1 as a participant in the MID between October 1, 2011 through September 30, 2013. A much smaller number of the practitioners identified as active participants in the demonstration actually placed an MID procedure order using the DSS. Specifically, 6,181, or 33.2 percent, of the ever active participants used the DSS to place an order.
� A large share of the orders placed for MID procedures were assessed as “not covered by medical society guidelines” because current guidelines only address a limited set of clinical scenarios of patient presenting symptoms.
� Conveners during the in-person meeting advocated for not limiting sources of evidence to medical society guidelines and that additional sources should be used. Limiting the MID to relying on evidence only from medical society guidelines was thought by conveners to be a major impediment to the effectiveness of the use of DSS.
� Conveners at the February 2014 in-person meeting indicated that greater attention needs to be given to the strength of the evidence base. For medical society guidelines and other sources of evidence, conveners noted the importance of greater reliance on higher quality evidence and use of evidence that is considered of lower quality may detract from the utility of decision support. Conveners also discussed the need for a high degree of transparency on the strength of the evidence underlying the advice given by DSS to users.
� The experience of the MID points to the need for medical specialty societies to develop processes to facilitate the translation of written guideline documents into dynamic algorithm logic for use in “rule sets” for decision support systems.
� For practices with electronic medical records (EMRs) and radiology order entry (ROE) systems, the integration / interoperability of DSS with EMRs was more challenging than expected and resulted in delays in launching the demonstration.
� The front end user experience matters:
• Conveners noted that a major lesson learned from the MID is that workflow should not be interrupted with low utility messaging from DSS. Specifically, rather than providing immediate feedback on all orders, workflow messaging should only focus on those situations where there is actionable information. Conveners emphasized that telling practitioners that an order is appropriate or a clinical situation is not addressed within guidelines was disruptive and was viewed as of no value to the MID participating practitioners.
• Conveners during the in-person meeting noted that another possible lesson learned from the MID is that the design of decision support may need to differ between generalists and specialists.
1 An ever active participant is a practitioner with authority to order imaging services who is associated with a MID participating practice at any point in the demonstration period.
Medicare Imaging Demonstration Report on Pre-Implementation and Implementation Experience
Final Report CMS Internal Use Only 3
� Some convener participants at the in-person meeting noted that the MID had a wide breadth of coverage of advanced imaging services and discussed the potential utility of a targeted design based on known problems (e.g., certain procedures or clinical situations or certain practitioners).
� Participating practices varied in terms of workflow changes needed to incorporate DSS into ordering of the MID advanced imaging services. The key distinction on workflow was based on whether the DSS was being integrated into an EMR and ROE system, versus whether the practice had to separately access an external web-based platform. In general, those practices where DSS was integrated or at least interoperable with an ROE system seem to have better compliance with using the DSS, including both use of the DSS and timely use at the point of deciding to order an imaging procedure.
� In many of the participating practices, the actual users of the DSS were “proxies”2 rather than the ordering practitioners.
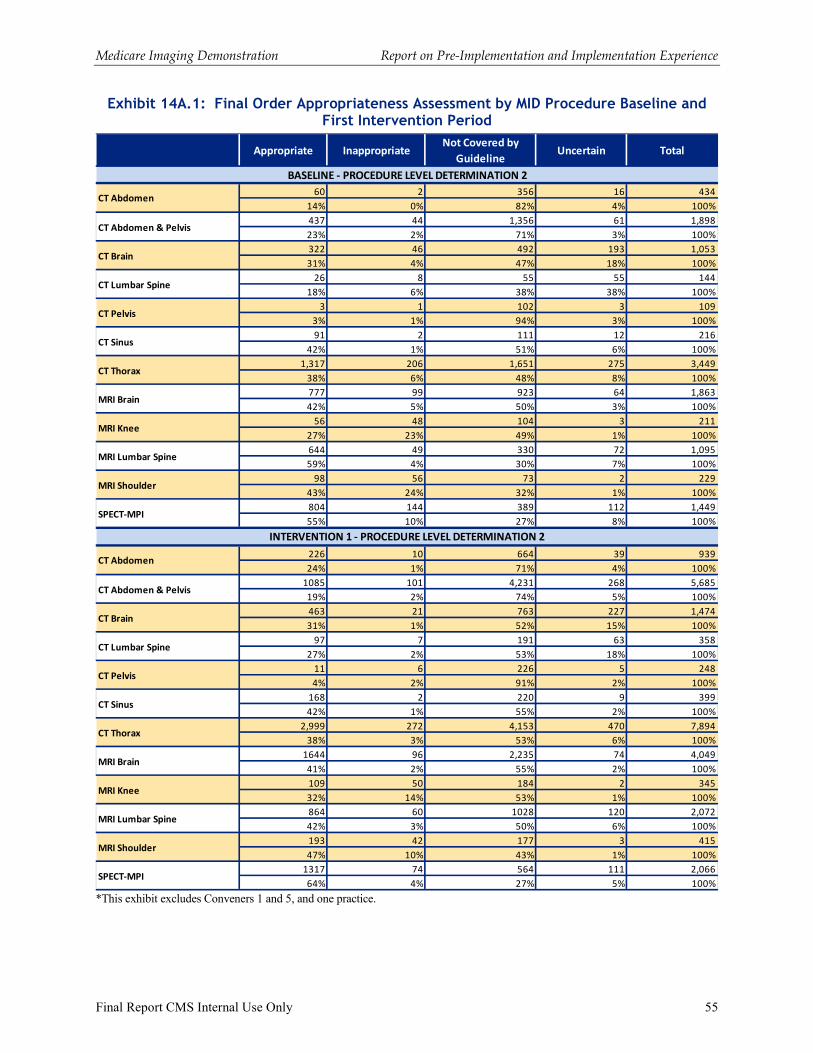
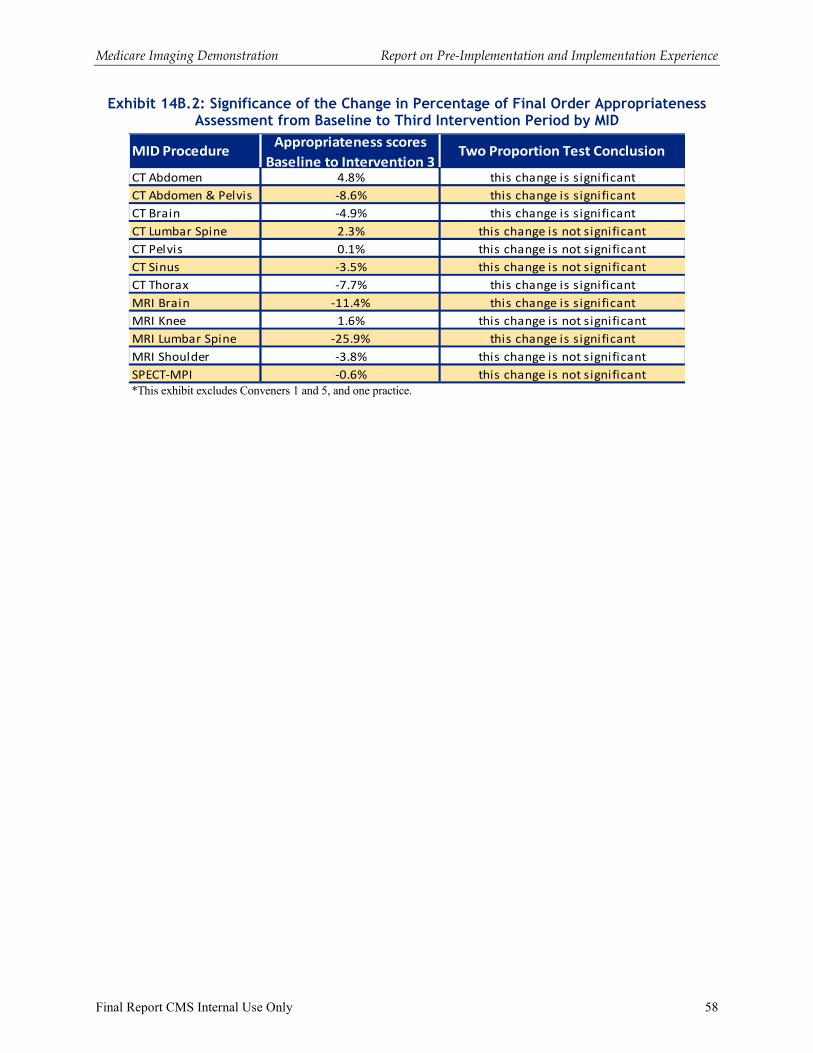
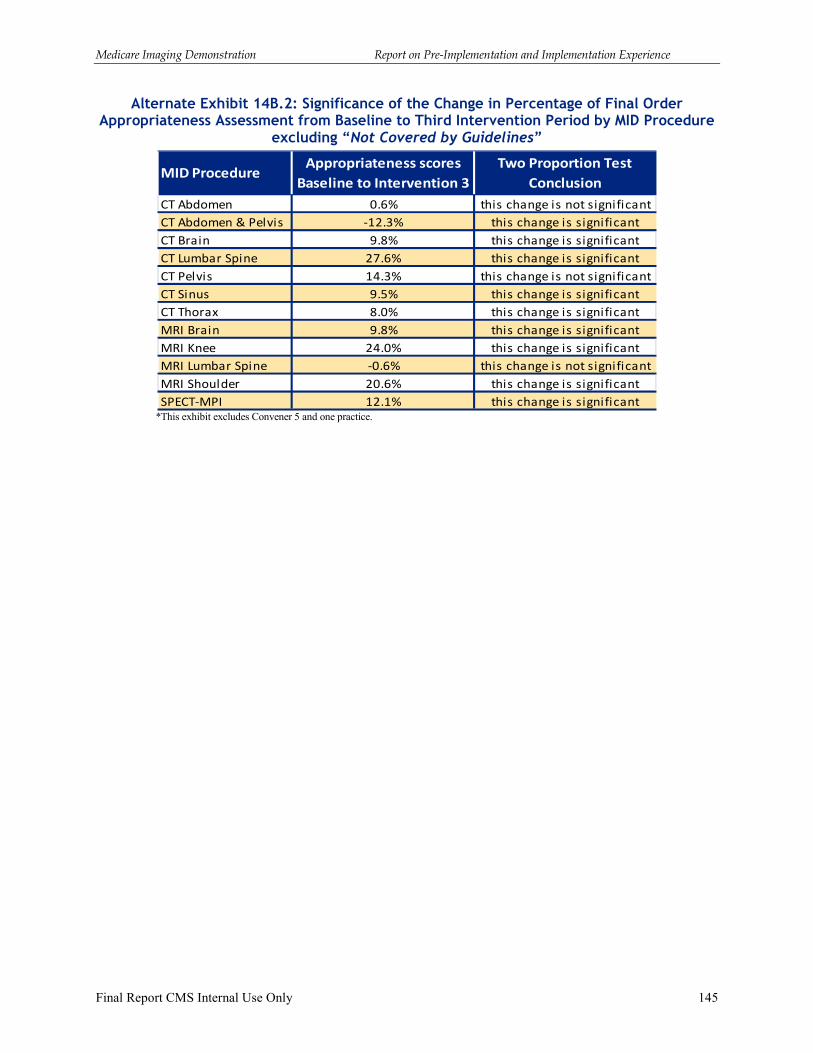
� From the baseline to first six months of the intervention period, the share of orders assessed as appropriate increased somewhat for seven of the twelve MID procedures. One procedure experienced no change, and four procedures experienced a decrease in the share of orders assessed as appropriate. However, proportion testing of the change in appropriateness score percentages from baseline to intervention reveals that the change is significant for only five of the 11 procedures that experienced a change. The volume of procedures for those that did not experience a significant change is much lower than the volume for those that did experience a significant change, indicating that volume of available procedures is an important factor in whether a change is significant under a two proportion test.
� For the demonstration as a whole, we observed very small numbers of DSS orders that were cancelled or changed after the launch of the intervention period in response to the feedback from the DSS.
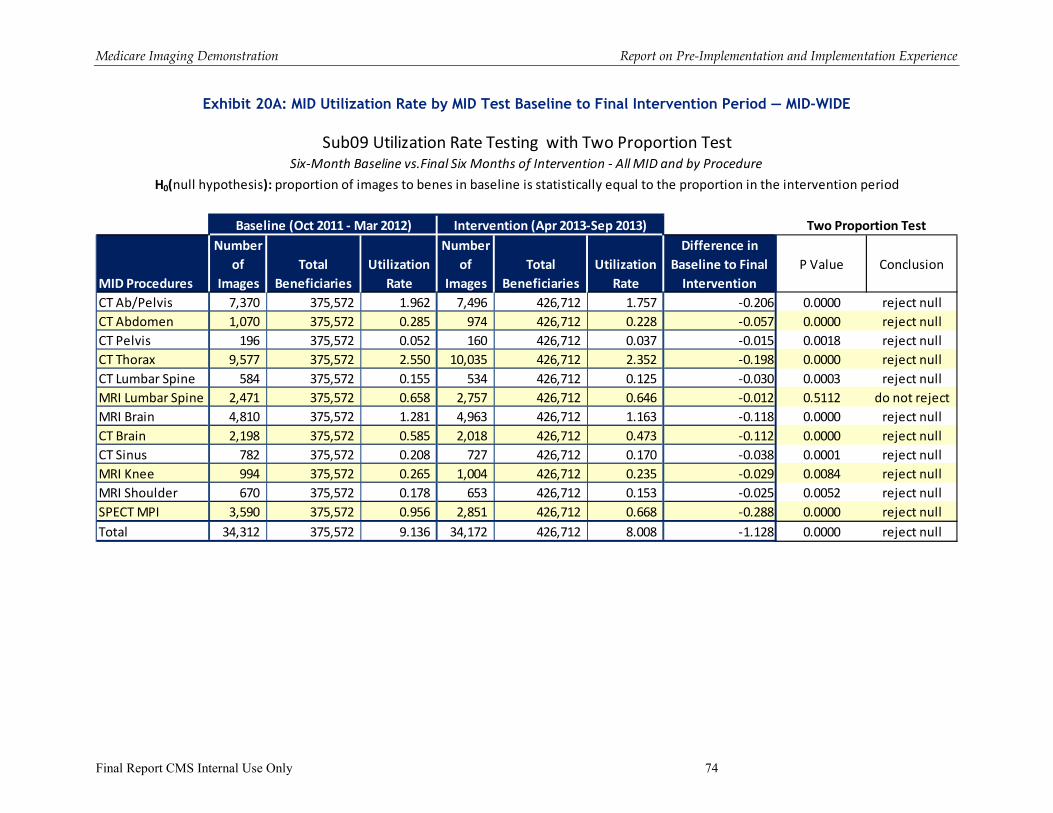
� The demonstration-wide utilization rates by MID procedure decrease slightly between the baseline and final six months of the intervention period as well as between the first six months of the intervention period and the last six months of the intervention period. In aggregate, the decrease in utilization of MID procedures as a market basket measure,
-1.13 per 100 Medicare beneficiaries (baseline to final six months of intervention period) and -0.87 per 100 Medicare beneficiaries (first six months of intervention period to final six months of intervention period), is statistically significant. It is important to note that our analysis is limited as we do not have a comparison group that is external to the demonstration. It is our understanding that RAND, as part of the evaluation analyses, will have comparison groups.
� During the February 2014 in-person meeting, conveners noted that the MID has influenced the progress of the use of decision support systems for radiology services. In general, the conveners expressed the view that DSS can be a useful tool in promoting evidenced-based imaging, and there were key lessons learned related to implementation of DSS as part of the demonstration.
2 A proxy is an individual (e.g., nurse, or administrative staff) who is acting under the direction of the ordering practitioner to enter information into the DSS on behalf of the ordering practitioner.
Medicare Imaging Demonstration Report on Pre-Implementation and Implementation Experience
Final Report CMS Internal Use Only 4
The report presents qualitative implementation lessons learned from the baseline and intervention period experience. In addition, the report includes presentation of quantitative information from the DSS data collection of the appropriateness assessments of imaging orders for the entire demonstration for both the baseline and intervention periods. Also included is a presentation of an analysis on utilization rates of the MID procedures based on Medicare claims data for the six-month baseline period and the 18-month intervention period. It is important to note that a formal evaluation of the demonstration is being conducted by RAND as the independent MID evaluation contractor for CMS as a Report to Congress. This report from Lewin is focused on the experience of planning and implementing the demonstration. The report also includes information similar to that included in feedback reporting (DSS appropriateness data and utilization rate data from Medicare claims), which was an aspect of the implementation of the demonstration. In this final report, however, the data have been updated to cover the entire demonstration period. In addition, this final report on the demonstration implementation includes additional analysis on cancelled orders and changed orders.
Medicare Imaging Demonstration Report on Pre-Implementation and Implementation Experience
Final Report CMS Internal Use Only 5
I. Overview of the Demonstration
A. Objectives/Mandate
The Medicare Imaging Demonstration (MID) was authorized by Congress in the Medicare Improvements for Patients and Providers Act of 2008. The goal of the demonstration is to assess whether the use of decision support systems (DSSs) that promote appropriate use of imaging services based on medical specialty society guidelines can improve quality of care and reduce unnecessary radiation exposure for Medicare patients. Through the MID, the Centers for Medicare & Medicaid Services (CMS) was able to collect data on physician compliance with medical specialty society appropriateness criteria for imaging services. The demonstration examines the impact of using a DSS on physicians’ rate of ordering advanced imaging services and the appropriateness of the orders. Existing coverage and payment policies under Medicare were not affected by this demonstration.
CMS released the MID solicitation on July 22, 2010, with applications due on September 21, 2010. The participants in the MID were referred to as “conveners” as the organizations were responsible for recruiting physician practices for participation in the demonstration. CMS informed conveners of their selection at the end of January 2011, with the official CMS press release of the selection of the five participants on February 2, 2011. The five conveners selected were:
� Brigham & Women's Hospital
� Henry Ford Health System (health system which includes a multi-specialty group practice)
� Maine Medical Center-Physician Hospital Organization (non-profit joint venture of Maine Medical Center and Community Physicians of Maine)
� National Imaging Associates (radiology benefit management company)
� University of Wisconsin Medical Foundation (physician group practice)
B. Demonstration Design
The MID was focused on three advanced imaging modalities: magnetic resonance imaging (MRI), computed tomography (CT), and nuclear medicine. Within those modalities, the demonstration targeted 123 of the most frequently used advanced imaging procedures (see Exhibit 1).
3 The July 2010 solicitation identified 11advanced imaging procedures. A change in procedure coding in 2011 created a separate set of procedure codes for combined CT Abdomen and CT Pelvis imaging, and consequently the number was increased to 12 to account for this additional combined procedure set.
Medicare Imaging Demonstration Report on Pre-Implementation and Implementation Experience
Final Report CMS Internal Use Only 6
Exhibit 1: MID Advanced Imaging Modalities and Procedures
The MID demonstration ran for two years, comprised of a six-month baseline period in which the convener’s DSS collected data “behind the scenes” on the appropriateness of orders but did not provide immediate feedback, and an 18-month intervention period where immediate feedback on appropriateness of test ordering was provided to the ordering practitioner at the point of image order. The assessment of appropriateness was based on medical specialty society guidelines. During the intervention period the medical society guidelines that underlie the assessment were made readily available via the DSS user interface. The intervention period also involved the provision of periodic feedback reports to practices and practitioners on the patterns of appropriateness of orders with comparison to other demonstration participants.
The purpose of the baseline period was to capture what the individual participating physicians’ ordering behavior was without immediate feedback about appropriateness of orders. During the intervention period, the DSS provided to the ordering practitioner an assessment of the appropriateness of the imaging orders at the time that the order was entered into the DSS.
The pre-implementation period for the demonstration began with a “kick-off” meeting among CMS, representatives from all five conveners, Lewin, and RAND, the evaluation contractor for the MID. The kick-off meeting was held February 4, 2011, at CMS headquarters in Baltimore, Maryland. Lewin then conducted site visits with all five conveners during February and early March 2011. Ensuing discussions through May 2011 with conveners around feasibility for implementation led CMS to set a target date of August 2011 for launch of the demonstration. However, testing of the DSS systems during the spring and early summer of 2011 found that further modifications were needed in order to meet the demonstration requirements and that some
Computed Tomography (CT) Procedures
CT Abdomen
CT Pelvis
CT Abdomen and Pelvis
CT Brain
CT Lumbar Spine
CT Sinus
CT Thorax
Magnetic Resonance Imaging (MRI) Procedures
MRI Brain
MRI Lumbar Spine
MRI Knee
MRI Shoulder
Nuclear Medicine
SPECT-MPI
Medicare Imaging Demonstration Report on Pre-Implementation and Implementation Experience
Final Report CMS Internal Use Only 7
conveners’ DSS systems were not yet ready to be tested. Consequently, CMS established a revised target launch date of October 2011.
The baseline data collection period was set as October 1, 2011 through March 30, 2012. The intervention period was set to begin on April 1, 2012 and run through September 30, 2013. Exhibit 2 is an overview of the demonstration timeline. Discussed in greater detail in Section III.A.6, the actual implementation dates for both the start of baseline and intervention varied by practice with some practices experiencing delays in launch of baseline, and in some cases launch delays were experienced in both baseline and intervention.
Exhibit 2: Demonstration Timeline
Participating physician practices received incentive payments for providing data on imaging services. These were pay-for-reporting payments and were separate from Medicare reimbursement for services rendered during the demonstration period. The MID did not alter Medicare payment for services delivered to Medicare beneficiaries. The MID incentive payment amounts were based on historic ordering volume of the participating practices so that there was no inducement to order more or less imaging procedures during the demonstration period. Using Medicare claims data, Lewin calculated the participating practices’ historic ordering volume for the procedures included in the demonstration. Based on these calculations, the practices were grouped into five ordering volume tiers based on the ordering volume found in CY 2009 Medicare claims data (see Exhibit 3). The minimum annual incentive payment to practices was $1,000 and the maximum annual payment was $20,000. The incentive payments were contingent upon meeting completeness of reporting4 and other requirements.
Exhibit 3: Practice Ordering Volume Tiers / Incentive Payments
Ordering Tier
Annual Medicare Test Ordering Volume
(claims for MID targeted advanced imaging procedures)
Annual Payment
to Practice
Tier 1 Under 50 $1,000
Tier 2 51-100 $2,000
Tier 3 101-500 $4,000
Tier 4 501-1,000 $7,000
Tier 5 1,001 and up ($1,000 for each additional 1,000 procedures up to
a maximum of $20,000) $8,000- $20,000
4 As will be discussed subsequently the assessment process for the adequacy of reporting changed during the course of the demonstration.
Pre-
implementation
Period(Jan ’11 – Sep ’11)
6-month Baseline
Data Collection
Period(Oct ’11 – Mar ’12)
18-month Intervention Period(Apr ’12 – Sep ’13)
Jan ’11
Awards
Oct ‘11
Demonstration
Year 1 Begins
Apr ‘12
Intervention
Period Begins
Oct ‘12
Demonstration
Year 2 Begins
Sep ‘13
End of
Demonstration Year 2Feb ’11
Kick-off
Post-implementation
Period(Oct ’13 – Apr ’14)
Apr ‘14
End of
Demonstration
Agreement
Period
Medicare Imaging Demonstration Report on Pre-Implementation and Implementation Experience
Final Report CMS Internal Use Only 8
Participating practices were not penalized for situations where there was a complete DSS record but for which no advanced imaging procedure was rendered (e.g., when a patient was not compliant or the DSS feedback resulted in physician canceling order).
A quarterly cycle of data submission was established for conveners, for a total of nine submissions. The data submitted by conveners included a practice workbook for each practice in the demonstration which included information on each of the participating practices (e.g., practice locations, tax ID numbers) and complete listings of all practitioners (e.g., names and NPIs) at the practices. In addition, each cycle included submission of DSS records. A discussion of the data collected is contained in Section II.B. The nine submission cycles and the time period included in the cycle are listed in Exhibit 4. For the ending time period of each cycle, conveners had some flexibility for the cut-off date of DSS record submission. For example, a convener could choose to only submit records through the 15th of the last month covered by the time period. The exception was Submission 09 for which all DSS records from the demonstration October 1, 20115 through September 30, 2013, must be included. With each subsequent data submission, conveners submitted a file that served to replace all previously submitted DSS data sets, with records dating back to the initial launch of the demonstration.
Exhibit 4: Data Submission Cycles and Time Periods
Submission Cycle Time Periods for Data
Submission01 October 2011 – December 2011
Submission02 October 2011 – March 2012
Submission03 October 2011 – June 2012
Submission04 October 2011 – September 2012
Submission05 October 2011 – December 2012
Submission06 October 2011 – March 2013
Submission07 October 2011 – June 2013
Submission08 October 2011 – September 2013
Submission09 October 2011 – September 2013
C. Demonstration Sites
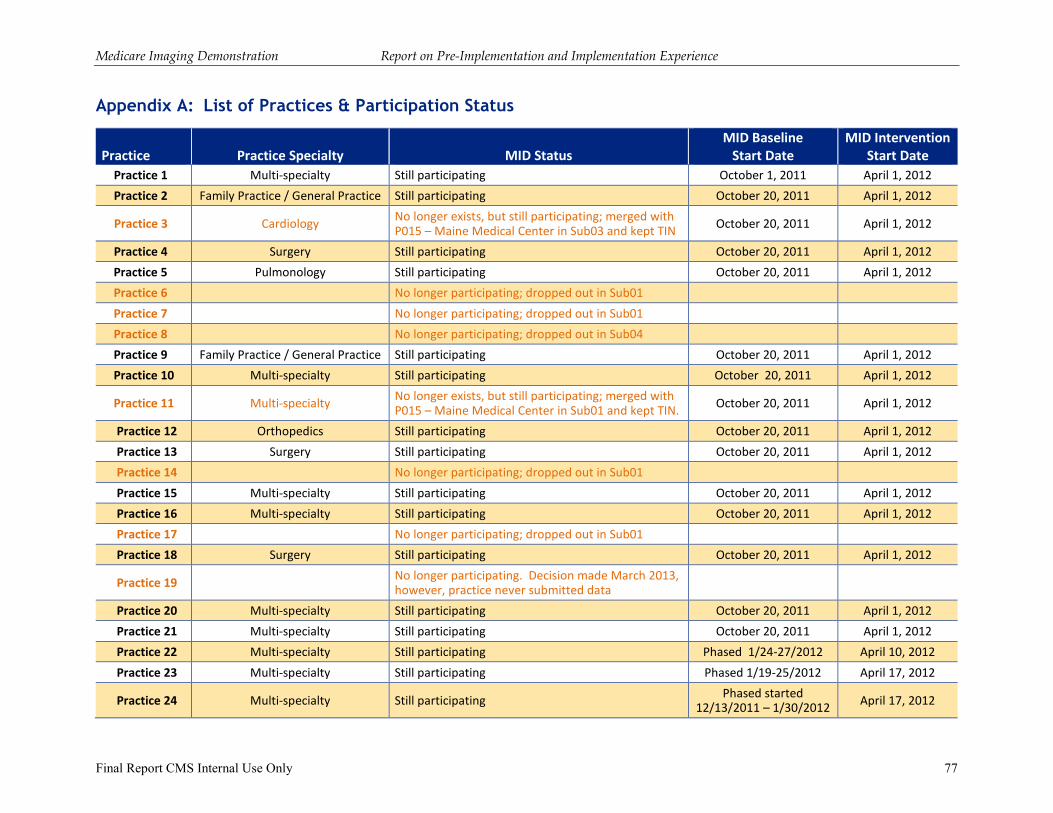
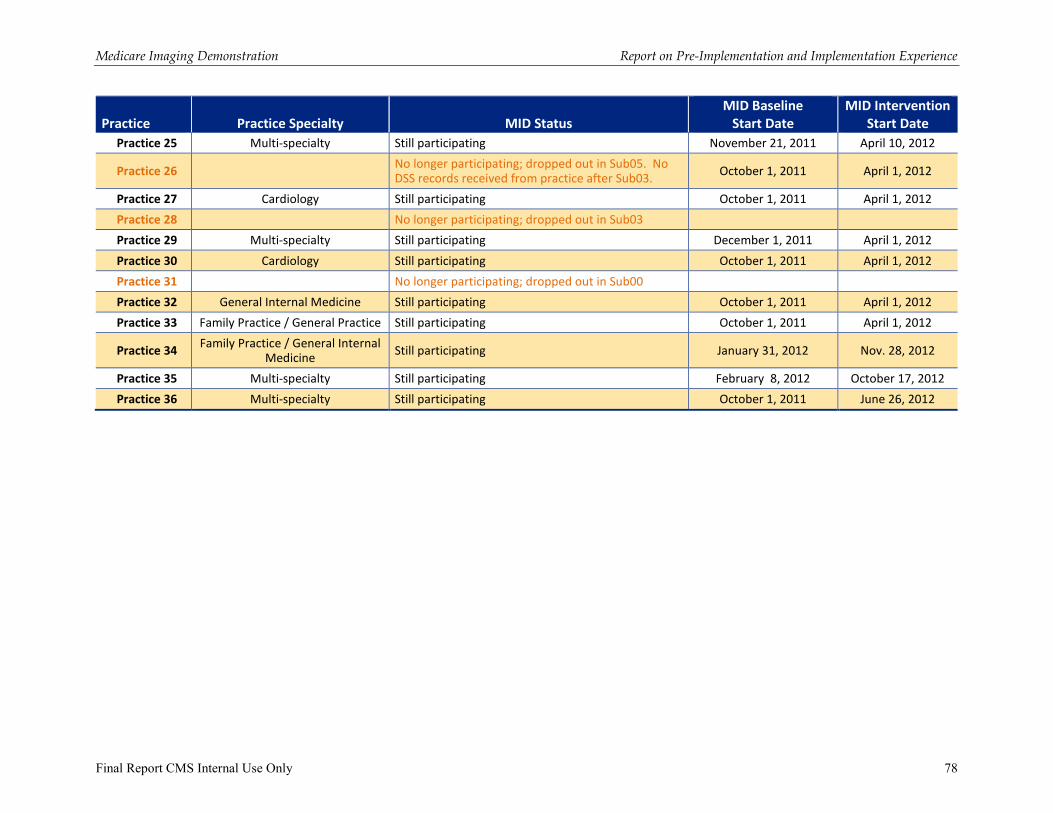
As noted previously, five conveners were selected for participation in the MID. The proposals from these five conveners included 36 practices for participation in the demonstration. CMS, based on prior experience, anticipated that there could be attrition in practice participation. There were two conveners that did experience practice attrition. In addition to the anticipated attrition, one convener experienced several practice mergers among practices in the demonstration, as well as practices that had not been demonstration participants but merged with a practice that did participate and thus joined the demonstration. As of the end of the demonstration period in September 2013, 276 of the 36 practices included in the original proposals were still participating.
Exhibit 5 provides information on the number of practices included in the original proposals from conveners, the number of participating practices as of September 2013, and the state location of
5 Or practice specific demonstration launch date. 6 Within this count there are two practices that merged into another practice, so that the final count of practices at the end of the demonstration period is 25.
Medicare Imaging Demonstration Report on Pre-Implementation and Implementation Experience
Final Report CMS Internal Use Only 9
these practices. A detailed listing of all the practices and their participation status is contained in Appendix A.
Exhibit 5: Number of Practices and State Locations of Practices
States
Maine. Massachusetts, Michigan, New Jersey, New York, Pennsylvania, Texas, Wisconsin
Number of Practices in Proposals
Number of Practices as of September 2013
36 257
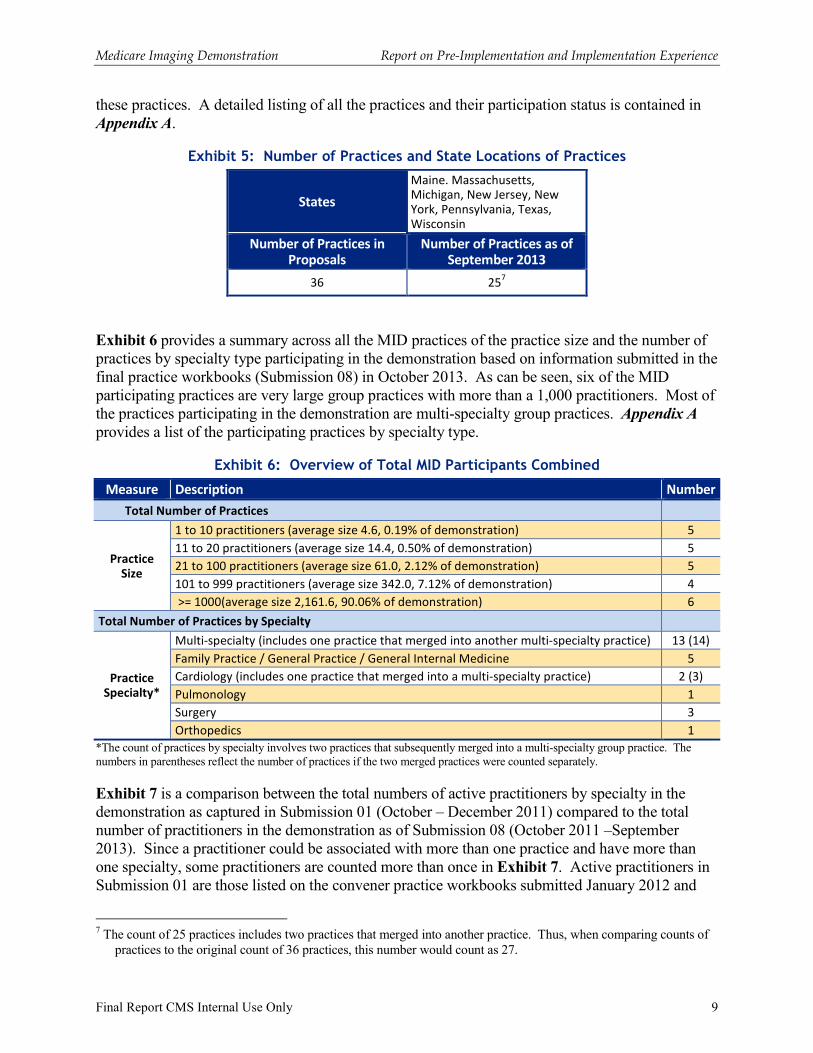
Exhibit 6 provides a summary across all the MID practices of the practice size and the number of practices by specialty type participating in the demonstration based on information submitted in the final practice workbooks (Submission 08) in October 2013. As can be seen, six of the MID participating practices are very large group practices with more than a 1,000 practitioners. Most of the practices participating in the demonstration are multi-specialty group practices. Appendix A provides a list of the participating practices by specialty type.
Exhibit 6: Overview of Total MID Participants Combined
Measure Description Number
Total Number of Practices
Practice Size
1 to 10 practitioners (average size 4.6, 0.19% of demonstration) 5
11 to 20 practitioners (average size 14.4, 0.50% of demonstration) 5
21 to 100 practitioners (average size 61.0, 2.12% of demonstration) 5
101 to 999 practitioners (average size 342.0, 7.12% of demonstration) 4
>= 1000(average size 2,161.6, 90.06% of demonstration) 6
Total Number of Practices by Specialty
Practice Specialty*
Multi-specialty (includes one practice that merged into another multi-specialty practice) 13 (14)
Family Practice / General Practice / General Internal Medicine 5
Cardiology (includes one practice that merged into a multi-specialty practice) 2 (3)
Pulmonology 1
Surgery 3
Orthopedics 1
*The count of practices by specialty involves two practices that subsequently merged into a multi-specialty group practice. The numbers in parentheses reflect the number of practices if the two merged practices were counted separately.
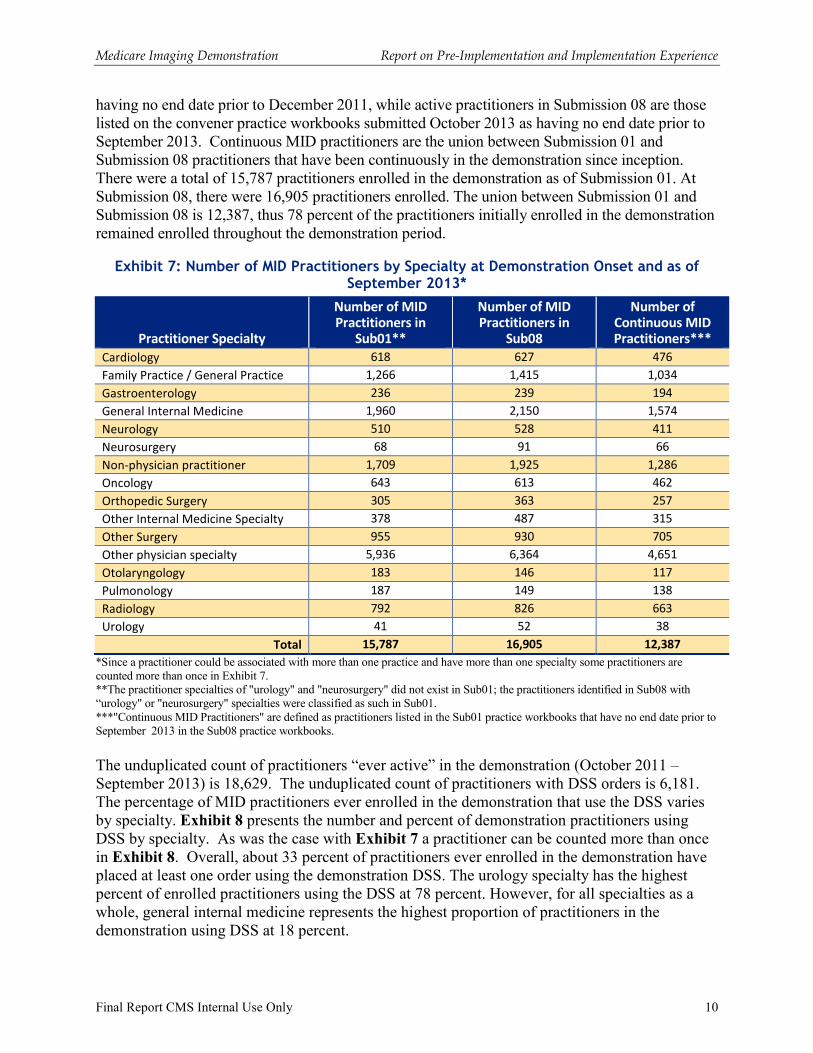
Exhibit 7 is a comparison between the total numbers of active practitioners by specialty in the demonstration as captured in Submission 01 (October – December 2011) compared to the total number of practitioners in the demonstration as of Submission 08 (October 2011 –September 2013). Since a practitioner could be associated with more than one practice and have more than one specialty, some practitioners are counted more than once in Exhibit 7. Active practitioners in Submission 01 are those listed on the convener practice workbooks submitted January 2012 and
7 The count of 25 practices includes two practices that merged into another practice. Thus, when comparing counts of practices to the original count of 36 practices, this number would count as 27.
Medicare Imaging Demonstration Report on Pre-Implementation and Implementation Experience
Final Report CMS Internal Use Only 10
having no end date prior to December 2011, while active practitioners in Submission 08 are those listed on the convener practice workbooks submitted October 2013 as having no end date prior to September 2013. Continuous MID practitioners are the union between Submission 01 and Submission 08 practitioners that have been continuously in the demonstration since inception. There were a total of 15,787 practitioners enrolled in the demonstration as of Submission 01. At Submission 08, there were 16,905 practitioners enrolled. The union between Submission 01 and Submission 08 is 12,387, thus 78 percent of the practitioners initially enrolled in the demonstration remained enrolled throughout the demonstration period.
Exhibit 7: Number of MID Practitioners by Specialty at Demonstration Onset and as of September 2013*
Practitioner Specialty
Number of MID Practitioners in
Sub01**
Number of MID Practitioners in
Sub08
Number of Continuous MID Practitioners***
Cardiology 618 627 476
Family Practice / General Practice 1,266 1,415 1,034
Gastroenterology 236 239 194
General Internal Medicine 1,960 2,150 1,574
Neurology 510 528 411
Neurosurgery 68 91 66
Non-physician practitioner 1,709 1,925 1,286
Oncology 643 613 462
Orthopedic Surgery 305 363 257
Other Internal Medicine Specialty 378 487 315
Other Surgery 955 930 705
Other physician specialty 5,936 6,364 4,651
Otolaryngology 183 146 117
Pulmonology 187 149 138
Radiology 792 826 663
Urology 41 52 38
Total 15,787 16,905 12,387
*Since a practitioner could be associated with more than one practice and have more than one specialty some practitioners are counted more than once in Exhibit 7. **The practitioner specialties of "urology" and "neurosurgery" did not exist in Sub01; the practitioners identified in Sub08 with “urology" or "neurosurgery" specialties were classified as such in Sub01. ***"Continuous MID Practitioners" are defined as practitioners listed in the Sub01 practice workbooks that have no end date prior to September 2013 in the Sub08 practice workbooks.
The unduplicated count of practitioners “ever active” in the demonstration (October 2011 – September 2013) is 18,629. The unduplicated count of practitioners with DSS orders is 6,181. The percentage of MID practitioners ever enrolled in the demonstration that use the DSS varies by specialty. Exhibit 8 presents the number and percent of demonstration practitioners using DSS by specialty. As was the case with Exhibit 7 a practitioner can be counted more than once in Exhibit 8. Overall, about 33 percent of practitioners ever enrolled in the demonstration have placed at least one order using the demonstration DSS. The urology specialty has the highest percent of enrolled practitioners using the DSS at 78 percent. However, for all specialties as a whole, general internal medicine represents the highest proportion of practitioners in the demonstration using DSS at 18 percent.
Medicare Imaging Demonstration Report on Pre-Implementation and Implementation Experience
Final Report CMS Internal Use Only 11
Exhibit 8: Number and Percent of MID Practitioners by Specialty Using DSS
This table was calculated by identifying all active MID practitioners (October 2011-September 2013) as ever active and as having at least one DSS order in the Sub09 DSS data (October 2011-September 2013). *Because a practitioner can be associated with more than one practice and report different specialties by practice a practitioner can be counted more than once in Exhibit 8. The unduplicated count of practitioners is 18,629. **The unduplicated count of practitioners with at least one DSS order is 6,181.
Medicare Imaging Demonstration Report on Pre-Implementation and Implementation Experience
Final Report CMS Internal Use Only 12
II. Decision Support Systems, Demonstration Data Collection, and Feedback Reports
A. Decision Support Systems
1. Interface/Functionality
CMS established the following requirements for the MID decision support systems:
� DSS must include decision support ordering for the 12 targeted MID procedures;
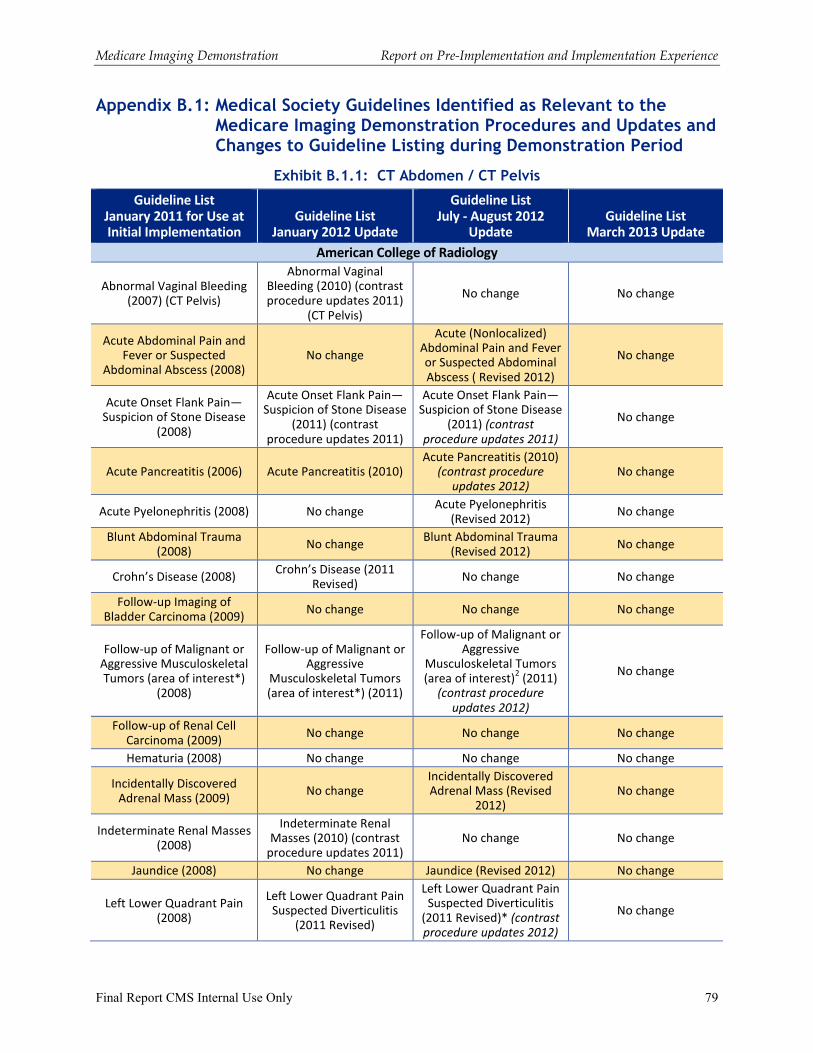
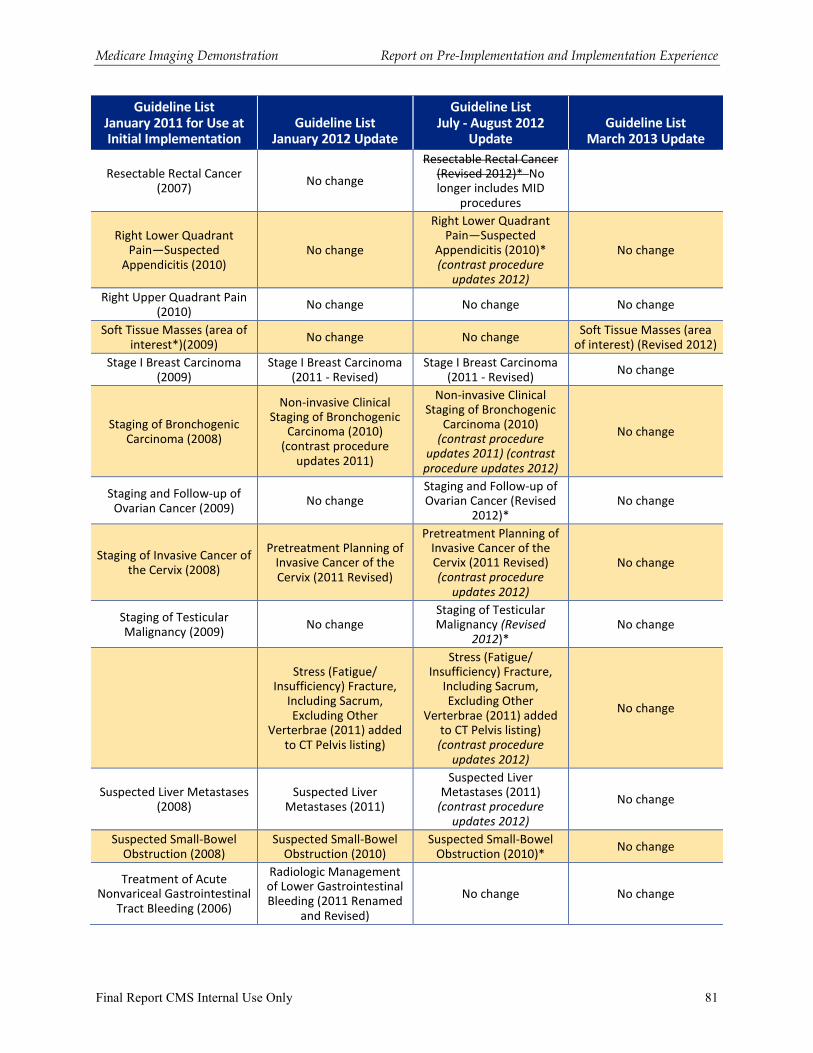
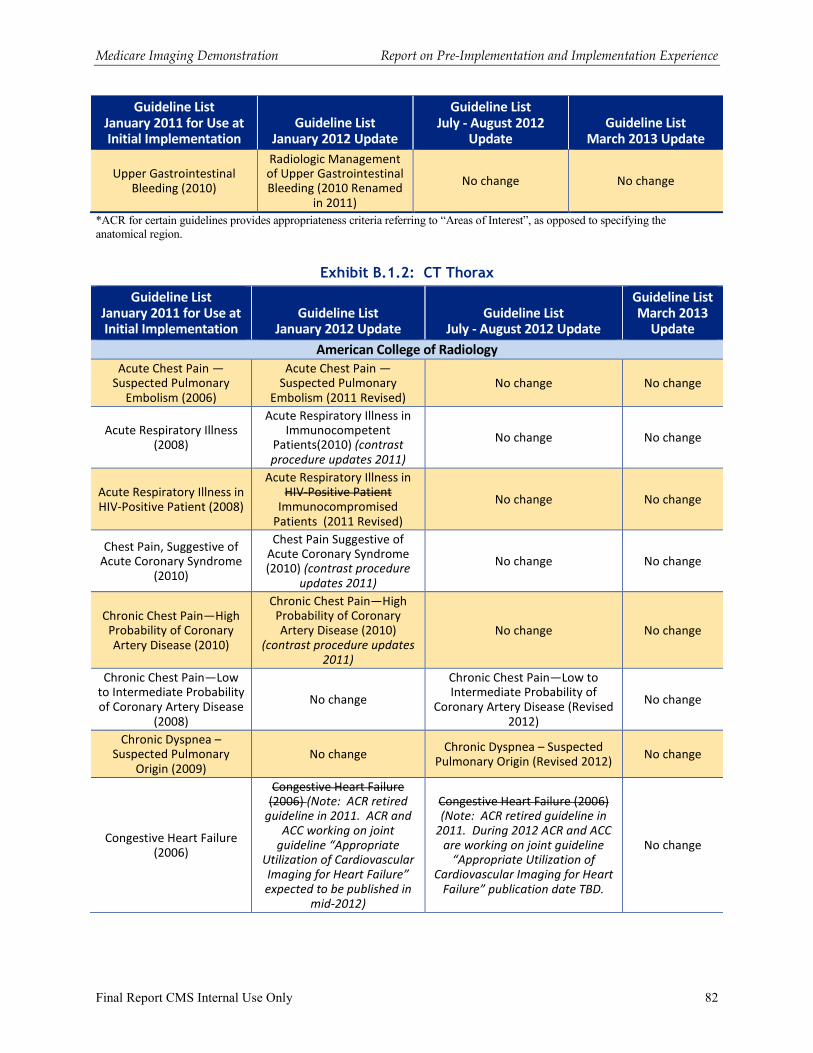
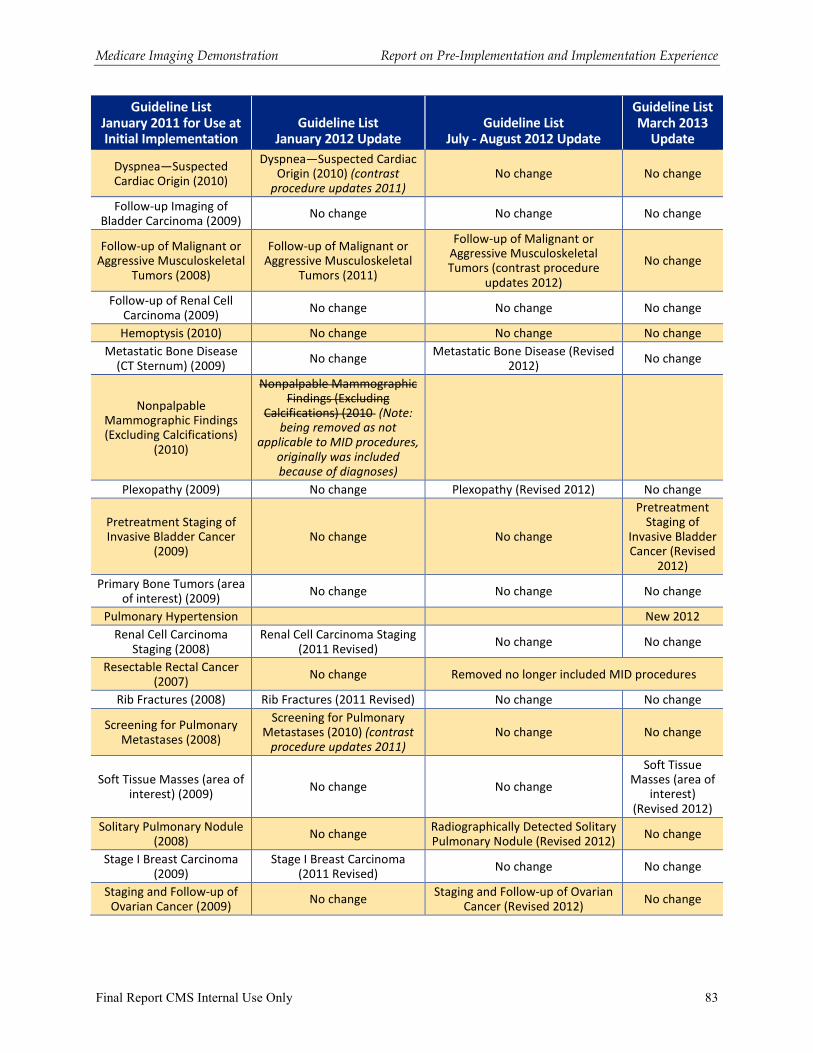
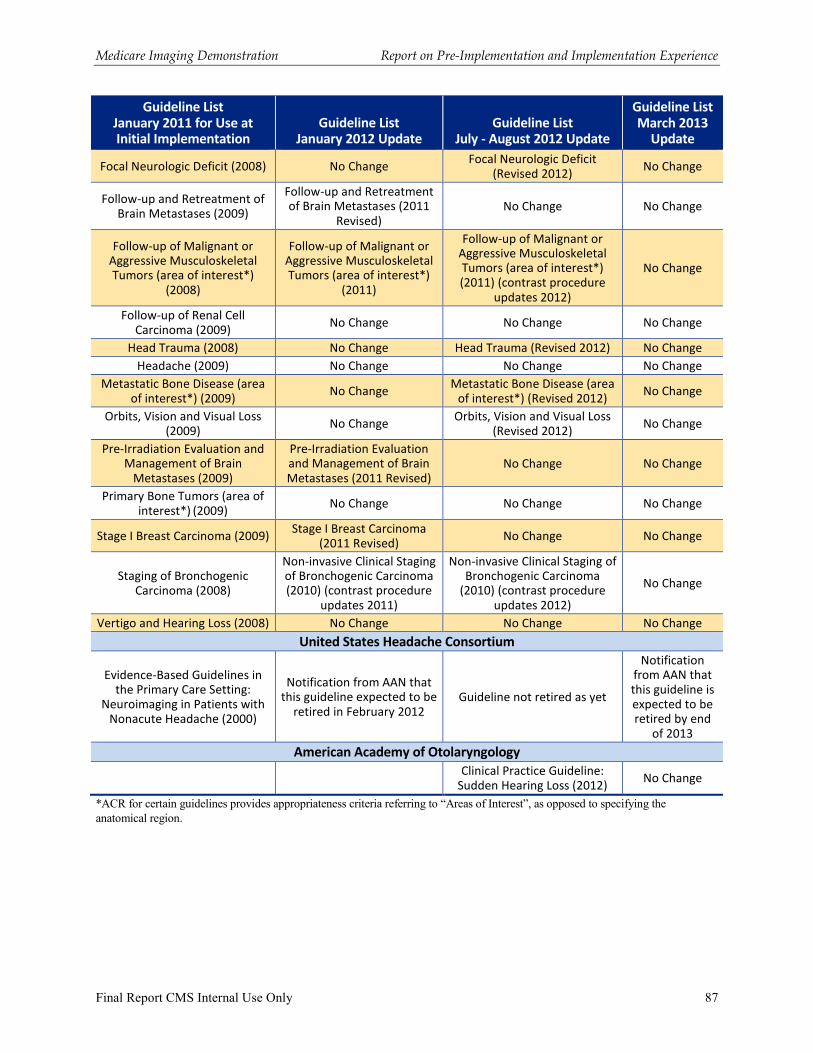
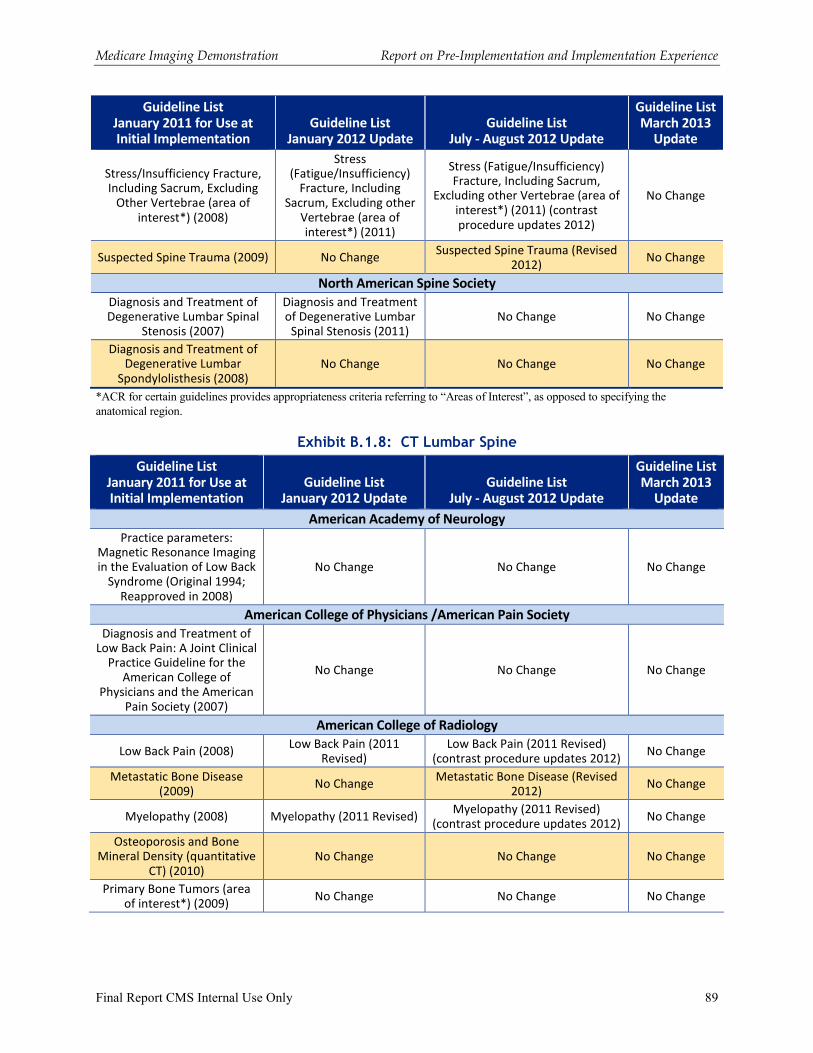
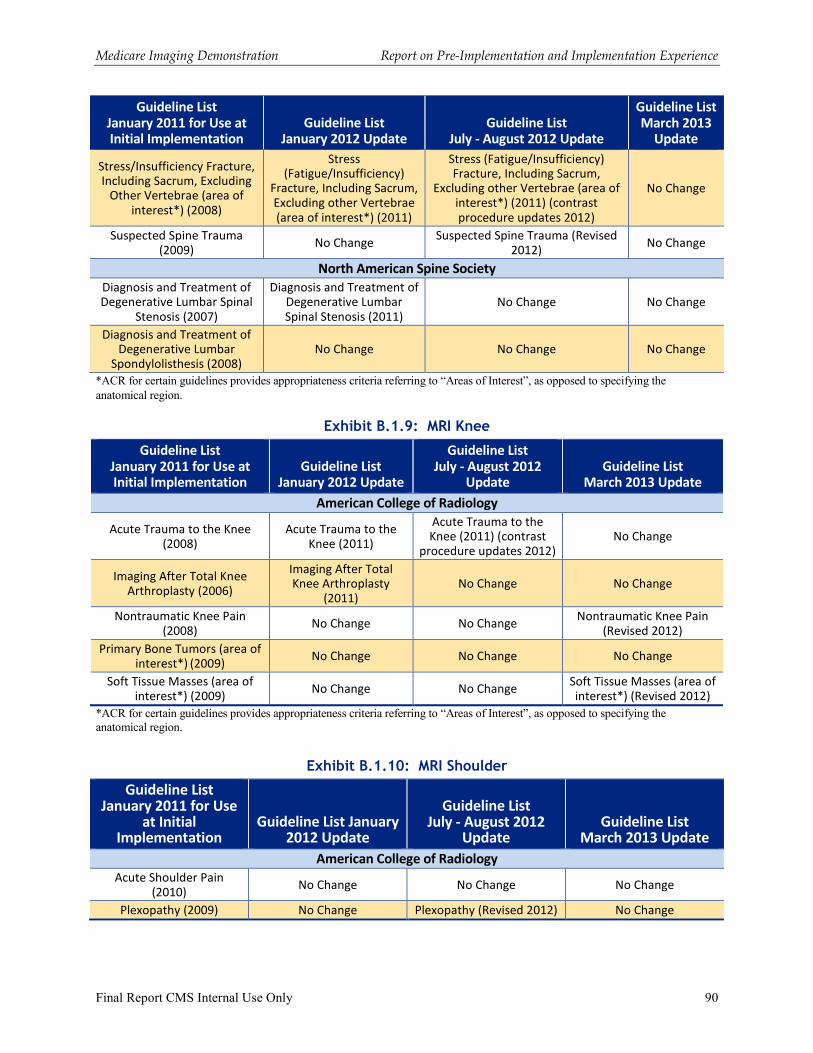
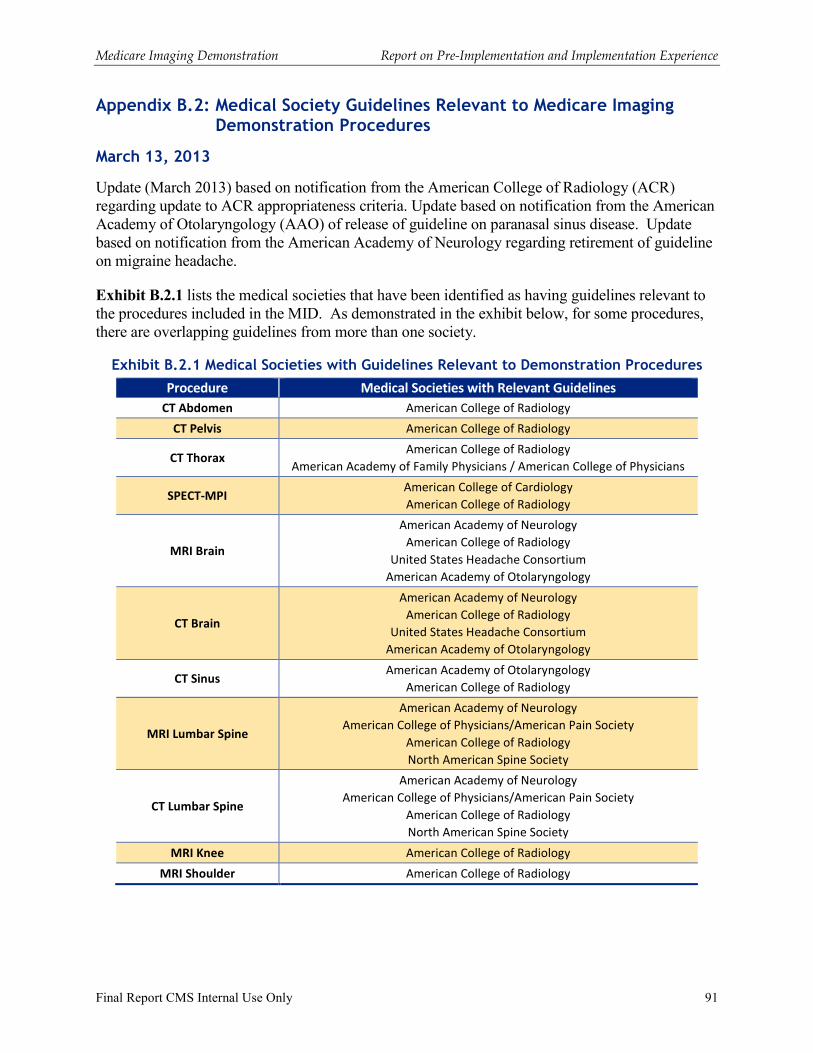
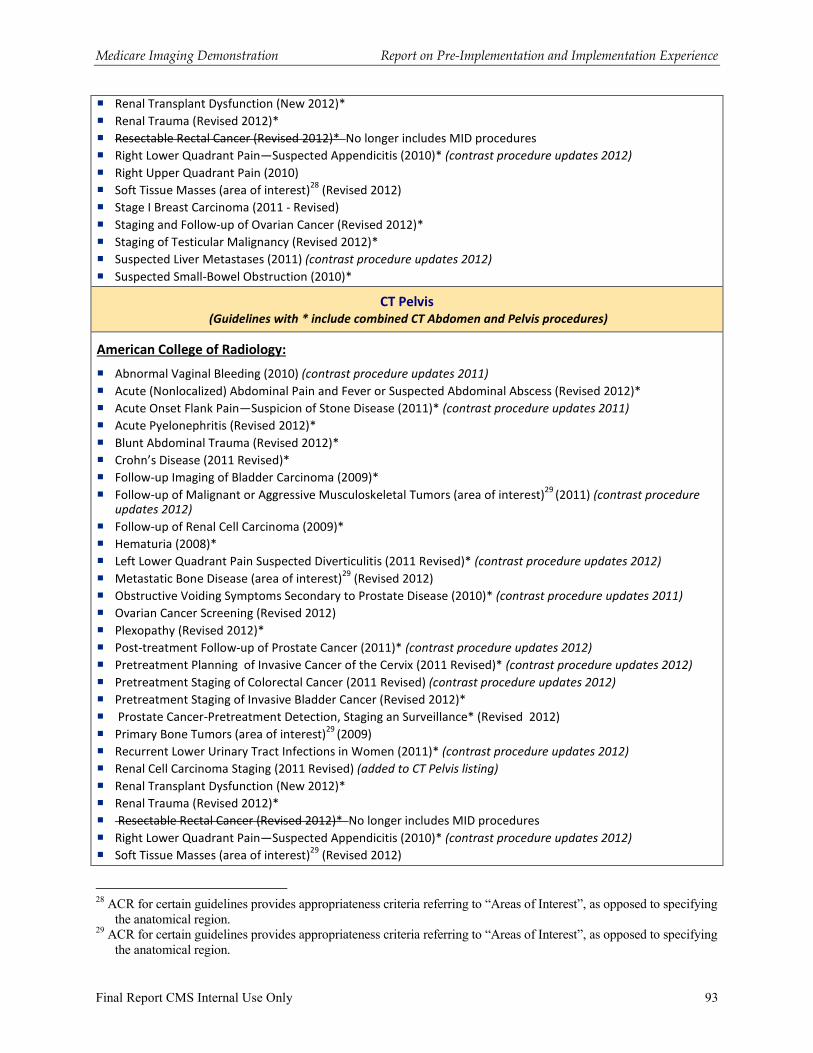
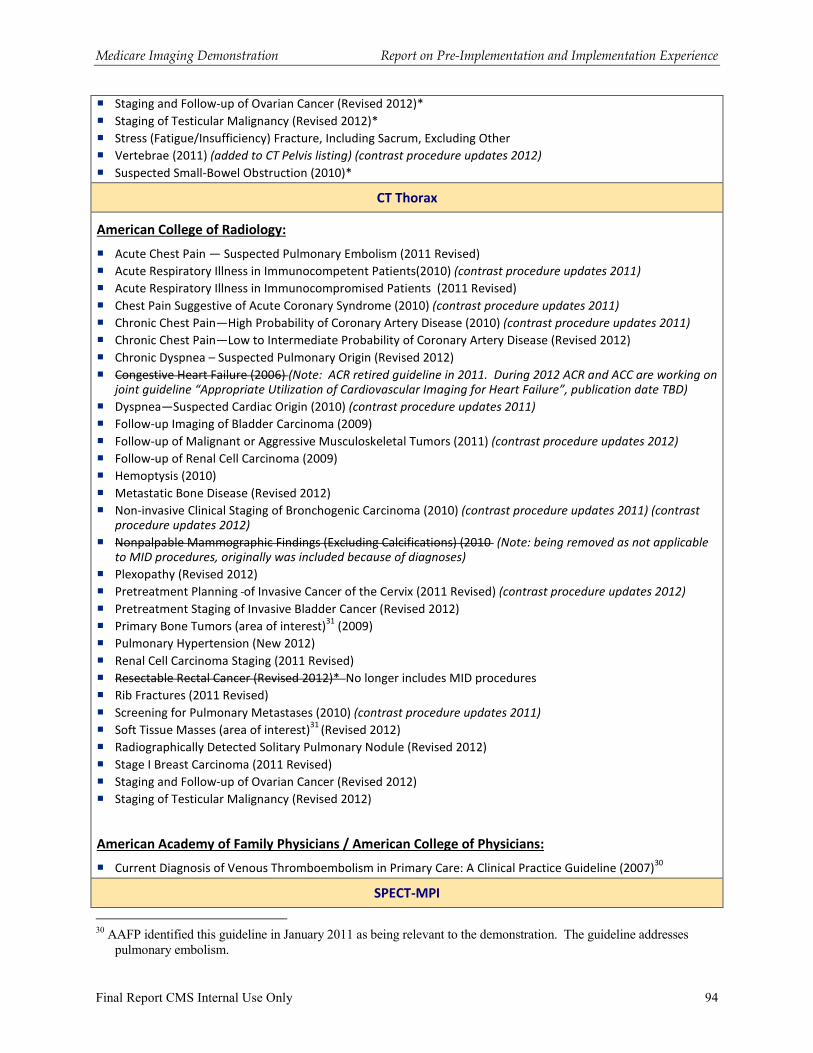
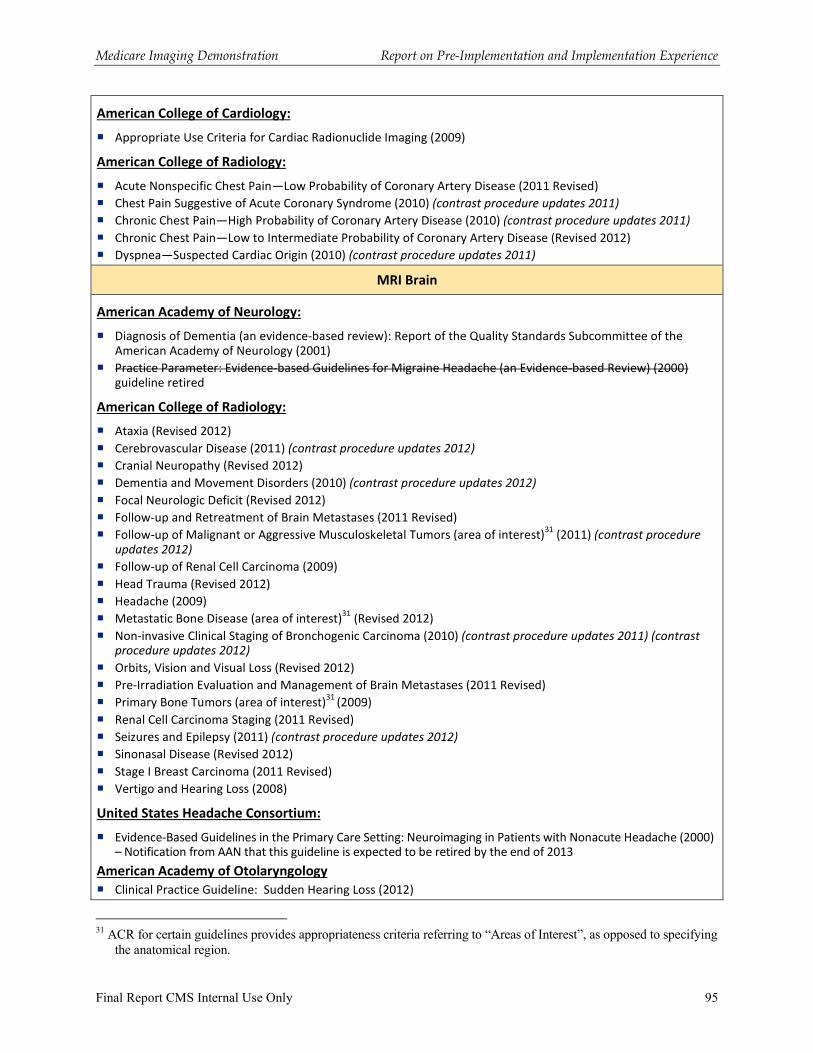
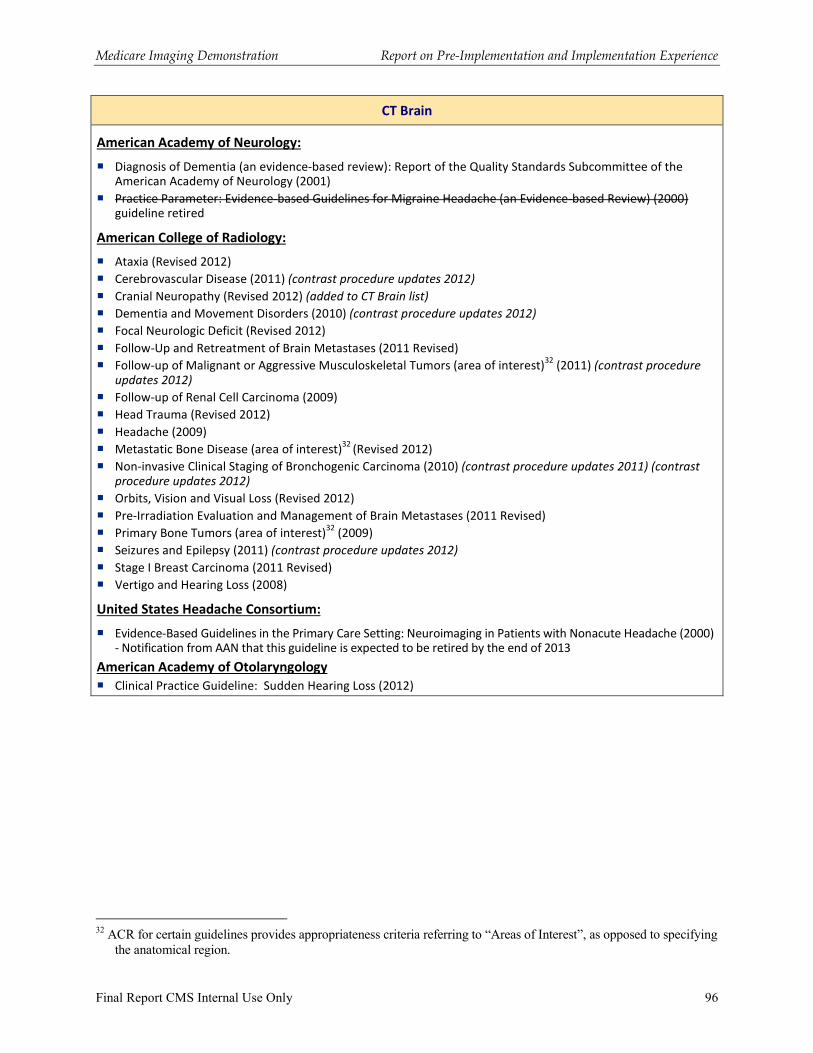
� DSS must evaluate these procedures using the medical specialty society guidelines identified by CMS (see Appendix B.1);
� Except during the (pre-intervention) baseline data collection period, systems must be transparent and show the source of the medical specialty society guidelines that underlies the DSS algorithm logic for order determination;
� DSS must provide an assessment that conveys to the ordering practitioners whether the orders for advanced diagnostic imaging services are: appropriate, uncertain, not appropriate, or not covered by medical society guidelines;
� During the (pre-intervention) baseline data collection period, the assessment on appropriateness will not be presented in the user interface, but the DSS will capture the assessment on appropriateness data “behind the scene”;
� Except during the (pre-intervention) baseline data collection period, DSS must provide decision support feedback on appropriateness (including, if applicable, more appropriate alternative procedures, or additional procedures recommended) to ordering practitioner at the time of order;
� In the event that the medical society guidelines are updated, the DSS must be modified to reflect updated guidelines, and the convener must ensure that these modifications transpire and are timely;
� DSS must have the capacity to distinguish between advanced diagnostic imaging services for the MID targeted procedures and other imaging services;
� DSS must comply with all applicable federal and state privacy and security requirements for the transfer and storage of protected health information data as well as controlling access to the system for data entry;
� DSS must be consistent with current Medicare policy (e.g., covered services); and
� DSS must collect all required data fields specified in the CMS data collection requirements (see Section II.B).
In order to assess compliance with these requirements, Lewin did testing using a limited set of clinical case scenarios developed by the medical specialty societies whose guidelines were identified as relevant to the MID procedures. Two rounds of testing occurred: the first prior to the launch of the baseline period, and the second prior to launch of the intervention period. Both Lewin and the conveners were involved in conducting testing and comparisons were made on testing results. The testing process was used to identify issues that conveners needed to correct. Retesting was conducted after the identified issues were corrected.
Medicare Imaging Demonstration Report on Pre-Implementation and Implementation Experience
Final Report CMS Internal Use Only 13
2. Limitations
One of the issues identified during the planning for the demonstration involved how many imaging procedures could be scored based on medical society guidelines. During the environmental scan, conducted as part of the design phase for the demonstration, stakeholder interviews indicated that DSS vendors were routinely going beyond medical society guidelines because the guidelines did not sufficiently address the clinical situations that were arising in the use of decision support tools for ordering advanced imaging procedures. DSS vendors reported using additional clinical evidence from research to support the development of the algorithm logic used in “scoring” imaging orders. Software vendors also employed guidelines provided to them by their clients, although it was not always clear how these additional guidelines were developed or specific references for their clinical evidence. However, because of the statutory requirements for the MID, it was acknowledged that existing systems would have to be modified in order to limit the algorithm logic to be based solely on medical society guidelines. Radiology chairs from the larger practices/hospitals requested confirmation that the department’s protocols could over-ride the DSS without penalty under the demonstration. During the in-person meeting with conveners after the completion of the demonstration the conveners noted that the over reliance on medical society guidelines as the evidence base for the decision support systems under the MID was a major impediment to the effectiveness of the use of DSS. Conveners advocated for not limiting sources of evidence to medical society guidelines and that differing sources should be used.
The required modification to adapt the DSS to limit the algorithm logic to just medical society guidelines was a major challenge that arose during the pre-implementation period. Two of the conveners ultimately changed the vendor sourcing to support their DSS for the demonstration. The American College of Radiology (ACR) became directly involved in responding to questions from conveners regarding guideline interpretation, and also worked extensively with two conveners supporting the DSS implementation interacting with the electronic records used by these two conveners and their practices.
The preparation of the DSS for the demonstration by the conveners and their vendors required extensive work, and ultimately the launch of the demonstration for the baseline period did not begin until October 2011. Even then, for a number of practices, the launch of the baseline period was delayed. Appendix A contains the launch dates for both the baseline and intervention periods for each of the participating practices.
A contributing factor to the delays encountered by some of the conveners and their practices was that the introduction of DSS for advanced imaging services required an integration / interoperability with the electronic medical record (EMR) system and newly established or existing radiology order entry (ROE) systems that were functioning as part of the EMR system. The interaction between the EMR and the DSS required data exchanges that would result in the necessary feedback on appropriateness scoring. During the February 2014 in-person meeting, it was noted that at the time of the original design of the MID in 2008-2009, the need for integration of DSS with EMRs and the challenges this might pose was not fully appreciated as this occurred before the enactment of the “Meaningful Use” funding. In addition, some of the user interface requirements for the MID such as easy access to the medical society guidelines, and some of the data collection requirements (e.g., attestation statement related to reviewing the DSS feedback) were not standard aspects of existing DSS systems or EMR user interfaces. There were also
Medicare Imaging Demonstration Report on Pre-Implementation and Implementation Experience
Final Report CMS Internal Use Only 14
challenges related to the sequencing of updates / change cycles for the EMR that influenced the timing of launching for MID baseline or intervention periods at some practices.
Several participants during the in-person meeting with conveners noted that in terms of DSS and EMR integration another lesson learned from the MID is the need to improve approaches to integration. Participants noted that, to the extent possible, practitioners should not need to enter information in the EMR related to patient symptoms and reason for visit, and then have to separately enter similar information on patient symptoms to support the use of DSS as part of the radiology ordering process. Conveners also discussed that the use of DSS needs to be built into meaningful use requirements of EMRs. Conveners suggested though, rather than specifying procedures and specific guidelines, meaningful use should focus on what a system should be capable of doing and on effectiveness.
Discussed in greater detail in Section III, the experience of all conveners in the MID was that a large share of the orders could not be scored by medical society guidelines. Furthermore, the nature of the user interface of some conveners seemed to influence the frequency at which the users would default to symptom selection categories, which had the consequence of resulting in orders not being covered by guidelines because certain categories (e.g., other, or single symptoms, use of text entry) were not tied to an appropriateness algorithm. Specifically during the baseline period, two conveners experienced significantly higher shares than other conveners of orders not being covered by guidelines / not scored. Both of these conveners attempted to address this issue. One of the conveners made substantial modifications to its user interface which did result in the share of orders not receiving a score becoming more consistent with the experience of other conveners. See Section V.C.
Conveners during the in-person meeting after the completion of the demonstration emphasized several other lessons learned in terms of the MID design features. First, there was general agreement among conveners that immediate feedback from DSS should be limited to those situations where there is actionable information for the practitioner (i.e., order assessed as inappropriate). Providing feedback when an order was assessed appropriate or when the guidelines did not contain an evidence base that addressed a clinical situation (not covered by guidelines) was disruptive to workflow and provided no value to the ordering practitioner. The attestation requirement was also considered disruptive to workflow. Conveners noted the importance of avoiding unnecessary “clicks” and too many “low value alerts” which become “noise” and result in “alert fatigue.” The resulting reaction may have the unintended consequence of the user ultimately ignoring even useful information provided by decision support.
Conveners also discussed the importance of terminology. For example, the terminology not covered by guidelines proved to be very confusing, and could be misinterpreted as implying that the ordering practitioner was doing something wrong. Convener representatives indicated that more thought around terminology to be used in decision support will be important in design of future demonstrations.
Conveners noted that the MID design took an approach of a “one-size” fits all ordering practitioners. Several, conveners suggested that a possible lesson learned from the MID experience is that it may be necessary to distinguish between DSS designed for generalists versus
Medicare Imaging Demonstration Report on Pre-Implementation and Implementation Experience
Final Report CMS Internal Use Only 15
specialists. Conveners noted that general practitioners may prefer to initiate the decision support by entering patient symptoms, whereas specialists may prefer to start by putting in a specific order.
Third, several convener representatives noted that the scope of the MID was quite broad, covering a large number of common procedures. It was suggested that perhaps consideration should be given to more targeted use of DSS. For example, focusing in on where there are known problems in terms of specific procedures, clinical situations, or certain practitioners. As will be discussed subsequently related to medical society guidelines, a number of the convener participants in the context of targeting also noted the importance of considering the strength of the evidence base when selecting clinical targets.
B. Demonstration Data Collection Requirements
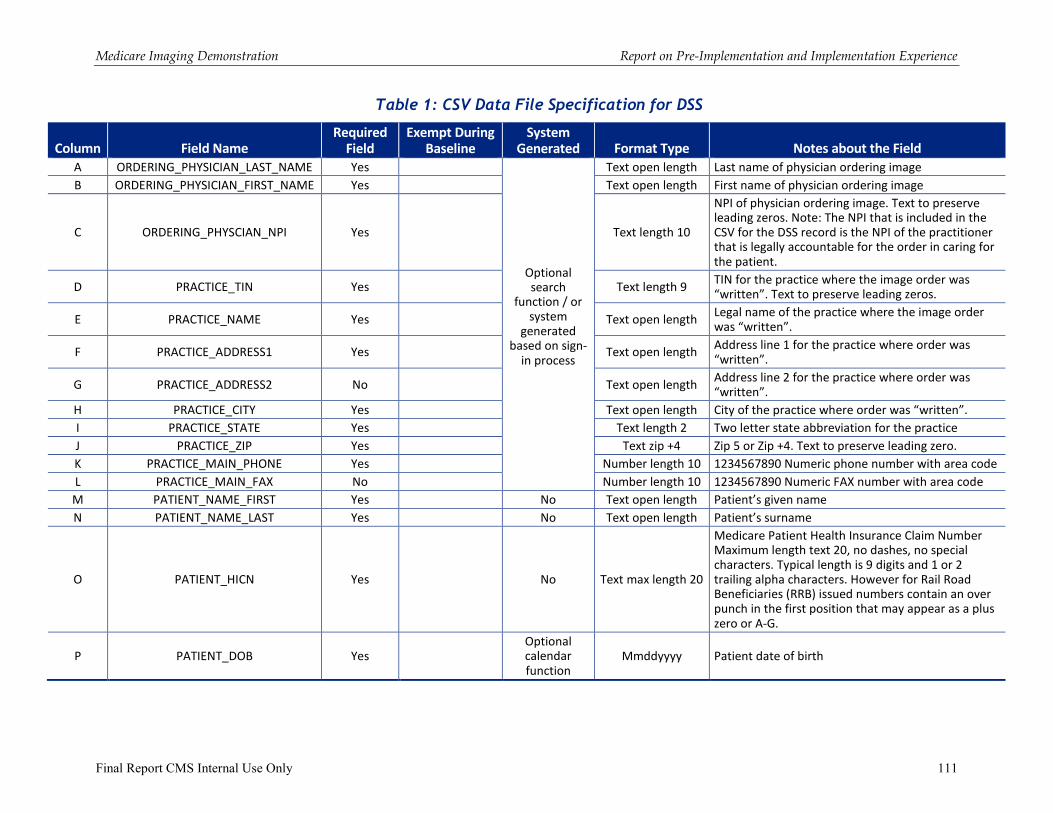
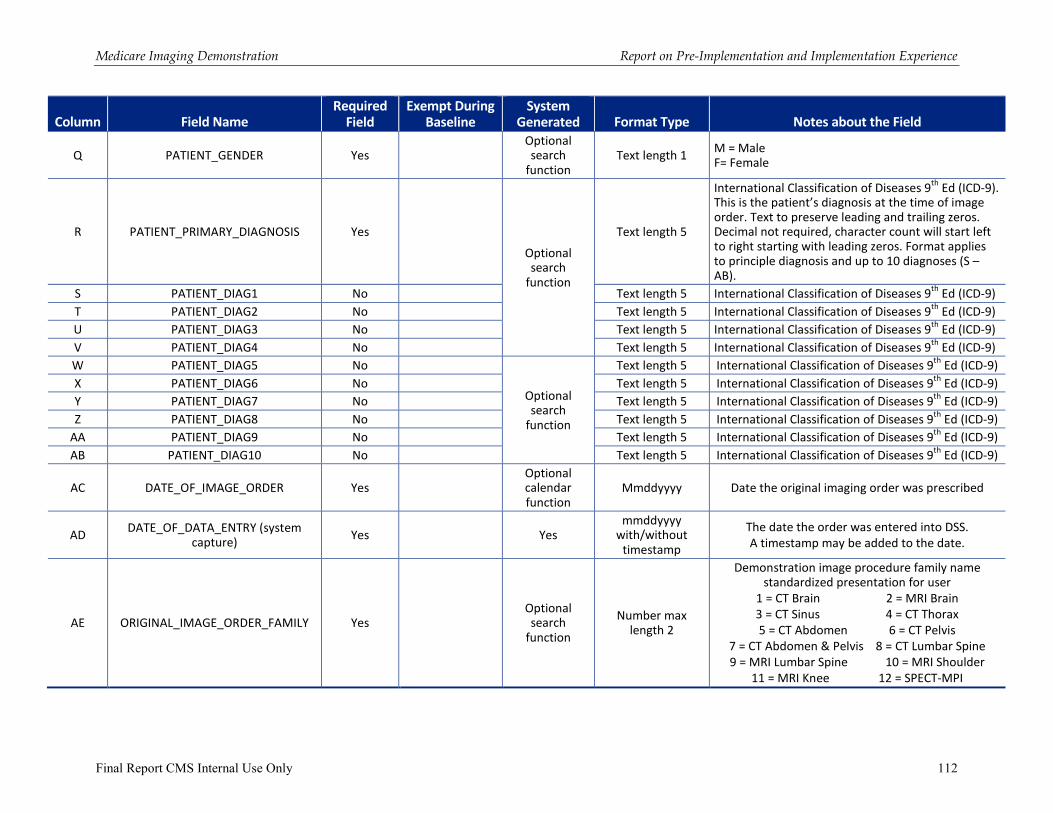
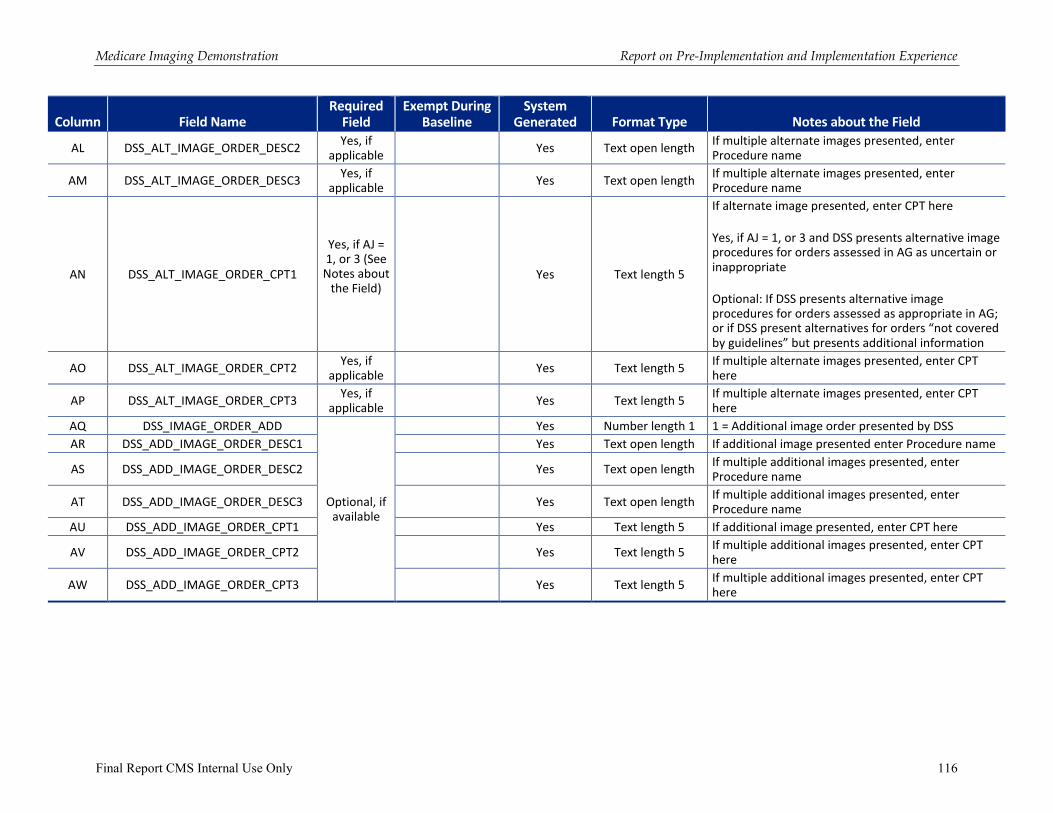
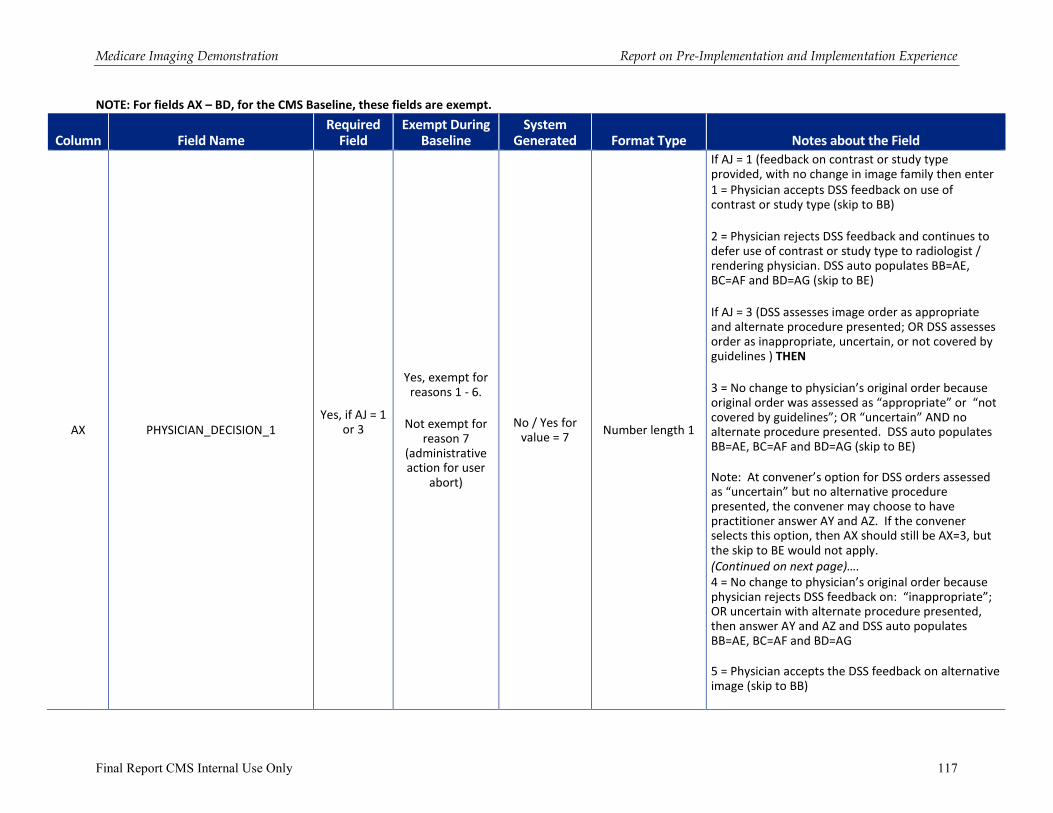
1. CSV Data File Specification for DSS — See Appendix D
The CSV Data File Specification was the expected file layout of the DSS data reported to CMS for the demonstration. While comma separated values format was requested, most conveners were able to submit acceptable data using Microsoft Excel.
The Design Report prepared by Lewin laid the groundwork for what the minimum reporting requirements would be for the conveners and presented a sample list of variables to be collected. Also in the Design Report, expected data flow logics were presented to CMS for a high level understanding of how the DSS data would be used and how Medicare claims data would be used.
In February 2011, the conveners were provided an initial version of the Medicare Imaging
Demonstration – Convener Data Collection Requirements and CSV File Specification and a portion of the kick-off meeting was dedicated to walking through the requirements. In the months that followed, Lewin participated in site visits with each convener. A key goal for these site visits was to walk through the data requirements in great detail and gain a clear understanding of the impact of these reporting requirements as it related to each convener’s radiology ordering workflow. Lewin staff gained valuable insight from each of the site visits that resulted in a dramatically expanded CSV File Specification and data flow than was envisioned initially.
From the revised CSV File Specification, it was determined that each convener would submit 50 test DSS records as a beta test of the process. For the beta test process, Lewin cut back the full CSV File Specification to a minimum data set version to lessen the burden of reporting on conveners. Beta testing took place in April 2011 and all five conveners actively supported the beta testing process by submitting minimum data for testing, which proved to be sufficient for understanding reporting capacity, convener work flow and begin preparations for baseline data processing.
While the demonstration baseline launch date was ultimately set for October 1, 2011 (see discussion in Section III), the CSV File Specification for reporting was not finalized until mid-December 2011. As the conveners actually moved into baseline launch and into intervention, there continued to be modest, but constructive, changes to the CSV File Specification in the form of
Medicare Imaging Demonstration Report on Pre-Implementation and Implementation Experience
Final Report CMS Internal Use Only 16
feedback on use of the DSS as it affected practice workflow. The last8 version of the CSV File Specification was issued April 10, 2012, shortly after the start of the intervention period, and remained in effect through the end of the demonstration. There were additional data variables that RAND requested of conveners, which were added to the data files.
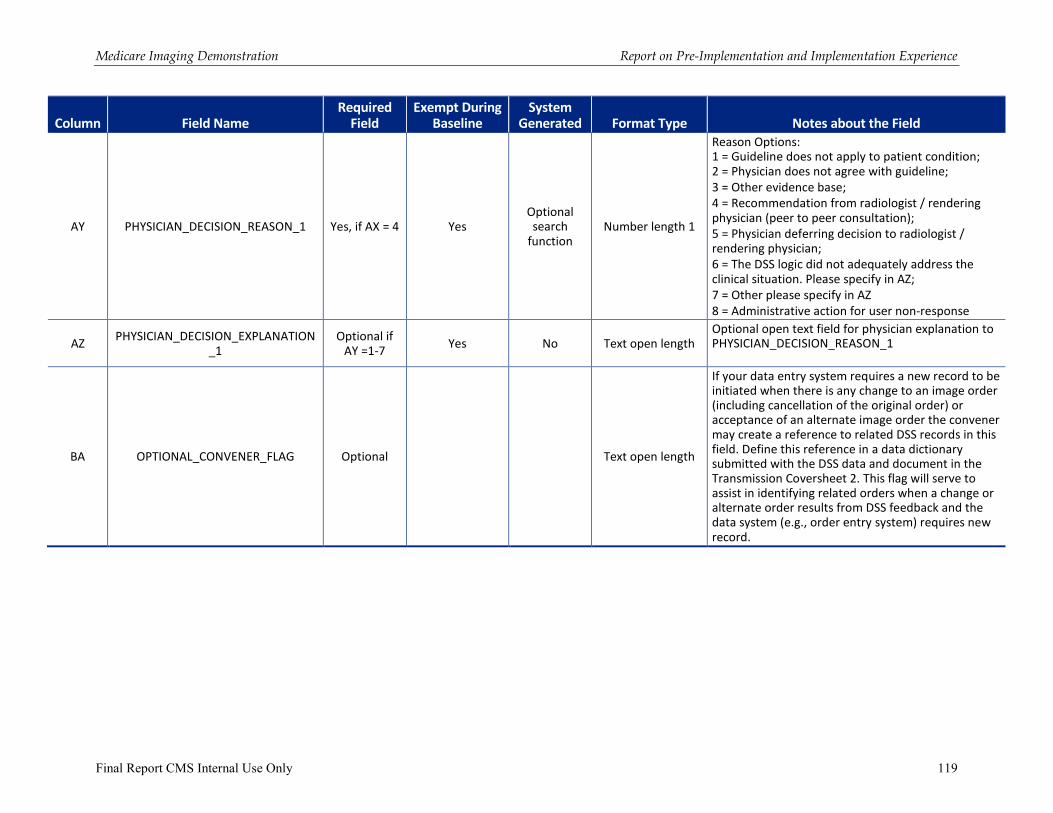
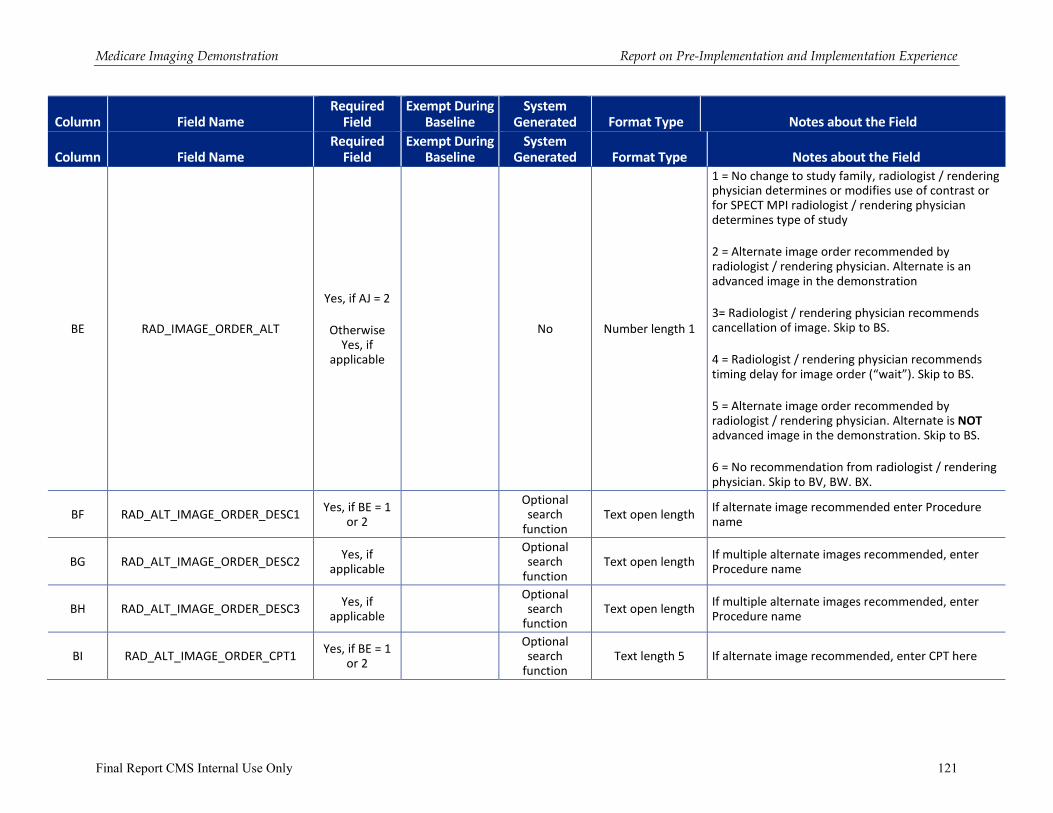
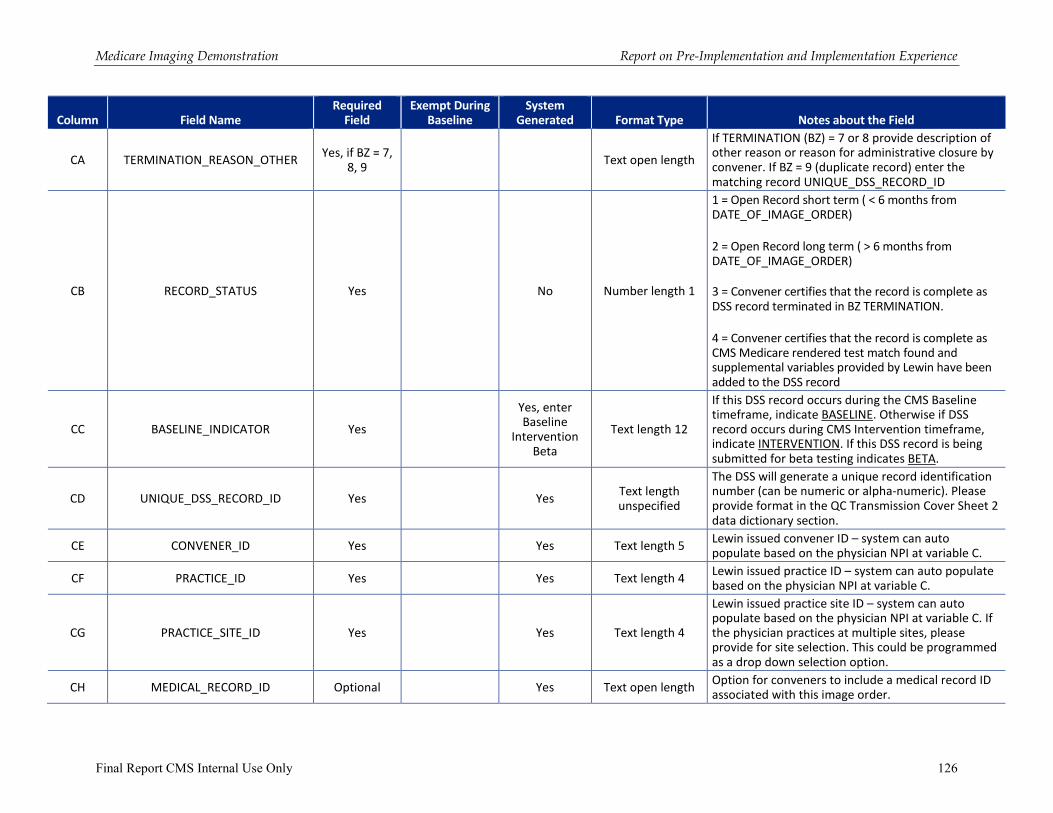
The majority of data collection requirements applied to both the baseline and intervention periods. There were some data variables that were only included in the intervention period as they related to the immediate feedback on appropriateness assessment that was provided to the ordering practitioner in the intervention period. The data requirements as specified in the CSV include collection of information in the following major areas:
� Identifying information on the ordering practitioner and practice
� Identifying information on the patient
� Patient date of birth and gender
� Patient diagnoses
� Date of order and information on the image being ordered
� Initial (original) appropriateness assessment of the DSS and alternative procedures recommended (if applicable)
� Cancellation of order (if applicable) – intervention period only
� Ordering practitioner attestation that the data to assess appropriateness of the image study and the DSS assessment were reviewed – intervention period only
� Physician decision making related to the DSS feedback – intervention period only
� Final image order decision
� Appropriateness assessment on the final order decision
� DSS record status variables
The CSV File Specification is available as Appendix D to this report.
2. Limitations
Based on discussions with the conveners the data requirements originally announced in the solicitation were modified somewhat. For example, the decision was made to drop the collection of information on study test results from radiology reports as this proved to be a very burdensome requirement on practices. Input from conveners also helped to refine response choices available for a number of the data variables.
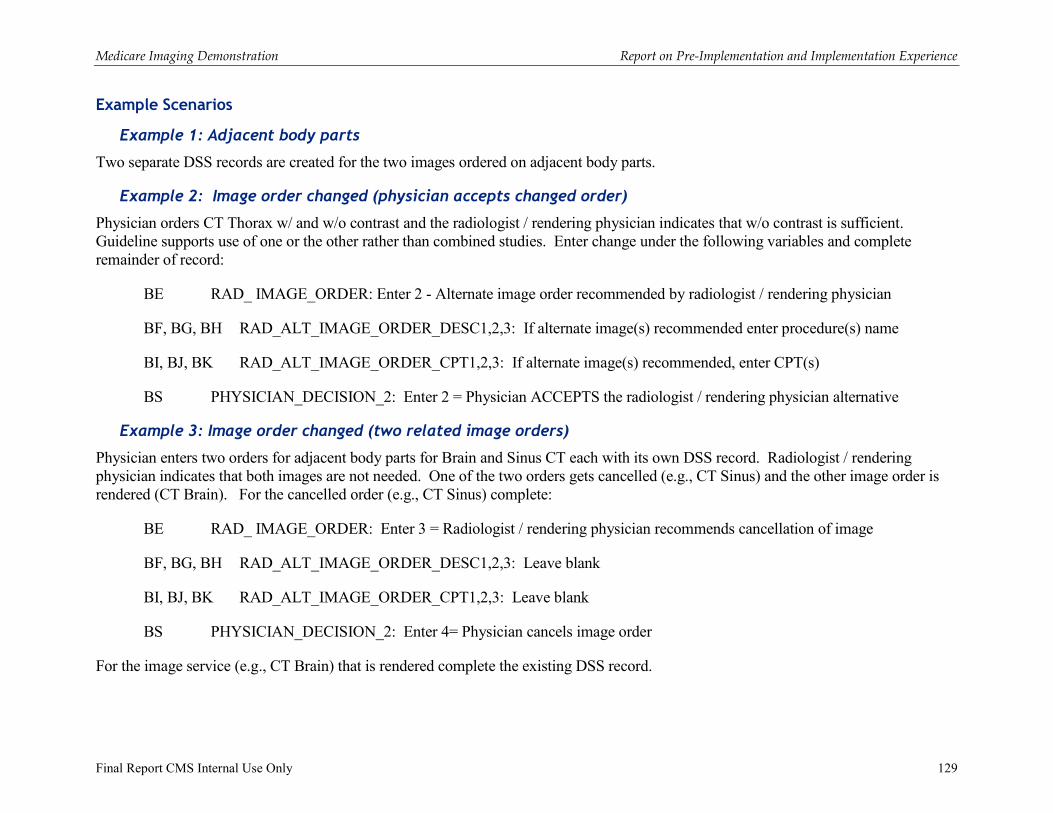
A set of data variables was also included in the CSV File Specification that attempted to gather information related to radiologist interventions that might change or cancel an order. Several conveners noted that capturing into the DSS data collection process the peer to peer consultations between ordering practitioners and radiologists was outside the normal workflow. Therefore upon
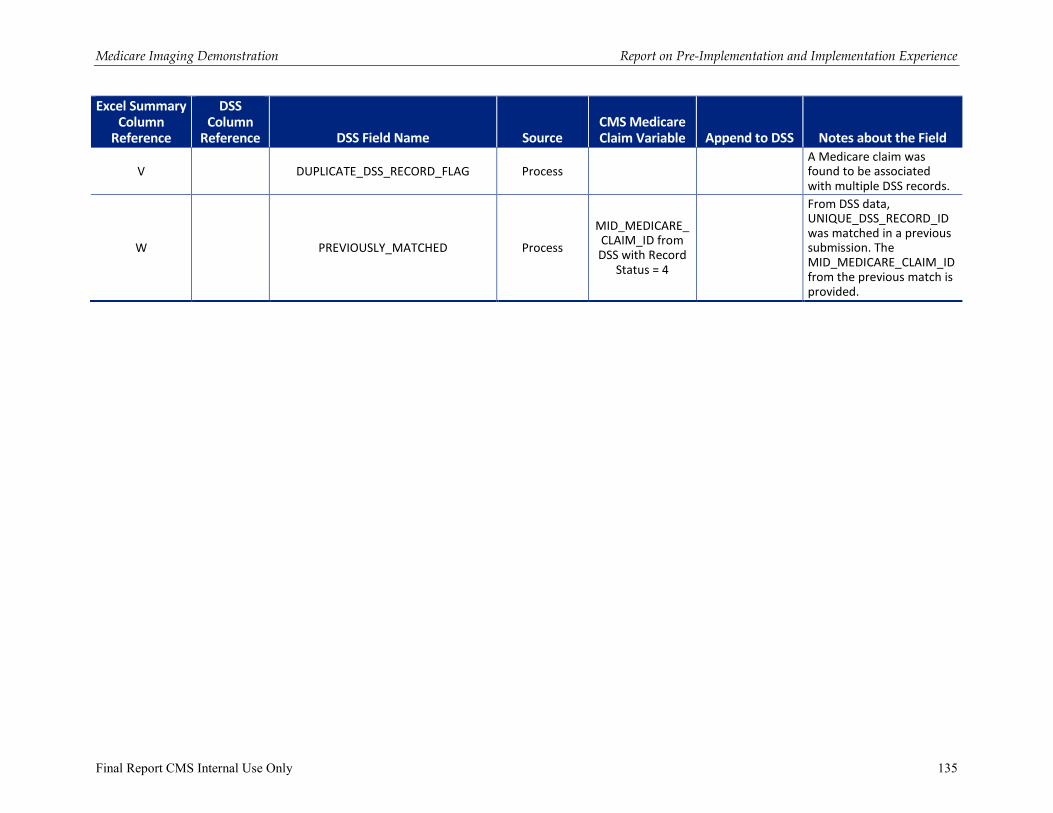
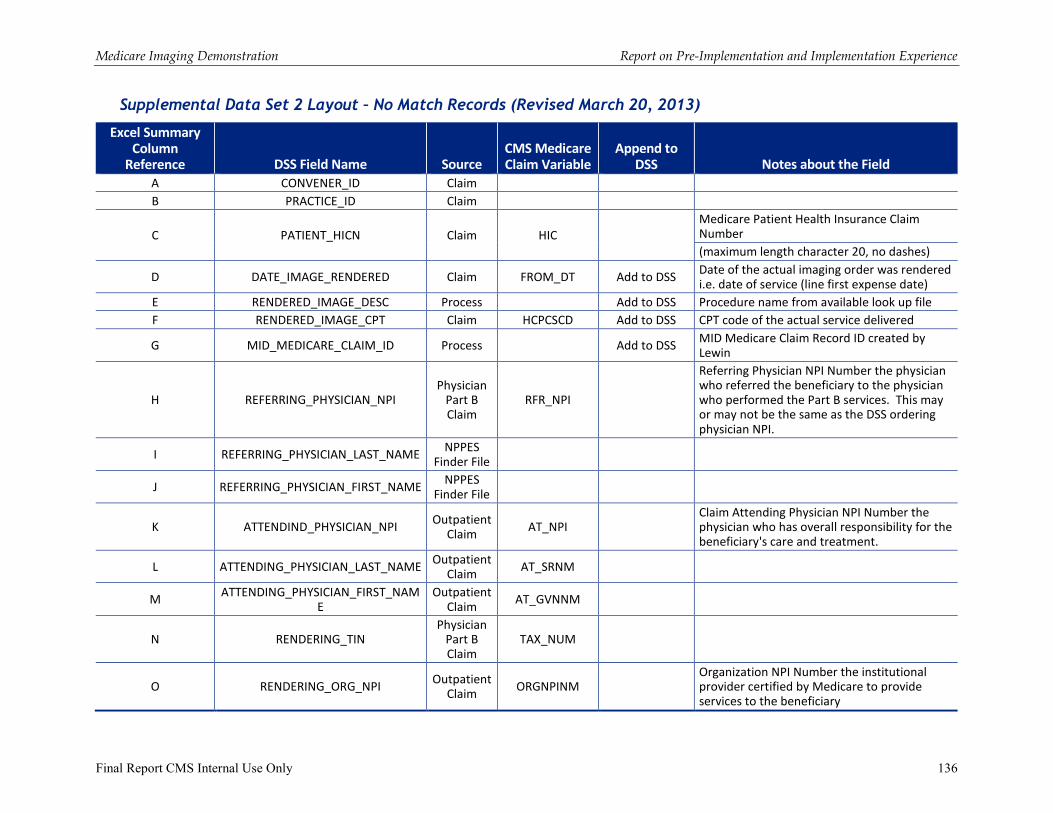
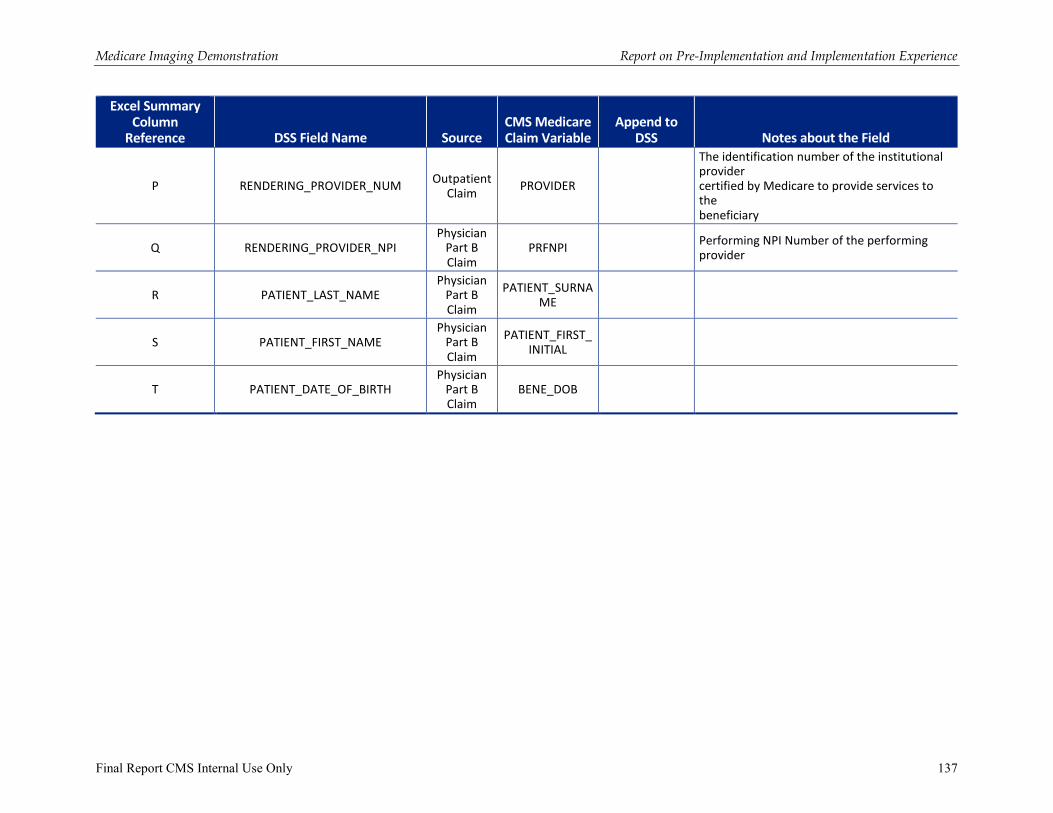
8 A new release of the CSV File Specification was issued on March 20, 2013, but with no implications to DSS data collection, only changes in the data that Lewin returned to the convener after Medicare claims matching were released in this version.
Medicare Imaging Demonstration Report on Pre-Implementation and Implementation Experience
Final Report CMS Internal Use Only 17
the request of the convener(s) these variables for capturing this peer to peer interaction were considered optional. Another challenge noted at the in-person meeting was that there is not a standardized approach in DSS for capturing information on “reason for order”.
At the end of the demonstration, two conveners had reported data for the radiology alternate image variables (BE – BR). One convener captured this data for 97 percent of the DSS records in the demonstration with 84 percent indicating no recommendation from radiologist; 13 percent of the DSS records are recorded as “no change”, “alternate image recommended” or “alternate image not in the demonstration”. Three percent were blank. The other convener captured this data for 55 percent of the DSS records (the majority are intervention records) in the demonstration with 49 percent indicating no recommendation from radiologist; 5.7 percent are recorded as “alternate image recommended” or “alternate image not in the demonstration”. Forty-five percent were blank.
C. Feedback Reports
In addition to providing DSS feedback about the appropriateness of an imaging order at the time that the order was entered, another component of the MID design and required by statute was providing periodic feedback to participating physicians and practices about their compliance with the medical specialty guidelines underlying the DSSs and how their imaging order patterns compared to those of their peers. Originally three cycles of feedback reporting at six-month intervals using the data from across the MID were planned to occur after completion of the baseline period. After discussion with conveners, the conveners elected to also provide feedback reports to practices at interim quarterly periods. As will be discussed subsequently conveners varied in the distribution of the optional interim reports.
1. Data
The feedback reports for the three MID-wide feedback cycles contained two measures based on appropriateness of orders with the source being the DSS data.
� Original test appropriateness: Each original order entered into the DSS was assessed and assigned to one of the following categories: appropriate, inappropriate, uncertain, or not covered by guideline related to the MID. Because of the large share of orders that were found to not be covered by guidelines, this measure was calculated in two manners: (i) All Inclusive: calculated four proportions based on whether original procedures were assigned to appropriate, inappropriate, uncertain, or not covered by guideline categories; (ii) Excluding “Not Covered by Guideline Records”: calculated three proportions based on whether original procedures were assigned (“scored”) to appropriate, inappropriate, or uncertain categories.
� Final test appropriateness: The appropriateness of the final test ordered also was collected in the DSS record for MID procedures. Since the ordering practitioner may change an original test order due to the appropriateness of the original test according to feedback from the DSS or a radiologist intervention, the final test ordered may or may not be different from the original test entered into the system. Some of the changes that may occur also included cancelling an order or changing to a non-MID procedure. In these later two cases there was not be a final determination submitted in the DSS data. This measure was calculated in a manner similar to the original test appropriateness i.e., there
Medicare Imaging Demonstration Report on Pre-Implementation and Implementation Experience
Final Report CMS Internal Use Only 18
were two calculations: (i) All Inclusive, and (ii) Excluding “Not Covered by Guideline” records. The denominator count could be lower because the denominator excluded DSS records for cancelled orders or orders changed to non-MID procedures.
For both of these appropriateness measures, the MID-wide feedback report data provided to conveners by Lewin, for analysis by procedure family, used the following stratification variables:
� Demonstration-wide level data
� Convener (each convener only received their own data, and was provided this data for quality checking purposes)
� Physician specialty
� Overtime (baseline and intervention periods)
The conveners calculated the appropriateness rates for their practices. Because of the time lag in the DSS data available to Lewin to prepare feedback reports, conveners were given the flexibility to extend the data they used in their appropriateness measures to encompass more recent DSS data that was available to the conveners but not yet submitted to Lewin. CMS established a minimum procedure order count of 30 in the applicable denominator in order to present the appropriateness rate calculation for a specific MID procedure. For practices and practitioners that did not meet the minimum case count requirement for a given procedure, CMS originally specified that the practice or the practitioner receive a listing of their orders and the appropriateness assessment. See the subsequent section on limitations for further discussion related to the provision of practitioner level reports.
Another measure for inclusion in feedback reporting was MID procedure utilization rate. Originally the utilization rate data was to be distributed as part of the second distribution of the MID-wide appropriateness data, however, the preparation of the rate data was found to be more complex than originally anticipated and the utilization rate data was provided to conveners in April 2013 for use in their second interim quarterly reporting. The utilization rate data was again provided to conveners in June 2013 for the third MID-wide feedback reporting cycle. The definition and calculation of the utilization rate is described below.
� Test utilization rate: The number of MID procedures performed per 100 Medicare beneficiaries seen by the practice for the applicable reporting time period. The utilization rate is calculated as follows:
• Numerator: Number of MID procedures (by each procedure family) rendered to Medicare patients based on paid claims data9
• Denominator: Number of unique Medicare patients seen by the practice for an evaluation and management (E&M) visit during the time-period of the imaging claims data
9 Note that in identifying the numerator imaging claims assigned to a practice based on the referring practitioner, only those practitioners who have been continuously enrolled in the MID are used. This limitation is the same limitation that was used when developing the analysis for completeness of reporting (COR) in order to try and limit the impact of physician and related patient migration.
Medicare Imaging Demonstration Report on Pre-Implementation and Implementation Experience
Final Report CMS Internal Use Only 19
In calculating the utilization rates, the same fixed period of time was used for both the numerator and denominator. The time period for the report was based on the imaging procedure rendered dates, i.e., although it was recognized that there was some time delay between the visit when a procedure was ordered and the rendering of a procedure. Thus, if an image was rendered in the time period window following when it was ordered, the image was counted in the numerator for the time period window in which it was rendered.
The denominator counted Medicare beneficiaries seen by the practice for an evaluation and management (E&M) visit for the same time period used for the numerator on rendered MID procedures. If a practice did not have 30 beneficiaries in the denominator for the applicable time period window then data was not to be reported. All practices met this minimum requirement.
2. Feedback Plan/Reports
In consultation with the conveners, a separate guidance document on feedback reporting was developed and first issued to conveners in February 2012. Based on experience with feedback reporting, updates to the guidance were subsequently issued in May 2012, August 2012, January 2013, with a final update issued in April 2013 to include additional guidance related to the utilization rate data.
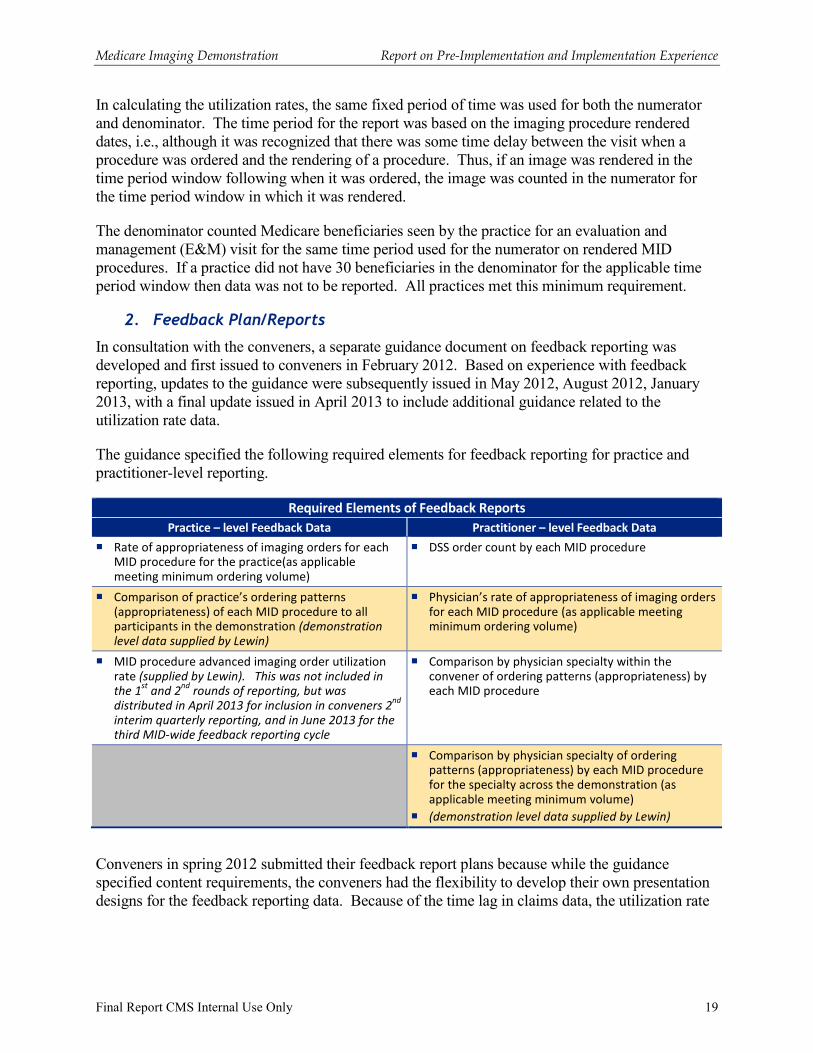
The guidance specified the following required elements for feedback reporting for practice and practitioner-level reporting.
Required Elements of Feedback Reports
Practice – level Feedback Data Practitioner – level Feedback Data
� Rate of appropriateness of imaging orders for each MID procedure for the practice(as applicable meeting minimum ordering volume)
� DSS order count by each MID procedure
� Comparison of practice’s ordering patterns (appropriateness) of each MID procedure to all participants in the demonstration (demonstration
level data supplied by Lewin)
� Physician’s rate of appropriateness of imaging orders for each MID procedure (as applicable meeting minimum ordering volume)
� MID procedure advanced imaging order utilization rate (supplied by Lewin). This was not included in
the 1st
and 2nd
rounds of reporting, but was
distributed in April 2013 for inclusion in conveners 2nd
interim quarterly reporting, and in June 2013 for the
third MID-wide feedback reporting cycle
� Comparison by physician specialty within the convener of ordering patterns (appropriateness) by each MID procedure
� Comparison by physician specialty of ordering patterns (appropriateness) by each MID procedure for the specialty across the demonstration (as applicable meeting minimum volume)
� (demonstration level data supplied by Lewin)
Conveners in spring 2012 submitted their feedback report plans because while the guidance specified content requirements, the conveners had the flexibility to develop their own presentation designs for the feedback reporting data. Because of the time lag in claims data, the utilization rate
Medicare Imaging Demonstration Report on Pre-Implementation and Implementation Experience
Final Report CMS Internal Use Only 20
data covered a shorter period than the DSS appropriateness data. Lewin provided to conveners data for feedback reports at the following times:
� Demonstration-Wide Report 1: Distributed to Conveners in June 2012
• DSS appropriateness data October 2011 – February 2012 (five months of baseline)
� Demonstration-Wide Report 2: DSS appropriateness data distributed to conveners in January 201310
• DSS appropriateness data October 2011 – March 2012 (six-month baseline) and April - August 2012 (five months of intervention)
� Utilization Rate Data Report distribution to conveners in April 2013
• MID-wide, convener level, and practice level utilization rate data for 12 MID procedures October 2011 – March 2012 (six-month baseline) and April 2012 – May 2012 (two months of intervention)
� Demonstration-Wide Report 3: Distribution to conveners in June 2013
• DSS appropriateness data October 2011 – March 2012 (six-month baseline) and April 2012 - February 2013 (11 months of intervention)
• Utilization rate data October 2011 – March 2012 (six-month baseline) and April – November 2012 (eight months of intervention)
Based on the consensus of the conveners, in addition to the three demonstration-wide feedback reports note above, the conveners had the option of preparing interim quarterly feedback reports limited to the data on the convener and its practices. The interim quarterly reports followed the same content and presentation of the appropriateness data as the demonstration-wide reporting feedback reports.
3. Limitations
The first round of feedback reporting identified a number of issues. Because of the high share of procedures that were not covered by guidelines, even for the MID-wide data, the calculations for specialty by specific MID procedures resulted in many cells not meeting the minimum denominator count of 30 when calculating the appropriateness rates excluding not covered by guidelines DSS records.
The conveners also found that many practitioners did not have sufficient ordering volume at the procedure specific level to meet the minimum 30 order counts to present appropriateness rates. Consequently, conveners had to produce a large number of specific listings of orders as part of the first round of feedback reporting. Conveners reported back that practitioners had little to no reaction over feedback reports or that the reports were not useful because so many of the orders were identified as not covered by guidelines.
10 Originally Report 2 was to also include utilization rate data. However, because of issues identified in the preparation of the utilization rate data, the decision was made to proceed with the release of the appropriateness feedback reports, and not delay pending resolution of the utilization rate data issues.
Medicare Imaging Demonstration Report on Pre-Implementation and Implementation Experience
Final Report CMS Internal Use Only 21
Because of the convener burden of producing individual lists of orders and the feedback from practitioners related to the issue of not covered by guidelines comprising a large share of orders, CMS developed additional guidance on which practitioners should receive feedback reports. Starting with the interim feedback report cycle in October 2012 the following additional guidance was implemented.
� If a practitioner has < 30 total orders covered by guidelines across all MID procedures in the INTERVENTION period then NO feedback report needs to be provided to the practitioner.
� If a practitioner has > 30 orders covered by guidelines across all MID procedures in the INTERVENTION period then GIVE a feedback report to the practitioner.
� Conveners have the option to provide feedback reports to more practitioners.
Under the guidance all MID participating practices continued to receive a feedback report regardless of their number of total orders covered by guidelines, unless the practice was a solo practitioner with <30 total orders covered by guidelines throughout the intervention period.
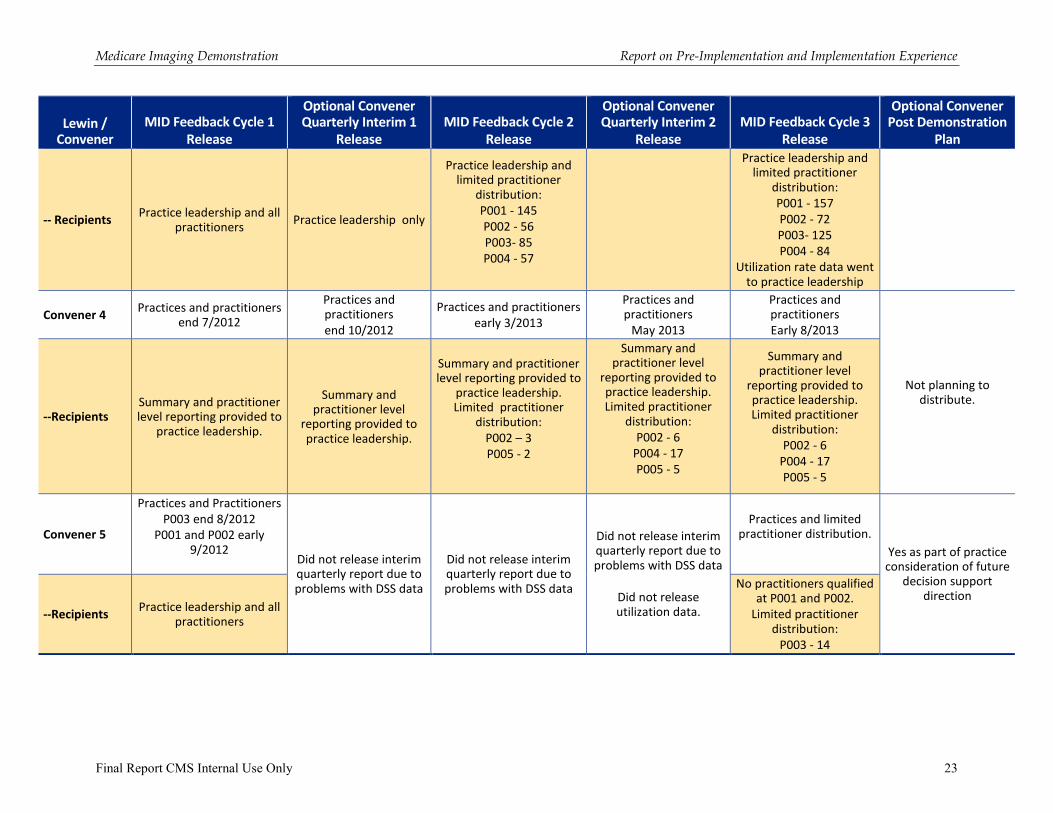
Exhibit 9 provides a summary of the feedback reporting cycles and the timing and recipients of each convener’s distribution of feedback reporting. As shown in Exhibit 9, conveners reported very limited numbers of practitioners meeting the criteria and receiving feedback reports. The exhibit also documents that conveners varied in their distribution of feedback reports. Once the revised policy on practitioner level reporting was issued, most conveners chose to limit the practitioner level reporting. One convener due to data problems only provided two rounds of MID-wide feedback reporting, and did not use the optional interim quarterly reporting cycles.
Medicare Imaging Demonstration Report on Pre-Implementation and Implementation Experience
Final Report CMS Internal Use Only 22
Exhibit 9: MID Feedback Reporting Cycle Summary
Lewin / Convener
MID Feedback Cycle 1
Release
Optional Convener Quarterly Interim 1
Release
MID Feedback Cycle 2
Release
Optional Convener Quarterly Interim 2
Release
MID Feedback Cycle 3
Release
Optional Convener Post Demonstration
Plan
Lewin MID-Wide Data
DSS Appropriateness Data (Sub 02)
Released June 2012
NA DSS Appropriateness Data
(Sub 04)
Released Jan 2013
Claims Utilization Rate Data
Released March 2013
DSS Appropriateness Data (Sub 06) and Claims
Utilization Rate Data
Released June 2013
NA
Time Period in MID-Wide Data
Baseline:
10/2011 - 2/2012 NA
Baseline:
10/2011 - 3/2012
Intervention:
4/2012 – 8/2012
Baseline:
10/2011 – 3/2012
Intervention: 4/2012 – 5/2012
Baseline
10/2011 - 3/2012
Intervention
4/2012 – 12/2012
NA
Convener 1
Distribution Timing
Practice and practitioners end 7/2012
Practice and practitioners end
11/2012
Practice and practitioners end early 3/2013
Practice and Practitioners 4/2013
Practice and Practitioners middle 9/2013
Yes
--Recipients Practice leadership and all
practitioners Practice leadership and
all practitioners Practice leadership and all
practitioners
Utilization rate data to radiology leadership;
13 practitioners received DSS reports
Practice leadership and all practitioners
Practice Leadership
Convener 2
Distribution Timing
Practices and practitioners early 8/2012
Practice leadership middle 11/2012
Practices and practitioners early 3/2013
Practices and practitioners 5/2013
Practices and practitioners 7/2013
Yes
--Recipients Practice leadership and all
practitioners
Practice leadership only as no practitioners met
minimum number of scored tests
Practice leadership and limited practitioner
distribution:
2 practitioners
Practice leadership and limited practitioner
distribution:
11 practitioners
Practice leadership and limited practitioner
distribution:
28 practitioners
Oversight board
Convener 3
Distribution Timing
Practices late 8/2012
Practitioners:
• P003 and P004 - end of 9/2012
• P002 – early 10/2012
• P001 end 10/2012
Practices late 10/2012 Practices and Practitioners
end of 2/2013 Convener did not issue
an Interim 2 Release
MID Cycle 3 Convener included utilization rate
data
Practices 9/2013
Practitioners
7/ 2013
Convener planning on preparing report to
share with practices on lessons learned, but not per se feedback
report data.
Medicare Imaging Demonstration Report on Pre-Implementation and Implementation Experience
Final Report CMS Internal Use Only 23
Lewin / Convener
MID Feedback Cycle 1
Release
Optional Convener Quarterly Interim 1
Release
MID Feedback Cycle 2
Release
Optional Convener Quarterly Interim 2
Release
MID Feedback Cycle 3
Release
Optional Convener Post Demonstration
Plan
-- Recipients Practice leadership and all
practitioners Practice leadership only
Practice leadership and limited practitioner
distribution:
P001 - 145
P002 - 56
P003- 85
P004 - 57
Practice leadership and limited practitioner
distribution:
P001 - 157
P002 - 72
P003- 125
P004 - 84
Utilization rate data went to practice leadership
Convener 4 Practices and practitioners
end 7/2012
Practices and practitioners
end 10/2012
Practices and practitioners
early 3/2013
Practices and practitioners
May 2013
Practices and practitioners
Early 8/2013
Not planning to distribute.
--Recipients Summary and practitioner level reporting provided to
practice leadership.
Summary and practitioner level
reporting provided to practice leadership.
Summary and practitioner level reporting provided to
practice leadership. Limited practitioner
distribution:
P002 – 3
P005 - 2
Summary and practitioner level
reporting provided to practice leadership. Limited practitioner
distribution:
P002 - 6
P004 - 17
P005 - 5
Summary and practitioner level
reporting provided to practice leadership. Limited practitioner
distribution:
P002 - 6
P004 - 17
P005 - 5
Convener 5
Practices and Practitioners
P003 end 8/2012
P001 and P002 early 9/2012
Did not release interim quarterly report due to problems with DSS data
Did not release interim quarterly report due to problems with DSS data
Did not release interim quarterly report due to problems with DSS data
Did not release utilization data.
Practices and limited practitioner distribution.
Yes as part of practice consideration of future
decision support direction
--Recipients Practice leadership and all
practitioners
No practitioners qualified at P001 and P002.
Limited practitioner distribution:
P003 - 14
Medicare Imaging Demonstration Report on Pre-Implementation and Implementation Experience
Final Report CMS Internal Use Only 24
III. Pre-Implementation and Baseline and Intervention Implementation Overview
A. Pre-Implementation
1. Technical Assistance
In the first part of 2011, conveners worked with CMS, Lewin, and their participating physician practices to prepare for implementation of the demonstration. Technical assistance was particularly focused on what needed to be modified in the DSS to meet MID requirements including the ability to collect required data elements. Lewin prepared a manual for conveners on all MID requirements. Lewin conducted site visits with each convener to support their understanding of the MID requirements and what the convener would need to do to meet the requirements. During the pre-implementation period, CMS and Lewin met via teleconference calls with all conveners on a weekly basis, and with individual conveners on a bi-weekly basis.
Also during the pre-implementation period, Lewin worked with the conveners to get an accurate accounting of the practice Tax Identification Numbers (TINs) and the participating practitioners. Lewin provided the conveners with information from claims data identifying potential TINs and participating practitioners that had not been initially identified by the conveners. Most of the conveners found the process of identification of TINs and related practitioners took more effort than initially anticipated, because of the need to verify TINs that got identified as a result of practitioners working at practices outside of the demonstration. Nonetheless, the analysis did result in identifying some additional TINs and practitioners that had originally not been included by the conveners in the practice workbooks.
The other major component of technical assistance involved the testing of the DSS systems relative to meeting the user interface requirements, scoring related to implementation of guidelines, and production of the data to be collected through the DSS. The original plan was for Lewin to be able to test the DSS systems for both baseline and intervention prior to the start of the demonstration. While it was possible to test the scoring against guidelines for purposes of both the baseline and intervention periods, a number of aspects of the user interface and data collection related to the intervention period (e.g., access to guidelines, physician attestation, physician decisions related to DSS feedback) were not available for testing until just prior to the start of the intervention period.
2. Guidelines
Subsequent to the solicitation period, a revised list of guidelines for use in the demonstration was prepared in January 2011, which served as the basis for the planning of the baseline implementation (see Appendix B.1 for the list of guidelines identified in January 2011). In general, the guidelines for the demonstration were identified based on those diagnoses found in the Medicare claims data that accounted for >1 percent of the claims volume for a demonstration procedure. However, where a guideline was applicable to more than one procedure, the guideline was included, even if the diagnoses under a specific procedure were less than 1 percent of claims volume, unless the volume was very minimal. Some guidelines were also included based on the identification by medical specialty societies. The original intent on selecting diagnoses that accounted for at least 1 percent of claims volume was to limit the burden on conveners in setting up their DSS. In retrospect this limitation on which guidelines were included, may have resulted in
Medicare Imaging Demonstration Report on Pre-Implementation and Implementation Experience
Final Report CMS Internal Use Only 25
some orders being scored as “not covered by guidelines.” The extent to which this limitation exacerbated the problem of orders not being covered by guidelines is unknown. However, with the exception of those guidelines targeting pediatric populations, very few ACR guidelines that addressed the imaging demonstration procedures were excluded. Lewin does not think that the exclusion of a small number of applicable ACR guidelines explains the large share of orders that were scored as not covered by guidelines.
Because of the plans to test the conveners’ DSSs using a standard set of clinical case scenarios that had been developed by the medical societies, conveners were very interested in making sure that they were correctly interpreting society guidelines. In particular, because the ACR appropriateness criteria comprised the vast majority of the guidelines being used a number of questions were identified that required clarification from ACR. Special meetings were arranged with ACR to discuss these issues with Lewin then preparing written clarifications that were approved by ACR.
The questions and ACR guidance provided during the pre-implementation period included:
1. What is the approach for determining the appropriateness rating of an ordered procedure when the procedure ordered does not specify contrast use and the ACR AC procedures specify contrast use?
ACR Guidance: For imaging procedures in which the ordering physician does not
specify the use of contrast (i.e., the decision on use of contrast is deferred to the
radiologist), the ACR indicated that the appropriateness rating (for purposes of the CMS
MID project) should be the highest appropriateness rating for that procedure. For
example, a physician orders a CT sinus and does not specify contrast. CT sinus without
contrast is rated 8, and CT sinus with contrast is rated 2. The rating for CT sinus should
default to 8 (i.e., the highest appropriateness rating for CT sinus). This applies to all
exams that are generic CT. That is, it does not refer to CTA or to CT perfusion studies.
Note that CTA, MRA, and CT perfusion are not included in the MID.
2. What are the assumptions regarding procedures not listed in an ACR appropriateness criteria rating table? How to interpret guidelines where one or two procedures in a modality are scored but another procedure in the same modality is not? For example, the ratings for procedures, ‘CT head with contrast’ and ‘CT head without contrast’, are provided but there is no rating for ‘CT head without and with contrast’. What can be interpreted about the appropriateness of CT head without and with contrast?
ACR Guidance: There are two options for MRI (without, and without followed by with
contrast) and three options for CT (without, with, and without followed by with contrast).
• For ordered procedures that are not listed in the ACR AC rating table, the ACR
Expert Panel chose not to consider the procedure for the particular clinical
scenario. This was either because the Panel considered that the not-listed
procedure was simply not relevant, or because there are insufficient studies or
experience to allow a reasonable consensus. Consequently, for purposes of the
CMS MID project, the rating “not addressed by ACR AC” will be assigned to
the procedure ordered (i.e., “not covered by guidelines”).
• If only one of the three possible CT procedures (without contrast, with contrast,
without followed by with contrast) or two possible MR procedures (without
contrast, without followed by with contrast) is listed and it is in the
Medicare Imaging Demonstration Report on Pre-Implementation and Implementation Experience
Final Report CMS Internal Use Only 26
“inappropriate” category, it is assumed that the other two CT or other one MR
procedures, regardless of contrast use, are inappropriate.
• For MR, there are no procedures designated as “MR with contrast” only. The
only two options are “without contrast” and without and with” contrast. If MR
with contrast is ordered, it should be rated the same as MR without and with
contrast. This is done in ACR’s web services version. Below is a table that
summarizes the above information for question 2 (also incorporates information
from question 3).
Summary of ACR Guidance Question 2:
Ordered Procedures Not Listed in Appropriateness Criteria Rating Table
When is "not covered by guidelines” to be used?
Key: Three procedures acronym labeling used in the table:
• without (wo)
• with (w)
• without followed by with contrast combined (CB)
CT
(1 - 3) (4 -6) (7 - 9)
Only 1 listed then others are not appropriate others not addressed others not addressed
Any 2 listed then others are not appropriate other not addressed other not addressed
MR
(1 - 3) (4 -6) (7 - 9)
Only 1 listed then others are not appropriate others not addressed others not addressed
2 listed (wo, CB) Rate "with contrast" the same as CB
Note: MRI with contrast as a standalone procedure is expected to be a rare order. Consequently, the ACR guidelines do not provide "scoring" for MRI with contrast.
3. Understanding intent when ACR uses terminology “with or without contrast” versus
“without and with contrast”.
ACR Guidance: The terminology “without AND with contrast” is referring to those
imaging procedures and the related CPT code in which the procedure is performed
initially without contrast followed by the same procedure or a modification of the same
procedure being performed with contrast. The use of the terminology “with OR
without” can be interpreted as either (i) the ACR appropriateness criteria are
indicating that there is not a clear preference or, (ii) the panel is rating the procedure
regardless of the use of contrast. For the MID, the ACR is recommending, and
incorporating into its web services version, the use of the term “unspecified IV
contrast” for this setting ,as well as for the setting addressed above in which one or two
of the CT approaches is rated as “appropriate” or “may be appropriate” and the other
one or two options are not addressed. As noted, if only one CT or MR procedure
regarding contrast is rated and it is rated as “inappropriate”, then it is assumed that
the other two or one are also inappropriate.
Medicare Imaging Demonstration Report on Pre-Implementation and Implementation Experience
Final Report CMS Internal Use Only 27
4. Understanding variants where multiple signs / symptoms are in the variant?
ACR Guidance: ACR indicated that there is not a general guidance that can be provided
for how to consider scoring when a patient may have some but not all of the signs /
symptoms in a given variant. How to interpret the ACR appropriateness criteria would
need to be specific to the variant involved as there is some clinical judgment involved.
As noted previously ACR became directly involved with two of the conveners. Specifically, ACR undertook an initiative to facilitate the use of the ACR Appropriateness Criteria in order entry and decision support applications. ACR now has created a machine-consumable version of the Appropriateness Criteria and distributing that content within a Service-Oriented Architecture (SOA).11 It is also important to note that as shown in Appendix B.1, during the course of the demonstration, ACR updated many of its guidelines, and frequently these updates involved specifications related to the use of contrast.
3. Decision Support Systems
Across the five conveners, initially there were two general models of user interface that evolved. In one model, the user, based on the type of procedure being ordered, would be selecting symptoms and diagnoses from detailed listings. Two conveners had this type of user interface. In a second model, the user would be selecting from combinations of symptoms that were derived from society guidelines. In particular the ACR guidelines, which comprised the majority of the guidelines identified as relevant to the MID, were structured based on clinical variants which present cases that frequently combine symptoms. Under the second DSS user interface model, the user was presented with the symptom combinations that comprised the ACR variants contained in the relevant guideline. Three conveners initially adopted this second type of user interface. As will be discussed subsequently in the DSS section for the baseline period, a third user interface was developed and adopted by one convener.
Another important differentiator for the DSS was whether there was integration with an EMR and ROE systems. The integration of DSS with EMRs created a set of challenges related to user interface and the demonstration requirements for data capture that influenced implementation timing.
During the February 2014 in-person meeting with conveners, there was discussion related to the resources required to implement DSS. Some noted that at a large institution the costs can be significant. The conveners also discussed the need to have project management staff with both information technology and clinical knowledge to guide the development of such systems. It was also noted that in large organizations, there might need to be a clinical governance team and a need for practice redesign in order to successfully implement and sustain DSS. Practice size was also a factor that conveners discussed as influencing the speed and process in which DSS is implemented. Large practice groups will have several layers of oversight of funding and contracting while small practices will have greater flexibility in these areas. However, small practice groups may have significantly limited resources available to devote to DSS implementation.
Medicare Imaging Demonstration Report on Pre-Implementation and Implementation Experience
Final Report CMS Internal Use Only 28
4. CSV Data File Specifications — Beta Testing Submission 00
At the demonstration kick-off meeting in February 2011, the selected conveners were apprised that as part of their reporting requirements, they would submit a minimum of 50 mock-DSS records. For the beta test process, Lewin cut back the full CSV Data File Specification to a minimum data set version to lessen the burden of reporting on conveners. Beta testing took place in April 2011 and all five conveners actively supported the beta process by submitting minimum data for testing, which proved to be sufficient for understanding report capacity, convener workflow, and to begin preparations for baseline data processing. The goals of the beta test exercise were achieved as the conveners were able to successfully prepare and submit data to CMS/Lewin using the established file naming conventions and practice data transfer through a secure file transfer protocol. Beta testing was referred to as Submission 00 for this demonstration.
5. Training
Conveners were required to submit training plans regarding the training for the baseline and intervention demonstration periods. The conveners approach to training for the baseline period varied. One convener, that was implementing an ROE simultaneously with the implementation of DSS, incorporated the DSS training into the practice-wide training for the ROE. Another convener visited each individual practice meeting with both the ordering practitioners and the staff who would be functioning in the role of proxy support. A third convener met with individual practices but during the baseline period the audience for the training was the proxy support staff. This convener focused on training proxies because it was assumed that during the baseline period where there was no feedback that the data entry would be performed by the proxy support staff for this convener’s practices. The fourth convener conducted trainings with briefing materials oriented to the DSS use in the context of the EMRs and the practices’ ROE systems. The fifth convener for the baseline period provided limited training sending out a written communication because the convener felt that the nature of the EMR user interface during the baseline period was not expected to change very much from the convener’s existing radiology order entry system. As will be discussed subsequently, conveners in preparation for the implementation period again conducted training.
During the convener in-person meeting in February 2014, some participants discussed the importance of earlier engagement of practitioners in the process of implementing DSS in order to have greater “buy-in.” Some suggested that practitioners become involved in the selection of the evidence base to be used for decision support. Others noted that where the practices were independent of the convener, it required a more intensive effort “boots on the ground” to get practice and practitioner engagement. Other challenges noted included practitioners familiarity and experience with information technology tools.
6. Limitations
One convener experienced the loss of one practice prior to the start of the baseline period. However, another convener during the intervention period ultimately dropped a practice which never submitted DSS data, and thus effectively had never been participating in the demonstration.
As noted previously the preparation of the DSS to meet the MID requirements, in particular, either limiting existing DSS platforms to just the medical society guidelines, or developing platforms based on the medical society guidelines proved more time consuming than originally anticipated.
Medicare Imaging Demonstration Report on Pre-Implementation and Implementation Experience
Final Report CMS Internal Use Only 29
Based on discussions with conveners during the first round of site visits, CMS initially established a launch date of August 1, 2011, for the baseline period. Testing of the DSS systems in late spring and summer 2011, found that the systems did not meet the MID requirements, were experiencing scoring issues, and in some cases were not ready for testing. Consequently, CMS postponed the launch date for the baseline period until October 1, 2011. Some conveners or individual practices continued to experience problems, particularly related to integration with EMRs. As shown in Appendix A, implementation of the baseline period stretched from October 1, 2011, until February 8, 2012. Most practices had launched the baseline period by December 2011.
During the in-person meeting after the completion of the demonstration, conveners discussed that the short timeframe initially expected for implementation was very challenging. Conveners estimated that the time needed to implement a nationwide DSS could range from six months to four years, but generally that one to two years would provide sufficient time to implement DSS. Conveners recommended a phased implementation starting with two to three procedures with flexibility to change focus over time.
Conveners also noted that one of the limitations with a national implementation is that there currently are a small number of vendors with the technical ability to implement a DSS. Conveners thought that vendor availability would ultimately be the scarcest resource and limiting factor to large-scale implementation.
B. Implementation of Baseline Phase
1. Technical Assistance
With the implementation of baseline by a convener, the technical assistance individual calls moved from bi-weekly to monthly, and the all convener calls moved to monthly. As needed ad hoc technical assistance calls were scheduled. Lewin also conducted a second round of site visits after the launch of the baseline period.
As noted previously, because not all of the requirements for the intervention DSS could be tested in the pre-implementation testing done for the baseline period, a second round of testing was scheduled prior to the intervention period. The second round of testing continued to include the limited assessment on scoring, but the major focus of the testing was to check on the user interface compliance with the DSS to provide immediate feedback on appropriateness assessment, access to guidelines, inclusion of the required attestation statement, and collection of information on physician decision-making in response to DSS feedback.
The other major focus of technical assistance during the baseline period was on data submission of DSS records and practice workbooks. During the pre-implementation period, there was limited beta testing of DSS data submission and updates of the practice workbooks. Therefore, the first two submission cycles of baseline data were heavily oriented to getting the DSS submissions and the practice workbooks corrected.
2. Guidelines
As noted previously, a revised list of guidelines for use in the demonstration was prepared in January 2011. The January 2011 guideline listing served as guidelines during the baseline
Medicare Imaging Demonstration Report on Pre-Implementation and Implementation Experience
Final Report CMS Internal Use Only 30
period. Appendix B.1 includes the listing of the guidelines identified as relevant to the demonstration procedures.
3. Decision Support Systems
As noted previously, a third user interface model was eventually adopted by one convener after the baseline period launch. During the baseline period, this convener experienced a number of problems with the user interface, including the need to hover over variants to see the complete text. Because of the challenges users experienced with the interface, many of the users defaulted to an easily available text entry box rather than picking from the list of symptom variants. The use of text entry resulted in most orders not being scored for appropriateness during the baseline period. In addition, there were concerns from physicians with the selection of medical society guideline variants in which the approach did not provide adequate coverage of the clinical situations physicians were encountering. The revised user interface combined features of the second model presenting variants in a list that no longer required hovering to read the full text of the variant, and an expanded list that included additional specific symptoms and diagnoses. Under this third model, however, the listing of individual symptoms or diagnoses were not linked to guideline logic, but were included in order to address the concerns of the practitioner users not being able to locate selections that matched their patients’ presenting symptoms.12
4. CSV Data File Specifications at Baseline
In preparation for baseline launch, much attention was given to what would ultimately be the reporting requirements for the conveners resulting in several iterations of the MID Convener Data
Collection Requirements and CSV Data File Specification. Ultimately, however, a version was agreed upon and released in time for baseline reporting. During baseline, the most significant change to the reporting requirements for conveners was to allow reporting on additional image orders. While additional and alternate image recommendations presented by the DSS to the user remained required reporting through data capture fields, recommendations presented through radiology intervention were changed to optional reporting for the conveners. This change was the result of conversations with the conveners as it was determined that the ability to capture data on radiologist to ordering practitioner peer-to-peer interactions and decision making was not truly possible or reliable, and created undue reporting burden on the conveners. In the case of additional MID procedures being recommended and the practitioner choosing to accept the radiologist recommendation, a new DSS order for the additional procedure(s) would need to be created. Also at this juncture, provision for an optional field to report the patient medical record identification was inserted into the data capture for use by conveners as an additional reference for locating the patient record at the individual practices.
5. Training
In preparation for the intervention period (but occurring at the end of the baseline), conveners again provided training. The approaches to training continued to vary by convener, and in some cases reflected changes from the training approaches used prior to the baseline period. The
12 The convener who adapted this third model has indicated that after the demonstration there may be an opportunity to refine the DSS further so that the additional symptoms / diagnoses listings could eventually also be programmed into appropriateness criteria. The short-term inclusion of the listing was simply to address user criticism of not being able to easily locate symptoms and diagnoses that were thought should be included.
Medicare Imaging Demonstration Report on Pre-Implementation and Implementation Experience
Final Report CMS Internal Use Only 31
convener who in the baseline period had integrated the DSS with the structured training sessions on the launch of a new ROE system modified their approach to training for the intervention period. That convener focused on distributing communication to key constituent groups regarding the upcoming changes followed by presentations at staff meetings that comprised the provider practice. A second convener that had done individualized training with its participating practices continued to use the same strategy of personalized training visits to each practice site. A third convener that had also done individualized training at practices but focused on proxies modified their approach. For the intervention period, this convener developed physician oriented materials focused on the intent of the demonstration and what practitioners would now experience with the feedback component of the program. Each of their practices addressed physician education through internal communications and the convener also provided webinar training for proxies. The fourth convener worked with each of its practices, but the individual practices developed their own training materials. The fifth convener that had provided limited training for the baseline period through written communications expanded its training effort. The convener developed specific materials regarding the changes being made to the DSS and its interface with the EMR / ROE system and conducted meetings with the departments that comprised the group practices.
6. Limitations
The baseline period experienced two major limitations in terms of impact on the demonstration design – delay in launch, and user interfaces that resulted in a very large share of orders not being scored by guidelines. Several of the practices were delayed in the start of the baseline period, even when the baseline launch had been extended out to October 2011, nine months after the selection of conveners was announced. While the environmental scan conducted during the demonstration design indicated that DSS vendors estimated that they could have their systems in place in approximately three months, vendors likely did not appreciate the number of changes required to satisfy the restriction for appropriateness to be based on medical society guidelines, or the challenge of interfacing with existing EMRs. Another factor that contributed to the delay was that one convener and its associated practices felt it was important to compare the medical society guidelines against local practice standards.
As discussed previously, there were two conveners whose user interfaces seemed to result in a much larger share of orders being defaulted to a scoring of not covered by guidelines. While the demonstration design had anticipated that a large share of orders would not be scored by guidelines, the experience of these two conveners where most orders were not getting scores was significantly different from that of other conveners. Thus for purposes of calculating the MID-wide experience for preparation of data for feedback reporting the data from these two conveners was excluded. Furthermore, for one convener, the dissatisfaction of the practitioners with the user interface resulted in the convener deciding to make significant changes to the user interface, which delayed the timeframe for the convener to launch the intervention period. The convener found that not including the Chief Information Officer (CIO) in the roll out of the DSS contributed to the launch experience. The analysis of data from this one convener will be challenging because there is a significant change in the user interface between the baseline and intervention period such that the data are likely not comparable. This same convener also experienced challenges during the baseline period in being able to submit data, which continued into the intervention period.
Medicare Imaging Demonstration Report on Pre-Implementation and Implementation Experience
Final Report CMS Internal Use Only 32
The other limitation experienced during the baseline period is that four practices (See Appendix A) dropped out of the demonstration during the first three months of the baseline period.
C. Implementation of Intervention Phase
1. Technical Assistance
The technical assistance to prepare for the intervention phase initially focused on testing the DSS systems for compliance with the demonstration requirements. In anticipation of the launch of intervention in April 2012, testing of the DSS intervention platforms was conducted in February – March 2012. One convener that was delayed did not have intervention testing done until June 2012.
A second major focus for technical assistance for the intervention period involved preparation of feedback reports. The development of the feedback report guidance for use by conveners was a collaborative effort among CMS, the conveners, Lewin, and RAND. Discussions of feedback reporting began in fall 2011 with draft guidance circulated for review and comment by conveners. The guidance was initially issued in February 2012 in anticipation of the start of the intervention period. Refinement of the approach to feedback reporting continued as conveners prepared for the first cycle of feedback reporting in the late summer of 2012. Subsequent to the first cycle of reporting, additional changes were made based on the experience of the conveners. See Section II for more detailed discussion of feedback reporting.
A third area for technical assistance focused on the data submissions and the measurement of completeness of reporting. Lewin worked with conveners to identify practices that appeared to have lower utilization of the DSS for ordering than had been anticipated based on comparison to rendered claims volume. Conveners then worked with individual practices to improve compliance.
2. Guidelines
An update to the guidelines listing based on changes made by medical specialty societies was released in January 2012, with conveners requested to have the guidelines incorporated into their systems in time for the launch of the implementation period on April 1, 2012. The January 2012 listing served as the guidelines for the start of the implementation period. During the implementation period there were two additional updates to the guidelines. Appendix B.1 includes a summary of the guidelines identified as relevant to demonstration along with the various updates that occurred. Appendix B.2 provides the final guideline listing issued in March 2013.
The third update to guidelines occurred in summer 2012. This update occurred in two issuances from Lewin, one in July 2012 based on changes to the ACR guidelines, with then another version released in August 2012 to incorporate a new guideline released by the American Academy of Otolaryngology. Conveners were requested to have the guidelines update implemented in DSS by October 1, 2012. For this third update, conveners experienced delays in getting the guidelines incorporated, with only one convener meeting the October 1 deadline. The final update of guidelines was released in March 2013. Conveners were asked to have the updated guidelines in place by no later than July 1, 2013. Exhibit 10 provides a summary of the implementation timing of the third and fourth update of guidelines.
Medicare Imaging Demonstration Report on Pre-Implementation and Implementation Experience
Final Report CMS Internal Use Only 33
Exhibit 10: Implementation of 3rd and 4th Guidelines Updates
Convener Implementation Date 3
rd
Guideline Update Implementation Date 4
th Guideline
Update
Convener 1 January 16, 2013
Convener was granted an exception to guideline update because of transition to EPIC record system and most practitioners would no longer be using DSS as of July 2013.
Convener 2 All Practices – week of
November 26, 2012 June 2013
Convener 3
P001, P002, P004 – week of November 26, 2012
P003 – November 20, 2012
All Practices - June14, 2013
Convener 4 All Practices - October 1, 2012 All Practices – July 1, 2013
Convener 5
P001 - November 28, 2012
P002 – October 17, 2012
P003 – November 12, 2012
Convener informed Lewin after the close of the demonstration period that the last guideline update had not been implemented
As shown in Appendix B.1, between the guideline listing issued in January 2011 and March 2013, most of the identified guidelines experienced at least one set of changes, with some guidelines experiencing multiple changes during this time. Medical societies and ACR in particular for its appropriateness criteria go through routine cycles of reviewing the society’s guidelines. The implications of this updating process for guidelines is that implementation of DSS for advanced imaging procedures does require a routine process for updating the underlying algorithm knowledge base that supports the use of DSS.
3. Decision Support Systems
With the conversion to the DSS intervention period, the user interface had to be changed in several ways. This included:
� Presenting feedback on the appropriateness of the order,
� Providing suggestions for alternative procedures if applicable,
� Providing transparency access to the medical society guidelines that were the basis for the appropriateness assessment and the alternative procedure suggestions,
� Gathering information on the ordering practitioner’s response and rationale for the response to the DSS feedback, and
� Providing for an attestation statement that the practitioner had reviewed the information on the patient in the DSS and the DSS feedback.
4. CSV Data File Specifications at Intervention
The most significant difference to note about the conveners reporting requirements at the transition from baseline to intervention relates to the data elements that were exempt during baseline, but were required for intervention. Specifically, at intervention it was required that the convener report on order cancellation at the point of original order appropriateness determination because as a result of receiving feedback from the DSS related to appropriateness, a practitioner may choose to cancel the order. Also required at intervention was the notion of attestation, where-in the practitioner was legally attesting that they had reviewed the DSS feedback on image
Medicare Imaging Demonstration Report on Pre-Implementation and Implementation Experience
Final Report CMS Internal Use Only 34
appropriateness. A design requirement at the juncture of attestation was that the DSS software issued a hard stop and disallowed the practitioner from moving forward with the order if the attestation was not complete. Upon attestation, the practitioner continued with the order and rendered a decision as to whether he/she accepted or rejected the feedback issued by the DSS, which was also exempt during baseline.
The only contextual changes to the CSV Data File Specification from baseline to intervention was clarifying language for collection of the ordering physician NPI, removal of the option for order determination as “no determination, contrast not specified” as it contradicted ACR guidance, and clearer instructions for appropriate data response when the DSS recommended an alternate image.
5. Limitations
One of the major limitations of the intervention period, is that one convener was significantly delayed in launching for the intervention period. As previously discussed, this convener had experienced problems with the DSS and the user interface during the baseline period and significant work was needed to modify the user interface, which delayed the launch of intervention. This convener also experienced challenges with data submission. Consequently, for purposes of development of the MID-wide feedback report data this convener had to be excluded.
The experience of the MID points to the need of processes for translating written guideline documents into algorithm logic for use in “rule sets” for decision support systems. During the in-person meeting with conveners after the completion of the demonstration, it was noted that medical society guidelines historically have not been designed to provide the underlying logic for IT based DSS. It was noted that the societies are starting to realize that there is a need to deliver a dynamic rule set. At the same time, it was noted that medicine is changing so rapidly that the guidelines may not be nimble enough. Conveners also noted that it will be expensive to maintain up-to-date guidelines. There was a suggestion at that meeting for payers to align with organizations creating guidelines to build an evidence base.
As previously mentioned, a major limitation noted by conveners was the MID reliance only on evidence from medical society guidelines, and that other sources of evidence should be permitted. The conveners at the in-person meeting noted that the medical society guidelines were quite variable in the strength of the evidence that supports various guidelines. There was concern regarding giving advice based on the guidelines via the DSS without information about the quality of the advice. Several convener representatives noted that including lower quality evidence might in fact have a deleterious effect on the credibility of the DSS advice. At the same time, it was acknowledged during the in-person meeting that there is not a large body of high quality evidence on imaging.
As will be discussed subsequently in Section IV.B., another major challenge was encountered with trying to exactly match Medicare claims data to DSS records. The major challenge encountered was dealing with discrepancies associated with migration of both providers and beneficiaries where participating providers order advanced imaging from non-participating practices, and beneficiaries were seen at both practices that were and were not participating in the demonstration. While the Medicare claims data for rendered imaging services did identify the practitioner who ordered the service, there was no variable on the claim that made it possible to identify the practice from which the order occurred.
Medicare Imaging Demonstration Report on Pre-Implementation and Implementation Experience
Final Report CMS Internal Use Only 35
In addition to the migration challenge, other factors contributing to the challenge of uniquely matching a Medicare rendered image claim with a DSS record order included:
� Order occurred before the demonstration began and there was no variable on the claim that indicated date of order that would permit excluding the claim. Lag time between ordering and rendering was quite variable (e.g., same day to six or more months post order);
� Patient was not a Medicare beneficiary at time of order, but was a beneficiary when procedure rendered;
� Inadequate coding of emergency room as location on imaging claims impacted ability to exclude the imaging services associated with emergency room visits which were not meant to be part of the demonstration;
� Changes in beneficiary health insurance claim number (HICN), particularly suffixes; and
� Identification of the referring physician (e.g., non-MID physicians being listed as the referring physician on the imaging claim when MID participating specialists were also involved in the ordering decision).
Medicare Imaging Demonstration Report on Pre-Implementation and Implementation Experience
Final Report CMS Internal Use Only 36
IV. Incentive Payments
A. Incentive Payments to Practices
As discussed previously, the incentive payments to participating practices were based on historic ordering volume prior to the MID (see Exhibit 3 for the incentive payment tiers). Ordering volume was determined through analysis of historic Medicare claims data. The total incentive payment for a practice was broken in to four equal payments -- two to cover the experience of the first year of the demonstration and two to cover the second year.
Exhibit 11 provides a summary of the number of practices receiving payment for each of the four payment cycles. The number of practices receiving the incentive payments decreased over time for three reasons: withdrawal from demonstration participation, practice mergers, and not satisfying the reporting requirements. As of the final payment cycle, six of the 25 practices that were considered still participating in the demonstration did not meet the reporting requirements.
Exhibit 11: Summary of Practice Incentive Payments by Payment Cycle13
Payment Amount
Number of Practices Cycle #1
Number of Practices Cycle #2
Number of Practices Cycle #3
Number of Practices Cycle #4
$500 2 1 2 2
$1,000 3 1
$2,000 5 3 2 2
$3,500* 5 3* 3 4
$4,000 3 2 2 2
$4,500 2 1 1
$5,000 1 1 1 1
$6,000** 1
$6,500** 1 1 1
$7,000 1 1 1 1
$9,000 1 1 1 1
$10,000 4 4 4 4
Total # Practices 28 18 18 19
*One practice merged **Payment incentives changed due to a merger that changed the historic ordering volume.
B. Challenge of Matching Claims to DSS Records and Change in Policy on COR
In retrospect, the process laid out for implementation of the demonstration for completeness of reporting (COR) and claims matching reconciliation now seems simple compared to what became reality for this process. Of the four most critical variables (patient ID, referring / attending NPI, type of service and date of service) needed to reconcile Medicare claims for rendered procedures to DSS records for ordered procedures, only one variable, date of service, proved to be the most regular and reliable variable. Our process simply stated was:
Lewin will use the imaging claims data to identify the beneficiary Medicare HICN, the NPI of
the referring practitioner from a MID participating practice (using the NPI lists for MID
13 Exhibit 11 reflects the payments made by qualifying cycle.
Medicare Imaging Demonstration Report on Pre-Implementation and Implementation Experience
Final Report CMS Internal Use Only 37
participating practices), and type of service (MID procedure family, or body part in the case
of MID procedures for brain and spine) to look for a matching order in the DSS records
submitted by the convener for a given practice.
What follows were some major themes of challenges experienced by the project team for matching a Medicare claim for a rendered procedure to a DSS order from the demonstration practice. A narrative of the Claims Processing Protocol for Medicare Advanced Imaging Claims can be found as Appendix E of this report.
The Medicare Physician Part B and Outpatient claims were used for this project. In order to provide timely matching of claims to DSS records, TAP14 data were used. The data process in Appendix E describes the stepwise approach the project team took to match and eliminate duplicate claims and duplicate procedures to prepare the data for use with the demonstration.
The Medicare claims data were used to create two denominator files: (1) identification and count of beneficiaries to a specific practice based on existence of an evaluation and management (E&M) ambulatory visit to the practice using the practice TIN for the Part B claims and the Medicare provider identifier for the outpatient claims; (2) identification and count of MID procedures for the beneficiaries assigned to the practice. The beneficiary denominator by practice was used to measure MID procedure utilization rates and the MID procedures denominator by practice was used in matching to DSS order records and to calculate COR.
The challenges encountered around the four critical variables mentioned above were identified very early in the matching process. At Submission 01, it was determined that the referring / attending practitioner NPI found on the Medicare claim could not be used to match a Medicare claim to a DSS record because the ordering physician NPI at the practice that appears on the DSS record did not always match to the referring/attending physician on the Medicare claim. Discussion with the conveners revealed that there were a myriad of reasons why the NPI on the Medicare claim could differ from that on the DSS order.
For example, the ordering practitioner for the DSS can be a resident, but for purposes of claims submission to CMS, the practice used the patient’s attending physician on the claim. In general, the referring / attending NPI on the Medicare claim for rendered MID procedures seemed to be reliable for identifying a claim that was attributable to a specific practice in the demonstration but was not able to be used to assist in matching. As will be discussed subsequently, however, when multiple practitioners were involved in the decision process on ordering (e.g., primary care and specialist and only the specialist is involved in the demonstration) who ended up as the referring practitioner on the claim varied.
Particularly challenging for matching a Medicare claim to a DSS record was the use of the patient HICN. Modest improvements in the matching were realized when the following processes were added:
� truncating the patient HICN (dropping the suffix)
� adding a match for month and year of the patient’s date of birth
14 TAP is early access data before final adjudication of the claim. Use of TAP data permits early access to paid Medicare claims data within two to three months of the claim filing, however, the data are not final adjudicated clean claims.
Medicare Imaging Demonstration Report on Pre-Implementation and Implementation Experience
Final Report CMS Internal Use Only 38
The project team’s quest to improve COR matching for the conveners continued through data Submission 05 with all conveners taking an active role in assisting Lewin to identify additional steps in claims processing to ensure that only the most likely Medicare claims were attributed to the practices in their convenership. While limiting on place of service and type of claim were included in the original design for matching, the limitations of using un-adjudicated claims in the TAP data required the project team to involve more variables and combinations of variables on the claims to ensure that the data were as clean as possible. This dialog with conveners resulted in the following:
� Keep all claims where:
• place of service was office based or outpatient facility, and
• Medicare was the primary payer, and
• the referring/attending physician NPI was that of a practitioner that was continuously enrolled in the demonstration (Note: limiting to continuously enrolled practitioners was an attempt to mitigate the selecting of images rendered when the practitioner(s) were working at other non-demonstration practices either before or after their participation in the demonstration)
� Remove all claims where:
• Emergency Department – where any variable on the claims (either outpatient or Part B) indicated that the procedure could have been rendered as emergency based on outpatient service type, revenue center codes, or place of service
• Inpatient procedures – where any variable on the claims indicated that the procedure could have been rendered on an inpatient basis
• Observation patients – where any variable on the claims indicated that the procedure was rendered while the patient was under observation using procedure codes or revenue center codes
• Any claim where a myelogram was rendered in conjunction with an MRI brain
• Any claim that was the professional component only, repeat procedure, clinical research or multiple procedure based on modifier codes
In addition to the claims processing steps above, the project team in coordination with the conveners, instituted practice specific claims processing to ensure that only claims that were most likely to be ordered by the practice were attributed to the practice. This process evolved into keeping only claims for practitioners that were continually enrolled in the demonstration and that there was specific knowledge that the practitioner did not see patients at another medical practice not in the demonstration. For the large and or academic practices that operate as a “closed system,” where generally what gets ordered at the practice gets rendered at the practice, the project team kept only claims where the rendering TIN and rendering Medicare provider identifier were those of the practice in the demonstration. Finally, we eliminated claims for procedures that were rendered prior to the practices’ specific baseline launch date.
Many of the process steps listed here came about as a result of analytic efforts to improve the COR matching for the conveners and individual practices. At the kickoff of the demonstration, conveners were informed that they would need to attain a COR minimum of 80 percent match rate (Medicare Claim to DSS Order) in Year 1 and improve to 90 percent in Year 2 of the
Medicare Imaging Demonstration Report on Pre-Implementation and Implementation Experience
Final Report CMS Internal Use Only 39
demonstration. At the close of Year 1 (Submission 05) with only four more data submissions ahead, only one conveners had met the COR minimum and only three of the 25 practices had met the COR minimum. Two additional practices were within a few percentage points of the COR minimum for the demonstration.
A major challenge was the absence of a variable on the Medicare imaging claim that indicated the practice of the referring / attending practitioner. The reality for the practices that ultimately participated in the MID was that practitioners were working in more than one practice and patients could be seen at multiple practices. It was assumed that the MID practices would have knowledge of whether a practitioner also worked elsewhere. As it turned out, for the large group practices, information that the physician worked elsewhere was not available. The project team had assumed that such information would be available and that it would be possible to exclude, if necessary, practitioners in the demonstration that were known to practice in non-MID practices. What also remained most challenging was the inability to account for the limitations in the Medicare claims data as it related to accurately reporting who the referring or attending physician was for the patient on the claim, accounting for migrating patients, and accounting for practitioners who may have also ordered procedures at medical practices not in the demonstration.
In summary, the major challenges are listed below, only some of which were able to be addressed, such as the HICN suffix issue. Other challenges, such as migration and adequate coding of emergency room associated imaging continued to remain, even though some strategies were implemented to help mitigate these problems in the matching process.
� Migration - doctors working at other practices and patients following doctors. There was no variable on the claim to identify where the referring practitioner was at the time of the order. Generally, large group practices do not have reliable information as to whether their practitioners also practice elsewhere.
� Order occurred before the demonstration began and there was no variable on the claim that indicated date of order that would permit excluding the claim. Lag time between ordering and rendering was quite variable (e.g., same day to six or more months post order).
� Patient was not a Medicare beneficiary at time of order, but was a beneficiary when procedure rendered.
� Inadequate coding of emergency room as location on imaging claims impacted ability to exclude the imaging services associated with emergency room visits, which were not meant to be part of the demonstration.
� Changes in beneficiary HICNs, particularly suffixes.
As a result of these challenges to meeting COR minimums, CMS adopted a revised policy that based COR as measured based on relative volume (RV) of DSS orders to the volume of Medicare claims determined to be associated with the practice. The incentive payment methodology was amended to use a 50 percent RV threshold for physician practices and conveners.
Lewin continued to monitor COR using both a claims matching process and a relative-volume relationship measurement. In the case of relative volume as of the last payment cycle 19 of the 25 participating practices met the relative volume test.
Medicare Imaging Demonstration Report on Pre-Implementation and Implementation Experience
Final Report CMS Internal Use Only 40
As part of final analyses on COR, Lewin examined the trend in claims matching using the final set of claims data pulled after the completion of the demonstration in September 2013 that provided for a full three-month run-out. Interestingly, this final analysis on claims matching found a steady improvement in the share of claims that could be matched to DSS records. Thus, some of the contributing factors to the early challenges in matching are likely due to the time lag between when an order is placed and when it is rendered and the time lags inherent in getting complete Medicare claims data. For all five conveners, regardless of delays in launch of baseline, the month-to-month trend of Medicare claims volume to COR for the duration of the demonstration shows relative stability when each convener is treated as one large practice.
Overall, for the demonstration, conveners monthly COR ranged from a low of 28 percent match rate to a high of 95 percent match rate rendered Medicare claims to ordered DSS records. The unweighted average COR for the whole demonstration is 67 percent (median 66 percent) for the 18-month period of January 2012 to June 2013. The target COR was expected to reach 80 percent in the first year and 90 percent in the second year of the demonstration. The unweighted average COR across all conveners for the first year15 (January 2012 – October 2012) was 66 percent. The unweighted average COR across all conveners for the second year16 (November 2012 – June 2013) reached 68 percent. The detailed trends of this analysis are presented in Appendix C for the demonstration as a whole and by convener.
C. Challenge of Duplicate DSS Records
One of the challenges with the DSS data submitted by conveners was the presence of a large volume of duplicate DSS records. There seemed to be multiple factors that contributed to this issue and unique combination of issues around duplicates for each convener.
First, for some practices, the nature of their radiology ordering system was the use of order sets for imaging procedures that commonly are done in combinations. In particular, a common order set involved the combination of CT Thorax with CT Abdomen, or CT Thorax with CT Abdomen/CT Pelvis. Because the Medicare claims handle CT Thorax separately, it was necessary for the conveners to create separate DSS records for the CT Thorax order. In the process of creating the separate CT Thorax orders, there was inadvertent creation of duplicate CT Abdomen and CT Abdomen/CT Pelvis orders. Another contributing factor to the presence of duplicate records was the nature of practices’ EMR workflows for ordering radiology services. In particular, several of the participating practices had an EMR workflow that for changed orders involved the initiation of a new order that then resulted in the creation of a new DSS record. Thus, while the ordering sequence involved imaging for the same patient and body part, multiple DSS records were involved in a single ordering sequence.
For each convener, we undertook a multi-layered approach to identifying potential duplicate records, again an approach that was unique to each convener. The conveners ultimately were able to identify and eliminate exact duplicate DSS records and maintain DSS records that could not be
15 The first three months of the demonstration (October, November, and December 2011) were excluded from the first year measurement to account for the delay in launch by conveners and their practices, and also to account for the claims data during these initial months including rendered services ordered prior to the start of the demonstration.
16 The last three months of the demonstration (July, August, and September 2013) were excluded from the second year measurement to provide some adjustment for the lag between ordering and rendering imaging services.
Medicare Imaging Demonstration Report on Pre-Implementation and Implementation Experience
Final Report CMS Internal Use Only 41
certain to be duplicates. Conveners also determined when it was appropriate to combine a series of DSS orders into a single DSS record as well as combined orders of CT Abdomen and CT Pelvis when these DSS orders should have been ordered as a single CT Abdomen/Pelvis image.
At the onset of the effort to eliminate duplicates, we identified a volume of approximately 13,800 DSS records as potential duplicate orders (7.5 percent of all MID DSS orders). Through the process with conveners, we were able to identify and eliminate just over 5,700 duplicate DSS records, reducing the potential duplicate DSS records to just over 4 percent MID-wide. The remaining potential duplicate DSS records are identified as same day, same patient, same body part DSS orders for the same convener at the same practice. Conveners were reluctant to identify all of these records as duplicates as there was not enough evidence in the DSS data variables or other available data sources to definitively determine that the order was a duplicate.
Medicare Imaging Demonstration Report on Pre-Implementation and Implementation Experience
Final Report CMS Internal Use Only 42
V. Findings from Baseline and Intervention Implementation Experience
This section of the report presents findings from the implementation experience related to workflow changes for integrating DSS for radiology ordering and “lessons learned” from the implementation experience. A separate comprehensive evaluation of the demonstration is being conducted by RAND. Information presented here focuses on findings from the implementation experience, including conveners input on lessons learned during an in-person meeting after the completion of the demonstration. This section also includes results from data analyses that supported quality control review of the DSS data and the preparation of feedback reporting, including DSS appropriateness assessments and utilization rate analysis from Medicare claims.
A. Workflow and Use of DSS
The experience of the participating practices varied in terms of workflow changes needed to incorporate DSS into ordering of the MID advanced imaging services. The key distinction on workflow was based on whether the DSS process was being integrated into an EMR and ROE system, versus whether the practice had to separately access an external web-based platform. In general, those practices, where DSS was integrated or at least interoperable with an online ROE system seem to have better compliance with using the DSS as measured by direct matching of claims to orders or through relative volume comparison of order volume to claims volume. For practices in which the DSS was not integrated with online ROE, the practices established separate workflows or order entry into the DSS, with several of those practices experiencing lower compliance with use of the DSS as measured by comparison of order volume to claims volume.
In both workflow scenarios (integrated and not integrated with an ROE), proxies (e.g., nurses, residents, and administrative personnel) were routinely involved as users of the system with then proxies communicating back with the ordering practitioner. Some of the practices with ROE systems that required final signing by the ordering practitioner built in workflow processes, which required the ordering practitioner as part of the signing process to review the feedback. Other practices relied on verbal communications between proxies and ordering practitioners.
B. Lessons Learned
In discussions with conveners, themes regarding lessons learned from the MID experience include:
� Limited Coverage of Clinical Scenarios in Medical Society Guidelines: As discussed previously, the experience of the MID was that there are many more clinical patient symptom presentations than were addressed by medical society guidelines. Consequently, large shares of the MID procedure orders were assessed as not covered by guidelines. Feedback from conveners and their participating practices indicated that this limitation resulted in practitioners finding lower utility of the use of the DSS. Conveners recommended not limiting the evidence base to just medical society guidelines for use in decision support.
� Quality of Evidence Base: After the completion of the demonstration, conveners noted during the in-person meeting that the quality of the evidence is an important consideration. It was noted that medical society guidelines are variable in the strength of the evidence that supports each of the guidelines, and that use of lower quality evidence may impact the perceived credibility of the DSS advice.
Medicare Imaging Demonstration Report on Pre-Implementation and Implementation Experience
Final Report CMS Internal Use Only 43
� Translating Written Guidelines in Algorithm Logic: The experience of the MID points to the need for medical specialty societies to develop processes facilitating the translation of written guideline documents into algorithm logic for use in dynamic “rule sets” for decision support systems. Ideally, algorithm logic will also take into account resource limitations. For example, if the primary recommendation is a CT scan, but there is none available within the area, the algorithm will default to the secondary recommendation.
� User Interface Design for Feedback and Efficiency of Workflow: As a large share of orders were assessed as either appropriate or not covered by guidelines, practitioners found that repetitively receiving feedback on appropriateness was not useful and of low value. For purposes of future design, conveners recommended that the immediate feedback from DSS should focus on those orders where there was an actionable change needed, rather than interrupting workflow with low value messages (i.e., order is appropriate or not covered by guidelines) that do not require an action on the part of the ordering practitioner. Conveners noted that a major lesson learned from the MID is that workflow should not be interrupted with low utility messaging from DSS.
� Generalists versus Specialists / Radiology DSS Paradigm – Need for Change? During the in-person meeting, conveners noted another lesson learned from the MID is that the design of decision support may need to differ between generalists and specialists. Specifically, generalists may prefer to begin the ordering process from the point of patient symptoms, whereas specialists may prefer to start with specification of the imaging procedure. Currently, the entry for radiology DSS begins with selection of the procedure to be ordered.
� Local Practices versus National Guidelines: Conveners generally acknowledged that there may be differences between national guidelines and local practices. How large a factor this played varied by convener and provider practice. However, conveners thought it is important to recognize that in designing decision support flexibility is needed to accommodate for local standards of care, some of which can be influenced by availability of equipment.
� Early Engagement of Users: Conveners indicated that experiences with implementing the DSS in the MID show a need for users to be engaged earlier in the implementation process in order to have buy-in.
� Targeting versus Broad Scope: Some convener representatives during the in-person meeting suggested that implementation of DSS might benefit from a more targeted approach. In the targeted approach, implementation of the DSS should focus on a narrow range of procedures, clinical situations, or practitioners where there are known problems in appropriateness of ordering.
� Integration with EMR: The integration / interoperability of DSS with EMR are important, particularly given the expected increased use of EMRs. However, the interaction of DSS with EMRs proved to be more challenging than expected. A number of the delays experienced by practices in launching the DSS for the baseline period were directly associated with the IT challenges related to DSS and EMR interaction. Furthermore, there are some limitations existing EMR vendor platforms have in terms of the user interface for DSS.
Medicare Imaging Demonstration Report on Pre-Implementation and Implementation Experience
Final Report CMS Internal Use Only 44
� Use of Proxies: The advent of EMRs does not necessarily mean that the initial user of the DSS will be the ordering practitioner, and the role of proxies warrants further consideration in the use of decision support systems. In many of the participating practices, the actual users of the DSS were proxies rather than the ordering practitioners. Some practices where DSS was integrated with ROE, designed their process so that the ordering practitioner ultimately did have to review the DSS feedback prior to signing the order. Practices that did not use ROE had to design specific workflow communication processes around providing the DSS feedback to ordering practitioners.
� Terminology of Appropriateness Assessment: The terminology for the MID related to appropriateness assessment (appropriate, uncertain, inappropriate) was derived from the statutory language that authorized the demonstration. Since 2008, there has been an evolution in thinking around the terminology related to appropriateness use criteria. Some conveners believe there is a need for medical specialty societies to gain consensus around terminology for appropriateness assessment. For example, currently, the ACR’s terminology for its appropriateness criteria use the terms “usually appropriate,” “may be appropriate,” and “usually not appropriate.”17 The American College of Cardiology also recently revised its appropriateness criteria terminology to use the terms “appropriate care,” “maybe appropriate care, “and “rarely appropriate care.”18
C. Findings from Baseline and Intervention DSS Data Analysis
This section will review updated findings from analyses of the DSS data prepared by Lewin to support preparation of feedback reports for the entire demonstration period. We have also included analyses used as general quality control and review of submitted DSS data. These analyses include:
� Distribution of orders for MID procedure by convener
� Appropriateness assessments, both the initial order assessment and the final order assessment
� Cancelled and changed orders
The time period in the analyses presented in this report includes the entire six-month baseline period (October 2011 – March 2012), and 18-month intervention period (April 2012 – September 2013). It is important to note however in the case of the baseline period, start dates varied by participating practice, see Appendix A.
One of the conveners experienced challenges with submitting data. This convener was unable to submit DSS data for several of the submission periods during the demonstration, but ultimately submitted complete DSS data files for Submission 08 and 09. Therefore, this convener’s baseline data is considered problematic with regard to appropriateness assessment. The convener’s initial user interface issues resulted in many practitioners defaulting to text entry of patient information from which DSS could not trigger an appropriateness assessment for the order. Consequently, this convener’s data is not included for any baseline period DSS data on appropriateness, or in an analysis that compares DSS baseline data to intervention period data on appropriateness
17 www.acr.org accessed April 2, 2014. 18 http://content.onlinejacc.org/article.aspx?articleid=1655352 accessed April 2, 2014.
Medicare Imaging Demonstration Report on Pre-Implementation and Implementation Experience
Final Report CMS Internal Use Only 45
assessment presented in this report. This convener’s data is included when doing analyses that compare the initial six months and the last six months of the intervention period, as the convener’s data for the intervention period was considered acceptable.
As a result of user behavior when interacting with the DSS, another convener experienced a large share of MID orders not receiving an appropriateness assessment. For this convener, users defaulted to the selection of “other” when they could not find a variant that they thought matched the patient. The selection of the “other” category resulted in the order being categorized as not covered by guidelines. The issue was identified early in the demonstration baseline period and the convener tried to address this issue through an enhanced search function, but this enhancement did not make a substantial difference in the already established user behavior in selecting “other”. This convener represented a large number of orders, and their DSS data is significantly different from other conveners with respect to not covered by guidelines occurrences. Thus, the decision was made to exclude this convener from the calculation of the MID-wide appropriateness assessment shown in the Exhibit 14 and 15 series.
Finally, one practice at one convener had prior exposure to using decision support for radiology ordering. The decision was made to exclude the practice for purposes of calculating MID-wide data on appropriateness assessments.
The Exhibit 12 series presents data on each of the conveners and illustrates the impact of the decisions to exclude certain conveners or practices on the overall MID-wide calculations. Exhibits 12A and 12B provide a summary, across all MID procedures, of the DSS appropriate assessments for the conveners and for the demonstration overall. The appropriateness assessment presented in these exhibits is the initial assessment of the image order by the DSS. The exhibits include, across all MID procedures, the number and percent of orders by initial appropriateness assessment for the following periods: baseline, first six months of intervention (INT1), and last six months of intervention (INT3)19. In Exhibit 12A, all possible values of appropriateness are included; however, in Exhibit 12B, we exclude DSS records with an initial appropriateness assessment of not covered by guidelines.
Exhibit 12A shows that excluding the previously discussed convener and practice that had DSS data available from the calculation of MID-wide appropriateness assessment results in a significant change in the resulting calculations during baseline. A more limited change is observed during the intervention period for these exclusions. The exhibit also shows the difference in the share of procedures not covered by guidelines for the excluded convener, where the share of orders not covered by guidelines was determined to be an outlier at over 80 percent.
Exhibit 12A shows that the share of orders assessed as appropriate and not covered by guidelines did vary by convener. As will be shown subsequently, the mix of procedures varied by convener and the share of procedures that are assessed as appropriate or not covered by guidelines varied by procedure type. Thus, the variation across conveners in the distribution of appropriateness assessments across all MID-procedures was influenced by mix of procedures being ordered. Also,
19 The intervention period of the demonstration was divided into three six-month periods: first intervention period (INT1) is April 1, 2012 – September 30, 2012; second intervention period (INT2) is October 1, 2012 – March 30, 2013; third intervention period (INT3) is April 1, 2013 – September 30, 2013. The six-month baseline period is October 1, 2011 – March 30, 2012. The comparison analysis in this report focuses on baseline, first and third intervention periods.
Medicare Imaging Demonstration Report on Pre-Implementation and Implementation Experience
Final Report CMS Internal Use Only 46
as shown in Exhibit 12A, approximately half of the orders (excluding the one practice and one convener previously noted)20 were assessed as not covered by guidelines in the baseline period. During the intervention periods the share of orders not covered by guidelines increased to 60 percent (INT1) and 65 percent (INT2) across the demonstration (excluding the one practice and one convener).
The baseline period in Exhibit 12B, which excludes all not covered by guidelines DSS records, shows a significant change in the allocation of records for the initial assessment when the exclusion of the one practice is applied. However, as the demonstration progresses through intervention, the change related to excluding this practice is less than in baseline and less than the intervention periods displayed in Exhibit 12A. Note for purposes of Exhibit 12B, the one convener that was excluded because of the high share of not covered by guidelines is included in the calculation of the MID-wide numbers.
As shown in Exhibits 12A and Exhibit 12B, one convener accounts for a large share of the DSS orders in the demonstration. This convenership included large practices.
20 One additional convener was also excluded from the baseline data because their data for the baseline period experienced problems and had very few DSS records with appropriateness assessments.
Medicare Imaging Demonstration Report on Pre-Implementation and Implementation Experience
Final Report CMS Internal Use Only 47
Exhibit 12A: Number and Percent Distribution of All MID Procedure Orders by Initial Appropriateness Assessment for Conveners and for MID-Wide Demonstration
Not Covered by Guideline 84.1% 37.5% 70.2% 24.9% 68.9% 65.5% 65.6%
Uncertain 3.1% 7.2% 3.1% 10.8% 2.8% 4.0% 3.8%
Blank 0.0% 1.0% 1.4% 0.0% 12.0% 2.0% 2.5%
Tota l 100.0% 100.0% 100.0% 100.0% 100.0% 100.0% 100.0%
INTERVENTION 3 (Apr 13-Sep 13)
BASELINE (Oct 11-Mar 12)
INTERVENTION 1 (Apr 12-Sep 12)
Medicare Imaging Demonstration Report on Pre-Implementation and Implementation Experience
Final Report CMS Internal Use Only 48
Exhibit 12B: Number and Percent Distribution of All MID Procedure Orders by Initial Appropriateness Assessment for Conveners and for MID-Wide Demonstration Excluding
"Not Covered by Guidelines"
1. Mix of Procedures by Convener
The mix of procedures being ordered varies across the conveners. Exhibit 13 displays this variance and presents the calculations with the previously discussed excluded practice included and excluded from the MID-wide calculations. As shown in the exhibit, there is variation across the conveners in the mix of procedures being ordered by their participating practices. CT Thorax was the most commonly ordered MID procedure across three conveners. MRI Brain and CT Abdomen and Pelvis also were commonly ordered procedures for most of the conveners. CT Abdomen and Pelvis was the most commonly ordered procedure for one convener, and for another convener, SPECT-MPI was the most commonly ordered procedure.
Tota l 100.0% 100.0% 100.0% 100.0% 100.0% 100.0% 100.0%
INTERVENTION 3 (Apr 13-Sep 13)
BASELINE (Oct 11-Mar 12)
INTERVENTION 1 (Apr 12-Sep 12)
Medicare Imaging Demonstration Report on Pre-Implementation and Implementation Experience
Final Report CMS Internal Use Only 49
Exhibit 13: Number and Percentage Distribution of the Original MID Procedure Orders by Convener – Baseline, First Intervention and Third Intervention Periods
Origina l Orde rs Convener 1 Convener 2 Convener 3 Convener 4 Convener 5Total w/ o One
Tota l 100.0% 100.0% 100.0% 100.0% 100.0% 100.0% 100.0%
BASELINE (Oct 11-Mar 12)
INTERVENTION 1 (Apr 12-Sep 12)
Medicare Imaging Demonstration Report on Pre-Implementation and Implementation Experience
Final Report CMS Internal Use Only 50
(Continued) Exhibit 13: Number and Percentage Distribution of the Original MID Procedure Orders by Convener – Baseline, First Intervention and
Third Intervention Periods
2. Demonstration-Wide DSS Final Order Appropriateness Assessment by Procedure– Baseline and First and Third Intervention Periods
This section of the report provides a summary across the entire demonstration of the DSS appropriateness assessments for the 12 procedure families. Information is presented on the final order image determination comparing the baseline period (October 1, 2011 – March 31, 2012)21 to the first six months of the intervention period (April 1, 2012 – September 30, 2012), and also to the third intervention period of the final six months of demonstration (April 1, 2013 – September 30, 2013). We also compare the first six months of the intervention period (April 1, 2012 – September 30, 2012) to the third intervention period (April 1, 2013 – September 30, 2013).
As discussed previously, for purposes of calculating the MID-wide appropriateness assessments certain data exclusions were used. The table below provides a summary of the exclusions applied to the different time periods comparisons, as well as to whether the analysis included or excluded DSS records assessed as not covered by guidelines.
21 As noted previously and as documented in Appendix A, not all practices launched the baseline period on October 1, 2011.
Origina l Orde rs Convener 1 Convener 2 Convener 3 Convener 4 Convener 5Total w/ o One
Tota l 100.0% 100.0% 100.0% 100.0% 100.0% 100.0% 100.0%
INTERVENTION 3 (Apr 13-Sep 13)
Medicare Imaging Demonstration Report on Pre-Implementation and Implementation Experience
Final Report CMS Internal Use Only 51
DSS Data Exclusions Applied for Analysis Where:
Not Covered by Guidelines Included in Appropriateness Assessment
Baseline Compared to Intervention Periods (First and Third/Final)
� One convener excluded due to large share of orders not covered by guidelines (Convener 1))
� One convener excluded because user interface resulted in large share of orders not assessed / scored during baseline period and thus data not available for baseline period (Convener 5)
� One practice excluded because of previous experience with DSS
First Intervention Period Compared to Third/Final
� One convener excluded due to large share of orders not covered by guidelines (Convener 1)
� One practice excluded because of previous experience with DSS
DSS Data Exclusions Applied for Analysis Where:
Not Covered by Guidelines Excluded from Appropriateness Assessment
Baseline Compared to Intervention Periods (First and Third/Final)
� One convener excluded because user interface resulted in large share of orders not assessed / scored during baseline period and thus data not available for baseline period (Convener 5)
� One practice excluded because of previous experience with DSS
First Intervention Period Compared to Third/Final
� One practice excluded because of previous experience with DSS
Exhibits 14A and Exhibits 14B provide a summary, across the entire demonstration, of the DSS appropriateness assessments for the 12 procedure families. Exhibit 14A.1 presents information on the final order image determination comparing the baseline period22 to the first intervention period, while Exhibit 14B.1 shows final order image determination comparing baseline to third intervention period. Exhibit 14C.1 compares appropriateness assessment for all 12 procedures for first intervention to third intervention period. As shown in these exhibits, the share of orders assessed as not covered by guidelines varied widely across the procedures. On the low end, 27 percent of SPECT-MPI orders were assessed as not covered by guidelines in baseline and first intervention period, while 38 percent were not covered by guidelines in the third intervention period. On the high end, 94 percent of CT Pelvis orders were assessed as not covered by guidelines in the baseline period. For first intervention period and third intervention period, the shares not covered by guidelines were 91 percent and 95 percent respectively. See Appendix F for an alternative analysis of appropriateness assessments excluding DSS records assessed as not covered by guidelines.
In Exhibit 14A.1 and 14A.2 (Baseline to First Intervention Period) from the baseline period to first intervention period, the share of orders assessed as appropriate increased for seven of the 12 MID procedures. One procedure experienced no change, and four procedures experienced a decrease in the share of orders assessed as appropriate on the final order determination. In addition, between baseline and first intervention period, the share of orders assessed as inappropriate decreased for eight of the 12 MID procedures, increased slightly for two of the procedures, and there was no change for two procedures.
22 As noted previously and as documented in Appendix A, not all practices launched the baseline period on October 1, 2011.
Medicare Imaging Demonstration Report on Pre-Implementation and Implementation Experience
Final Report CMS Internal Use Only 52
In Exhibit 14B.1 and 14B.2 (Baseline to Third Intervention Period), from the baseline period to third intervention period, the share of orders assessed as appropriate increased for only four of the 12 MID procedures. Eight procedures experienced a decrease in the share of orders assessed as appropriate on the final order determination. Also, between baseline and third intervention period, the share of orders assessed as inappropriate decreased for ten of the 12 MID procedures, increased slightly for one procedure, and there was no change for one procedure.
From Exhibit 14C.1 and 14.C.2 (First Intervention to Third Intervention Periods), from the first intervention period to the third intervention period the share of appropriate orders decreased for all 12 MID procedures between these intervention periods. For inappropriate orders between first and third intervention periods, the share decreased for eight of the 12 MID procedures, increased for one procedure, and there was no change for three procedures.
Two-proportion probability tests23 were used to statistically assess whether the change in proportion of appropriateness scores, from baseline to first intervention and third intervention periods and from first intervention period to third intervention period, were meaningful. In Exhibit 14A.2, we observed five changes in the ratio of appropriateness versus total that were significant at a five percent error level. These included SPECT-MPI, CT Abdomen, CT Abdomen and Pelvis, CT Lumbar Spine, and MRI Lumbar Spine. Of the five statistically significant findings, changes in the proportion of appropriate over total ranged from a decrease of 17 percent (MRI Lumbar Spine) to a 10 percent increase (CT Abdomen) when comparing data from baseline to first intervention period. Seven procedures did not show a significant change for this comparison.
In Exhibit 14B.2, we observed six changes in the ratio of appropriateness versus total that were significant at a five percent error level. These included CT Abdomen, CT Abdomen and Pelvis, CT Brain, CT Thorax, MRI Brain and MRI Lumbar Spine. Of the six statistically significant findings, changes in the proportion of appropriate over total ranged from a decrease of nearly 26 percent (MRI Lumbar Spine) to a 4.8 percent increase (CT Abdomen) when comparing data from baseline to first intervention period. Seven procedures did not show a significant change for this comparison.
In Exhibit 14C.2, we observed eight changes in the ratio of appropriateness versus total that were significant at a five percent error level when comparing data from first to third intervention periods. These included SPECT-MPI, MRI Shoulder, MRI Brain, CT Thorax, CT Brain, CT Abdomen, CT Abdomen and Pelvis, and MRI Lumbar Spine. Of the eight statistically significant findings, changes in the proportion of appropriate over total ranged from a decrease of 12.2 percent (MRI Shoulder) to a decrease of 3.6 percent (CT Abdomen & Pelvis). Four procedures did not show a significant change for this comparison.
23 A two proportion hypothesis test was used to determine if, for each MID procedure, a statistically significant change could be detected in two comparison groups: The two proportion test is a statistical standard for comparing percentages from two samples; it requires that each component comprising the proportions have a minimum of ten observations. This is a two-sided test and assumes a null hypothesis that the difference between the two ratios is equal to zero. The test calculates a normally-distributed Z value which is compared against a Z critical value of 1.96 required to reject the null hypothesis at an error level of 0.05
Medicare Imaging Demonstration Report on Pre-Implementation and Implementation Experience
Final Report CMS Internal Use Only 53
Of the seven MID procedures, in Exhibit 14A.2, that experienced an increase in the share of orders assessed as appropriate from baseline to first intervention period, the change for three of these procedures (SPECT-MPI, CT Lumbar Spine, CT Abdomen) is statistically significant. The change experienced by two of the four procedures (CT Abdomen & Pelvis and MRI Lumbar Spine) that experienced a decrease in the share of orders assessed as appropriate is statistically significant.
In Exhibit 14B.2, for the four MID procedures that experienced an increase in the share of orders assessed as appropriate from baseline to third intervention period, the change for one of these procedures (CT Abdomen) is statistically significant. The change experienced by four of the eight procedures (CT Abdomen & Pelvis, CT Brain, CT Thorax and MRI Lumbar Spine) that experienced a decrease in the share of orders assessed as appropriate is statistically significant
In Exhibit 14C.2, comparing the first and third (final) intervention periods all MID procedures experienced a decrease in the share of orders assessed as appropriate between first to third intervention periods, however, only eight were statistically significant. These are CT Abdomen, CT Abdomen & Pelvis, CT Brain, CT Thorax, MRI Brain, MRI Lumbar Spine, MRI Shoulder and SPECT-MPI.
For the three comparisons two proportion tests described above, the volume of procedures for those that did not experience a significant change is much lower than the volume for those that did experience a significant change, indicating that volume of available procedures is an important factor in whether a change is significant under a two proportion test.
Alternatively, the same analysis was performed excluding DSS records assessed as not covered by guidelines and can be found in Appendix F. From the baseline period to first intervention period, the share of orders assessed as appropriate increased for 10 of the 12 MID procedures. Two procedures experienced a decrease in the share of orders assessed as appropriate on the final order determination. Also, between baseline and first intervention period, the share of orders assessed as inappropriate decreased for nine of the 12 MID procedures, increased for two of the procedures, and stayed the same for one procedure (Ref. Alternate Exhibit 14A.1 in Appendix F).
The share of appropriate orders increased for 10 of the 12 MID procedures between baseline and third intervention periods. For inappropriate orders between baseline and third intervention periods, the share decreased for nine of the 12 MID procedures, increased for two procedures, and there was no change for one procedure (Ref. Alternate Exhibit 14B.1 in Appendix F)
The share of appropriate orders increased for eight and decreased for three of the 12 MID procedures between first and third intervention periods. For inappropriate orders between first and third intervention periods, the share decreased for seven of the 12 MID procedures, increased for four procedures, and there was no change for one procedure (Ref. Alternate Exhibit 14C.1 in Appendix F).
The two proportion test was performed excluding DSS records assessed as not covered by guidelines. This alternative analysis can be found in Appendix F as well. In this analysis, nine changes in the ratio of appropriateness versus total, that were significant at a five percent error level, were observed when comparing final order appropriateness assessment for baseline to first intervention period. Of the nine statistically significant findings, changes in the proportion of
Medicare Imaging Demonstration Report on Pre-Implementation and Implementation Experience
Final Report CMS Internal Use Only 54
appropriate over total ranged from a decrease of six percent (CT Abdomen & Pelvis) to a 29 percent increase (CT Lumbar Spine) when comparing data from baseline to first intervention period (Ref. Alternate Exhibit 14A.2 in Appendix F). Three procedures did not show a significant change for this comparison.
Of the ten MID procedures, that experienced an increase in the share of orders assessed as appropriate from baseline to first intervention period, the change for eight of these procedures is statistically significant. The change experienced by one of the two procedures that decreased in the share of orders assessed as appropriate is statistically significant (Ref. Alternate Exhibit 14A.2 in Appendix F). The two proportion test for baseline to third intervention period were observed to be the same as baseline to first intervention period, in that there were 10 MID procedures that increased in appropriateness assessment and eight of these changes were statistically significant. The change experienced by one of the two procedures that decreased in the share of orders assessed as appropriate is statistically significant (Ref. Alternate Exhibit 14B.2 in Appendix F).
Three changes in the ratio of appropriateness versus total that were significant at a five percent error level were observed when comparing data from first to third intervention periods. Of the three statistically significant findings, changes in the proportion of appropriate over total ranged from a decrease of six percent (CT Abdomen & Pelvis) to an increase of eleven percent (MRI Knee) (Ref. Alternate Exhibit 14C.2 in Appendix F). Ten MID procedures did not show a significant change for this comparison.
With the exclusion of orders assessed as not covered by guidelines, the majority of DSS orders across all procedures were assessed as appropriate in all three time periods (baseline, first, and third intervention periods, with the exception of CT Lumbar Spine and CT Pelvis in the baseline period). Two procedures experienced higher shares of inappropriate assessments after not covered by guidelines DSS records were removed. These included MRI Knee (45 percent in baseline and 20 percent in third intervention period) and MRI Shoulder (36 percent in baseline and 16 percent in third intervention period). See Appendix F Alternate Exhibit Series 14 for the detailed tables.
Medicare Imaging Demonstration Report on Pre-Implementation and Implementation Experience
Final Report CMS Internal Use Only 55
Exhibit 14A.1: Final Order Appropriateness Assessment by MID Procedure Baseline and First Intervention Period
*This exhibit excludes Conveners 1 and 5, and one practice.
Appropriate InappropriateNot Covered by
GuidelineUncertain Total
60 2 356 16 434
14% 0% 82% 4% 100%
437 44 1,356 61 1,898
23% 2% 71% 3% 100%
322 46 492 193 1,053
31% 4% 47% 18% 100%
26 8 55 55 144
18% 6% 38% 38% 100%
3 1 102 3 109
3% 1% 94% 3% 100%
91 2 111 12 216
42% 1% 51% 6% 100%
1,317 206 1,651 275 3,449
38% 6% 48% 8% 100%
777 99 923 64 1,863
42% 5% 50% 3% 100%
56 48 104 3 211
27% 23% 49% 1% 100%
644 49 330 72 1,095
59% 4% 30% 7% 100%
98 56 73 2 229
43% 24% 32% 1% 100%
804 144 389 112 1,449
55% 10% 27% 8% 100%
226 10 664 39 939
24% 1% 71% 4% 100%
1085 101 4,231 268 5,685
19% 2% 74% 5% 100%
463 21 763 227 1,474
31% 1% 52% 15% 100%
97 7 191 63 358
27% 2% 53% 18% 100%
11 6 226 5 248
4% 2% 91% 2% 100%
168 2 220 9 399
42% 1% 55% 2% 100%
2,999 272 4,153 470 7,894
38% 3% 53% 6% 100%
1644 96 2,235 74 4,049
41% 2% 55% 2% 100%
109 50 184 2 345
32% 14% 53% 1% 100%
864 60 1028 120 2,072
42% 3% 50% 6% 100%
193 42 177 3 415
47% 10% 43% 1% 100%
1317 74 564 111 2,066
64% 4% 27% 5% 100%
MRI Shoulder
SPECT-MPI
CT Pelvis
CT Sinus
CT Thorax
MRI Brain
MRI Knee
MRI Lumbar Spine
SPECT-MPI
INTERVENTION 1 - PROCEDURE LEVEL DETERMINATION 2
CT Abdomen
CT Abdomen & Pelvis
CT Brain
CT Lumbar Spine
CT Sinus
CT Thorax
MRI Brain
MRI Knee
MRI Lumbar Spine
MRI Shoulder
BASELINE - PROCEDURE LEVEL DETERMINATION 2
CT Abdomen
CT Abdomen & Pelvis
CT Brain
CT Lumbar Spine
CT Pelvis
Medicare Imaging Demonstration Report on Pre-Implementation and Implementation Experience
Final Report CMS Internal Use Only 56
Exhibit 14A.2: Significance of the Change in Percentage of Final Order Appropriateness Assessment from Baseline to First Intervention Period by MID
*This exhibit excludes Conveners 1 and 5, and one practice.
CT Abdomen 10.2% this change is significant
CT Abdomen & Pelvis -3.9% this change is significant
CT Brain 0.8% this change is not significant
CT Lumbar Spine 9.0% this change is significant
CT Pelvis 1.7% this change is not significant
CT Sinus 0.0% this change is not significant
CT Thorax -0.2% this change is not significant
MRI Brain -1.1% this change is not significant
MRI Knee 5.1% this change is not significant
MRI Lumbar Spine -17.1% this change is significant
MRI Shoulder 3.7% this change is not significant
SPECT-MPI 8.3% this change is significant
Appropriateness scores
Baseline to Intervention 1Two Proportion Test ConclusionMID Procedure
Medicare Imaging Demonstration Report on Pre-Implementation and Implementation Experience
Final Report CMS Internal Use Only 57
Exhibit 14B.1: Final Order Appropriateness Assessment by MID Procedure Baseline and Third Intervention Period
*This exhibit excludes Conveners 1 and 5, and one practice.
Appropriate InappropriateNot Covered by
GuidelineUncertain Total
60 2 356 16 434
14% 0% 82% 4% 100%
437 44 1,356 61 1,898
23% 2% 71% 3% 100%
322 46 492 193 1,053
31% 4% 47% 18% 100%
26 8 55 55 144
18% 6% 38% 38% 100%
3 1 102 3 109
3% 1% 94% 3% 100%
91 2 111 12 216
42% 1% 51% 6% 100%
1,317 206 1,651 275 3,449
38% 6% 48% 8% 100%
777 99 923 64 1,863
42% 5% 50% 3% 100%
56 48 104 3 211
27% 23% 49% 1% 100%
644 49 330 72 1,095
59% 4% 30% 7% 100%
98 56 73 2 229
43% 24% 32% 1% 100%
804 144 389 112 1,449
55% 10% 27% 8% 100%
176 19 716 32 943
19% 2% 76% 3% 100%
965 117 5,268 330 6,680
14% 2% 79% 5% 100%
442 13 1061 203 1,719
26% 1% 62% 12% 100%
79 9 250 51 389
20% 2% 64% 13% 100%
8 1 269 5 283
3% 0% 95% 2% 100%
175 0 271 7 453
39% 0% 60% 2% 100%
2,768 246 5,666 391 9,071
31% 3% 62% 4% 100%
1494 74 3,321 47 4,936
30% 1% 67% 1% 100%
113 33 254 2 402
28% 8% 63% 0% 100%
825 67 1520 95 2,507
33% 3% 61% 4% 100%
196 39 268 0 503
39% 8% 53% 0% 100%
1999 97 1370 176 3,642
55% 3% 38% 5% 100%
CT Lumbar Spine
CT Pelvis
CT Sinus
CT Thorax
MRI Brain
MRI Knee
MRI Lumbar Spine
MRI Shoulder
SPECT-MPI
INTERVENTION 3 - PROCEDURE LEVEL DETERMINATION 2
CT Abdomen
CT Abdomen & Pelvis
CT Brain
MRI Brain
MRI Knee
MRI Lumbar Spine
MRI Shoulder
SPECT-MPI
BASELINE - PROCEDURE LEVEL DETERMINATION 2
CT Abdomen
CT Abdomen & Pelvis
CT Brain
CT Lumbar Spine
CT Pelvis
CT Sinus
CT Thorax
Medicare Imaging Demonstration Report on Pre-Implementation and Implementation Experience
Final Report CMS Internal Use Only 58
Exhibit 14B.2: Significance of the Change in Percentage of Final Order Appropriateness Assessment from Baseline to Third Intervention Period by MID
*This exhibit excludes Conveners 1 and 5, and one practice.
CT Abdomen 4.8% this change is significant
CT Abdomen & Pelvis -8.6% this change is significant
CT Brain -4.9% this change is significant
CT Lumbar Spine 2.3% this change is not significant
CT Pelvis 0.1% this change is not significant
CT Sinus -3.5% this change is not significant
CT Thorax -7.7% this change is significant
MRI Brain -11.4% this change is significant
MRI Knee 1.6% this change is not significant
MRI Lumbar Spine -25.9% this change is significant
MRI Shoulder -3.8% this change is not significant
SPECT-MPI -0.6% this change is not significant
MID ProcedureAppropriateness scores
Baseline to Intervention 3Two Proportion Test Conclusion
Medicare Imaging Demonstration Report on Pre-Implementation and Implementation Experience
Final Report CMS Internal Use Only 59
Exhibit 14C.1: Final Order Appropriateness Assessment by MID Procedure First Intervention and Third Intervention Period
*This exhibit excludes Convener 1 and one practice.
Appropriate InappropriateNot Covered by
GuidelineUncertain Total
239 13 782 40 1074
22% 1% 73% 4% 100%
1209 113 5,330 294 6,946
17% 2% 77% 4% 100%
499 33 1024 261 1,817
27% 2% 56% 14% 100%
97 7 254 80 438
22% 2% 58% 18% 100%
11 6 250 5 272
4% 2% 92% 2% 100%
201 2 298 15 516
39% 0% 58% 3% 100%
3,257 303 5,186 514 9,260
35% 3% 56% 6% 100%
1740 99 2,867 82 4,788
36% 2% 60% 2% 100%
157 72 306 6 541
29% 13% 57% 1% 100%
956 69 1401 137 2,563
37% 3% 55% 5% 100%
254 58 230 5 547
46% 11% 42% 1% 100%
1380 105 695 115 2,295
60% 5% 30% 5% 100%
186 21 798 34 1039
18% 2% 77% 3% 100%
1088 135 6,324 358 7,905
14% 2% 80% 5% 100%
487 19 1315 233 2,054
24% 1% 64% 11% 100%
81 11 312 66 470
17% 2% 66% 14% 100%
8 1 305 7 321
2% 0% 95% 2% 100%
225 1 355 10 591
38% 0% 60% 2% 100%
3,056 257 6,669 444 10,426
29% 2% 64% 4% 100%
1603 77 3,966 51 5,697
28% 1% 70% 1% 100%
168 44 410 4 626
27% 7% 65% 1% 100%
918 72 1931 110 3,031
30% 2% 64% 4% 100%
225 45 385 3 658
34% 7% 59% 0% 100%
2059 108 1529 181 3,877
53% 3% 39% 5% 100%SPECT-MPI
MRI Brain
MRI Brain
MRI Knee
MRI Knee
MRI Shoulder
MRI Shoulder
CT Abdomen & Pelvis
CT Abdomen & Pelvis
CT Abdomen
CT Abdomen
SPECT-MPI
CT Brain
CT Lumbar Spine
CT Lumbar Spine
CT Pelvis
CT Pelvis
INTERVENTION 3 - PROCEDURE LEVEL DETERMINATION 2
CT Brain
CT Sinus
CT Sinus
CT Thorax
INTERVENTION 1 - PROCEDURE LEVEL DETERMINATION 2
MRI Lumbar Spine
MRI Lumbar Spine
CT Thorax
Medicare Imaging Demonstration Report on Pre-Implementation and Implementation Experience
Final Report CMS Internal Use Only 60
Exhibit 14C.2: Significance of the Change in Percentage of Final Order Appropriateness Assessment from First Intervention to Third Intervention Period by MID Procedure
*This exhibit excludes Convener 1 and one practice.
3. Demonstration-Wide DSS Original and Final Order Appropriateness Assessment by Procedure– First and Third Intervention Periods
During the intervention period, the ordering practitioner was provided immediate feedback on the appropriateness of the order. Thus, another approach for examining the DSS data during the intervention period is to look at the appropriateness assessments between the original order DSS assessment and the assessment of appropriateness on the final order—see Exhibit 15A and Exhibit 15B. The data presented in this report is limited to just the MID procedures, and does not include those orders for which the practitioner either changed to a non-MID procedure or cancelled an order. A more comprehensive analysis related to evaluating the impact of the DSS is the subject of the demonstration evaluation. Lewin includes the data in this report because calculations of original order appropriateness and final order appropriateness assessments for the intervention period were variables included in the feedback reporting process.
In Exhibit 15A.1, all 12 MID procedures experienced slight increases in the share of MID procedure orders assessed as appropriate between the original order determination and final order determination during the first intervention period. In Exhibit 15B.1, for the third intervention period, 10 procedures showed a small increase in change of appropriateness; while one procedure experienced a small decrease and one procedure experienced no change.
The two proportion test was also used to examine changes from original order determination to final order determination. For first intervention period, the change in proportion of appropriate versus total was found to be significant for one MID procedure (CT Abdomen & Pelvis)—see Exhibit 15A.2. Even though the change is statistically significant it was only an increase of 1.2 percent. In Exhibit 15B.2, none of the procedures show a statistically significant change in proportion of appropriate versus total for the third intervention period. Across the MID procedures, changes in proportion from original order determination to final order determination,
CT Abdomen -4.4% this change is significant
CT Abdomen & Pelvis -3.6% this change is significant
CT Brain -3.8% this change is significant
CT Lumbar Spine -4.9% this change is not significant
CT Pelvis -1.6% this change is not significant
CT Sinus -0.9% this change is not significant
CT Thorax -5.9% this change is significant
MRI Brain -8.2% this change is significant
MRI Knee -2.2% this change is not significant
MRI Lumbar Spine -7.0% this change is significant
MRI Shoulder -12.2% this change is significant
SPECT-MPI -7.0% this change is significant
MID Procedure Two Proportion Test Conclusion
Appropriateness scores
Intervention 1 to
Intervention 3
Medicare Imaging Demonstration Report on Pre-Implementation and Implementation Experience
Final Report CMS Internal Use Only 61
for the first and third intervention periods, were smaller than those from baseline to first intervention period using the final order determination only as the unit of measure.
Alternatively, similar results excluding DSS records assessed as not covered by guidelines can be found in Appendix F. For orders assessed as appropriate between the original order determination and final order determination during the first intervention period, 11 of 12 MID procedures experienced slight increases (Ref. Alternate Exhibit 15A.1 in Appendix F). For the third intervention period, 10 procedures showed a small increase in change of appropriateness, while two procedures experienced no change (Ref. Alternate Exhibit 15C.1 in Appendix F).
For the first intervention period, none of the procedures show a statistically significant change in proportion of appropriate versus total when comparing original order appropriate assessment to final order appropriate assessment (Ref. Alternate Exhibit 15A.2 in Appendix F). The same trend was observed for the third intervention period when comparing original to final appropriate assessments (Ref. Alternate Exhibit 15C.2 in Appendix F).
As with the previous analysis around final order determination, excluding orders assessed as not covered by guidelines results in a larger proportion of orders assessed as appropriate across all MID procedures. As in the previous assessment, MRI Knee experiences a higher level of images assessed as inappropriate at 31 percent in first intervention period and 23 percent in third intervention period. See Appendix F for the detailed tables.
Medicare Imaging Demonstration Report on Pre-Implementation and Implementation Experience
Final Report CMS Internal Use Only 62
Exhibit 15A.1: Original and Final Order Appropriateness Assessment by MID Procedure for the First Intervention Period
This exhibit excludes Convener 1 and one practice.
198 14 775 36 1,023
19% 1% 76% 4% 100%
1,130 115 5406 319 6,970
16% 2% 78% 5% 100%
497 34 1178 273 1,982
25% 2% 59% 14% 100%
93 7 258 84 442
21% 2% 58% 19% 100%
9 7 256 7 279
3% 3% 92% 3% 100%
200 3 300 14 517
39% 1% 58% 3% 100%
3,219 312 5236 528 9,295
35% 3% 56% 6% 100%
1,711 103 3053 88 4,955
35% 2% 62% 2% 100%
154 72 308 5 539
29% 13% 57% 1% 100%
937 73 1427 144 2,581
36% 3% 55% 6% 100%
251 60 230 5 546
46% 11% 42% 1% 100%
1,381 111 693 116 2,301
60% 5% 30% 5% 100%
239 13 782 40 1,074
22% 1% 73% 4% 100%
1,209 113 5,330 294 6,946
17% 2% 77% 4% 100%
499 33 1,024 261 1,817
27% 2% 56% 14% 100%
97 7 254 80 438
22% 2% 58% 18% 100%
11 6 250 5 272
4% 2% 92% 2% 100%
201 2 298 15 516
39% 0% 58% 3% 100%
3,257 303 5,186 514 9,260
35% 3% 56% 6% 100%
1,740 99 2,867 82 4,788
36% 2% 60% 2% 100%
157 72 306 6 541
29% 13% 57% 1% 100%
956 69 1,401 137 2,563
37% 3% 55% 5% 100%
254 58 230 5 547
46% 11% 42% 1% 100%
1,380 105 695 115 2,295
60% 5% 30% 5% 100%SPECT-MPI
MRI Lumbar Spine
MRI Shoulder
MRI Knee
CT Sinus
CT Thorax
MRI Brain
CT Lumbar Spine
CT Pelvis
MRI Lumbar Spine
MRI Shoulder
SPECT-MPI
INTERVENTION 1 - PROCEDURE LEVEL DETERMINATION 2
CT Abdomen
CT Abdomen & Pelvis
Appropriate
CT Thorax
MRI Brain
InappropriateNot Covered
by GuidelineUncertain Total
INTERVENTION 1 - PROCEDURE LEVEL DETERMINATION 1
CT Abdomen
CT Abdomen & Pelvis
CT Brain
CT Brain
CT Lumbar Spine
CT Pelvis
CT Sinus
MRI Knee
Medicare Imaging Demonstration Report on Pre-Implementation and Implementation Experience
Final Report CMS Internal Use Only 63
Exhibit 15A.2: Significance of the Change in Percentage of Original Order to Final Order Appropriateness Assessments by MID Procedure for the First Intervention Period
This exhibit excludes Convener 1 and one practice.
CT Abdomen 2.9% this change is not significant
CT Abdomen & Pelvis 1.2% this change is significant
CT Brain 2.4% this change is not significant
CT Lumbar Spine 1.1% this change is not significant
CT Pelvis 0.8% this change is not significant
CT Sinus 0.3% this change is not significant
CT Thorax 0.5% this change is not significant
MRI Brain 1.8% this change is not significant
MRI Knee 0.4% this change is not significant
MRI Lumbar Spine 1.0% this change is not significant
MRI Shoulder 0.5% this change is not significant
SPECT-MPI 0.1% this change is not significant
MID ProcedureAppropriateness scores
Intervention 1 DET 1 to DET 2Two Proportion Test Conclusion
Medicare Imaging Demonstration Report on Pre-Implementation and Implementation Experience
Final Report CMS Internal Use Only 64
Exhibit 15B.1: Original and Final Order Appropriateness Assessment by MID Procedure for the Third Intervention Period
This exhibit excludes Convener 1 and one practice.
155 26 795 29 1,005
15% 3% 79% 3% 100%
1,023 141 6385 373 7,922
13% 2% 81% 5% 100%
480 21 1480 241 2,222
22% 1% 67% 11% 100%
77 15 315 71 478
16% 3% 66% 15% 100%
7 2 306 6 321
2% 1% 95% 2% 100%
227 1 355 10 593
38% 0% 60% 2% 100%
3,045 266 6727 440 10,478
29% 3% 64% 4% 100%
1,576 80 4192 62 5,910
27% 1% 71% 1% 100%
164 46 417 5 632
26% 7% 66% 1% 100%
908 86 1960 112 3,066
30% 3% 64% 4% 100%
222 46 388 3 659
34% 7% 59% 0% 100%
2,058 108 1527 181 3,874
53% 3% 39% 5% 100%
186 21 798 34 1,039
18% 2% 77% 3% 100%
1,088 135 6,324 358 7,905
14% 2% 80% 5% 100%
487 19 1,315 233 2,054
24% 1% 64% 11% 100%
81 11 312 66 470
17% 2% 66% 14% 100%
8 1 305 7 321
2% 0% 95% 2% 100%
225 1 355 10 591
38% 0% 60% 2% 100%
3,056 257 6,669 444 10,426
29% 2% 64% 4% 100%
1,603 77 3,966 51 5,697
28% 1% 70% 1% 100%
168 44 410 4 626
27% 7% 65% 1% 100%
918 72 1,931 110 3,031
30% 2% 64% 4% 100%
225 45 385 3 658
34% 7% 59% 0% 100%
2,059 108 1529 181 3,877
53% 3% 39% 5% 100%SPECT-MPI
CT Abdomen & Pelvis
MRI Lumbar Spine
MRI Shoulder
Appropriate InappropriateNot Covered
by GuidelineUncertain Total
MRI Knee
CT Sinus
CT Thorax
MRI Brain
CT Lumbar Spine
CT Pelvis
MRI Lumbar Spine
MRI Shoulder
SPECT-MPI
INTERVENTION 3 - PROCEDURE LEVEL DETERMINATION 2
CT Abdomen
CT Abdomen & Pelvis
CT Thorax
MRI Brain
INTERVENTION 3 - PROCEDURE LEVEL DETERMINATION 1
CT Abdomen
CT Brain
CT Brain
CT Lumbar Spine
CT Pelvis
CT Sinus
MRI Knee
Medicare Imaging Demonstration Report on Pre-Implementation and Implementation Experience
Final Report CMS Internal Use Only 65
Exhibit 15B.2: Significance of the Change in Percentage of Original and Final Order Appropriateness Assessments by MID Procedure for the Third Intervention Period
This exhibit excludes Convener 1 and one practice.
D. Cancelled and Changed Orders
DSS orders could be cancelled, delayed, or changed at a few key decision points in the DSS process. During the intervention period, before the final order was placed, ordering physicians received input from the DSS. In addition, during both the baseline and intervention periods, the normal radiology protocoling processes were in place and also were expected to have influenced the type of image ultimately ordered and rendered or whether any image was rendered at all. Thus, at several points in the workflow an order could be cancelled or changed.
Within the DSS, ordering workflow provision was made for capturing data on cancelled orders at several points. The first data capture occurred after the practitioner was presented with the feedback from the DSS (CSV variable AH ‘image order cancelled’). In a related variable, a second data capture on cancelled orders was provided for as part of the documentation of the physician decision in response to DSS feedback (CSV variable AX “Physician Decision 1’). A third potential data capture was provided for (CSV variable BS ‘Physician Decision 2’), occurring after radiologist review and recommendations. This same variable on Physician Decision 2 also provided for capturing a decision to delay an order based on radiologist recommendation. Finally, provision for capturing cancelled orders was made as part of the CSV variable documenting termination status (CSV variable BZ ‘Termination’).
Exhibit 16 summarizes the volume of cancelled orders for each variable that indicates an order was cancelled. No orders were reported as cancelled or delayed at Physician Decision 2, after review by a radiologist. As noted previously in the report, while the CSV specification provided for capturing data on radiologist recommendations and ordering practitioner response, feedback from conveners indicated this was very difficult information to capture and thus these fields were
CT Abdomen 2.5% this change is not significant
CT Abdomen & Pelvis 0.9% this change is not significant
CT Brain 2.1% this change is not significant
CT Lumbar Spine 1.1% this change is not significant
CT Pelvis 0.3% this change is not significant
CT Sinus -0.2% this change is not significant
CT Thorax 0.3% this change is not significant
MRI Brain 1.5% this change is not significant
MRI Knee 0.9% this change is not significant
MRI Lumbar Spine 0.7% this change is not significant
MRI Shoulder 0.5% this change is not significant
SPECT-MPI 0.0% this change is not significant
Two Proportion Test ConclusionMID ProcedureAppropriateness scores
Intervention 3 DET 1 to DET 2
Medicare Imaging Demonstration Report on Pre-Implementation and Implementation Experience
Final Report CMS Internal Use Only 66
optional. Only two conveners reported any data in CSV data fields related to radiologist recommendations.24
As shown in Exhibit 16, a small percentage of cancelled orders appear to have occurred after the initial feedback from the DSS (CSV variable AH) during the intervention period (0.87 percent for the first six months of the intervention period, and 0.61 percent during the last six months of the intervention period). In total, based on the termination variable BZ, there were additional order cancellations. Across the demonstration as a whole, 7.37 percent of DSS orders were identified as cancelled in CSV variable BZ during the first six months of intervention and 4.09 percent during the last six months of intervention. During the baseline period 10.68 percent of orders were identified as cancelled. The assumption related to the larger share of cancelled orders reflected in the termination variable BZ is that this may reflect radiologist intervention. Rate of cancellations varied by convener, and the pattern across time periods also varied.
Exhibit 17 presents information on the timing of changed orders. MID-wide, 19.3 percent of original orders were changed between the initial order and the final order during the baseline period. The rate decreased slightly to 16.5 percent of orders being changed between original and final order by the final six months of the intervention period. The volume of changed orders excludes cancelled orders and orders without a valid procedure in the original order. During the baseline period, the DSS did not provide feedback. As such, orders changed during this period are assumed to have been influenced not by the DSS but by other factors, and most likely radiology protocoling.
Some changes occurring during the intervention period may have been prompted by DSS feedback, before radiologist review. Exhibit 17 shows three periods for changed orders: (1) between initial order and DSS feedback, (2) between feedback and final order, and (3) between initial order and final order. As shown in Exhibit 17, during the intervention period a small percentage of orders changed between the initial order and the DSS feedback. During the first six months of the intervention period, less than 4 percent of orders changed after DSS feedback, and during the last six months of the intervention period less than 1 percent of orders changed after DSS feedback. A larger share of orders changed between initial and final order again likely reflecting radiology intervention. During the intervention period, the order image could change after DSS feedback and again after radiologist feedback. In some cases, it may have been possible for the original order to change after DSS feedback, but then change back to the original order after radiologist feedback. In other words, the sum of changes between original order and feedback and the changes between feedback and final order may not add up to the number of changes between original and final order.
The pattern of changed orders between initial order and DSS feedback varied by convener, but consistently was a small percentage of orders from less than 1 percent to less than 6 percent. A much larger variation in changed orders occurred across conveners between the initial order and the final order captured in the DSS data ranging from around 2 percent to over 35 percent. This larger variation across conveners in changed orders between original and final reflected in the DSS
24 One convener captured radiologist related data for 97 percent of the DSS records in the demonstration, with 84 percent indicating no recommendation from radiologist. A second convener captured this data for 55 percent of the DSS records (the majority are intervention records) in the demonstration, with 49 percent indicating no recommendation from radiologist.
Medicare Imaging Demonstration Report on Pre-Implementation and Implementation Experience
Final Report CMS Internal Use Only 67
data is likely due to a number of factors, including the nature of the conveners’ practices and the involvement of and policies for radiology protocoling across the participating practices. Also, the availability to the convener of information on the final image ordered and ultimately rendered.
Medicare Imaging Demonstration Report on Pre-Implementation and Implementation Experience
Final Report CMS Internal Use Only 68
Exhibit 16: MID Cancelled Orders Summary by Convener
All Orders All Cancelled
or Delayed
Orders
Cancelled at
Terminated
(BZ=1)
Cancelled at
Image Order
Cancelled
(AH=Yes)
Cancelled at
Physician
Decision 1
(AX=6)
Cancelled at
Physician
Decision 2
(BS=4)
Delayed at
Physician
Decision 2
(BS=5)
Cancelled at
Image Order
Cancelled
and
Terminated
Cancelled at
Physician
Decision
1 and
Terminated
Cancelled or
Delayed at
Physician
Decision 2
and
Terminated
Number of Orders 35,283 3,770 3,770 27 3 0 0 27 3 0
% of All Orders 10.685% 10.685% 0.077% 0.009% 0.000% 0.000% 0.077% 0.009% 0.000%
Number of Orders 49,242 3,631 3,631 429 23 0 0 429 23 0
% of All Orders 7.374% 7.374% 0.871% 0.047% 0.000% 0.000% 0.871% 0.047% 0.000%
Number of Orders 50,062 2,050 2,048 306 18 0 0 306 18 0
% of All Orders 4.095% 4.091% 0.611% 0.036% 0.000% 0.000% 0.611% 0.036% 0.000%
Number of Orders 5,828 464 464 0 0 0 0 0 0 0
% of All Orders 7.962% 7.962% 0.000% 0.000% 0.000% 0.000% 0.000% 0.000% 0.000%
Number of Orders 7,199 1,088 1,088 349 0 0 0 349 0 0
% of All Orders 15.113% 15.113% 4.848% 0.000% 0.000% 0.000% 4.848% 0.000% 0.000%
Number of Orders 2,625 358 358 72 0 0 0 72 0 0
% of All Orders 13.638% 13.638% 2.743% 0.000% 0.000% 0.000% 2.743% 0.000% 0.000%
Number of Orders 2,933 160 160 17 0 0 0 17 0 0
% of All Orders 5.455% 5.455% 0.580% 0.000% 0.000% 0.000% 0.580% 0.000% 0.000%
Number of Orders 3,085 136 136 23 18 0 0 23 18 0
% of All Orders 4.408% 4.408% 0.746% 0.583% 0.000% 0.000% 0.746% 0.583% 0.000%
Number of Orders 3,178 307 307 12 12 0 0 12 12 0
% of All Orders 9.660% 9.660% 0.378% 0.378% 0.000% 0.000% 0.378% 0.378% 0.000%
Number of Orders 13,655 395 395 3 3 0 0 3 3 0
% of All Orders 2.893% 2.893% 0.022% 0.022% 0.000% 0.000% 0.022% 0.022% 0.000%
Number of Orders 28,485 801 801 5 5 0 0 5 5 0
% of All Orders 2.812% 2.812% 0.018% 0.018% 0.000% 0.000% 0.018% 0.018% 0.000%
Number of Orders 33,015 625 623 6 6 0 0 6 6 0
% of All Orders 1.893% 1.887% 0.018% 0.018% 0.000% 0.000% 0.018% 0.018% 0.000%
Number of Orders 1,865 7 7 7 0 0 0 7 0 0
% of All Orders 0.375% 0.375% 0.375% 0.000% 0.000% 0.000% 0.375% 0.000% 0.000%
Number of Orders 2,456 30 30 29 0 0 0 29 0 0
% of All Orders 1.221% 1.221% 1.181% 0.000% 0.000% 0.000% 1.181% 0.000% 0.000%
Number of Orders 3,171 28 28 28 0 0 0 28 0 0
% of All Orders 0.883% 0.883% 0.883% 0.000% 0.000% 0.000% 0.883% 0.000% 0.000%
Number of Orders 11,002 2,744 2,744 0 0 0 0 0 0 0
% of All Orders 24.941% 24.941% 0.000% 0.000% 0.000% 0.000% 0.000% 0.000% 0.000%
Number of Orders 8,017 1,576 1,576 23 0 0 0 23 0 0
% of All Orders 19.658% 19.658% 0.287% 0.000% 0.000% 0.000% 0.287% 0.000% 0.000%
Number of Orders 8,073 732 732 188 0 0 0 188 0 0
% of All Orders 9.067% 9.067% 2.329% 0.000% 0.000% 0.000% 2.329% 0.000% 0.000%
Order CategoriesM
ID W
ide
BaselineOct 2011 -
Mar 2012
InterventionApril 2012 -
Sep 2012
InterventionApril 2013 -
Sep 2013
Co
nven
er
1
BaselineOct 2011 -
Mar 2012
InterventionApril 2012 -
Sep 2012
InterventionApril 2013 -
Sep 2013
Co
nven
er
2 BaselineOct 2011 -
Mar 2012
InterventionApril 2012 -
Sep 2012
InterventionApril 2013 -
Sep 2013
Co
nven
er
3 BaselineOct 2011 -
Mar 2012
InterventionApril 2012 -
Sep 2012
InterventionApril 2013 -
Sep 2013
Co
nven
er
4 BaselineOct 2011 -
Mar 2012
InterventionApril 2012 -
Sep 2012
InterventionApril 2013 -
Sep 2013
Co
nven
er
5 BaselineOct 2011 -
Mar 2012
InterventionApril 2012 -
Sep 2012
InterventionApril 2013 -
Sep 2013
Medicare Imaging Demonstration Report on Pre-Implementation and Implementation Experience
Final Report CMS Internal Use Only 69
Exhibit 17: MID Changed Orders Summary by Convener
Between Initial
Order and
Feedback
Between
Feedback and
Final Order
Between Initial
Order and Final
Order
Number of Orders 35,283 3,770 0 0 6,802
% of All Orders 10.685% 0.000% 0.000% 19.278%
Number of Orders 49,242 3,631 1,919 9,354 8,500
% of All Orders 7.374% 3.897% 18.996% 17.262%
Number of Orders 50,062 2,050 453 7,834 8,239
% of All Orders 4.095% 0.905% 15.649% 16.458%
Number of Orders 5,828 464 0 0 1,596
% of All Orders 7.962% 0.000% 0.000% 27.385%
Number of Orders 7,199 1,088 33 1,736 1,747
% of All Orders 15.113% 0.458% 24.114% 24.267%
Number of Orders 2,625 358 5 538 538
% of All Orders 13.638% 0.190% 20.495% 20.495%
Number of Orders 2,933 160 0 0 0
% of All Orders 5.455% 0.000% 0.000% 0.000%
Number of Orders 3,085 136 98 0 98
% of All Orders 4.408% 3.177% 0.000% 3.177%
Number of Orders 3,178 307 59 0 59
% of All Orders 9.660% 1.857% 0.000% 1.857%
Number of Orders 13,655 395 0 0 4,927
% of All Orders 2.893% 0.000% 0.000% 36.082%
Number of Orders 28,485 801 1,707 7,182 6,142
% of All Orders 2.812% 5.993% 25.213% 21.562%
Number of Orders 33,015 625 318 6,560 6,836
% of All Orders 1.893% 0.963% 19.870% 20.706%
Number of Orders 1,865 7 0 0 11
% of All Orders 0.375% 0.000% 0.000% 0.590%
Number of Orders 2,456 30 44 4 44
% of All Orders 1.221% 1.792% 0.163% 1.792%
Number of Orders 3,171 28 19 1 19
% of All Orders 0.883% 0.599% 0.032% 0.599%
Number of Orders 11,002 2,744 0 0 268
% of All Orders 24.941% 0.000% 0.000% 2.436%
Number of Orders 8,017 1,576 37 432 469
% of All Orders 19.658% 0.462% 5.389% 5.850%
Number of Orders 8,073 732 52 735 787
% of All Orders 9.067% 0.644% 9.104% 9.749%
Order Categories
MID
Wid
e
BaselineOct 2011 -
Mar 2012
InterventionApril 2012 -
Sep 2012
InterventionApril 2013 -
Sep 2013
Co
nven
er
1
BaselineOct 2011 -
Mar 2012
InterventionApril 2012 -
Sep 2012
InterventionApril 2013 -
Sep 2013
Co
nven
er
2 BaselineOct 2011 -
Mar 2012
InterventionApril 2012 -
Sep 2012
InterventionApril 2013 -
Sep 2013
April 2013 -
Sep 2013
Co
nven
er
3 BaselineOct 2011 -
Mar 2012
InterventionApril 2012 -
Sep 2012
InterventionApril 2013 -
Sep 2013
All Cancelled or
Delayed Orders
All Orders Changed
Co
nven
er
5 BaselineOct 2011 -
Mar 2012
InterventionApril 2012 -
Sep 2012
InterventionApril 2013 -
Sep 2013
Co
nven
er
4 BaselineOct 2011 -
Mar 2012
InterventionApril 2012 -
Sep 2012
Intervention
Medicare Imaging Demonstration Report on Pre-Implementation and Implementation Experience
Final Report CMS Internal Use Only 70
E. Utilization Rate Data Analysis of Baseline and Intervention Periods
An element of the feedback reports Lewin provided to the conveners included an analysis of utilization rates for each practice, for each convener, and for the demonstration as a whole. As part of the preparation of the final report on the demonstration, Lewin updated the utilization rate analysis to cover the entire demonstration period. Exhibits 18, 19, 20A and 20B that follow present the final utilization rate analysis that compares both the baseline period of October 1, 2011 – March 30, 2012, and the first six months of the intervention period (April 1, 2012 – September 30, 2012) to the final six months of the intervention period (April 1, 2013 – September 30, 2013). Utilization rates are calculated per 100 Medicare beneficiaries. The method used for the utilization rate calculations presented in this report is the same as done for the feedback reporting process (see Section II.C.1.Data for a description).
As previously noted in the interim report, utilization rates for the MID procedures vary across the practices in the demonstration. The MID-wide utilization rates in Exhibits 18 and 19 are influenced greatly by the larger practices in the demonstration.
Exhibit 19 is a compilation and comparison of the larger multi-specialty group practices in the demonstration with baseline, first period, and final period intervention utilization rates. The variance25 in utilization rates across these eight practices is highest for CT Abdomen/Pelvis, CT Thorax, MRI Brain, and SPECT MPI, while there is little variation for the other eight MID procedures. The variation is likely related to the lack of homogeneity of the practices in the demonstration and the inclusion of medical, surgical, and other specialty practices. Exhibit 19 illustrates that comparison of utilization rates over time for the practices in this demonstration should be a comparison within the practice itself rather than comparison across practices in the demonstration.
The analysis of the utilization rate data for the practices in the demonstration found that many of the smaller or specialty specific MID practices may have very few rendered imaging claims in the numerator for certain procedures. As a result of the small numerator at the practice level, the utilization rate for a particular MID procedure may appear to experience an increase (e.g., double), when in fact this is an artifact of simply having an increase in the numerator from one to two procedures in the numerator. Furthermore, analysis of the utilization rate data indicates that it is difficult to make comparisons across practices because of the differences in the mix of procedures ordered by the practices. Lastly, as part of the strategy to deal with the challenge of practitioner and patient migration, Lewin did limit the claims assigned to some practices based on the location of where the image was rendered. However, this strategy was not feasible or applicable for all practices. Consequently, as illustrated in Exhibit 19, some of the higher rates seen at one practice are likely due to the characteristics of the practice and the nature of its service area, in that it was not possible to limit the imaging claims to just those rendered by this practice; whereas, the strategy for addressing the challenge of migration could be applied to all the other practices included in Exhibit 19.
25 Variance is a measure of how far each value in the data set is from the mean. The variance is small when the data are clustered around the mean and large when the data are scattered. Standard deviation is a comparable measure of central tendency.
Medicare Imaging Demonstration Report on Pre-Implementation and Implementation Experience
Final Report CMS Internal Use Only 71
The demonstration-wide utilization rates by MID procedure decrease slightly between the baseline and final six months of the intervention period, as well as between the first six months of the intervention period and the last six months of the intervention period. Again, we chose a two proportion test to evaluate the significance of the changes in utilization rate over time.26 In Exhibit 20A, which compares the baseline period to the final six months of the intervention period, the range of difference between average baseline utilization rates and intervention utilization rates is -0.29 to -0.01, with an average difference of -0.16, weighted by the number of images, with rates measured as procedures per 100 beneficiaries. Exhibit 20B, which compares the first six months of the intervention period with the last six months of the intervention period, demonstrates similar changes in utilization rate ranging from -0.27 to 0; CT sinus rates remained statistically the same. In aggregate, the decrease in utilization of the MID procedures as a market basket measure, -1.13 per 100 Medicare beneficiaries (baseline to final six months of intervention period) and -0.87 per 100 Medicare beneficiaries (first six months of intervention period to final six months of intervention period), is statistically significant. The baseline and intervention utilization rates are both based on a six-month measurement period. It is important to note that our analysis is limited as we do not have a comparison group that is external to the demonstration. It is our understanding that the evaluation will have comparison groups.
26 A two proportion hypothesis test was used to determine if, for each MID procedure, a statistically significant change could be detected in two comparison groups: The two proportion test is a statistical standard for comparing percentages from two samples; however, it requires that each component comprising the proportions have a minimum of ten observations which was not always the case with our data. This is a two-sided test and assumes a null hypothesis that the difference between the two ratios is equal to zero. The test calculates a normally-distributed Z value which is compared against a Z critical value of 1.96 required to reject the null hypothesis at an error level of 0.05
Medicare Imaging Demonstration Report on Pre-Implementation and Implementation Experience
Final Report CMS Internal Use Only 72
Exhibit 18: MID Utilization Rate by MID procedure on Medicare Claims per 100 Medicare Beneficiaries — MID-WIDE
CT
Ab/Pelvis
CT
AbdomenCT Pelvis CT Thorax
CT Lumbar
Spine
MRI
Lumbar
Spine
MRI Brain CT Brain CT Sinus MRI KneeMRI
ShoulderSPECT MPI Total
Number of Images 7370 1070 196 9577 584 2471 4810 2198 782 994 670 3590 34312
Medicare Imaging Demonstration Report on Pre-Implementation and Implementation Experience
Final Report CMS Internal Use Only 73
Exhibit 19: MID Utilization Rate by MID procedure on Medicare Claims per 100 Medicare Beneficiaries Baseline to Intervention Periods — Selected Practices
Sub09 Utilization Rate Testing with Two Proportion TestFirst Six Months of Intervention vs. Final Six Months of Intervention - All MID and by Procedure
Intervention (Apr 2012 - Sep 2012) Intervention (Apr 2013-Sep 2013) Two Proportion Test
H0(null hypothesis): proportion of images to benes in baseline is statistically equal to the proportion in the intervention period
Medicare Imaging Demonstration Report on Pre-Implementation and Implementation Experience
Final Report CMS Internal Use Only 76
F. Conclusion
The experience of the MID illuminates the necessity to clearly understand daily workflow and local practice standards of providers in the field as it relates to the successful implementation of a DSS. In particular, integration of the demonstration requirements for DSS into practices with EMR and ROE systems presented challenges that resulted in a delay in launching the demonstration. However, those practices where DSS was integrated, or at least interoperable with a ROE system, seem to have better compliance with using the DSS. The MID experience also points to the need to only interrupt practitioner workflow when there is actionable messaging information.
The MID has revealed that available clinical guidelines from medical specialty societies used in this demonstration address a limited set of clinical scenarios and presenting symptoms resulting in a large share of the advanced image orders in this demonstration being not covered by guidelines. Further, the MID experience points to the need for medical specialty societies to develop processes that facilitate the translation of written guidelines into dynamic algorithmic logic that can be easily incorporated into DSSs. Convener participants in the MID advocated that sources of evidence should not be limited to medical society guidelines, and that it is important to focus on the strength of the evidence base.
The purpose of the MID is to assess whether the use of DSSs, in conjunction with medical specialty society guidelines, promote appropriate use of imaging services, improve quality of care and reduce unnecessary radiation exposure in Medicare beneficiaries. A formal evaluation of the MID is being conducted by RAND as the contracted evaluator to CMS for this demonstration.
Conveners during the February 2014 in-person meeting noted that the MID has influenced the progress of the use of DSSs for radiology services. In general, the conveners expressed the view that DSS can be a useful tool in promoting evidenced-based imaging and there were key lessons learned related to implementation of DSS as part of the demonstration.
Medicare Imaging Demonstration Report on Pre-Implementation and Implementation Experience
Final Report CMS Internal Use Only 77
Appendix A: List of Practices & Participation Status
Practice Practice Specialty MID Status
MID Baseline
Start Date
MID Intervention
Start Date
Practice 1 Multi-specialty Still participating October 1, 2011 April 1, 2012
Practice 2 Family Practice / General Practice Still participating October 20, 2011 April 1, 2012
Practice 3 Cardiology No longer exists, but still participating; merged with P015 – Maine Medical Center in Sub03 and kept TIN
October 20, 2011 April 1, 2012
Practice 4 Surgery Still participating October 20, 2011 April 1, 2012
Practice 5 Pulmonology Still participating October 20, 2011 April 1, 2012
Practice 6 No longer participating; dropped out in Sub01
Practice 7 No longer participating; dropped out in Sub01
Practice 8 No longer participating; dropped out in Sub04
Practice 9 Family Practice / General Practice Still participating October 20, 2011 April 1, 2012
Practice 10 Multi-specialty Still participating October 20, 2011 April 1, 2012
Practice 11 Multi-specialty No longer exists, but still participating; merged with P015 – Maine Medical Center in Sub01 and kept TIN.
October 20, 2011 April 1, 2012
Practice 12 Orthopedics Still participating October 20, 2011 April 1, 2012
Practice 13 Surgery Still participating October 20, 2011 April 1, 2012
Practice 14 No longer participating; dropped out in Sub01
Practice 15 Multi-specialty Still participating October 20, 2011 April 1, 2012
Practice 16 Multi-specialty Still participating October 20, 2011 April 1, 2012
Practice 17 No longer participating; dropped out in Sub01
Practice 18 Surgery Still participating October 20, 2011 April 1, 2012
Practice 19 No longer participating. Decision made March 2013, however, practice never submitted data
Practice 20 Multi-specialty Still participating October 20, 2011 April 1, 2012
Practice 21 Multi-specialty Still participating October 20, 2011 April 1, 2012
Practice 22 Multi-specialty Still participating Phased 1/24-27/2012 April 10, 2012
Practice 23 Multi-specialty Still participating Phased 1/19-25/2012 April 17, 2012
Practice 24 Multi-specialty Still participating Phased started
12/13/2011 – 1/30/2012 April 17, 2012
Medicare Imaging Demonstration Report on Pre-Implementation and Implementation Experience
Final Report CMS Internal Use Only 78
Practice Practice Specialty MID Status
MID Baseline
Start Date
MID Intervention
Start Date
Practice 25 Multi-specialty Still participating November 21, 2011 April 10, 2012
Practice 26 No longer participating; dropped out in Sub05. No DSS records received from practice after Sub03.
October 1, 2011 April 1, 2012
Practice 27 Cardiology Still participating October 1, 2011 April 1, 2012
Practice 28 No longer participating; dropped out in Sub03
Practice 29 Multi-specialty Still participating December 1, 2011 April 1, 2012
Practice 30 Cardiology Still participating October 1, 2011 April 1, 2012
Practice 31 No longer participating; dropped out in Sub00
Practice 32 General Internal Medicine Still participating October 1, 2011 April 1, 2012
Practice 33 Family Practice / General Practice Still participating October 1, 2011 April 1, 2012
Practice 34 Family Practice / General Internal
Medicine Still participating January 31, 2012 Nov. 28, 2012
Practice 35 Multi-specialty Still participating February 8, 2012 October 17, 2012
Practice 36 Multi-specialty Still participating October 1, 2011 June 26, 2012
Medicare Imaging Demonstration Report on Pre-Implementation and Implementation Experience
Final Report CMS Internal Use Only 79
Appendix B.1: Medical Society Guidelines Identified as Relevant to the Medicare Imaging Demonstration Procedures and Updates and Changes to Guideline Listing during Demonstration Period
Exhibit B.1.1: CT Abdomen / CT Pelvis
Guideline List January 2011 for Use at Initial Implementation
Osteoporosis and Bone Mineral Density (quantitative
CT) (2010) No Change No Change No Change
Primary Bone Tumors (area of interest*) (2009)
No Change No Change No Change
Medicare Imaging Demonstration Report on Pre-Implementation and Implementation Experience
Final Report CMS Internal Use Only 90
Guideline List January 2011 for Use at Initial Implementation
Guideline List January 2012 Update
Guideline List July - August 2012 Update
Guideline List March 2013
Update
Stress/Insufficiency Fracture, Including Sacrum, Excluding
Other Vertebrae (area of interest*) (2008)
Stress (Fatigue/Insufficiency)
Fracture, Including Sacrum, Excluding other Vertebrae (area of interest*) (2011)
Stress (Fatigue/Insufficiency) Fracture, Including Sacrum,
Excluding other Vertebrae (area of interest*) (2011) (contrast procedure updates 2012)
No Change
Suspected Spine Trauma (2009)
No Change Suspected Spine Trauma (Revised
2012) No Change
North American Spine Society
Diagnosis and Treatment of Degenerative Lumbar Spinal
Stenosis (2007)
Diagnosis and Treatment of Degenerative Lumbar Spinal Stenosis (2011)
No Change No Change
Diagnosis and Treatment of Degenerative Lumbar
Spondylolisthesis (2008) No Change No Change No Change
*ACR for certain guidelines provides appropriateness criteria referring to “Areas of Interest”, as opposed to specifying the
anatomical region.
Exhibit B.1.9: MRI Knee
Guideline List January 2011 for Use at Initial Implementation
Guideline List January 2012 Update
Guideline List July - August 2012
Update Guideline List
March 2013 Update
American College of Radiology
Acute Trauma to the Knee (2008)
Acute Trauma to the Knee (2011)
Acute Trauma to the Knee (2011) (contrast
procedure updates 2012) No Change
Imaging After Total Knee Arthroplasty (2006)
Imaging After Total Knee Arthroplasty
(2011) No Change No Change
Nontraumatic Knee Pain (2008)
No Change No Change Nontraumatic Knee Pain
(Revised 2012)
Primary Bone Tumors (area of interest*)
(2009)
No Change No Change No Change
Soft Tissue Masses (area of interest*) (2009)
No Change No Change Soft Tissue Masses (area of interest*) (Revised 2012)
*ACR for certain guidelines provides appropriateness criteria referring to “Areas of Interest”, as opposed to specifying the anatomical region.
Exhibit B.1.10: MRI Shoulder
Guideline List January 2011 for Use
at Initial Implementation
Guideline List January 2012 Update
Guideline List July - August 2012
Update Guideline List
March 2013 Update
American College of Radiology
Acute Shoulder Pain (2010)
No Change No Change No Change
Plexopathy (2009) No Change Plexopathy (Revised 2012) No Change
Medicare Imaging Demonstration Report on Pre-Implementation and Implementation Experience
Final Report CMS Internal Use Only 91
Appendix B.2: Medical Society Guidelines Relevant to Medicare Imaging Demonstration Procedures
March 13, 2013
Update (March 2013) based on notification from the American College of Radiology (ACR) regarding update to ACR appropriateness criteria. Update based on notification from the American Academy of Otolaryngology (AAO) of release of guideline on paranasal sinus disease. Update based on notification from the American Academy of Neurology regarding retirement of guideline on migraine headache.
Exhibit B.2.1 lists the medical societies that have been identified as having guidelines relevant to the procedures included in the MID. As demonstrated in the exhibit below, for some procedures, there are overlapping guidelines from more than one society.
Exhibit B.2.1 Medical Societies with Guidelines Relevant to Demonstration Procedures
Procedure Medical Societies with Relevant Guidelines
CT Abdomen American College of Radiology
CT Pelvis American College of Radiology
CT Thorax American College of Radiology
American Academy of Family Physicians / American College of Physicians
SPECT-MPI American College of Cardiology
American College of Radiology
MRI Brain
American Academy of Neurology
American College of Radiology
United States Headache Consortium
American Academy of Otolaryngology
CT Brain
American Academy of Neurology
American College of Radiology
United States Headache Consortium
American Academy of Otolaryngology
CT Sinus American Academy of Otolaryngology
American College of Radiology
MRI Lumbar Spine
American Academy of Neurology
American College of Physicians/American Pain Society
American College of Radiology
North American Spine Society
CT Lumbar Spine
American Academy of Neurology
American College of Physicians/American Pain Society
American College of Radiology
North American Spine Society
MRI Knee American College of Radiology
MRI Shoulder American College of Radiology
Medicare Imaging Demonstration Report on Pre-Implementation and Implementation Experience
Final Report CMS Internal Use Only 92
Medical Specialty Society Imaging Guidelines
Exhibit B.2.2 provides the final listing of the guidelines identified as relevant to the procedure test families included in the demonstration.
Exhibit B.2.2 Guidelines Listing by Procedure27
CT Abdomen
(Guidelines with * include combined CT Abdomen and Pelvis procedures)
American College of Radiology:
� Acute (Nonlocalized) Abdominal Pain and Fever or Suspected Abdominal Abscess ( Revised 2012)*
� Acute Onset Flank Pain—Suspicion of Stone Disease (2011)* (contrast procedure updates 2011)
� Radiologic Management of Lower Gastrointestinal Bleeding (2011 Renamed and Revised)
� Radiologic Management of Upper Gastrointestinal Bleeding (2010 Renamed in 2011)
� Recurrent Lower Urinary Tract Infections in Women (2011)* (contrast procedure updates 2012)
� Renal Cell Carcinoma Staging (2011 Revised)
� Renal Failure (2008)
27 In general, the guidelines were originally identified based on those diagnoses having a volume of ≥1 percent. However where a guideline is applicable to more than one procedures, the guideline has been included even if diagnoses under that procedure were <1 percent, unless volume was minimal. Some guidelines have been included based on identification by medical specialty societies.
Medicare Imaging Demonstration Report on Pre-Implementation and Implementation Experience
Final Report CMS Internal Use Only 93
� Renal Transplant Dysfunction (New 2012)*
� Renal Trauma (Revised 2012)*
� Resectable Rectal Cancer (Revised 2012)* No longer includes MID procedures
� Pre-Irradiation Evaluation and Management of Brain Metastases (2011 Revised)
� Primary Bone Tumors (area of interest)31
(2009)
� Renal Cell Carcinoma Staging (2011 Revised)
� Seizures and Epilepsy (2011) (contrast procedure updates 2012)
� Sinonasal Disease (Revised 2012)
� Stage I Breast Carcinoma (2011 Revised)
� Vertigo and Hearing Loss (2008)
United States Headache Consortium:
� Evidence-Based Guidelines in the Primary Care Setting: Neuroimaging in Patients with Nonacute Headache (2000) – Notification from AAN that this guideline is expected to be retired by the end of 2013
American Academy of Otolaryngology
� Clinical Practice Guideline: Sudden Hearing Loss (2012)
31 ACR for certain guidelines provides appropriateness criteria referring to “Areas of Interest”, as opposed to specifying the anatomical region.
Medicare Imaging Demonstration Report on Pre-Implementation and Implementation Experience
Final Report CMS Internal Use Only 96
CT Brain
American Academy of Neurology:
� Diagnosis of Dementia (an evidence-based review): Report of the Quality Standards Subcommittee of the American Academy of Neurology (2001)
� Practice Parameter: Evidence-based Guidelines for Migraine Headache (an Evidence-based Review) (2000) guideline retired
� Pre-Irradiation Evaluation and Management of Brain Metastases (2011 Revised)
� Primary Bone Tumors (area of interest)32
(2009)
� Seizures and Epilepsy (2011) (contrast procedure updates 2012)
� Stage I Breast Carcinoma (2011 Revised)
� Vertigo and Hearing Loss (2008)
United States Headache Consortium:
� Evidence-Based Guidelines in the Primary Care Setting: Neuroimaging in Patients with Nonacute Headache (2000) - Notification from AAN that this guideline is expected to be retired by the end of 2013
American Academy of Otolaryngology
� Clinical Practice Guideline: Sudden Hearing Loss (2012)
32 ACR for certain guidelines provides appropriateness criteria referring to “Areas of Interest”, as opposed to specifying the anatomical region.
Medicare Imaging Demonstration Report on Pre-Implementation and Implementation Experience
Final Report CMS Internal Use Only 97
CT Sinus
American Academy of Otolaryngology:
� Clinical Practice Guideline: Adult Sinusitis (2007)
� Clinical Consensus Statement: Appropriate Use of Computed Tomography for Paranasal Sinus Disease (New 2012)
American College of Radiology:
� Headache (CT head, include sinuses) (2009)
� Sinonasal Disease (Revised 2012)
MRI Lumbar Spine
American Academy of Neurology:
� Practice parameters: Magnetic Resonance Imaging in the Evaluation of Low Back Syndrome (Original 1994; Reapproved in 2008)
American College of Physicians /American Pain Society:
� Diagnosis and Treatment of Low Back Pain: A Joint Clinical Practice Guideline for the American College of Physicians and the American Pain Society (2007)
American College of Radiology:
� Ataxia (Revised 2012)
� Dementia and Movement Disorders (2010) (contrast procedure updates 2012)
� Low Back Pain (2011 Revised) (contrast procedure updates 2012)
� Stress (Fatigue/Insufficiency) Fracture, Including Sacrum, Excluding other Vertebrae (area of interest)33
(2011) (contrast procedure updates 2012)
� Suspected Spine Trauma (Revised 2012)
North American Spine Society:
� Diagnosis and Treatment of Degenerative Lumbar Spinal Stenosis (2011)
� Diagnosis and Treatment of Degenerative Lumbar Spondylolisthesis (2008)
33 ACR for certain guidelines provides appropriateness criteria referring to “Areas of Interest”, as opposed to specifying the anatomical region.
Medicare Imaging Demonstration Report on Pre-Implementation and Implementation Experience
Final Report CMS Internal Use Only 98
CT Lumbar Spine
American Academy of Neurology:
� Practice parameters: Magnetic Resonance Imaging in the Evaluation of Low Back Syndrome (Original 1994; Reapproved in 2008)
American College of Physicians /American Pain Society:
� Diagnosis and Treatment of Low Back Pain: A Joint Clinical Practice Guideline for the American College of Physicians and the American Pain Society (2007)
American College of Radiology:
� Low Back Pain (2011 Revised) (contrast procedure updates 2012)
� Osteoporosis and Bone Mineral Density (quantitative CT)34
(2010)
� Primary Bone Tumors (area of interest)35
(2009)
� Stress (Fatigue/Insufficiency) Fracture, Including Sacrum, Excluding other Vertebrae (area of interest)35
(2011) (contrast procedure updates 2012)
� Suspected Spine Trauma (Revised 2012)
North American Spine Society:
� Diagnosis and Treatment of Degenerative Lumbar Spinal Stenosis (2011)
� Diagnosis and Treatment of Degenerative Lumbar Spondylolisthesis (2008)
MRI Knee
American College of Radiology:
� Acute Trauma to the Knee (2011) (contrast procedure updates 2012)
� Imaging After Total Knee Arthroplasty (2011)
� Nontraumatic Knee Pain (Revised 2012)
� Primary Bone Tumors (area of interest)35
(2009)
� Soft Tissue Masses (area of interest)35
(Revised 2012)
MRI Shoulder
American College of Radiology:
� Acute Shoulder Pain (2010)
� Plexopathy (Revised 2012)
34 ACR’s guideline for Osteoporosis had recommendations specific to Quantitative CT, in which normal CT equipment is used in addition to computer software.
35 ACR for certain guidelines provides appropriateness criteria referring to “Areas of Interest”, as opposed to specifying the anatomical region
Medicare Imaging Demonstration Report on Pre-Implementation and Implementation Experience
Final Report CMS Internal Use Only 99
Appendix C: Completeness of Reporting Trend since Demonstration Inception
By Month (Oct 2011 - Sep 2013) Rendered Medicare Image Claims and Percent Claims Matched to DSS
Medicare Imaging Demonstration Report on Pre-Implementation and Implementation Experience
Final Report CMS Internal Use Only 100
Medicare Imaging Demonstration Report on Pre-Implementation and Implementation Experience
Final Report CMS Internal Use Only 101
Medicare Imaging Demonstration Report on Pre-Implementation and Implementation Experience
Final Report CMS Internal Use Only 102
Appendix D: Medicare Imaging Demonstration—Convener Data Collection Requirements and CSV File Specification Revised March 20, 2013, Version 1.8
Convener Requirements
Conveners must arrange for the availability of a DSS for their panel of physician practices participating in the demonstration. CMS will collect only data relevant to the 11 targeted advanced imaging procedures and guidelines identified for use in the demonstration. All guidelines must be transparent to the participating physician practices. The convener must recruit physician practices and make the DSS available to physician practices participating in the demonstration. For the duration of the demonstration period, the convener must ensure the DSS for advanced diagnostic imaging services is in agreement with the most current medical specialty society guidelines available. A list of the medical specialty guidelines for the 11 targeted procedures is available in the Documents and Resources section of the MID convener website (https://mid.lewin.com).
The demonstration employs a pre-post research design. During the first six months of the demonstration, CMS will collect baseline data on the appropriateness of orders for advanced diagnostic imaging services. For this period, the DSS will not include presentation to the physician practice of the assessment links in order to capture the individual physician’s ordering methods. However, the DSS will collect on the back end the assessment data. After the initial testing and baseline data collection period, the remaining 18 months of the demonstration will be considered the intervention period during which assessment of appropriateness of image orders will be presented to physician practices at the time the order is entered into the DSS.
During both the baseline and intervention period the DSS must capture and report all data included in the CSV specification. Conveners must adhere to the following requirements regarding the DSS structure and data capture for the 11 targeted advanced imaging procedures selected for study under this demonstration:
� The DSS must include decision support ordering for the 11 targeted procedures selected for study under this demonstration;
� The DSS must evaluate these procedures using the medical specialty society guidelines identified by CMS in the final terms and conditions (a list of updated guidelines is available in the Documents and Resources section of the MID convener website (https://mid.lewin.com/index.php);
� Except for the (pre-intervention) baseline data collection period, systems must be transparent and show the source of the medical specialty society guidelines that underlies the DSS algorithm logic;
� Except for the (pre-intervention) baseline period, the DSS must provide an assessment that conveys to the physician practice whether its orders for advanced diagnostic imaging services are: appropriate, uncertain, or inappropriate; During the baseline
Medicare Imaging Demonstration Report on Pre-Implementation and Implementation Experience
Final Report CMS Internal Use Only 103
period the DSS must still capture data on appropriateness scoring (appropriate, uncertain, or inappropriate) for the CSV file reporting even though the DSS does not present the assessment to the physician practice during the baseline period;
� The DSS must provide decision support feedback on appropriateness (including, if applicable, more appropriate alternative procedures) to ordering physician practices at the time of image order (except during the baseline data collection period);
� If medical specialty society guidelines do not provide guidance regarding a particular clinical scenario (e.g., possible diagnoses, signs/symptoms), the DSS needs to provide physician practices information indicating that appropriateness criteria do not address the clinical scenario; (i.e., not covered by guideline). During the baseline period the DSS must still capture data on image orders not covered by a guideline;
� Test cases will be run to ensure comparability across all conveners’ DSSs and CMS will require system modification if discrepancies are discovered;
� In the event that medical specialty guidelines are updated, the DSS must be able to be modified and the convener must ensure that these modifications transpire;
� The DSS must have the capacity to distinguish between advanced diagnostic imaging services for the 11 targeted procedures and other imaging services;
� The DSS must comply with all applicable federal and state privacy and security requirements for the transfer and storage of such data; and
� The DSS must be consistent with current Medicare policy (e.g., covered services).
NOTE: The use of the terminology “physician” in this document also applies to practitioners who under state law are licensed to order advanced imaging services in the state.
The DSS must capture and provide the following data elements for each of the 11 targeted advanced imaging procedures:
� Physician name36
� Practice TIN
� Physician National Provider Identifier (NPI)
� Practice name and location
36 Note: If the practitioner ordering the procedure is a non-physician (e.g. physician assistant or nurse practitioner) licensed to order advanced imaging services in the state, complete the physician fields with the non-physician ordering practitioner information.
Medicare Imaging Demonstration Report on Pre-Implementation and Implementation Experience
Final Report CMS Internal Use Only 104
� Patient name
� Medicare Patient Health Insurance Claim Number (HICN)37
� Patient demographics (e.g., date of birth, gender)
� Attestation (exempt during baseline period)
Ordering physician - point of order (POO): Attestation that the data to determine appropriateness and DSS recommendations were reviewed by the physician.
Rendering physician – point of service (POS): The rendering physician at the point of service assumes the responsibility for the review of the DSS data and appropriateness assessment either because: (1) the demonstration site is using a POS model, or (2) as a responsible physician proxy for the ordering physician in a POO model, but the ordering physician is unavailable to review or be informed of the DSS data and assessment prior to the rendering of the image. If the rendering provider is doing the review of the DSS feedback, in addition to the physician attesting that the data to determine appropriateness and recommendations were reviewed by the physician, the provider also attests that patient identifying information and image study were confirmed with the patient or patient representative.
� Date of the image order, and system capture of the date of data entry of order
� Diagnosis and/or any relevant signs and/or symptoms (at the time of image order) and International Classification of Diseases Ninth Edition (ICD-9 or ICD-10 if applicable to convener DSS) codes needed to support guideline based algorithms;
� Procedure family name and specification of use of contrast or study type (for SPECT-MPI) of imaging service originally ordered;
� Name and CPT code of imaging procedure ordered and performed (i.e., captures any changes in order after interaction with the DSS), or decision not to order a service;
� Appropriateness determination (appropriate/inappropriate/uncertain/no guideline)38 of original procedure ordered;
37 It is very important that the patient HICN and demographic information be entered into the DSS accurately. These data fields are the primary link of the DSS records to the CMS claim records. Errors in the patient HICN will result in DSS records where Medicare paid for a MID procedure not matching to a corresponding claim. Claims for MID procedures that cannot be matched to a DSS record will be identified in a reconciliation report that Lewin will provide to conveners (see MID Convener Manual Section 10.3). The reconciliation report will be provided for each data submission cycle. Conveners will need to work with participating practices to reconcile unmatched claims as these will impact the calculation of completeness of reporting (COR). Thus, accurate data entry of beneficiary information by participating practices is an essential aspect in meeting COR requirements.
38 The terminology “appropriate”, “inappropriate”, “uncertain” for the demonstration is based on language from Section 135b of the Medicare Improvements for
Patients and Providers Act of 2008 (MIPPA). For purposes of the demonstration this language is referring to the appropriateness determination based on medical
Medicare Imaging Demonstration Report on Pre-Implementation and Implementation Experience
Final Report CMS Internal Use Only 105
� Appropriateness determination (appropriate/inappropriate/uncertain/no guideline)39 of final procedure ordered (if it is a demonstration procedure); and
� Indications of record status e.g., open record versus complete record.
Conveners will be required every three (3) months to submit via a Secure File Transfer Protocol site the data in a format to be specified by CMS. A database on imaging orders at both the physician NPI level and the practice level will be constructed for reporting. Conveners should be prepared to address issues related to the performance standard of the completeness of reporting identified by CMS.
CSV Data File Specification for DSS
A comma-separated values (CSV) file is used for the digital storage of data structured in a table of lists form, where each associated item (member) in a group is in association with others also separated by the commas of its set. Each line in the CSV file corresponds to a row of complete data elements for a single record from the DSS (e.g. the variable in Column A of an Excel worksheet would start at cell A1 which would be ORDERING_PHYSICIAN_LAST_NAME). Within a line, fields are separated by commas, each field belonging to one table column. Since it is a common and simple file format, CSV files are often used for moving tabular data between two different computer programs, for example between a database program and a spreadsheet program. When saving your data file select the file extension .csv from the available options to ensure your data is in the format requested.
Medicare patient data fields – Physician practices completing the DSS record must complete all of the requested Medicare patient data fields. Please note that for this demonstration, CMS is only able to provide retrospective Medicare patient specific data on beneficiaries with visits to the participating physician practices. The beneficiary finder file data can be used by conveners to validate beneficiary HICN data entered by practices into the DSS records. The convener use of the beneficiary finder file information is restricted to use under the demonstration for purposes of assuring accurate data entry into the DSS. (See discussion of “beneficiary finder file” in section 10.3.3 of the MID Convener Manual.)
Conveners will be submitting ALL DSS records from demonstration initiation through the end of the demonstration period. Convener must send records that remain OPEN and COMPLETE records for each data submission cycle 01 – 09. See Convener Manual (section 14) for details on data submission requirements.
specialty guidelines that indicate whether a procedure is “appropriate” or ”inappropriate” given certain clinical situations. The term “uncertain” for the demonstration is where guidelines address a clinical situation but where the guidance indicates an assessment that falls in between “appropriate” and ”inappropriate”. The term “no guideline” refers to clinical situations that are not addressed by a medical specialty guideline in the demonstration.
39 Ibid.
Medicare Imaging Demonstration Report on Pre-Implementation and Implementation Experience
Final Report CMS Internal Use Only 106
An open record (RECORD_STATUS (CB = 1 or 2)) is an image order record from the DSS for which Lewin has not yet provided to the convener the necessary Medicare claims data variables matching a DSS record to a rendered service in a Medicare claim. An open record is an image order record that has not been terminated (variable BZ).
A complete record is all required fields and all relational fields, where applicable, are completed. Convener certifies that the record is complete and indicates the appropriate response for RECORD_STATUS (CB=3 or 4).
Complete record types include either terminated records (CB=3) or completed records for rendered procedures (CB=4).
Terminated records include:
� Order Changed and Not MID Procedure – if the procedure ordered is not a demonstration image (BB or BV = 13);
� Order Cancelled or Order Not Rendered – if image order is cancelled or not rendered in an outpatient setting (AH = Yes; AX = 6 or BS = 4). Also see administrative closure of records below.
� Advanced Demonstration Image is Rendered in an Inpatient setting (BZ = 3) – Image order initiated while patient was being seen in an ambulatory care setting, however, patient subsequently admitted to inpatient setting and the image procedure was delivered in the inpatient setting. The demonstration is focused on ambulatory care settings.
� Order Abandoned/Abort/Premature Exit – if the data entry of the image order is abandoned, aborted or prematurely discontinued by user then the convener completes the DSS record by entering AX = 7 Administrative Action for user non-response and BZ = 8 for administrative closing of record by convener. As part of the quality control review process, conveners and practices will be monitored for excessive use of administrative closures as it may indicate user training issues.
• Abandoned Orders Determined to Be Cancelled - If a convener retrospectively determines that an abandoned/aborted/premature exit of DSS data entry actually resulted in a documented cancelled order (e.g., through a radiology order entry system) the convener should code variable BZ =1 (physician cancelled the order).
� Administrative closure of records – For orders that remain open longer than six months and are not designated as long term (CB not equal 2) and for which a service has not been rendered, conveners are expected to contact practices to determine the status of a record. If upon contact with the practice the convener is provided a reason for TERMINATION (BZ = 1, 2, 3, 4, 5, 6, or 7) convener may enter the value and complete the record (CA, CB). If convener determines that the order should be classified as a long term order, then modify RECORD_STATUS (CB = 2) “Open record long term (> six months from image order date)”. Conveners are expected to work with the practices to determine whether an order is expected to be long term and not program the DSS to auto-populate CB to equal 2 based on the record remaining open more than six months.
Medicare Imaging Demonstration Report on Pre-Implementation and Implementation Experience
Final Report CMS Internal Use Only 107
As part of the process of reconciling claims data to DSS, or as part of the convener’s review of open records, potential duplicative records may be identified. If a convener identifies a record as a duplicate, the convener may close one of the records as a duplicate TERMINATION (BZ=9), and indicate in TERMINATION_REASON_OTHER (CA) the UNIQUE_DSS_RECORD_ID(s) of the matching record. See subsequent discussion on DSS record matching to Medicare claims data.
The remaining reason for administrative closure of DSS records will occur at the close of the demonstration (BZ = 10) which should only be used if other reasons for termination have not been ascertained from the physician practice, and no matching Medicare claim is found by Lewin to permit completing the record as a rendered procedure.
Completed records for rendered procedures:
For rendered procedures a complete record is a DSS record matched to the appropriate Medicare claim indicating that a MID image was ordered and a MID image was rendered. Lewin will provide to conveners selected data variables from Medicare claims data that match to a DSS record. Conveners are expected to add these supplemental data variables into their DSS record. After adding the supplemental data to the DSS record to complete the record, the convener can change RECORD_STATUS to CB = 4 which reflect that the procedure was rendered and the following supplemental data from Lewin has been added to the DSS record:
• DATE_IMAGE_RENDERED, RENDERED_IMAGE_DESC, RENDERED_IMAGE_CPT, MID_MEDICARE_CLAIM_ID, LEWIN_MATCH_TYPE (data variables CI – CM). See page 37 of this document for details and page 41 for the flow chart on the process for appending the Medicare claims rendered procedure details to the open DSS records.
Fields CC – CG are used to identify the DSS record and must be completed. Field CH, MEDICAL_RECORD_ID, is optional.
Fields CI – CM will be provided by Lewin to the convener in Supplemental Data 1 to append to the DSS records.
Time lag for DSS record completion - Conveners are expected to work closely with physician practices and Lewin to complete DSS image order records in a timely manner. Variable CB (RECORD_STATUS) provides for distinguishing between open image order records that are short term (less than six months) and long term (greater than six months) from the date of image order (variable AC).
Multiple Image(s) – If as the result of interacting with the DSS or a radiologist / rendering physician the ordering physician decides to change an existing order to add other imaging procedures covered under the demonstration, a new DSS record should be opened for each additional procedure.
Medicare Imaging Demonstration Report on Pre-Implementation and Implementation Experience
Final Report CMS Internal Use Only 108
Distinguishing between “alternate” image versus “additional” image recommendations – Some guidelines contain information not only on alternate (substitute) procedure(s), but also recommended additional (follow-up) procedure(s). Consequently, conveners are expected to incorporate this distinction in their data capture and reporting. The data reporting fields for DSS presentations (AJ - AW) provide for this distinction. Presentation by DSS of suggested additional (follow-up) procedures is for information purposes only. The data variable PHYSICIAN_DECISION_1 (AX) is only related to the physician decision on DSS presentation of alternate images. Similarly this distinction between alternative and additional image procedures is made for radiologist / rendering physician recommendations (BE - BR). The data variable PHYSICIAN_DECISION_2 (BS) is only related to the physician decision on radiologist / rendering physician alternate image recommendations.
If the physician chooses to accept a DSS or radiologist / rendering physician recommendation for an additional follow-up study and the imaging procedure is a demonstration procedure, a separate DSS record should be created for an order related to that procedure.
Physician Attestation (AI):
The attestation needs to be understood in the context of the purpose of the Medicare Imaging Demonstration. The purpose of the demonstration is to provide CMS an opportunity to work closely with individual conveners and physician practices in testing whether the use of decision support systems at the time of ordering can improve quality of care by diminishing patient exposure to potentially harmful radiation and / or contrast material caused by unnecessary over-utilization of advanced imaging services. In order to operate the demonstration for purposes of answering the key question on the impact of the use of decision support in the ordering of advanced imaging services, during the intervention period (attestation does not apply during baseline) it is necessary to have either: (1) for a POO model the ordering physician who under state law is the authorized and responsible individual for the order to be “exposed” at the time of ordering to the information provided through the decision support system (see proxy and rendering physician discussion below), or (2) for a POS model the rendering physician who under state law is the authorized and responsible physician for the delivery of the advanced imaging service to be “exposed” to the information provided through the decision support system prior to service delivery. The attestation is a legal documentation of this accountability related to the order.
Ordering Physician: The attestation is the ordering physician’s confirmation the physician (or other practitioner permitted under state law to order advanced imaging services) reviewed the data to determine appropriateness and the DSS recommendations as part of the ordering process.
Use of Proxy: CMS recognizes that conveners and their practices may need to integrate decision support into their workflow and radiology ordering in different ways. Conveners working with the practices have the flexibility to use different workflows including the use of “proxy” individuals to handle the data entry process to the DSS at the time of ordering. But data entry is different than being the responsible party for the order. So that if the individual interfacing with the DSS at the time of order is not the physician responsible for
Medicare Imaging Demonstration Report on Pre-Implementation and Implementation Experience
Final Report CMS Internal Use Only 109
the order, then the workflow process during the intervention period needs to include procedures for the ordering physician to be informed of the DSS immediate feedback on the appropriateness of the order, if the assessment is “uncertain” or “inappropriate”.
Inherent in the demonstration design is that the ordering physician receives the DSS feedback at the time of order (i.e., before the procedure is performed), and thus has the opportunity to respond to the feedback if indicated, i.e., situations of DSS assessments that indicate an order is either inappropriate or uncertain. Also, some of the feedback from the DSS may be indicating that there is an alternative procedure that may be more appropriate. Thus key to the demonstration is that the ordering physician who is legally responsible for placing the order receives the DSS feedback at the time of making the order and prior to service delivery. Conveners working with the practices have flexibility in how the physician is informed, if a proxy is handling the DSS data entry process rather than the ordering physician being the DSS user. The ultimate responsibility remains with the ordering physician / practitioner and a workflow process for timely provision of the DSS feedback needs to be developed.
Rendering Physician Attestation (as proxy for ordering physician in POO model or if convener is using a POS model): CMS recognizes that under a POO model there may be some exceptional scheduling and workflow circumstances in which the proxy is unable to contact an ordering physician (e.g., physician is in surgery) to provide the DSS feedback. In such exceptional situations where the ordering physician is not available, and because of workflow scheduling the patient is ready for the imaging service to be rendered, an attestation by the rendering physician at point of service can be used in these limited situations. In other words, if the authorizing ordering physician cannot attest, then the feedback from the DSS should be brought to the attention of the radiologist / rendering physician. CMS wants to assure a chain of accountability. If the ordering physician cannot authorize the attestation, then there still needs to be accountability and this could be handled by the radiologist / rendering physician deciding whether or not to proceed after reviewing the patient information and DSS appropriateness assessment. The CSV provides an open field (AZ) for text entry related to the physician decision in response to DSS feedback (AY - Physician_Decision_Reason_1). The open text field can be used to capture information and document these exceptions to the normal attestation process for a POO model. The attestation is confirming that the feedback from the DSS process has taken place and that there is a physician who is legally responsible for ordering or rendering having reviewed that feedback in the context of the procedure being ordered.
If a convener is using a POS model instead of a POO model, then a rendering physician attestation would be routinely used for the attestation.
Conveners should document their practice(s) workflow processes in training plans and in their operational protocols.
Urgent Attestation Cases - The CMS demonstration excludes services ordered and rendered in emergency room settings. However it is recognized that urgent patient situations can still arise in physician offices. Because of the urgency of a particular case, there may not be time for the physician to use decision support. The use of decision support is not meant to interfere with the delivery of services to
Medicare Imaging Demonstration Report on Pre-Implementation and Implementation Experience
Final Report CMS Internal Use Only 110
patients who need immediate care. The ATTESTATION variable in the DSS provides for indicating that due to the urgent nature of a patient’s condition that the DSS data and recommendation was reviewed post ordering and rendering of the imaging procedure. Physician practices should try to complete the DSS record for “urgent” cases as soon as possible. It is not expected that the use of “Urgent” attestation will occur often, and the use of this variable will be monitored.
Optional Convener Flag – Variable BA is an optional flag (value = 1) if the conveners’ data entry system requires a new record to be initiated when there is ANY change to an image order, including change in use of contrast, where the change results in the cancellation of the original image order and the creation of a new DSS record as acceptance of the alternate image order. This flag will serve to assist in identifying related records when a change to the original order or an alternate order results from DSS feedback. Lewin expects the convener to make every attempt to consolidate the related DSS records into one complete DSS record that begins with the original image order and is complete with the final image order, eliminating overlapping data fields from the initiation of a second DSS record to capture the change or alternate image order.
Retrospective data entry of variables related to the final image ordered (variable BV -
IMAGE_ORDER_SELECTED_FAMILY_2, variable BW -IMAGE_ORDER_SELECTED_DETAIL_2, and variable BX –
FINAL_CPT_ORDERED) - If in a POO model the ordering physician defers determination of use of contrast to the radiologist / rendering provider, the data entry for the final image ordered (BV, BW, and BX) and subsequent related final DSS assessment (variable BY – IMAGE_ORDER_DETERMINATION_2) can occur through retrospective data entry.
Practice name and location – the following variables can be auto populated based on the single practice site for the ordering physician: PRACTICE_NAME, PRACTICE_ADDRESS1, PRACTICE_ADDRESS2, PRACTICE_CITY, PRACTICE_STATE, PRACTICE_ZIP, PRACTICE_MAIN_PHONE, PRACTICE_MAIN_FAX, and PRACTICE_SITE_ID.
See flow charts of process on pages 40-41.
Medicare Imaging Demonstration Report on Pre-Implementation and Implementation Experience
Final Report CMS Internal Use Only 111
Table 1: CSV Data File Specification for DSS
Column Field Name Required
Field Exempt During
Baseline System
Generated Format Type Notes about the Field
A ORDERING_PHYSICIAN_LAST_NAME Yes
Optional search
function / or system
generated based on sign-
in process
Text open length Last name of physician ordering image
B ORDERING_PHYSICIAN_FIRST_NAME Yes Text open length First name of physician ordering image
C ORDERING_PHYSCIAN_NPI Yes Text length 10
NPI of physician ordering image. Text to preserve leading zeros. Note: The NPI that is included in the CSV for the DSS record is the NPI of the practitioner that is legally accountable for the order in caring for the patient.
D PRACTICE_TIN Yes Text length 9 TIN for the practice where the image order was “written”. Text to preserve leading zeros.
E PRACTICE_NAME Yes Text open length Legal name of the practice where the image order was “written”.
F PRACTICE_ADDRESS1 Yes Text open length Address line 1 for the practice where order was “written”.
G PRACTICE_ADDRESS2 No Text open length Address line 2 for the practice where order was “written”.
H PRACTICE_CITY Yes Text open length City of the practice where order was “written”.
I PRACTICE_STATE Yes Text length 2 Two letter state abbreviation for the practice
J PRACTICE_ZIP Yes Text zip +4 Zip 5 or Zip +4. Text to preserve leading zero.
K PRACTICE_MAIN_PHONE Yes Number length 10 1234567890 Numeric phone number with area code
L PRACTICE_MAIN_FAX No Number length 10 1234567890 Numeric FAX number with area code
M PATIENT_NAME_FIRST Yes No Text open length Patient’s given name
N PATIENT_NAME_LAST Yes No Text open length Patient’s surname
O PATIENT_HICN Yes No Text max length 20
Medicare Patient Health Insurance Claim Number Maximum length text 20, no dashes, no special characters. Typical length is 9 digits and 1 or 2 trailing alpha characters. However for Rail Road Beneficiaries (RRB) issued numbers contain an over punch in the first position that may appear as a plus zero or A-G.
P PATIENT_DOB Yes Optional calendar function
Mmddyyyy Patient date of birth
Medicare Imaging Demonstration Report on Pre-Implementation and Implementation Experience
Final Report CMS Internal Use Only 112
Column Field Name Required
Field Exempt During
Baseline System
Generated Format Type Notes about the Field
Q PATIENT_GENDER Yes Optional search
function Text length 1
M = Male F= Female
R PATIENT_PRIMARY_DIAGNOSIS Yes
Optional search
function
Text length 5
International Classification of Diseases 9th
Ed (ICD-9). This is the patient’s diagnosis at the time of image order. Text to preserve leading and trailing zeros. Decimal not required, character count will start left to right starting with leading zeros. Format applies to principle diagnosis and up to 10 diagnoses (S – AB).
S PATIENT_DIAG1 No Text length 5 International Classification of Diseases 9th
Ed (ICD-9)
T PATIENT_DIAG2 No Text length 5 International Classification of Diseases 9th
Ed (ICD-9)
U PATIENT_DIAG3 No Text length 5 International Classification of Diseases 9th
Ed (ICD-9)
V PATIENT_DIAG4 No Text length 5 International Classification of Diseases 9th
Ed (ICD-9)
W PATIENT_DIAG5 No
Optional search
function
Text length 5 International Classification of Diseases 9th
Ed (ICD-9)
X PATIENT_DIAG6 No Text length 5 International Classification of Diseases 9th
Ed (ICD-9)
Y PATIENT_DIAG7 No Text length 5 International Classification of Diseases 9th
Ed (ICD-9)
Z PATIENT_DIAG8 No Text length 5 International Classification of Diseases 9th
Ed (ICD-9)
AA PATIENT_DIAG9 No Text length 5 International Classification of Diseases 9th
Ed (ICD-9)
AB PATIENT_DIAG10 No Text length 5 International Classification of Diseases 9th
Ed (ICD-9)
AC DATE_OF_IMAGE_ORDER Yes Optional calendar function
Mmddyyyy Date the original imaging order was prescribed
Demonstration image procedure family name standardized presentation for user
1 = CT Brain 2 = MRI Brain
3 = CT Sinus 4 = CT Thorax
5 = CT Abdomen 6 = CT Pelvis
7 = CT Abdomen & Pelvis 8 = CT Lumbar Spine
9 = MRI Lumbar Spine 10 = MRI Shoulder
11 = MRI Knee 12 = SPECT-MPI
Medicare Imaging Demonstration Report on Pre-Implementation and Implementation Experience
Final Report CMS Internal Use Only 113
Column Field Name Required
Field Exempt During
Baseline System
Generated Format Type Notes about the Field
AF ORIGINAL_IMAGE_ORDER_DETAIL Yes Optional search
function Number length 1
1 = With Contrast 2 = Without Contrast
3 = With and Without Contrast
4 = SPECT MPI single study (CPT 78451)
5 = SPECT MPI multiple studies (CPT 78452)
6 = Contrast Not Specified
7 = SPECTMPI study type not specified
NOTE: For fields AG & AJ – AX, the DSS must capture the data contained in these fields during the CMS Baseline timeframe but the fields are not presented in the user interface to the physician practices.
AG ORIGINAL_ORDER_DETERMINATION Yes Yes Number length 1
1 = appropriate 2 = inappropriate 3 = uncertain 4 =not covered by guideline related to this demonstration
5 = No determination, contrast not specified
Note: AG=5 is no longer a field code choice based on ACR guidance to default to highest score when contrast not specified.
AH IMAGE_ORDER_CANCELLED Yes Yes No Text Yes/No YES, after review of original order determination is to cancel the order. NO, if decision is to continue with an image order.
Note: If AH = Yes, proceed to BZ and CB (Terminate and Record Status). The convener could program this to be automated based on AH = Yes.
Medicare Imaging Demonstration Report on Pre-Implementation and Implementation Experience
Final Report CMS Internal Use Only 114
Column Field Name Required
Field Exempt During
Baseline System
Generated Format Type Notes about the Field
AI ATTESTATION Yes Yes No Number length 1
1 = Ordering physician attests that the data to assess appropriateness of the image study and DSS assessment were reviewed by the physician.
2 = Urgent case = Ordering physician attests that the data to assess appropriateness of the image study and DSS assessment were reviewed by the physician POST rendering of service because of the urgent nature of the patient’s condition.
NOTE: Use of value = 3 in this attestation applies only if the rendering physician at the point of service assumes the responsibility for the review of the DSS data and assessment either because the demonstration site is using a POS model or because the ordering physician is unavailable to review the DSS data and assessment prior to the rendering of the image.
3 = Rendering physician attests that the data to assess appropriateness of the image study and DSS assessment were reviewed by the physician. Rendering physician also attests that patient identifying information and image study were confirmed with the patient or patient representative.
The DSS should have a hard stop and issue an error if this field is not complete.
Medicare Imaging Demonstration Report on Pre-Implementation and Implementation Experience
Final Report CMS Internal Use Only 115
Column Field Name Required
Field Exempt During
Baseline System
Generated Format Type Notes about the Field
AJ DSS_IMAGE_ORDER_ALT Yes Yes Number length 1
If AF = 6 or 7 (contrast or SPECT-MPI study type not specified) and there is no change to image family ordered in AE then
1 = DSS presents feedback on appropriate use of contrast (or) type of SPECT MPI study (AX will be 1 or
2)
2 = Study scores as appropriate and no feedback on contrast because provider policy requires that radiologist / rendering physician determines use of contrast (skip to BE)
Otherwise
3 = DSS assesses image order as appropriate AND DSS presents information on alternative procedures: OR DSS assesses image order as inappropriate, uncertain, or not covered by guidelines. (AX will be
3,4,5,6,or 7)
4 = DSS assesses image order as appropriate and DSS does not present alternative procedures Auto populate BB=AE, BC=AF and BD=AG (skip to BE)
Note: When DSS presents both feedback on appropriate use of contrast (or) study type of SPECT MPI, but also presents feedback on an alternative study that is different than the image family order in AE (i.e., presents both within family and alternative modality) then AJ should be coded AJ=3.
AK DSS_ALT_IMAGE_ORDER_DESC1
Yes, if AJ = 1, or 3 (See
Notes about the Field)
Yes Text open length
If alternate image presented enter Procedure name
Yes, if AJ = 1, or 3 and DSS presents alternative image procedures for orders assessed in AG as uncertain or inappropriate
Optional: If DSS presents alternative image procedures for orders assessed as appropriate in AG; or if DSS present alternatives for orders “not covered by guidelines” but presents additional information
Medicare Imaging Demonstration Report on Pre-Implementation and Implementation Experience
Final Report CMS Internal Use Only 116
Column Field Name Required
Field Exempt During
Baseline System
Generated Format Type Notes about the Field
AL DSS_ALT_IMAGE_ORDER_DESC2 Yes, if
applicable Yes Text open length
If multiple alternate images presented, enter Procedure name
AM DSS_ALT_IMAGE_ORDER_DESC3 Yes, if
applicable Yes Text open length
If multiple alternate images presented, enter Procedure name
AN DSS_ALT_IMAGE_ORDER_CPT1
Yes, if AJ = 1, or 3 (See
Notes about the Field)
Yes Text length 5
If alternate image presented, enter CPT here
Yes, if AJ = 1, or 3 and DSS presents alternative image procedures for orders assessed in AG as uncertain or inappropriate
Optional: If DSS presents alternative image procedures for orders assessed as appropriate in AG; or if DSS present alternatives for orders “not covered by guidelines” but presents additional information
AO DSS_ALT_IMAGE_ORDER_CPT2 Yes, if
applicable Yes Text length 5
If multiple alternate images presented, enter CPT here
AP DSS_ALT_IMAGE_ORDER_CPT3 Yes, if
applicable Yes Text length 5
If multiple alternate images presented, enter CPT here
AQ DSS_IMAGE_ORDER_ADD
Optional, if available
Yes Number length 1 1 = Additional image order presented by DSS
AR DSS_ADD_IMAGE_ORDER_DESC1 Yes Text open length If additional image presented enter Procedure name
AS DSS_ADD_IMAGE_ORDER_DESC2 Yes Text open length If multiple additional images presented, enter Procedure name
AT DSS_ADD_IMAGE_ORDER_DESC3 Yes Text open length If multiple additional images presented, enter Procedure name
AU DSS_ADD_IMAGE_ORDER_CPT1 Yes Text length 5 If additional image presented, enter CPT here
AV DSS_ADD_IMAGE_ORDER_CPT2 Yes Text length 5 If multiple additional images presented, enter CPT here
AW DSS_ADD_IMAGE_ORDER_CPT3 Yes Text length 5 If multiple additional images presented, enter CPT here
Medicare Imaging Demonstration Report on Pre-Implementation and Implementation Experience
Final Report CMS Internal Use Only 117
NOTE: For fields AX – BD, for the CMS Baseline, these fields are exempt.
Column Field Name Required
Field Exempt During
Baseline System
Generated Format Type Notes about the Field
AX PHYSICIAN_DECISION_1
Yes, if AJ = 1 or 3
Yes, exempt for reasons 1 - 6.
Not exempt for reason 7
(administrative action for user
abort)
No / Yes for value = 7
Number length 1
If AJ = 1 (feedback on contrast or study type provided, with no change in image family then enter
1 = Physician accepts DSS feedback on use of contrast or study type (skip to BB)
2 = Physician rejects DSS feedback and continues to defer use of contrast or study type to radiologist / rendering physician. DSS auto populates BB=AE, BC=AF and BD=AG (skip to BE)
If AJ = 3 (DSS assesses image order as appropriate and alternate procedure presented; OR DSS assesses order as inappropriate, uncertain, or not covered by guidelines ) THEN
3 = No change to physician’s original order because original order was assessed as “appropriate” or “not covered by guidelines”; OR “uncertain” AND no alternate procedure presented. DSS auto populates BB=AE, BC=AF and BD=AG (skip to BE)
Note: At convener’s option for DSS orders assessed as “uncertain” but no alternative procedure presented, the convener may choose to have practitioner answer AY and AZ. If the convener selects this option, then AX should still be AX=3, but the skip to BE would not apply.
(Continued on next page)….
4 = No change to physician’s original order because physician rejects DSS feedback on: “inappropriate”; OR uncertain with alternate procedure presented, then answer AY and AZ and DSS auto populates BB=AE, BC=AF and BD=AG
5 = Physician accepts the DSS feedback on alternative image (skip to BB)
Medicare Imaging Demonstration Report on Pre-Implementation and Implementation Experience
Final Report CMS Internal Use Only 118
Column Field Name Required
Field Exempt During
Baseline System
Generated Format Type Notes about the Field
6 = Physician cancels image order (skip to BZ Termination)
7 = Administrative action for user non-response (skip to BZ Termination)
Note: If AX = 6 proceed to BZ and CB (Terminate and Record Status). The convener could program this to be automated based on AX = 6.
Note: The DSS software can be programmed to auto populate AX with the value 7 if the user abandons/aborts /prematurely exits data entry related to this image order. If convener takes administrative action (AX = 7) for user non response then BZ = 8. During the baseline period PHYSICIAN_DECISION_1 is not visible in the user interface. However, behind the scenes the convener can collect AX=7 for users who stop data entry, i.e., stopping data entry reflect abandoned /aborted /exiting order entry process.
Medicare Imaging Demonstration Report on Pre-Implementation and Implementation Experience
Final Report CMS Internal Use Only 119
Column Field Name Required
Field Exempt During
Baseline System
Generated Format Type Notes about the Field
AY PHYSICIAN_DECISION_REASON_1 Yes, if AX = 4 Yes Optional search
function Number length 1
Reason Options: 1 = Guideline does not apply to patient condition; 2 = Physician does not agree with guideline;
3 = Other evidence base;
4 = Recommendation from radiologist / rendering physician (peer to peer consultation);
5 = Physician deferring decision to radiologist / rendering physician;
6 = The DSS logic did not adequately address the clinical situation. Please specify in AZ;
7 = Other please specify in AZ
8 = Administrative action for user non-response
AZ PHYSICIAN_DECISION_EXPLANATION
_1 Optional if
AY =1-7 Yes No Text open length
Optional open text field for physician explanation to PHYSICIAN_DECISION_REASON_1
BA OPTIONAL_CONVENER_FLAG Optional Text open length
If your data entry system requires a new record to be initiated when there is any change to an image order (including cancellation of the original order) or acceptance of an alternate image order the convener may create a reference to related DSS records in this field. Define this reference in a data dictionary submitted with the DSS data and document in the Transmission Coversheet 2. This flag will serve to assist in identifying related orders when a change or alternate order results from DSS feedback and the data system (e.g., order entry system) requires new record.
Medicare Imaging Demonstration Report on Pre-Implementation and Implementation Experience
Final Report CMS Internal Use Only 120
Column Field Name Required
Field Exempt During
Baseline System
Generated Format Type Notes about the Field
BB IMAGE_ORDER_SELECTED_FAMILY_
1 Yes Yes
Optional search
function
Number max length 2
Procedure name standardized presentation for user. Note: If AX = 2, 3, or 4 then original order maintained, and BB, BC should be the same as AE, AF.
Demonstration image procedure family name standardized presentation for user
1 = CT Brain 2 = MRI Brain
3 = CT Sinus 4 = CT Thorax
5 = CT Abdomen 6 = CT Pelvis
7 = CT Abdomen & Pelvis 8 = CT Lumbar Spine
9 = MRI Lumbar Spine 10 = MRI Shoulder
11 = MRI Knee 12 = SPECT-MPI
13 = Not an advanced image in the demonstration
BC IMAGE_ORDER_SELECTED_DETAIL_
1
Yes, If
BB =1-12 Yes
Optional search
function Number length 1
1 = With Contrast 2 = Without Contrast
3 = With and Without Contrast
4 = SPECT MPI single study
5 = SPECT MPI multiple studies
6 = Contrast Not Specified; defer to rendering provider
7 = SPECT MPI study type not specified; defer to rendering provider
Note: if BB = 13 proceed to BZ and CB (Terminate and Record Status). The convener could program this to be automated based on BB = 13.
BD IMAGE_ORDER_DETERMINATION_1 Yes Yes Yes Number length 1
1 = appropriate 2 = inappropriate 3 = uncertain 4 = not covered by guideline related to this demonstration Note: If BB, BC is a new image order then BD is required. However, if original order is maintained (AE, AF) then BD = AG. BD may equal to 5 if AG was equal to 5 and original order (AE, AF) was maintained and AG is copied here. Note: AG=5 is no longer a field code choice based on ACR guidance to default to highest score when contrast not specified.
NOTE: For fields BE – BU, physician practices may during CMS Baseline and CMS Intervention timeframes interact with radiologist / rendering physicians who may suggest alternate or additional image orders or cancellation of the image order. Consequently, fields BE – BU must be available for data entry by physician practices during both CMS Baseline and CMS Intervention timeframes.
Medicare Imaging Demonstration Report on Pre-Implementation and Implementation Experience
Final Report CMS Internal Use Only 121
Column Field Name Required
Field Exempt During
Baseline System
Generated Format Type Notes about the Field
Column Field Name Required
Field Exempt During
Baseline System
Generated Format Type Notes about the Field
BE RAD_IMAGE_ORDER_ALT
Yes, if AJ = 2
Otherwise Yes, if
applicable
No Number length 1
1 = No change to study family, radiologist / rendering physician determines or modifies use of contrast or for SPECT MPI radiologist / rendering physician determines type of study
2 = Alternate image order recommended by radiologist / rendering physician. Alternate is an advanced image in the demonstration
3= Radiologist / rendering physician recommends cancellation of image. Skip to BS.
4 = Radiologist / rendering physician recommends timing delay for image order (“wait”). Skip to BS.
5 = Alternate image order recommended by radiologist / rendering physician. Alternate is NOT advanced image in the demonstration. Skip to BS.
6 = No recommendation from radiologist / rendering physician. Skip to BV, BW. BX.
BF RAD_ALT_IMAGE_ORDER_DESC1 Yes, if BE = 1
or 2
Optional search
function Text open length
If alternate image recommended enter Procedure name
BG RAD_ALT_IMAGE_ORDER_DESC2 Yes, if
applicable
Optional search
function Text open length
If multiple alternate images recommended, enter Procedure name
BH RAD_ALT_IMAGE_ORDER_DESC3 Yes, if
applicable
Optional search
function Text open length
If multiple alternate images recommended, enter Procedure name
BI RAD_ALT_IMAGE_ORDER_CPT1 Yes, if BE = 1
or 2
Optional search
function Text length 5 If alternate image recommended, enter CPT here
Medicare Imaging Demonstration Report on Pre-Implementation and Implementation Experience
Final Report CMS Internal Use Only 122
Column Field Name Required
Field Exempt During
Baseline System
Generated Format Type Notes about the Field
BJ RAD_ALT_IMAGE_ORDER_CPT2 Yes, if
applicable
Optional search
function Text length 5
If multiple alternate images recommended, enter CPT here
BK RAD_ALT_IMAGE_ORDER_CPT3 Yes, if
applicable
Optional search
function Text length 5
If multiple alternate images recommended, enter CPT here
BL RAD_IMAGE_ORDER_ADD
Optional, if available
No Number length 1
1 = Additional (follow-up) advanced image order in the demonstration recommended by radiologist / rendering physician, this includes radiologist / rendering physician recommendation for earlier image follow-up
2 = Additional (follow-up) image order NOT in the demonstration recommended by radiologist / rendering physician.
BM RAD_ADD_IMAGE_ORDER_DESC1 Optional search
function Text open length
If additional image recommended enter Procedure name
BN RAD_ADD_IMAGE_ORDER_DESC2
Optional, if available
Optional search
function Text open length
If multiple additional images recommended, enter Procedure name
BO RAD_ADD_IMAGE_ORDER_DESC3 Optional search
function Text open length
If multiple additional images recommended, enter Procedure name
BP RAD_ADD_IMAGE_ORDER_CPT1 Optional search
function Text length 5 If additional image recommended, enter CPT here
BQ RAD_ADD_IMAGE_ORDER_CPT2 Optional search
function Text length 5
If multiple additional images recommended, enter CPT here
BR RAD_ADD_IMAGE_ORDER_CPT3 Optional search
function Text length 5
If multiple additional images recommended, enter CPT here
Medicare Imaging Demonstration Report on Pre-Implementation and Implementation Experience
Final Report CMS Internal Use Only 123
Column Field Name Required
Field Exempt During
Baseline System
Generated Format Type Notes about the Field
BS PHYSICIAN_DECISION_2 Yes, if
BE = 1- 5 No Number length 1
1 = Ordering physician deferred contrast or SPECT MPI study type to radiologist / rendering physician. NOTE: Can be programmed to auto populate if BC = 6 (contrast) or 7 (SPECT MPI)
2 = Ordering physician ACCEPTS the radiologist / rendering physician alternative
3 = Ordering physician REJECTS the radiologist / rendering physician alternate image (BE=2), or cancellation (BE=3), or delay of image (BE=4)
4 = Ordering physician ACCEPTS recommendation to cancel image order
5 = Ordering physician ACCEPTS recommendation to delay image order
BT PHYSICIAN_DECISION_REASON_2 Optional, if
BS = 3
Optional search
function Number length 1
Reason Options: 1 = Ordering physician does not agree with radiologist / rendering physician 2 = Advice does not pertain to patient’s current clinical situation
3 = Other patient considerations 4 = Other evidence base 5 = Other please specify in BU
Note: If BS = 4 proceed to BZ and CB (Terminate and Record Status). The convener could program this to be automated based on BS = 4.
BU PHYSICIAN_DECISION_EXPLANATION
_2 Optional, if BT = 1 – 5
No Text open length Optional open text field for physician explanation to PHYSICIAN_DECISION_REASON_2
Medicare Imaging Demonstration Report on Pre-Implementation and Implementation Experience
If AF = deferral to radiologist / rendering physician is 6 (contrast) or 7 (SPECT MPI study type) AND BE = 1 (no change in family radiologist / rendering physician determination) then BV = AE.
Demonstration image procedure family name standardized presentation for user
1 = CT Brain 2 = MRI Brain
3 = CT Sinus 4 = CT Thorax
5 = CT Abdomen 6 = CT Pelvis
7 = CT Abdomen & Pelvis 8 = CT Lumbar Spine
9 = MRI Lumbar Spine 10 = MRI Shoulder
11 = MRI Knee 12 = SPECT-MPI
13 = Not an advanced image in the demonstration
BW IMAGE_ORDER_SELECTED_DETAIL_2 Yes, if
BV = 1-12
Optional search
function Number length 1
1 = With Contrast 2 = Without Contrast
3 = With and Without Contrast
4 = SPECT MPI single study (CPT 74851)
5 = SPECT MPI multiple studies (CPT 74852)
BX FINAL_CPT_ORDERED Yes Yes Text length 5 The CPT represented as the final image procedure ordered. BX could be programmed to auto populated based on the combination of BV + BW.
Note: if BV = 13 proceed to BZ and CB (Terminate and Record Status). The convener could program this to be automated based on BV = 13.
Medicare Imaging Demonstration Report on Pre-Implementation and Implementation Experience
Final Report CMS Internal Use Only 125
Column Field Name Required
Field Exempt During
Baseline System
Generated Format Type Notes about the Field
BY IMAGE_ORDER_DETERMINATION_2 Yes Yes Number length 1
1 = appropriate 2 = inappropriate 3 = uncertain 4 = not covered by guideline related to this demonstration
If the original order and score are maintained, this field could be auto populated.
BZ TERMINATION Yes, if
applicable
Yes, where applicable
Number max length 2
1 = physician cancelled the order
2 = not advanced image in demonstration
3 = demonstration image rendered as inpatient
4 = patient too ill to receive image procedure
5 = patient non-compliance
6 = patient deceased
7 = other reason
8 = administrative closing of record by convener
9 = administrative closing of record by convener – duplicate record, specify in CA
10 = administrative closing of record by convener at the end of demonstration
Notes for this field: If an order is cancelled (AH = “yes” or AX = 6 or BS = 4) then the system can auto populate BZ = 1. If not a demonstration procedure (BB or BV = 13) then system could auto populate BZ = 2. If administrative action of record (AX = 7) the system could auto populate BZ = 8.
Medicare Imaging Demonstration Report on Pre-Implementation and Implementation Experience
Final Report CMS Internal Use Only 126
Column Field Name Required
Field Exempt During
Baseline System
Generated Format Type Notes about the Field
CA TERMINATION_REASON_OTHER Yes, if BZ = 7,
8, 9 Text open length
If TERMINATION (BZ) = 7 or 8 provide description of other reason or reason for administrative closure by convener. If BZ = 9 (duplicate record) enter the matching record UNIQUE_DSS_RECORD_ID
CB RECORD_STATUS Yes No Number length 1
1 = Open Record short term ( < 6 months from DATE_OF_IMAGE_ORDER)
2 = Open Record long term ( > 6 months from DATE_OF_IMAGE_ORDER)
3 = Convener certifies that the record is complete as DSS record terminated in BZ TERMINATION.
4 = Convener certifies that the record is complete as CMS Medicare rendered test match found and supplemental variables provided by Lewin have been added to the DSS record
CC BASELINE_INDICATOR Yes
Yes, enter Baseline
Intervention Beta
Text length 12
If this DSS record occurs during the CMS Baseline timeframe, indicate BASELINE. Otherwise if DSS record occurs during CMS Intervention timeframe, indicate INTERVENTION. If this DSS record is being submitted for beta testing indicates BETA.
CD UNIQUE_DSS_RECORD_ID Yes Yes Text length unspecified
The DSS will generate a unique record identification number (can be numeric or alpha-numeric). Please provide format in the QC Transmission Cover Sheet 2 data dictionary section.
CE CONVENER_ID Yes Yes Text length 5 Lewin issued convener ID – system can auto populate based on the physician NPI at variable C.
CF PRACTICE_ID Yes Yes Text length 4 Lewin issued practice ID – system can auto populate based on the physician NPI at variable C.
CG PRACTICE_SITE_ID Yes Yes Text length 4
Lewin issued practice site ID – system can auto populate based on the physician NPI at variable C. If the physician practices at multiple sites, please provide for site selection. This could be programmed as a drop down selection option.
CH MEDICAL_RECORD_ID Optional Yes Text open length Option for conveners to include a medical record ID associated with this image order.
Medicare Imaging Demonstration Report on Pre-Implementation and Implementation Experience
Final Report CMS Internal Use Only 127
Column Field Name Required
Field Exempt During
Baseline System
Generated Format Type Notes about the Field
CI DATE_IMAGE_RENDERED Add from
Lewin supplement
Mmddyyyy
Date of the actual imaging order was rendered i.e. date of service. This field will be provided by Lewin to the convener in the supplemental data for DSS records matched to Medicare claims.
CJ RENDERED_IMAGE_DESC Add from
Lewin supplement
Text open length Procedure name. This field will be provided by Lewin to the convener in the supplemental data for DSS records matched to Medicare claims.
CK RENDERED_IMAGE_CPT Add from
Lewin supplement
Text length 5
CPT code of the actual service delivered. This field will be provided by Lewin to the convener in the supplemental data for DSS records matched to Medicare claims.
CL MID_MEDICARE_CLAIM_ID Add from
Lewin supplement
Open text length MID Medicare Claim Record ID created by Lewin
CM LEWIN_MATCH_TYPE Add from
Lewin supplement
Number length 1
The following match types are hierarchical.
1 = exact procedure match to Medicare claim 2 = procedure family match to Medicare claim
3 = body part match to Medicare claim (applies to brain/sinus and spine only)
Medicare Imaging Demonstration Report on Pre-Implementation and Implementation Experience
Final Report CMS Internal Use Only 128
File Naming Convention and Submission for DSS data
The convener will apply the following file naming conventions to all files to be submitted for use with the demonstration. MID## identification will be assigned to each convener. The submission cycle will be determined by the time period for the data being submitted and will be Sub01 – Sub09 (except for beta test file which will be Sub00).
� Complete DSS data file for the specified time period (.csv)
• MIDxx_<convener ID>_DSS_Subxx_<version>.csv
� Beta Data DSS data file for the specified time period (.csv)
• MIDxx_<convener ID>_DSS_Sub00_<version>.csv
Conveners will submit DSS data to Lewin in general on a three month cycle basis. In addition to the submission of a beta test file, there are nine submission cycles for the demonstration. The submission process is available in the MID Convener Manual Section 14.6.3.
MIDxx is the MID# (number) issued by Lewin to the convener.
Convener ID is an abbreviated convener name, issued by Lewin to the
convener.
Subxx is equal to the corresponding submission cycle (e.g., 00 through 09).
Use a version control number when resubmitting data in the same cycle in the event of
incomplete or corrected data being resubmitted to Lewin.
The file name should not contain any spaces or special characters, such as ampersands
(&) and hyphens (-).
Medicare Imaging Demonstration Report on Pre-Implementation and Implementation Experience
Final Report CMS Internal Use Only 129
Example Scenarios
Example 1: Adjacent body parts
Two separate DSS records are created for the two images ordered on adjacent body parts.
Example 2: Image order changed (physician accepts changed order)
Physician orders CT Thorax w/ and w/o contrast and the radiologist / rendering physician indicates that w/o contrast is sufficient. Guideline supports use of one or the other rather than combined studies. Enter change under the following variables and complete remainder of record:
BE RAD_ IMAGE_ORDER: Enter 2 - Alternate image order recommended by radiologist / rendering physician
BF, BG, BH RAD_ALT_IMAGE_ORDER_DESC1,2,3: If alternate image(s) recommended enter procedure(s) name
BI, BJ, BK RAD_ALT_IMAGE_ORDER_CPT1,2,3: If alternate image(s) recommended, enter CPT(s)
BS PHYSICIAN_DECISION_2: Enter 2 = Physician ACCEPTS the radiologist / rendering physician alternative
Example 3: Image order changed (two related image orders)
Physician enters two orders for adjacent body parts for Brain and Sinus CT each with its own DSS record. Radiologist / rendering physician indicates that both images are not needed. One of the two orders gets cancelled (e.g., CT Sinus) and the other image order is rendered (CT Brain). For the cancelled order (e.g., CT Sinus) complete:
BE RAD_ IMAGE_ORDER: Enter 3 = Radiologist / rendering physician recommends cancellation of image
BI, BJ, BK RAD_ALT_IMAGE_ORDER_CPT1,2,3: Leave blank
BS PHYSICIAN_DECISION_2: Enter 4= Physician cancels image order
For the image service (e.g., CT Brain) that is rendered complete the existing DSS record.
Medicare Imaging Demonstration Report on Pre-Implementation and Implementation Experience
Final Report CMS Internal Use Only 130
Example 4: Physician does not accept DSS suggestion
Physician orders CT Lumbar Spine without contrast. DSS presents MRI Lumbar Spine without contrast. Physician rejects the DSS suggestion.
AJ DSS_IMAGE_ORDER_ALT: Enter 3 = Alternate image order presented by DSS
AK DSS_ALT_IMAGE_ORDER_DESC1: If alternate image presented enter procedure name
AN DSS_ALT_IMAGE_ORDER_CPT1: If alternate image recommended, enter CPT
AX PHYSICIAN_DECISION_1: Enter 4 = Physician rejects the DSS alternative
AY PHYSICIAN_DECISION_REASON_1: Select from responses 1 = 7
AZ PHYSICIAN_DECISION_EXPLANATION_1: Optional open text field for reason
Example 5: Add-On / Follow-up studies
Physician orders image w/o contrast. After the image is rendered, radiologist / rendering physician indicates that w/contrast is needed. Create new DSS record.
Example 6: Add-On / Follow-up studies
Physician orders CT Thorax. After the image is rendered, radiologist / rendering physician indicates that adjacent body part for abdomen is needed. Create a new DSS record.
Medicare Imaging Demonstration Report on Pre-Implementation and Implementation Experience
Final Report CMS Internal Use Only 131
CMS Medicare Claims data appended to DSS Record
Lewin will provide supplemental data to the convener to be appended to the DSS records database. The supplemental data will be appended to the specific DSS record based on the UNIQUE_DSS_RECORD_ID generated by the individual convener systems and submitted on the DSS data for each submission cycle. The supplemental data provided by Lewin will be the matched Medicare claim variables for the ordered service, including date of service, rendered image and image description, Medicare claim identification number and a match value (See below for Supplemental Data Set 1 Layout – Matched Records).
Upon receipt of the supplemental data variables from the Medicare claims, the convener will append the variables to the DSS record and change the RECORD_STATUS to the appropriate value (CB = 4). The convener may choose to automate the update of RECORD_STATUS with software programming.
DSS open records that do not match to a Medicare claim will remain open in the convener’s DSS records database and an attempt will be made to match them to a Medicare claim in subsequent DSS submission cycles.
In addition to the supplemental data for matched orders to Medicare claims, Lewin will also provide to the convener a supplemental data file that contains detailed variables from the Medicare claims data for MID images rendered for which there is no DSS record. (See below for Supplemental Data Set 2 Layout – No Matched Records). See discussion in Sections 10.3 Completeness of Reporting and Reconciliation and 10.4 Intervention Plan with Physician Practices Not Meeting COR in the MID Convener Manual
regarding addressing discrepancies found between Medicare imaging claims data and DSS records and working with practices to improve compliance with MID reporting requirements.
Naming Convention for Supplemental Data files from Lewin
Supplemental Data Set 1: Match records (MID##_MATCH_ConvenerID_Sub##.csv)
Supplemental Data Set 2: No Match records (MID##_NOMATCH_ConvenerID_Sub##.csv)
DUPLICATE_DSS_RECORD_FLAG – As part of the process of reconciling claims data to DSS, potential duplicative records may be identified. If Lewin identifies potential multiple DSS records related to a single Medicare MID procedure on a claim we will provide an indicator on the Supplemental Data Set 1. Conveners will need to resolve which DSS record is the appropriate match and terminate the duplicate (non-match) record by closing the record(s) as a duplicate in TERMINATION (BZ=9), and indicate in TERMINATION_REASON_OTHER (CA) the UNIQUE_DSS_RECORD_ID(s) that was selected as the matching DSS record for the Medicare claim.
Medicare Imaging Demonstration Report on Pre-Implementation and Implementation Experience
Final Report CMS Internal Use Only 132
Supplemental 1 and Supplemental 2 variable lists are expanded taking into consideration feedback from the Conveners with regard to what variables are useful for matching DSS to Medicare Claims.
Supplemental Data Set 1 Layout – Matched Records (Revised March 20, 2013)
Excel Summary Column
Reference
DSS Column
Reference DSS Field Name Source CMS Medicare Claim Variable Append to DSS Notes about the Field
A CE CONVENER_ID DSS
B CF PRACTICE_ID DSS
C C ORDERING_PHYSCIAN_NPI DSS
NPI of physician ordering image from DSS Record
D O PATIENT_HICN DSS and Claim HIC
Medicare Patient Health Insurance Claim Number
(maximum length character 20, no dashes)
E CD UNIQUE_DSS_RECORD_ID DSS
The DSS will generate a unique record identification number (can be numeric or alpha-numeric)
F AC DATE_OF_IMAGE_ORDER DSS
Medicare Imaging Demonstration Report on Pre-Implementation and Implementation Experience
Final Report CMS Internal Use Only 133
Excel Summary Column
Reference
DSS Column
Reference DSS Field Name Source CMS Medicare Claim Variable Append to DSS Notes about the Field
G CI DATE_IMAGE_RENDERED Claim FROM_DT Add to DSS
Date of the actual imaging order was rendered i.e. date of service (line first expense date)
H CJ RENDERED_IMAGE_DESC Process
Add to DSS Procedure name from available look up file
I CK RENDERED_IMAGE_CPT Claim HCPCSCD Add to DSS CPT code of the actual service delivered
J CL MID_MEDICARE_CLAIM_ID Process
Add to DSS MID Medicare Claim Record ID created by Lewin
K CM LEWIN_MATCH_TYPE Process
Add to DSS
The following match types are hierarchical.
1 = exact procedure match to Medicare claim
2 = procedure family match to Medicare claim
3 = body part match to Medicare claim (applies to brain/sinus and spine only)
Medicare Imaging Demonstration Report on Pre-Implementation and Implementation Experience
Final Report CMS Internal Use Only 134
Excel Summary Column
Reference
DSS Column
Reference DSS Field Name Source CMS Medicare Claim Variable Append to DSS Notes about the Field
L CN REFERRING_PHYSICIAN_NPI Physician Part
B Claim RFR_NPI
Referring Physician NPI Number the physician who referred the beneficiary to the physician who performed the Part B services. This may or may not be the same as the DSS ordering physician NPI.
M CO REFERRING_PHYSICIAN_LAST_NAME NPPES Finder
File
N CP REFERRING_PHYSICIAN_FIRST_NAME NPPES Finder
File
O
ATTENDIND_PHYSICIAN_NPI Outpatient
Claim AT_NPI
Claim Attending Physician NPI Number the physician who has overall responsibility for the beneficiary's care and treatment.
P
ATTENDING_PHYSICIAN_LAST_NAME Outpatient
Claim AT_SRNM
Q
ATTENDING_PHYSICIAN_FIRST_NAME Outpatient
Claim AT_GVNNM
R
RENDERING_TIN Physician Part
B Claim TAX_NUM
S
RENDERING_ORG_NPI Outpatient
Claim ORGNPINM
Organization NPI Number the institutional provider certified by Medicare to provide services to the beneficiary
T
RENDERING_PROVIDER_NUM Outpatient
Claim PROVIDER
The identification number of the institutional provider certified by Medicare to provide services to the beneficiary
U
RENDERING_PROVIDER_NPI Physician Part
B Claim PRFNPI
Performing NPI Number of the performing provider
Medicare Imaging Demonstration Report on Pre-Implementation and Implementation Experience
Final Report CMS Internal Use Only 135
Excel Summary Column
Reference
DSS Column
Reference DSS Field Name Source CMS Medicare Claim Variable Append to DSS Notes about the Field
V
DUPLICATE_DSS_RECORD_FLAG Process A Medicare claim was found to be associated with multiple DSS records.
W
PREVIOUSLY_MATCHED Process
MID_MEDICARE_CLAIM_ID from DSS with Record
Status = 4
From DSS data, UNIQUE_DSS_RECORD_ID was matched in a previous submission. The MID_MEDICARE_CLAIM_ID from the previous match is provided.
Medicare Imaging Demonstration Report on Pre-Implementation and Implementation Experience
Final Report CMS Internal Use Only 136
Supplemental Data Set 2 Layout – No Match Records (Revised March 20, 2013)
Excel Summary Column
Reference DSS Field Name Source CMS Medicare Claim Variable
Append to DSS Notes about the Field
A CONVENER_ID Claim
B PRACTICE_ID Claim
C PATIENT_HICN Claim HIC
Medicare Patient Health Insurance Claim Number
(maximum length character 20, no dashes)
D DATE_IMAGE_RENDERED Claim FROM_DT Add to DSS Date of the actual imaging order was rendered i.e. date of service (line first expense date)
E RENDERED_IMAGE_DESC Process
Add to DSS Procedure name from available look up file
F RENDERED_IMAGE_CPT Claim HCPCSCD Add to DSS CPT code of the actual service delivered
G MID_MEDICARE_CLAIM_ID Process
Add to DSS MID Medicare Claim Record ID created by Lewin
H REFERRING_PHYSICIAN_NPI Physician
Part B Claim
RFR_NPI
Referring Physician NPI Number the physician who referred the beneficiary to the physician who performed the Part B services. This may or may not be the same as the DSS ordering physician NPI.
I REFERRING_PHYSICIAN_LAST_NAME NPPES
Finder File
J REFERRING_PHYSICIAN_FIRST_NAME NPPES
Finder File
K ATTENDIND_PHYSICIAN_NPI Outpatient
Claim AT_NPI
Claim Attending Physician NPI Number the physician who has overall responsibility for the beneficiary's care and treatment.
L ATTENDING_PHYSICIAN_LAST_NAME Outpatient
Claim AT_SRNM
M ATTENDING_PHYSICIAN_FIRST_NAM
E Outpatient
Claim AT_GVNNM
N RENDERING_TIN Physician
Part B Claim
TAX_NUM
O RENDERING_ORG_NPI Outpatient
Claim ORGNPINM
Organization NPI Number the institutional provider certified by Medicare to provide services to the beneficiary
Medicare Imaging Demonstration Report on Pre-Implementation and Implementation Experience
Final Report CMS Internal Use Only 137
Excel Summary Column
Reference DSS Field Name Source CMS Medicare Claim Variable
Append to DSS Notes about the Field
P RENDERING_PROVIDER_NUM Outpatient
Claim PROVIDER
The identification number of the institutional provider certified by Medicare to provide services to the beneficiary
Q RENDERING_PROVIDER_NPI Physician
Part B Claim
PRFNPI Performing NPI Number of the performing provider
R PATIENT_LAST_NAME Physician
Part B Claim
PATIENT_SURNAME
S PATIENT_FIRST_NAME Physician
Part B Claim
PATIENT_FIRST_INITIAL
T PATIENT_DATE_OF_BIRTH Physician
Part B Claim
BENE_DOB
Medicare Imaging Demonstration Report on Pre-Implementation and Implementation Experience
Final Report CMS Internal Use Only 138
CMS Imaging Demonstration: Data Flow Chart
PROCESS
ALTERNATE
DECISION
MANUAL ENTRY
TERMINATION
CONNECTOR
FLOW CHART KEY
Note: The open record symbol in the flow chart are illustrative of points in the image order process where records remain open but may ultimately need administrative intervention by the
convener to contact the practice to close the record or for the convener to administratively close the record. Reference instructions in the CSV Data File Specification , page 8.
Image Order Aborted or Cancelled (AH) Go to
Terminate DSS Record Status
(BZ,CA,CB)
Patient Encounter
Decision to order
demonstration
image
No
Yes
No DSS Record
Data Entry to DSS(A - AF)
Original Image Order Scored
DSS alternate / additional Image order suggested
(AJ - AW)
Image Order selected(BB,BC)
Physician accepts DSS alternate (AX)
Attestation (AI)
New Record
If AX = 4 Physician reason for
rejecting DSS alternate
(AY, AZ)
No
Yes No
Yes
Image is a Advanced Image in
Demonstration
Radiologist alternate / additional image order
suggested (BE - BR)
Physician accepts radiologist
alternate ( BS)
Image is a Advanced Image in
Demonstration
No
Yes
Yes
No
Yes
No
Original order maintained
Image Order selected
(BV, BW, BX)
Yes
No
Original order maintained (AE, AF) or
DSS alternate (BB,BC)
Order RenderedSupplemental Data set
1 from Lewin (CH -CL)
Convener appends
supplemental data
DSS Record Status(complete record)
(CB)
Decision for follow-up study
Yes
No
Image Order Scored (BD)
Image Order Scored (BY)
Physician reason f or rejecting radiologist
alternate
(BT, BU)
additional image(s)
Image Order Aborted or Cancelled (AX) Go to
Terminate DSS Record Status
(BZ,CA,CB)
Image Order Cancelled Go to Terminate DSS
Record Status
(BZ,CA,CB)
AX = 2
AX = 1,5
additional image(s)
additional image
New DSS
open record
open record
open record
BS = 3
BS = 1,2,5
Terminate Record (BZ,CA)
alternate
additional image
New DSS
alternate
AX = 6
Supplemental Data Set 1 f rom Lewin will be appended to the DSS record by the convener. The supplemental data
(A technical protocol is available for programmers but is not included in this report because it contains protected information)
1. CLAIMS DATA – Receive TAP data - all Physician Part B and Outpatient claims where the practice TINs in the demonstration are listed as the rendering organization on the Part B claim and where the Medicare PROVIDER ID related to the practices in the demonstration are used to identify outpatient claims. Using these claims, then include ALL claims for the Medicare beneficiaries who are on the claims for the practice TINs identified. Specifically for one critical access hospital, the Medicare Provider ID on the outpatient claims is used to identify the Medicare beneficiaries associated with this practice.
2. DENOMINATOR / BENEFICIARY FILE – Using the claims data, identify all of the Medicare beneficiaries that had at least one evaluation and management ambulatory visit to the MID practice. If a Medicare beneficiary has had an ambulatory office visit at the practice, then the beneficiary is deemed to be a patient of that practice. A beneficiary can be associated with more than one MID practice. Unique beneficiaries are identified as having an ambulatory E&M visit to the practice appearing on physician Part B claims using the practice TIN (or) as having an ambulatory E&M visit to the practice appearing on outpatient claims using the Medicare Provider ID, regardless of whether an advanced image in the demonstration was rendered for the beneficiary.
3. NUMERATOR / COMPLETENESS OF REPORTING (COR) FILE – Using the Medicare beneficiaries identified in the Denominator/Beneficiary file, extract all of the Part B and Outpatient claims with an advanced imaging procedure in the demonstration. Match together the Part B and the Outpatient claims to avoid duplicate counting of an image in the demonstration, resulting in about 70 percent of Medicare claims with both the Part B and Outpatient (PC and TC) components matched, the remainder 30 percent are Part B only or Outpatient only claims.
Keep all claims where:
a. place of service is office based or outpatient facility, and
b. Medicare is the primary payer, and
c. the referring/attending physician NPI is that of a practitioner that is continuously enrolled in the demonstration (Note: limiting to continuously enrolled practitioners is an attempt to mitigate the selecting of images rendered when the practitioner(s) were working at other non-demo practices either before or after their participation in the demonstration)
Because these are un-adjudicated Medicare claims, the following types of claims are removed:
a. Emergency Department – where any variable on the claim indicates that the procedure could have been rendered as emergency based on outpatient service type, revenue center codes, or place of service
Medicare Imaging Demonstration Report on Pre-Implementation and Implementation Experience
Final Report CMS Internal Use Only 140
b. Inpatient procedures – where any variable on the claims indicates that the procedure could have been rendered on an inpatient basis
c. Observation patients – where any variable on the claims indicates that the procedure was rendered while the patient was under observation using procedure codes or revenue center codes.
d. Any claim where a myelogram is rendered in conjunction with an MRI brain
e. Any claim that is the professional component only, repeat procedure, clinical research or multiple procedure based on modifier codes
4. MID PRACTICE SPECIFIC PROCEDURES – For most of the very large group practices in the demonstration the process is to select only Medicare claims that are rendered at the practice based on the practice TIN and the Medicare Provider ID. With this process, we are assuming a “closed” system where it is very likely that what gets ordered at the practice gets rendered at the practice. This process works for several of the practices participating in the MID. Additionally, some practices are able to tell us with confidence that certain practitioners see patients at practices outside the demonstration, so the process also excludes claims associated with these practitioners, as it is not possible to know if the procedure was ordered within the demonstration practice or elsewhere. Lastly, several practices did not launch their DSS on October 1, 2011; therefore, these practices have different launch dates. All claims with a date of service that is prior to the practice specific launch date are excluded from the demonstration.
5. COR MATCHING – The Medicare imaging claims for MID procedures that remain after the process steps above are then matched to the DSS imaging order data provided by the conveners. A match occurs when the patient identifier, patient date of birth, approximate date of service and the procedure rendered “matches” the procedure ordered in the DSS data. Both patient identifier (HICN) and patient date of birth are truncated (removing the suffix and removing the day of birth) in order to create more matches. Our process found that most often a match did not occur if the patient suffix was different or if the patient actual day of birth was different. A date of service match is where the procedure is rendered on or after the date of DSS procedure order. And a procedure match is either an exact procedure match ordered to rendered, or can be a loose match where the same procedure family was rendered, or the same body part was studied.
6. COR RATE – The claims identified in the Numerator/COR file process above serve as the denominator for calculating the COR rate. The numerator for COR rate are the Medicare advanced imaging claims for rendered procedures that are matched to a DSS order in the COR matching process. The rate is shown as a percentage of matched Medicare claims divided by total Medicare claims for advanced imaging procedures rendered and attributable to the practice.
7. RELATIVE VOLUME - The claims identified in the Numerator/COR file process above serve as the denominator for calculating the relative volume. The numerator is the number of DSS orders for the practice for the same time period. For example, if the Medicare claims count for the denominator is for October 2011 – June 2012, then the DSS count of records would be DSS orders placed October 2011 – June 2012. Relative volume is shown as a percentage of DSS orders placed by the practice divided by total
Medicare Imaging Demonstration Report on Pre-Implementation and Implementation Experience
Final Report CMS Internal Use Only 141
Medicare claims for advanced imaging procedures rendered and attributable to the practice.
8. UTILIZATION RATE – The utilization rate is calculated using the numerator file referenced above, including all Practice specific procedures, without applying the variability in launch dates. The numerator includes all images rendered and found to be associated with a practice in the demonstration beginning with October 1, 2011. The denominator for the practice utilization rate is the denominator/beneficiary file developed in the process above, with each beneficiary being counted only once for the time period of measure, thus a beneficiary can be counted uniquely in more than one time period if the beneficiary experienced an ambulatory office visit with the practice in multiple time periods. The numerator is represented as a rendered advanced imaging procedure event and the denominator is the number of unique beneficiaries in the practice with an ambulatory office visit. The utilization rate is represented as the number of advanced image procedures per 100 beneficiaries for the time period measured. When the data is rolled up to the convener and whole demonstration reporting of utilization rates, a beneficiary can be counted multiple times in one time period because they may be a beneficiary for more than one practice in the demonstration.
9. CHALLENGES - The things that contribute to the problem in matching include:
a. Migration - doctors working at other practices and patients following doctors – there is no variable on the claim to identify where the referring practitioner was at the time of the order. Generally large group practices do not have reliable information as to whether their practitioners also practice elsewhere.
b. Order occurred before the demonstration began and there is no variable on the claim that indicates date of order that would permit excluding the claim. Lag time between ordering and rendering is quite variable (e.g., same day to six or more months post order);
c. Patient was not a Medicare beneficiary at time of order, but is a beneficiary when procedure rendered;
d. Inadequate coding of emergency room as location on imaging claims impacts ability to exclude the imaging services associated with emergency room visits which were not meant to be part of the demonstration;
e. Changes in beneficiary HICNs, particularly suffixes;
f. Identification of the referring physician (e.g., non-MID physicians being listed as the referring physician on the imaging claim when MID participating specialists are also involved in the ordering decision).
Medicare Imaging Demonstration Report on Pre-Implementation and Implementation Experience
Final Report CMS Internal Use Only 142
Appendix F: Alternate Look at Appropriateness Assessment Excluding “Not Covered by Guidelines”
Alternate Exhibit 14A.1: Final Order Appropriateness Assessment by MID Procedure Baseline and First Intervention Period excluding “Not Covered by Guidelines”
‘*This exhibit excludes Convener 5 and one practice.
Appropriate Inappropriate Uncertain Total
60 2 16 78
77% 3% 21% 100%
437 44 61 542
81% 8% 11% 100%
322 46 193 561
57% 8% 34% 100%
26 8 55 89
29% 9% 62% 100%
3 1 3 7
43% 14% 43% 100%
91 2 12 105
87% 2% 11% 100%
1,317 206 275 1,798
73% 11% 15% 100%
777 99 64 940
83% 11% 7% 100%
56 48 3 107
52% 45% 3% 100%
644 49 72 765
84% 6% 9% 100%
98 56 2 156
63% 36% 1% 100%
804 144 112 1,060
76% 14% 11% 100%
226 10 39 275
82% 4% 14% 100%
1085 101 268 1,454
75% 7% 18% 100%
463 21 227 711
65% 3% 32% 100%
97 7 63 167
58% 4% 38% 100%
11 6 5 22
50% 27% 23% 100%
168 2 9 179
94% 1% 5% 100%
2,999 272 470 3,741
80% 7% 13% 100%
1644 96 74 1,814
91% 5% 4% 100%
109 50 2 161
68% 31% 1% 100%
864 60 120 1,044
83% 6% 11% 100%
193 42 3 238
81% 18% 1% 100%
1317 74 111 1,502
88% 5% 7% 100%
MRI Brain
MRI Knee
MRI Lumbar Spine
MRI Shoulder
SPECT-MPI
INTERVENTION 1 - PROCEDURE LEVEL DETERMINATION 2
CT Abdomen
CT Brain
CT Lumbar Spine
CT Pelvis
CT Sinus
CT Thorax
SPECT-MPI
CT Abdomen & Pelvis
MRI Lumbar Spine
MRI Shoulder
MRI Brain
MRI Knee
CT Sinus
CT Thorax
CT Lumbar Spine
CT Pelvis
CT Abdomen & Pelvis
CT Brain
BASELINE - PROCEDURE LEVEL DETERMINATION 2
CT Abdomen
Medicare Imaging Demonstration Report on Pre-Implementation and Implementation Experience
Final Report CMS Internal Use Only 143
Alternate Exhibit 14A.2: Significance of the Change in Percentage of Final Order Appropriateness Assessment from Baseline to First Intervention Period by MID Procedure
excluding “Not Covered by Guidelines”
*This exhibit excludes Convener 5 and one practice.
CT Abdomen 5.3% this change is not significant
CT Abdomen & Pelvis -6.0% this change is significant
CT Brain 7.7% this change is significant
CT Lumbar Spine 28.9% this change is significant
CT Pelvis 7.1% this change is not significant
CT Sinus 7.2% this change is significant
CT Thorax 6.9% this change is significant
MRI Brain 8.0% this change is significant
MRI Knee 15.4% this change is significant
MRI Lumbar Spine -1.4% this change is not significant
MRI Shoulder 18.3% this change is significant
SPECT-MPI 11.8% this change is significant
MID ProcedureAppropriateness scores
Baseline to Intervention 1
Two Proportion Test
Conclusion
Medicare Imaging Demonstration Report on Pre-Implementation and Implementation Experience
Final Report CMS Internal Use Only 144
Alternate Exhibit 14B.1: Final Order Appropriateness Assessment by MID Procedure Baseline and Third Intervention Period excluding “Not Covered by Guidelines”
*This exhibit excludes Convener 5 and one practice.
Appropriate Inappropriate Uncertain Total
60 2 16 78
77% 3% 21% 100%
437 44 61 542
81% 8% 11% 100%
322 46 193 561
57% 8% 34% 100%
26 8 55 89
29% 9% 62% 100%
3 1 3 7
43% 14% 43% 100%
91 2 12 105
87% 2% 11% 100%
1,317 206 275 1,798
73% 11% 15% 100%
777 99 64 940
83% 11% 7% 100%
56 48 3 107
52% 45% 3% 100%
644 49 72 765
84% 6% 9% 100%
98 56 2 156
63% 36% 1% 100%
804 144 112 1,060
76% 14% 11% 100%
176 19 32 227
78% 8% 14% 100%
965 117 330 1,412
68% 8% 23% 100%
442 13 203 658
67% 2% 31% 100%
79 9 51 139
57% 6% 37% 100%
8 1 5 14
57% 7% 36% 100%
175 0 7 182
96% 0% 4% 100%
2,768 246 391 3,405
81% 7% 11% 100%
1494 74 47 1,615
93% 5% 3% 100%
113 33 2 148
76% 22% 1% 100%
825 67 95 987
84% 7% 10% 100%
196 39 0 235
83% 17% 0% 100%
1999 97 176 2,272
88% 4% 8% 100%
SPECT-MPI
SPECT-MPI
MRI Lumbar Spine
MRI Lumbar Spine
MRI Shoulder
MRI Shoulder
MRI Brain
MRI Brain
MRI Knee
MRI Knee
CT Sinus
CT Sinus
CT Thorax
CT Thorax
CT Lumbar Spine
CT Lumbar Spine
CT Pelvis
CT Pelvis
CT Abdomen & Pelvis
CT Abdomen & Pelvis
CT Brain
CT Brain
BASELINE - PROCEDURE LEVEL DETERMINATION 2
INTERVENTION 3 - PROCEDURE LEVEL DETERMINATION 2
CT Abdomen
CT Abdomen
Medicare Imaging Demonstration Report on Pre-Implementation and Implementation Experience
Final Report CMS Internal Use Only 145
Alternate Exhibit 14B.2: Significance of the Change in Percentage of Final Order Appropriateness Assessment from Baseline to Third Intervention Period by MID Procedure
excluding “Not Covered by Guidelines”
*This exhibit excludes Convener 5 and one practice.
CT Abdomen 0.6% this change is not significant
CT Abdomen & Pelvis -12.3% this change is significant
CT Brain 9.8% this change is significant
CT Lumbar Spine 27.6% this change is significant
CT Pelvis 14.3% this change is not significant
CT Sinus 9.5% this change is significant
CT Thorax 8.0% this change is significant
MRI Brain 9.8% this change is significant
MRI Knee 24.0% this change is significant
MRI Lumbar Spine -0.6% this change is not significant
MRI Shoulder 20.6% this change is significant
SPECT-MPI 12.1% this change is significant
MID ProcedureAppropriateness scores
Baseline to Intervention 3
Two Proportion Test
Conclusion
Medicare Imaging Demonstration Report on Pre-Implementation and Implementation Experience
Final Report CMS Internal Use Only 146
Alternate Exhibit 14C.1: Final Order Appropriateness Assessment by MID Procedure First Intervention and Third Intervention Period excluding “Not Covered by Guidelines”
*This exhibit excludes one practice.
Appropriate Inappropriate Uncertain Total
239 13 40 292
82% 4% 14% 100%
1209 113 294 1,616
75% 7% 18% 100%
499 33 261 793
63% 4% 33% 100%
97 7 80 184
53% 4% 43% 100%
11 6 5 22
50% 27% 23% 100%
201 2 15 218
92% 1% 7% 100%
3,257 303 514 4,074
80% 7% 13% 100%
1740 99 82 1,921
91% 5% 4% 100%
157 72 6 235
67% 31% 3% 100%
956 69 137 1,162
82% 6% 12% 100%
254 58 5 317
80% 18% 2% 100%
1380 105 115 1,600
86% 7% 7% 100%
186 21 34 241
77% 9% 14% 100%
1088 135 358 1,581
69% 9% 23% 100%
487 19 233 739
66% 3% 32% 100%
81 11 66 158
51% 7% 42% 100%
8 1 7 16
50% 6% 44% 100%
225 1 10 236
95% 0% 4% 100%
3,056 257 444 3,757
81% 7% 12% 100%
1603 77 51 1,731
93% 4% 3% 100%
168 44 4 216
78% 20% 2% 100%
918 72 110 1,100
83% 7% 10% 100%
225 45 3 273
82% 16% 1% 100%
2059 108 181 2,348
88% 5% 8% 100%SPECT-MPI
MRI Brain
MRI Brain
MRI Knee
MRI Knee
MRI Shoulder
MRI Shoulder
CT Abdomen & Pelvis
CT Abdomen & Pelvis
INTERVENTION 1 - PROCEDURE LEVEL DETERMINATION 2
INTERVENTION 3 - PROCEDURE LEVEL DETERMINATION 2
CT Abdomen
SPECT-MPI
CT Brain
CT Sinus
CT Thorax
CT Lumbar Spine
CT Pelvis
MRI Lumbar Spine
MRI Lumbar Spine
CT Sinus
CT Thorax
CT Lumbar Spine
CT Pelvis
CT Abdomen
CT Brain
Medicare Imaging Demonstration Report on Pre-Implementation and Implementation Experience
Final Report CMS Internal Use Only 147
Alternate Exhibit 14C.2: Significance of the Change in Percentage of Final Order Appropriateness Assessment from First Intervention to Third Intervention Period by MID
Procedure excluding “Not Covered by Guidelines”
*This exhibit excludes one practice.
CT Abdomen -4.7% this change is not significant
CT Abdomen & Pelvis -6.0% this change is significant
CT Brain 3.0% this change is not significant
CT Lumbar Spine -1.5% this change is not significant
CT Pelvis 0.0% this change is not significant
CT Sinus 3.1% this change is not significant
CT Thorax 1.4% this change is not significant
MRI Brain 2.0% this change is significant
MRI Knee 11.0% this change is significant
MRI Lumbar Spine 1.2% this change is not significant
MRI Shoulder 2.3% this change is not significant
SPECT-MPI 1.4% this change is not significant
MID ProcedureTwo Proportion Test
Conclusion
Appropriateness scores
Intervention 1 to Intervention 3
Medicare Imaging Demonstration Report on Pre-Implementation and Implementation Experience
Final Report CMS Internal Use Only 148
Alternate Exhibit 15A.1: Original and Final Order Appropriateness Assessment by MID Procedure for the First Intervention Period Only excluding “Not Covered by Guidelines”
This exhibit excludes one practice.
198 14 36 248
80% 6% 15% 100%
1,130 115 319 1,564
72% 7% 20% 100%
497 34 273 804
62% 4% 34% 100%
93 7 84 184
51% 4% 46% 100%
9 7 7 23
39% 30% 30% 100%
200 3 14 217
92% 1% 6% 100%
3,219 312 528 4,059
79% 8% 13% 100%
1,711 103 88 1,902
90% 5% 5% 100%
154 72 5 231
67% 31% 2% 100%
937 73 144 1,154
81% 6% 12% 100%
251 60 5 316
79% 19% 2% 100%
1,381 111 116 1,608
86% 7% 7% 100%
239 13 40 292
82% 4% 14% 100%
1,209 113 294 1,616
75% 7% 18% 100%
499 33 261 793
63% 4% 33% 100%
97 7 80 184
53% 4% 43% 100%
11 6 5 22
50% 27% 23% 100%
201 2 15 218
92% 1% 7% 100%
3,257 303 514 4,074
80% 7% 13% 100%
1,740 99 82 1,921
91% 5% 4% 100%
157 72 6 235
67% 31% 3% 100%
956 69 137 1,162
82% 6% 12% 100%
254 58 5 317
80% 18% 2% 100%
1,380 105 115 1,600
86% 7% 7% 100%SPECT-MPI
CT Abdomen
CT Abdomen & Pelvis
CT Brain
INTERVENTION 1 - PROCEDURE LEVEL DETERMINATION 1
Inappropriate Uncertain Total
CT Lumbar Spine
MRI Lumbar Spine
MRI Shoulder
CT Thorax
MRI Brain
MRI Knee
MRI Lumbar Spine
CT Pelvis
CT Sinus
MRI Shoulder
SPECT-MPI
INTERVENTION 1 - PROCEDURE LEVEL DETERMINATION 2
CT Abdomen
CT Brain
CT Lumbar Spine
Appropriate
CT Abdomen & Pelvis
CT Pelvis
CT Sinus
CT Thorax
MRI Brain
MRI Knee
Medicare Imaging Demonstration Report on Pre-Implementation and Implementation Experience
Final Report CMS Internal Use Only 149
Alternate Exhibit 15A.2: Significance of the Change in Percentage of the Original and Final Order Appropriateness Assessments by MID Procedure for the First Intervention Period excluding “Not Covered by Guidelines”
This exhibit excludes one practice.
CT Abdomen 2.0% this change is not significant
CT Abdomen & Pelvis 2.6% this change is not significant
CT Brain 1.1% this change is not significant
CT Lumbar Spine 2.2% this change is not significant
CT Pelvis 10.9% this change is not significant
CT Sinus 0.0% this change is not significant
CT Thorax 0.6% this change is not significant
MRI Brain 0.6% this change is not significant
MRI Knee 0.1% this change is not significant
MRI Lumbar Spine 1.1% this change is not significant
MRI Shoulder 0.7% this change is not significant
SPECT-MPI 0.4% this change is not significant
MID ProcedureAppropriateness scores
Intervention 1 DET 1 to DET 2Two Proportion Test Conclusion
Medicare Imaging Demonstration Report on Pre-Implementation and Implementation Experience
Final Report CMS Internal Use Only 150
Alternate Exhibit 15B.1: Original and Final Order Appropriateness Assessment by MID Procedure for the Third Intervention Period Only excluding “Not Covered by Guidelines”
143 23 26 192
74% 12% 14% 100%
897 123 345 1,365
66% 9% 25% 100%
435 15 210 660
66% 2% 32% 100%
75 10 52 137
55% 7% 38% 100%
7 2 4 13
54% 15% 31% 100%
175 0 7 182
96% 0% 4% 100%
2,746 254 387 3,387
81% 7% 11% 100%
1,462 77 57 1,596
92% 5% 4% 100%
110 34 2 146
75% 23% 1% 100%
810 75 97 982
82% 8% 10% 100%
192 40 0 232
83% 17% 0% 100%
2,000 98 176 2,274
88% 4% 8% 100%
176 19 32 227
78% 8% 14% 100%
965 117 330 1,412
68% 8% 23% 100%
442 13 203 658
67% 2% 31% 100%
79 9 51 139
57% 6% 37% 100%
8 1 5 14
57% 7% 36% 100%
175 0 7 182
96% 0% 4% 100%
2,768 246 391 3,405
81% 7% 11% 100%
1,494 74 47 1,615
93% 5% 3% 100%
113 33 2 148
76% 22% 1% 100%
825 67 95 987
84% 7% 10% 100%
196 39 0 235
83% 17% 0% 100%
1,999 97 176 2,272
88% 4% 8% 100%
CT Abdomen
CT Abdomen & Pelvis
CT Brain
CT Lumbar Spine
Total
INTERVENTION 3 - PROCEDURE LEVEL DETERMINATION 1
CT Abdomen
Appropriate Inappropriate Uncertain
CT Abdomen & Pelvis
CT Brain
CT Lumbar Spine
CT Pelvis
CT Sinus
CT Thorax
MRI Brain
MRI Knee
MRI Lumbar Spine
MRI Shoulder
SPECT-MPI
INTERVENTION 3 - PROCEDURE LEVEL DETERMINATION 2
CT Pelvis
CT Sinus
CT Thorax
MRI Brain
MRI Knee
MRI Lumbar Spine
MRI Shoulder
SPECT-MPI
Medicare Imaging Demonstration Report on Pre-Implementation and Implementation Experience
Final Report CMS Internal Use Only 151
This exhibit excludes one practice. Alternate Exhibit 15B.2: Significance of the Change in Percentage of Original and Final Order Appropriateness Assessments by MID Procedure for the Third Intervention Period excluding “Not Covered by Guidelines”
This exhibit excludes one practice.
CT Abdomen 3.1% this change is not significant
CT Abdomen & Pelvis 2.6% this change is not significant
CT Brain 1.3% this change is not significant
CT Lumbar Spine 2.1% this change is not significant
CT Pelvis 3.3% this change is not significant
CT Sinus 0.0% this change is not significant
CT Thorax 0.2% this change is not significant
MRI Brain 0.9% this change is not significant
MRI Knee 1.0% this change is not significant
MRI Lumbar Spine 1.1% this change is not significant
MRI Shoulder 0.6% this change is not significant
SPECT-MPI 0.0% this change is not significant
MID ProcedureAppropriateness scores
Intervention 3 DET 1 to DET 2Two Proportion Test Conclusion