January 2015 Medicare Health Care Quality (MHCQ) Demonstration Evaluation North Carolina Community Care Networks Year 3 Evaluation Report Final Report Prepared for Normandy Brangan Centers for Medicare & Medicaid Services The Center for Medicare and Medicaid Innovation Mail Stop WB-06-05 7500 Security Boulevard Baltimore, MD 21244 Prepared by Michael Trisolini, PhD, MBA John Kautter, PhD Asta Sorensen, MA Joseph Burton, MS Cordon Newhart, MA Jenya Kaganova, PhD Aleksandra Petrovic, BS Meghan Howard, BA RTI International 3040 E. Cornwallis Road Research Triangle Park, NC 27709 RTI Project Number 0209853.030.002.004
Transcript
January 2015
Medicare Health Care Quality (MHCQ) Demonstration Evaluation
North Carolina Community Care Networks
Year 3 Evaluation Report Final Report
Prepared for
Normandy Brangan Centers for Medicare & Medicaid Services
The Center for Medicare and Medicaid Innovation Mail Stop WB-06-05
7500 Security Boulevard Baltimore, MD 21244
Prepared by
Michael Trisolini, PhD, MBA John Kautter, PhD
Asta Sorensen, MA Joseph Burton, MS
Cordon Newhart, MA Jenya Kaganova, PhD
Aleksandra Petrovic, BS Meghan Howard, BA
RTI International 3040 E. Cornwallis Road
Research Triangle Park, NC 27709
RTI Project Number 0209853.030.002.004
[This page intentionally left blank.]
MEDICARE HEALTH CARE QUALITY (MHCQ) DEMONSTRATION EVALUATION: NORTH CAROLINA—COMMUNITY CARE NETWORKS
FINAL YEAR 3 EVALUATION REPORT
By:
Michael Trisolini, PhD, MBA John Kautter, PhD Asta Sorensen, MA Joseph Burton, MS
Cordon Newhart, MA Jenya Kaganova, PhD
Aleksandra Petrovic, BS Meghan Howard, BA
Federal Project Officer: Normandy Brangan
RTI International
CMS Contract No. HHSM-500-2005-00029I
January 2015
This project was funded by the Centers for Medicare & Medicaid Services under contract no. HHSM-500-2005-00029I. The statements contained in this report are solely those of the authors and do not necessarily reflect the views or policies of the Centers for Medicare & Medicaid Services. RTI assumes responsibility for the accuracy and completeness of the information contained in this report.
_________________________________ RTI International is a registered trademark and a trade name of Research Triangle Institute.
1.2.3 Assessing Lessons Learned and Implications for Future Programs ................16
2 Analysis.................................................................................................................................17 2.1 Administration and Infrastructure ................................................................................17 2.2 Health Information Technology ...................................................................................19 2.3 Provider and Beneficiary Participation ........................................................................21
2.3.2 Beneficiary Participation .................................................................................23 2.4 Cost and Savings ..........................................................................................................30
2.4.1 Savings Calculated for MHCQ Demonstration Performance Payments .........31
2.4.2 Impact of the NC-CCN MHCQ Demonstration on Cost Outcomes ................32 2.5 Quality..........................................................................................................................36
2.5.1 Quality Measures Reported by NC-CCN for the MHCQ Demonstration ..................................................................................................36
List of Tables ES-1 Medicare Health Care Quality Demonstration sites .............................................................. 1 1 Medicare Health Care Quality Demonstration sites ............................................................ 14 2 Numbers of site visit interviewees, by type of protocol ...................................................... 16 3 Changes in participating physician practices and providers from PY1 to PY3 ................... 23 4 Beneficiary assignments and exclusions for the BY and PY3 ............................................. 26 5 CMS-assigned beneficiaries by demographics and disease subgroups, for the BY
and PY3 and for the Intervention Group and Comparison Group ....................................... 27 6 NC-CCN CMS-assigned beneficiaries by utilization and expenditures for the BY,
PY1, and PY3 and for the Intervention Group and Comparison Group .............................. 28 7 Financial outcomes: Multivariate regression analysis results for per-capita
8 Cost outcomes: Multivariate regression analysis results for analyses of subgroups of the main NC-CCN demonstration population for per-capita expenditures ......................... 35
9 Financial outcomes: Multivariate regression analysis results for expenditure components for per-capita expenditures .............................................................................. 36
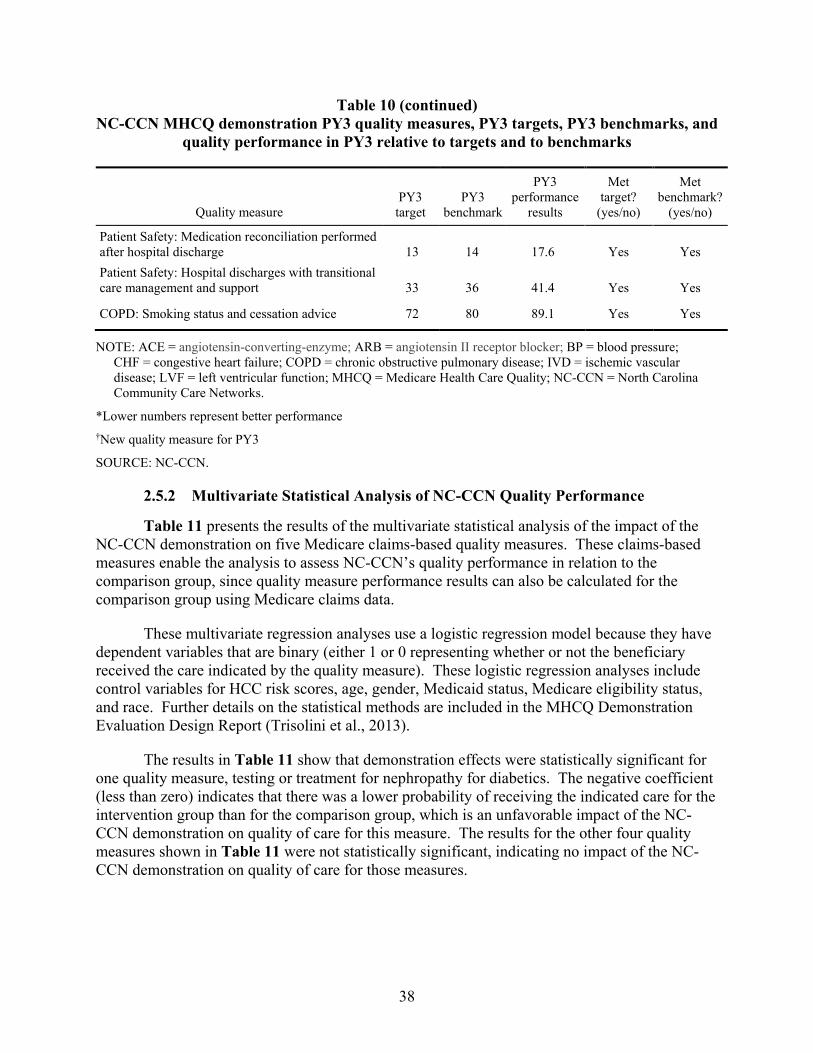
10 NC-CCN MHCQ demonstration PY3 quality measures, PY3 targets, PY3 benchmarks, and quality performance in PY3 relative to targets and to benchmarks ......... 37
11 Demonstration impact on quality outcomes—multivariate regression results for five claims-based quality measures for the main NC-CCN demonstration population .............. 39
12 Utilization outcomes: Summary of statistical analysis results for hospital admissions, emergency department visits, and 30-day readmissions .................................. 41
iv
EXECUTIVE SUMMARY
Introduction
The Medicare Health Care Quality (MHCQ) Demonstration was developed to address concerns about the U.S. health care system, which typically fragments care while also encouraging both omissions in and duplication of care. To rectify this situation, Congress directed the Centers for Medicare & Medicaid Services (CMS) to test major changes to the health care delivery and payment systems to improve the quality of care while also increasing efficiency across the health care system.
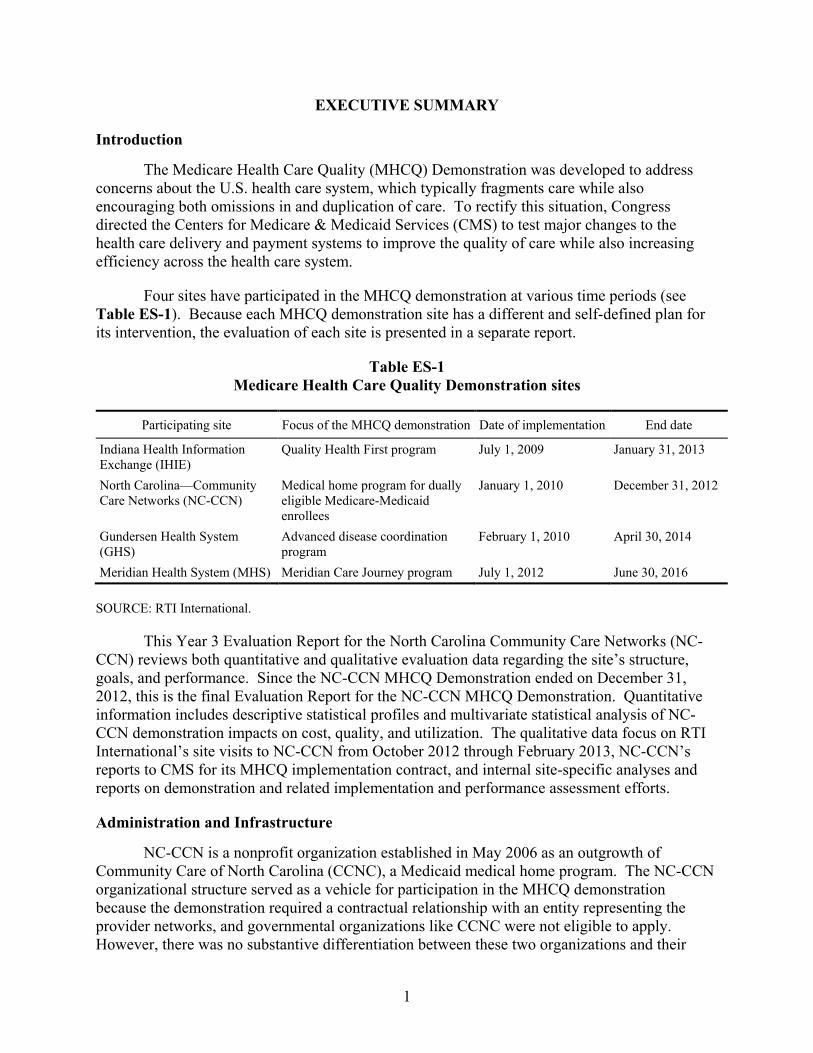
Four sites have participated in the MHCQ demonstration at various time periods (see Table ES-1). Because each MHCQ demonstration site has a different and self-defined plan for its intervention, the evaluation of each site is presented in a separate report.
Table ES-1 Medicare Health Care Quality Demonstration sites
Participating site Focus of the MHCQ demonstration Date of implementation End date
Indiana Health Information Exchange (IHIE)
Quality Health First program July 1, 2009 January 31, 2013
North Carolina—Community Care Networks (NC-CCN)
Medical home program for dually eligible Medicare-Medicaid enrollees
January 1, 2010 December 31, 2012
Gundersen Health System (GHS)
Advanced disease coordination program
February 1, 2010 April 30, 2014
Meridian Health System (MHS) Meridian Care Journey program July 1, 2012 June 30, 2016
SOURCE: RTI International.
This Year 3 Evaluation Report for the North Carolina Community Care Networks (NC-CCN) reviews both quantitative and qualitative evaluation data regarding the site’s structure, goals, and performance. Since the NC-CCN MHCQ Demonstration ended on December 31, 2012, this is the final Evaluation Report for the NC-CCN MHCQ Demonstration. Quantitative information includes descriptive statistical profiles and multivariate statistical analysis of NC-CCN demonstration impacts on cost, quality, and utilization. The qualitative data focus on RTI International’s site visits to NC-CCN from October 2012 through February 2013, NC-CCN’s reports to CMS for its MHCQ implementation contract, and internal site-specific analyses and reports on demonstration and related implementation and performance assessment efforts.
Administration and Infrastructure
NC-CCN is a nonprofit organization established in May 2006 as an outgrowth of Community Care of North Carolina (CCNC), a Medicaid medical home program. The NC-CCN organizational structure served as a vehicle for participation in the MHCQ demonstration because the demonstration required a contractual relationship with an entity representing the provider networks, and governmental organizations like CCNC were not eligible to apply. However, there was no substantive differentiation between these two organizations and their
1
staff, and they were referred to interchangeably by NC-CCN/CCNC staff, networks, and providers. The NC-CCN MHCQ demonstration included 8 CCNC networks in 26 counties, and was intended as a 5-year project that began in 2010 and was scheduled to end in 2014, but NC-CCN decided to withdraw from the MHCQ demonstration as of December 2012. The NC-CCN MHCQ demonstration included beneficiaries who were dually eligible for both Medicare and Medicaid. Medicaid-only beneficiaries were required to enroll with CCNC, but enrollment with CCNC was optional for beneficiaries dually eligible for both Medicare and Medicaid.
The networks’ interventions in the MHCQ demonstration included embedding care managers in high-volume practices and hospitals to assist with care transitions and to help practices identify patients who could benefit from care management services. NC-CCN staff noted in comments to the evaluation team that practices were increasingly hiring their own care managers, in addition to utilizing network care managers, to expand their care management capacity. Two practices hired their own nurse care managers to complement the activities of the CCNC care managers. To increase coordination and documentation across the many types of care managers, the CCNC Case Management Information System (CMIS) was opened up to non-CCNC health department, hospital-based, and practice-based care managers in 2011.
To meet the needs of the MHCQ demonstration, NC-CCN and network staff trained care managers, social workers, and clinical pharmacists about Medicare benefits. Network staff also facilitated relationships between networks and Medicare-oriented community organizations, such as disability resource centers and agencies on aging. Staff at four MHCQ-participating networks interviewed by the evaluation team in performance year two (PY2) reported that they were training staff on patient safety issues that were especially relevant to the Medicare population (e.g., falls prevention, polypharmacy, palliative care coordination), in addition to offering refreshers on topics like congestive heart failure (CHF).
NC-CCN, practice, and network staff reported to the evaluation team that polypharmacy issues in the dually eligible population requiring heightened medication management activities led to increases in pharmacy staff for the MHCQ demonstration. To address a shortage of clinical pharmacists reported in PY1, NC-CCN coordinated efforts across networks to fund part-time community pharmacists, including several working in retail pharmacies, to assist in providing medication therapy management for patients. By PY3, NC-CCN reported that their networks had on staff network-level pharmacists, clinical pharmacists, behavioral health pharmacists, and pharmacy technicians.
Health Information Technology
NC-CCN staff reported to the evaluation team that they had used internal information systems developed by CCNC before the MHCQ demonstration began, but they made MHCQ demonstration-specific modifications to the systems. Through the CMIS, Pharmacy Home system, and informatics reports, NC-CCN channeled data to network staff and providers to facilitate targeted interventions.
NC-CCN staff reported to the evaluation team that the CMIS was a user-built dataset designed in 2001 to provide care managers with direct access to patient data. Through the CMIS, care managers could access demographic and claims data for all N.C. Medicaid enrollees
2
regardless of their enrollment status. Patient records within CMIS helped to ensure continuity of care because patient records remained the same regardless of the patient’s geographic location or change in eligibility status. The CMIS provided care managers with a consistent source for documenting care management interventions, assessments, care plans, and other activities. However, NC-CCN and network staff reported that documentation was not standardized among staff, resulting in variation at the staff member and network levels.
The Pharmacy Home data system aggregated information on drug use that served network pharmacists, care managers, and primary care providers (PCPs). It provided patient-level information on medication history for point-of-care activities and population-based reports to identify patients who had benefitted from clinical pharmacy and care management services. Pharmacy Home was updated to allow providers, pharmacists, and care managers to generate notes, send messages, and enter a clinical narrative into a patient’s record, whereas the system previously could only summarize claims data.
NC-CCN reported that it used Medicare claims and chart audit data for internal data reporting and for preparing reports to CMS for the MHCQ demonstration. These informatics reports included the following:
• Emergency Department (ED) Visit Report—listed all ED visits for MHCQ dually eligible beneficiaries and provided ED visit summary counts by patients.
• Inpatient Visit Report—listed all inpatient services for dually eligible beneficiaries and provided inpatient services summary counts by patient.
• 646 Patient List Report—provided patient-level information on dually eligible beneficiaries in the MHCQ demonstration, with 80 data elements on demographics, costs, utilization, diagnoses, care management status, and priority status for care manager assessment.
• Summary Statistics Report—summarized patient demographics, costs, utilization rates, disease prevalence, and care management status at the county or network level.
NC-CCN staff reported to the evaluation team that they received direct admission, discharge, and transfer (ADT) data feeds from about two-thirds of the major hospitals in the state. Networks historically received fax feeds from some hospitals for Medicaid patients only, but the newer ADT feeds built on the North Carolina Disease Event Tracking and Epidemiologic Collection Tool (NC DETECT). These data feeds were reported by NC-CCN to have been particularly advantageous for identifying high-risk, high-utilization patients for care management services.
Provider and Beneficiary Participation
Provider Participation. The number of NC-CCN MHCQ demonstration participating practices increased by 5 percent from PY1 to PY2, with 33 new practices joining the demonstration and 22 leaving the demonstration. However, at the same time, the number of participating providers fell by 9 percent, with 95 providers leaving the demonstration and only
3
10 joining the demonstration during that period. From PY2 to PY3, the number of practices fell by 3 percent and the number of participating providers fell by 7 percent, with 95 providers leaving the demonstration and only 39 joining. In PY3, the NC-CCN had 791 providers participating, but this was down from 932 participating in PY1.
According to NC-CCN staff, the opportunities for quality improvement and for financial bonuses (if Medicare savings were achieved) were two of the main factors that motivated providers to participate in the MHCQ demonstration. All of the providers interviewed by the evaluation team indicated that improving services for dually eligible beneficiaries was the most appealing aspect of MHCQ participation. Staff at one network reported to the evaluation team that local providers had voiced interest in working with dually eligible beneficiaries because they are a high-need patient population.
Several physicians reported to the evaluation team that physician leadership at the network level was “extremely important” and drove community physician buy-in for the MHCQ demonstration. Most providers had communicated with network medical leadership or other NC-CCN physician leaders when deciding to join the demonstration.
Beneficiary Participation. NC-CCN staff reported to the evaluation team that MHCQ beneficiaries assigned by CMS who were enrolled with a CCNC practice were aware that they were linked to a medical home, but they had no knowledge of their provider’s participation in the MHCQ demonstration. NC-CCN staff emphasized the importance of patients choosing their medical homes (as opposed to being assigned to them), as patients who chose their medical home were much more receptive to its services, particularly to care management and clinical pharmacy services.
Care managers reported to the evaluation team that dually eligible beneficiaries were easier to engage than other populations because they did not work and could be contacted during regular business hours. Care managers also reported that dually eligible beneficiaries were more willing to talk about their health care; they were open and trusting. In addition, because their health needs were so complex, they welcomed additional help in managing their health. NC-CCN staff noted that older beneficiaries were not as comfortable using telehealth devices and other “tech-savvy” health resources, but they appreciated the regular home visits and telephone calls from care managers.
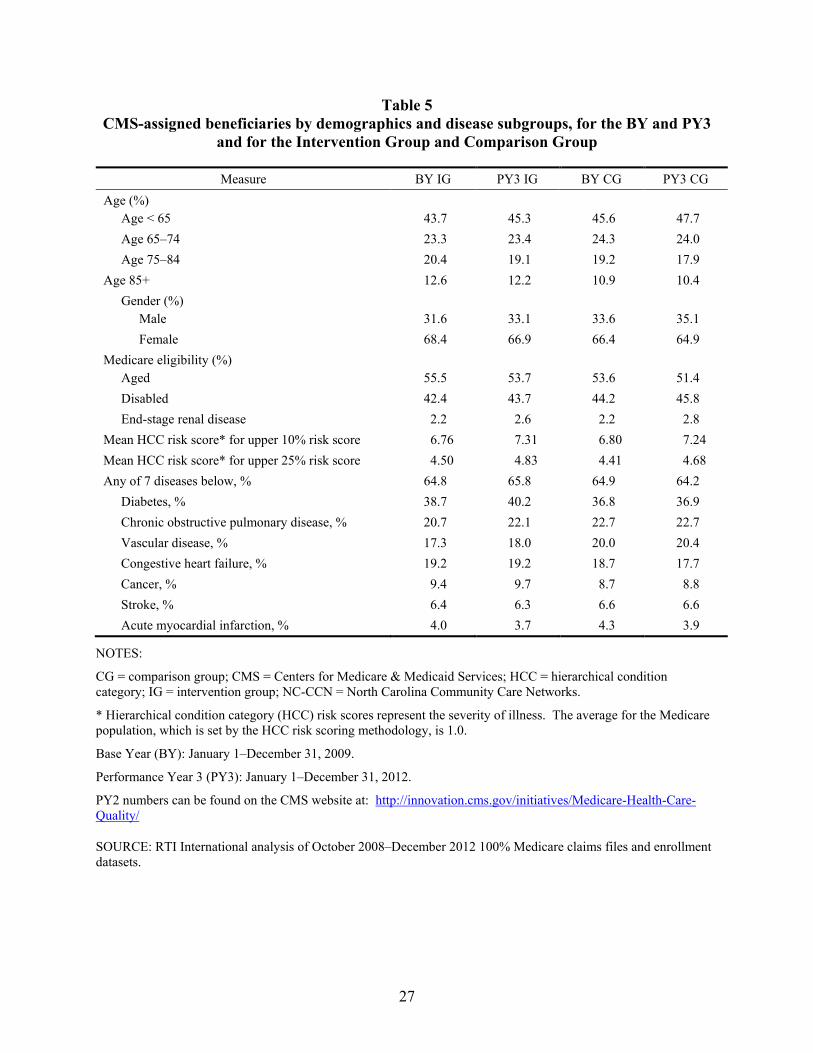
For this demonstration, intervention group beneficiaries were identified using a “one touch” assignment (attribution) algorithm agreed upon by CMS and NC-CCN, meaning that beneficiaries had to have at least one primary care visit with a participating provider. Descriptive statistics for CMS-assigned beneficiaries indicated that both the intervention and comparison groups had very large numbers of CMS-assigned beneficiaries for statistical analysis in the pre-base year (BY), BY, PY1, PY2, and PY3. In PY3, they totaled 49,482 for the intervention group and 103,854 for the comparison group. More than half of the assigned beneficiaries were age 65 or older, and about 45 percent were younger than age 65. About two-thirds of the beneficiaries were females. More than half (55 percent) of the beneficiaries were eligible for Medicare because they were aged, and more than 42 percent were eligible for Medicare because of disability. These patterns were consistent across the pre-BY, BY, PYs, IG, and CG. They are also similar to the national demographic and Medicare eligibility patterns in
4
the dually eligible Medicare population, which has a similar percentage of dually eligible beneficiaries who are younger than age 65 (43 percent), although the national data show a slightly lower percentage of dually eligible beneficiaries who are females (61 percent).
CMS-assigned beneficiaries included more than 36 percent with diabetes and more than 20 percent with chronic obstructive pulmonary disease (COPD). Across the intervention and comparison groups, more than 17 percent had vascular disease, more than 17 percent had CHF, and more than 8 percent had cancer. As expected, the NC-CCN dually eligible beneficiaries had higher percentages of most of these chronic diseases than the overall national Medicare beneficiary population, which had 28 percent with diabetes, 12 percent with COPD, and 16 percent with CHF. The national percentage with cancer is about the same, at 8 percent.
Descriptive statistics on utilization and expenditures show that beneficiaries in the intervention group had an average of about 9–11 office or other outpatient evaluation and management (E&M) visits per year, whereas members of the comparison group had a similar but slightly lower range of about 7–10 office or other outpatient E&M visits per year, on average. Hospital admissions were slightly higher in the intervention group ranging from 580–600 admissions per 1,000 beneficiaries, compared to a range of 530–590 for the comparison group. The pattern for 30-day readmissions showed little change over time for both the intervention and comparison groups. Emergency department visits per 1,000 beneficiaries increased slightly for both the intervention and comparison groups over time.
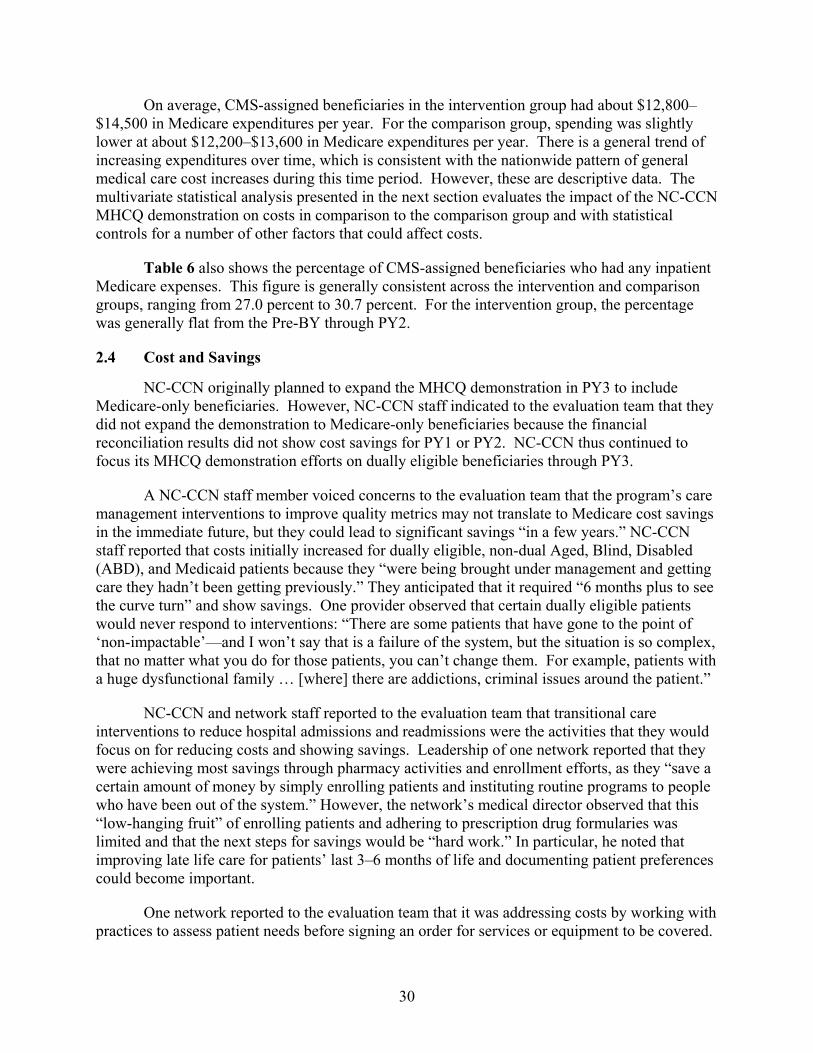
On average, CMS-assigned beneficiaries in the intervention group had about $12,800–$14,500 in Medicare expenditures per year. For the comparison group, spending was slightly lower at about $12,200–$13,600 in Medicare expenditures per year. There is a general trend of increasing expenditures over time, which is consistent with the nationwide pattern of general medical care cost increases during this time period. However, these are descriptive data. The multivariate statistical analysis presented in the next section evaluates the impact of the NC-CCN MHCQ demonstration on costs in comparison to the comparison group and with statistical controls for a number of other factors that could affect costs.
Cost and Savings
To determine whether the NC-CCN MHCQ demonstration achieved Medicare savings and was eligible for a performance payment, CMS contracted with an implementation contractor (independent of the RTI evaluation contract) to calculate savings annually according to the terms and conditions in the demonstration protocol. The NC-CCN PY1, PY2, and PY3 financial reconciliation reports found that NC-CCN’s Medicare savings did not exceed the minimum savings requirement (MSR), so NC-CCN did not earn a performance payment from Medicare for PY1, PY2, or PY3 (Coomer et al., 2011; 2013; 2014).
To determine whether the NC-CCN intervention had an impact on Medicare expenditures, the evaluation conducted multivariate analyses on annualized Medicare expenditures per beneficiary. Unadjusted descriptive data (presented in Table 6 of this report) show that overall costs per beneficiary per year rose for both the intervention and comparison groups between the BY and PY3, so the evaluation used multivariate regression analyses to determine whether the intervention group cost growth rate was slower than the comparison
5
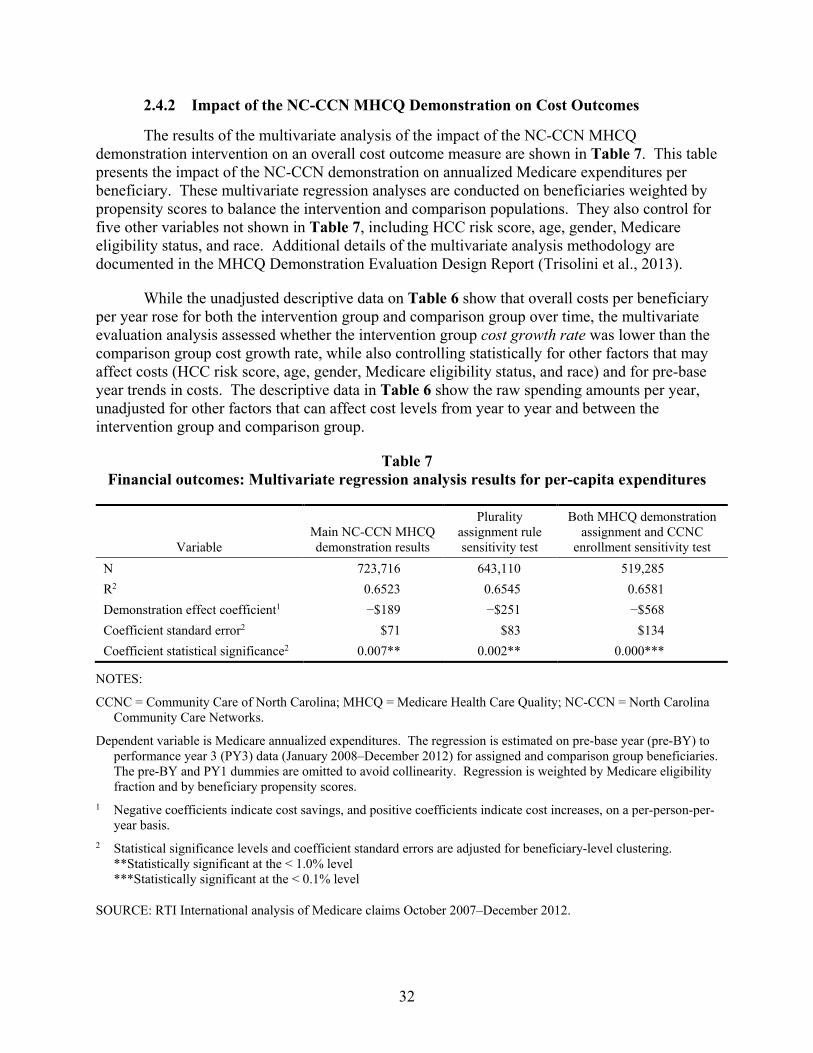
group cost growth rate, while also controlling statistically for five other factors that may affect costs (HCC risk score, age, gender, Medicare eligibility status, and race) and for pre-base year trends in costs. Table 7 of this report shows that for the main NC-CCN MHCQ demonstration effect per-capita costs rose $189 less in the intervention group compared to the comparison group, after adjusting for the other factors that affect costs, and the effect was statistically significant at the 1 percent level. This decrease in cost growth represents a favorable effect of the NC-CCN MHCQ demonstration.
To test whether Medicare savings would have occurred if beneficiaries were assigned on the basis of a plurality of touches with an NC-CCN practice, as opposed to the one-touch rule used for beneficiary assignment for NC-CCN in the MHCQ demonstration, another analysis was conducted as a sensitivity test with the reassigned beneficiaries. A plurality assignment methodology similar to the methodologies used in the CMS Physician Group Practice Demonstration and in the Medicare Shared Savings Program Accountable Care Organization program was used with the NC-CCN MHCQ demonstration beneficiaries. The results of this sensitivity analysis found that PBPY costs for the intervention group were again estimated to decrease (-$251) between the pre-BY and PY3 compared with the comparison group during the same time period, and the effect was statistically significant at better than the 1 percent level.
A second sensitivity test evaluated an alternate definition for the intervention group that included only beneficiaries who were both assigned to NC-CCN for the MHCQ demonstration and enrolled in CCNC’s Medicaid medical home program. This sensitivity analysis found that PBPY costs for the intervention group decreased by $568 from the pre-BY through PY3 compared with the comparison group during the same time period, and the effect was statistically significant at the 0.1 percent level. This also represents a favorable effect of the NC-CCN MHCQ demonstration. The magnitude of savings and level of significance were both higher for this second sensitivity analysis than for the plurality assignment sensitivity analysis and the main demonstration results. As described above, enrollment in CCNC is voluntary for dually eligible beneficiaries, so these results are for a subgroup of the main demonstration. Intervention group beneficiaries also enrolled in CCNC totaled 9,147 in the BY, 21,151 in PY1, 27,368 in PY2, and 25,484 in PY3. Propensity score analysis was conducted independently for this multivariate statistical analysis sensitivity test to balance this intervention group subgroup with the comparison group.
While the NC-CCN demonstration was not able to reduce costs enough to achieve the minimum savings requirement necessary to qualify for a shared savings payment as determined by the financial reconciliation process, the evaluation did find a significant decrease in cost growth between the pre-base year and performance year 3. There were three main differences between the methodologies for the MHCQ evaluation and the MHCQ financial reconciliation that should be noted when comparing these results. First, the evaluation methodology made use of five years (pre-BY, BY, and PY1-PY3) of data while the financial reconciliation methodology used two years of data (BY and PY3). The intent of the evaluation methodology was to examine the changes in cost growth through a difference-in-difference approach which required more years of data. The financial reconciliation examined whether costs were less than a target amount set for PY3 using an actuarial analyses that was agreed upon by the site and CMS in the demonstration protocol. Second, the evaluation methodology used multivariate statistical adjustments to control for factors that can affect cost levels, while the financial reconciliation
6
used an actuarial method that did not control for potential confounding variables. Third, the evaluation used propensity score weighting to balance beneficiary characteristics between the intervention group and comparison group. The financial reconciliation used a demographic factor calculated from a regression of expenditures on four control variables to balance potential demographic differences between the intervention group and comparison group.
It is also important to note that both the MHCQ evaluation and the MHCQ financial reconciliation analyses examined Medicare expenditures only. An analysis of Medicaid expenditures was not conducted due to the lags in the availability of Medicaid claims, and thus we cannot report on the impact of the NC-CCN demonstration on Medicaid expenditures.
Multivariate regression analysis was also conducted to evaluate the impact of the main NC-CCN demonstration intervention on expenditures by beneficiary subgroups. A number of statistically significant effects were found. Of the 13 subgroups analyzed, statistically significant intervention effects were found for 7 subgroups, including beneficiaries with diabetes, any of seven chronic diseases, vascular disease, end-stage renal disease (ESRD), positive inpatient spending, risk scores in the top 10%, and risk scores in the top 25% (see Table 8 in this report). For all of these subgroups, the per-capita costs declined for the intervention group compared with the comparison group, which represent favorable effects of the NC-CCN MHCQ demonstration. The size of the ESRD subgroup effect is notable, at $4,587 in savings per beneficiary.
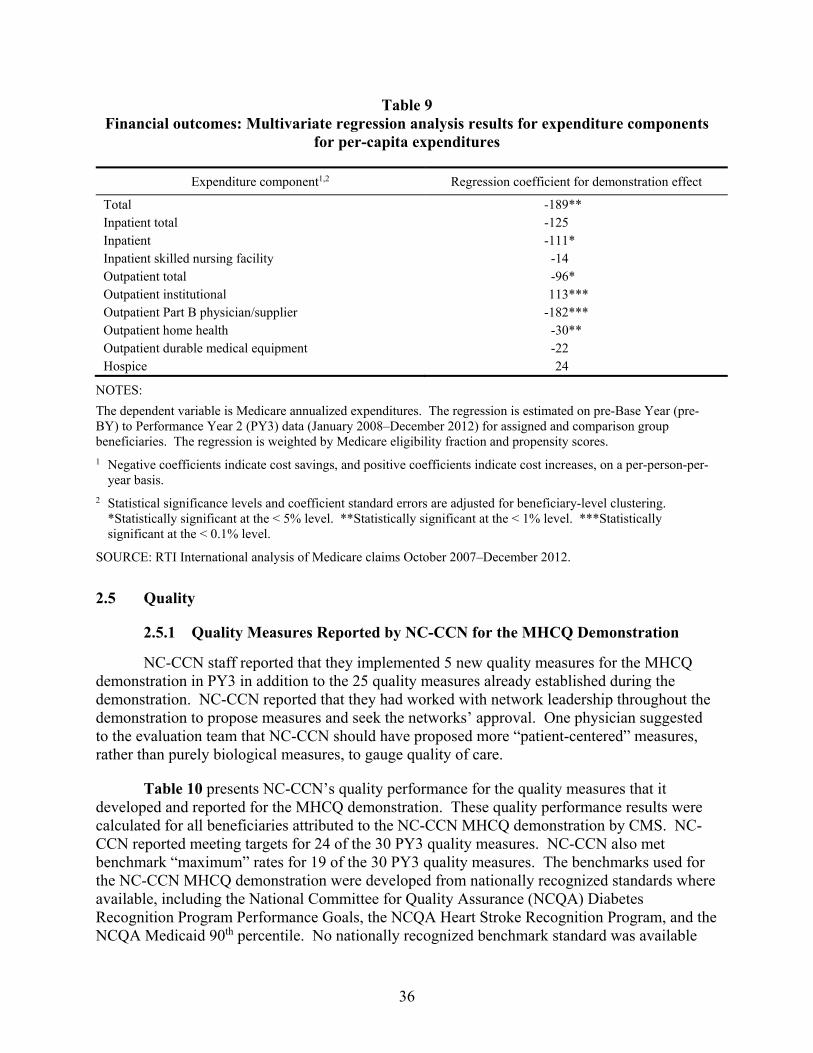
Multivariate statistical analysis was also conducted to evaluate the impact of the main NC-CCN demonstration intervention effect on expenditure by types of Medicare services and their associated Medicare claims data expenditure components. Of the nine components analyzed, statistically significant intervention effects were found for five, including inpatient, outpatient total, outpatient institutional, Part B physician/supplier, and home health. Costs declined for four of these expenditure components, representing favorable effects of the NC-CCN MHCQ demonstration. Costs increased for one of these expenditure components, Outpatient Institutional, representing an unfavorable effect of the NC-CCN MHCQ demonstration.
Quality
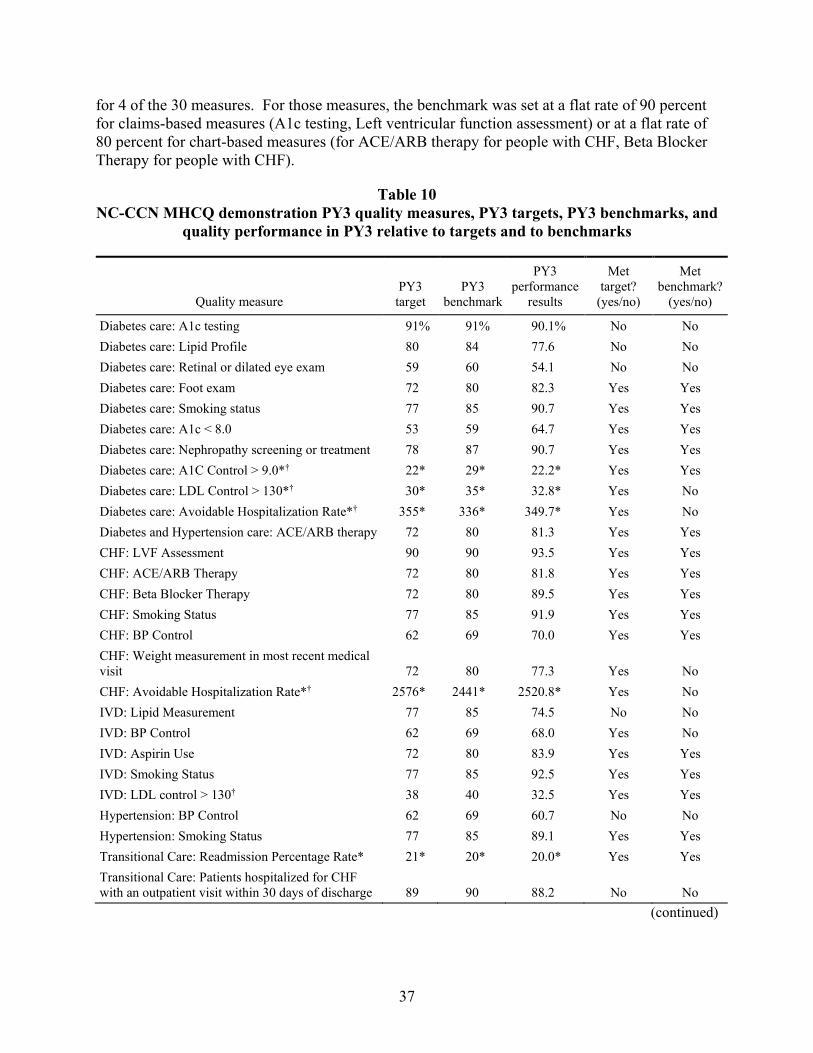
NC-CCN staff reported that they implemented 5 new quality measures for the MHCQ demonstration in PY3 in addition to the 25 quality measures from PY2. NC-CCN reported meeting targets for 24 of the 30 PY3 quality measures.
Multivariate statistical analysis of the impact of the NC-CCN demonstration on quality of care was conducted for this evaluation for five Medicare claims-based quality measures. These claims-based measures enabled the analysis to assess NC-CCN’s quality performance in relation to the comparison group, since quality measure performance results can also be calculated for the comparison group using Medicare claims data.
These multivariate regression analyses used logistic regression models because they have binary dependent variables. They also included control variables for HCC risk scores, age, gender, Medicaid status, Medicare eligibility status, and race. Separate logistic regression analyses were conducted for the following quality measures:
7
• Glycated hemoglobin (HbA1c) testing once a year for beneficiaries with diabetes.
• Low-density lipoprotein testing once a year for beneficiaries with diabetes.
• Urine protein testing once a year or for evidence of medical attention for nephropathy for beneficiaries with diabetes.
• Lipid profile testing once a year for beneficiaries with coronary artery disease (CAD).
• Beneficiaries hospitalized with a principal diagnosis of heart failure during the current year who also had left ventricular ejection fraction testing during the current year.
The results of these analyses found only one quality measure result that was statistically significant, but it was unfavorable, showing lower probability of receiving the indicated care for the intervention group in comparison to the comparison group. This was for testing or treatment of nephropathy for diabetics. The results for the other four quality measures were not statistically significant, indicating no effect of the NC-CCN demonstration on quality of care for those measures.
Utilization
Multivariate regression analyses were conducted to evaluate the NC-CCN MHCQ demonstration impact on three utilization measures: hospital admissions, ED visits, and 30-day readmissions. Demonstration effects were found to be statistically significant for hospital admission for the predicted number of utilization events, for ED visits for both the predicted number of utilization events and the overall demonstration effect on utilization, and for 30-day readmissions for the predicted number of utilization events. Of these four significant effects, three were negative, indicating that the demonstration resulted in reductions for the predicted number of hospital admissions, the predicted number of ED visits, and the overall demonstration effect for ED visits. These reductions in utilization represent favorable impacts of the demonstration for these utilization outcomes. However, there was an increase in the predicted number of readmissions, an unfavorable effect.
Lessons Learned and Implications for Future Programs
A variety of lessons learned and implications for future programs can be gleaned from the results of the NC-CCN MHCQ demonstration across its 3 performance years.
The cost impacts of the demonstration were favorable over the three years of demonstration operations, with a statistically significant reduction in cost growth found overall for the main NC-CCN MHCQ demonstration. Significant savings were also found for two sensitivity analyses, including one using a plurality attribution rule, and a second using the subset of beneficiaries who were both assigned by CMS to NC-CCN for the MHCQ demonstration and also enrolled in CCNC. The high levels of statistical significance for these cost savings effects, all at the 1 percent level or better, were also notable.
8
The cost impact analysis results in PY3 were stronger that the results in PY2, where cost savings were also found for the main effect and the two sensitivity tests, but with lower levels of savings and weaker levels of statistical significance (below the 10 percent level but not below the 5 percent level) for the main effect and for the sensitivity test using the plurality attribution rule. This indicates that the cost savings impact increased over time for the NC-CCN MHCQ demonstration. However, despite the significantly decreased cost growth over time, the NC-CCN demonstration was not able to reduce costs enough to achieve the minimum savings requirement necessary to qualify for a shared savings payment as determined by the financial reconciliation process detailed in the demonstration protocol, which was independent from the evaluation.
There were three main differences between the methodologies for the MHCQ evaluation and the MHCQ financial reconciliation that should be noted when comparing the results. First, the evaluation methodology made use of five years (pre-BY, BY, and PY1-PY3) of data to examine the changes in cost growth through a difference-in-difference approach. The financial reconciliation methodology used actuarial techniques agreed upon by the site and CMS in the demonstration protocol to allow for timely savings calculation using two years of data (BY and PY3) to determine whether costs were less than a target amount. Second, the evaluation methodology used multivariate statistical adjustments to control for factors that can affect cost levels, while the financial reconciliation used an actuarial method that did not control for potential confounding variables. Third, the evaluation used propensity score weighting to balance beneficiary characteristics between the intervention group and comparison group. The financial reconciliation used a demographic factor to balance potential demographic differences between the intervention group and comparison group.
It is important to note that the evaluation and the financial reconciliation analyzed Medicare expenditures only and not Medicaid expenditures due to the lags in availability of Medicaid data. So, any impact of the NC-CCN demonstration on Medicaid expenditures is not known.
NC-CCN’s self-reported quality measures for the MHCQ demonstration, which were assessed for the intervention group against targets agreed upon with CMS and not against a comparison group, showed good results with the targets met for 24 of the 30 quality measures. Most of the targets were set using national benchmarks for those quality measures, but these intervention group-only results do not indicate whether or not the same results were achieved by the comparison group in the absence of the NC-CCN MHCQ demonstration interventions.
The multivariate analysis of utilization impacts of the NC-CCN MHCQ demonstration for PY3, in comparison to the comparison group utilization performance, found statistically significant utilization effects for one or more measures for all three utilization outcomes, including hospital admissions, ED visits, and 30-day readmissions. Three of the significant effects were for reductions in utilization, and thus represent favorable impacts of the NC-CCN MHCQ demonstration. However, the effect for 30-day readmissions was for an increase in utilization. These PY3 utilization outcome analysis results showed more statistically significant effects than the PY2 results, where only two significant effects were found for ED measures, with both for reductions in utilization.
9
In sum, several lessons were learned from the multivariate statistical analysis of NC-CCN MHCQ demonstration impacts on cost, quality, and utilization. The key points are as follows:
• As predicted by NC-CCN, reducing Medicare cost growth for dual-eligibles using the medical home intervention took time. With each performance year, the level of savings increased but did not become statistically significant until PY3. Demonstrations covering longer time periods may be beneficial, especially for populations that are complex and require sustained interventions over time, such as dual-eligibles, to produce significant savings.
• High cost and high utilization beneficiary subgroups were found to have significant cost savings in this NC-CCN demonstration, including beneficiaries with the higher HCC scores, any of 7 chronic diseases, and ESRD.
• Future CMS demonstration projects should expand the number of quality measures evaluated against comparison groups, and rely less on quality measures evaluated against targets assessed only for the intervention group. While the site-reported measures showed improvement in quality of care over time, the evaluation analysis using claims data and a comparison group found that the NC-CCN intervention did not improve quality for the 5 measures examined.
• Despite increases in 30-day readmissions, reductions in emergency department visits and hospitalizations were consistent with the cost savings and represent some of the ways in which NC-CCN achieved its cost savings.
Qualitative analysis and descriptive statistics for the NC-CCN MHCQ demonstration also provide a number of lessons learned and implications for future programs. Educating more providers about the demonstration may have been beneficial, as providers interviewed by the evaluation team generally indicated a lack of awareness about the demonstration unless they had leadership roles in CCNC networks or in NC-CCN. Most physicians did not distinguish MHCQ demonstration activities from the other services provided to them through CCNC network affiliation.
One concern found in the site visits was that NC-CCN seemed to be recycling the existing CCNC interventions with few additional resources devoted to dually eligible beneficiaries due to limited funding or to hopes that they could demonstrate savings under the MHCQ demonstration without much additional effort. Staff of one network explained that they were relying on Medicaid payments to fund their care managers, who were “stretched thin” in having expanded their services to include dually eligible beneficiaries in the MHCQ demonstration without additional funding to support the expansion in services. Site visit participants agreed that more investments in resources and infrastructure were needed at the beginning of the MHCQ demonstration. Future Medicare demonstration projects involving dually eligible beneficiaries should consider up-front incentive payments for defined care delivery interventions as one way to expand provider involvement and interventions, and test if this can increase the efficacy of the interventions for reducing costs and improving quality.
10
NC-CCN site-reported data included information on beneficiaries who received one or more types of NC-CCN non-Medicare and non-Medicaid services, but those data were found to be incomplete and recorded in inconsistent ways by different demonstration site staff, and thus not useful for evaluation purposes. NC-CCN staff indicated that those data were intended for internal operations purposes by care managers, and had not been intended for use in evaluation analysis. Future Medicare demonstration projects should consider ways to ensure that site-reported data collected on non-Medicare services that are not recorded in Medicare claims data are collected in a more systematic and comprehensive way so that they can be used for both internal operations purposes by demonstration site staff and evaluation purposes by CMS.
NC-CCN staff identified a number of challenges in implementing the MHCQ demonstration that should be considered in designing future CMS programs. They viewed data delays and attribution issues as barriers to demonstrating cost savings in the MHCQ demonstration. The NC-CCN MHCQ demonstration one-touch beneficiary attribution method was cited by NC-CCN staff as a barrier to achieving savings, as it did not identify longitudinal patient-provider relationships and created significant turnover in the beneficiary population attributed to NC-CCN from year to year. NC-CCN informatics staff reported that having technical assistance from CMS to better understand Medicare data would have helped to resolve some of the data issues they encountered early in the demonstration. NC-CCN staff also indicated that not getting Part D data was a problem for the MHCQ demonstration because medication fill history information adds a lot of value in managing patients.
11
[This page intentionally left blank.]
12
SECTION 1 INTRODUCTION
The Medicare Health Care Quality (MHCQ) demonstration was developed to address concerns about the U.S. health care system, which typically fragments care while also encouraging both omissions in and duplication of care. To rectify this situation, Congress directed the Centers for Medicare & Medicaid Services (CMS) to test major changes to the health care delivery and payment systems to improve the quality of care while also increasing efficiency across the health care system. This goal would be achieved through several types of interventions: adoption and use of information technology and decision support tools by physicians and their patients, such as evidence-based medicine guidelines; best practice guidelines; shared decision-making programs; reform of payment methodologies; improved coordination of care among payers and providers serving defined communities; measurement of outcomes; and enhanced cultural competence in the delivery of care.
Section 1866C of the Social Security Act, as amended by Section 646 of the Medicare Prescription Drug, Improvement, and Modernization Act of 2003 (P.L. 108-173, Section 1866C[b]), requires the Secretary of the Department of Health and Human Services to establish a 5-year demonstration, under which the Secretary may approve demonstration projects that examine health delivery factors that encourage improved quality in patient care. This section also authorizes the Secretary to waive compliance with such requirements of Titles XI and XVIII of the Social Security Act (42 U.S.C. 1395 et seq.) as may be necessary for the purposes of carrying out the demonstration project.
Three types of “health care groups” were eligible to participate in the MHCQ demonstration: (1) groups of physicians, (2) integrated health care delivery systems, and (3) organizations representing regional coalitions of groups or systems. The MHCQ demonstration is designed to examine the extent to which major, multifaceted changes to traditional Medicare’s health delivery and financing systems lead to improvements in the quality of care provided to Medicare beneficiaries without increasing total program expenditures.
Four sites have participated in the MHCQ demonstration at various time periods (see Table 1). Because each MHCQ demonstration site has a different and self-defined plan for its intervention, the evaluations of each site are presented in separate reports. This report presents evaluation results for the North Carolina Community Care Networks (NC-CCN).
13
Table 1 Medicare Health Care Quality Demonstration sites
Participating site Focus of the MHCQ demonstration Date of implementation End date
Indiana Health Information Exchange (IHIE)
Quality Health First program July 1, 2009 January 31, 2013
North Carolina—Community Care Networks (NC-CCN)
Medical home program for dually eligible Medicare-Medicaid enrollees
January 1, 2010 December 31, 2012
Gundersen Health System (GHS)
Advanced disease coordination program
February 1, 2010 April 30, 2014
Meridian Health System (MHS) Meridian Care Journey program July 1, 2012 June 30, 2016
SOURCE: RTI International.
1.1 Objectives and Structure of This Report
This Year 3 Evaluation Report for the NC-CCN reviews both quantitative and qualitative evaluation data regarding the site’s structure, goals, and performance. Since the NC-CCN MHCQ Demonstration ended on December 31, 2012, this is the Final Evaluation Report for the NC-CCN MHCQ Demonstration.
Section 2 of this report includes the detailed evaluation of NC-CCN using quantitative and qualitative data and analysis. The focus of the quantitative analysis is on multivariate statistical analysis of the impacts of the NC-CCN demonstration on cost, quality, and utilization outcomes. The qualitative analysis describes the goals, governance, and interventions as well as the barriers and challenges that NC-CCN experienced in implementing its demonstration. Section 3 includes lessons learned and implications for future programs.
1.2 NC-CCN Evaluation Methods
1.2.1 Quantitative Analysis
To evaluate improvements in quality, utilization, and costs in the NC-CCN demonstration, it is necessary to specify a comparison group of beneficiaries not subject to the intervention. This enables the evaluation to assess whether the observed effects on quality, utilization, and costs may have happened even in the absence of the demonstration.
We used the same intervention and comparison groups that the MHCQ demonstration implementation contractor used for the financial reconciliation analysis for NC-CCN, to maintain consistency between the two analyses. The methodology for determining the comparison group is outlined in more detail in NC-CCN’s demonstration protocol. There were two basic steps to match intervention and comparison group beneficiaries. The first step was to identify comparison counties with metropolitan areas that were similar to the counties included in the NC-CCN demonstration with regard to the sociodemographic characteristics of their Medicare populations. The counties found to be most similar to the demonstration area and agreed upon with NC-CCN include 18 counties in Georgia, 19 counties in Kentucky, 12 counties in South Carolina, 9 in Tennessee, and 20 in Virginia. The second step was to retrospectively identify
14
beneficiaries in the comparison counties who met the eligibility criteria for the NC-CCN demonstration. In each demonstration year (base or performance), a beneficiary was included in the comparison group if he or she had a qualifying treatment1 from a primary care provider, resided in one of the comparison counties, and was dually eligible for Medicare and Medicaid.
Quantitative information in this evaluation includes descriptive statistical profiles and multivariate statistical analysis of NC-CCN demonstration outcomes. The descriptive statistical profiles include the intervention and comparison groups; pre-base year (pre-BY), base year (BY), performance year one (PY1), performance year two (PY2), and performance year three (PY3) time periods; and data on beneficiary demographic, Medicare enrollment, and disease characteristics. The intervention group for the NC-CCN MHCQ demonstration was identified by CMS using a one-touch attribution rule calculated using Medicare claims data; this attribution method was intended to cast a wide net for beneficiaries receiving treatment from the demonstration providers, and it also provided an objective approach for identifying the intervention group that did not rely on the site’s own data systems.
The multivariate statistical analysis methodology involves two main methods. First, propensity scores are estimated and propensity score weights are applied to the data in order to balance the intervention group and comparison group with respect to key beneficiary characteristics before conducting the impact analyses. Second, a multivariate regression model combining data from the pre-BY and BY as well as from PY1, PY2, and PY3 is used to estimate the impact of the demonstration on Medicare expenditures, quality, and utilization. This multivariate difference-in-differences regression model estimates the effect of the demonstration on an outcome of interest during the demonstration period after controlling for beneficiary characteristics and time trends throughout the entire observation period. Further details of the statistical analysis methods are included in the MHCQ Demonstration Evaluation Design Report (Trisolini et al., 2013).
1.2.2 Qualitative Analysis
The qualitative data in this report include information provided to RTI during site visits to NC-CCN; through interviews with NC-CCN patients and family members; and from NC-CCN’s reports to CMS, and internal site-specific analyses and reports on demonstration and related implementation and performance assessment efforts.
RTI staff conducted interviews with NC-CCN in person and by telephone between October 2012 and February 2013. RTI staff interviewed individuals representing four of the eight participating NC-CCN networks. The interviews were guided by unique protocols tailored to specific types of interviewees. Table 2 describes the types and numbers of site visit interviewees, by type of protocol used. The site visit interviews were conducted by teams of two or three RTI staff. The protocols were developed to address the evaluation domains identified in the MHCQ Demonstration Evaluation Design Report (Trisolini et al., 2013).
1 A qualifying treatment is a treatment billed using an evaluation and management Current Procedural Terminology (CPT) code for office or other outpatient services; nursing facility services; or domiciliary, rest home, or other custodial care services.
15
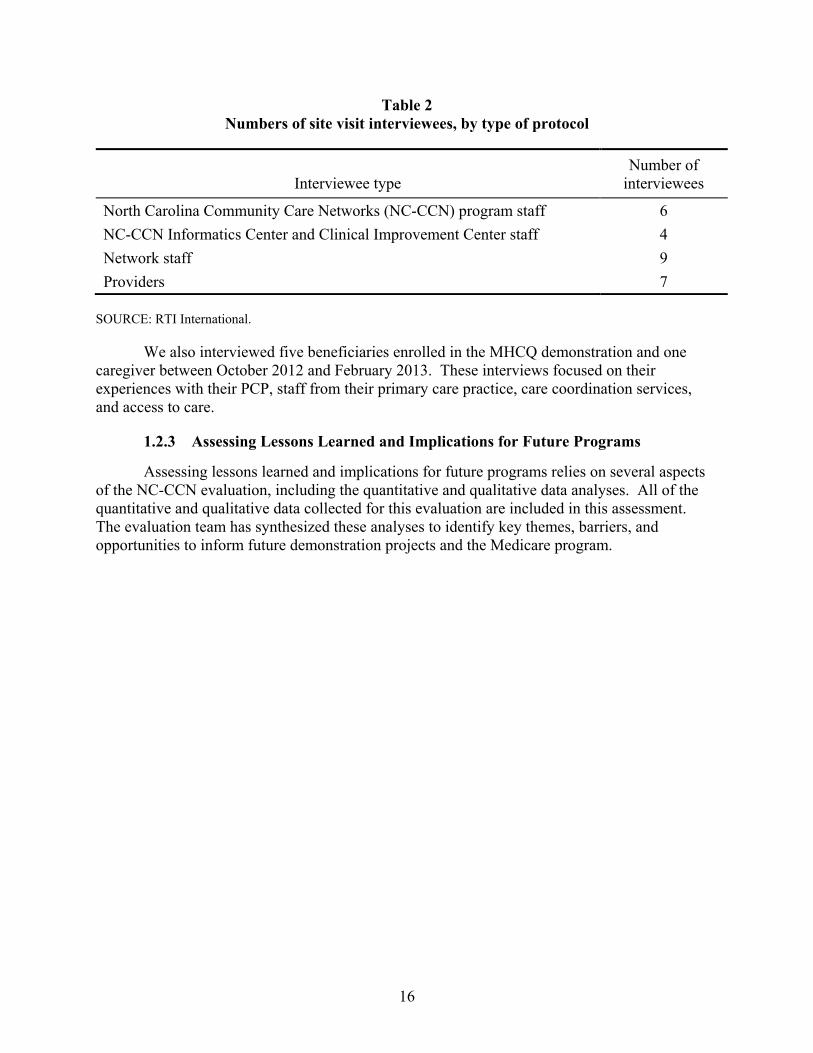
Table 2 Numbers of site visit interviewees, by type of protocol
Interviewee type Number of
interviewees
North Carolina Community Care Networks (NC-CCN) program staff 6 NC-CCN Informatics Center and Clinical Improvement Center staff 4 Network staff 9 Providers 7
SOURCE: RTI International.
We also interviewed five beneficiaries enrolled in the MHCQ demonstration and one caregiver between October 2012 and February 2013. These interviews focused on their experiences with their PCP, staff from their primary care practice, care coordination services, and access to care.
1.2.3 Assessing Lessons Learned and Implications for Future Programs
Assessing lessons learned and implications for future programs relies on several aspects of the NC-CCN evaluation, including the quantitative and qualitative data analyses. All of the quantitative and qualitative data collected for this evaluation are included in this assessment. The evaluation team has synthesized these analyses to identify key themes, barriers, and opportunities to inform future demonstration projects and the Medicare program.
16
SECTION 2 ANALYSIS
This section includes the following topics: administration and infrastructure, health information technology, provider and beneficiary participation, cost and savings, quality, and utilization.
2.1 Administration and Infrastructure
Administration. NC-CCN is a nonprofit organization established in May 2006 as an outgrowth of CCNC, a Medicaid medical home program. The NC-CCN organizational structure served as the vehicle for participation in the MHCQ demonstration because the demonstration required a contractual relationship with an entity representing provider networks, and governmental organizations such as CCNC were not eligible to apply. However, there was no substantive differentiation between these two organizations and their staff, and they were referred to interchangeably by NC-CCN/CCNC staff, networks, and providers. The NC-CCN MHCQ demonstration included eight CCNC networks operating in 26 counties. It targeted beneficiaries who were dually eligible for both Medicare and Medicaid. Medicaid-only beneficiaries were required to enroll with CCNC, but enrollment with CCNC was optional for beneficiaries dually eligible for both Medicare and Medicaid.
The NC-CCN MHCQ Demonstration implemented a four-pronged strategy to improve care delivery for dually eligible beneficiaries. The demonstration
• assigned beneficiaries to participating primary care physician practices, which were responsible for coordinating care and improving performance on a defined set of quality measures;
• provided community-based care coordination services to participating practices and beneficiaries;
• expanded the Medicaid case management information system (CMIS) to include the dually eligible population; and
• developed and implemented a performance measurement and reporting program to recognize and encourage improvements in performance by participating physicians.
NC-CCN implemented several kinds of targeted interventions for chronically ill patients. These services included screening, assessment, and care planning; transition care support; care coordination; targeted risk management of high-risk patients, especially those with multiple chronic conditions; patient-centered chronic care model (medical home); disease management; pharmacy home and medication reconciliation; self-management support; mental health integration; provider education; practice improvement; and data and reports for networks and practices.
The NC-CCN MHCQ demonstration began in 2010, and was intended as a 5-year project. NC-CCN decided to withdraw from the MHCQ demonstration in December 2012.
17
However, following the demonstration NC-CCN is continuing to serve dual eligibles in North Carolina.
Infrastructure. NC-CCN staff reported to the evaluation team that engagement of the dually eligible patient population for the MHCQ demonstration contributed to an overall growth of infrastructure for NC-CCN and CCNC, expanded CCNC activities into new settings like nursing facilities and group homes, and increased the focus on mental health and pharmacy resources.
During the demonstration, NC-CCN adapted its medical home model to long-term care facilities that served residents enrolled in CCNC in network participating in NC-CCN. One MHCQ network brought medical home services to skilled nursing facilities (SNFs) through a single physician practice, although SNF residents could not be enrolled in CCNC at that time. Primary care physicians, nurse practitioners, and care managers provided on-site care in long-term care facilities that agreed to work with CCNC and its networks. Networks reported that they pursued engagement with long-term care facilities to varying degrees, including adding an Aging Continuum Coordinator position for reaching out to local adult care homes and community organizations.
Overall growth in the CCNC-enrolled population led to the hiring of new staff over the three years of the demonstration. Network staff reported that growth in enrollment was not specific to the dually eligible population, but it also included the Medicaid-only aged, blind, or disabled (ABD) patient population. Network staff noted that the dually eligible and ABD patients required more time, resources, and staffing than other patient populations because of their high needs and complexity. One network hired additional social workers and changed their overall ratio of nurses to social workers to meet the needs of the new patient populations. The network also reorganized their care manager assignments to geographic regions as part of joining MHCQ to ensure that no particular care managers were “inundated with all high-need, high-risk” ABD and dually-eligible patients. A staff member of the network noted, “We had to get used to taking care of sick people, super complex patients with many social needs.”
Networks embedded care managers in high-volume practices and hospitals to assist with care transitions and to help practices identify patients that could benefit from care management services. NC-CCN staff noted in comments to the evaluation team that two practices hired their own registered nurse care managers to complement the activities of the CCNC care managers. To increase coordination and documentation across the many types of care managers, the CCNC Case Management Information System (CMIS) was opened up to non-CCNC health department, hospital-based, and practice-based care managers in 2011.
To meet the needs of the MHCQ demonstration, NC-CCN and network staff trained care managers, social workers, and clinical pharmacists about Medicare benefits. Network staff also facilitated relationships between networks and Medicare-oriented community organizations, such as disability resource centers and agencies on aging. Every CCNC network maintained a list of community resources on its website. The four MHCQ networks interviewed in PY2 reported that they were training staff on patient safety issues that were relevant to the elderly (e.g., falls prevention, polypharmacy) and palliative care coordination, in addition to offering refreshers on
18
topics like congestive heart failure (CHF). One network used staff training offered by the local aging network.
NC-CCN, network staff, and providers reported to the evaluation team that they encountered a high prevalence of coexisting mental illnesses in the dually eligible patient population, resulting in increased attention to a statewide dearth of behavioral health resources. NC-CCN staff noted that their ability to integrate the existing NC mental health services system into their medical home model had been challenging because North Carolina contracted separately with local managed care entities to take care of mental health and substance abuse needs on a capitated basis. According to NC-CCN, each of its 14 networks had hired a part- or full-time psychiatrist and a full-time behavioral health coordinator “well versed in that community” who could coordinate with providers on a consulting basis. In addition, NC-CCN embedded psychologists and counselors in several rural, high-burden practices and hoped to expand this “co-location” model to other sites. NC-CCN staff noted that despite these efforts, resources to meet the mental health needs of their enrolled patient population were still inadequate.
NC-CCN, practice, and network staff reported to the evaluation team that polypharmacy issues in the dually eligible population required heightened medication management activities and led to increases in pharmacy staff for the MHCQ demonstration. To address a shortage of clinical pharmacists reported in PY1, NC-CCN coordinated efforts across networks to fund part-time community pharmacists, including several working in retail pharmacies, to assist in providing medication therapy management to CCNC patients. Networks were hiring pharmacy technicians to assist clinical pharmacists with administrative tasks and basic medication therapy management. By PY3, NC-CCN reported that their networks had staff that included network-level pharmacists, clinical pharmacists, behavioral health pharmacists, and pharmacy technicians.
2.2 Health Information Technology
NC-CCN staff reported to the evaluation team that they used internal information systems developed by CCNC before the MHCQ demonstration began, but they made MHCQ demonstration-specific modifications to the systems. Through the CMIS, Pharmacy Home, and informatics reports, NC-CCN channeled data to network staff and providers to facilitate targeted interventions.
NC-CCN staff reported to the evaluation team that the CMIS is a user-built dataset designed in 2001 to provide care managers with direct access to patient data. Through CMIS, care managers could access demographic and claims data for all NC Medicaid enrollees regardless of their enrollment status. However, Medicare data were not incorporated into the system for the MHCQ demonstration. Patient records within CMIS helped to ensure continuity of care, because patient records remain the same regardless of the patient’s geographic location or change in eligibility status. The CMIS provided care managers with a consistent source for documenting care management interventions, assessments, care plans, and other activities. NC-CCN and network staff reported that documentation among staff were not standardized, however, resulting in variation in the data entered into the system at the staff member and network levels.
19
The Pharmacy Home data system aggregated information on drug use that serves network pharmacists, care managers, and primary care providers (PCPs). It provided patient-level information on medication history for point-of-care activities and population-based reports to identify patients who may benefit from clinical pharmacy and care management services. Pharmacy Home was updated to allow providers, pharmacists, and care managers to generate notes, send messages, and enter a clinical narrative into a patient’s record, whereas the system previously could only summarize claims data. The informatics team did not create an alert in Pharmacy Home to show that a patient was attributed to the MHCQ demonstration, although there was notation to show that a patient was dually eligible.
Although a complete pharmacy claims history was available within several weeks of a fill date for Medicaid-only beneficiaries, NC-CCN lacked Medicare Part D data for dually eligible patients during the MHCQ demonstration. NC-CCN noted that timely pharmacy claims allow pharmacists to identify issues of nonadherence and care gaps for targeted outreach, education, and medication reconciliation. NC-CCN used Surescripts as an alternative source for attributed patients’ pharmacy fill history during the MHCQ demonstration.
NC-CCN reported that it used Medicare claims and chart audit data in for internal data reporting and for preparing reports to CMS for the MHCQ demonstration. The informatics reports included the following:
• Emergency Department (ED) Visit Reports—listed all ED visits for MHCQ dual eligibles, and provided ED visit summary counts by patients. Users could sort data by hospital, date of service, paid claim date, PCP, PCP county, care management status, emergent vs. nonemergent status, and care manager.
• Inpatient Visit Reports—listed all inpatient services for dual eligibles and provided inpatient services summary counts by patient. Users could sort by PCP, PCP county, hospital, care manager, care management status, date of service, paid date, and patients with at least one 30-day readmission.
• 646 Patient List Report—provided patient-level information on dual eligibles in the MHCQ demonstration, with 80 data elements on demographics, costs, utilization, diagnoses, care management status, and priority status for care manager assessment. CMS data were incorporated into this report for practices participating in the MHCQ demonstration.
• Summary Statistics Report—summarized patient demographics, costs, utilization rates, disease prevalence, and care management status at the county or network level.
The Quality Measurement and Feedback chart review reports provided practices with patient chart audit results. These results included quality measure data not available from claims, such as HbA1c values, blood pressure readings, patient weight, and occurrence of foot exams. NC-CCN staff reported that a representative sample of randomized charts was audited for patients with qualifying conditions.
20
NC-CCN informatics staff reported to the evaluation team that the Medicare claims data feeds from CMS had improved since the beginning of the demonstration, but staff would have liked them to be timelier. However, NC-CCN staff were concerned that CMS removal of claims with substance abuse diagnoses and treatment procedures from abstracts starting in December 2011 deleted some claims used for care coordination and affected the accuracy of risk segmentation strategies. In addition, NC-CCN reported that claims file format changes in March 2011 created delays because the NC-CCN load programs failed. NC-CCN noted that consistent file formats would have reduced delays and system errors.
NC-CCN staff reported to the evaluation team that they received direct admission, discharge, and transfer (ADT) data feeds from about two-thirds of the major hospitals in the state during the demonstration. Networks historically received fax feeds from some hospitals for Medicaid patients only, but ADT feeds built upon the North Carolina Disease Event Tracking and Epidemiologic Collection Tool (NC DETECT). These data feeds were particularly advantageous for identifying high-risk, high-utilization patients for care management services.
NC-CCN staff reported that 1,717 individuals in provider offices statewide (including non-MHCQ providers and staff) had direct login access to the Provider Portal as of PY2. Although NC-CCN staff noted in comments to the evaluation team that “the more information you can give to a doctor about their entire patient population, they appreciate it,” several providers noted that PCPs generally were overwhelmed by available data and preferred that care managers handle CCNC data feeds. In the words of one physician, “the CCNC Informatics Center is incredible, but we are not going to use it in terms of daily workflow.” Another physician noted that providers would have accessed CCNC data more often if the CCNC systems had been integrated with local electronic health records (EHRs), as physicians had to log off their internal systems to log in to the Provider Portal. On the other hand, one physician reported that the Provider Portal had been “invaluable” for feedback and communication purposes.
2.3 Provider and Beneficiary Participation
2.3.1 Provider Participation
According to NC-CCN, the opportunities for quality improvement and for financial bonuses (if Medicare savings were achieved) were two of the main factors that motivated providers to participate in the MHCQ demonstration. Providers indicated to NC-CCN that improving the quality of services for dually eligible patients was the most appealing aspect of MHCQ participation. Staff at one network noted that local providers had voiced interest in working with the demonstration population because of their high needs. One network noted that access to Medicare data, which were not previously available, also encouraged providers to participate. However, several providers interviewed were unable to distinguish their participation in the MHCQ demonstration from their involvement in multiple network initiatives.
Several physicians reported to the evaluation team that physician leadership at the network level was “extremely important” and drove community physician buy-in for the MHCQ demonstration. Most providers had communicated with the network medical leadership or other NC-CCN physician leaders when deciding to join the demonstration. NC-CCN continued to send its medical leadership staff to networks and practices throughout the demonstration to
21
maintain lines of “doctor-to-doctor” communication and an overall environment of peer-driven change in care delivery.
Providers agreed in comments to the evaluation team that support from CCNC and their network was beneficial to their dually eligible patient populations. MHCQ providers affiliated with CCNC prior to the demonstration noted that CCNC services were mostly focused on Medicaid patients. One provider explained that a care gap for dual eligibles had been filled by the expansion of CCNC care management, clinical pharmacy, and social work services for dually eligible patients for the MHCQ demonstration: “We already saw patients with Medicare primary insurance, and they didn’t get the services that primary Medicaid population got. We always felt these people really need the case management and intensive care.”
Staff at one network reported to the evaluation team that their providers were awaiting news on Medicare savings in PY1 and PY2, because “they all work really hard and really hope to see something.” NC-CCN staff held a meeting with the networks’ leadership to discuss how they would communicate to physicians that no Medicare savings had been achieved. Staff from several networks voiced disappointment in comments to the evaluation team in being unable to announce savings to providers and pay providers bonus payment from demonstration savings for pursuing better care for a difficult patient population. At the same time, several providers interviewed were unaware that shared savings originally had been proposed in the MHCQ demonstration model. One physician reported that he received extra per-member-per-month payments for patients because he had been accredited as a patient-centered medical home through the National Committee for Quality Assurance. He indicated that he would have preferred that the MHCQ demonstration also provided incentives for quality improvements in advance, rather than having to wait until overall savings occurred.
The quantitative analysis for provider and beneficiary participation includes descriptive statistics from Medicare claims and enrollment data to provide profiles of the NC-CCN MHCQ demonstration providers and assigned beneficiaries. This NC-CCN MHCQ Demonstration Year 3 evaluation report includes data on the NC-CCN Pre-BY that covered January–December 2008; BY that covered January–December 2009; PY1 that included January–December 2010; PY2 that covered January–December 2011; and PY3 that covered January–December 2012.
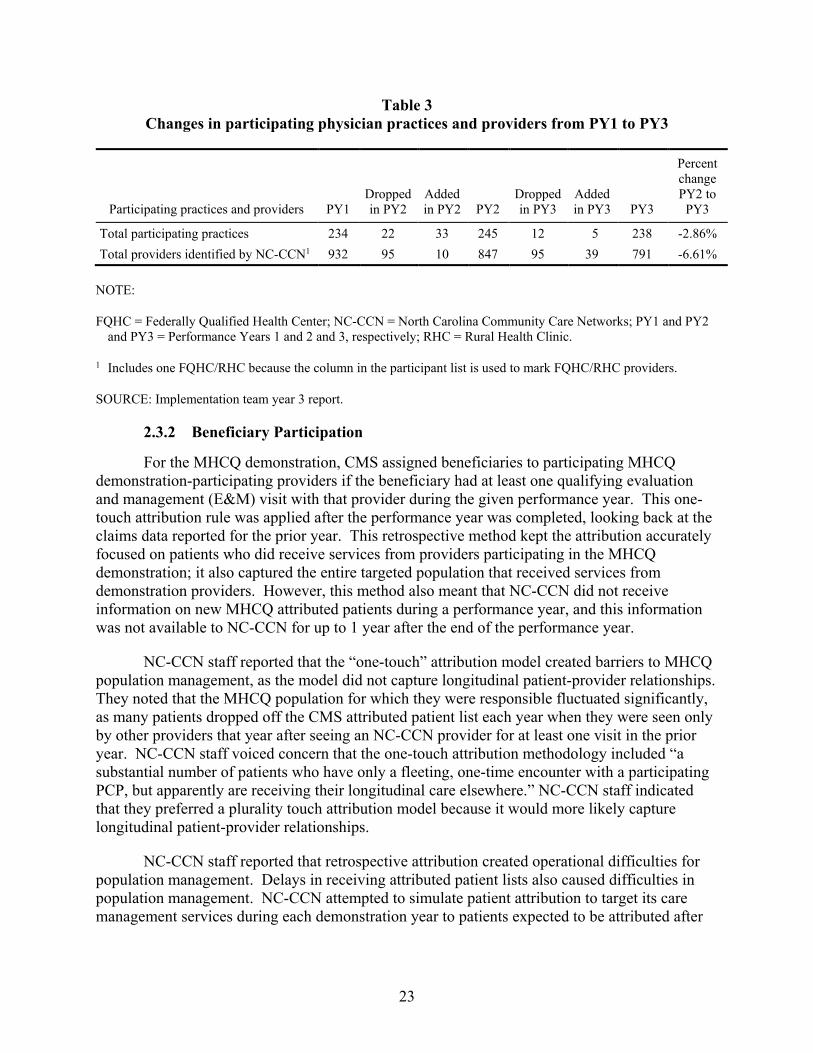
Table 3 presents data on changes in provider participation from PY1 to PY3. Table 3 shows that the number of MHCQ demonstration participating practices increased by 5 percent from PY1 to PY2, with 33 new practices joining the demonstration and 22 leaving the demonstration. However, at the same time, the number of participating providers fell by 9 percent, with 95 providers leaving the demonstration and only 10 joining the demonstration during that period. From PY2 to PY3, the number of practices fell by 3 percent and the number of participating providers fell by 7 percent, with 95 providers leaving the demonstration and only 39 joining. In PY3, the NC-CCN had 791 providers participating, which was down from 932 participating in PY1.
22
Table 3 Changes in participating physician practices and providers from PY1 to PY3
Participating practices and providers PY1 Dropped in PY2
Added in PY2 PY2
Dropped in PY3
Added in PY3 PY3
Percent change PY2 to
PY3
Total participating practices 234 22 33 245 12 5 238 -2.86% Total providers identified by NC-CCN1 932 95 10 847 95 39 791 -6.61%
NOTE:
FQHC = Federally Qualified Health Center; NC-CCN = North Carolina Community Care Networks; PY1 and PY2 and PY3 = Performance Years 1 and 2 and 3, respectively; RHC = Rural Health Clinic.
1 Includes one FQHC/RHC because the column in the participant list is used to mark FQHC/RHC providers.
SOURCE: Implementation team year 3 report.
2.3.2 Beneficiary Participation
For the MHCQ demonstration, CMS assigned beneficiaries to participating MHCQ demonstration-participating providers if the beneficiary had at least one qualifying evaluation and management (E&M) visit with that provider during the given performance year. This one-touch attribution rule was applied after the performance year was completed, looking back at the claims data reported for the prior year. This retrospective method kept the attribution accurately focused on patients who did receive services from providers participating in the MHCQ demonstration; it also captured the entire targeted population that received services from demonstration providers. However, this method also meant that NC-CCN did not receive information on new MHCQ attributed patients during a performance year, and this information was not available to NC-CCN for up to 1 year after the end of the performance year.
NC-CCN staff reported that the “one-touch” attribution model created barriers to MHCQ population management, as the model did not capture longitudinal patient-provider relationships. They noted that the MHCQ population for which they were responsible fluctuated significantly, as many patients dropped off the CMS attributed patient list each year when they were seen only by other providers that year after seeing an NC-CCN provider for at least one visit in the prior year. NC-CCN staff voiced concern that the one-touch attribution methodology included “a substantial number of patients who have only a fleeting, one-time encounter with a participating PCP, but apparently are receiving their longitudinal care elsewhere.” NC-CCN staff indicated that they preferred a plurality touch attribution model because it would more likely capture longitudinal patient-provider relationships.
NC-CCN staff reported that retrospective attribution created operational difficulties for population management. Delays in receiving attributed patient lists also caused difficulties in population management. NC-CCN attempted to simulate patient attribution to target its care management services during each demonstration year to patients expected to be attributed after
23
the demonstration year in the retrospective process. However, the lists they generated from the simulation were not entirely accurate.
In addition, NC-CCN staff believed that it would have been useful for CMS to include information about the provider to which a patient had been attributed, although this need had not been identified in the original agreement between CMS and NC-CCN. NC-CCN had to determine the patient-provider association for each new MHCQ patient, which was challenging and time-consuming. For more than 10,000 patients in the September 2011 attributed patient file received from CMS, NC-CCN reported that it was unable to determine the attributed provider with Medicaid claims alone. NC-CCN informatics staff reported that, in PY3, CMS identified newly touched patients and sent NC-CCN an updated attribution list every quarter, but no provider information or claims history was included with those patients as had been requested.
Enrollment. NC-CCN staff reported that the North Carolina Division of Medical Assistance’s (NC DMA’s) policy of optional CCNC enrollment for dually eligible patients presented challenges to NC-CCN for engaging and managing MHCQ demonstration beneficiaries. With the NC DMA’s opt-out provision, some dually eligible patients either opted out from CCNC enrollment before their attribution to the MHCQ demonstration or chose to opt out when contacted by CCNC upon being attributed to the MHCQ demonstration. While the CCNC networks reached out to nonenrolled dually eligible patients, NC-CCN’s management of these beneficiaries was often limited by lack of patient interest, lack of sufficient data feeds to NC-CCN from the NC DMA for CCNC nonenrolled patients, or both. NC-CCN staff were also concerned that many dually eligible patients were relying on specialist care and were therefore very difficult to enroll into a CCNC primary care medical home regardless of whether they were attributed to the MHCQ demonstration.
In 2011, the NC DMA, NC Hospital Association, and CCNC networks partnered with NC-CCN to enroll as many eligible patients as possible into CCNC, which included dually eligible beneficiaries. One network reported to the evaluation team that they hired patient navigators to locally augment the CCNC enrollment project. Another network worked with staff from local social services departments to explain CCNC enrollment benefits to eligible patients. To overcome challenges with enrollment and attribution for the MHCQ demonstration, NC-CCN advised networks to direct their care managers, clinical pharmacists, and MHCQ providers to engage all dually eligible beneficiaries eligible for CCNC whom they encountered and encourage them to enroll.
Another population that NC-CCN had difficulty enrolling was beneficiaries residing in long-term care facilities. Although SNF residents cannot enroll in CCNC, several MHCQ networks targeted enrollment efforts at other types of long-term care facilities (such as group homes) to engage dually eligible beneficiaries for care management services. NC-CCN expected these efforts to help enrollment into CCNC for dually eligible beneficiaries in long-term care facilities to tackle the high ED and hospitalization rates for residents in those facilities.
NC-CCN staff indicated to the evaluation team that MHCQ-assigned beneficiaries who were enrolled with a CCNC practice were aware that they were linked to a medical home, but they had no knowledge of their provider’s participation in the MHCQ demonstration. NC-CCN staff emphasized the importance of patients choosing their medical homes (as opposed to being
24
assigned to them), as patients who chose their medical homes were much more receptive to its services, particularly to care management and clinical pharmacy. A physician also noted that patients in his practice were most receptive to care managers when it was clear that they worked with the patient’s primary care doctor.
NC-CCN and network staff reported to the evaluation team that medical home opt-out letters sent to dually eligible patients from the NC DMA caused “a lot of confusion about what it means and what patients need to do.” One network’s care managers became “inundated” with questions and concerns from potential enrollees, so they created the position of CCNC Benefits Advocate through the local department of social services to discuss and encourage CCNC enrollment.
NC-CCN informatics staff produced priority patient reports that identified more severely ill patients, and they assisted networks (particularly care managers) in allocating network and practice resources. Network staff reported to the evaluation team that these reports were very useful, but they also placed importance on provider referrals “because they see the patients and really know them.” One provider emphasized the importance of having other staff, such as care managers, available to discuss CCNC enrollment with patients identified in a clinical visit, as a doctor has little time to explain the benefits in depth to a patient. Care managers embedded in practices and hospitals also engaged some dually eligible patients, even if they were not on a high-risk list.
Care managers reported to the evaluation team that dually eligible patients were easier to engage than other patient populations, as they did not work and were more easily contacted during regular business hours. Care managers also reported that dually eligible patients were more willing to talk about their health care; they were open and trusting. In addition, because their health needs were complex, they welcomed additional help in managing their health.
Descriptive Statistics. Descriptive statistics for CMS-assigned NC-CCN beneficiaries are shown in Tables 4–6 on the following pages. Table 4 indicates that both the intervention group and comparison group had very large numbers of assigned beneficiaries for statistical analysis in the Base Year (BY) and PY3. In PY3, they totaled 49,482 for the intervention group and 103,854 for the comparison group. The comparison group is about two times the size of the intervention group, which adds statistical power for the multivariate statistical analysis of demonstration outcomes that is presented in the following sections.
Table 5 shows that about 55 percent of the CMS-assigned beneficiaries were age 65 or older and about 45 percent were younger than age 65 across all of the groups shown. About two-thirds of the beneficiaries were females. More than half of the CMS-assigned beneficiaries were eligible for Medicare because they were aged, and more than 42 percent were eligible for Medicare because of disability. These patterns were consistent across the BY, PYs, intervention group, and comparison group. They are also similar to the national demographic and Medicare eligibility patterns in the dually eligible Medicare population, which show that a similar percentage of national dually eligible beneficiaries are younger than age 65 (43 percent), although the national data show a slightly lower percentage of dually eligible beneficiaries who are females (61 percent) (MEDPAC, 2012).
25
Table 4 Beneficiary assignments and exclusions for the BY and PY3
Assignments and exclusions BY IG PY3 IG BY CG PY3 CG
1. Beneficiaries covered by Medicaid in the assignment period 313,846 339,654 161,276 181,052
2. Total beneficiaries excluded from assignment 71,809 83,152 40,368 53,820 3. Beneficiaries eligible for assignment
(line 1 − line 2) 242,037 256,502 120,908 127,232 4. Intervention group: Beneficiaries with a
qualifying patient visit with a participating provider at a participating practice1,2
41,906 47,827 — —
5. Intervention group: Beneficiaries with a qualifying patient visit with a participating provider at a nonparticipating practice
7. Comparison group: Beneficiaries eligible for assignment who were provided at least one office or other outpatient E&M service by a primary care provider3
— — 97,345 103,854
NOTES:
CG = comparison group; E&M = evaluation and management; IG = intervention group; MHCQ = Medicare Health Care Quality; NC-CCN = North Carolina Community Care Networks.
Base Year (BY): January 1–December 31, 2009.
Performance Year 3 (PY3): January 1–December 31, 2012. 1 Beneficiaries for specified practices, specified community health centers (CHCs), and beneficiaries with a
qualifying patient visit with participating Federally Qualified Health Centers (FQHCs) or Rural Health Clinics (RHCs) are selected regardless of location of practice.
2 Beneficiaries with a qualifying patient visit with a participating provider both at a participating practice and at a nonparticipating practice are included in this count.
3 Primary care providers include those in family medicine, general medicine, internal medicine, geriatric medicine, as well as physician assistants, nurse practitioners, and clinical nurse specialists who provide primary care services. Visits to FQHCs and RHCs are counted as one E&M visit.
SOURCE: RTI International analysis of October 2008–December 2012 100% Medicare claims files and enrollment datasets.
26
Table 5 CMS-assigned beneficiaries by demographics and disease subgroups, for the BY and PY3
and for the Intervention Group and Comparison Group
Measure BY IG PY3 IG BY CG PY3 CG Age (%)
Age < 65 43.7 45.3 45.6 47.7 Age 65–74 23.3 23.4 24.3 24.0 Age 75–84 20.4 19.1 19.2 17.9
Age 85+ 12.6 12.2 10.9 10.4 Gender (%)
Male 31.6 33.1 33.6 35.1 Female 68.4 66.9 66.4 64.9
CG = comparison group; CMS = Centers for Medicare & Medicaid Services; HCC = hierarchical condition category; IG = intervention group; NC-CCN = North Carolina Community Care Networks.
* Hierarchical condition category (HCC) risk scores represent the severity of illness. The average for the Medicare population, which is set by the HCC risk scoring methodology, is 1.0.
Base Year (BY): January 1–December 31, 2009.
Performance Year 3 (PY3): January 1–December 31, 2012.
PY2 numbers can be found on the CMS website at: http://innovation.cms.gov/initiatives/Medicare-Health-Care-Quality/
SOURCE: RTI International analysis of October 2008–December 2012 100% Medicare claims files and enrollment datasets.
Table 6 NC-CCN CMS-assigned beneficiaries by utilization and expenditures for the BY, PY1, and PY3 and for the Intervention
Group and Comparison Group
Measure Pre-BY
IG BY IG
PY1 IG
PY2 IG
PY3 IG
Pre-BY CG
BY CG
PY1 CG
PY 2 CG
PY 3 CG
Mean count of qualified office or other outpatient E&M visits per beneficiary1 10.04 10.37 8.90 11.00 10.90 9.50 9.70 7.40 10.10 10.24 Hospital admissions per 1,000 beneficiaries2 599 593 576 604 583 587 568 544 566 533 30-day readmission rate (% of beneficiaries) 17.89 18.39 19.00 18.20 18.89 17.70 18.30 18.70 18.40 17.85 Emergency department visits per 1,000 beneficiaries 1.48 1.53 1.60 1.60 1.60 1.40 1.40 1.40 1.50 1.50 Mean annualized Medicare expenditures per beneficiary per year3 $12,867 $13,734 $13,945 $14,633 $14,509 $12,182 $12,774 $13,020 $13,631 $13,492 Mean annualized Medicare expenditures per beneficiary per month3 $1,072 $1,145 $1,162 $1,219 $1,209 $1,015 $1,064 $1,085 $1,136 $1,124 Percent of beneficiaries with inpatient expenses (%) 30.9 30.7 30.0 30.7 29.6 29.9 29.0 28.0 28.3 27.0
NOTES: CG = comparison group; E&M = evaluation and management; IG = intervention group; MHCQ = Medicare Health Care Quality; NC-CCN = North Carolina
Community Care Networks.
Base Year (BY): January 1–December 31, 2009. Performance Year 1 (PY1): January 1–December 31, 2010. Performance Year 2 (PY2): January 1–December 31, 2011. 1 Qualified E&M visits are listed in §9.1 of the Protocol and are counted regardless of performing provider. Visits to Federally Qualified Health Centers
(FQHCs) and to Rural Health Clinics (RHCs) are counted as one E&M visit. 2 Refers to hospital admissions at any provider. 3 Annualized Medicare expenditures per beneficiary are calculated by dividing actual expenditures by the fraction of the year the beneficiary is alive, and are
capped at the weighted 99th percentile of the claims distribution for beneficiaries without end-stage renal disease (ESRD) and at the weighted 99th percentile of the national claims distribution for beneficiaries with ESRD.
SOURCE: RTI International analysis of October 2007–December 2012 100% Medicare claims files and enrollment datasets.
Table 5 also shows the mean risk scores for the upper 10 percent and upper 25 percent of the hierarchical condition category (HCC) risk score distribution among assigned beneficiaries. These mean scores illustrate how those groups have significantly higher severity of illness than the average for the Medicare population, which is set by the HCC risk scoring methodology at 1.0. As expected, the upper 10 percent group has a higher severity of illness (ranging from 6.8 to 7.3) than the upper 25 percent group (ranging from 4.4 to 4.8).
Table 5 also shows the percentages of assigned beneficiaries with chronic diseases of interest for the Medicare population—diseases that have high prevalence or high costs. NC-CCN-assigned beneficiaries included more than 36 percent with diabetes and more than 20 percent with COPD. Across the intervention and comparison groups, more than 17 percent had vascular disease, more than 17 percent had CHF, and more than 8 percent had cancer. As expected, these NC-CCN dually eligible beneficiaries had higher percentages of most of these chronic diseases than the overall national Medicare beneficiary population, which had 28 percent with diabetes, 12 percent with COPD, and 16 percent with CHF, although the national percentage with cancer was about the same at 8 percent (CMS, 2012). Notably, more than 64 percent of the assigned beneficiaries had at least one of the seven chronic diseases highlighted in Table 5, across both the intervention and comparison groups.
Table 6 presents descriptive statistics on utilization and expenditures for the assigned beneficiaries. It shows that beneficiaries in the intervention group had an average of about 9–11 office or other outpatient E&M visits per year, whereas members of the comparison group had a similar but slightly lower range of about 7–10 office or other outpatient E&M visits per year, on average. For the intervention group, the number of visits stayed flat from the Pre-BY through PY3, but increased slightly in the comparison group.
Hospital admissions were slightly higher in the intervention group ranging from 580–600 admissions per 1,000 beneficiaries, compared to a range of 530–590 for the comparison group. The pattern for 30-day readmissions showed little change over time for both the intervention group and comparison group. Emergency department visits per 1,000 beneficiaries increased slightly for both the intervention and comparison groups over time.
Table 6 also presents data on mean annualized Medicare expenditures per beneficiary. For this NC-CCN evaluation, Medicare expenditures are expressed as per-beneficiary-per-month (PBPM) expenditures or as per-beneficiary-per-year (PBPY) expenditures. Medicare expenditures include all Part A and Part B fee-for-service claims components (inpatient, skilled nursing, outpatient, physician/supplier, home health, durable medical equipment, and hospice). Part D expenditures for pharmaceutical expenses are not included because those claims data were not readily accessible for some of the time periods involved in this demonstration. PBPY expenditures in the baseline and annual performance periods are defined as the sum of Medicare expenditures for the eligible months in that period, and PBPM expenditures are the PBPY amounts divided by the number of eligible months in that period. Expenditures are presented as truncated (capped at the 99th percentile) in Table 6. Intervention group and comparison group observations are weighted by the beneficiary’s fraction of eligible months in the demonstration period.
29
On average, CMS-assigned beneficiaries in the intervention group had about $12,800–$14,500 in Medicare expenditures per year. For the comparison group, spending was slightly lower at about $12,200–$13,600 in Medicare expenditures per year. There is a general trend of increasing expenditures over time, which is consistent with the nationwide pattern of general medical care cost increases during this time period. However, these are descriptive data. The multivariate statistical analysis presented in the next section evaluates the impact of the NC-CCN MHCQ demonstration on costs in comparison to the comparison group and with statistical controls for a number of other factors that could affect costs.
Table 6 also shows the percentage of CMS-assigned beneficiaries who had any inpatient Medicare expenses. This figure is generally consistent across the intervention and comparison groups, ranging from 27.0 percent to 30.7 percent. For the intervention group, the percentage was generally flat from the Pre-BY through PY2.
2.4 Cost and Savings
NC-CCN originally planned to expand the MHCQ demonstration in PY3 to include Medicare-only beneficiaries. However, NC-CCN staff indicated to the evaluation team that they did not expand the demonstration to Medicare-only beneficiaries because the financial reconciliation results did not show cost savings for PY1 or PY2. NC-CCN thus continued to focus its MHCQ demonstration efforts on dually eligible beneficiaries through PY3.
A NC-CCN staff member voiced concerns to the evaluation team that the program’s care management interventions to improve quality metrics may not translate to Medicare cost savings in the immediate future, but they could lead to significant savings “in a few years.” NC-CCN staff reported that costs initially increased for dually eligible, non-dual Aged, Blind, Disabled (ABD), and Medicaid patients because they “were being brought under management and getting care they hadn’t been getting previously.” They anticipated that it required “6 months plus to see the curve turn” and show savings. One provider observed that certain dually eligible patients would never respond to interventions: “There are some patients that have gone to the point of ‘non-impactable’—and I won’t say that is a failure of the system, but the situation is so complex, that no matter what you do for those patients, you can’t change them. For example, patients with a huge dysfunctional family … [where] there are addictions, criminal issues around the patient.”
NC-CCN and network staff reported to the evaluation team that transitional care interventions to reduce hospital admissions and readmissions were the activities that they would focus on for reducing costs and showing savings. Leadership of one network reported that they were achieving most savings through pharmacy activities and enrollment efforts, as they “save a certain amount of money by simply enrolling patients and instituting routine programs to people who have been out of the system.” However, the network’s medical director observed that this “low-hanging fruit” of enrolling patients and adhering to prescription drug formularies was limited and that the next steps for savings would be “hard work.” In particular, he noted that improving late life care for patients’ last 3–6 months of life and documenting patient preferences could become important.
One network reported to the evaluation team that it was addressing costs by working with practices to assess patient needs before signing an order for services or equipment to be covered.
30
They would send a care manager into the home to determine if a patient already had the requested resource or if the patient had functional needs that affected two or three activities of daily living, before the patient’s doctor signed for medical necessity. Network staff observed that doctors had been getting stacks of such orders and signing them without knowing if there was a medical necessity. In addition to incurring unnecessary medical costs, the network explained that these resources might make an elderly person more dependent when the patient may simply need a tool (such as a grab bar in the shower) or a short period of physical therapy to help maintain independence. The network aimed to engage care managers in pursuing less costly routes to improve patient quality of life.
One physician asserted in comments to the evaluation team that provider coding was a barrier to achieving savings in PY1 because patients were more severely ill than demonstrated through coding: “We could code a diabetic patient with eye disease, kidney disease, and neuropathy. We would just code a 250.00 for diabetes without mention of complications.” The physician believed that MHCQ providers had been coding more completely since PY1, but that better coding from the beginning of the demonstration could have allowed MHCQ practices to demonstrate savings.
2.4.1 Savings Calculated for MHCQ Demonstration Performance Payments
To determine whether the NC-CCN MHCQ demonstration achieved Medicare savings and was eligible for a performance payment, CMS contracted with an implementation contractor (independent of the RTI evaluation contract) to calculate savings annually according to the terms and conditions in the demonstration protocol. The NC-CCN PY1, PY2, and PY3 financial reconciliation reports found that NC-CCN’s Medicare savings did not exceed the minimum savings requirement (MSR), so NC-CCN did not earn a performance payment from Medicare for PY1, PY2, or PY3 (Coomer et al., 2011; 2013; 2014).
For each PY, the potential award payment was based on the calculated savings to Medicare. To determine the savings to Medicare, an expenditure target was calculated for the intervention group using the expenditures of the intervention and comparison groups as well as adjustments for differences in demographics.2 To generate savings, NC-CCN had to underspend the target by a minimum amount (the MSR) that accounted for the amount of variation in Medicare expenditures. The PY3 financial reconciliation results were determined using a 3-year trend from the baseline (calendar year 2009) to PY3 (calendar year 2012). In PY3, the financial reconciliation report showed that NC-CCN was required to reduce per beneficiary per year (PBPY) spending to $273 below the spending target for that year to reach the MSR (Coomer et al, 2014). However, NC-CCN’s actual spending was found to be $50 PBPY above the spending target. As a result, the implementation contractor found that NC-CCN did not achieve the required savings and did not earn an MHCQ demonstration bonus payment from Medicare for PY3.
2 The demographic factors were established each year on the basis of age, sex, Medicaid eligibility, and aged, disabled, and ESRD Medicare entitlement status. See Coomer et al 2104 for more information on how the savings were calculated.
31
2.4.2 Impact of the NC-CCN MHCQ Demonstration on Cost Outcomes
The results of the multivariate analysis of the impact of the NC-CCN MHCQ demonstration intervention on an overall cost outcome measure are shown in Table 7. This table presents the impact of the NC-CCN demonstration on annualized Medicare expenditures per beneficiary. These multivariate regression analyses are conducted on beneficiaries weighted by propensity scores to balance the intervention and comparison populations. They also control for five other variables not shown in Table 7, including HCC risk score, age, gender, Medicare eligibility status, and race. Additional details of the multivariate analysis methodology are documented in the MHCQ Demonstration Evaluation Design Report (Trisolini et al., 2013).
While the unadjusted descriptive data on Table 6 show that overall costs per beneficiary per year rose for both the intervention group and comparison group over time, the multivariate evaluation analysis assessed whether the intervention group cost growth rate was lower than the comparison group cost growth rate, while also controlling statistically for other factors that may affect costs (HCC risk score, age, gender, Medicare eligibility status, and race) and for pre-base year trends in costs. The descriptive data in Table 6 show the raw spending amounts per year, unadjusted for other factors that can affect cost levels from year to year and between the intervention group and comparison group.
enrollment sensitivity test N 723,716 643,110 519,285 R2 0.6523 0.6545 0.6581 Demonstration effect coefficient1 −$189 −$251 −$568 Coefficient standard error2 $71 $83 $134 Coefficient statistical significance2 0.007** 0.002** 0.000***
NOTES:
CCNC = Community Care of North Carolina; MHCQ = Medicare Health Care Quality; NC-CCN = North Carolina Community Care Networks.
Dependent variable is Medicare annualized expenditures. The regression is estimated on pre-base year (pre-BY) to performance year 3 (PY3) data (January 2008–December 2012) for assigned and comparison group beneficiaries. The pre-BY and PY1 dummies are omitted to avoid collinearity. Regression is weighted by Medicare eligibility fraction and by beneficiary propensity scores.
1 Negative coefficients indicate cost savings, and positive coefficients indicate cost increases, on a per-person-per-year basis.
2 Statistical significance levels and coefficient standard errors are adjusted for beneficiary-level clustering. **Statistically significant at the < 1.0% level ***Statistically significant at the < 0.1% level
SOURCE: RTI International analysis of Medicare claims October 2007–December 2012.
32
Table 7 shows that for the main NC-CCN MHCQ demonstration effect per-capita costs rose $189 less in the intervention group compared to the comparison group, after adjusting for other factors that affect costs, and the effect was statistically significant at the 1 percent level. This decrease in cost growth represents a favorable effect of the NC-CCN MHCQ demonstration.
The MHCQ evaluation also included two sensitivity tests for the cost outcomes analysis. The first sensitivity test assessed whether Medicare savings would have occurred if beneficiaries were assigned on the basis of a plurality of touches with an NC-CCN practice, as opposed to the one-touch rule used for beneficiary assignment for NC-CCN in the MHCQ demonstration, a sensitivity analysis was conducted with the reassigned beneficiaries. A plurality assignment methodology similar to the methodologies used in the CMS Physician Group Practice Demonstration and in the Medicare Shared Savings Program Accountable Care Organization program was used with the NC-CCN MHCQ demonstration beneficiaries. Table 7 shows that for this sensitivity analysis per-capita cost growth for the intervention group was $251 less than that for the comparison group from the pre-BY through PY3, and the effect was statistically significant at more than the 1 percent level. This also represents a favorable effect of the NC-CCN MHCQ demonstration. The magnitude of savings and level of significance are somewhat higher for this plurality assignment sensitivity analysis versus the main demonstration results.
Table 7 also shows the results of a second sensitivity test, evaluating an alternate definition for the intervention group that included only beneficiaries who were both assigned to NC-CCN for the MHCQ demonstration and enrolled in CCNC’s Medicaid medical home program. Table 7 shows that for this sensitivity analysis per-capita cost growth for the intervention group was $568 less from the pre-BY through PY3 compared with the comparison group during the same time period, and the effect was statistically significant at the 0.1 percent level. This also represents a favorable effect of the NC-CCN MHCQ demonstration. The magnitude of savings and level of significance were higher for this second sensitivity analysis than for the plurality assignment sensitivity analysis and the main demonstration results. As described above, enrollment in CCNC is voluntary for dually eligible beneficiaries, so these results are for a subgroup of the main demonstration. Intervention group beneficiaries also enrolled in CCNC totaled 9,147 in the BY, 21,151 in PY1, 27,368 in PY2, and 25,484 in PY3. Propensity score analysis was conducted independently for this multivariate statistical analysis sensitivity test to balance this intervention group subgroup with the comparison group.
The MHCQ demonstration evaluation results show statistically significant decreases in cost growth for NC-CCN MHCQ demonstration for PY3 even though the financial reconciliation analysis showed no cost savings for PY3. There are three main differences between the methodologies for the MHCQ evaluation and the MHCQ financial reconciliation that should be noted when comparing the results. First, the evaluation methodology used of five years (pre-BY, BY, and PY1-PY3) of data while the financial reconciliation methodology used two years of data (BY and PY3). The intent of the evaluation methodology was to examine the changes in cost growth through a difference-in-difference approach which requires more years of data. The financial reconciliation examined whether costs were less than a target amount set for PY3 as specified in the demonstration protocol. Using two years of data for the financial reconciliation allowed for more timely calculation of savings than the regression methodology. Second, the evaluation methodology used multivariate statistical adjustments to control for factors that can
33
affect cost levels, while the financial reconciliation used an actuarial method that did not control for potential confounding variables. Third, the evaluation used propensity score weighting to balance beneficiary characteristics between the intervention group and comparison group. The financial reconciliation used a demographic factor calculated from a regression of expenditures on four control variables to balance potential demographic differences between the intervention group and comparison group.
In addition, it is important to note that both the MHCQ evaluation and the MHCQ financial reconciliation analyses only included analysis of Medicare expenditures. An analysis of Medicaid expenditures was not conducted because of the lags in Medicaid data availability and thus we cannot report on the impact of the NC-CCN demonstration on Medicaid expenditures.
Table 8 presents results for the multivariate regression analyses for the impact of the NC-CCN demonstration on cost by beneficiary subgroups. The statistical methods are the same as in Table 7 for the main NC-CCN MHCQ demonstration results. Table 8 shows that, when the impact of the demonstration on per-capita costs was analyzed by beneficiary subpopulations, a number of significant effects were found. Of the 13 subgroups analyzed, statistically significant intervention effects were found for 7 subgroups, including diabetes, any of seven chronic diseases, vascular disease, end-stage renal disease (ESRD), inpatients, beneficiaries in the upper 10% risk score subgroup, and beneficiaries in the upper 25% risk score subgroup. All of these effects were significant at the 1 percent level or better. Moreover, for each of these subgroups the costs declined for the intervention group compared with the comparison group, which are favorable effects of the NC-CCN MHCQ demonstration.
The size of the ESRD subgroup effect is notable, at $4,587 per beneficiary. These high levels of savings may be possible for ESRD beneficiaries since they have much higher average costs than the average costs for dually eligible beneficiaries overall.
Table 9 presents multivariate statistical analysis results for the impact of the NC-CCN demonstration intervention on costs by types of Medicare service and their associated Medicare claims data expenditure components. The statistical methods are the same as for the main NC-CCN MHCQ demonstration results shown in Table 7. Of the nine types of expenditure components analyzed, statistically significant intervention effects were found for five components: Inpatient, Outpatient Total, Outpatient Institutional, Part B Physician/Supplier, and Home Health. Costs declined for four of these expenditure components, representing favorable effects of the NC-CCN MHCQ demonstration. Costs increased for one of these expenditure components, Outpatient Institutional, representing an unfavorable effect of the NC-CCN MHCQ demonstration.
34
Table 8 Cost outcomes: Multivariate regression analysis results for analyses of subgroups of the
main NC-CCN demonstration population for per-capita expenditures
The dependent variable is Medicare annualized expenditures. The regression is estimated on pre-Base Year (pre-BY) to Performance Year 3 (PY3) data (January 2008–December 2012) for assigned and comparison group beneficiaries. Regression is weighted by Medicare eligibility fraction and propensity scores. 1 Negative coefficients indicate cost savings, and positive coefficients indicate cost increases, on a per-person-per-
year basis. 2 Statistical significance levels and coefficient standard errors are adjusted for beneficiary-level clustering.
*Statistically significant at the < 5% level. **Statistically significant at the < 1% level. ***Statistically significant at the < 0.1% level.
SOURCE: RTI International analysis of Medicare claims October 2007-December 2012.
Expenditure component1,2 Regression coefficient for demonstration effect
Total -189** Inpatient total -125 Inpatient -111* Inpatient skilled nursing facility -14 Outpatient total -96* Outpatient institutional 113*** Outpatient Part B physician/supplier -182*** Outpatient home health -30** Outpatient durable medical equipment -22 Hospice 24
NOTES: The dependent variable is Medicare annualized expenditures. The regression is estimated on pre-Base Year (pre-BY) to Performance Year 2 (PY3) data (January 2008–December 2012) for assigned and comparison group beneficiaries. The regression is weighted by Medicare eligibility fraction and propensity scores. 1 Negative coefficients indicate cost savings, and positive coefficients indicate cost increases, on a per-person-per-
year basis. 2 Statistical significance levels and coefficient standard errors are adjusted for beneficiary-level clustering.
*Statistically significant at the < 5% level. **Statistically significant at the < 1% level. ***Statisticallysignificant at the < 0.1% level.
SOURCE: RTI International analysis of Medicare claims October 2007–December 2012.
2.5 Quality
2.5.1 Quality Measures Reported by NC-CCN for the MHCQ Demonstration
NC-CCN staff reported that they implemented 5 new quality measures for the MHCQ demonstration in PY3 in addition to the 25 quality measures already established during the demonstration. NC-CCN reported that they had worked with network leadership throughout the demonstration to propose measures and seek the networks’ approval. One physician suggested to the evaluation team that NC-CCN should have proposed more “patient-centered” measures, rather than purely biological measures, to gauge quality of care.
Table 10 presents NC-CCN’s quality performance for the quality measures that it developed and reported for the MHCQ demonstration. These quality performance results were calculated for all beneficiaries attributed to the NC-CCN MHCQ demonstration by CMS. NC-CCN reported meeting targets for 24 of the 30 PY3 quality measures. NC-CCN also met benchmark “maximum” rates for 19 of the 30 PY3 quality measures. The benchmarks used for the NC-CCN MHCQ demonstration were developed from nationally recognized standards where available, including the National Committee for Quality Assurance (NCQA) Diabetes Recognition Program Performance Goals, the NCQA Heart Stroke Recognition Program, and the NCQA Medicaid 90th percentile. No nationally recognized benchmark standard was available
36
for 4 of the 30 measures. For those measures, the benchmark was set at a flat rate of 90 percent for claims-based measures (A1c testing, Left ventricular function assessment) or at a flat rate of 80 percent for chart-based measures (for ACE/ARB therapy for people with CHF, Beta Blocker Therapy for people with CHF).
quality performance in PY3 relative to targets and to benchmarks
Quality measure PY3 target
PY3 benchmark
PY3 performance
results
Met target?
(yes/no)
Met benchmark?
(yes/no)
Patient Safety: Medication reconciliation performed after hospital discharge 13 14 17.6 Yes Yes Patient Safety: Hospital discharges with transitional care management and support 33 36 41.4 Yes Yes
COPD: Smoking status and cessation advice 72 80 89.1 Yes Yes
NOTE: ACE = angiotensin-converting-enzyme; ARB = angiotensin II receptor blocker; BP = blood pressure; CHF = congestive heart failure; COPD = chronic obstructive pulmonary disease; IVD = ischemic vascular disease; LVF = left ventricular function; MHCQ = Medicare Health Care Quality; NC-CCN = North Carolina Community Care Networks.
*Lower numbers represent better performance†New quality measure for PY3
SOURCE: NC-CCN.
2.5.2 Multivariate Statistical Analysis of NC-CCN Quality Performance
Table 11 presents the results of the multivariate statistical analysis of the impact of the NC-CCN demonstration on five Medicare claims-based quality measures. These claims-based measures enable the analysis to assess NC-CCN’s quality performance in relation to the comparison group, since quality measure performance results can also be calculated for the comparison group using Medicare claims data.
These multivariate regression analyses use a logistic regression model because they have dependent variables that are binary (either 1 or 0 representing whether or not the beneficiary received the care indicated by the quality measure). These logistic regression analyses include control variables for HCC risk scores, age, gender, Medicaid status, Medicare eligibility status, and race. Further details on the statistical methods are included in the MHCQ Demonstration Evaluation Design Report (Trisolini et al., 2013).
The results in Table 11 show that demonstration effects were statistically significant for one quality measure, testing or treatment for nephropathy for diabetics. The negative coefficient (less than zero) indicates that there was a lower probability of receiving the indicated care for the intervention group than for the comparison group, which is an unfavorable impact of the NC-CCN demonstration on quality of care for this measure. The results for the other four quality measures shown in Table 11 were not statistically significant, indicating no impact of the NC-CCN demonstration on quality of care for those measures.
38
Table 11 Demonstration impact on quality outcomes—multivariate regression results for five
claims-based quality measures for the main NC-CCN demonstration population
Glycated hemoglobin testing once per year for diabetics 0.01 Low-density lipoprotein testing once per year for diabetics 0.05 Testing or treatment for nephropathy for diabetics −0.08** Lipid profile testing once per year for beneficiaries with coronary artery disease 0.05 Left ventricular ejection fraction testing if hospitalized for heart failure −0.13
NOTES:
The regression is estimated on pre-base year (pre-BY) to Performance Year 3 (PY3) data (January 2008–December 2012) for intervention group (IG) and comparison group (CG) beneficiaries. 1 The dependent variable for each logistic regression analysis is a binary indicator for achieving a quality measure.
Coefficients > 0 indicate higher quality of care, and coefficients < 0 indicate lower quality of care. 2 The regression analyses are weighted by Medicare eligibility fraction and by beneficiary propensity scores. 3 Statistical significance levels and coefficient standard errors are adjusted for beneficiary-level clustering.
** Statistically significant at the <1% level.
SOURCE: RTI International analysis of Medicare claims October 2007–December 2012.
Measures assessing utilization indicators are included in the next section. Some of these, such as readmissions, are sometimes also viewed as quality measures since they reflect the impact of quality of care on utilization.
2.6 Utilization
NC-CCN staff reported to the evaluation team that they did not analyze overall changes in utilization of health care services for the MHCQ demonstration beneficiaries. However, some networks and practices did focus some program interventions on patients with high utilization rates. In addition, in November 2011, NC-CCN pilot tested a call center in two networks as part of efforts to reduce nonemergent ED utilization among CCNC-enrolled patients, and the project was expanded to include CCNC-enrolled patients from all 14 CCNC networks in February 2012. Using ADT system feeds from hospitals that had agreed to share data with NC-CCN, staff called enrolled patients who had recently had nonemergent visits to the ED to educate them about their medical home and ask follow up questions, such as what did the ED tell them and what prescriptions did they have filled.
The call center emphasized the importance of the medical home and was able to send a secure message to the patient’s care manager about any needs identified during the call. NC-CCN staff reported a 45 percent decrease in the per-member-per-month ED admission rate, a 37 percent decrease in nonemergent ED visits, and a 33 percent cost reduction among patients who were contacted through the call center across the 14 networks.
To tackle avoidable readmissions during PY2 and PY3, one network reported to the evaluation team that it began collaborating with the Carolinas Center for Medical Excellence and other local organizations. They performed a root cause analysis for a large regional hospital
39
serving two MHCQ counties to formulate a community plan for addressing drivers of readmission. The network then expanded their efforts to prevent readmissions in non-MHCQ counties.
Furthermore, one network and a large PCP practice focused on transitions and advance care planning with MHCQ patients in up to 12 facilities within the network’s geographic region. Both care managers and clinical pharmacists from the network provided on-site services to patients who were residents in the facilities. The network and practice also initiated quarterly long-term care community meetings that included representatives from a major local hospital and aging organizations to identify and solve transitions of care problems.
Another network reported to the evaluation team that they had started an initiative with willing physicians from a subset of practices to provide monthly on-site medical visits in local long-term care facilities. The initiative began as part of the MHCQ demonstration and served a large number of the network’s dually eligible patients. CCNC care managers assigned to the facilities followed up with site administrators and residents every 2 weeks or as needed. The initiative focused on keeping residents out of the ED and inpatient hospital setting. Those who had been admitted were followed up within 72 hours of returning to their long-term care facility.
A third network reported to the evaluation team that they dedicated two social workers to coordinating transitions for patients admitted to the hospital with a primary diagnosis of behavioral health. They followed up after 30 days to check that the patients were connected to a PCP and had not had a readmission.
Table 12 presents multivariate regression analysis results for utilization outcomes for the NC-CCN MHCQ demonstration, including measures for hospital admissions, ED visits, and 30-day readmissions. These results show that the demonstration effects were statistically significant at the 1 percent level for hospital admission for the predicted number of utilization events, for ED visits for both the predicted number of utilization events and the overall demonstration effect on utilization, and for 30-day readmissions for the predicted number of utilization events. Of these four significant effects, three were negative, indicating that the demonstration resulted in reductions for the predicted number of hospital admissions, the predicted number of ED visits, and the overall demonstration effect for ED visits. These reductions in utilization represent favorable impacts of the demonstration for these utilization outcomes. However, there was an increase in the predicted number of readmissions, an unfavorable effect.
The percentage changes included in Table 12 are associated with the effect coefficients, and they translate those coefficients from nonlinear statistical models into estimated percentage effect sizes. For example, the estimated effect size for the overall reduction in ED visits is −2.18 percent.
40
Table 12 Utilization outcomes: Summary of statistical analysis results for hospital admissions,
emergency department visits, and 30-day readmissions
Measure Hospital
admissions
Emergency department
visits 30-day
readmissions
Predicted probability of a utilization event occurring1 0.0048 −0.0035 −0.0002 Predicted number of utilization events2 −0.0125** −0.0600** 0.03257** Overall demonstration effect on utilization3 −0.0028 −0.0542** 0.0096 Estimated percent change in predicted probability of utilization event occurring
1.57 −0.66 −0.09
Estimated percent change in predicted number of utilization events
−0.4952 −1.7059 2.2681
Estimated percent change from overall demonstration effect on utilization
−0.18 −2.1765 2.89
NOTES: ** Statistically significant at the <1% level. 1 Logit regression models were used to calculate the predicted probability of utilization binary events (yes/no event)
occurring, such as whether or not a beneficiary had at least one hospital admission per year. 2 Negative binomial regression models were used to predict the number of times a utilization event occurs. These
models, which were estimated on beneficiaries who had at least one occurrence of the utilization event (such as beneficiaries with at least one hospital admission), predict the number of admissions among beneficiaries who had at least one admission.
3 Combined hurdle regression models were used to analyze the joint effects of two separate processes generating the utilization outcomes. These include one process generating whether or not a beneficiary experienced an event, and another process that generates the number of events the beneficiary experienced given that the beneficiary had at least one event. The combined hurdle models combine the information from the logit models and the negative binomial models to calculate the overall effect of the demonstration on the utilization outcomes.
SOURCE: RTI International analysis of Medicare claims October 2007–December 2012.
41
[This page intentionally left blank.]
42
SECTION 3 LESSONS LEARNED AND IMPLICATIONS FOR FUTURE PROGRAMS
A variety of lessons learned and implications for future programs can be gleaned from the results of the NC-CCN MHCQ demonstration across its 3 performance years.
The cost impact of the demonstration in PY3 was statistically significant with a reduction in cost growth found overall for the main NC-CCN MHCQ demonstration. Significant savings were also found for two sensitivity analyses, including one using a plurality attribution rule, and a second using the subset of beneficiaries who were both assigned by CMS to NC-CCN for the MHCQ demonstration and also enrolled in CCNC. The high levels of statistical significance for these cost savings effects, all at the 1 percent level or better, were also notable.
These results were stronger than the results in PY2, where reductions in cost growth were also found for the main effect and the two sensitivity tests, but with lower levels of savings and weaker levels of statistical significance (below the 10 percent level but not below the 5 percent level) for the main effect and for the sensitivity test using the plurality attribution rule. This indicates that the impact on Medicare cost growth due to the demonstration increased over time for the NC-CCN MHCQ demonstration. However, despite the significantly decreased cost growth over time, the NC-CCN demonstration was not able to reduce costs enough to achieve the minimum savings requirement necessary to qualify for a shared savings payment as determined by the financial reconciliation process specified in the demonstration protocol, which was independent from the evaluation.
There were three main differences between the methodologies for the MHCQ evaluation and the MHCQ financial reconciliation that should be noted when comparing the results. First, the evaluation methodology used of five years (pre-BY, BY, and PY1-PY3) of data while the financial reconciliation methodology used two years of data (BY and PY3), which allowed for more timely savings calculation. The intent of the evaluation methodology was to examine the changes in cost growth through a difference-in-difference approach which required more years of data. The financial reconciliation examined whether costs were less than a target amount set for PY3. Second, the evaluation methodology used multivariate statistical adjustments to control for factors that can affect cost levels, while the financial reconciliation used an actuarial method that did not control for potential confounding variables. Third, the evaluation used propensity score weighting to balance beneficiary characteristics between the intervention group and comparison group. The financial reconciliation used a demographic factor calculated from a regression of expenditures on four control variables to balance potential demographic differences between the intervention group and comparison group.
It is important to note that the evaluation and the financial reconciliation analyzed Medicare expenditures only and not Medicaid expenditures due to lags in Medicaid data availability. So, any impact of the NC-CCN demonstration on Medicaid expenditures is not known.
The multivariate statistical analysis of quality impacts of the NC-CCN demonstration for PY3, in comparison to the comparison group quality performance, found a statistically significant but unfavorable impact for one of the five claims-based quality measures, for testing
43
or treatment of nephropathy for diabetics. No significant impacts were found for the other four claims-based quality measures. These PY3 results were similar to the PY2 results that also found a statistically significant effect for only one of the five claims-based quality measures, that was also an unfavorable effect. However, in PY2 the significant effect was for a different quality measure, for lipid profile testing once per year for beneficiaries with coronary artery disease.
In contrast, NC-CCN’s self-reported quality measures for the MHCQ demonstration, which were assessed for the intervention group against targets agreed upon with CMS and not against a comparison group, showed good results with the targets met for 24 of the 30 quality measures. Most of the targets were set using national benchmarks for those quality measures, but these intervention group-only results do not indicate whether or not the same results were achieved by the comparison group in the absence of the NC-CCN MHCQ demonstration interventions.
The multivariate analysis of utilization impacts of the NC-CCN MHCQ demonstration for PY3, in comparison to the comparison group utilization performance, found statistically significant utilization effects for one or more measures for all three utilization outcomes, including hospital admissions, ED visits, and 30-day readmissions. Three of the significant effects were for reductions in utilization, and thus represent favorable impacts of the NC-CCN MHCQ demonstration. However, the effect for 30-day readmissions was for an increase in utilization. These PY3 utilization outcome analysis results showed more statistically significant effects than the PY2 results, where only two significant effects were found for ED measures, with both for reductions in utilization.
In sum, several lessons were learned from the multivariate statistical analysis of NC-CCN MHCQ demonstration impacts on cost, quality, and utilization. The key points are as follows:
• As predicted by NC-CCN, reducing Medicare cost growth using the medical home intervention implemented by NC-CCN took time. With each performance year, the level of savings increased but did not become statistically significant until PY3. Demonstrations covering longer time periods may be beneficial, especially for populations that are complex and require sustained interventions over time, such as dual-eligibles, to produce significant savings.
• High cost and high utilization beneficiary subgroups were found to have significant cost savings in this NC-CCN demonstration, including beneficiaries with the higher HCC scores, any of 7 chronic diseases, and ESRD.
• Future CMS demonstration projects should expand the number of quality measures evaluated against comparison groups, and rely less on quality measures evaluated against targets assessed only for the intervention group. While the site-reported measures showed improvement in quality of care over time, the evaluation analysis using claims and a comparison group found that the NC-CCN intervention did not improve quality for the 5 measures examined.
44
• Despite increases in 30-day readmissions, reductions in emergency department visits and hospitalizations were consistent with the cost savings and represent some of the ways in which NC-CCN achieved its cost savings.
Qualitative analysis and descriptive statistics for the NC-CCN MHCQ demonstration also provide a number of lessons learned and implications for future programs. Educating more providers about the demonstration may have been beneficial, as providers interviewed by the evaluation team generally indicated a lack of awareness about the demonstration unless they had leadership roles in CCNC networks or in NC-CCN. Most physicians did not distinguish MHCQ demonstration activities from the other services provided to them through CCNC network affiliation.
One concern found in the site visits was that NC-CCN seemed to be recycling the existing CCNC interventions with few additional resources devoted to dually eligible beneficiaries due to limited funding or to hopes that they could demonstrate savings under the MHCQ demonstration without much additional effort. Staff of one network explained that they were relying on Medicaid payments to fund their care managers, who were “stretched thin” in having expanded their services to include dually eligible beneficiaries in the MHCQ demonstration without additional funding to support the expansion in services. Site visit participants agreed that more investments in resources and infrastructure were needed at the beginning of the MHCQ demonstration. Future Medicare demonstration projects involving dually eligible beneficiaries should consider up-front incentive payments for defined care delivery interventions as one way to expand provider involvement and interventions, and test if this can increase the efficacy of the interventions for reducing costs and improving quality.
NC-CCN site-reported data included information on beneficiaries who received one or more types of NC-CCN non-Medicare and non-Medicaid services, but those data were found to be incomplete and recorded in inconsistent ways by different demonstration site staff, and thus not useful for evaluation purposes. NC-CCN staff indicated that those data were intended for internal operations purposes by care managers, and had not been intended for use in evaluation analysis. Future Medicare demonstration projects should consider ways to ensure that site-reported data collected on non-Medicare services that are not recorded in Medicare claims data are collected in a more systematic and comprehensive way so that they can be used for both internal operations purposes by demonstration site staff and evaluation purposes by CMS.
NC-CCN staff identified a number of challenges in implementing the MHCQ demonstration that should be considered in designing future CMS programs. They viewed data delays and attribution issues as barriers to demonstrating cost savings in the MHCQ demonstration. The NC-CCN MHCQ demonstration one-touch beneficiary attribution method was cited by NC-CCN staff as a barrier to achieving savings, as it did not identify longitudinal patient-provider relationships and created significant turnover in the beneficiary population attributed to NC-CCN from year to year. NC-CCN informatics staff reported that having technical assistance from CMS to better understand Medicare data would have helped to resolve some of the data issues they encountered early in the demonstration. NC-CCN staff also indicated that not getting Part D data was a problem for the MHCQ demonstration because medication fill history information adds a lot of value in managing patients.
45
[This page intentionally left blank.]
46
REFERENCES
Coomer, N., Adamache, W., Patterson, L., et al.: North Carolina Community Care Networks: Health Care Quality 646 Demonstration Performance Year One Financial Results. Research Triangle Park, N.C. RTI International, 2011.
Coomer, N., Patterson, L., Smith K., et al.: North Carolina Community Care Networks: Health Care Quality 646 Demonstration Performance Year Two Financial Results. Research Triangle Park, N.C. RTI International, 2013.
Coomer, N., Patterson, L., Smith K., et al.: North Carolina Community Care Networks: Health Care Quality 646 Demonstration Performance Year Three Financial Results. Research Triangle Park, N.C. RTI International, 2014.
MEDPAC. A Data Book: Health Care Spending and the Medicare Program. Washington, D.C. Medicare Payment Advisory Commission, 2012.
Sorensen, A., Bernard, S., Tant, E., et al.: Medicare Health Care Quality Demonstration: North Carolina Community Care Network Case Study Report. Prepared for the Centers for Medicare & Medicaid Services. Research Triangle Park, N.C. RTI International, 2010.
Trisolini, M., Kautter, J., Sorensen, A., et al.: Medicare Health Care Quality Demonstration Evaluation: Evaluation Design Report Year 2. Prepared for the Centers for Medicare & Medicaid Services. Research Triangle Park, N.C. RTI International, 2013.