31
Medium and Long Term Natural Gas Outlook – CEDIGAZ – February 2015
Medium and Long Term Natural Gas Outlook – CEDIGAZ – February 2015

Medium and Long Term Natural Gas Outlook – CEDIGAZ – February 2015
Global growth rates – Macroeconomic indicators CEDIGAZ Reference Scenario
%/year Main consuming markets - %/year (2013-2035)
-3
-2
-1
0
1
2
3
4
GDP Population Energyintensity
Energydemand
Natural gasdemand
1990 - 2013 2013 - 2035
• Despite notable advances in energy efficiency, both rising populations and expanding economies will result in a sustained growth in global energy demand in the long-term, estimated at 1.3%/year. But an acceleration in energy efficiency gains will lead to slower energy growth than in the previous decade.
-4
-2
0
2
4
6
Europe UnitedStates
OECD Asia China Other non-OECD Asia
MiddleEast
Energy intensity
Real GDP
Population
Energy demand
Natural gas demand
Source: CEDIGAZ, IEA, EIA, IMF, World Bank

Medium and Long Term Natural Gas Outlook – CEDIGAZ – February 2015
International energy prices CEDIGAZ Reference Scenario
Source: CEDIGAZ
2013 2020 2035
United States
Henry Hub ($/MBtu) 3.8 5.5 7.1
Europe
Spot ($/MBtu) 10.6 10.5 12.1
Average ($/MBtu) 11.8 11 12.5
% Spot-indexed 55 75 90
CO2 – EUA ($/tonne) 6 10.5 75
Coal - CIF ARA ($/tonne) 80 100 115
Japan
Average ($/MBtu) 16 14 14.7
% Spot-indexed 11 35 65
Brent ($/bbl) 109 110 130
2013 prices

Medium and Long Term Natural Gas Outlook – CEDIGAZ – February 2015
CEDIGAZ Reference Scenario: Main results
• World natural gas demand is expected to grow by 1.8%/year over 2013- 2035. Asia-Oceania explains 42% of the incremental demand (China: 28%), followed by the Middle East (24%).
• Natural gas share in world primary energy supply is projected to increase from an estimated 21.3% in 2013 to 23.6% in 2035 to the detriment of other fossil fuels.
• Although the expansion of gas demand is spread across all of the main consuming sectors, gas-fired power generation remains the largest contributor to growth.
• Natural gas production is growing everywhere, with the exception of Europe (-2.1%/year). The largest regional production gains are expected in Asia Oceania, the Middle East and North America.
• Shale gas will provide one third of the incremental natural gas supply by 2035.
• In the US, shale gas production will account for 56% of national output by 2035, versus 44% in 2013.
• Net inter-regional trade is forecast to grow by 3.1%/year to 821 bcm by 2035. The CIS will record the largest volumetric growth in net exports (+ 191 bcm).
• The share of LNG in net inter-regional flows will increase from 46% in 2013 to 50% in 2035.
• The international LNG market is expected to tighten after 2020.
• The price differentials between the US, Europe and Japan will narrow in a context of globalization of gas markets via a strong expansion of the LNG trade (flexible LNG).

Medium and Long Term Natural Gas Outlook – CEDIGAZ – February 2015
Regional natural gas demand prospects
2013 2020 2035 %/year 2013-35
NORTH AMERICA 889 953 1104 1.0%
of which : US 724 757 850 0.7%
LATIN AMERICA 159 188 245 2.0%
EUROPE 512 532 585 0.6%
of which:
Turkey 44 58 79 2.7%
Germany 93 91 95 0.1%
United Kingdom 74 78 80 0.4%
CIS 610 627 690 0.6%
of which: Russia 435 440 470 0.4%
AFRICA 128 142 212 2.3%
MIDDLE EAST 433 576 807 2.9%
ASIA-OCEANIA 664 912 1334 3.2%
of which: China 169 355 615 6.1%
WORLD 3394 3930 4977 1.8%
Unit: Bcm

Medium and Long Term Natural Gas Outlook – CEDIGAZ – February 2015
Natural gas demand growth by region
0
200
400
600
800
1000
1200
1400Growth 2020-2035
Growth 2013-2020
2013
Asia-Oceania
27%
North America
22% Middle East
16%
CIS 14%
Europe 12%
Latin America
5%
Africa 4%
Asia-Oceania
19%
North America
26%
Middle East 13%
CIS 18%
Europe 15%
Latin America
5%
Africa 4%
2013
2035
• Two regions explain two-thirds of the incremental demand: - Asia-Oceania (42% ), of which China (28%) and India (5%) - The Middle East (24%)
Unit: Bcm
Medium and Long Term Natural Gas Outlook – CEDIGAZ – February 2015
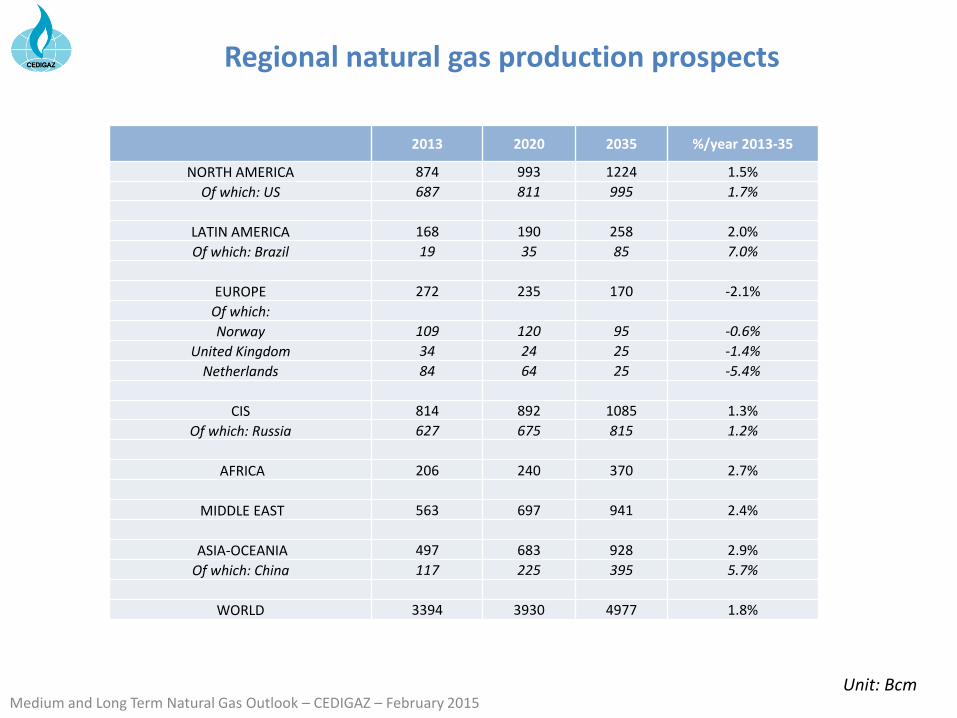
Regional natural gas production prospects
2013 2020 2035 %/year 2013-35
NORTH AMERICA 874 993 1224 1.5%
Of which: US 687 811 995 1.7%
LATIN AMERICA 168 190 258 2.0%
Of which: Brazil 19 35 85 7.0%
EUROPE 272 235 170 -2.1%
Of which:
Norway 109 120 95 -0.6%
United Kingdom 34 24 25 -1.4%
Netherlands 84 64 25 -5.4%
CIS 814 892 1085 1.3%
Of which: Russia 627 675 815 1.2%
AFRICA 206 240 370 2.7%
MIDDLE EAST 563 697 941 2.4%
ASIA-OCEANIA 497 683 928 2.9%
Of which: China 117 225 395 5.7%
WORLD 3394 3930 4977 1.8%
Unit: Bcm
Medium and Long Term Natural Gas Outlook – CEDIGAZ – February 2015
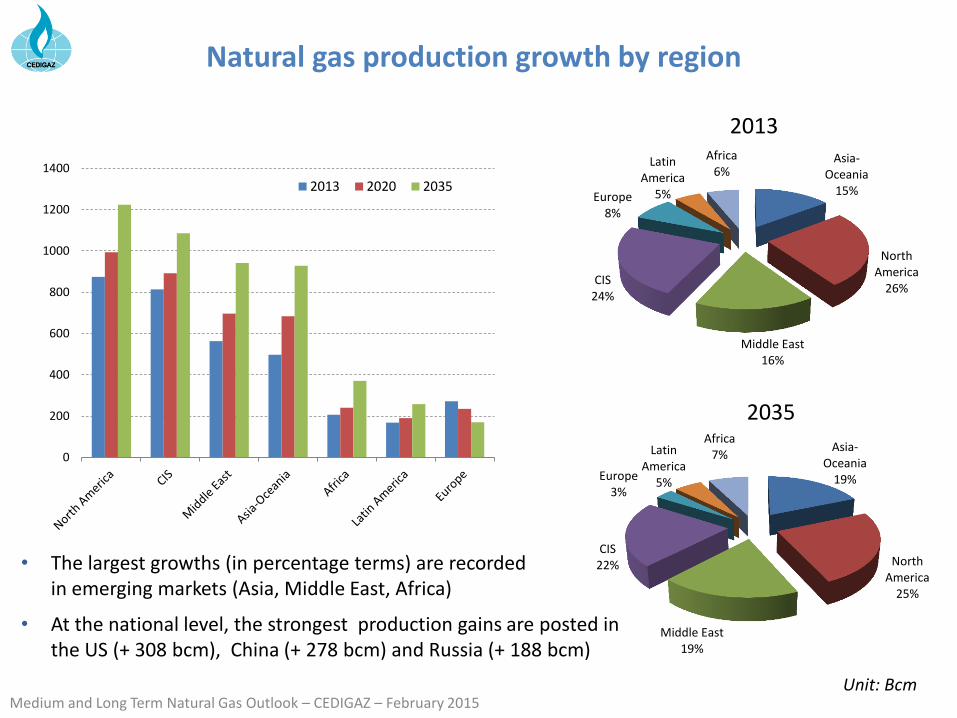
Natural gas production growth by region
0
200
400
600
800
1000
1200
1400
2013 2020 2035
Asia-Oceania
19%
North America
25%
Middle East 19%
CIS 22%
Europe 3%
Latin America
5%
Africa 7%
Asia-Oceania
15%
North America
26%
Middle East 16%
CIS 24%
Europe 8%
Latin America
5%
Africa 6%
2013
2035
• At the national level, the strongest production gains are posted in the US (+ 308 bcm), China (+ 278 bcm) and Russia (+ 188 bcm)
• The largest growths (in percentage terms) are recorded in emerging markets (Asia, Middle East, Africa)
Unit: Bcm

Medium and Long Term Natural Gas Outlook – CEDIGAZ – February 2015
The growing role of unconventional gas
0
1000
2000
3000
4000
5000
2013 2020 2035
Tight Gas
CBM
Shale gas
Conventional
Conventional 68%
CBM 6% Tight Gas
9%
North America 13%
Asia-Oceania 2%
Other 2%
Shale gas 17%
Global natural gas production - 2035 Global natural gas production prospects (Bcm)
The share of unconventional gas in global marketed production is expected to rise from 19% in 2013 to 32% in 2035

Medium and Long Term Natural Gas Outlook – CEDIGAZ – February 2015
0
100
200
300
400
500
600
700
NorthAmerica
UnitedStates
Canada Mexico
Growth 2020-2035
Growth 2013-2020
2013
0
10
20
30
40
50
60
NorthAmerica
UnitedStates
Canada
Growth 2020-2035
Growth 2013-2020
2013
Unconventional gas production prospects in North America
Shale gas CBM
Unit: Bcm
• North America will account for around 60% of the global incremental production of shale gas over 2013-2035 (US: 48%). In the long term, US shale gas production will pursue strong expansion, boosted by relatively high gas and oil prices (associated gas to oil and liquids-rich plays).
• Although the US currently dominate world CBM supply, national CBM production is set to flatten in the long term because of the maturity of resources.

Medium and Long Term Natural Gas Outlook – CEDIGAZ – February 2015
Shale gas production prospects outside North America
Regional prospects National prospects
0
10
20
30
40
50
60
70
80
90 Growth 2020-2035
Growth 2013-2020
2013
0
20
40
60
80
100
120
140 Growth 2020-2035
Growth 2013-2020
2013
• Outside North America, China largely leads the expansion of shale gas thanks to large resources, the implementation of appropriate measures and technological progress (growing productivity).
• 8000-10000 wells in aggregate are required by 2035 in China.
• China will not replicate the US shale gas revolution due to major challenges that remain (complex geology, high drilling costs, immature service and gas industry, scarcity of water, relocation of residents…).
Unit: Bcm

Medium and Long Term Natural Gas Outlook – CEDIGAZ – February 2015
CBM production prospects outside North America An Asian story
Unit: Bcm
Regional prospects National prospects
0
20
40
60
80
100
120
Australia China India Russia Others
Growth 2020-2035
Growth 2013-2020
2013
• CBM production in the Asian region is expected to grow from 13 bcm in 2013 to 208 bcm in 2035, with Australia expected to contribute for half of this total, followed by China (36%).
0
50
100
150
200
250
AsiaOceania
CIS Europe Africa
Growth 2020-2035
Growth 2013-2020
2013

Medium and Long Term Natural Gas Outlook – CEDIGAZ – February 2015
Prospects for net inter-regional natural gas trade
-450
-350
-250
-150
-50
50
150
250
350
450
2013 2020 2035 2013 2020 2035
Europe 240 297 415
Asia-Oceania 167 229 406
North America 14 -40 -120
Latin America -9 -2 -13
CIS -204 -265 -395
Africa -78 -98 -158
Middle East -130 -120 -134
WORLD 421 526 821
Total trade for the seven CEDIGAZ regions, not including trade within CEDIGAZ regions.
Notes: Positive numbers denote net imports, negative numbers net exports.
Unit: Bcm

Medium and Long Term Natural Gas Outlook – CEDIGAZ – February 2015
Main future trends: NORTH AMERICA 2013-2035
• Robust economic growth (+ 2.2%/year) and of the attendant energy (+ 0.5%/year) and electricity demand (+ 1%/year).
• The share of natural gas in the energy demand is expected to increase slightly from 27.5% to 29%.
• Natural gas demand is projected to grow by 1%/year over the projection period (+ 0.7%/year in the US).
• Natural gas consumption is driven by the industrial and power generation sectors.
• In the US, natural gas is the fastest-growing fossil fuel. It will make a growing contribution to the power generation mix, coupled with the growth of renewables.
• Reversely, coal and nuclear expand more slowly (retirements of 50 GW of coal-fired generating capacity by 2020).
• In the US, natural gas use in the transport sector is expected to rise by more than 10%/year.
• The region is turning from an importing to an exporting province. Net exports will account for 10% of regional production by 2035.
• As US imports from Canada are falling, the US will become a net pipeline gas exporter by 2020.
• Because of the fast-growing demand in Mexico (+2.5%/year), the US will considerably increase pipeline gas exports to this neighbouring country.

Medium and Long Term Natural Gas Outlook – CEDIGAZ – February 2015
North America’s natural gas supply prospects
0
200
400
600
800
1000
Canada US Mexico
0
100
200
300
400
500
600
700
800
900
Canada US Others
-100
-80
-60
-40
-20
0
20
Canada US Others
Production Consumption Net LNG trade: exports (-), imports (+)
• In the US, the rise of both domestic demand and LNG export commitments will be followed by an increase in the Henry Hub price from $3.8/MBtu in 2013 to $7.1/MBtu in 2035.
Unit: Bcm
2013 2020 2035

Medium and Long Term Natural Gas Outlook – CEDIGAZ – February 2015
Main future trends: EUROPE 2013-2035
• The GDP per capita is expected to grow by 1.6%/year by 2035. However, economic growth is offset by growing energy efficiency in the industrial sector.
• A very slow increasing electricity demand.
• Despite the fast expansion of renewables (approaching a 27% share of the energy mix by 2035), the share of natural gas in energy demand increases after 2020 to reach 27% by 2035 (24% in 2013), while coal share will decline.
• In the medium term, natural gas consumption is mainly driven up by the residential-commercial and industrial sectors in Turkey and Southern Europe.
• In western Europe, only the UK should post an increase in gas use for power generation by 2020 (environmental regulation).
• Natural gas in the power sector will return to growth after 2020 (impacts of LCPD/IED, nuclear phase out, coal plants closures and retirements), backing up renewables.
• Natural gas remains competed by coal until 2020. In the longer term, natural gas-fired power generation costs will tend to equalize those of coal in a context of rising CO2 price.
• Natural gas consumption in the transport sector (CNG along with LNG for heavy goods vehicles and shipping) is expected to grow sixfold by 2035. It will remain concentrated in a few countries (Italy Germany), as policy intervention is needed for this market to really take off across Europe.

Medium and Long Term Natural Gas Outlook – CEDIGAZ – February 2015
European natural gas demand prospects
0
20
40
60
80
100
120
140
2013 2020 2035
0
50
100
150
200
250
Growth 2020-2035
Growth 2013-2020
2013
• The expected growth in the residential-commercial and industrial sectors will mainly come from Turkey and Southern Europe.
• Turkey is expected to become the third largest gas market in 2035.
• Potential for significant development of highly-flexible gas-fired power plants after 2020.
Unit: Bcm

Medium and Long Term Natural Gas Outlook – CEDIGAZ – February 2015
European natural gas supply prospects
0
100
200
300
400
500
600
2013 2020 2035
LNG
Other (pipeline)
Africa (pipeline)
Central Asia (pipeline)
Russia (pipeline)
Unconventional production
Conventional production
• External dependence 2013: 47% 2020: 56% 2035: 71%
• Share of LNG (% of supply) 2013: 8% 2020: 13% 2035: 23%
• Share of unconventional gas (% of supply) 2013: 0.2% 2020: 1.1% 2035: 6.8%
• Strong competition between LNG and Russian pipeline gas.
• LNG will play a growing role to enhance diversification, flexibility and security of gas supply.
• Unconventional gas will be not sufficient to compensate for the decline of conventional production.
Unit: Bcm

Medium and Long Term Natural Gas Outlook – CEDIGAZ – February 2015
Main future trends: ASIA-OCEANIA 2013-2035
• Strong economic growth (+ 5.6%/year in emerging markets) and rapid expansion of the attendant energy demand (+ 1.9%/year).
• Energy demand will remain flat in OECD Asia but is expected to rise by 2.2%/year in emerging markets.
• The share of natural gas in the primary energy mix is forecast to increase from 11% to 13.5%.
• Oil will lose ground to natural gas in the transport sector, industry and peak power generation due to its poor economics.
• Natural gas use in the transport sector (30 bcm in 2013) is expected to rise by 6%/year.
• The growth of gas demand (+ 3.2%/year over 2013-2035) is projected to surpass that of coal.
• In emerging markets, this is largely due to China’s energy and environmental policy in the long term (implementation of CO2 pricing after 2020).
• However, coal will maintain a significant growth (+ 2.3%/year) because of its competitiveness in power generation (China, India, Indonesia, Malaysia).
• Coal will continue to be the dominant source of energy supply accounting for more than half of regional energy and power generation mix by 2035.
• In OECD Asia, the development of nuclear and renewables will limit the expansion of gas. Nuclear will not be phased out from Japan’s energy mix.
• Natural gas will still represent a small share of the power generation mix in China by 2035.

Medium and Long Term Natural Gas Outlook – CEDIGAZ – February 2015
Asia-Oceania: natural gas supply prospects
0
200
400
600
800
1000
1200
1400
2013 2020 2035
Conventional Production Unconventional production
Coal to Gas Net LNG imports
Net pipeline imports
0
100
200
300
400
500
600
700
2013 2020 2035
Conventional production Shale gas & CBM
Coal to gas LNG imports
Pipeline imports
• Despite the growing role of unconventional production, the dependence of the Asian market on extra-regional supplies will increase from 25% in 2013 to 30% in 2035.
• The dependence of China on external sources (both pipeline gas and LNG) will grow from 31% to 37%.
• Shale gas and CBM will represent a quarter of regional natural gas production by 2035.
Unit: Bcm
Asia-Oceania China

Medium and Long Term Natural Gas Outlook – CEDIGAZ – February 2015
Asia-Oceania: natural gas demand prospects by sector
• In China, natural gas is making inroads in all consuming sectors. The use of gas in the transport sector is rising the fastest.
• The share of power generation in natural gas consumption will decrease from 42% to 39%, while that of industry will grow from 27% to 29%.
0
20
40
60
80
100
120
1402013
2035
0
50
100
150
200
250
3002013
2035
0
20
40
60
80
100
120
140
160
180
2002013
2035
• Urbanization and city expansion (China, South Korea) will result in a strong growth of gas demand in the residential-commercial sector (+ 4%/year), whose share will grow from 14% to 15%.
OECD Asia China Other non-OECD Asia
Unit: Bcm
Medium and Long Term Natural Gas Outlook – CEDIGAZ – February 2015
0
100
200
300
400
500
600
Production - 2013 Production - 2035
Net imports - 2013 Net imports - 2035
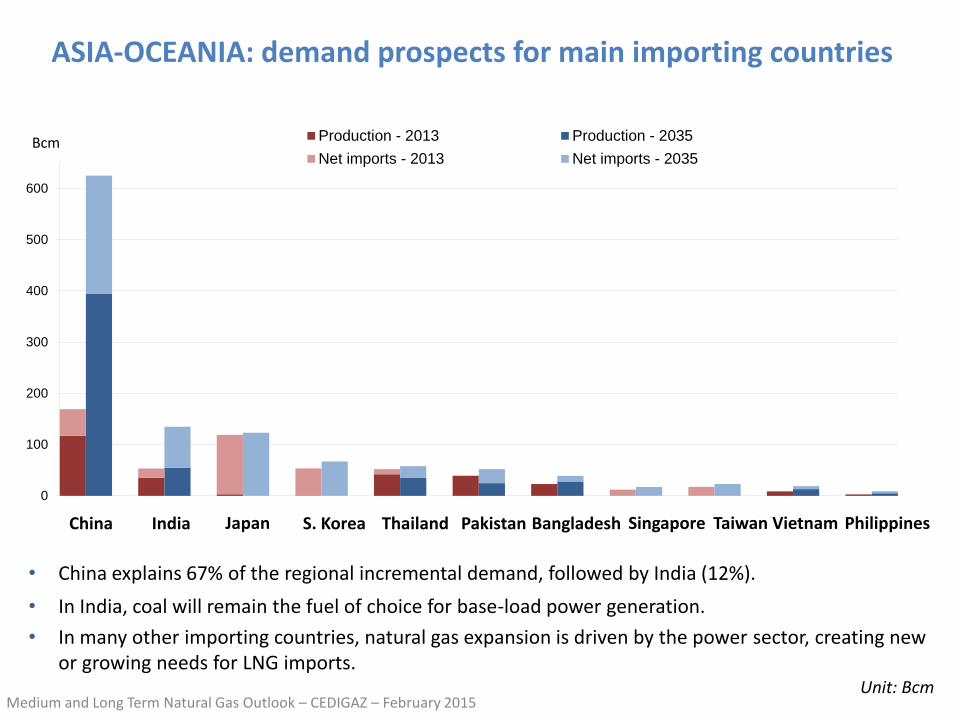
ASIA-OCEANIA: demand prospects for main importing countries
Bcm
China India Japan S. Korea Thailand Pakistan Singapore Taiwan Bangladesh Philippines Vietnam
• China explains 67% of the regional incremental demand, followed by India (12%).
• In India, coal will remain the fuel of choice for base-load power generation.
• In many other importing countries, natural gas expansion is driven by the power sector, creating new or growing needs for LNG imports.
Unit: Bcm

Medium and Long Term Natural Gas Outlook – CEDIGAZ – February 2015
0
20
40
60
80
100
120
140
160
180
200
Demand - 2013 Demand - 2035
Net exports - 2013 Net exports - 2035
Australia Malaysia Myanmar Indonesia Brunei
• Some traditional LNG producing countries (Indonesia, Malaysia and Brunei) are facing a growing gas shortage, forcing them to increase LNG imports, while limiting their exports.
• Thanks to vast conventional gas reserves and growing contributions from CBM, Australia will manage to increase LNG export capacity significantly and meet its rising domestic demand (power).
Unit: Bcm
ASIA-OCEANIA: production prospects for main exporting countries
Medium and Long Term Natural Gas Outlook – CEDIGAZ – February 2015
Main future trends: MIDDLE EAST 2013-2035
• Strong economic growth (+ 3.7%/year) boosting energy demand (+ 2%/year) and industrial activity (petrochemical industry).
• The Middle East is both a major producing and exporting region and a significant demand center. In 2013, 23% of natural gas supply was exported.
• Natural gas demand is expected to rise strongly (+ 2.9%/year), with the largest growths expected in Iran, Qatar, Saudi Arabia and the UAE.
• Natural gas share in the primary energy mix is expected to increase from 54% to 63%.
• The fast growth of natural gas in the power sector is mostly explained by favourable economics relative to alternative oil.
• Natural gas will play a growing role as an industrial feedstock because of relatively low gas prices in countries holding abundant low-cost gas reserves.
• The expansion of domestic gas consumption will enable to dedicate and value more oil for exports.
• Many countries are facing gas shortage, increasing their LNG imports (Kuwait, Dubai) or planning to do so (UAE, Jordan, Bahrain, Lebanon…).
• The share of the region in international LNG imports will increase from 1% to 4% over 2013-2035.
• The fast growth of gas demand will affect the availability of gas for exports and it is unlikely that the region will experience a massive LNG expansion.

Medium and Long Term Natural Gas Outlook – CEDIGAZ – February 2015
Middle East: natural gas supply prospects
• Despite growing production (+ 2.4%/year), net gas exports will decline by 2020, before growing slightly to reach 134 bcm by 2035 (130 bcm in 2013).
0%
5%
10%
15%
20%
25%
0
100
200
300
400
500
600
700
800
900
1000
2013 2020 2035
Net LNG exports
Net pipeline exports
Demand
Exports as a share ofproduction
Middle East’s natural gas balance Middle East’s natural gas consumption
• Natural gas demand will remain driven by the power and industrial sectors, which today together account for 75% of consumption.
0
100
200
300
400
500
600
700
800
900
2013 2020 2035
Others
Power generation
Industry
Residential-commercial
Unit: Bcm

Medium and Long Term Natural Gas Outlook – CEDIGAZ – February 2015
Prospects for inter-regional natural gas trade: Main results
• Inter-regional trade of natural gas is poised to increase much faster than demand, due to the growing dependence of consuming markets (Asia, Europe) on increasingly distant production sources, sometimes located in economically and politically unstable areas (Russia, Africa). The share of net inter-regional trade in global gas supply will progress from 12% in 2013 to 16.5% in 2035.
• Regional patterns of current consuming markets differ. Europe will remain dependent in large part on Russian pipeline gas, while Asia-Oceania will continue to absorb the bulk of LNG imports. Shale gas in North America will make the region move from an importing to a major exporting province by 2020.
• The largest volumetric growth in net exports are represented by CIS’s pipeline flows to Europe and Asia. The share of the CIS’s pipeline exports dedicated to Asia will surge from 15% to 36% over 2013-2035. Russia’s exports to China are expected to be primarily composed of pipeline gas.
• The growth of inter-regional LNG flows will surpass that of pipeline’s over 2020-2035. The LNG demand will remain essentially dominated by the European and Asian markets, which will be in competition for access to LNG supply.
• LNG supply will be characterized by a growing diversification of sources, with the significant breakthrough of North America, Australia, and East Africa in particular.
• The fast-growing domestic consumption, needs of gas reinjection for enhanced oil recovery and political risks in the Middle East and Latin America will limit the potential of exports from these two regions.

Medium and Long Term Natural Gas Outlook – CEDIGAZ – February 2015
Prospects for net inter-regional trade
0
50
100
150
200
250
300
No
rth
Am
eri
ca
Afr
ica
Mid
dle
Eas
t
CIS
Lati
n A
me
rica
Euro
pe
Asi
a-O
cean
ia
No
rth
Am
erc
a
2013 2020 2035
Exports Exports Imports Imports
Pipeline LNG
Unit: Bcm
0
50
100
150
200
250
300
MiddleEast &Other
CIS toEurope
CIS toAsia
Africa Europe Asia
2013 2020 2035
Note: Exports from the Middle East to Africa (Israel-Egypt) and Asia (Iran-Pakistan pipeline) are envisaged post 2025. Exports from Turkmenistan to Pakistan and India (TAPI pipeline) are also envisaged post-2025.

Medium and Long Term Natural Gas Outlook – CEDIGAZ – February 2015
Prospects for international LNG imports
Asia- Traditional markets : Japan, South Korea and Taiwan. Asia - Existing & recent emerging markets: India, China, Thailand, Singapore, Malaysia. Asia - Potential emerging importing markets: Indonesia, Vietnam, Bangladesh, Myanmar, Philippines, Pakistan and New Zealand.
Global growth - 2013-2035
North America: + 0%/year Of which Mexico: +1.3%/year
Europe: + 5%/year
Asia-Oceania: + 3.3%/year Of which : Traditional markets: + 0.5%/year Emerging markets: +8.2%/year
Other emerging markets: +5.1%/year
WORLD : + 3.6%/year
% LNG share of global gas supply
Unit: Bcm
0
100
200
300
400
500
600
700
2005 2013 2020 2025 2030 2035
Africa
Latin America
Middle East
Asia - Potential emerging markets
Asia - Existing & recent emerging markets
Asia - Traditional markets
Europe
North America 12%
14%
9%

Medium and Long Term Natural Gas Outlook – CEDIGAZ – February 2015
Prospects for LNG supply
International LNG exports
0
20
40
60
80
100
120
140
160
Australia OtherAsia
US Canada EastAfrica
OtherAfrica
Russia MiddleEast
2013 2035
Unit: Bcm
Australia 9%
Other Asia 21%
Africa 15%
Russia 4%
Middle East 42%
Latin America 8%
Europe 1%
Australia 19%
Other Asia 11%
US 13%
Canada 7%
East Africa 7%
Other Africa 12%
Russia 5%
Middle East 20%
Latin America 5%
Europe 1%
2013: 313 bcm
2035: 684 bcm

Medium and Long Term Natural Gas Outlook – CEDIGAZ – February 2015
Global LNG market prospects
Source: CEDIGAZ LNG Service Database
Note: Includes all projects with an "Operating", "Under Construction", "Operations Suspended" and "Potential" Status in the CEDIGAZ LNG Service Liquefaction Database. Effective capacity is the maximum LNG output given the current operating constraints. For existing projects, CEDIGAZ assesses the future output based on production trends, available reserves and development opportunities. For existing projects with no expected reduction in production, under construction and potential projects, the effective capacity is set at 95% of the design capacity from 2015 to 2035. For the first gas year, capacity is set at 50% of the design capacity, except for 2015, for which there is a better view on the start-up date. 2014 figures are output estimates.

Medium and Long Term Natural Gas Outlook – CEDIGAZ – February 2015
CONCLUSION Conditions for natural gas growth and challenges
• Despite a growing component of spot indexation in pricing formulas, oil indexation (Asia) and long term contracts will remain necessary to meet the massive investment requirements in new and capital-intensive projects.
• A number of powerful factors argue in favour of a growing contribution of natural gas to meet the economic, environmental and security challenges of the world energy system.
• The competitiveness of natural gas remains a major challenge. The orientation of energy policies and implementation of appropriate environmental regulations will be key factors in the successful expansion of natural gas (China).
• In terms of supply, costly investments must be made to meet future demand, limit tensions on international markets and favour supply security, flexibility and diversification.
• In emerging markets, the establishment of a regulatory and tax incentive framework, as well as reforms on domestic prices are critical to encourage private investments and allow the development of new reserves, including unconventional gas.


