The International Center for Development and Decent Work ICDD Working Papers | Paper No. 12 | May 2014 Tulika Bhattacharya Meenakshi Rajeev Identifying Employment Creating Sectors in India: An Analysis of Input-Output Linkages
Transcript
The International Center for Developmentand Decent Work
ICDD Working Papers | Paper No. 12 | May 2014
Tulika BhattacharyaMeenakshi Rajeev
IdentifyingEmployment CreatingSectors in India:An Analysis of Input-Output Linkages
Tulika Bhattacharya is a PhD scholar at the Institute for Social and Economic Change,
ICDD | Identifying Employment Creating Sectors in India: An Analysis of Input-Output Linkages
Introduction
Generation of employment remains an important issue in a labour surplus economy like
India with a growing working age population. It is well-known that the official statistics
on unemployment in India do not take into account disguised unemployment and thus
provides an underestimate of the unemployment rate. Nonetheless to quote certain offi-
cials figures: according to the Labour Bureau, Government of India (2010), the unem-
ployment rate was at 9.4 percent in 2009 –10, an increase of 1.1 percent over the previous
survey in 2004 – 05. The growth of labour, on the other hand, stood still at around 2 per-
cent for the decade between 1994 and 2005, which has added to growing unemployment
in the nation1. Secondly, 93 percent of the population working in the informal sector also
shows the concerns India has on the employment front.
Historically, since the mid 1970s employment generation has been considered as an
inevitable development policy in India, and several programs for the creation of employ-
ment were subsequently taken up. Later, India adopted a series of reform measures dur-
ing the 1990s, but what the period witnessed was a phase of jobless growth. One of the
reasons for low employment growth coupled with high output growth may be because
the high output achieved was through the growth of certain sectors which were not par-
ticularly employment intensive. Subsequently, though programs like National Rural
Employment Guarantee Act (NREGA) were adopted by the government for the genera-
tion of employment, these programs were not adequately linked with the production
process. Therefore, if our collective concern is about inclusive growth, it is essential to
identify the sectors that are not only growth oriented but also employment generating.
In the existing literature, a number of studies have focused on the issue of employment
by studying its trend, patterns, share across sectors and other such indicators. However,
while examining the employment creation potentials of different sectors within the econ-
omy, the authors have mostly concentrated on the employment generated only within
a sector. However, it is also important to capture how employment generation in one
sector in turn helps to create employment opportunities in other sectors through linkage
effects. More precisely, if output of sector X rises, by implication employment in the sec-
tor also increases through direct effect. In addition, employment of the sectors which
supply input to X would also rise due to higher input demands; and the same process
1
4
1 Labour Bureau, Ministry of Labour and Employment, Government of India (2010), “Report on Employment and Unemployment Survey 2009 –10”, downloaded from http://labourbureau.nic.in/Final_Report_Emp_Unemp_2009_10.pdf, accessed on 03.07.2014.
ICDD | Identifying Employment Creating Sectors in India: An Analysis of Input-Output Linkages
of employment generation in turn goes on for the sectors that supply inputs to these
first sets of input supplying sectors and so on. Similar effects can be seen for the sectors
that demand output of sector X as their input, and therefore the final picture needs to
be evaluated considering all the linkage effects. This is an area where not many authors
have worked in India and the current study attempts to fill this gap by examining
employment generation potentials of major sectors of the Indian economy using both
direct and indirect linkage effects of the sectors.
Thus, this paper essentially incorporates the employment aspect within an Input-Output
framework in order to understand employment linkages of individual economic sectors
by estimating employment multipliers for the time periods 2003–04 and 2007– 08. To
achieve this, the analysis uses National Sample Survey Organization (NSSO) data on
employment and appends this in the standard input-output table provided by the Central
Statistical Organisation. This exercise we believe is of considerable importance. This
helps in the identification of sectors which have the potential to create employment
through direct and indirect employment linkage effects. Further, an analysis is presented
to show whether a highly linked sector in terms of output (calculated by measuring the
standard backward and forward linkage effects) is also employment generating or not,
and this exercise is expected to provide policy inputs for fostering inclusive growth.
Often a sector with high backward linkage is found to be dependent on capital intensive
intermediate products. Thus, if policy thrust is given to such sectors, the employment
generation objective may not be accomplished. In this context, inclusion of the employ-
ment generation aspect within an Input-Output framework serves a useful purpose in
the process of determining key sectors.
Against this backdrop the paper is organized as follows. Section 2 reviews the literature
on employment aspects within an Input-Output framework. Methodological details
regarding estimation of employment multipliers and data sources are discussed in
Section 3. In the penultimate section, the employment linkage of each sector is present-
ed using the Input-Output tables for 2003 – 04 and 2007– 08 both at the aggregate and
disaggregates levels. Interpretations of these results as well as the comparison between
output and employment linkages are also discussed in this section. A concluding section
follows at the end.
5
ICDD | Identifying Employment Creating Sectors in India: An Analysis of Input-Output Linkages
Review of Literature
As mentioned above, employment creation has been an issue of intense debate in aca-
demia. One set of literature in this context has focused on the role of employment in
affecting economic growth, while the other strand of literature has incorporated the
employment aspect within the Input-Output framework.
By analyzing the employment trends of the Indian economy, Mehrotra et al. (2012) sug-
gested that employment should be created in the non-agricultural sector, especially in
the organized manufacturing and services sector, with appropriate policies. Thus, infor-
mal employment in the unorganized sector must be transformed to formal employment
in non-agricultural organized sectors, which will in turn help to ensure faster growth of
the economy. Concentrating on the problem of jobless growth, Mehrotra et al. (2013)
calculate employment intensity of output in the Indian context. In addition, Papola and
Sahu (2012) have examined growth and structural changes in employment in the long
and short term, emphasizing the post-reform period of the Indian economy. They argue
that good quality productive employment should be created to ensure inclusive growth.
Another set of literature has incorporated the employment aspect within an Input-Output
(I-O) framework in order to relate the employment conditions with that of the change in
final demands of several sectors. On the one hand, Gorg and Ruane (2000) have incor-
porated employment within the I-O framework for the Irish economy considering aver-
age employment as a proxy for firm size. They expected this variable to have a negative
relation with the firm’s linkage. The reason for this negative relation may be that large
firms have lower linkages than small firms because of their vertical integration for attain-
ing self-sufficiency, and to reap the benefits of economies of scale. Even the trend of
globalization and out-sourcing of activities also will support the fact that the small firms
have higher linkages within the domestic economy because they are more comfortable
in local markets. On the other hand, Bin (2010) calculated employment elasticity and
included it in the partial non-linear I-O framework in order to measure the employment
effect of changes in final demand using the 2007 I-O table for China along with China’s
employment data for the years 2002–09. Using a non-linear output-employment rela-
tionship, he has found that employment loss in China due to the US sub-prime crisis will
affect the output as well as export of China adversely, which will in turn reduce the
growth of China’s economy. Thus, he concludes that this non-linear formulation and
employment elasticity estimated thereby will reflect the economic situation in a better
way, and highlight the need for appropriate policies for sustaining the growth of Chinese
2
6
ICDD | Identifying Employment Creating Sectors in India: An Analysis of Input-Output Linkages
economy. Using 1996–97 I-O tables, Valadkhani (2003) had identified the high employ-
ment generating industries for the Australian economy. Measuring sectoral employment
elasticity, he showed that the sectors like retail trade, construction, health & community
services, and education will be the most employment generating industries in future.
In the Indian context, Sarma & Ram (1989) evaluated the employment, income and out-
put linkages for India’s manufacturing industries using 1979–80 I-O tables. Measuring
forward and backward linkage in output and employment generation as well as grouping
the manufacturing sectors into four broad categories (agro-based industries, non-agro
based final goods industries, non-agro based intermediate goods industries and capital
goods industries), their study identified the sectors that have relatively higher income,
output and employment potentials. Their results showed that agro-based industries had
potential to generate relatively more income and employment than the others.
The above review clearly reveals that the existing studies have either seen the employ-
ment trends through measuring employment elasticity or have incorporated employment
within the I-O framework in order to identify certain other firm related features, while
identification of employment generating industries through direct and indirect linkage
effects have received less attention. Needless to say, it would be insightful for policy mak-
ers to relate output growth and employment growth through identification of key sectors
in terms of their output linkage along with employment linkage. This is especially valid
for a labour surplus economy like India. However, the literature review presented reveals
that only limited Indian studies have included employment generation capacity for iden-
tification of key sectors. In addition, there is no recent study on the topic in the Indian
context even though the economy has witnessed significant change in the post-reform
era. In this context, the current research makes an attempt to examine whether the highly
linked sectors are also able to create employment or not and thus seeks to fill the gap in
the existing literature by providing a new direction for determination of key sectors.
7
ICDD | Identifying Employment Creating Sectors in India: An Analysis of Input-Output Linkages
Methodology and Data Sources
Input-Output Framework
A broad Input-Output model has been used for addressing the aforementioned objec-
tives. In the famous Leontief Input-Output model (1936), i, jth element of the Leontief
inverse ((I – A)-1) can be interpreted as the total effect (both direct and indirect) on the
gross output of the ith sector when the jth sector final demand changes by one unit.
Now with each output change, there will be an associated change in employment. Also
following the dual-sector Lewis model, we have assumed that a change in output is
linked to a fixed proportional change in employment, that is, the proportion of labour
consumed per unit of output remains the same irrespective of the scale of production
(Pradhan, Saluja & Singh, 2006). This constant return to scale assumption is considered
standard in respect of an Input-Output framework. Though this assumption appears
somewhat restrictive, it is to be noted that the entire literature on input-output analysis
is developed and based on this assumption. Following this assumption, we get the fixed
employment coefficients for each sector, noted as follows:
ICDD | Identifying Employment Creating Sectors in India: An Analysis of Input-Output Linkages
Ei = Li / Xi --------- (1), (i = 1, 2, …, n), where Li is the employment in sector ‘i’, Xiis the gross output and Ei is the fixed employment coefficient. In other words,
Ei is the labour requirement per unit of gross output, Xi. We can, therefore, write:
Li = Êi * Xi --------- (2), where Êi is a diagonalised matrix formed from the vector ‘E’,
whose elements are defined by equation (1). The diagonalised matrix of Êi clearly
shows the labour requirement for each sector with respect to per unit of gross output.
Now, from our conventional I-O model, we have, X = (I – A)-1 F --------- (3)
Substituting the relation of X from (3) in (2), we have got the following labour equation:
L = Ê (I – A)-1 F = KF --------- (4), where Ê is the diagonalised matrix formed with elements
of Ei, (I – A)-1 is the Leontief Inverse matrix, ‘F’ is the vector comprising final demand, ‘L’
is the employment requirement, K = [kij], the i, jth element of K, which measures employ-
ment created directly and indirectly in the ith sector when the jth final demand changes
by one unit. Again, ∑i kij gives the employment multiplier, thus measuring the total direct
and indirect employment created throughout the economy, when the jth sector final
demand increases by one unit (Pradhan, Saluja & Singh, 2006; Bulmer-Thomas, 1982).
A mere consideration of employment multiplier (∑i kij) does not provide adequate infor-
mation as far as selecting a key employment generating sector is concerned. Thus, it
would be more appropriate if one could calculate appropriate indices to capture employ-
ment forward and backward linkages, which, in turn, helps to identify a key employment
generating sector. These indices as we consider are as follows:
20 Financing, insurance, real estate & business services
1.10 0.21 0.21 1.35 0.21 0.29
21 Other comm., social & personal services 6.14 0.53 0.50 6.55 0.58 0.71
SC = Sector Code
ES = Employment share
EB = Employment Backward Linkage Co-efficient
EF = Employment Forward Linkage Co-efficient
Source: Authors’ estimation by using I-O tables for 2003–04 (CSO, 2008) & 2007–08 (CSO, 2012).
ICDD | Identifying Employment Creating Sectors in India: An Analysis of Input-Output Linkages
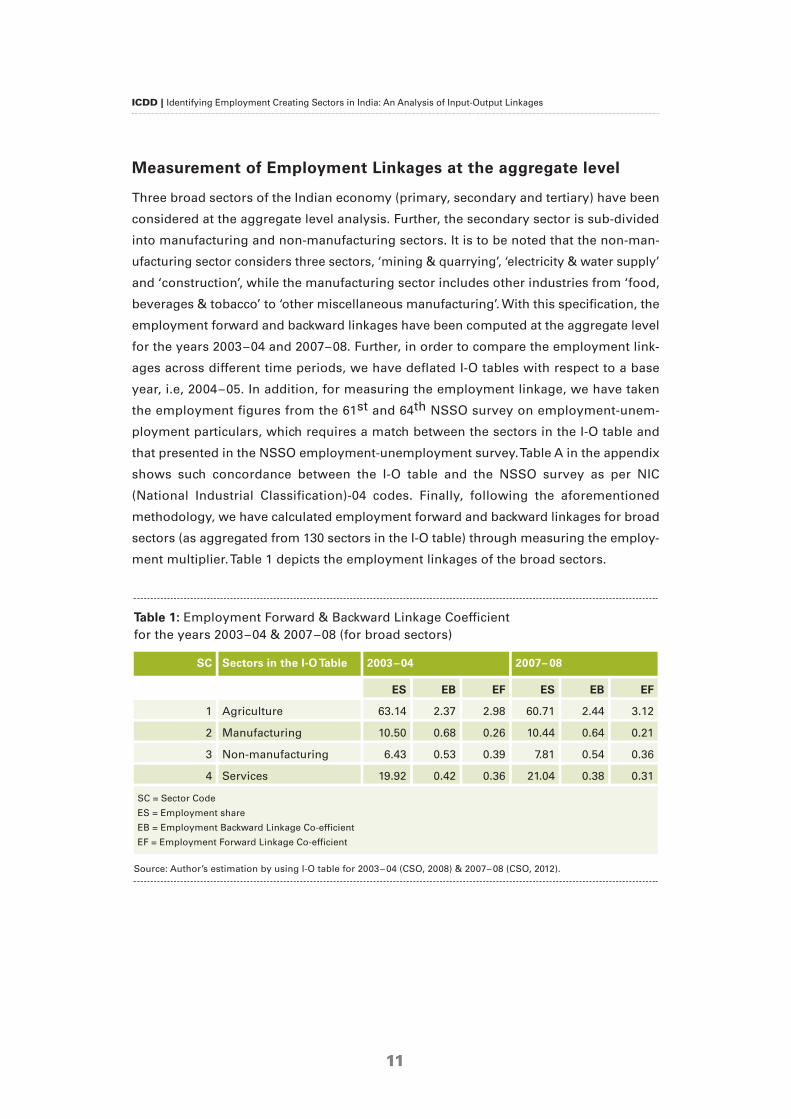
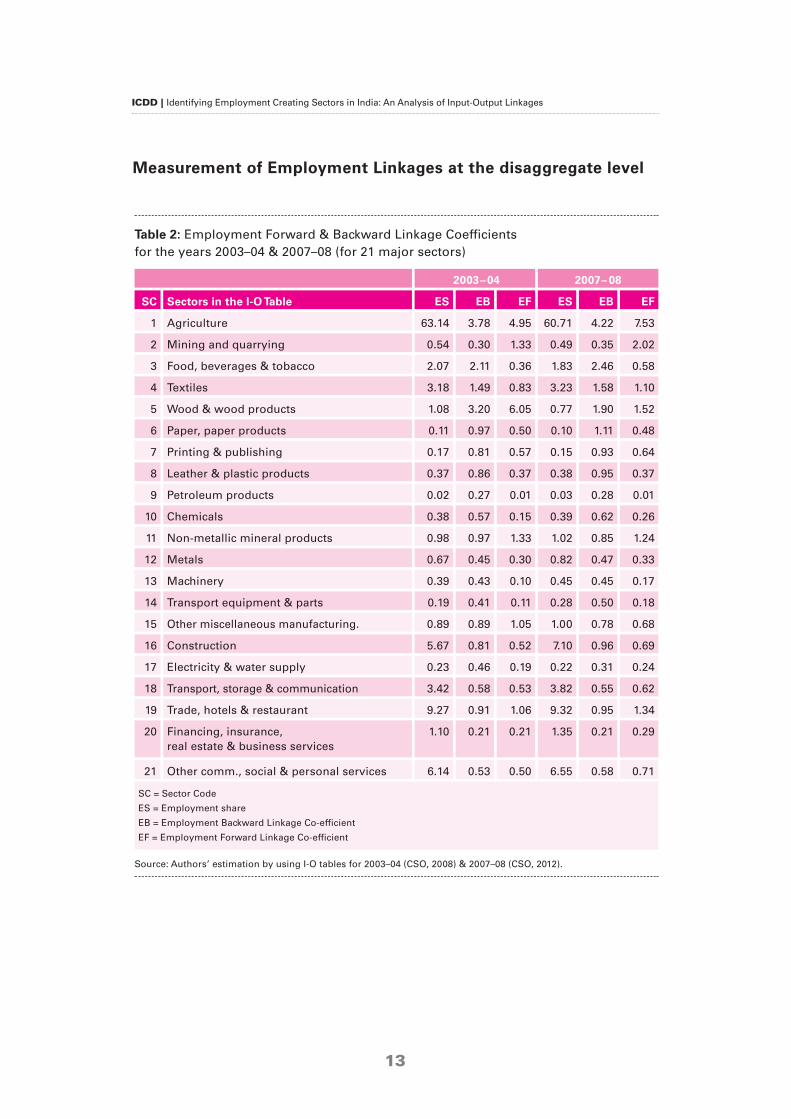
Table 2 clearly shows the employment share along with employment forward and back-
ward linkages across 21 sectors for the time periods 2003–04 and 2007–08. It is to be
noted that the sectors having more than unitary employment backward linkage are capa-
ble of creating above average (more than one unit) employment in other sectors, when
final demand increases by unity. In contrast, the sectors having more than unitary
employment forward linkage are capable of creating above average employment within
that sector, when final demand for all the sectors increases by unity. Thus, an employ-
ment linkage analysis captures additional employment generation capabilities not cap-
tured through mere employment share, since employment share represents the creation
of only direct employment within the sectors, while a linkage analysis covers the cre-
ation of employment not only within the sectors, but also in other sectors.
Focusing on Table 2, as expected we have found that the ‘agriculture’ sector has the
highest employment forward and backward linkages; thus it has the highest employ-
ment generation capacity in respect to both within the sector as well as outside the sec-
tor with a change in the final demand. With respect to an in-house employment share of
the agriculture sector, we have found the employment share of agriculture decreased in
2007– 08 as compared to 2003–04 although its employment linkage has increased over
time, which again illustrates that considering only the employment share does not
reflect the actual potential of a sector in terms of generating employment. Within the
manufacturing sectors, ‘textiles’, ‘wood & wood products’ also possess high employ-
ment forward as well as backward linkages. Looking at the employment share of those
sectors, it has been found that ‘wood & wood products’ generates a lesser amount of
in-house employment (in terms of absolute employment share), while it has the capacity
to affect other sectors by way of creating employment through its high employment link-
age. Even the ‘paper, paper products’ sector creates a lesser amount of employment
within it, while it has moderate employment linkage with others. ‘Mining & quarrying’
holds the second position in terms of employment forward linkage, thus creating more
employment within itself in order to serve the demand from other sectors. In contrast,
the agro based industry ‘food, beverages & tobacco’ occupies the second place with its
employment backward linkage, thus creating proportionately more employment in other
sectors through creating more demand. Thus, employment linkage provides more
insight into the sectors’ employment generation rather than their employment share.
14
ICDD | Identifying Employment Creating Sectors in India: An Analysis of Input-Output Linkages
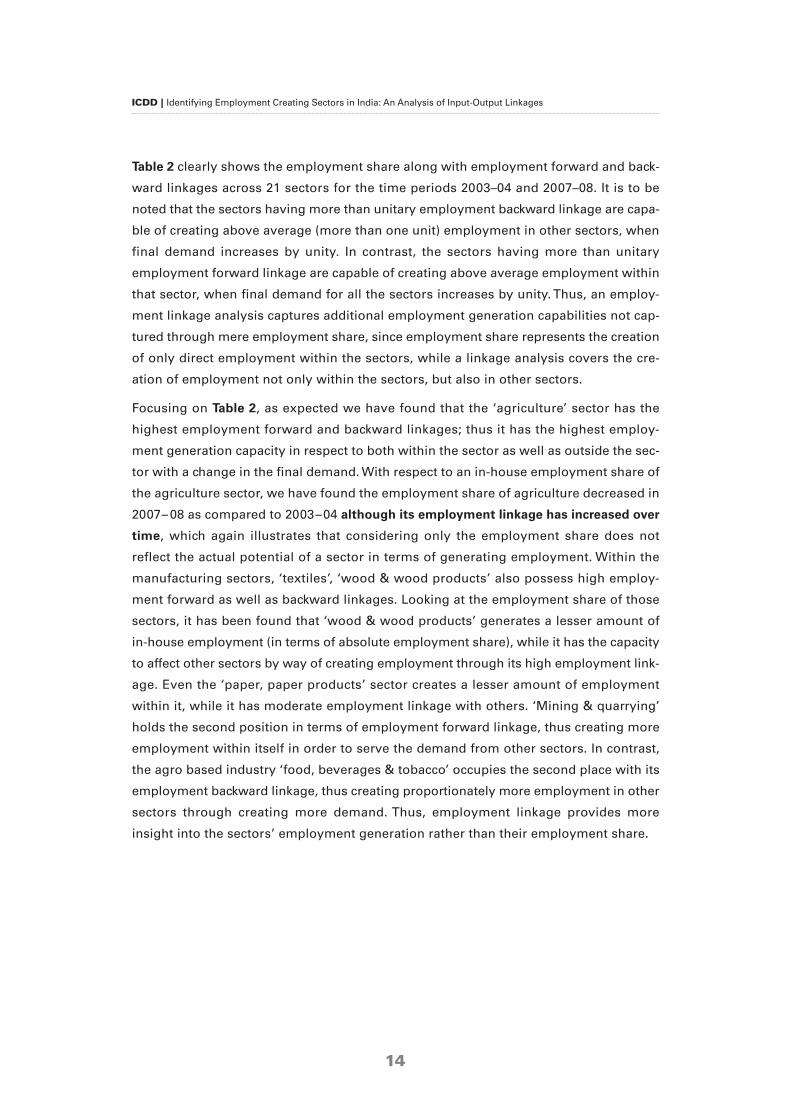
Now, in order to identify the key employment generating sectors, it is useful to rank
them in terms of their high employment forward as well as backward linkage coeffi-
cients. According to Diamond (1975), a key employment sector is the one which has high
employment forward as well as backward linkage; more precisely, which has both
employment forward as well as backward linkage coefficients greater than unity. Based
on this criterion, we identify the key employment generating sectors for 2003–04 and
2007– 08 (see Table 3).
From Table 3, we can clearly identify the key employment generating sectors with both
forward and backward linkages greater than unity.
However, Diamond’s specification imposes a strict restriction of both forward and back-
ward linkages in that they have to be greater than unity. If we marginally relax this strict
assumption to consider the sectors which have at least one of the linkage coefficients
(either employment forward or backward) greater than unity, we can arrive at a number
of sectors with moderately high linkage effects. Table 4 lists those sectors.
Table 3: Key Employment Generating Sectors for the years 2003–04 & 2007–08 (for 21 major sectors)
2003–04 2007– 08
Sectors in the I-O Table EB EF EB EF
Agriculture 3.78 4.95 4.22 7.53
Wood & wood products 3.20 6.05 1.90 1.52
Textiles – – 1.58 1.10
EB = Employment Backward Linkage Co-efficient
EF = Employment Forward Linkage Co-efficient
Source: Author’s estimation by using I-O tables for 2003–04 (CSO, 2008) & 2007–08 (CSO, 2012).
15
ICDD | Identifying Employment Creating Sectors in India: An Analysis of Input-Output Linkages
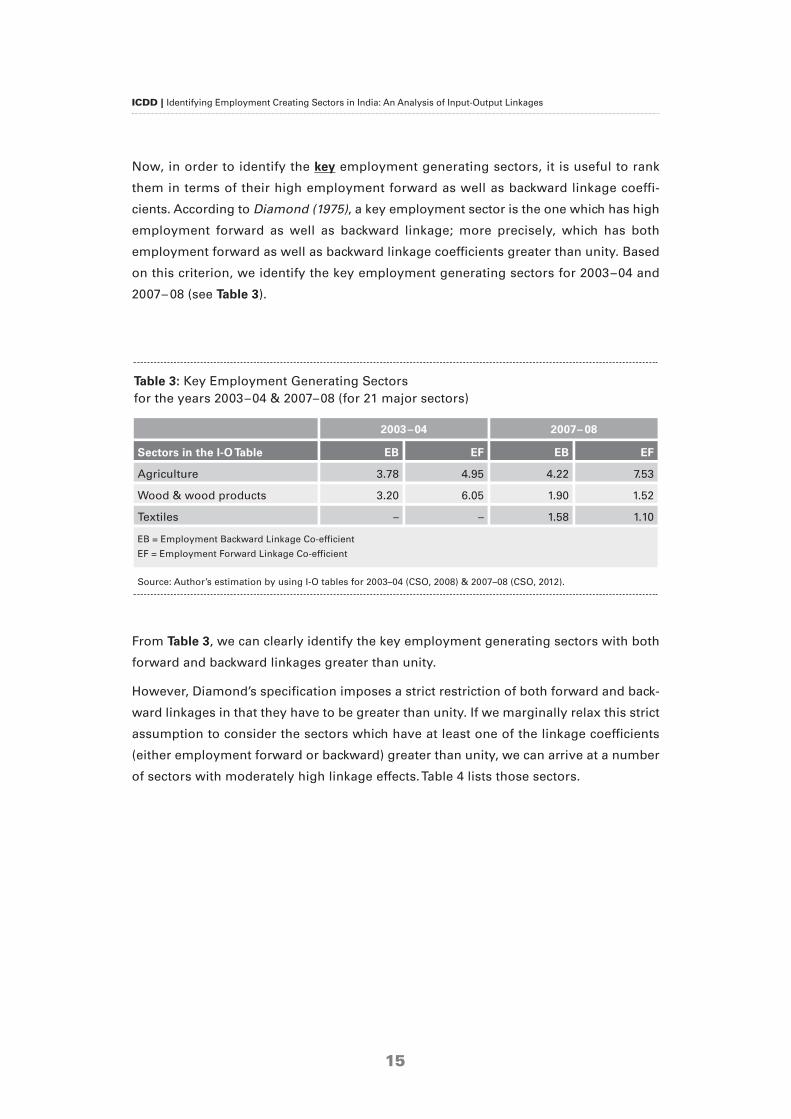
Finally, we attempt to examine whether the sectors that have been identified in terms of
their high output linkage also display a similar performance in terms of generating
employment or not. This necessitates calculation of output forward and backward link-
ages of the sectors as well. This was done using the standard I-O technique2. In Table 5
we present both output and employment linkage coefficients which aid in presenting a
comparative picture.
Table 4: Key Employment Generating Sectors with relaxed norms* for 2003–04 & 2007– 08 (for 21 major sectors)
2003–04 2007– 08
Sectors in the I-O Table EB EF EB EF
Mining and quarrying 0.30 1.33 0.35 2.02
Food, beverages & tobacco 2.11 0.36 2.46 0.58
Textiles 1.49 0.83 – –
Paper, paper products – – 1.11 0.48
Non-metallic mineral products 0.97 1.33 0.85 1.24
Other miscellaneous manufacturing 0.89 1.05 - -
Trade, hotels & restaurants 0.91 1.06 0.95 1.34
EB = Employment Backward Linkage Co-efficient
EF = Employment Forward Linkage Co-efficient
*Either forward or backward linkage coefficients are greater than unity.
Source: Author’s estimation by using I-O tables for 2003–04 (CSO, 2008) & 2007–08 (CSO, 2012).
16
2 Here, we have used the demand driven standard Leontief model for measuring the backward link-age coefficients, while the supply driven Ghosh model (1958) is used for measuring the forwardlinkage coefficients. For both these models, we have broadly used the Chenery-Watanabe method(1958) and the Rasmussen method (1956) in order to find the direct as well as indirect forward andbackward linkage coefficients using the technical coefficient matrix (A), allocation coefficient matrix(B) and Leontief inverse matrix (I-A)-1, (I-B)-1.
ICDD | Identifying Employment Creating Sectors in India: An Analysis of Input-Output Linkages
Table 5: Comparison between Employment & Output Linkage coefficients for 2003–04 & 2007–08 (for 21 major sectors)
Source: Author’s estimation by using I-O table for 2007–08 in CSO (2012).
20
ICDD | Identifying Employment Creating Sectors in India: An Analysis of Input-Output Linkages
Conclusion
In this paper an attempt has been made to identify certain key sectors in terms of their
employment generating capabilities. While highlighting such sectors, linkage effects are
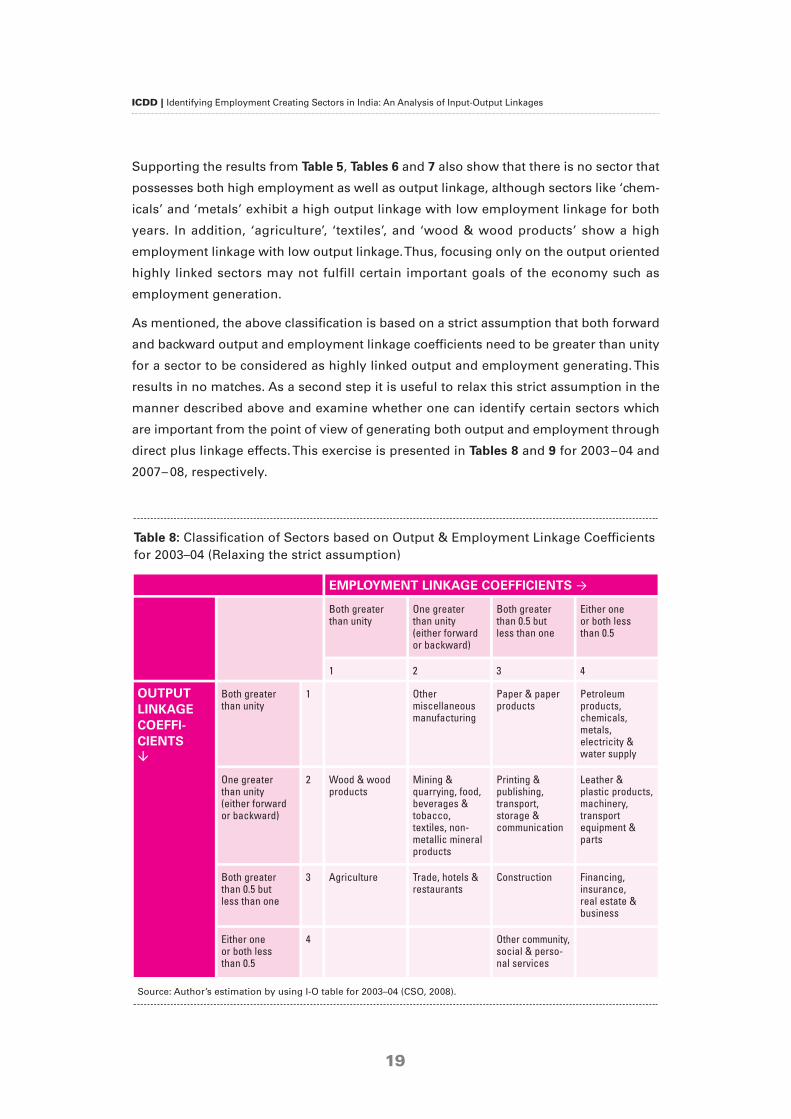
also taken into consideration. It has been found that sectors like ‘agriculture’, ‘textiles’,
and ‘wood & wood products’ are key employment generating sectors possessing high
employment forward as well as backward linkages for both the time periods under con-
sideration, 2003–04 and 2007– 08, although they have a low output linkage. In contrast,
‘petroleum products’, ‘chemicals’, and ‘metals’, are the sectors that affect others in terms
of their output linkage for both time periods, although they have a low employment link-
age. In addition, discrepancies also exist between the direct employment share and
employment linkage of the sectors. For example, the employment share of the sectors
like ‘agriculture’, ‘wood & wood products’, and ‘paper & paper products’ has decreased
from 2003–04 to 2007– 08, even though their employment linkage has increased over
time. Thus computation of employment linkage provides additional insightful informa-
tion regarding the employment creation capabilities of a sector which only the share of
employment is unable to fully capture.
Policy makers, therefore, should focus on those sectors that are highly linked to others
in terms of their output linkage along with their capacity to generate direct and indirect
employment. Marginally relaxing the strict assumption of high linkage, our results have
identified certain sectors like ‘mining & quarrying’, ‘food, beverages & tobacco’, ‘textiles’,
and ‘non-metallic mineral products’ which have a reasonably good output as well as
employment linkage for both the time periods. Thus, policy measures for boosting
growth in some of these sectors can go a long way toward fostering inclusive growth in
the economy.
4
21
ICDD | Identifying Employment Creating Sectors in India: An Analysis of Input-Output Linkages
References
p Bin, W. (2010): A Non-Linear Input-Output Model for Measuring the Employment Effect of Changes
in Final Demand: An Approach Based on the Employment Elasticity, 18th International Input Output
Conference, downloaded from, www.iioa.org/files/conference-1/149.pdf, accessed on 10.06.13
p Bulmer-Thomas, V. (1982): Input-Output Analysis in Developing Countries, Sources, Methods and
Applications, John Wiley and& Sons Ltd., New York.
p Central Statistical Organization (CSO):
Government of India (2008), Input-Output Transaction table for 2003–04.
p Central Statistical Organization (CSO):
Government of India (2012), Input-Output Transaction table for 2007– 08.
p Chenery, H. B. and T. Watanabe (1958):
International Comparisons of Structure of Production, Econometrica, 26(4): 487–521.
p Ghosh, A. (1958): Input-Output Approach in an Allocation System, Economica, 25(97): 58–64.
p Gorg, H. and F. Ruane (2000): An Analysis of Backward Linkages in the Irish Electronics Sector,
The Economic and& Social Review, 31(3): 215–235.
p Labour Bureau, Ministry of Labour and Employment, Government of India (2010):
Report on Employment and Unemployment Survey 2009-10, downloaded from:
http://labourbureau.nic.in/Final_Report_Emp_Unemp_2009_10.pdf, accessed on 03.07.2014.
p Leontief, W. W. (1936): Quantitative Input and Output Relations in the Economic System
of the United States, Review of Economic Statistics, 18(3): 105–125.
p Mehrotra, S., A. Gandhi, B. K. Sahoo and P. Saha (2012):
Creating Employment in the Twelfth Five-Year Plan, Economic and& Political Weekly, 47(19): 63–73.
p Mehrotra, S., A. Gandhi, P. Saha and B. K. Sahoo (2013):Turnaround in India’s Employment Story:
Silver Lining Amidst Joblessness and Informalisation?, Economic and& Political Weekly, 48(35): 87–96.
p National Sample Survey Office, Ministry of Statistics & Programme Implementation,
Government of India (2010): Employment and Unemployment Situation in India 2007– 08,
NSS Report No. 531(64/10.2/1).
p National Sample Survey Organization, Ministry of Statistics & Programme Implementation,
Government of India (2006): Employment and Unemployment Situation in India 2004– 05,
NSS Report No. 515(61/10/1).
p Papola, T. S. and P. P. Sahu (2012): Growth and Structure of Employment in India:
Long-Term and Post-Reform Performance and the Emerging Challenge, downloaded from:
http://isidev.nic.in/pdf/ICSSR_TSP_PPS.pdf, accessed on 12.11.2013.
p Pradhan, B. K., M. R. Saluja and S. K. Singh (2006): Social Accounting Matrix for India:
Concepts, Construction and Applications, Sage publications, New Delhi.
p Raa, T. T. (2005):The Economics of Input-Output Analysis, Cambridge University Press, Cambridge
and New York.
p Rasmussen, P. N. (1956): Studies in Intersectoral Relations, North-Holland Publishing, Amsterdam.
p Sarma, A. and K. Ram (1989): Income, Output and Employment Linkages and Import Intensities of
Manufacturing Industries in India, The Journal of Development Studies, 25(2): 192-209.
p Valadkhani, A. (2003): Using Input-Output Analysis to Identify Australia’s High Employment
Generating Industries, Australian Bulletin of Labour, 29(3): 199-217.
5
22
ICDD | Identifying Employment Creating Sectors in India: An Analysis of Input-Output Linkages
Appendices6
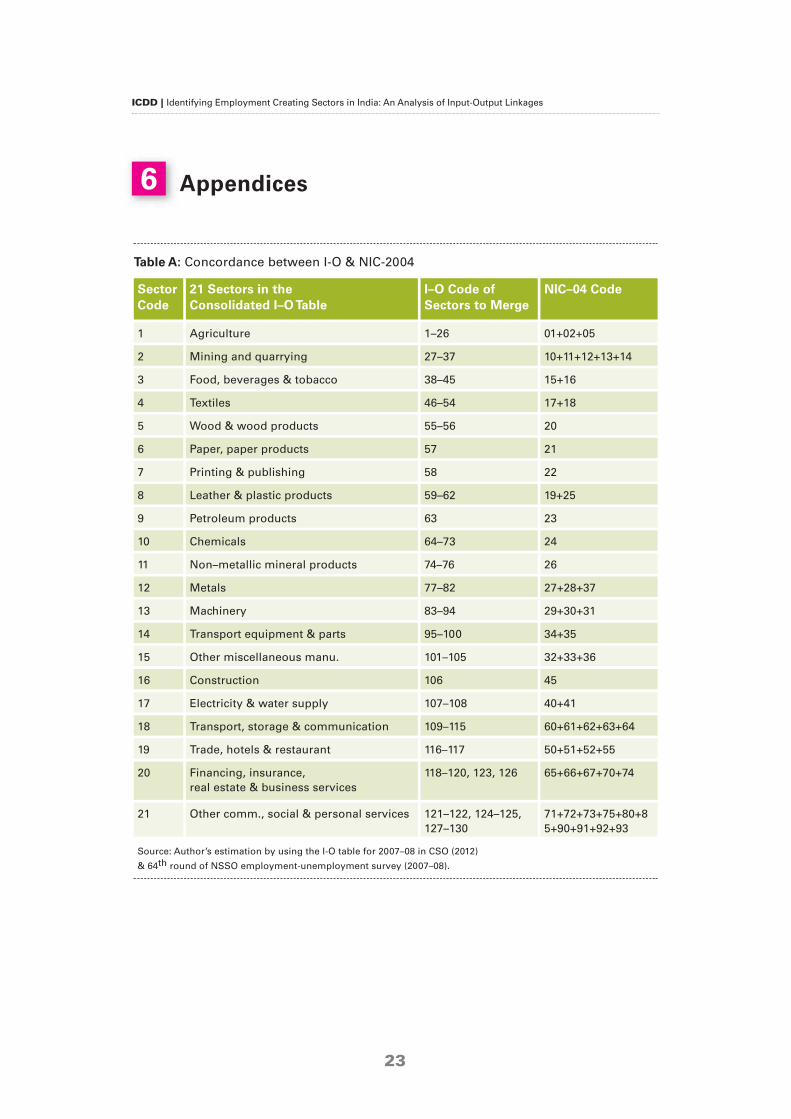
Table A: Concordance between I-O & NIC-2004
SectorCode
21 Sectors in the Consolidated I–O Table
I–O Code of Sectors to Merge
NIC–04 Code
1 Agriculture 1–26 01+02+05
2 Mining and quarrying 27–37 10+11+12+13+14
3 Food, beverages & tobacco 38–45 15+16
4 Textiles 46–54 17+18
5 Wood & wood products 55–56 20
6 Paper, paper products 57 21
7 Printing & publishing 58 22
8 Leather & plastic products 59–62 19+25
9 Petroleum products 63 23
10 Chemicals 64–73 24
11 Non–metallic mineral products 74–76 26
12 Metals 77–82 27+28+37
13 Machinery 83–94 29+30+31
14 Transport equipment & parts 95–100 34+35
15 Other miscellaneous manu. 101–105 32+33+36
16 Construction 106 45
17 Electricity & water supply 107–108 40+41
18 Transport, storage & communication 109–115 60+61+62+63+64
19 Trade, hotels & restaurant 116–117 50+51+52+55
20 Financing, insurance, real estate & business services
118–120, 123, 126 65+66+67+70+74
21 Other comm., social & personal services 121–122, 124–125,127–130
71+72+73+75+80+85+90+91+92+93
Source: Author’s estimation by using the I-O table for 2007–08 in CSO (2012)
& 64th round of NSSO employment-unemployment survey (2007–08).
23
ICDD | Identifying Employment Creating Sectors in India: An Analysis of Input-Output Linkages
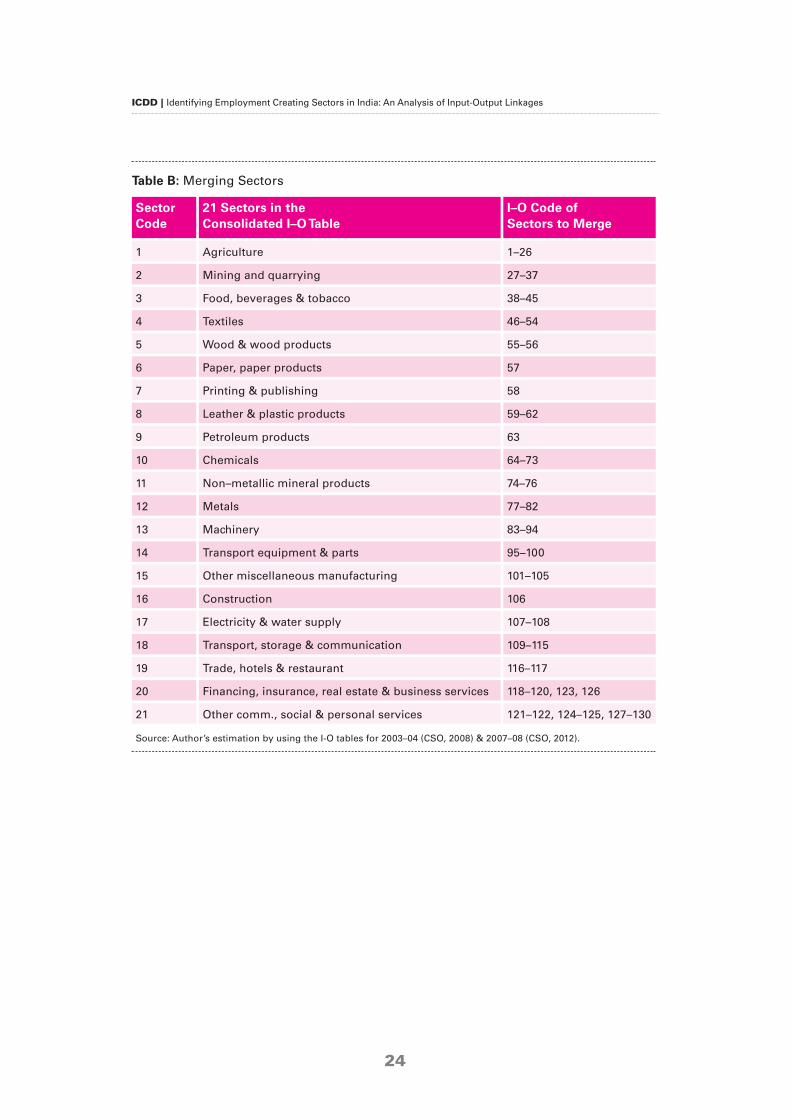
Table B: Merging Sectors
SectorCode
21 Sectors in the Consolidated I–O Table
I–O Code of Sectors to Merge
1 Agriculture 1–26
2 Mining and quarrying 27–37
3 Food, beverages & tobacco 38–45
4 Textiles 46–54
5 Wood & wood products 55–56
6 Paper, paper products 57
7 Printing & publishing 58
8 Leather & plastic products 59–62
9 Petroleum products 63
10 Chemicals 64–73
11 Non–metallic mineral products 74–76
12 Metals 77–82
13 Machinery 83–94
14 Transport equipment & parts 95–100
15 Other miscellaneous manufacturing 101–105
16 Construction 106
17 Electricity & water supply 107–108
18 Transport, storage & communication 109–115
19 Trade, hotels & restaurant 116–117
20 Financing, insurance, real estate & business services 118–120, 123, 126
21 Other comm., social & personal services 121–122, 124–125, 127–130
Source: Author’s estimation by using the I-O tables for 2003–04 (CSO, 2008) & 2007–08 (CSO, 2012).
24
ICDD Working Paper Series
p Vol. 1: Webster, Edward: Work and Economic Security in the 21st century. What Can We Learn from Ela Bhatt?, 17 pages
p Vol. 2: Hagmann, Jonas: Opportunities and Constraints of Peri-urban Buffalo and DairyCattle Systems in Faisalabad, Punjab, Pakistan, 48 pages
p Vol. 3: Marchetti, Sabrina:Together? On the Not-so-easy Relationship between ItalianLabour Organisations and Migrant Domestic Workers’ Groups, 23 pages
p Vol. 4: Sinaga, Hariati / Scherrer, Christoph: Core Labor Rights: Competitive Pressures and Non-Compliance, 29 pages
p Vol. 5: Burchardt, Hans-Jürgen / Weinmann, Nico: Social Inequality and Social Policy outside the OECD: A New Research Perspective on Latin America, 39 pages
p Vol. 6: Beck, Stefan: Sozial verantwortliche Beschaffung von Informationstechnik. Socially Responsible Public Procurement of Information Technology, ISBN 978-3-944090-08-5, 40 pages
p Vol. 7: Aufderheide, Mareike / Voigts, Clemens / Hülsebusch, Christian / Kaufmann,Brigitte: Decent Work? How Self-employed Pastoralists and Employed Herders on Ranches Perceive their Working Conditions, ISBN 978-3-944090-05-4, 28 pages
p Vol. 8: Bhattacharjee, Manojit / Rajeev, Meenakshi: Credit Exclusion of the Poor: A Study of Cultivator Households in India, ISBN 978-3-944090-09-2, 22 pages
p Vol. 9: Younas, Muhammad: The Dairy Value Chain: A Promoter of Development andEmployment in Pakistan, ISBN 978-3-944090-06-1, 22 pages
p Vol. 10: Erbach, Juliane: The Decency of Women’s Working Conditions in Peri-urbanBuffalo Production Systems in the District Faisalabad, Punjab, Pakistan, kasseluniversity press, ISBN 978-3-86219-692-0, 45 pages
p Vol. 11: Schützhofer, Timm B.: Can Decent Work and Export Oriented Growth Strategies Go Together? Lessons from Nicaragua’s Export Processing Zones, kassel university press, ISBN 978-3-86219-810-8, 52 pages
p Vol. 12: Bhattacharya, Tulika / Rajeev, Meenakshi: Identifying Employment CreatingSectors in India: An Analysis of Input-Output Linkages, kassel university press, ISBN 978-3-86219-852-8, 28 pages
p Vol. 13: Withanachchi, Sisira Saddhamangala / Houdret, Annabelle / Nergui,Soninkhishig / Ejarque i Gonzalez, Elisabet / Tsogtbayar, Ankhbold / Ploeger,Angelika: (Re) configuration of Water Resources Management in Mongolia: A Critical Geopolitical Analysis, kassel university press, ISBN 978-3-86219-860-3