23
Beef Cattle Selection and Management for Adaptation to Drought Megan Rolf State Beef Extension Specialist Oklahoma State University
| Date post: | 20-Jul-2015 |
| Category: |
Science |
| Upload: | lpe-learning-center |
| View: | 32 times |
| Download: | 2 times |
Beef Cattle Selection and
Management for Adaptation to
Drought
Megan Rolf
State Beef Extension Specialist
Oklahoma State University
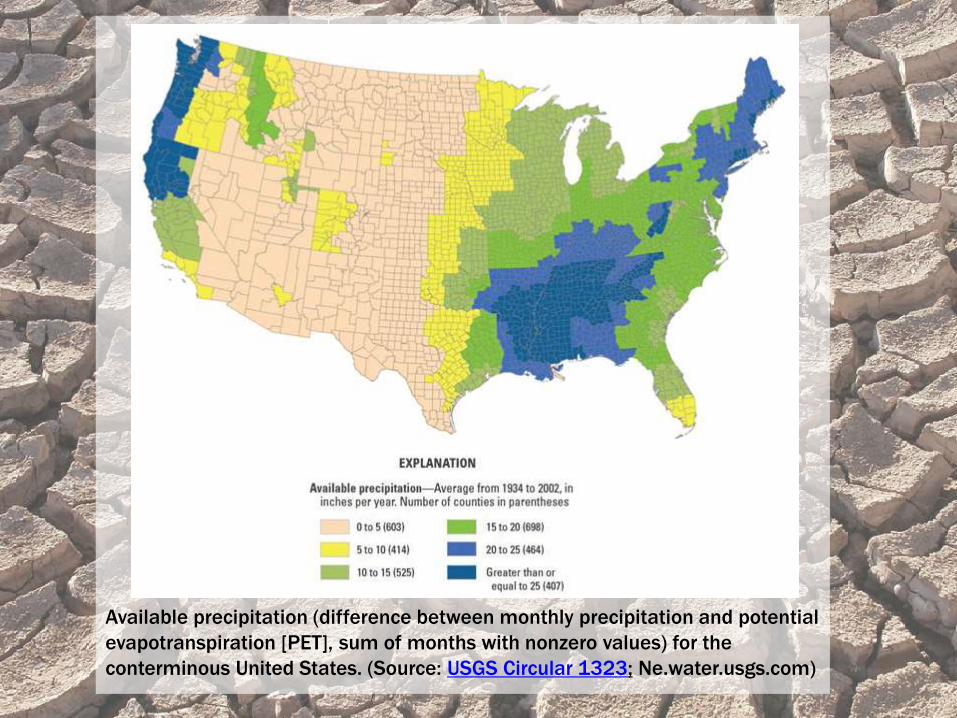
Available precipitation (difference between monthly precipitation and potential
evapotranspiration [PET], sum of months with nonzero values) for the
conterminous United States. (Source: USGS Circular 1323; Ne.water.usgs.com)

Figures from Agcensus.usda.gov and Ne.water.usgs.com
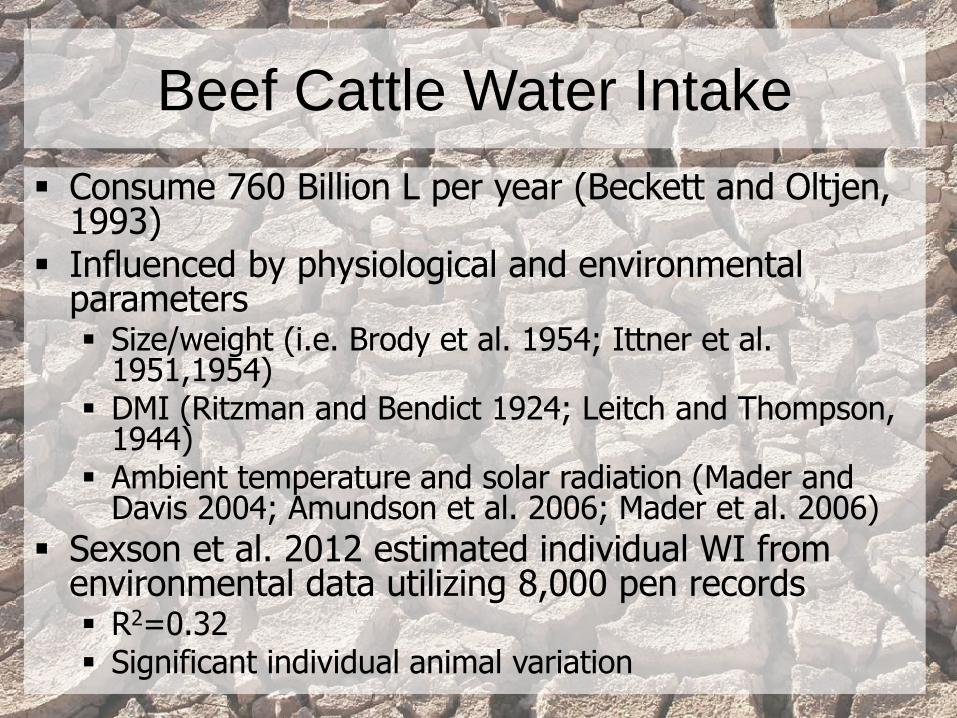
Beef Cattle Water Intake
Consume 760 Billion L per year (Beckett and Oltjen, 1993)
Influenced by physiological and environmental parameters Size/weight (i.e. Brody et al. 1954; Ittner et al.
1951,1954) DMI (Ritzman and Bendict 1924; Leitch and Thompson,
1944) Ambient temperature and solar radiation (Mader and
Davis 2004; Amundson et al. 2006; Mader et al. 2006)
Sexson et al. 2012 estimated individual WI from environmental data utilizing 8,000 pen records R2=0.32 Significant individual animal variation
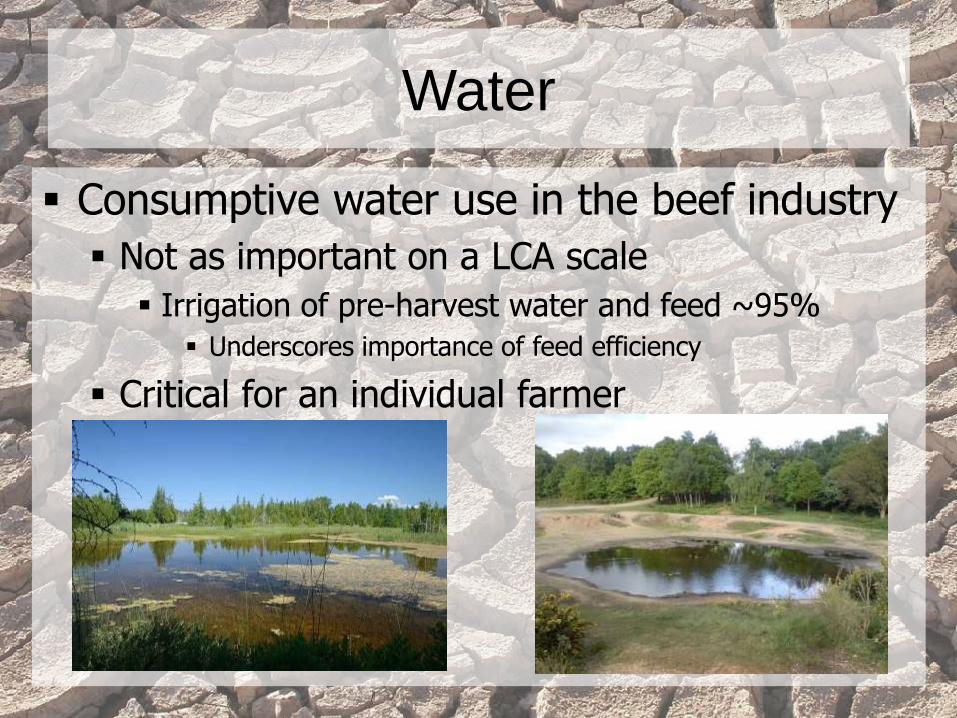
Water
Consumptive water use in the beef industry
Not as important on a LCA scale
Irrigation of pre-harvest water and feed ~95%
Underscores importance of feed efficiency
Critical for an individual farmer

Decreased water availability Amplified by increased evaporation if hot
Decreased water quality from increase in adulterants May affect taste and odor, palatability (Lardner
et al. 2005) Decreased performance likely due to reduced
water and feed intakes (Lardner et al. 2005)
Increased water temperature Typically increase water demand Particularly apparent in taurine cattle (Ittner et
al. 1951)
Need to consume more water, when we have less available and they are less likely to want to drink it
Water restriction Increases the spread of maximum and minimum
body temperatures (interferes with body temperature regulation; Finch 1985)
What to Expect During Drought
J. Anim. Sci Vol. 62 No. 2, p. 531-542
Australian Journal of Agricultural Research. 56: 97–104
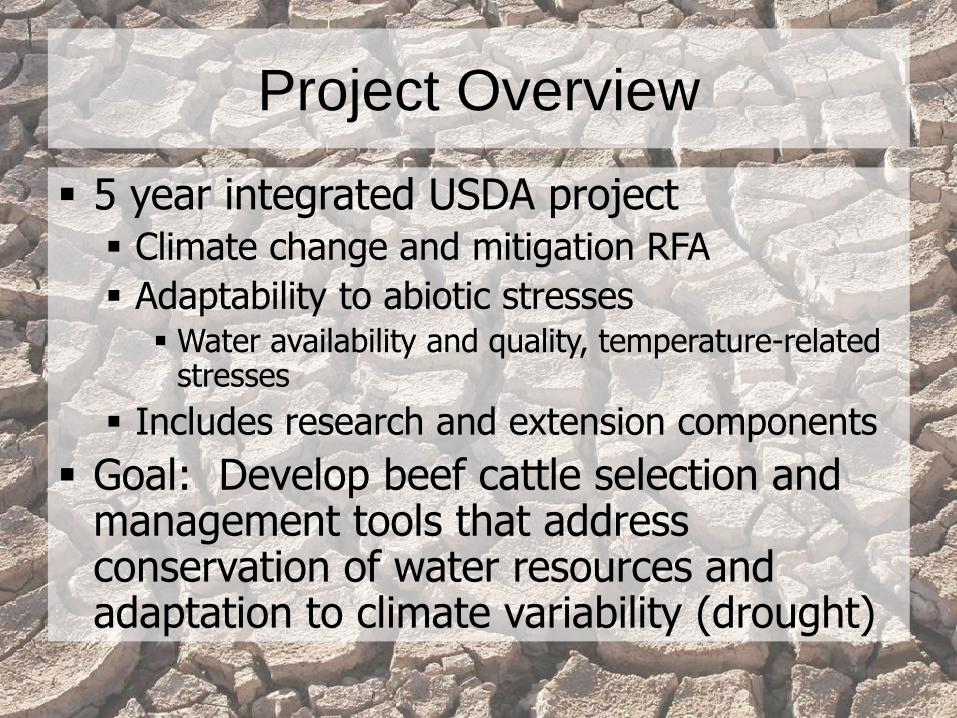
Project Overview
5 year integrated USDA project Climate change and mitigation RFA
Adaptability to abiotic stresses Water availability and quality, temperature-related
stresses
Includes research and extension components
Goal: Develop beef cattle selection and management tools that address conservation of water resources and adaptation to climate variability (drought)

Insentec System
21 Day acclimation period
Commence test protocol
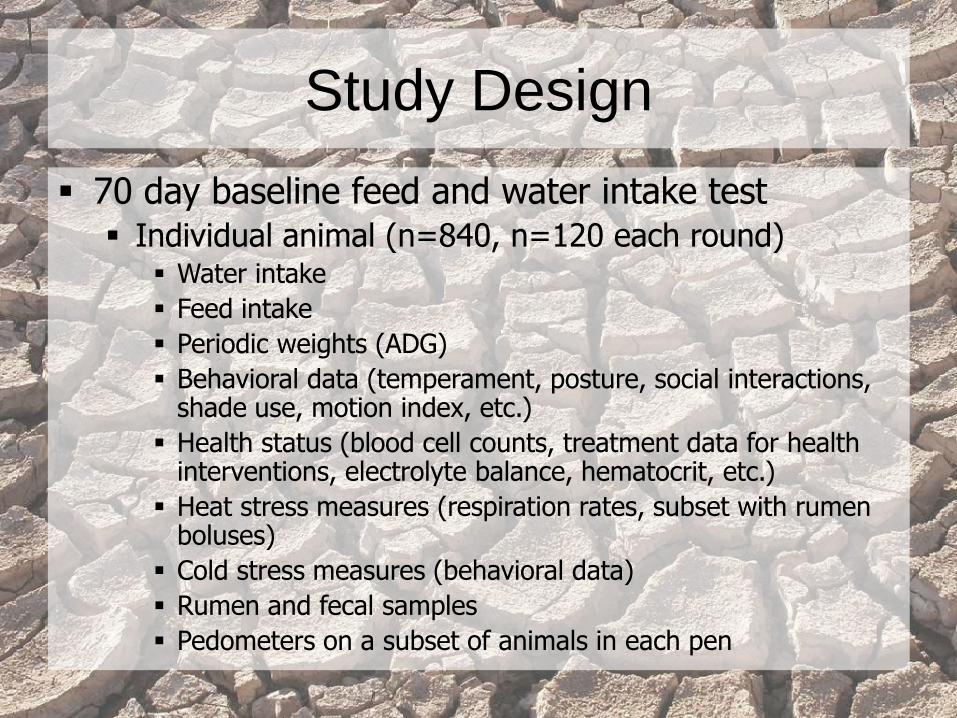
Study Design
70 day baseline feed and water intake test Individual animal (n=840, n=120 each round)
Water intake
Feed intake
Periodic weights (ADG)
Behavioral data (temperament, posture, social interactions, shade use, motion index, etc.)
Health status (blood cell counts, treatment data for health interventions, electrolyte balance, hematocrit, etc.)
Heat stress measures (respiration rates, subset with rumen boluses)
Cold stress measures (behavioral data)
Rumen and fecal samples
Pedometers on a subset of animals in each pen
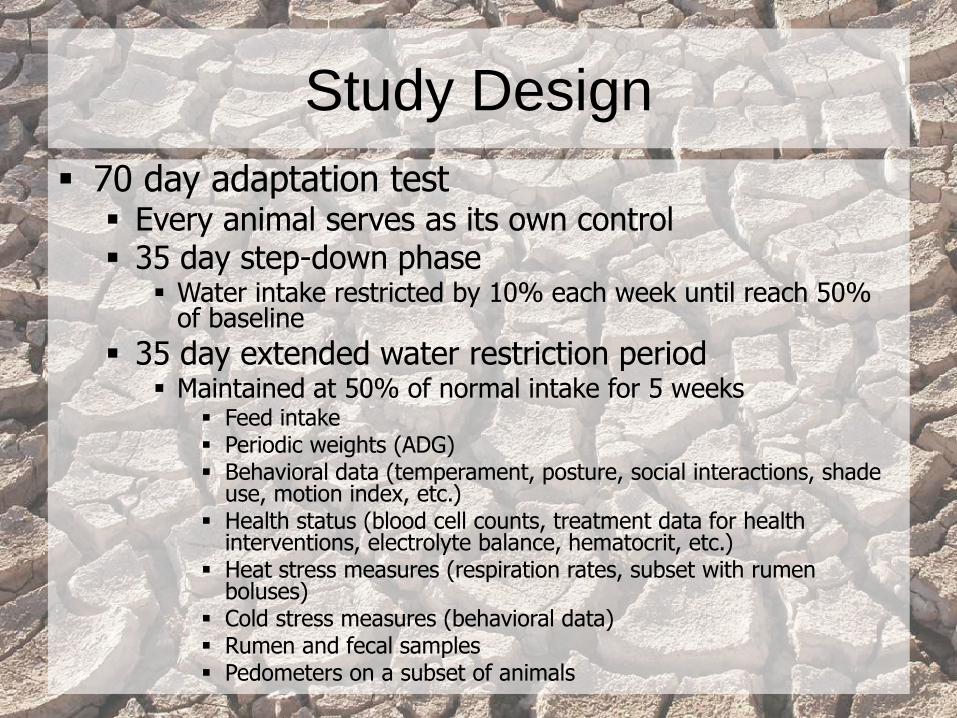
Study Design
70 day adaptation test Every animal serves as its own control 35 day step-down phase
Water intake restricted by 10% each week until reach 50% of baseline
35 day extended water restriction period Maintained at 50% of normal intake for 5 weeks
Feed intake Periodic weights (ADG) Behavioral data (temperament, posture, social interactions, shade
use, motion index, etc.) Health status (blood cell counts, treatment data for health
interventions, electrolyte balance, hematocrit, etc.) Heat stress measures (respiration rates, subset with rumen
boluses) Cold stress measures (behavioral data) Rumen and fecal samples Pedometers on a subset of animals

Study Design
Feed samples (high roughage) Analyzed for dry matter weekly Stored for future nutrient analysis
Water Samples (TCFA) Water quality monitored once/month throughout the
study Tested in on-campus water lab
Calves maintained in the feedlot through finishing phase Impacts on carcass performance
140 control steers (20 in each group)
Collection of tissues at harvest (where possible)
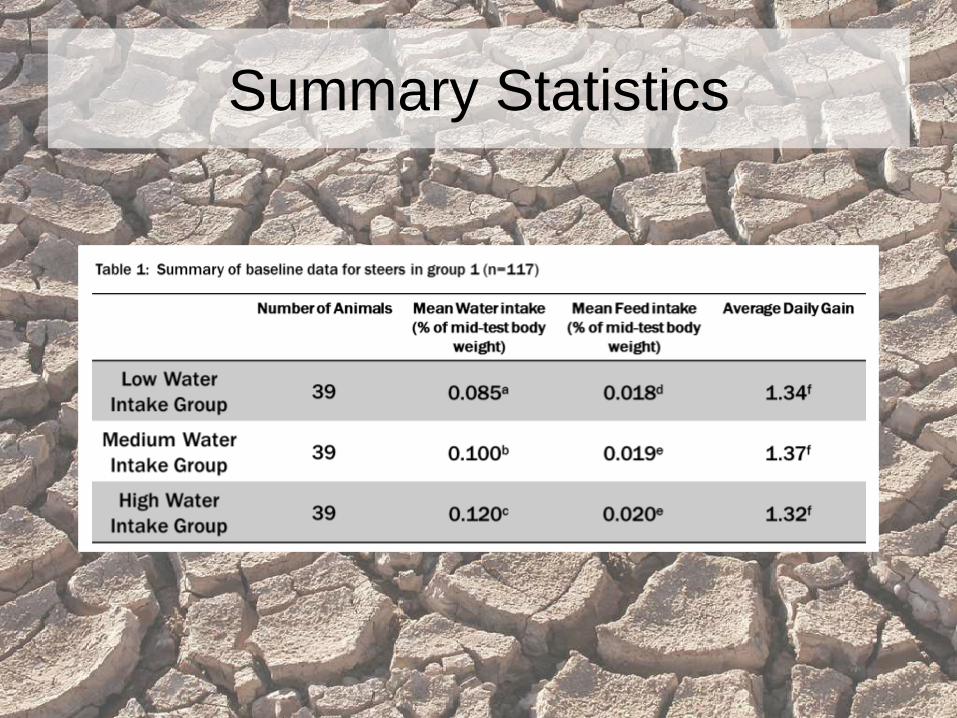
Summary Statistics
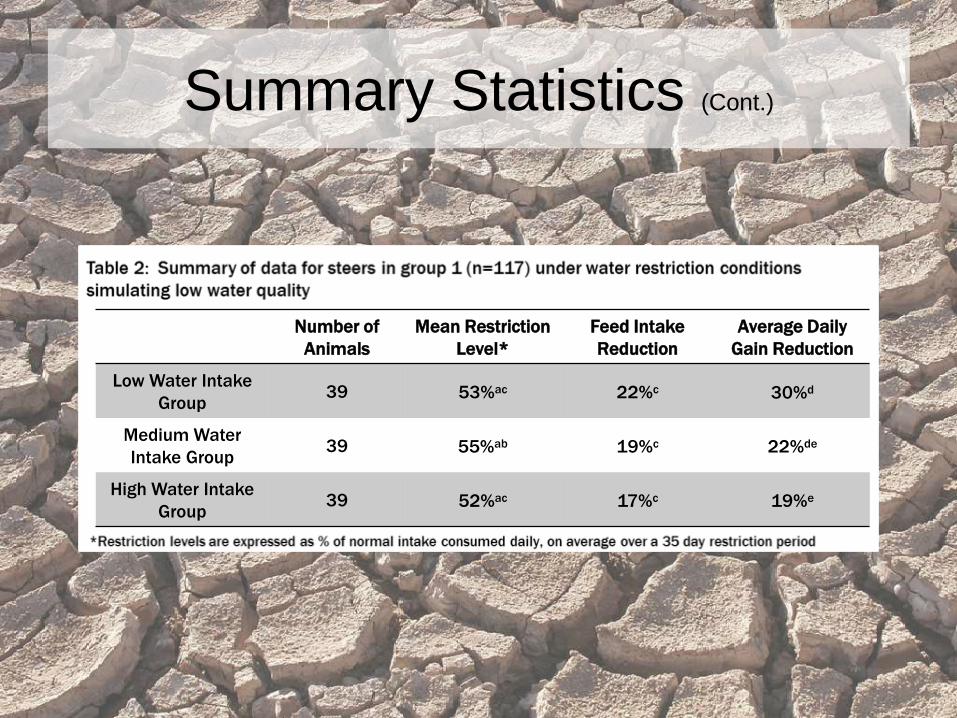
Summary Statistics (Cont.)
Number of
Animals
Mean Restriction
Level*
Feed Intake
Reduction
Average Daily
Gain Reduction
Low Water Intake
Group39 53%ac 22%c 30%d
Medium Water
Intake Group39 55%ab 19%c 22%de
High Water Intake
Group39 52%ac 17%c 19%e
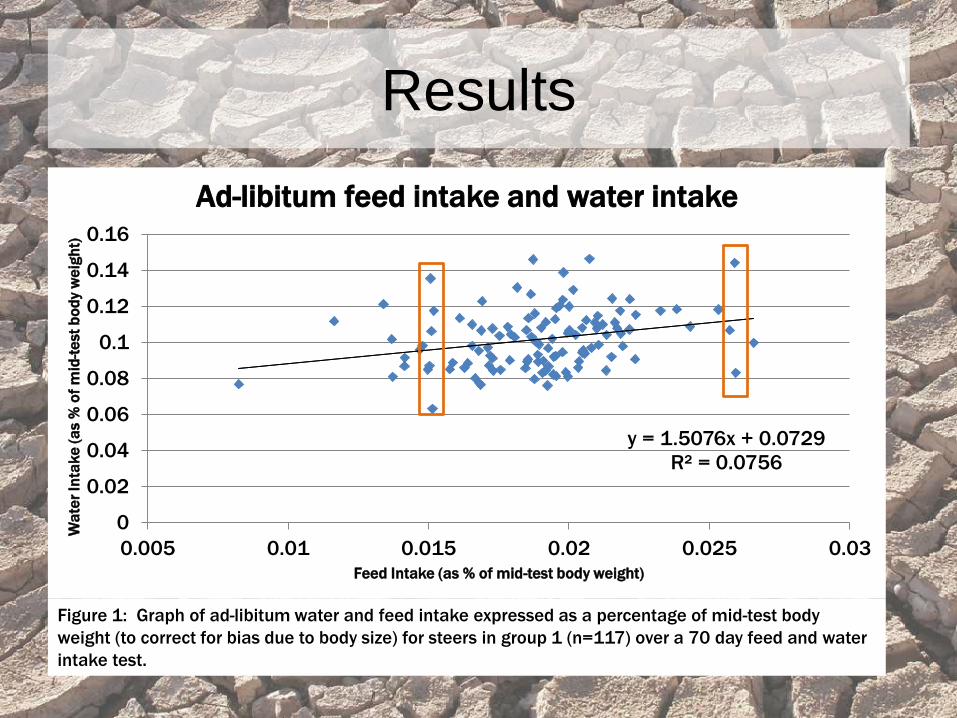
Results
y = 1.5076x + 0.0729
R² = 0.0756
0
0.02
0.04
0.06
0.08
0.1
0.12
0.14
0.16
0.005 0.01 0.015 0.02 0.025 0.03
Wa
ter
Inta
ke
(a
s %
of
mid
-te
st
bo
dy w
eig
ht)
Feed Intake (as % of mid-test body weight)
Ad-libitum feed intake and water intake
Figure 1: Graph of ad-libitum water and feed intake expressed as a percentage of mid-test body
weight (to correct for bias due to body size) for steers in group 1 (n=117) over a 70 day feed and water
intake test.

y = -0.0004x + 0.102
R² = 7E-05
0.00
0.02
0.04
0.06
0.08
0.10
0.12
0.14
0.16
0.0 0.5 1.0 1.5 2.0 2.5
Wa
ter
Inta
ke
(a
s %
of
mid
-te
st
bo
dy w
eig
ht)
Mean Average Daily Gain (kg)
Ad-libitum Water Intake and Average Daily Gain
Results
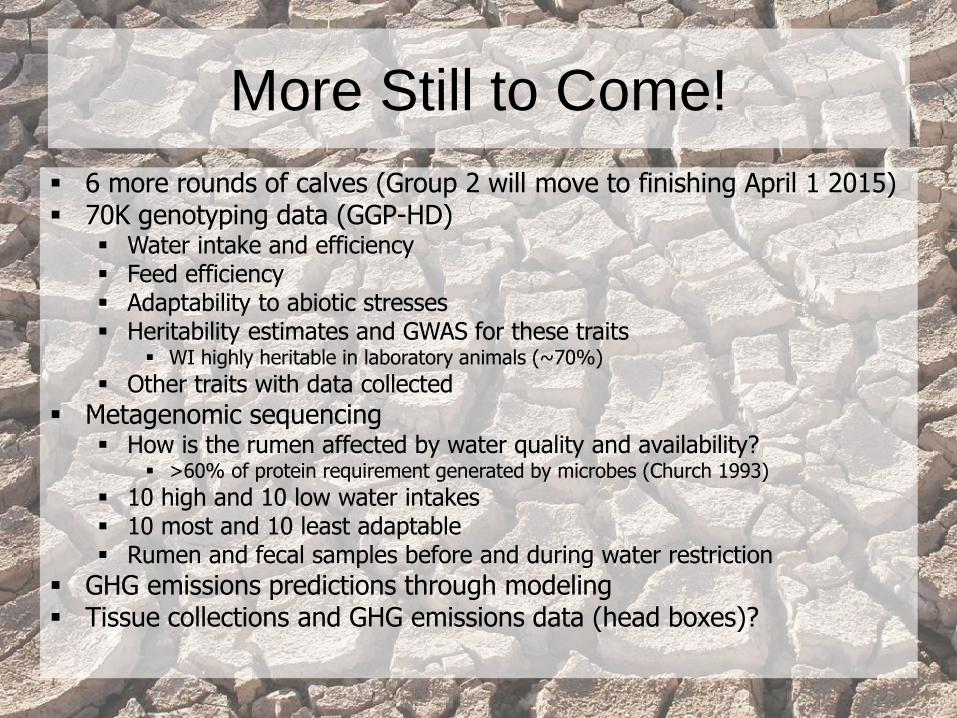
More Still to Come!
6 more rounds of calves (Group 2 will move to finishing April 1 2015) 70K genotyping data (GGP-HD)
Water intake and efficiency Feed efficiency Adaptability to abiotic stresses Heritability estimates and GWAS for these traits
WI highly heritable in laboratory animals (~70%)
Other traits with data collected
Metagenomic sequencing How is the rumen affected by water quality and availability?
>60% of protein requirement generated by microbes (Church 1993)
10 high and 10 low water intakes 10 most and 10 least adaptable Rumen and fecal samples before and during water restriction
GHG emissions predictions through modeling Tissue collections and GHG emissions data (head boxes)?
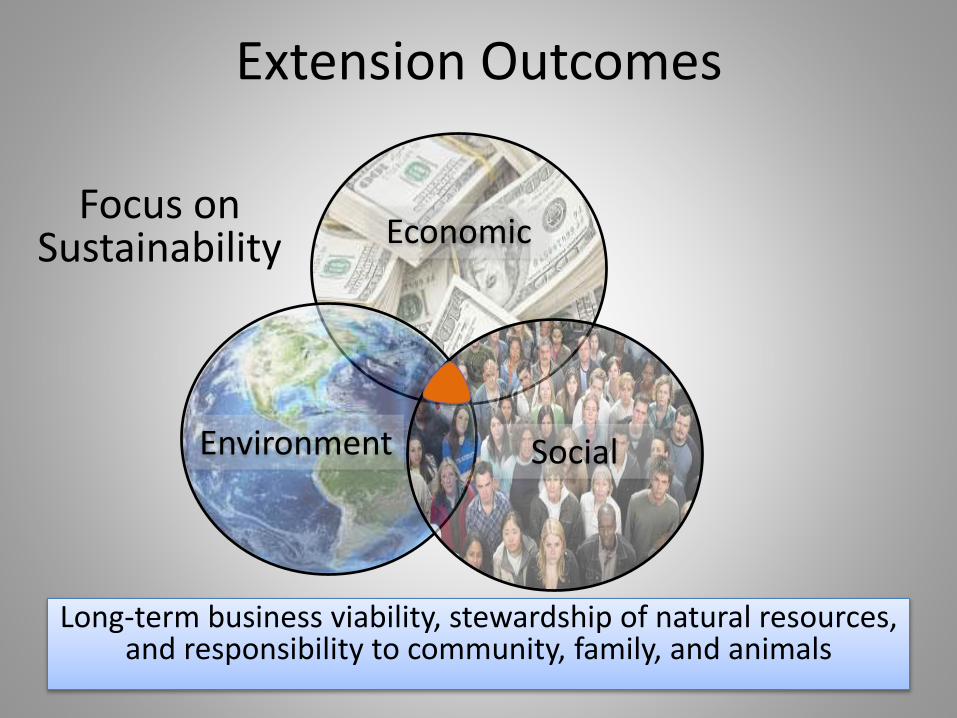
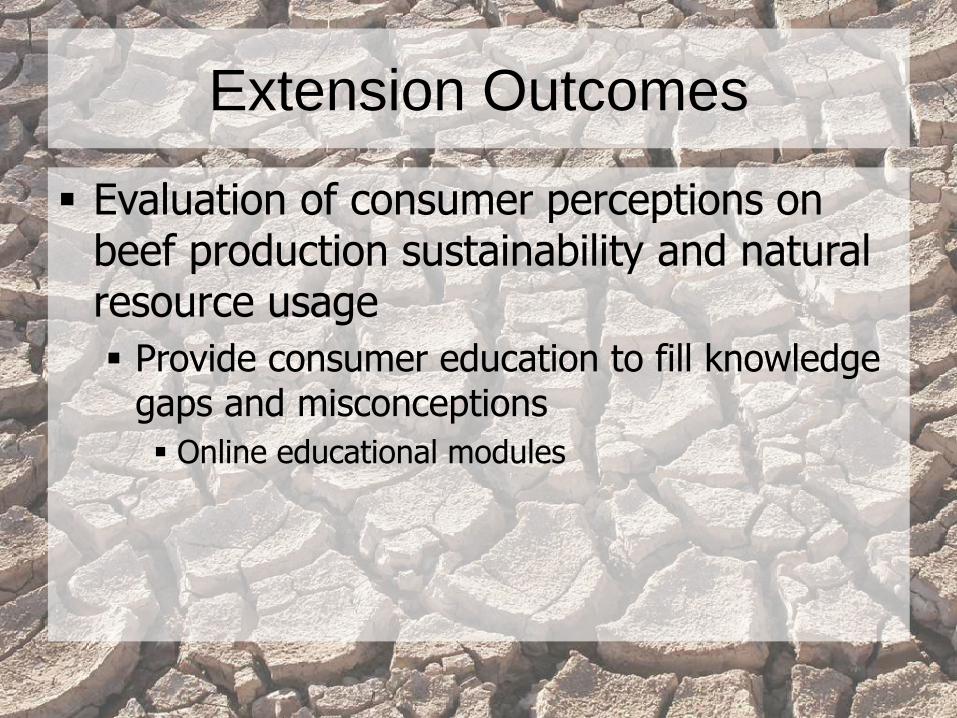
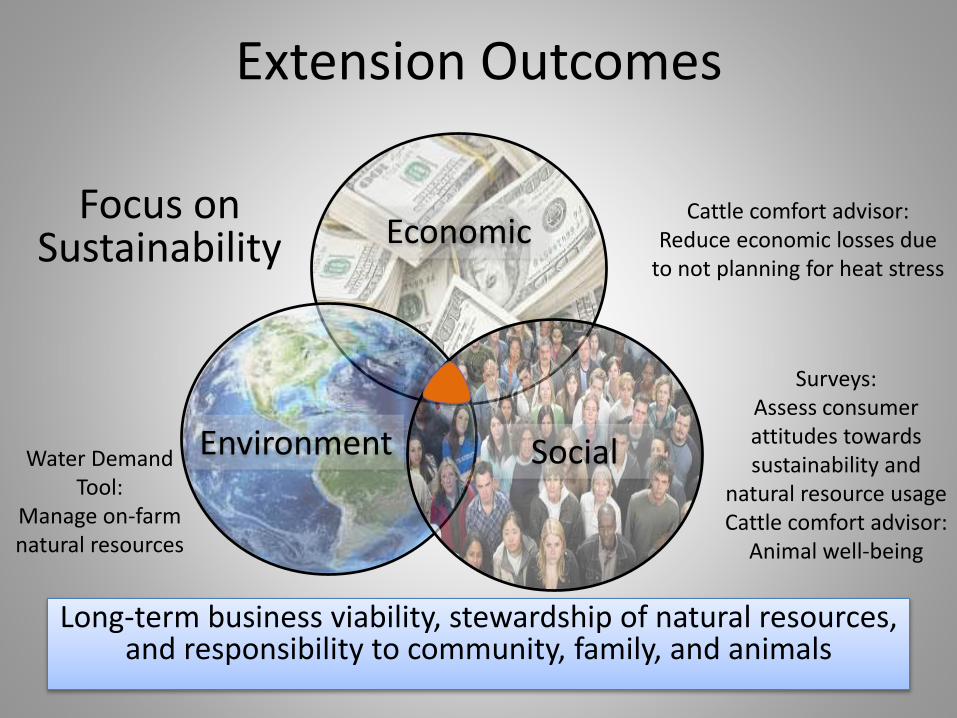
Extension Outcomes
Long-term business viability, stewardship of natural resources, and responsibility to community, family, and animals
Economic
Environment Social
Focus on Sustainability
Extension Outcomes
Evaluation of consumer perceptions on beef production sustainability and natural resource usage
Provide consumer education to fill knowledge gaps and misconceptions
Online educational modules
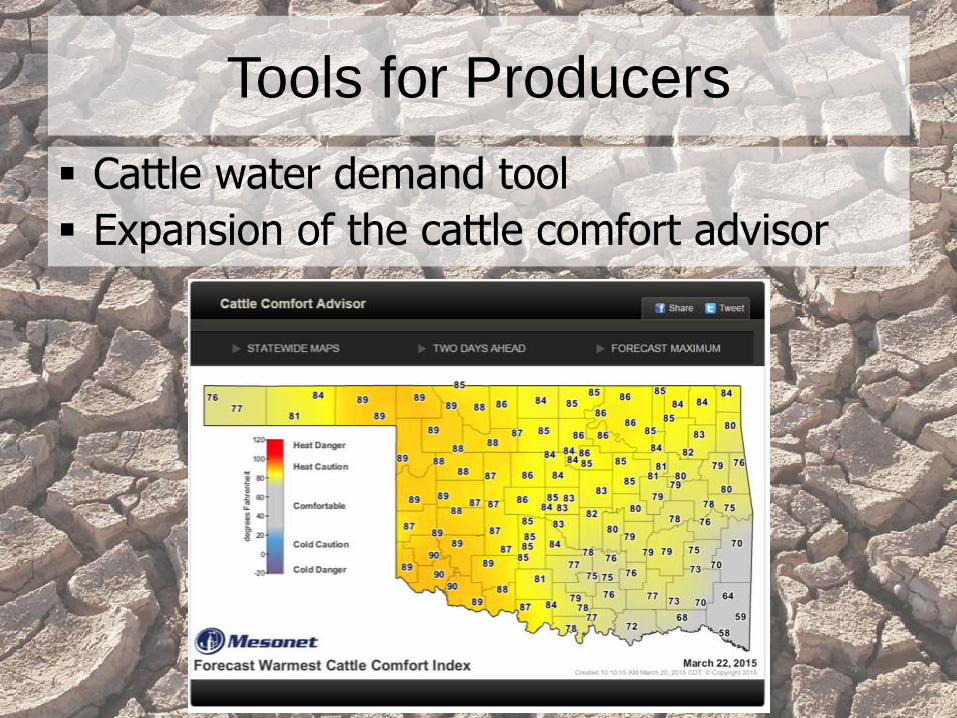
Tools for Producers
Cattle water demand tool
Expansion of the cattle comfort advisor
Extension Outcomes
Long-term business viability, stewardship of natural resources, and responsibility to community, family, and animals
Economic
Environment Social
Focus on Sustainability
Cattle comfort advisor:Reduce economic losses due
to not planning for heat stress
Water Demand Tool:
Manage on-farm natural resources
Surveys:Assess consumer attitudes towards sustainability and
natural resource usageCattle comfort advisor:
Animal well-being

Project Team
Oklahoma State UniversityMegan Rolf
Michelle Calvo-Lorenzo
Sara Place
Chris Richards
Clint Krehbiel
Udaya DeSilva
University of FloridaRaluca Mateescu
CollaboratorsDL Step-OSU Center for Veterinary Health Sciences
Al Sutherland-Oklahoma Mesonet
This project was supported by Agriculture and Food Research Initiative Competitive Grant no. 2014-67004-21624 from the USDA National Institute of Food and Agriculture.

Graduate Students
Rolf Lab Cashley Ahlberg Kristi Allwardt Ashley Broocks Justin Buchanan Kimberly Branham
Others Catherine Haviland Jake Reed Justin Lyles Emily Andreini Andrew Grimes

Thank you!
http://www.ansi.okstate.edu/research/labs/genetics/rolf/home


