Available on line at Association of the Chemical Engineers of Serbia AChE www.ache.org.rs/CICEQ Chemical Industry & Chemical Engineering Quarterly 19 (2) 241−252 (2013) CI&CEQ 241 MEHRI ESFAHANIAN MARYAM NIKZAD GHASEM NAJAFPOUR ALI ASGHAR GHOREYSHI Faculty of Chemical Engineering, Noushirvani University of Technology, Babol, Iran SCIENTIFIC PAPER UDC 004.8:60:661.722:663.15 DOI 10.2298/CICEQ120210058E MODELING AND OPTIMIZATION OF ETHANOL FERMENTATION USING Saccharomyces cerevisiae: RESPONSE SURFACE METHODOLOGY AND ARTIFICIAL NEURAL NETWORK In this study, the capabilities of response surface methodology (RSM) and artificial neural networks (ANN) for modeling and optimization of ethanol pro- duction from glucose using Saccharomyces cerevisiae in batch fermentation process were investigated. The effects of three independent variables in a defined range of pH (4.2-5.8), temperature (20-40 °C) and glucose concen- tration (20-60 g/l) on the cell growth and ethanol production were evaluated. The results showed that the prediction accuracy of ANN was apparently similar to RSM. At optimum conditions of temperature (32 °C), pH (5.2) and glucose concentration (50 g/l), suggested by the statistical methods, the maximum cell dry weight and ethanol concentration obtained from RSM were 12.06 and 16.2 g/l, whereas experimental values were 12.09 and 16.53 g/l, respectively. The present study showed that using ANN as a fitness function, the maximum cell dry weight and ethanol concentration were 12.05 and 16.16 g/l, respectively. Also, the coefficients of determination for biomass and ethanol concentration obtained from RSM were 0.9965 and 0.9853 and from ANN were 0.9975 and 0.9936, respectively. The process parameters optimization was successfully conducted using RSM and ANN; however, prediction by ANN was slightly more precise than RSM. Based on experimental data, the maximum yield of ethanol production of 0.5 g ethanol/g substrate (97% of theoretical yield) was obtained. Keywords: artificial neural network, ethanol fermentation, response surface methodology, Saccharomyces cerevisiae, ethanol yield. Fermentation is a complicated phenomenon intensely investigated in many bioprocesses [1]. The cost of alcohol production needs to be lowered via fermentation processes. Today, bioethanol production by fermentation is one of the popular subjects in the world with regards to the biological environment and economic challenges. In fact, bioethanol feedstock is produced from biomass which is depends on solar energy for converting simple raw lignocellulosic mate- rials to chemical fuel via biological routes [2]. In this Correspondence: G. Najafpour, Faculty of Chemical Engineer- ing, Noushirvani University of Technology, Shariati street, Babol, Iran. E-mail: [email protected]Paper received: 10 February, 2012 Paper revised: 14 May, 2012 Paper accepted: 5 June, 2012 view, knowing the optimum condition and estimation of bioethanol production from glucose can be very useful in industrial applications as the main goals in the present work, because any kind of raw materials as carbon sources first must be converted to glucose before the ethanol fermentation is performed. The fermentation process has both nonlinear and dynamic properties. Modeling such a process is difficult and challenging [1]. Considerable attempts have been made by several researchers to propose a metho- dology based on mathematical models [3,4]. A major disadvantage of these models is that they need a large number of experiments and it is often very com- plicated to describe the experimental observation [5]. A way of dealing with such problems is to use simple and efficient models, such as response surface metho- dology (RSM) and artificial neural network (ANN).
Transcript
Available on line at
Association of the Chemical Engineers of Serbia AChE www.ache.org.rs/CICEQ
Chemical Industry & Chemical Engineering Quarterly 19 (2) 241−252 (2013) CI&CEQ
241
MEHRI ESFAHANIAN
MARYAM NIKZAD GHASEM NAJAFPOUR
ALI ASGHAR GHOREYSHI
Faculty of Chemical Engineering, Noushirvani University of Technology, Babol, Iran
SCIENTIFIC PAPER
UDC 004.8:60:661.722:663.15
DOI 10.2298/CICEQ120210058E
MODELING AND OPTIMIZATION OF ETHANOL FERMENTATION USING Saccharomyces cerevisiae: RESPONSE SURFACE METHODOLOGY AND ARTIFICIAL NEURAL NETWORK
In this study, the capabilities of response surface methodology (RSM) and artificial neural networks (ANN) for modeling and optimization of ethanol pro-duction from glucose using Saccharomyces cerevisiae in batch fermentation process were investigated. The effects of three independent variables in a defined range of pH (4.2-5.8), temperature (20-40 °C) and glucose concen-tration (20-60 g/l) on the cell growth and ethanol production were evaluated. The results showed that the prediction accuracy of ANN was apparently similar to RSM. At optimum conditions of temperature (32 °C), pH (5.2) and glucose concentration (50 g/l), suggested by the statistical methods, the maximum cell dry weight and ethanol concentration obtained from RSM were 12.06 and 16.2 g/l, whereas experimental values were 12.09 and 16.53 g/l, respectively. The present study showed that using ANN as a fitness function, the maximum cell dry weight and ethanol concentration were 12.05 and 16.16 g/l, respectively. Also, the coefficients of determination for biomass and ethanol concentration obtained from RSM were 0.9965 and 0.9853 and from ANN were 0.9975 and 0.9936, respectively. The process parameters optimization was successfully conducted using RSM and ANN; however, prediction by ANN was slightly more precise than RSM. Based on experimental data, the maximum yield of ethanol production of 0.5 g ethanol/g substrate (97% of theoretical yield) was obtained.
Fermentation is a complicated phenomenon intensely investigated in many bioprocesses [1]. The cost of alcohol production needs to be lowered via fermentation processes. Today, bioethanol production by fermentation is one of the popular subjects in the world with regards to the biological environment and economic challenges. In fact, bioethanol feedstock is produced from biomass which is depends on solar energy for converting simple raw lignocellulosic mate-rials to chemical fuel via biological routes [2]. In this
Correspondence: G. Najafpour, Faculty of Chemical Engineer-ing, Noushirvani University of Technology, Shariati street, Babol, Iran. E-mail: [email protected] Paper received: 10 February, 2012 Paper revised: 14 May, 2012 Paper accepted: 5 June, 2012
view, knowing the optimum condition and estimation of bioethanol production from glucose can be very useful in industrial applications as the main goals in the present work, because any kind of raw materials as carbon sources first must be converted to glucose before the ethanol fermentation is performed. The fermentation process has both nonlinear and dynamic properties. Modeling such a process is difficult and challenging [1]. Considerable attempts have been made by several researchers to propose a metho-dology based on mathematical models [3,4]. A major disadvantage of these models is that they need a large number of experiments and it is often very com-plicated to describe the experimental observation [5]. A way of dealing with such problems is to use simple and efficient models, such as response surface metho-dology (RSM) and artificial neural network (ANN).
M. ESFAHANIAN et al.: MODELING AND OPTIMIZATION OF ETHANOL FERMENTATION… CI&CEQ 19 (2) 241−252 (2013)
242
Modeling and optimization to enhance the effi-ciency of a process is one of the most significant stages in a biochemical process [6]. The conventional one-factor-at-a-time approach of optimization is not only tiresome, but also ignores the merged interact-ions of each factor [7]. One of the most common opti-mization methods used in the last two decades is the Response Surface Methodology (RSM). RSM is a statistical technique based on the essential principles of statistics, randomization and duplication, which makes the optimization easier by studying the recipro-cal interactions among the variables over a wide range of values in a statistically logical manner [8]. Thus, RSM is an effective approach to deal with a large number of variables and there are various reports on the application of RSM for fermentation [9,10]. Although RSM has so many advantages, it is hard to say that it is applicable to all optimization and modeling studies [6].
Artificial Neural Network (ANN) has also been successfully applied in modeling of biological systems [10,11]. The advantages of ANN are that they need less time for development of the extensive experi-mentation. That is performed with limited numbers of experiments to predict the degree of non-linearity and their capability to learn complex relationships without requiring the knowledge of the model structure [12]. Moreover, it is a superior and more accurate model-ing technique than RSM, as ANN depicts the non-li-nearity of the model [7]. ANN cannot produce a model equation similar to RSM, but it estimates the res-ponse based on the trained data [6].
In the present work, ANN and RSM were used for modeling and optimization of ethanol production as a function of temperature, pH and glucose concen-tration in a batch fermentation using limited experi-mental runs. The accuracy of the estimated data was defined and then the overall prediction ability of these two techniques was assessed.
MATERIALS AND METHODS
Microorganism
The pure stock culture of Saccharomyces cere-visiae was used for ethanol production. The strain was originated from Persian Type Culture Collection (PTCC 24860), supplied by the Iranian Research Organization for Science and Technology (IROST). The medium used for cultivation contained glucose, NH4Cl and yeast extract: 10, 0.45 and 1 g/l, respecti-vely. The medium was autoclaved at 121 °C and 15 psig for 20 min. The sterilized medium was inoculated with 5% of pure seed culture of the microorganism
and then the culture was cultivated in an incubator and shaker at 30 °C for 24 h.
Growth media and culture conditions
The media were used for ethanol production contained various concentrations of glucose (20, 30, 40, 50 and 60 g/l), yeast extract and NH4Cl (3 and 5 g/l). A suitable proportion of potassium hydrogen phthalate 0.1 M and sodium hydroxide 0.1 M, as buf-fer solution for pH values of 4.2, 4.6, 5, 5.4 and 5.8 were prepared. The media were autoclaved at 121 °C and 15 psig for 20 min. The sterilized media were inoculated and cultivated in an incubator at 30 °C for 24 h. Batch fermentation experiments were carried out in 250 ml shaking flasks with working volume of 200 ml medium in incubator shaker (IKA, Japan) at various incubation temperatures (20, 25, 30, 35 and 40 °C) and 200 rpm for 30 h. Samples were period-ically taken from the culture every 2 hours for moni-toring the cell optical density, determination of the cell dry weight and concentration of produced ethanol. The optical density was measured at 620 nm by a spectrophotometer (Unico, USA). The cell dry weight was calculated based on a pre-developed calibration curve. The calibration curve was obtained based on optical density of broth solution with certain concen-tration of microorganism at 620 nm by a spectro-photometer. The experiments were conducted in tri-plicates and analysis of each sample was performed in duplicate. The volume changes caused by samples at the end of each run were less than 7%.
For determination of the glucose concentration, 2 ml sample was collected and cells were separated by centrifugation at 7000 g for 7 min by a micro cen-trifuge Hermle, model: Z 233 M-2 (Germany). The concentration of glucose in the media was determined by color-metric method using DNS reagent [13].
Ethanol analysis
The produced ethanol concentration was mea-sured using a gas chromatograph (Agilent, 7890A) equipped with a flame ionization detector (FID). The stainless steel packed column 1.83 m length and 2.1 mm I.D, 80/100 mesh Porapak Q (Supelco, USA) was used. The initial oven temperature was set at 120 ºC and hold for 1 min. Then, the oven temperature was increased at a rate of 40 °C/min until it reached to 185 °C and remained at this temperature for 8.5 min. The detector temperature was 225 °C. The carrier gas was nitrogen with a flow rate of 30 ml/min. The pro-pionic acid (Merck, Germany) or 2-propanol (Merck) prepared in 3 vol.% was used as internal standard. An exact volume of 50 µl the internal standard was added into 0.5 ml of the sample.
M. ESFAHANIAN et al.: MODELING AND OPTIMIZATION OF ETHANOL FERMENTATION… CI&CEQ 19 (2) 241−252 (2013)
243
Response surface methodology
One of the best models to describe the biolo-gical processes in analytical methods is quadratic model in comparison with linear and cubic equation. The relationship among the three factors is expressed in a second-order equation (Quadratic model):
= = == + +
3 3 3
0 11 1 1
i ij i ji i j
Y a a X a X X (1)
where Y is the predicted value, a0 is a constant and ai
and aij are the regression coefficients of the RSM model. The Xi and Xj are the factor variables [7]. Sta-tistical analysis of the experimental data was per-formed to evaluate the analysis of variance (ANOVA) using Design Expert software 7.01 (Stat-Ease, Inc, Minneapolis, MN, USA). In this study, maximum cell dry weight (Xmax) and ethanol concentration were inves-tigated as a function of temperature, pH and glucose concentration. S. cerevisiae was used in the same condition. Table 1 shows the coded values of different media factors and level of independent variables.
Coding of the variables was done according to the following equation:
− −=−
Actual Hi LowCoded
Hi Low
( ) / 2
( ) / 2
N N Nn
N N (2)
where nCoded is the coded variables and Ni is the actual variable.
All experiments were carried out in 250 ml flasks with working volume of 200 ml medium in an incu-bator-shaker at an agitation rate of 200 rpm for dura-tion of 30 h. The predicted values of the cell dry weight and ethanol concentration were based on the equation incorporated in the software. In fact, the predicted values were the responses of software for modeling in comparison to the actual values. Thus, the mathematical regression model for the maximum cell dry weight and ethanol concentration responses fitted in terms of coded factors was obtained as stated in Eqs. (8) and (9).
Artificial neural network
Artificial neural network (ANN) is a mathematical tool that tries to represent the low-level intelligence in natural organisms and it is a flexible structure,
capable of making a non-linear mapping between input and output spaces [14]. Especially in the past two decades, it has been greatly used in many fields of science and engineering. ANN consists of many simple computational elements, called nodes or neu-rons, organized in layers, operating in parallel [15]. Neurons are connected by weights that are modified during the learning phase [14]. All neural networks have three main layers which are called input, hidden and output layers [16]. Many classes of neural net-works exist in the literature such as, feed forward back propagation, recurrent neural networks, cascade correlation neural networks and radial basis function neural networks. All types of these network architec-tures have the same elements: neurons, layers and weights. The most common type of ANN in chemical engineering application is the multi-layer perceptron (MLP), which is a back propagation feed forward net-work [17]. In this work, a multi-layer feed forward neu-ral network has been used. MLP network consists of input and output layers, with several, but usually only one hidden layer [18]. In this particular ANN, informa-tion moves in only one direction, forward from the input layer, through the hidden layer and to the output layer [16]. The number of neurons in the input layer depends on the number of independent variables and the number of neurons in the output layer which cor-responds to the dependent variables. In this work, the independent variables were temperature, pH and glu-cose concentration and the output variable were ethanol concentration and maximum cell dry weight. The schematic representation of the neural network used for this work is illustrated in Figure 1.
It is necessary to train an artificial neural net-work before using it for a particular application [16]. Feed forward network training starts by applying the input vector to the input layer having network proces-sing element [17]. During the training, the network learns to create new outputs through a repetitive method [16]. Generated outputs by network are com-pared to the target. The network is adjusted, based on a comparison of the output and the target, until the network output matches the target. Basically, the pur-pose of training patterns is to reduce the global error. The aim of every training algorithm is to decrease this global error by adjusting the weights and biases [14].
Table 1. Experimental range of different media factors and level of independent variables
Range and levels Symbol Factor
+2 +1 0 -1 -2
40 35 30 25 20 A Temperature, °C 5.8 5.4 5 4.6 4.2 B pH
60 50 40 30 20 C Glucose concentration, g/l
M. ESFAHANIAN et al.: MODELING AND OPTIMIZATION OF ETHANOL FERMENTATION… CI&CEQ 19 (2) 241−252 (2013)
244
After training, the trained network was tested by test-ing data to further check if the network achieved good generalization. In this work, input and output data were scaled between 0 and 1, before training network as follows:
( )( ) ( )
( ) ( )
−
−
value
Actualvaluevalue
Actual value Actual value
Scaled =
Actual Minimum=
Maximum Minimum
(3)
Input data were randomized into three sets: learning, validation and testing. Usually, 30% of data are used for testing and the remaining 70% for train-ing and validation [16]. Activation function of the hid-den layer was “logsig” and the one in the output layer was “purelin”.
−=+
1logsig( )
1 e xx (4)
=purelin( )x x (5)
Training of the network was performed with the function of “trainlm”, which updates weight and bias values according to the Levenberg-Marquardt optimi-zation. In learning of the network, “learngd” was used as the adaption learning function. The maximum train-ing epochs were 1000, and the mean square error was 0.0001. The other parameters of neural network were taken as defaults of neural network toolbox, MATLAB. The performance of the ANN was statis-tically measured by the mean squared error (MSE) and the coefficient of determination (R2) as follows:
( )=
−=
2
pre, e xp,1
n
i ii
X XMSE
n (6)
( )( )
=
=
−= −
−
2
pre, exp,2 1
2exp,
1
1
n
i ii
n
ii
X XR
X X (7)
where Xpre,i is the predicted output from observation i, Xexp,i is the experimental (target) output from obser-vation i, X is the average value of experimental out-put, and n is the total number of data.
RESULTS AND DISCUSSION
Response surface methodology
RSM is a frequently useful technique for model-ing and determining the optimal process conditions. Based on the experimental results of the central com-posite design (CCD) in Tables 2 and 3, a second-order polynomial equation (quadratic model) was established to identify the relationship between maxi-mum cell dry weight, produced ethanol concentration and three batch fermentation conditions.
Statistical testing of the model for each res-ponse was done by Fisher’s statistical test for anal-ysis of variance (ANOVA). The fitted polynomial equation was expressed as three-dimensional surface plots to imagine the relationship between responses and experimental levels of each factor used in the design [19]. The goodness of fit of the model can be investigated by determination coefficient (R2) and using adjusted R2 and predicted R2. The value of R2 is
Figure 1. Schematic representation of the three layer feed forward neural network.
M. ESFAHANIAN et al.: MODELING AND OPTIMIZATION OF ETHANOL FERMENTATION… CI&CEQ 19 (2) 241−252 (2013)
245
the percentage variability in the cell dry weight and ethanol concentration values that are defined by this model. It falls between 0 and 1. The adjusted R2 is the value adjusted down for a higher number of variables in the model which makes it much more useful than the usual value of R2 and it is suggested to use R2 adjusted rather than the regular R2 to estimate the fit of a multiple regression model. Predicted R2 is used in regression analysis to show how well the model predicts responses for new observations; predicted R2 can impede over fitting. Larger values of predicted R2 suggest models of greater predictive ability [20]. In this study, it was aimed to model the microorganism growth, ethanol biosynthesis and also to model cul-ture cell dry weight for enhanced maximal ethanol production. The results from the analysis of variance of the designed experiments showed that the adjusted and predicted R2 for Xmax were 0.9933 and 0.9712, and for ethanol concentration 0.9721 and 0.8770, res-pectively. The very high values of R2 imply that the model fitted very well and can predict the responses satisfactorily.
After square root transformation of the Xmax and ethanol concentration, the responses recommended by the Box–Cox plot, regression analysis of the expe-riments exhibited that the quadratic model terms for
Xmax (A2, B2 and C2) and interactive model terms (AB)
were significant (P < 0.05, without insignificant terms). Values of “Prob > F” less than 0.05 indicate that the model terms were significant. Also, the linear model terms (A, B and C) were found to be significant (P < < 0.05) in modeling of the cell dry weight. However, the interactive model terms (AC and BC) were insig-nificant (P > 0.05). But for ethanol concentration, the linear model terms (A, B and C) and the quadratic model terms (A2, B2 and C2) were significant model terms, while the interactive model terms (AB, AC and BC) were found to be insignificant. It was noted that A, B and C are temperature, pH and glucose concen-tration, respectively.
By applying the multiple regression analysis, the results were fitted to a second-order polynomial equa-tion. The ANOVA test output can be investigated in Tables 4 and 5. Thus, the mathematical regression model for maximum cell dry weight and ethanol con-centration responses fitted in terms of coded factors was obtained as follows:
= + + + − +
+ + − −
− −
max
2
2 2
12 0.51 0.45 0.44 0.37
0.037 0.032 0.37
0.28 0.39
X A B C AB
AC BC A
B C
(8)
Table 2. CCD matrix of three factors and experimental data, RSM and ANN for determined values of maximum cell dry weight
A B C Xmax / g l–1
RSM ANN
Temperature, °C pH Concentration, g/l Experimental value Model value Relative error, % Model value Relative error, %
25 4.6 30 9.30 9.250 0.54 9.321 0.22
35 4.6 30 10.9 10.945 0.41 10.923 0.21
25 5.4 30 10.83 10.835 0.04 10.812 0.16
35 5.4 30 10.99 11.041 0.46 10.975 0.13
25 4.6 50 10.12 10.001 1.17 10.094 0.25
35 4.6 50 11.89 11.835 0.46 11.863 0.22
25 5.4 50 11.80 11.705 0.80 11.692 0.91
35 5.4 50 12.09 12.059 0.25 12.051 0.32
20 5 40 9.40 9.500 1.06 9.441 0.48
40 5 40 11.58 11.540 0.34 11.563 0.14
30 4.2 40 9.93 9.980 0.50 9.900 0.30
30 5.8 40 11.76 11.780 0.17 11.743 0.14
30 5 20 9.60 9.560 0.41 9.541 0.61
30 5 60 11.20 11.320 1.07 11.163 0.33
30 5 40 12.000 12.000 0.00 11.921 0.65
30 5 40 11.990 12.000 0.08 11.970 0.16
30 5 40 11.980 12.000 0.16 12.013 0.27
30 5 40 11.990 12.000 0.08 12.018 0.23
30 5 40 12.000 12.000 0.00 11.897 0.85
30 5 40 12.000 12.000 0.00 11.965 0.29
M. ESFAHANIAN et al.: MODELING AND OPTIMIZATION OF ETHANOL FERMENTATION… CI&CEQ 19 (2) 241−252 (2013)
246
[ ] = + + +
+ + + + −
− − −2 2 2
Ethanol concentration 15.50 0.5 1.26
1.87 0.13 0.071 0.20
0.66 0.79 0.56
A B
C AB AC BC
A B C
(9)
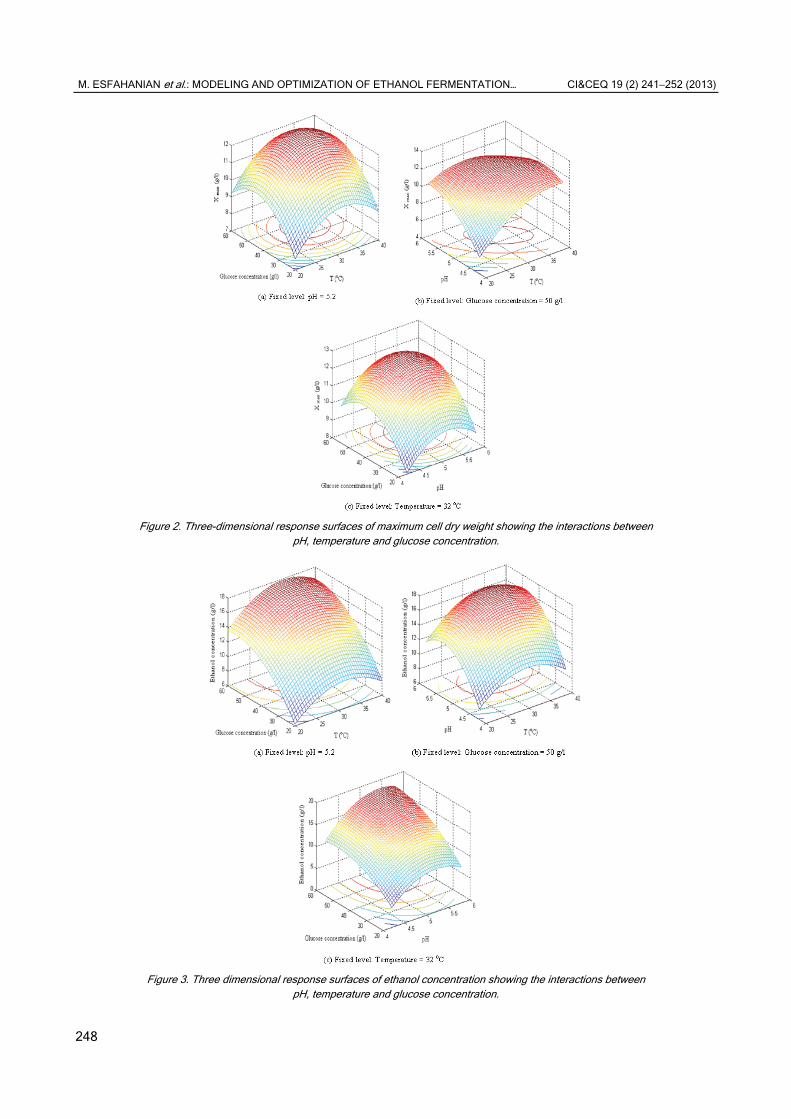
The analysis of the 3D surface and contour plot of the maximum cell dry weight and produced ethanol concentration using response surface quadratic model, and also based on Eqs. (8) and (9), are shown in Figures 2 and 3. These figures explain the effect of three independent variables: temperature, glucose concentration and pH on the two responses, including Xmax and ethanol concentration. In order to determine the optimal levels of each variable for Xmax and maxi-
mum ethanol production, isoresponse contour plots were constructed by plotting the responses (Xmax and ethanol concentration) on the Z-axis versus the two independent variables, while other variables were at their optimal levels, which was useful for understand-ing both the main and the interaction effects of these two factors. The response surface can be used to predict the optimum range for different values of the test variables, and the main interactions between the experiment variables can be identified from the cir-cular or elliptical nature of the contours. The circular nature of the contours imply that the interactive effects between the test variables are not significant
Table 3. CCD matrix of three factors and experimental data, RSM and ANN for determined values of ethanol concentration
A B C Ethanol concentration, g/l
RSM ANN
Temperature, °C pH Concentration, g/l Experimental value Model value Relative error, % Model value Relative error, %
25 4.6 30 10.03 10.261 2.30 9.91 1.19
35 4.6 30 10.56 10.859 2.83 10.719 1.50
25 5.4 30 11.94 12.121 1.51 11.832 0.90
35 5.4 30 12.90 13.239 2.62 13.094 1.50
25 4.6 50 13.89 13.459 3.10 13.648 1.74
35 4.6 50 14.62 14.341 1.90 14.900 1.91
25 5.4 50 16.53 16.119 2.48 16.163 2.22
35 5.4 50 17.86 17.521 1.89 17.663 1.10
20 5 40 11.72 11.860 1.19 12.010 2.47
40 5 40 13.93 13.860 0.50 13.951 0.15
30 4.2 40 9.78 9.820 0.40 9.810 0.30
30 5.8 40 14.78 14.860 0.54 14.482 0.41
30 5 20 10.08 9.520 5.55 9.715 3.62
30 5 60 16.32 17.000 4.16 16.461 0.86
30 5 40 15.49 15.500 0.06 15.361 0.83
30 5 40 15.48 15.500 0.12 15.297 1.18
30 5 40 15.47 15.500 0.19 15.402 0.43
30 5 40 15.50 15.500 0.00 15.511 0.07
30 5 40 15.49 15.500 0.06 15.509 0.12
30 5 40 15.48 15.500 0.12 15.541 0.39
Table 4. Analysis of variance (ANOVA) for experimental results of the maximum cell dry weight design (Quadratic model); values of “Prob > F” less than 0.05 indicate model terms are significant
P-value, Prob > FStandard error Mean squareDegree of freedomSum of squaresCoefficient estimate Factor <0.00010.020 4.1814.18 0.51 A <0.00010.020 3.2013.20 0.45 B <0.0001 0.020 3.13 1 3.13 0.44 C
<0.00010.028 1.0711.07 -0.37 AB 0.2146 0.028 0.011 1 0.011 0.037 AC
M. ESFAHANIAN et al.: MODELING AND OPTIMIZATION OF ETHANOL FERMENTATION… CI&CEQ 19 (2) 241−252 (2013)
247
and optimum values of the test variables can be easily obtained with regarding to the center point of contour plot. According to Figure 2 (a and c), the contours around the stationary point were circular and it means that the interaction between temperature and glucose concentration and also pH and glucose concentration on maximum biomass concentration were insignificant. On the other hand, according to Figure 2b, the contour around the stationary point was elliptical and it became elongated more and more along the both pH and temperature axis. This means that the interaction between temperature and pH on biomass concentration was significant and a small change of these two variables causes a big change of cell dry weight. It was evident that Xmax increased in range of 4 to 12 g/l with increasing of the pH and temperature to 5.2 and 32 °C, respectively, at the optimum glucose concentration of 50 g/l and then decreased. The significant interaction between tem-perature and initial pH were apparent not only from the elliptical nature of the contour plot, but also from the low probability value (P < 0.05). In addition, the maximum ethanol concentration was 17.86 g/l at the optimum condition, as illustrated in Figure 3. Accord-ing to the contour plot of ethanol concentration, the interaction between each pair of the mentioned independent variables shows a less interactive effect.
Artificial neural network
Experimental values for ethanol concentration and maximum cell dry weight in Tables 2 and 3 were used with an ANN to model the fermentation process.
Figure 4 shows the average relative deviation (ARD) of testing data versus number of neurons in the hidden layer. This graph clearly shows that the 3-6-2 topology is the best topology, with a minimum value of error for ethanol concentration and Xmax. ARD is selected as the criterion for the accuracy of each topology. ARD can be calculated as follows:
=
−= × exp, pre,
1 exp,
100 n i i
i i
X XARD
n X (10)
Therefore, a 3-6-2 topology was chosen as the best topology for modeling the fermentation and was built with Neural Network toolbox, MATLAB R2009b. The best network model was the network having the minimum MSE and maximum R2 using predicted and experimental data. After training, the trained network was tested using the experimental data to further check if the network achieved good generalization. The results after training and testing are presented in Tables 2 and 3.
From the training and testing process, MSE and R2 between the predicted values and experimental values were obtained. The R2 for the maximum bio-mass and ethanol concentrations were 0.9976 and 0.9936, respectively. In addition, the values of MSE for the two responses were 0.0022 and 0.0358, res-pectively.
Comparison of RSM and ANN
After the model was built, the performance of RSM and ANN models was also compared. Results of the two methods are summarized in Tables 2 and 3. Figures 5 and 6 show the plots of predicted Xmax and ethanol concentration by ANN and RSM against the experimental values, respectively. The results showed that ANN predictions were closer to 45° dia-gonal; which means perfect prediction than those of RSM. It means that ANN has higher performance than RSM for the prediction of Xmax and ethanol concentra-tions.
Also, for similar conditions, the relative errors of ANN related to experimental data were less than RSM. At optimum conditions, the maximum predicted biomass and ethanol concentration with ANN were 12.32 and 17.58 g/l, respectively. These values were
Table 5. Analysis of variance (ANOVA) for experimental results of produced ethanol concentration design (quadratic model); values of “Prob > F” less than 0.05 indicate model terms are significant
P-value, Prob > FStandard error Mean squareDegree of freedomSum of squaresCoefficient estimate Factor 0.00060.10 3.9713.97 0.50 A
<0.00010.10 25.33125.33 1.26 B <0.0001 0.10 56.06 1 56.06 1.87 C
0.39070.14 0.1310.13 0.13 AB 0.6302 0.14 0.041 1 0.041 0.071 AC
M. ESFAHANIAN et al.: MODELING AND OPTIMIZATION OF ETHANOL FERMENTATION… CI&CEQ 19 (2) 241−252 (2013)
248
Figure 2. Three-dimensional response surfaces of maximum cell dry weight showing the interactions between
pH, temperature and glucose concentration.
Figure 3. Three dimensional response surfaces of ethanol concentration showing the interactions between
pH, temperature and glucose concentration.
M. ESFAHANIAN et al.: MODELING AND OPTIMIZATION OF ETHANOL FERMENTATION… CI&CEQ 19 (2) 241−252 (2013)
249
Figure 4. ARD of testing data versus neuron number in hidden layer.
Figure 5. The values of Xmax predicted by ANN and RSM versus the experimental ones.
in good agreement with experimental data, as maxi-mum cell and ethanol concentration at optimum con-dition were 12.35 and 17.92 g/l, respectively. It is worth to mention that those values by RSM were 12.31 and 17.49 g/l, respectively. Therefore, at optimum condi-tions, the relative error in RSM was more than ANN. So, ANN is more capable than RSM for prediction of Xmax and ethanol concentration compared to the ob-tained experimental data.
Table 6 shows higher R2, and lower MSE and ARD values obtained by the neural network com-pared to those of the RSM model. Thus, the accuracy
of neural network model was more desired and was better fitted to the data compared to the RSM method.
Literatures about optimization and modeling of ethanol fermentation by RSM and ANN from various biomass sources and microorganisms as function of different parameters such as temperature, pH, fer-mentation time and inoculums size were discussed. Ezhumalai et al. [10] had investigated optimization of incubation temperature (25–45 °C), pH (5–7) and fer-mentation time (24–120 h) using RSM and ANN in bio-conversion of steam pretreated sugarcane bagasse into ethanol by cellulase and thermotolerant yeast
M. ESFAHANIAN et al.: MODELING AND OPTIMIZATION OF ETHANOL FERMENTATION… CI&CEQ 19 (2) 241−252 (2013)
250
Kluyveromyces marxianus var. marxianus MTCC 3013. They have reported that the optimum values of temperature, pH and fermentation time were 39 °C, 5.7 and 110 h, respectively. At optimum conditions, maximum ethanol concentration of 5.89 g/l was achieved from 50 g/l pretreated sugarcane bagasse in aerobic batch fermentation. Also, in another investi-gation [21], studied on bioconversion of lignocellulosic material such as pretreated sugarcane bagasse into ethanol by cellulase and candida wickerhamii MTCC 3013 based on CCD experiments. Optimum condi-tions were obtained at a temperature of 33 °C, pH of 5.7 and fermentation time of 104 h. Maximum ethanol concentration at optimum conditions was 4.28 from 50 g/l pretreated sugarcane bagasse in aerobic batch fermentation. Beside, Yan et al. [22] have assessed the optimization of the alcoholic fermentation of blue-berry juice by AS 2.316 S. cerevisiae wine yeast. Through statistically designed optimization, the opti-mal conditions of alcoholic fermentation were found to be temperature of 22.65 °C, pH value of 3.53 and inoculum size of 7.37%. At the optimal condition, the production of ethanol and volatile acid of blueberry wine had achieved up to 7.63% and 0.34 g /l, respec-
tively. High ethanol concentration (47g/l) for an immo-bilized cell reactor, using high substrate concentration (150g/l) has been reported in the literature as the enhanced ICR system was continuous [23]. The yield of ethanol produced in ICR was 0.32 g ethanol/g sugar; however, in this work, a batch process using low concentration of sugar resulted in 0.36 g etha-nol/g sugar.
In this work, optimization of ethanol fermentation from glucose using Saccharomyces cerevisiae PTCC 24860 was performed by RSM and ANN. The inves-tigated parameters were temperature (20-40 °C), pH (4.2-5.8) and glucose concentration (20-60 g/l). At optimum conditions, including temperature of 32 °C, pH of 5.2 and glucose concentration of 50 g/l obtained by RSM, the maximum ethanol and biomass concentration were 17.92 and 12.35 g/l, which was in good agreement with the predicted values of ANN. In addition, the relative error in RSM was more than ANN only at optimum conditions. Therefore, ANN is more capable than RSM for prediction of Xmax and ethanol concentration in comparison with experimen-tal data.
Figure 6. The values of ethanol concentration predicted by ANN and RSM versus the experimental ones.
Table 6. Statistical results of the neural network and RSM models
Model name Statistical criterions Ethanol concentration, g/l Xmax
ANN MSE
R2
ARD
0.0358
0.9936
1.1140
0.0022
0.9975
0.3435
RSM MSE
R2
ARD
0.0824
0.9853
1.576
0.0033
0.9965
0.395
M. ESFAHANIAN et al.: MODELING AND OPTIMIZATION OF ETHANOL FERMENTATION… CI&CEQ 19 (2) 241−252 (2013)
251
CONCLUSION
This study investigated ethanol production using Saccharomyces cerevisiae from glucose. Interaction of three independent variables, pH of media (4.2-5.8), temperature (20-40 °C) and glucose concentration (20-60 g/l), in the batch fermentation was investi-gated. Also, this work described the use of RSM for optimization of ethanol production. Two models were developed for ethanol concentration. In this process, using RSM and ANN methods, maximum cell dry weight prediction was obtained. The best models for RSM and ANN methodologies by quadratic model and multilayer feed forward network were obtained. The optimum process conditions, glucose concentra-tion of 50 g/l, pH value of 5.2 and media temperature of 32 °C were obtained. Finally, these two methods were compared for their predictive abilities. The highest R2 and lowest MSE and ARD for ANN model with high accuracy and capability of prediction of the given model were identified.


![Abstract arXiv:1801.01442v1 [cs.CV] 6 Dec 2017 · Jose Sotelo, Soroush Mehri, Kundan Kumar, Joao Felipe Santos, Kyle Kastner, Aaron Courville, and Yoshua Bengio. Char2wav: End-to-end](https://static.documents.pub/doc/80x56/5f96abb5bb0b302efd017666/abstract-arxiv180101442v1-cscv-6-dec-2017-jose-sotelo-soroush-mehri-kundan.jpg)


