18

2
Acknowledgments
In the realization of this work to the following
professionals:
Alvaro Andrade Clavijo - FANCESA. Industrial Engineer.
Rolando Valdivia - UMRPSFXCH. Industrial Engineer.

3
This PDF document is a summary of the project consistent of 230 pages.

4
CONTENT
Acknowledgments...........................................2
Abstract..................................................5
1. Introduction...........................................7
2. Sector Analysis........................................7
3. Model Development.....................................10
4. Results...............................................12
5. Conclusions...........................................15
6. Bibliography..........................................17

5
ABSTRACT
This document introduce the obtained results of the
econometric estimation of cement demand and supply in Bolivia
considered as a simultaneous equations model, based on two
equations, one for the demand and another for the supply. The
objective of this study is to quantify the forces that affect
the cement market in the period understood among the years
1994 up to 2003.
Five models of simultaneous equations were considered, which
are based on the respective linear functions of cement demand
and supply to be able to explain the coefficients associated
to the variables in form of elasticities. The estimates were
made following the classic methodology of econometrics with
the respective statistical validation, being carried out the
individual and groupal validation of the coefficients
associated to each variable indicating the statistic
significance of the same ones.

6
7
1. INTRODUCTION
Cement is an indicator of supreme importance to reflect the
economic situation of a country. The cement demand and supply
in Bolivia are variable and subject to several factors,
according to Armando Gumucio is considered that the item of
the construction of highways making use of the rigid pavement
uses in the country in a direct way from 2.000 to 2.500
people and easily of 30.000 at 40.000 in an indirect way.
2. SECTOR ANALYSIS
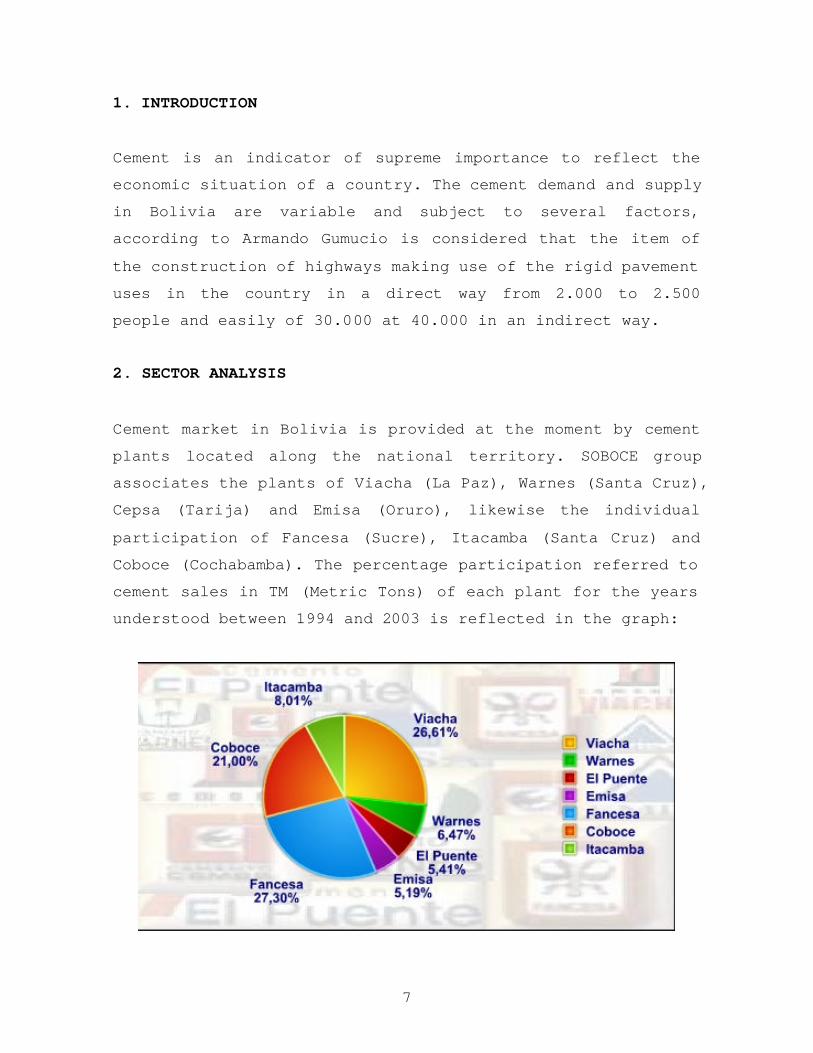
Cement market in Bolivia is provided at the moment by cement
plants located along the national territory. SOBOCE group
associates the plants of Viacha (La Paz), Warnes (Santa Cruz),
Cepsa (Tarija) and Emisa (Oruro), likewise the individual
participation of Fancesa (Sucre), Itacamba (Santa Cruz) and
Coboce (Cochabamba). The percentage participation referred to
cement sales in TM (Metric Tons) of each plant for the years
understood between 1994 and 2003 is reflected in the graph:

8
Fancesa (Sucre) leads the percentage participation in Bolivia
(27.3%) followed very closely by Viacha (La Paz) (26.61%), in
third comparative place it is observed Coboce (Cochabamba)
(21.0%) followed by Warnes (6.47%), El Puente (5.41%) and
lastly Emisa (5.19%). The percentage variation of the
national GDP and the sector of the Construction and Public
Works are reflected in the following graph:
The clear effect of the economic crisis is evidenced in these
indicators, being appreciated a negative variation for 1999
due to the severe economic crisis that affected the country
in that period of time, for the later years a light recovery
is observed.
The following graph indicates the evolution of the cement
demand and supply at national level:

9
The graph shows the almost parallel evolution of the cement
demand and supply in Bolivia reflecting a maximum in the
demand and supply in 1999 taking place a gradual decrease in
later years as clear indicator of the economic crisis in
which Bolivia was involved. In 2001 a light increment is
observed from now on.
The following graph indicates the installed and occupied
capacities in Bolivia:
10
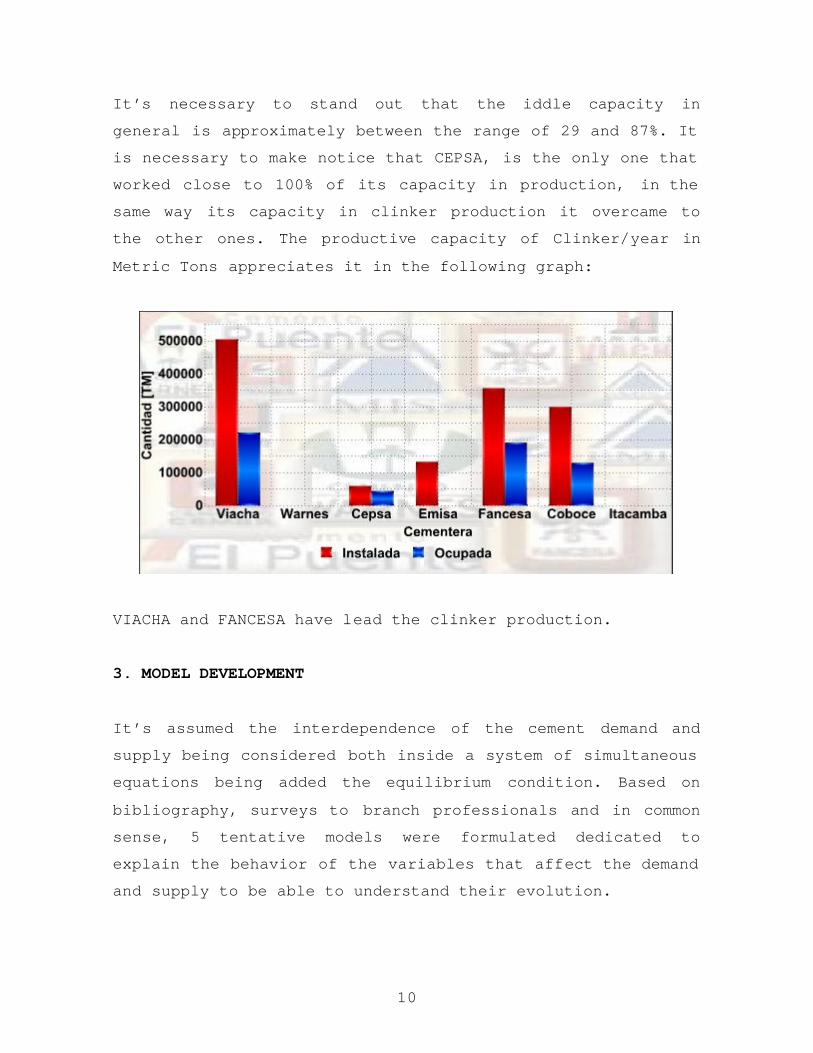
It’s necessary to stand out that the iddle capacity in
general is approximately between the range of 29 and 87%. It
is necessary to make notice that CEPSA, is the only one that
worked close to 100% of its capacity in production, in the
same way its capacity in clinker production it overcame to
the other ones. The productive capacity of Clinker/year in
Metric Tons appreciates it in the following graph:
VIACHA and FANCESA have lead the clinker production.
3. MODEL DEVELOPMENT
It’s assumed the interdependence of the cement demand and
supply being considered both inside a system of simultaneous
equations being added the equilibrium condition. Based on
bibliography, surveys to branch professionals and in common
sense, 5 tentative models were formulated dedicated to
explain the behavior of the variables that affect the demand
and supply to be able to understand their evolution.
11
Due to their particular characteristics and after the
respective identifications the next step is estimate the same
ones using the TSLS method for each one (over-identificated).
Likewise the prices and quantities of equilibrium are
obtained for every year.
The variables included in the cement demand equation (DCt)
(TM) are:
- Cement Price (PCt)($us/50 kg bag)
- National GDP per capita (PIBt) ($us/hab)
- Construction National GDP per capita (PIBCt) ($us/hab)
- Cost ratio Construction (ICCt)
- Telluric Motion (MTt) *
- Built Roads Length (LCCt) (thousands of Km)
- Gross Fixed Capital Formation (FBCCt) (thousands of Bs.)
For cement supply (OCt)(TM):
- Cement Price (PCt)($us/50 kg bag)
- Lagged Cement Price (PCt-1) ($us/50 kg bag)
- Inputs Production ratio (IPt)
- Public Investment in Infrastructure (IPEIt) (millions $us)
- Installed Capacity (CIt) (TM)
- Quality Certificates (CCt) *
* Dummy variables.
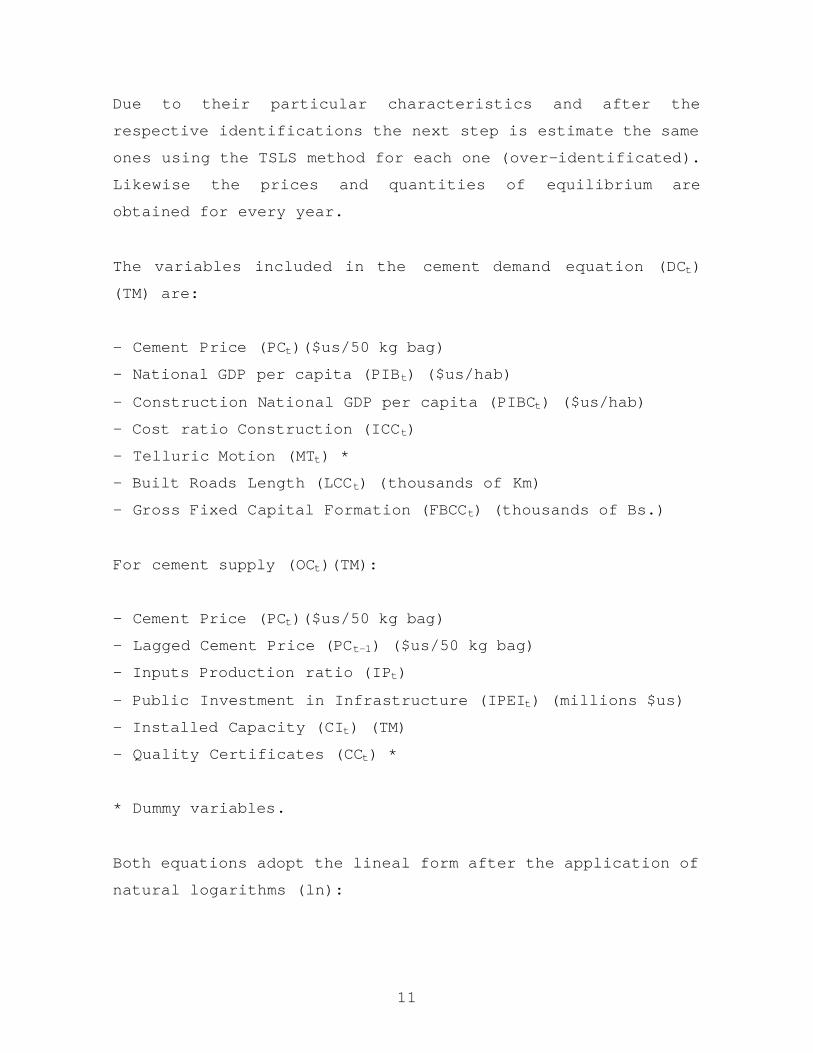
Both equations adopt the lineal form after the application of
natural logarithms (ln):
12
ttttttttt uFBCCLCCMTICCPIBCPIBPCDC ++++++++= 76543210 αααααααα
tttttttt vCCCIIPEIIPPCPCOC +++++++= − 65431210 βββββββ
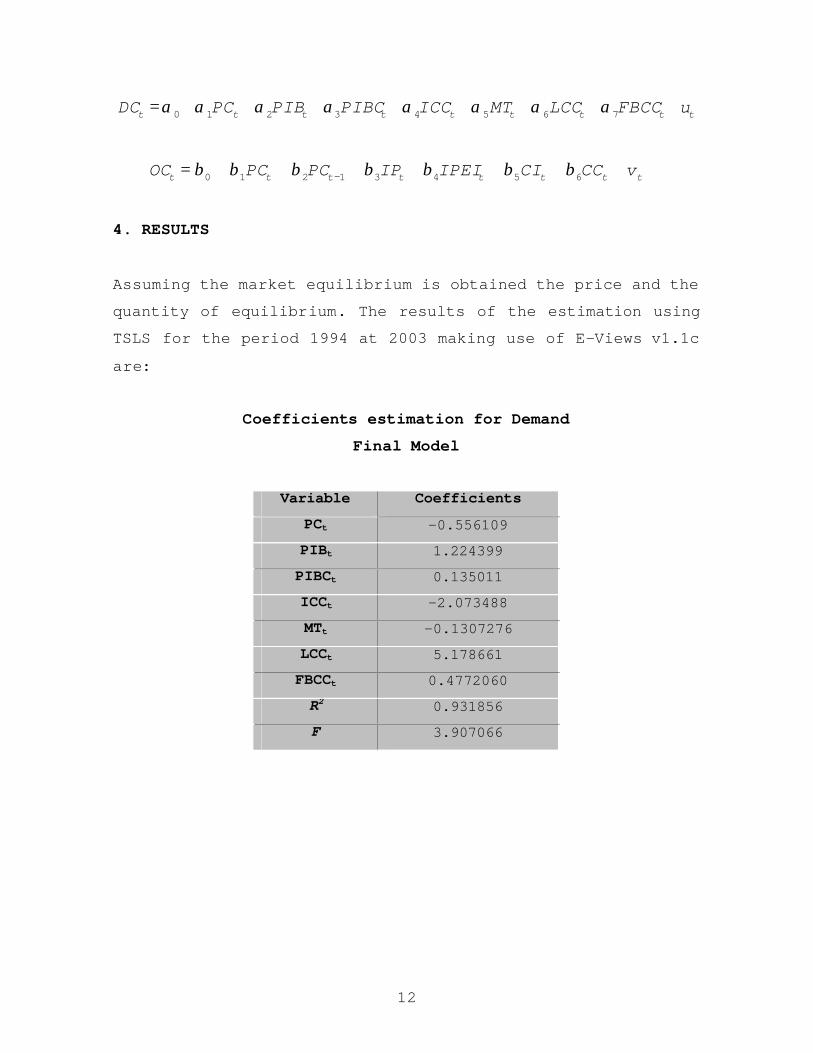
4. RESULTS
Assuming the market equilibrium is obtained the price and the
quantity of equilibrium. The results of the estimation using
TSLS for the period 1994 at 2003 making use of E-Views v1.1c
are:
Coefficients estimation for Demand
Final Model
Variable Coefficients
PCt -0.556109
PIBt 1.224399
PIBCt 0.135011
ICCt -2.073488
MTt -0.1307276
LCCt 5.178661
FBCCt 0.4772060
R2 0.931856
F 3.907066

13
Coefficients estimation for Supply
Final Model
Variable Coefficients
PCt 0.06302695
PCt-1 0.16221071
IPt 0.0784555
IPEIt -0.686210
CIt 0.38163385
CCt 0.00285663
R2 0.984003
F 30.75632
BEST MODEL SELECTION
For the selection of the pattern that explains in a better
way the behavior of the cement demand and supply in Bolivia
was considered:
1. The sign concordance obtained in the estimation compared with a priori expectations for each coefficient related with
their respective variable.
2. The value of 2R (R-squared) that measures the adjustment
kindness for each equation. While higher it is this
coefficient in the regression, in a better way it will
explain the behavior of the dependent variable.
3. The individual statistic for each coefficient indicating
statistically if they are significant and therefore they
deserve to be present in each equation.
14
4. The value of F statistic, which indicates if jointly all
the considered variables are statistically significant to be
included in their respective equation.
=> The 2R calculated for the last model is the highest in comparison to the rest (not presented in this summary). The a
priori signs are the expected ones for each coefficient
associated to the respective variable with the exception of
variable (IPEIt), with a negative sign contrarily to the
expectation. Explained, possibly, to the final use that the
invested mount by the government in infrastructure, the
reality is different considering the data. The signs and the
magnitudes of the rest of the variables are reasonable and
they are agree with the expectations.
- It was for almost the entirety of the coefficients the
presence of a high colineality, reflected in the non-
statistical significance of the parameters that however for
prediction terms they are not a problem.
- The F statistic rejects the null hypothesis that affirms
that the coefficients included in the model are similar or
equal to zero.

15
PRICE AND EQUILIBRIUM QUANTITY
The prices and equilibrium quantities are detailed in the
following chart:
Year Equilibrium Price
[$us/bag] Equilibrium Amount [TM]
1994 3.67 796974
1995 4.32 900914
1996 5.32 916208
1997 4.24 1057562
1998 4.89 1164185
1999 4.56 1178601
2000 4.56 1065134
2001 4.51 980404
2002 4.95 1032325
2003 4.87 1126219
5. CONCLUSIONS
The main conclusion in this work is that the cement in
Bolivia is ruled under the classic laws of demand and supply.
Numeric values were obtained on the variables that affect
jointly the cement demand and supply in Bolivia expressed in
elasticities. It was found that the elasticity estimated for
the price of the demand has an inelastic value of -0.55610961
in absolute value, indicating that before an increment of the
cement price at national level of 1%, we hope the cement
demand in Bolivia dicreases approximately in 0.56%. Another
elasticity that deserves an analysis is the GDP per capita,
before an increment in the GDP per national capita of 1%, we
hope the cement demand in Bolivia is increased approximately

16
in 1.22%. The elasticity of higher value estimated for the
demand equation is referred to the variable Lenght of Built
Roads (LCCt) 5.178661 indicating that if is observed the
increment of this variable in 1%, we wait that the cement
demand at national level is increased approximately in 5.18%.
The variable GDP of the Construction was added (PIBCt) to
measure the contribution on the cement demand being an
inferior value to the GDP per capita.
In the same way for supply: The offer equation has
characteristic of distributed lagged because it was added to
the price left behind as explanatory variable. Considering
the values of the coefficients of PCt on the whole and PCt-1
(cement price in the previous period) whose values were:
0.063026956 and 0.16221071 respectively, which are known as
impact multipliers or of short term, to represent the change
in the half value of the cement offer after an unitary change
in the cement price in the same period of time. Maintaining
the change in the price at the same level of there from now
on, then 0.063026956 + 0.16221071 correspond to the change in
the cement offer in the following period, that is to say
0.225238. Then 0.063026956 turn out to be the short term
multiplier of the supply equation, while the long term
multiplier is 0.16221071. It means that before an increment
of 1% in the price of the cement, the bidders will increase
its production level in approximately 0.063% during the first
year and 0.16% the second year. The cocients between
0.063026956 and 0.225238, in the other side 0.16221071 and
0.225238 are obtained respectively: 0.279823 and 0.720174,
indicating that 27.98% of the impact on the offer of cement
of an unitary change in the price feels immediately and 100%
feels after having lapsed one year. Equally, it was not

17
evidenced the dynamics existence statistically in the demand
equation, when being calculated a negative value for the
coefficient of the variable it Demands of Cement straggler in
one period (DCt-1).
6. BIBLIOGRAPHY
Extracto de LA RAZÓN (digital). Edición día lunes 6 de diciembre de 2004, declaracion de Marcelo Alfaro Gerente General del IBCH.
Extracto de LA RAZÓN (digital). Edición día lunes 6 de diciembre de 2004, declaracion de Armando Gumucio Gerente General de la Sociedad Boliviana de Cemento.
Gujarati, Damodar N., Econometría, 2da. Edición, Mc Graw Hill International Editions, New York. 1994. Keynes, Jhon Maynard: La Teoría General del Empleo, Interés y Dinero, Harcourt Brace Javanovich, Inc., New York, 1936 p. 36. A. C. Harvey: Análisis Econométrico de Series de Tiempo, Jhon Wiley & Sosn, Inc., New York, 1981. Klein, Lawrence R.: Tratado de Econometría, 2da. Edición, Prentice-Hall Inc., Englewood Cliffs, 1974. Theil, Henri: Introducción a la Econometría, Prentice Hall Inc., Englewood Cliffs N.J., 1978, pag. 341-342. Basmann, Roberth L.: “A Generalizated Classical Method of Linear Estimation of Coefficients in a Structural Equation”, Econometrica, vol. 25, pp. 77-83, 1957. Behar, Alberto; Edwards, Lawrence, School of Economics, University of Cape Town: Estimating Elasticities Of Demand And Supply For South African Manufactured Exports Using A Vector Error Correction Model, 19 August 2002. H, Borath, Income and Price Elasticities in Manufacturing Exports, in Trade & Industry Monitor, Volumen 5, March 1998; Trade and Industrial Policy Secretariat And Development Policy Research Unit.

18
Roy, Noel; Mazany, Leigh; E. Schrank, William, A Simultaneous Equations Model of the U.S. Market for Canadian Atlantic Cod. Paper delivered at the Seventh International Conference of the International Institute of Fisheries Economics and Trade, Taipei, R.O.C., July 18-21, 1994. Quantitative Micro Software, E-views: User’s Guide, MicroTSP for Windows, Versión 1.1c. ICRA, The Indian Cement Industry, Executive Summary. Icra Limited, 2002.
El-Mefleh, A. Muhannad: ECONOMETRIC FORECASTING FOR JORDAN, National University. Garín Muñoz, Teresa; Pérez Amaral, Teodosio: An Econometric Model For International Tourism Flows to Spain, Universidad Nacional de Educación a Distancia, Madrid , Spain and Universidad Complutense de Madrid, Spain. Working Paper, received 13 August 1998. El Constructor (Revista); Órgano Oficial de la Cámara Bolivana de la Construcción; Año 6, Número 32, Septiembre 2001. Friedman, Milton: The Methodologies of Positive Economics, Essays in Positive Economics, University of Chicago Press, 1953. Prentice, David: Estimating a differentiated products models with a discrete/continous choice and limited data. La Trobe University. David Prentice School of Business. December 1, 2000. Extracto NOTICIAS, www.soboce.com Año 4 No. 7 Agosto 2003.


