Mercator Ocean Quarterly Newsletter #18 – July 2005 – Page 1 GIP Mercator Océan Quarterly Newsletter Editorial Dear Mercatorian, Be warned: half of the world's population live less than 100 km from the sea! From this reality, an important work is developed at Mercator around the service to the “Coastal people”. What is the goal? Answer to their questions about tourism, development of the shoreline, providing access to port infrastructures, the industrial sector, prevention of pollution, aquaculture, etc. Modelling and forecasting of the coastal ocean always has to take into account the specific local environment. However, before we can model these specific cases we need the most recent information on the offshore ocean and the way it affects coastal areas. Any operational modelling of local conditions requires up- to-date knowledge of the impact of offshore conditions. This is provided by Mercator. Source : Ifremer For Mercator, meeting the needs of 'Coastal people' means providing an accurate description of the state of the offshore ocean a few kilometres away from the coastline. This description defines the limit conditions for their local coastal models. Embedment, grid refinement, downscaling, boundary conditions, initial conditions, one-way, two-ways, … A Newsletter entirely dedicated to the problematic transition between global and regional models. Have a very good reading and see you for next issue with the new multivariate high-resolution Mercator prototype ! Contents News: Forcing coastal models with Mercator data ? By Jerôme Chanut and Hélène Etienne Methods to constrain the boundaries of an ocean model: application to a model of the Bay of Biscay By Sylvain Cailleau, Veronika Fedorenko, Bernard Barnier, Eric Blayo and Laurent Debreu Description of the PE Regional ESEOO Model System: Preliminary results from a Mercator nesting exercise By Marcos Sotillo and Enrique Álvarez Fanjul Modelling of eastern boundary upwelling systems with MERCATOR By Vincent Echevin, Patrick Marchesiello and Pierrick Penven Page 2 Page 4 Page 12 Page 18
Be warned: half of the world's population live less than 100 km from the sea! From this reality, an important work is developed at Mercator around the service to the “Coastal people”. What is the goal? Answer to their questions about tourism, development of the shoreline, providing access to port infrastructures, the industrial sector, prevention of pollution, aquaculture, etc.
Modelling and forecasting of the coastal ocean always has to take into account the specific local environment. However, before we can model these specific cases we need the most recent information on the offshore ocean and the way it affects coastal areas. Any operational modelling of local conditions requires up-to-date knowledge of the impact of offshore conditions. This is provided by Mercator.
Source : Ifremer
For Mercator, meeting the needs of 'Coastal people' means providing an accurate description of the state of the offshore ocean a few kilometres away from the coastline. This description defines the limit conditions for their local coastal models.
Embedment, grid refinement, downscaling, boundary conditions, initial conditions, one-way, two-ways, … A Newsletter entirely dedicated to the problematic transition between global and regional models.
Have a very good reading and see you for next issue with the new multivariate high-resolution Mercator prototype !
Contents
News: Forcing coastal models with Mercator data ? By Jerôme Chanut and Hélène Etienne Methods to constrain the boundaries of an ocean model: application to a model of the Bay of Biscay By Sylvain Cailleau, Veronika Fedorenko, Bernard Barnier, Eric Blayo and Laurent Debreu Description of the PE Regional ESEOO Model System: Preliminary results from a Mercator nesting exercise By Marcos Sotillo and Enrique Álvarez Fanjul Modelling of eastern boundary upwelling systems with MERCATOR By Vincent Echevin, Patrick Marchesiello and Pierrick Penven
News : Forcing coastal models with Mercator data ?
News: Forcing coastal models with Mercator data ? By Jerôme Chanut and Hélène Etienne
To take into account the large/meso scale circulation, coastal limited area models requires realistic initial and open boundary conditions. Basin-scale ocean model outputs such as MERCATOR prototypes are eligible for providing this information. There are an useful alternative to relatively scarse four-dimensional observations.
Nevertheless, this strategy raises different practical issues:
• the major concern relates to the scale transition from open ocean to coastal ocean ("downscaling") : the large scale fields need to be projected from the large-scale grid onto the finer scale-grid,
• this requires an horizontal remapping (via interpolation/extrapolation schemes) as well as a vertical remapping function capable for vertical coordinate system transformation.
• Initialization from interpolated data can produce inertia-gravity waves, a modification of the mass budget or/and anomalous vertical velocities that degrade the solution.
Up to now, the Mercator team has delivered interpolated/extrapolated data from the high resolution operational system. To investigate possible improvements of this service regarding the above issues, we developed a 1/12° configuration (NEATL12) with the OPA 9 model (Madec et al. 1999), spanning the North-East Atlantic (19.3°W / 4.6°E, 20.7°N / 54°N). As shown on figure 1, it covers most of the European and North African coasts down to the South of the Morocco. Open boundaries and initial conditions are interpolated from a free-run of the ¼° North Atlantic configuration (NATL4) using OPA 9 too.
Figure 1 Initial condition for Sea Surface Height (SSH) of NEATL12 configuration computed from interpolated NEATL4 SSH. Open boundaries are blue lines. The red cross is the position of the time series of figure 2.
At the four open boundaries, inner model fields from NEATL12 are mixed with the outer ¼° solution from NATL4 over 8 points according to a Flow Relaxation Scheme (Davies 1976). To ensure a better compatibility between the grids, the 1/12° bathymetry has been modified on this 8 points wide strip to match the 1/4°’s one. The daily bulk forcings and wind stresses are taken identical to the NATL4 model and interpolated onto the model grid. In our initial tests, the time step was set to 800 seconds and the model has been integrated for 2 weeks.
The time evolution of the potential temperature at a particular point close to the Portuguese coast and at 93m is displayed on figure 2. It reveals strong oscillations with a 12/24h period caused by spurious gravity waves. The model vertical velocity (not shown) is also particularly noisy all over the domain. It is clear from our preliminary results that a crude initialisation produces undesirable transients signals that disappear only after a week or so. We now explore simple possible techniques to reduce this problem.
Figure 2 Time series of potential temperature at 93m locted at 11°E, 39.3°N
(red cross on figure 1)
The first one is based on the correction of barotropic velocities under the hypothesis that they should be approximatively non-divergent. An other possibility, is to enforce the conservation of the total volume. In both case, the benefits and the cost of such optimisations will need to be compared to the use of a few days spin-up.
News : Forcing coastal models with Mercator data ?
References Davies, H. C. , 1976, A lateral boundary formulation for multi-level prediction models, Quaterly Journal of the Royal
Meteorological Society, 102: 405-418.
Madec, G., P. Delecluse, et al., 1999, OPA 8.1 Ocean General Circulation Model reference manuel, Note du Pôle de modélisation, Institut Pierre-Simon Laplace (IPSL): 91.
Methods to constrain the boundaries of an ocean model: application to a model of the Bay of Biscay
Methods to constrain the boundaries of an ocean model: application to a model of the Bay of Biscay By Sylvain Cailleau, Veronika Fedorenko, Bernard Barnier, Eric Blayo et Laurent Debreu
Introduction Nowaday, the multi-scale modelling is on the road to success. This access particularly enables to study ocean physical phenomena and their interactions for extended spatial and time scales (from mesoscale eddies to the general circulation, from day to decade). This concept is as follows : a large model (global or basin model) will provide information to regional models which resolution is increased. Then, the difficulty lies in the choice of the method to constrain the boundaries of the considered regional model. Indeed, the conditions applied to the model’s boundaries must provide it with the relevant information from outside, while evacuating the model’s outgoing information. This latter will become crucial when the regional model is intended to correct the large scale model solution
Methods to constrain the boundaries Following the idea of multi-scale modelling described in the introduction, several methods to constrain boundaries of a regional model are compared in this paper, in a realistic situation. We can distinguish three main categories of methods.
The open boundary conditions
The regional model is integrated alone, and it is forced at its boundaries by outside data (such as climatology, output of larger model which has been previously integrated, …).
We use two methods from this category :
• The clamped open boundaries :
The values of available outside data are directly imposed (after interpolation) to the boundaries of the regional domain
• The radiative open boundaries :
These conditions are frequently used in ocean models. They combine a transport of the local model’s prognostic variables through the boundary, and a damping to the value of the outside data. Transport through the boundary follows a wave equation.
The results of this method (although slightly better) are comparable to the ones obtained by the clamped boundary method (Cailleau, 2004).
Consequently, the radiative open boundaries will not be discussed later in this paper.
The grid refinement
In this kind of method, the calculation grid of a large scale model is locally refined on the region of interest, and the high and coarse resolution grids interact at their interface.
Among the different grid refinement processes, we are interested in the refinement method from Berger & Oliger (1984).
In this process, the fine grid of the considered regional domain is superimposed to coarse grid of the large model (so the grids recover each other). It is then a space and time refinement.
Several fine grid time steps correspond to a coarse grid one. During the model integration, at a precise time, the calculated coarse resolution solution is directly imposed (by interpolation) to the fine grid, at the interface between both grids. At this stage, the fine grid passively receives the information from the coarse grid. Then, we talk about « One Way » mode refinement. Updating the coarse resolution solution with the fine grid solution on the recovery zone of both grids is made possible at each coarse grid time step. So, this « Two-Way » mode refinement allows a feedback from the fine grid to the coarse grid.
The model coupling
In this kind of method, two different models are coupled and interact at their interface. In this paper, we are interested in the model coupling by the « Schwarz » method (Blayo & Debreu, 2005b).
The regional model is embedded into the large model, but model grids do not overlap.
The Schwarz method of domain decomposition enables the solution of both models to converge at the interface, following mathematical conditions that must be defined (e.g. : continuity and derivability).
Methods to constrain the boundaries of an ocean model: application to a model of the Bay of Biscay
Contrary to the refinement methods, no overlap is necessary between the two models : the large model has a « hole » on the embedded model zone. The Schwarz algorithm is iterative and so requires much calculation time. The process is reiterated for a fixed time window, until the convergence is reached.
We can notice that the Schwarz coupling is used here for the first time in a realistic ocean simulation.
Application to a basin model of the North Atlantic and to a regional model of Bay of Biscay We consider the large scale NATL3 model (figure 1a), set up for the CLIPPER Project (2001).
This North Atlantic model has a 1/3° resolution calculation grid. The fine grid regional model BABY15 (BAy of BiscaY) has been specifically set up for this study (figure 1b). This model has a 1/15° resolution calculation grid. These models are based on the calculation code OPA (Madec et al., 1998) which resolves the primitive equations. They are initialized by temperature and salinity fields from the 1/6° resolution Atlantic model ATL6 set up for the CLIPPER Project (2001) as well. They are forced by daily interannual fluxes produced by the ECMWF analysis.
depth (m)
Figure 1 Domain and bathymetry of the large model NATL3 (coarse calculation grid : 1/3° resolution) and of the regional model BABY15 (fine calculation grid : 1/15° resolution). The red lines correspond to the sections used to calculate the transport on Figure 6.
From these models, we have realized a three-year simulation series (from 1996 to 1998) in order to evaluate the different methods described previously.
• The "NATL3" simulation
The large model NATL3 is integrated alone, with closed boundaries ("buffer zones"), where temperature and salinity fields of the model are relaxed to the climatological values of the Atlas of Reynaud et al., 1998.
• The "BABY15-spe" simulation
The regional model BABY15 is integrated alone. Its West boundary is open and the model variables are clamped by the three-day averaged outputs of the NATL3 simulation. The other boundaries (in Channel and Irish Sea) are closed ("buffer zones") where temperature and salinity fields of the model are relaxed to the climatological values of the Atlas Reynaud et al., 1998.
• The "AGRIF One-Way" simulation
The NATL3 model is refined on the BABY15 region with the 1/15° resolution, thanks to the AGRIF tool (Adaptive Grid Refinement In Fortran, Debreu, 2000).
This NATL3/BABY15 set is integrated during these 3 years in One-Way mode, without any feedback from the fine grid to the coarse grid. So, the coarse grid solution is the same as the NATL3 solution. On the refined BABY15 region, we obtain a 1/15° solution which differs from the "BABY15-spe" experiment solution by using another
Methods to constrain the boundaries of an ocean model: application to a model of the Bay of Biscay
sampling frequency of NATL3 data imposed to the boundary (i.e. time step frequency of the coarse model instead of a three-day average frequency in the case of "BABY15-spe").
• The "AGRIF Two-Ways" simulation
The NATL3 model refined on the BABY15 region with the 1/15° resolution, is integrated for 3 years in Two-Way mode, i.e. in the refined area, the NATL3 model solution is obtained by a spatial average of the solution calculated on the fine grid. So, on the coarse grid, the NATL3 solution is influenced at each time step by the 1/15° solution calculated on the fine grid.
• The "COMODO" simulation
The large model NATL3 and the regional model BABY15 are coupled following the Schwarz method thanks to the COMODO tool (COuplage de MOdèle et Décomposition de modèle en Océanographie, Fedorenko - 2004). In this case, five iterations were sufficient to obtain a good convergence of the algorithm.
For every simulations, it has been necessary to ensure a smooth and progressive transition of the bathyhmetry and the viscosity between the two models.
A detailed description of these simulations, and a complete analyse of the behaviour of the different methods to constrain boundaries are presented in the PhD thesis of Cailleau (2004).
Evaluation of the methods to constrain boundaries In order to evaluate and validate the different boundary conditions, we study their impact on the behaviour of the solution at the boundary and inside the regional domain.
Behaviour at the boundary of the regional domain
Later on, we consider the Western boundary of the regional domain. First, we analyse the energy assessment at the boundary by examining the behaviour of the Total Kinetic Energy (TKE) in the transition area between the coarse and the fine resolutions. We calculate the three-year TKE mean integrated on meridian sections parallel to the boundary. We present in figure 2 the variation of this TKE mean on a longitude band from 12.5°W to 6.5°W centred on the Western boundary of the BABY15 domain.
Westside of the boundary, the TKE is weak because the resolution of the large model (1/3°) is not sufficient to allow the development of a realistic meso-scale turbulence. In general, for every obtained curves, the TKE strongly increases from the domains’ interface (9°W), due to the resolution change, and it reaches a threshold far eastward inside the regional domain. The transition layer in viscosity should make this increase from the BABY15 boundary progressive (e.g. : figure 2c). No progression can be noticed for the simulation with clamped boundary (Figure 2a). Contrary to the other simulations, the clamped boundary accumulates a lot of energy. Besides, the TKE remains higher inside the regional model. The TKE’s progressive increase inward the fine grid domain is well represented in the other simulations, even for the « One Way » refinement (figure 2b), and shows a good permeability of the boundary. We can notice that for the « Two-Way » refinement cases (figure 2c) or for the COMODO coupling (figure 2d), the coarse resolution domain TKE adapts itself to the high resolution model TKE. The energy transition is the most continuous and the most progressive for the AGRIF "two-way" and the Schwarz’ coupled simulation. So, the clamped boundary shows some difficulties in evacuating fluxes and structures such as eddies or fronts, contrary to the other methods. The One Way refinement - which principle is close to the clamped boundary one, but with boundary data provided with a time sampling equal to the coarse grid time step - brings about a clear improvement of the TKE behaviour near the boundary. Thus the time sampling of the boundary data constitutes an important element to control a model through its boundaries.
To complete this analysis, we present temperature maps (figure 3) and current speed maps (figure 4) dating from August, 13 1998. This date corresponds to a situation of significant flows through the Western boundary of the Bay of Biscay. In the case of the clamped boundary, regarding the BABY15 domain, we can notice a cold anomaly near the boundary at about 48°N and a marked cold water tongue along the Southern coast of Ireland (Figure 3a). The current speed field (Figure 4a) presents a northward current along the boundary which doesn’t appear in the other simulations. In this simulation, the current at the South of Ireland is even reversed (north-eastwards) in comparison to the other experiments. That is the permeability defect of this kind of boundary that we previously pointed out when we studied the TKE variations through the boundary. The refinement grid simulations (figures 3b,3c and figures 4b,4c) and the Schwarz’ simulation (figures 3d, 4d) enable a better behaviour of the fluxes at the boundary. The continuity is well respected in Two-Way and coupled modes, which favour the coarse grid solution adaptation at the Western boundary. The transparency of the boundary regarding the crossing fluxes is noticeable in the case of the coupled simulation: the penetrating North Atlantic Current in the Bay of Biscay at 47°N and the outgoing upwelling current at 43°N are not disturbed at all.
Methods to constrain the boundaries of an ocean model: application to a model of the Bay of Biscay
a) BABY15-spe b) AGRIF One-Way
c) AGRIF Two-Ways d) COMODO Figure 2
Spatial variation of the Total Kinetic Energy (TKE time mean for the simulation period) surrounding the Western boundary of the BABY15 domain for the various simulations : a) clamped boundary, b) One-Way grid refinement, c) Two-Way grid refinement, and d) Schwarz coupling. The vertical solid line delimits the boundary of the BABY15 domain (at 9°W) or the interface between the two grids (at 9.2°W). The vertical dashed line delimits the transition layer for bathymetry and viscosity. The dashed curve corresponds to the TKE of the « NATL3 » simulation on the recovery zone of the fine and coarse domains
Methods to constrain the boundaries of an ocean model: application to a model of the Bay of Biscay
a) BABY15-spe b) AGRIF One-Way
c) AGRIF Two-Ways d) COMODO
Figure 3
Temperature field continuity through the limit of the grids. These maps represent the model temperature at 30m, on August, 13 1998, for the coarse grid NATL3 solution and the fine grid BABY15 solution on both sides of the Western boundary of the regional domain and for the various simulations : a) clamped boundary, b) One-Way grid refinement, c) Two-Way grid refinement, and d) Schwarz coupling. The line around 9°W delimits the BABY15 domain.
Methods to constrain the boundaries of an ocean model: application to a model of the Bay of Biscay
Impact on the solution inside the regional domain
First, we analyse the evolution of the energy assessment integrated in the whole regional domain for the three-year simulations. We present in Figure 5 the variation of the average TKE for the fine grid basin volume during the period 1996-98. At first, these curves show a « spin-up » phase due to the dynamical adjustment which seems to depend on the method used for the processing of boundary conditions.
In the case of the clamped boundary (Figure 5a), the TKE increase is very high in the first two months and remains high during the first year. The TKE slightly decreases the second year and keeps a high energy during the rest of the integration. This method brings about a higher energy level for the regional model than for the other cases. For the grid refinement simulations, the assessment is far more satisfactory, i.e. the initial increase is clearly lower but keeps developing during the first year, and consequently a lower threshold is reached from the second year. We can notice a lower threshold in Two-way mode. As for the coupled simulation, the increase is relatively high during the first two months (between the clamped boundary increase and the grid refinement simulation increase). Unlike all the other simulations, the TKE increase does not continue after the initial phase. It even shows a (linear) trend to decrease during the last phase of the experiment. We have not examined the reasons for such a behaviour yet.
Moreover, it seems interesting to observe that every simulation shows a quite similar clearly defined season cycle (higher TKE from October to April).
Figure 5 TKE evolution for the three-year integration (TKE average on the whole regional domain for the various simulations) : a) clamped boundary, b) One-Way grid refinement, c) Two-Way grid refinement, and d) Schwarz coupling. The black curve corresponds to the fine grid solution, and the grey curve corresponds to the coarse grid solution. The fine curves are sampled every 3 days, and the thick curves are smoothed every 30 days.
Then, we study the circulation along the shelf break in the Bay of Biscay for the various simulations. We examine the transport evolution through two sections perpendicular to the shelf break, during the third year (Figure 6). These sections are indicated on
Methods to constrain the boundaries of an ocean model: application to a model of the Bay of Biscay
Figure 1. The first section, « Galicia section », is a meridian section at 7°W. The second one, « Armorique section», is oblique and centred at 45°N.
Regarding the Galicia section (Figure 6a), the correlation between the transport curves of the different simulations is not obvious. Nevertheless, we can notice a maximum transport in Autumn for every simulation. This section is close to the boundary, and its transport is logically sensitive to the applied constraints. Besides, this region is favourable to a strong and chaotic meso-scale activity : there, canyons make the current unstable along the shelf break and by the way generates eddies. The evolution of these eddies is strongly influenced by boundary conditions chosen. This also contributes to the uncorrelation obtained between the different transport evolutions through the Galicia section. Though, the clamped boundary simulation (BABY15-spe) shows the most different behaviour.
Regarding the Armorique section (Figure 6b), the correlation between the transport curves is much clearer. Most of the curves extrema coincide. For each simulation, the highest transport happens in November (except for the One-Way refinement simulation). The maximum transport in Autumn is in accordance with the measured currents along the shelf break (Pingree & Le Cann, 1990). Far from the boundary, the transport variability through this section seems to be less dependant on the constraint methods used, at least concerning the phase of the season variations. The main differencies between the simulations lie in the transport intensity: in Autumn, the maximum transport is more distinct for the Two-Way mode refinement simulation and the Schwarz coupling one, which have shown the best results until now.
Figure 6 Transport evolution of the current along the shelf break of the Bay of Biscay in 1998 for the various simulations. a) Transport through the Galicia meridian section at 7°W, b) Transport through the Armorique oblique section. These two sections are indicated Figure 1.
Conclusion In this survey, we have tested 4 methods to constrain the open boundaries of an ocean model, by applying them to a realistic case of the Bay of Biscay.
The clamped boundaries (as well as the radiative boundaries that have not been developed in this paper), which are among the most used boundary conditions today, bring about a systematic energy accumulation and problems of recirculation along the boundary. These boundaries can disturb the internal dynamics of the regional domain. Moreover, these methods are strongly influenced by the frequency of the values imposed at the boundaries (in comparison with the One-Way grid refinement simulation results). Consequently, the clamped boundaries must be situated far from the region studied. It seems interesting to point out that some works aim at finding better open boundary conditions for a regional model, based on the method of characteristics (Blayo & Debreu, 2005a).
The refinement and coupling methods have a far more satisfactory behaviour. The boundary is more transparent and the circulation inside the regional domain does not seem to be significantly disturbed. Concerning long periods of integration, the Two-Way mode refinement improves both the fine and coarse grid solutions. Finally, due to the regularity obtained with the Schwarz coupling, the boundary is perfectly transparent. Yet, this method still requires much more calculation time because it uses an iterative algorithm and needs optimization. This method opens particular perspectives, because it must enable to couple models with different physics. This is particularly interesting when the finest resolution model solves another dynamics (e.g. non-hydrostatic).
Methods to constrain the boundaries of an ocean model: application to a model of the Bay of Biscay
References Berger, M., and J. Oliger, Adaptative mesh refinement for hyperbolic partial differential equations, J. Comp. Phys., 53, 484-512,
1984.
Blayo, E. and L. Debreu, Revisiting open boundary conditions from the point of view of characteristic variables, Ocean modelling, 9 (3), 231-252, 2005.
Cailleau, S., Validation de méthodes de contrainte aux frontières d’un modèle océanique : application à un modèle hauturier de l’Atlantique Nord et à un modèle régional du Golfe de Gascogne, Ph.D. thesis, Université Joseph Fourier, Grenoble, France, 2004.
CLIPPER Project : Modélisation à haute résolution de la circulation dans l’océan Atlantique forcé et couplé océan-atmosphère, Rapport final d’activité scientifique et technique, LEGI, LPO, LODYC, LEGOS, Grenoble, Brest, Paris, Toulouse, 2001.
Debreu, L.,Raffinement adaptatif de maillage et méthodes de zoom, application aux modèles d’océan, Ph.D. thesis, Université Joseph Fourier, Grenoble, France, 2000.
Fedorenko, V., Le coupleur COMODO, Documentation, LMC, Grenoble, 2004.
Madec, G., P. Delecluse, M. Imbard, and C. Levy, OPA, release 8, ocean general circulation model reference manual, Internal report, LODYC/IPSL, Paris, 1997.
Pingree, R. and B. Le Cann, Structure, strength and seasonality of the slope currents in the Bay of Biscay region, J. mar. Bio. Ass. UK, 70, 857-885, 1990.
Reynaud, T., P. Legrand, H. Mercier, B. Barnier, A new analysis of hydrographic data in the Atlantic and its application to an inverse modelling study, International WOCE Newsletter, 32, 29-31, 1998.
Description of the PE Regional ESEOO Model System: Preliminary results from a Mercator nesting exercise
Description of the PE Regional ESEOO Model System: Preliminary results from a Mercator nesting exercise By Marcos Sotillo and Enrique Álvarez Fanjul
Overview of the ESEOO Project and its objectives The main objective of the ESEOO project is the development and implementation of a Spanish Operational Oceanography system able to be used in emergency situations at sea, such as oil spill accidents or tracking of drifting objects. The system will consist in several applications based on numerical modelling and analysis of oceanographic data, both historical and real time. The applications based on numerical models will provide forecast of several physical parameters, such as winds, currents, sea surface temperature, waves and sea level. The models will be operational at two different scales: a) regional, providing a single high resolution solution for all the Spanish waters and b) local, where different Institutes, participating in ESEOO Project, will create very high resolution applications for different coastal areas. Local scale applications will be nested on regional scale ones, and regional will be nested on existing operational global systems. The aim is that the system will provide immediate access to processed information that will be used for decision making during emergency situations. Further information on the ESEOO Project is provided in the ESEOO web site: http://www.eseoo.org
PE ESEOO Model System Within the ESEOO Project, PE is one of the groups working on the development of operational systems, based on numerical models, able to provide a complete oceanographic information useful to face emergency situations at sea and thus improving the answer to future crisis such as the Prestige one. The ESEOO project has as one of its maximum priorities obtaining reliable outputs for coastal areas. In order to fulfil this objective a downscaling approach (from global to coastal) has been taken into account to design the numerical model applications. This downscaling approach is necessary for several reasons: inclusion of additional physic phenomena (e.g. tidal forcing, fresh water inputs), higher spatial resolution as well as higher frequency updating the atmospheric forcing in the forecast, etc. Following this downscaling approach, the POLCOMS model (provided by the Proudman Oceanographic Laboratory, UK) has been implemented at PE to be used as the regional model of the PE applications taking initial and boundary conditions from global ocean models provided by different Global Systems. As was already mentioned, tidal, meteorological, and fresh water riverine forcings are also included in the forecast systems created. Three different domains (ESEOAT, ESEOMED and ESEOCAN), displayed in figure 1, covering together completely the Spanish waters have been selected to run different regional applications.
POLCOMS model Description
As was already mentioned PE is setting-up three different applications for all the aforementioned ESEOO domains using to this aim the POLCOMS model (Holt and James, 2001 and Holt et al, 2001). The POLCOMS has been developed by the Proudman Oceanographic Laboratory (POL,UK) to be used in multidisciplinary studies focused on shelf and coastal areas. The model is a three-dimensional finite-difference primitive equations model formulated in spherical-polar co-ordinates on an Arakawa-B grid. The vertical is discretized into 34 S-levels. Incompressible, hydrostatic Boussinesq equations of motion are solved allowing time splitting between barotropic and baroclinic modes. Both temperature and salinity are treated as prognostic variables. The origin of the model lies with James (1986) and has been subsequently developed (James, 1996) to included improvements such as an advection scheme based on a Piecewise Parabolic Method (PPM) that allows to keep horizontal gradients and minimize the numerical diffusion of momentum and scalar variables. Hence, the model arises as a useful tool to simulate on-shelf baroclinic features such as river plumes and fronts. For further details consult the POLCOMS documentation: http://cobs.pol.ac.uk/modl/metfcst/POLCOMS_DOCUMENTATION
Description of the PE Regional ESEOO Model System: Preliminary results from a Mercator nesting exercise
ESEOAT ESEOMED ESEOCAN
Figure 1 Geographical limits of the three different ESEOO regional domains. Bathymetry is also depicted.
PE ESEOAT 1-year Hindcast Run
Validation of model outputs is essential for understanding how the models should best be used and identifying areas or points to be improved. For this purpose, a preliminary 1-year hindcast reanalysis exercise focused on the Prestige event year (from September 2002 to August 2003) was planned. The outputs from this hindcast will be validated against different satellite and in-situ (buoys, hydrographic sections, Argo data, moorings, etc.) data, providing us a measure of the skill shown by the models to forecast reliable 3-D properties (currents, temperature, salinity, etc.) of the ocean. The performing of these 1-year hindcasts with their subsequent validation can be seen as a significant test to evaluate the capabilities of the different applications in order to lead the efforts towards a real-time operational oceanographic system.
The ESEOAT domain has been selected as a pilot area for a preliminary test of the PE ESEOO model system. The current (not final) configuration of this system has been setting up after performing different test runs and sensitivity studies.
ESEOO Model System at EPPE ESEOO Model System at EPPE
POLCOMS3D Baroclinic hydrodynamic
coastal-ocean model
Meteorological forcing10-mw, mslp,2m-T,q,
surf rad,cloud
Ocean model forcing T, S, U,V,zet
Freshwater inputs from Rivers
Tidal forcing
Initial conditions
S & T
OUTPUTSCurrents,
SSHTemp & Salinity
Climatology & extremes
statistics
Local & pollutant
model
LEGOS/POC
FOAM data(UK MetOffice)
FOAM data (UK MetOffice)HIRLAM (INM)
GRDC
Implemented at EPPE (Altix 3000)
Figure 2 The PE ESEOO Regional Model System
Figure 2 illustrates the current scheme of the PE ESEOO model system used to run the 1-year integration. As it can be seen in the figure, the system is based on the 3-D baroclinic hydrodynamic coastal-ocean POLCOMS model, running with a spatial
Description of the PE Regional ESEOO Model System: Preliminary results from a Mercator nesting exercise
resolution of 1/20º, which in turn takes boundary forcing from global model FOAM (UK MetOffice). The run is forced with atmospheric fields and surface fluxes from the Spanish Met Office (INM). The POLCOMS model is also forced with tides obtained from the MOG2D model (LEGOS/POC) as well as with climatological fresh water discharge data for 14 rivers, provided by the GRDC . The ESEOAT 1-year hindcast run is nested to the FOAM global model, which provides initial and boundary conditions (6 hours frequency).
Different test-runs, from the most basic (barotropic run forced with only the M2 tidal harmonic constituent) to the most complex (baroclinic run, including the whole above-described forcings) were performed in order to set-up the most accurate ESEOAT POLCOMS application.
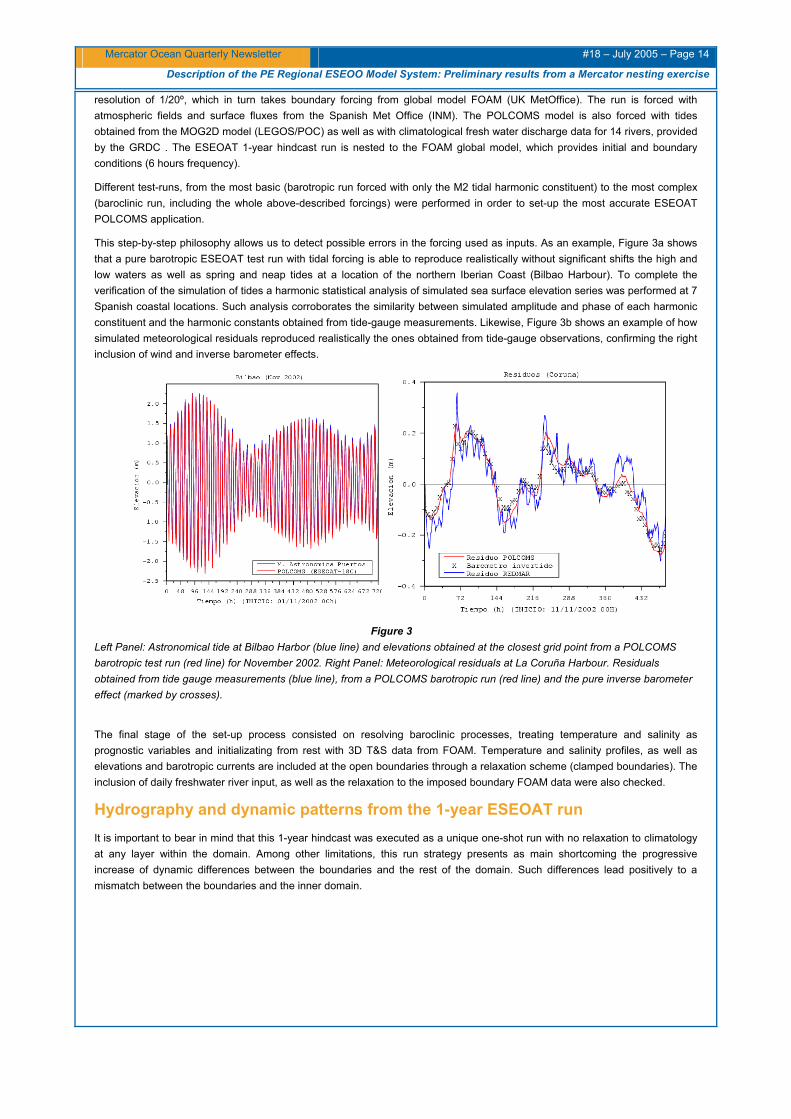
This step-by-step philosophy allows us to detect possible errors in the forcing used as inputs. As an example, Figure 3a shows that a pure barotropic ESEOAT test run with tidal forcing is able to reproduce realistically without significant shifts the high and low waters as well as spring and neap tides at a location of the northern Iberian Coast (Bilbao Harbour). To complete the verification of the simulation of tides a harmonic statistical analysis of simulated sea surface elevation series was performed at 7 Spanish coastal locations. Such analysis corroborates the similarity between simulated amplitude and phase of each harmonic constituent and the harmonic constants obtained from tide-gauge measurements. Likewise, Figure 3b shows an example of how simulated meteorological residuals reproduced realistically the ones obtained from tide-gauge observations, confirming the right inclusion of wind and inverse barometer effects.
Figure 3
Left Panel: Astronomical tide at Bilbao Harbor (blue line) and elevations obtained at the closest grid point from a POLCOMS barotropic test run (red line) for November 2002. Right Panel: Meteorological residuals at La Coruña Harbour. Residuals obtained from tide gauge measurements (blue line), from a POLCOMS barotropic run (red line) and the pure inverse barometer effect (marked by crosses).
The final stage of the set-up process consisted on resolving baroclinic processes, treating temperature and salinity as prognostic variables and initializating from rest with 3D T&S data from FOAM. Temperature and salinity profiles, as well as elevations and barotropic currents are included at the open boundaries through a relaxation scheme (clamped boundaries). The inclusion of daily freshwater river input, as well as the relaxation to the imposed boundary FOAM data were also checked.
Hydrography and dynamic patterns from the 1-year ESEOAT run It is important to bear in mind that this 1-year hindcast was executed as a unique one-shot run with no relaxation to climatology at any layer within the domain. Among other limitations, this run strategy presents as main shortcoming the progressive increase of dynamic differences between the boundaries and the rest of the domain. Such differences lead positively to a mismatch between the boundaries and the inner domain.
Description of the PE Regional ESEOO Model System: Preliminary results from a Mercator nesting exercise
Figure 4 Monthly means of ESEOAT surface temperature, salinity and currents for sep-2002 and Feb-2003.
Firstly, it is worth to point out as a very positive and encouraging issue the fact that after a year run the model is able to reproduce a situation similar to the initial one. It is able to simulate some important features such as the summer and early autumn cooling along the north-west and north Iberian shelf, related to prevailing upwelling conditions (Figure 4a); the circulation into the Gulf of Cadiz and the winter cooling over the French platform (Figure 4b). Also noticeable the impact that freshwater river discharge has on salinity, being responsible of significant salinity decrease occurring in coastal and on-shelf areas along the western coast of the Iberian Peninsula and the French platform, where the Loire and Garone discharges play a leading role (Figure 4d). Monthly vectorial averages of surface currents (Figures 4e and 4f) show the progressive increase of current speeds at the open boundaries, especially along the western one. Speed values higher than 1 ms-1 are obtained along such boundary points. The presence of these boundary effects, linked to the mismatch between imposed boundary and simulated inner domain values, is a problem, especially when such effects, initially restricted to the boundary nearby areas, propagates into the domain spoiling the output.
Preliminary results from an ESEOAT exercise nested to Mercator Once the first approach towards the “Prestige” 1-year ESEOAT hindcast is run, all the PE efforts will be lead to carry out a complete validation of such a run to evaluate the system capabilities, as well as to identify, and correct before setting up the operational model system, possible shortcomings. Within this framework, it is important to have some knowledge about how sensitive the PE ESEOO model system is when the initial and boundary conditions are changed. To this aim a sensitivity test lead to evaluate the impact of such changes has been performed. In order to do this, an ESEOAT run, with a set-up similar to the 1-year hindcast’s one, but nested to Mercator, instead of FOAM, was performed.
Description of the PE Regional ESEOO Model System: Preliminary results from a Mercator nesting exercise
Figure 5 Mercator & FOAM salinity fields used as initial conditions in the 2 ESEOAT runs (panels a and b, respectively). Surface currents from the ESEOAT run forced with Mercator and from the one forced with FOAM (panels c and d, respectively).
Figure 6 Differences in surface salinity between the ESEOAT run forced with Mercator and
the one forced with FOAM at 2 different dates. The first point that arises at this preliminary stage of the study is related to the noticeable differences existing between the Mercator and FOAM data used as initial conditions of the regional ESEOAT runs. Such differences seem to be relevant, especially in coastal and on-shelf areas. As an example, Figures 5a and 5b illustrate the Mercator and FOAM surface salinity fields used as initial condition of the PE ESEOAT runs, respectively. Both fields show a similar latitudinal gradient over Atlantic open waters. However, significant differences can be observed over the southern French Platform in the Bay of Biscay, where FOAM provides an anomalous high salinity nucleus. As we move in time, surface salinity from both ESEOAT experiments converge towards most similar values (Figure 6a and 6b illustrate the progressive decrease of salinity differences between both ESEOAT runs). The convergence of the two runs to a similar solution over the Bay of Biscay from so different initial fields can
Description of the PE Regional ESEOO Model System: Preliminary results from a Mercator nesting exercise
support the idea that the downscaling can be a useful approach to overcome the problems of global model with the coastal areas.
With regards to surface currents, it is worth to mention that a preliminary inspection (after 19 days of simulation) reveals a lower impact of spurious boundary effects in the ESEOAT POLCOMS run nested into Mercator (Figure 5c and 5d). This fact requires further investigation.
To conclude, it is worth to mention that PE is leading its efforts to upgrade the present ESEOAT model system. Introducing to this aim some possible improvements such as the implementation of a new reanalysis strategy based on a re-start run scheme, inclusion of Mediterranean exchanges through the Strait of Gibraltar, and new treatment of surface heat and salinity fluxes. Once positive impacts of these improvements will be tested, the resulting version of the system will be implemented as operational into the Spanish Met Office (INM), providing open boundary conditions to coastal and local systems.
References Holt JT, James ID, 2001, An S co-ordinate density evolving model of the northwest European continental shelf. 1. Model
description and structure, Journal of Geophysical Research, 106, 14015-14034.
Holt JT, James ID, Jones JE 2001 An s co-ordinate density evolving model of the northwest European continental shelf 2. Seasonal currents and tides, Journal of Geophysical Research, 106, 14035-14053.
James ID, 1986 A front-resolving sigma co-ordinate sea model with a simple hybrid advection scheme. Applied Mathematical Modelling, 10, 87-92
James ID, 1996, Advection schemes for shelf sea models, Journal of Marine Systems, 8, 237-254.
Modelling of eastern boundary upwelling systems with Mercator
Modelling of eastern boundary upwelling systems with Mercator By Vincent Echevin, Patrick Marchesiello and Pierrick Penven
Introduction Despite their relatively low energy compared to western boundary areas, eastern boundary systems are very important for resources. Located under the influence of alongshore blowing trade winds, the dynamic of these sites is quite specific: the offshore Ekman transport of surface waters generates an upwelling of cold, nutrient rich deep waters nearshore, which triggers favourable conditions for the development of a rich and complex food chain. Furthermore, an intense mesoscale activity develops along the upwelling front and generates cross-front water masses exchanges between the coastal zone and deep ocean. The main eastern boundary upwelling systems (Peru-Chile, Canaries, Benguela, California) are characterized by important fisheries, which fluctuate interannually, intensively exploited by southern neighbouring countries (Chavez et al., 2003).
The objective of the project « model embedment in upwelling systems » supported by Mercator is to develop and operate modelling tools for the regional and coastal circulation, which will be coupled to the global Mercator model to access to the circulation and water masses characteristics. A realistic representation of the ocean dynamics is the first step towards sustainable management of southern countries fisheries, taking into account the impact of climate variability and global change.
Our approach to study of the dynamics of these systems consists in embedding regional and coastal models in the POG Mercator model at ¼° (~25 km) resolution. This allows resolving the adequate spatial scales at stake in upwelling systems. It has been shown for the California system that a spatial mesh of 20km, or even 10 or 5km, is not adapted to represent correctly the mesoscale and submesoscale instability processes associated to the upwelling front, responsible for the coastal transition zone where downscaling of variability occurs.
Data and methods The POG general circulation model is based on the OPA8.2 dynamical kernel, with a ¼° resolution and a geopotential vertical grid. POG was initialized with the Levitus climatology and forced with a wind stress and heat fluxes climatology calculated from the ERA15 at 1.6° resolution.
The ROMS regional ocean model has been used in various configurations. For the Humboldt system close to the equator, a single level of embedment has been used, at 1/9° resolution. For the Canaries and Benguela systems, two levels of embedment were used to reach a high resolution, based on the AGRIF software (Debreu and Blayo, 1999).
Besides the spatial grid of the models, the major differences between ROMS and POG concern the vertical grid (generalized sigma coordinates), advection schemes, the free surface, the parameterizations of vertical mixing and open boundaries. Numerics are detailed in Marchesiello et al. (2001) and Shchepetkin and McWilliams (1998, 2003, 2005).
The POG simulations used in this work were climatological. They were the first preliminary simulations available at Mercator since an interannual simulation for the period 1993-2001 was recently produced. Fields of temperature, salinity, velocity and sea level, averaged every 15 days in POG, and atmospheric forcing used for POG were interpolated on the ROMS grid to create the regional forcing. The diagnostics were calculated with the third and fourth year of simulation. As a comparison, we show results from a ROMS simulation forced by monthly outputs of ORCA model at ½°, also based on OPA.
The data used is essentially satellital: sea surface temperature from NOAA/AVHRR, sea level from TP/ERS and sea colour data from Modis.
Results
Circulation in the Peru upwelling: mean state and mesoscale variability in ROMS
An overview of the surface circulation is given by ROMS current and SST maps in December (Figure 1). A cold tongue of 18°C-22°C locates the coastal upwelling between 6°S and 22°S. Associated to it, the Humboldt coastal current (HC) flows equatorward. Further south (13°S-16°S), the upwelling is much weaker when compared to the observed SST. Globally, the surface currents in ROMS are more intense by 30-50% than in POG, owing to the increased resolution and weakly diffusive advection scheme which strengthen the fronts.
Modelling of eastern boundary upwelling systems with Mercator
Figure 1 Surface temperature and velocity in ROMS, december, and climatological NOAA/AVHRR surface temperature
A vertical section of temperature and meridional velocity in POG and ROMS off north Peru (Figure 2) confirms the intensification of the coastal upwelling in ROMS due to a more realistic representation of the shelf topographical effect. Consequently the surface density front is more marked, and the HC is wide (~100 km) and intense (~20-30 cm/s), with a maximum at 20-40 km from shore.
Figure 2 Zonal section at 8°S of annual mean temperature (in degrees Celsius, color scale) and meridional velocity (cm/s) in POG (left),
ROMS forced by POG ¼° (middle), ROMS forced by ORCA ½° (right)
At depth (~50-200 m), the Peru Chile undercurrent (PCUC) flows poleward along the coast, and transports waters of tropical origin, nutrient rich, part of which are upwelled to the surface nearshore.
The vertical structure and intensity of the PCUC are quite different in ROMS and POG because of the shelf and slope influence. The undercurrent is more intense, and extends deeper vertically in ROMS than in POG, which would have a potential impact on the upwelling biogeochemistry and biology. As a comparison, ROMS forced by a monthly climatology of ORCA ½° and of ERS/Quikscat winds (hereafter ROMS/ORCA0.5) over the period 1992-2000, produced a slope trapped undercurrent, less intense than in ROMS/POG. The surface current in ROMS/ORCA0.5 is twice weaker than in ROMS/POG. A sensitivity experiment using ROMS/POG and ERS/Quikscat winds shows that the surface and subsurface coastal currents are significatively reduced. This shows that the local wind, in the present case the rather low resolution ERA15 product, influences strongly the structure of coastal currents, and that the influence of the initial state and open boundaries coming from the GCM remains of second order.
A diagnostic on the mesoscale circulation gives an indirect validation of the coastal currents. Surface eddy kinetic energy (EKE) is higher in the model than in satellite observations (Figure 3). This could be due to short scale filaments present in the simulations and ill-sampled from space. Nevertheless, sensitivity experiments on the regional forcing (wind and open boundaries) show that the intensity and structure of EKE depend strongly on it. The strong vertical shear of current in the ROMS/POG/ERA15 and ROMS/POG/ERS-Quikscat is reduced in ROMS/ORCA0.5, where eddies are less energetic. The zone of high EKE remains confined to the coast, which seems more realistic.
Modelling of eastern boundary upwelling systems with Mercator
Figure 3 Surface eddy kinetic energy calculated over 1993-1996 for TP/ERS data (left), over the 4th year of simulation for ROMS/POG
(middle), over 1993-1996 for ROMS/ORCA1/2° (right).
Sensitivity of the surface dynamics to the physics in the Canaries upwelling
The comparison of ROMS and POG at the same resolution (1/4°) allows to evaluate the sensitivity of a regional simulation to the model choice. One can evaluate the validity of Mercator products at regional scale, and, when necessary, the need to either improve the global model, or to priviledge the coupled use of the GCM and regional models more adapted to the regional scale. Figure 4 shows a zoom on the Cap Blanc (~21N) region for the two models on August 10th of a given simulation year. In summer, Cape Blanc is a confluence zone for the equatorward cold Canaries current and the poleward warm Monsoon current. This confluence is well reproduced in ROMS but it is located too far south throughout summer in POG.
Figure 4
August surface temperature (°C, color scale) and velocity (m/s) in the Canaries upwelling for POG (left) and ROMS (right).
In fact this cold current is generated locally. Associated to the upwelling front, it is barotropically and baroclinically unstable, which triggers a separation from the coast at multiple locations, generating filaments of cold water (Marchesiello et al., 2003, 2005).
The resolution of the upwelling front and associated filaments needs very fine grids of the order of a few kilometers. At ¼°, the front is underestimated, as well as the currents and their variability. But the effective resolution of a model is not only given by the spatial grid used for discretization, it also depends on the accuracy of the numerical schemes and the amount of dissipation used to eliminate spurious numerical modes.
Discretization in ROMS is oriented towards higher order schemes (Shchepetkin & McWilliams, 1998, 2003, 2004), weakly dispersive and dissipative, to improve the effective resolution at a moderate cost. The second-order, centered schemes in POG need a high level of dispersion to correct numerical effects caused by the Leapfrog algorithm. A dissipative filter is used to reduce the accuracy of the temporal scheme to the first degree (Shchepetkin & McWilliams, 2005). In other words, on the same grid, it is not surprising that mathematically similar but numerically different models produce different results even at the largest regional scales.
In the case of Cape Blanc, a “linear” ROMS simulation with a model version where non linear advection terms in the momentum equation have been cancelled (tracers advection terms remain) was performed. In that case, neither instabilities nor mesoscale structures are produced, the upwelling jets cannot separate from the coast, and the too strong alongshore component of the current pushes the monsoon current further south. It suggests that the same process may occur in POG to a lesser degree.
Modelling of eastern boundary upwelling systems with Mercator
The conclusion of this study is that solutions for regional problems are very sensitive to the type of model used. A spatial resolution of ¼° in POG does not allow the resolution of such mesoscale structures in the coastal transition zone. Nevertheless, the use of others numerical schemes and the embedment of regional ROMS models could increase the realism of the coastal circulation.
Impact of regional wind forcing products on the circulation
One of the limitations of a global product like Mercator is the need to use global atmospheric forcing which is not validated at regional scale. This is the case of wind fields which although quite unknown in coastal zones, are fundamental (Chelton et al., 2004).
In a study on the influence of atmospheric forcing at short scale (Capet et al., 2004) ROMS showed a high sensitivity of coastal upwelling to the spatial structure of nearshore wind. Indeed, coastal marine meteorology is characterized by a very stable and thin boundary layer, hence strongly influenced by orography. The strong thermal and roughness contrasts affect the structure of coastal winds at regional and short scales of a few km. Besides, too little data is collected in the coastal band, and AGCM are seldom validated in these regions.
The study of the impact of atmospheric regional fluxes on the coastal ocean needs to be tackled with a regional atmospheric model (Koracin and Dorman, 2004) such as WRF (Weather Research and Forecast system). This allows the implementation of experimental forecast systems, compatible with the means available in southern countries. Such systems are presently operational in Senegal (http://www.brest.ird.fr/personnel/pmarches/forecast_sen.html) and New Caledonia.
Preliminary results tend to confirm that the resolution and the choice of parameterisations affect the produced solutions in the atmosphere and in the ocean. For example, the differences of roughness between land and sea produce a very narrow zone of transition of a few kilometres, where alongshore winds decrease brutally. High resolution is necessary to avoid the offshore spreading and widening of the shear zone which would affect the realism of the modelled upwelling processes. One can recommend that it is preferable to give a greater weight to satellite or “blended” products for global wind fields. Some of which are being produced at CERSAT for future Mercator simulations.
Conclusions and perspectives Mercator main goal is to produce realistic simulations thanks to modelling and data assimilation at global scale. What will be the impact of data assimilation for upwelling systems? The choice of the algorithm will have to reproduce correctly the dynamics of equatorial waves, which generate poleward propagating coastal waves. This seems an attainable goal with the PSY3V2 prototype, as it was shown in the tropical Atlantic (E. Greiner and S. Illig, pers. communication.), and with the 4D-var implementation in the near future.
To be able to forecast the regional and coastal circulation, the path to follow remains to be invented. Several questions need to be addressed: how to initialize at best regional models with an eddy field produced by a basin circulation model? How do the adjustment to the initial state and the development of short scales occur? Will the data assimilated in the global model be also assimilated in the coastal model as well, and if so, what will be the best methodology? Last but not least, the atmospheric forcing will need to be carefully chosen: satellite products, global or regional ACM, or a clever blend of several products? Besides the dynamical components, to represent the first stages of the trophic chain remains a challenge for many applications. To operate regional and coastal coupled biogeochemical models, users will need access to the fundamental biogeochemical fields (nutrients and oxygen) at regional scale, their mean and variability consistent with the dynamics. This will be allowed by the implementation of global coupled models, such as proposed by the BIONUTS project (http://www.legos.obs-mip.fr/fr/projets/bionuts).
References Capet X.J., P. Marchesiello, and J.C. McWilliams, 2004: Upwelling response to coastal wind profiles, Geophysical Research
Letters 13, L13311, doi: 10.1029/2004GL020123.
Chavez, F.P., J. Ryan, S.E. Lluch-Cota, M.Niquen C., 2003. From anchovies to sardines and back : multidecadal change in the Pacific Ocean, Science, vol. 299.
Chelton, D.B., M.G. Schlax, M.H. Freilich and R.F. Milliff, 2004. Satellite measurements reveal persistent small-scale features in ocean winds, Science, Vol. 303, 978-983.
Debreu L., and E. Blayo, 1999. Adaptive mesh refinement for finite difference ocean models: first experiments, Journal of Physical Oceanography, 29, 1239-1250.
Modelling of eastern boundary upwelling systems with Mercator
Koracin, D., C.E. Dorman, E.P. Dever, 2004. Coastal Perturbations of Marine-Layer Winds, Wind Stress, and Wind Stress Curl along California and Baja California in June 1999, Journal of Physical Oceanography, 34, 1152-1173.
Marchesiello, P., J.C. McWilliams, & A. Shchepetkin, 2001: Open boundary conditions for long-term integrations of regional oceanic models, Ocean Modelling, 3, 1-20.
Marchesiello, P., J.C. McWilliams, & A. Shchepetkin, 2003: Equilibrium structure and dynamics of the California Current System, Journal of Physical Oceanography, 33, 753-783.
Marchesiello P., S. Herbette, L. Nykjaer, and C. Roy, 2004: Eddy-driven dispersion processes in the Canary Current upwelling system: comparison with the California system, International GLOBEC Newsletter, Volume 10, No. 1, April 2004.
Shchepetkin, A., and J.C. McWilliams, 2005: The Regional Oceanic Modeling System: A split-explicit, free-surface, topography-following-coordinate ocean model, submitted to Ocean Modelling, 9, 347-404
Shchepetkin, A.F., and J.C. McWilliams, 2003: A method for computing horizontal pressure-gradient force in an ocean model with a non-aligned vertical coordinate. J. Geophys. Res., 108, C3, 3090, doi:10.1029/2001JC001047.
Shchepetkin, A., & J.C. McWilliams, 1998: Quasi-monotone advection schemes based on explicit locally adaptive dissipation. Monthly Weather Review, 126, 1541-1580.
- Notebook -
Editorial board
Nathalie Verbrugge
Secretary
Sophie Baudel
Articles
News: Forcing coastal models with Mercator data ?
By Jerôme Chanut and Hélène Etienne
Methods to constrain the boundaries of an ocean model: application to a model of the Bay of Biscay
By Sylvain Cailleau, Veronika Fedorenko, Bernard Barnier, Eric Blayo and Laurent Debreu
Description of the PE Regional ESEOO Model System: Preliminary results from a Mercator nesting exercise
By Marcos Sotillo and Enrique Álvarez Fanjul
Modelling of eastern boundary upwelling systems with Mercator
By Vincent Echevin, Patrick Marchesiello and Pierrick Penven
Contact
Please send us your comments to the following e-mail address : [email protected]