Mercator Ocean Quarterly Newsletter #20 – january 2006 – Page 1 GIP Mercator Océan Quarterly Newsletter Editorial - January 2006 High scientific demand, sustainable management of sea resources, assessment and monitoring of pollution sources and of their environmental impact, urgency to understand how does the biologic processes link to the Carbon cycle and how do they impact climate: oceanic biologic parameters (primary production, biomass, and pelagic populations) are in the depths of vital stakes for our society sustainable development. Today, Mercator-Ocean is strongly involved in producing operational bulletins of the physical “blue” ocean. To use new requirements, it is going to integrate the forecasting of the living world seas’ component and become more “green”. A first quasi- real time demonstration phase will be launched in the beginning of 2006. LOBSTER biologic model will be integrated in the Mercator operational chain. This new stage was made possible thanks to the Bionuts research/operational collaboration. Five structures contribute to this project: LEGOS (Toulouse), LEGI (Grenoble), IPSL/OCEAN and IPSL/LSCE (Paris) and the GIP Mercator- Ocean. In the News, Patrick Monfray & al. present us this project, its stakes, as well as some recent results. The three other Newsletter’s articles present an overview of the Mercator associated research works on the “biology” thematic. François Royer & al. are interested on the pelagic species’ spatial dynamic, unavoidable stage for a better management of the sea resources. A toxic bloom of the cyanobacteria, Nodularia spumigena has been reported in the Baltic Sea. On July 24, 2003, SeaWiFS captured this view of the blooming Baltic. (credits NASA) In the scope of the Bionuts project, Leo Berline & al. have studied the assimilation impact (temperature, salinity, sea level) on the biologic parameters of coupled biology/physical model. In fact, the confrontation of physical models to biology constraints has revealed some negative effects of the assimilation scheme on the vertical processes performance. So, improve them is a crucial stake for the biology/physical coupling. At last, coupling between biologic and physical models is a great opportunity for Scientists to investigate how does the dynamic impact the biology. Isabelle Dadou & al. have looked at the Rossby waves influence on the primary production. Have a very good read!
Transcript
Mercator Ocean Quarterly Newsletter
#20 – january 2006 – Page 1
GIP Mercator Océan
Quarterly Newsletter
Editorial - January 2006
High scientific demand, sustainable management of sea resources, assessment and monitoring of pollution sources and of their environmental impact, urgency to understand how does the biologic processes link to the Carbon cycle and how do they impact climate: oceanic biologic parameters (primary production, biomass, and pelagic populations) are in the depths of vital stakes for our society sustainable development.
Today, Mercator-Ocean is strongly involved in producing operational bulletins of the physical “blue” ocean. To use new requirements, it is going to integrate the forecasting of the living world seas’ component and become more “green”. A first quasi-real time demonstration phase will be launched in the beginning of 2006. LOBSTER biologic model will be integrated in the Mercator operational chain. This new stage was made possible thanks to the Bionuts research/operational collaboration. Five structures contribute to this project: LEGOS (Toulouse), LEGI (Grenoble), IPSL/OCEAN and IPSL/LSCE (Paris) and the GIP Mercator-Ocean. In the News, Patrick Monfray & al. present us this project, its stakes, as well as some recent results.
The three other Newsletter’s articles present an overview of the Mercator associated research works on the “biology” thematic.
François Royer & al. are interested on the pelagic species’ spatial dynamic, unavoidable stage for a better management of the sea resources.
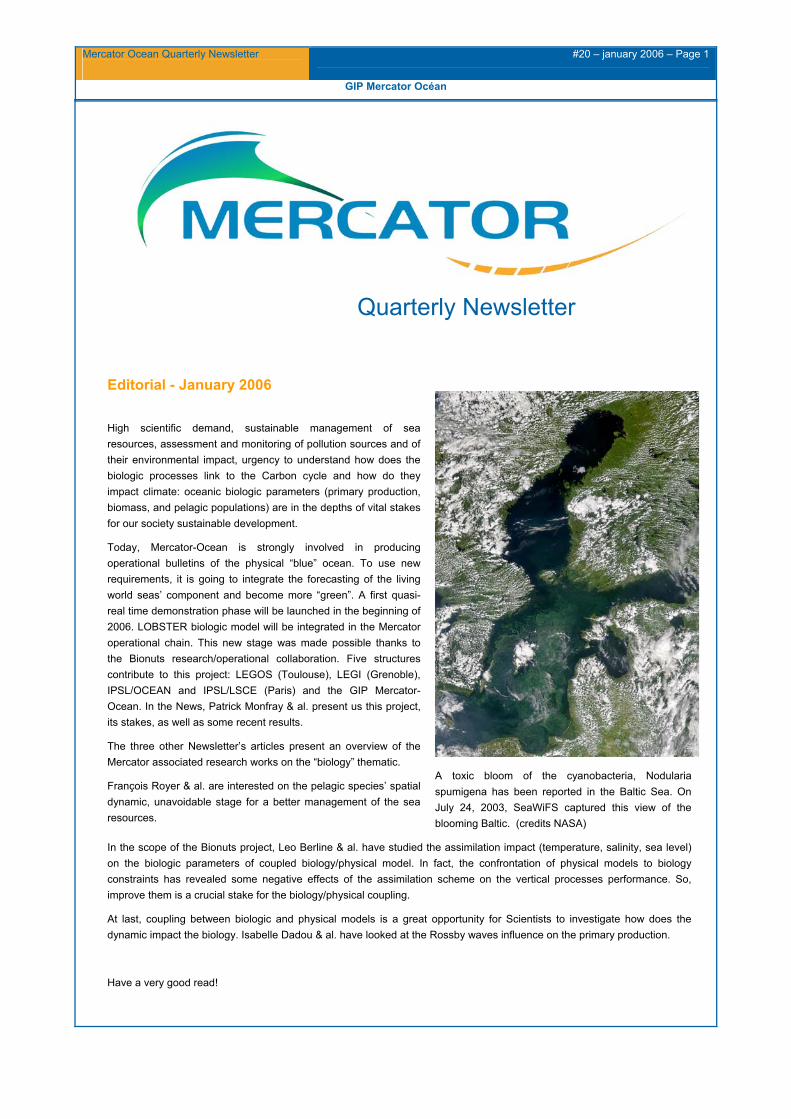
A toxic bloom of the cyanobacteria, Nodularia spumigena has been reported in the Baltic Sea. On July 24, 2003, SeaWiFS captured this view of the blooming Baltic. (credits NASA)
In the scope of the Bionuts project, Leo Berline & al. have studied the assimilation impact (temperature, salinity, sea level) on the biologic parameters of coupled biology/physical model. In fact, the confrontation of physical models to biology constraints has revealed some negative effects of the assimilation scheme on the vertical processes performance. So, improve them is a crucial stake for the biology/physical coupling.
At last, coupling between biologic and physical models is a great opportunity for Scientists to investigate how does the dynamic impact the biology. Isabelle Dadou & al. have looked at the Rossby waves influence on the primary production.
Have a very good read!
Mercator Ocean Quarterly Newsletter
#20 – january 2006 – Page 2
GIP Mercator Océan
Contents
Glossary
News : The marine biology, a challenge for operational oceanography
By Patrick Monfray with contribution of Abdelali El Moussaoui and the Bionuts Consortium
Migratory and depth behavior of Bluefin tuna in the Gulf Stream area : how Mercator can help in revealing habitat use by pelagic species
By François Royer, Steve Wilson and Molly Lutcavage
A challenge for the phusical-biogeochemical coupling in MERCATOR : improving the physics of coupled models through data assimilation
By Léo Berline, Jean-Michel Brakart, Pierre Brasseur, Yann Ourmières and Jacques Verron
Coupled physical/biogeochemical modeling at mesoscale in the North Atlantic Ocean : Rossby waves, a coupled process example
By Guillaume Charria, Isabelle Dadou, Marie Drévillon, Jérôme Llido and Véronique Garçon
Page 3
Page 4
Page 7
Page 12
Page 22
Mercator Ocean Quarterly Newsletter
#20 – january 2006 – Page 3
GIP Mercator Océan
Glossary
Biomass: The quantity of living matter, expressed as a concentration or weight per unit area
Bloom: A population burst of phytoplankton that remains within a defined part of the water column
Diatoms: Microscopic algae with plate like structures composed of silica. Diatoms are considered a good food source for zooplankton.
Eutrophic: Describes an aquatic system with high nutrient concentrations. These nutrient concentrations fuel algal growth. This algae eventually dies and decomposes, with reduces the amount of dissolved oxygen in the water
Oligotropic: Refers to water bodies or habitats with low concentrations of nutrients
Pelagic: The open ocean, excluding the ocean bottom and shore
Photic Layer: Refers to the surface layer of the ocean that receives enough sunlight for photosynthesis
Phytoplancton: Plankton are usually very small organisms that cannot move independently of water currents. Phytoplankton are any plankton that are capable of making food via photosynthesis
Primary production: The amount of organic material that plants synthesize from inorganic substances during photosynthesis
Zooplankton: a community of floating, often microscopic animals that inhabit aquatic environments. Unlike phytoplankton, zooplankton cannot produce their own food, and so are consumers.
Mercator Ocean Quarterly Newsletter
#20 – january 2006 – Page 4
News : The marine biology, a challenge for operational oceanography
News: The marine biology, a challenge for operational oceanography By Patrick Monfray with contribution of Abdelali El Moussaoui and the Bionuts Consortium 1 1 Bionuts Consortium to date : LEGI/Grenoble (L. Berline, J.M. Brankart, P. Brasseur,Y. Ourmieres, J. Verron); LEGOS/Toulouse (A. El Moussaoui, P. Monfray); LOCEAN/Paris et Brest (O. Aumont, A. El Moussaoui, M. Lévy, A.S. Kremeur), LSCE/Gif (S. Alvain, L. Bopp, J. Orr, C. Moulin); CLS/Toulouse (P. Gaspar, J. Stum); GIP-Mercator/Toulouse (E. Dombrowsky, E. Greiner, L. Nouel). Activities are supported by French GMMC and European projects MERSEA and CARBOOCEAN.1
The large variability of marine resources from interannual to decadal timescale is a major challenge for the scientific community as well as for the social demand towards sustainable management (see also paper by F. Royer on this issue). In fact, the populations of marine species are sensitive to the variability of physical, chemical and biological environments and its perturbations by anthropogenic activities as fisheries, management, nutrient and pollutant loading, climate change. Take up the gauntlet is part of the objectives of IMBER, the new international program over the period 2004-2014 (http://www.imber.info) who’s the international office recently opened in Brest.
But before reaching this goal, one step to cross over is to represent the dynamics of primary production, the elemental piece of energy flux at the base of the trophic food web. This productivity is driven by photosynthetic processes, which transform various nutrients into organic matter. It corresponds to bring right nutrients cocktail at the right place and the right time into the photic zone, which varies broadly from 20m to 120m.
In practice, it represents a triple challenge: 1) having a right vertical dynamics bringing nutrients from subsurface to the photic zone, 2) having the right subsurface nutrient fields, itself determined by a long range transport linking theirs sources and sinks, 3) having a good parameterization of biological processes as growing rate, efficiency and degradation of phytoplankton (ie organisms using chlorophyll for photosynthesis). Up to now a lot of effort had been devoted to this last aspect, but intrication of space and time scale implies to improve jointly the three previous aspects. In this context, new insights by operational oceanography could be decisive.
Ocean biogeochemical reanalysis linked to the climate
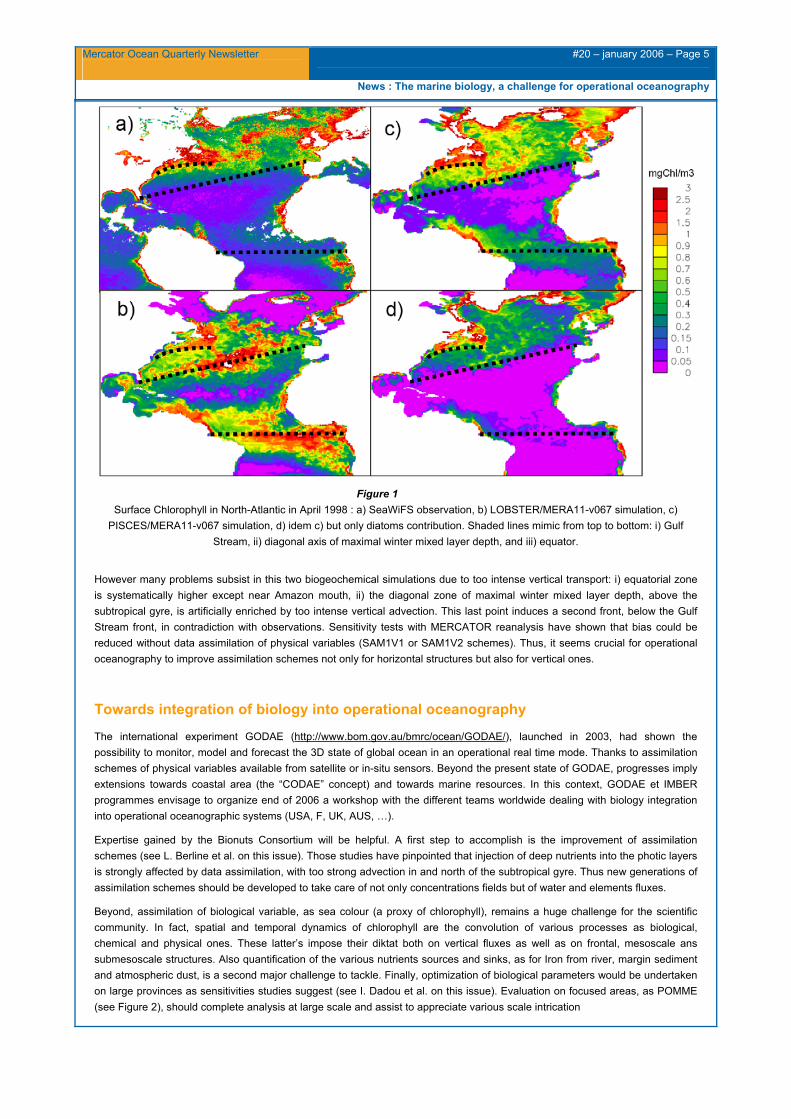
The Bionuts project is attacking this problem by taking opportunity of eddy permitting analysis over a whole basin, as the Northern Atlantic at 1/3° by using the new MERCATOR MERA11 reanalysis over the 1992-2001 period. Figure 1 illustrates progresses and difficulties to simulate a typical spring bloom within the Northern Atlantic. Simple models, NPZD type (as LOBSTER2) using only one nutrient (nitrates here), are aiming to represent the very broad structure revealed by satellite chlorophyll, with maximum at equator and mid latitudes split by a biological desert: the subtropical gyre. Only the use of a more advanced model, using various nutrients (as PISCES3) with Silica and Iron, which main sources are near margins, allows a better contrast between coastal areas and open ocean, and a reduction in HNLC areas (High Nutrient Low Chlorophyll) in the equatorial belt limited by iron.
News : The marine biology, a challenge for operational oceanography
Figure 1
Surface Chlorophyll in North-Atlantic in April 1998 : a) SeaWiFS observation, b) LOBSTER/MERA11-v067 simulation, c) PISCES/MERA11-v067 simulation, d) idem c) but only diatoms contribution. Shaded lines mimic from top to bottom: i) Gulf
Stream, ii) diagonal axis of maximal winter mixed layer depth, and iii) equator.
However many problems subsist in this two biogeochemical simulations due to too intense vertical transport: i) equatorial zone is systematically higher except near Amazon mouth, ii) the diagonal zone of maximal winter mixed layer depth, above the subtropical gyre, is artificially enriched by too intense vertical advection. This last point induces a second front, below the Gulf Stream front, in contradiction with observations. Sensitivity tests with MERCATOR reanalysis have shown that bias could be reduced without data assimilation of physical variables (SAM1V1 or SAM1V2 schemes). Thus, it seems crucial for operational oceanography to improve assimilation schemes not only for horizontal structures but also for vertical ones.
Towards integration of biology into operational oceanography
The international experiment GODAE (http://www.bom.gov.au/bmrc/ocean/GODAE/), launched in 2003, had shown the possibility to monitor, model and forecast the 3D state of global ocean in an operational real time mode. Thanks to assimilation schemes of physical variables available from satellite or in-situ sensors. Beyond the present state of GODAE, progresses imply extensions towards coastal area (the “CODAE” concept) and towards marine resources. In this context, GODAE et IMBER programmes envisage to organize end of 2006 a workshop with the different teams worldwide dealing with biology integration into operational oceanographic systems (USA, F, UK, AUS, …).
Expertise gained by the Bionuts Consortium will be helpful. A first step to accomplish is the improvement of assimilation schemes (see L. Berline et al. on this issue). Those studies have pinpointed that injection of deep nutrients into the photic layers is strongly affected by data assimilation, with too strong advection in and north of the subtropical gyre. Thus new generations of assimilation schemes should be developed to take care of not only concentrations fields but of water and elements fluxes.
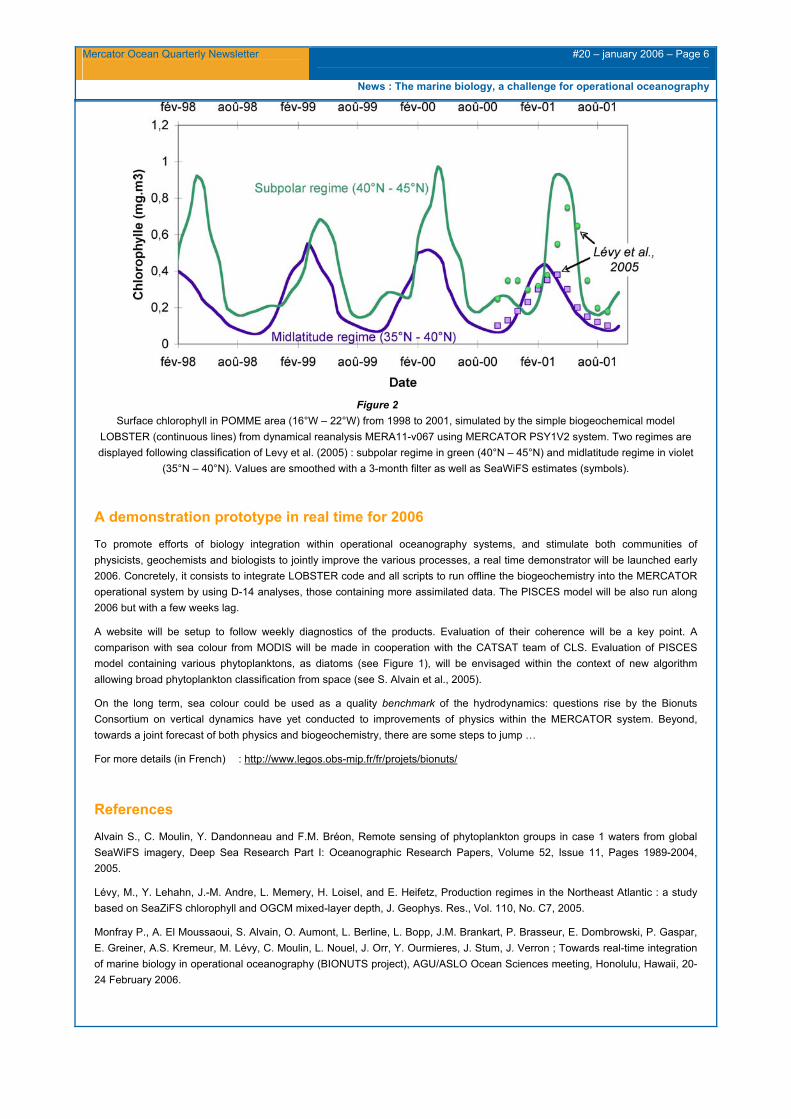
Beyond, assimilation of biological variable, as sea colour (a proxy of chlorophyll), remains a huge challenge for the scientific community. In fact, spatial and temporal dynamics of chlorophyll are the convolution of various processes as biological, chemical and physical ones. These latter’s impose their diktat both on vertical fluxes as well as on frontal, mesoscale ans submesoscale structures. Also quantification of the various nutrients sources and sinks, as for Iron from river, margin sediment and atmospheric dust, is a second major challenge to tackle. Finally, optimization of biological parameters would be undertaken on large provinces as sensitivities studies suggest (see I. Dadou et al. on this issue). Evaluation on focused areas, as POMME (see Figure 2), should complete analysis at large scale and assist to appreciate various scale intrication
News : The marine biology, a challenge for operational oceanography
Figure 2 Surface chlorophyll in POMME area (16°W – 22°W) from 1998 to 2001, simulated by the simple biogeochemical model
LOBSTER (continuous lines) from dynamical reanalysis MERA11-v067 using MERCATOR PSY1V2 system. Two regimes are displayed following classification of Levy et al. (2005) : subpolar regime in green (40°N – 45°N) and midlatitude regime in violet
(35°N – 40°N). Values are smoothed with a 3-month filter as well as SeaWiFS estimates (symbols).
A demonstration prototype in real time for 2006
To promote efforts of biology integration within operational oceanography systems, and stimulate both communities of physicists, geochemists and biologists to jointly improve the various processes, a real time demonstrator will be launched early 2006. Concretely, it consists to integrate LOBSTER code and all scripts to run offline the biogeochemistry into the MERCATOR operational system by using D-14 analyses, those containing more assimilated data. The PISCES model will be also run along 2006 but with a few weeks lag.
A website will be setup to follow weekly diagnostics of the products. Evaluation of their coherence will be a key point. A comparison with sea colour from MODIS will be made in cooperation with the CATSAT team of CLS. Evaluation of PISCES model containing various phytoplanktons, as diatoms (see Figure 1), will be envisaged within the context of new algorithm allowing broad phytoplankton classification from space (see S. Alvain et al., 2005).
On the long term, sea colour could be used as a quality benchmark of the hydrodynamics: questions rise by the Bionuts Consortium on vertical dynamics have yet conducted to improvements of physics within the MERCATOR system. Beyond, towards a joint forecast of both physics and biogeochemistry, there are some steps to jump …
For more details (in French) : http://www.legos.obs-mip.fr/fr/projets/bionuts/
References
Alvain S., C. Moulin, Y. Dandonneau and F.M. Bréon, Remote sensing of phytoplankton groups in case 1 waters from global SeaWiFS imagery, Deep Sea Research Part I: Oceanographic Research Papers, Volume 52, Issue 11, Pages 1989-2004, 2005.
Lévy, M., Y. Lehahn, J.-M. Andre, L. Memery, H. Loisel, and E. Heifetz, Production regimes in the Northeast Atlantic : a study based on SeaZiFS chlorophyll and OGCM mixed-layer depth, J. Geophys. Res., Vol. 110, No. C7, 2005.
Monfray P., A. El Moussaoui, S. Alvain, O. Aumont, L. Berline, L. Bopp, J.M. Brankart, P. Brasseur, E. Dombrowski, P. Gaspar, E. Greiner, A.S. Kremeur, M. Lévy, C. Moulin, L. Nouel, J. Orr, Y. Ourmieres, J. Stum, J. Verron ; Towards real-time integration of marine biology in operational oceanography (BIONUTS project), AGU/ASLO Ocean Sciences meeting, Honolulu, Hawaii, 20-24 February 2006.
Migratory and depth behavior of Bluefin tuna in the Gulf Stream area
Migratory and depth behavior of Bluefin tuna in the Gulf Stream area: how Mercator can help in revealing habitat use by pelagic species By François Royer1, Steve Wilson2, Molly Lutcavage2
1 UNH (University of New Hampshire) 2 Large Pelagics Research Lab, University of New Hampshire, Durham, New Hampshire, 03870, USA
Introduction
In the past decade, the development of tagging technology has lead to new insight in how marine species explore the pelagic environment. Such knowledge is greatly needed for management purposes, as the spatial distribution and habitat use of many marine species remain poorly known. Archival tags (data loggers equipped with depth, temperature and irradiance sensors) documented important events such as trans-oceanic migrations and long-term diving behavior (Block et al. 2001, Lutcavage et al. 1999, Wilson et al. 2005). The resulting data has however not been fully exploited due to the lack of inclusion of oceanographic information, and non-trivial observation errors.
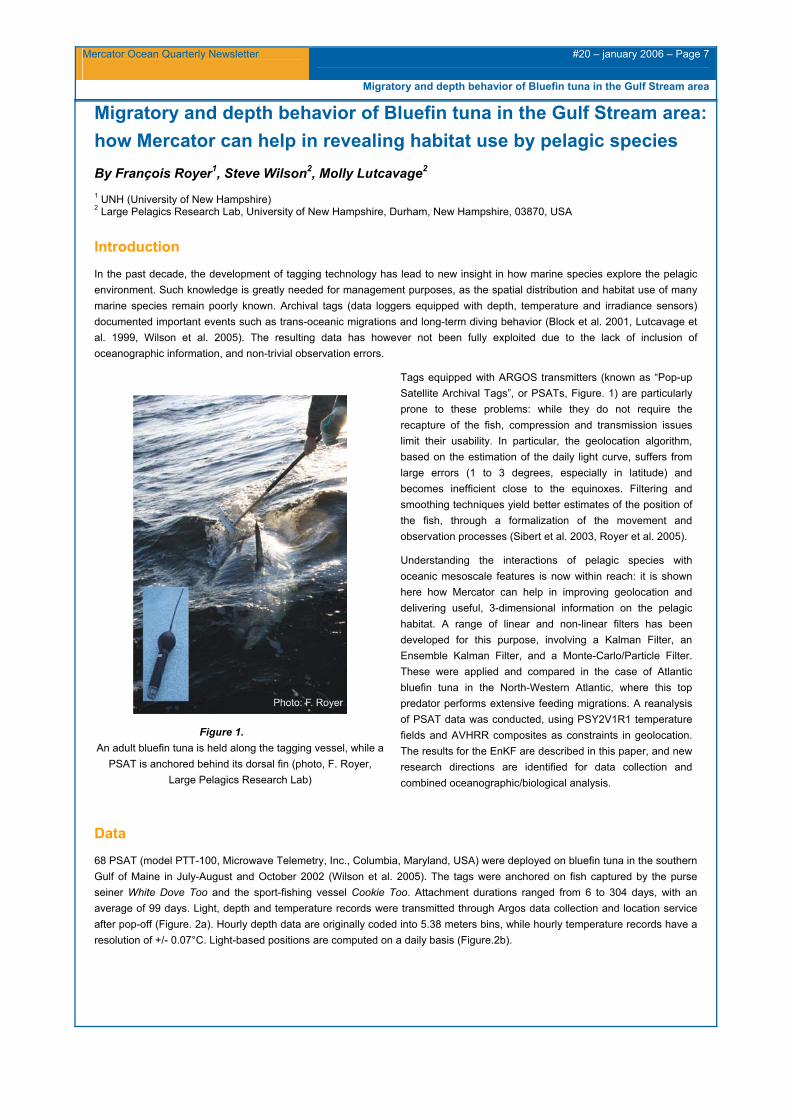
Figure 1. An adult bluefin tuna is held along the tagging vessel, while a
PSAT is anchored behind its dorsal fin (photo, F. Royer, Large Pelagics Research Lab)
Tags equipped with ARGOS transmitters (known as “Pop-up Satellite Archival Tags”, or PSATs, Figure. 1) are particularly prone to these problems: while they do not require the recapture of the fish, compression and transmission issues limit their usability. In particular, the geolocation algorithm, based on the estimation of the daily light curve, suffers from large errors (1 to 3 degrees, especially in latitude) and becomes inefficient close to the equinoxes. Filtering and smoothing techniques yield better estimates of the position of the fish, through a formalization of the movement and observation processes (Sibert et al. 2003, Royer et al. 2005).
Understanding the interactions of pelagic species with oceanic mesoscale features is now within reach: it is shown here how Mercator can help in improving geolocation and delivering useful, 3-dimensional information on the pelagic habitat. A range of linear and non-linear filters has been developed for this purpose, involving a Kalman Filter, an Ensemble Kalman Filter, and a Monte-Carlo/Particle Filter. These were applied and compared in the case of Atlantic bluefin tuna in the North-Western Atlantic, where this top predator performs extensive feeding migrations. A reanalysis of PSAT data was conducted, using PSY2V1R1 temperature fields and AVHRR composites as constraints in geolocation. The results for the EnKF are described in this paper, and new research directions are identified for data collection and combined oceanographic/biological analysis.
Data
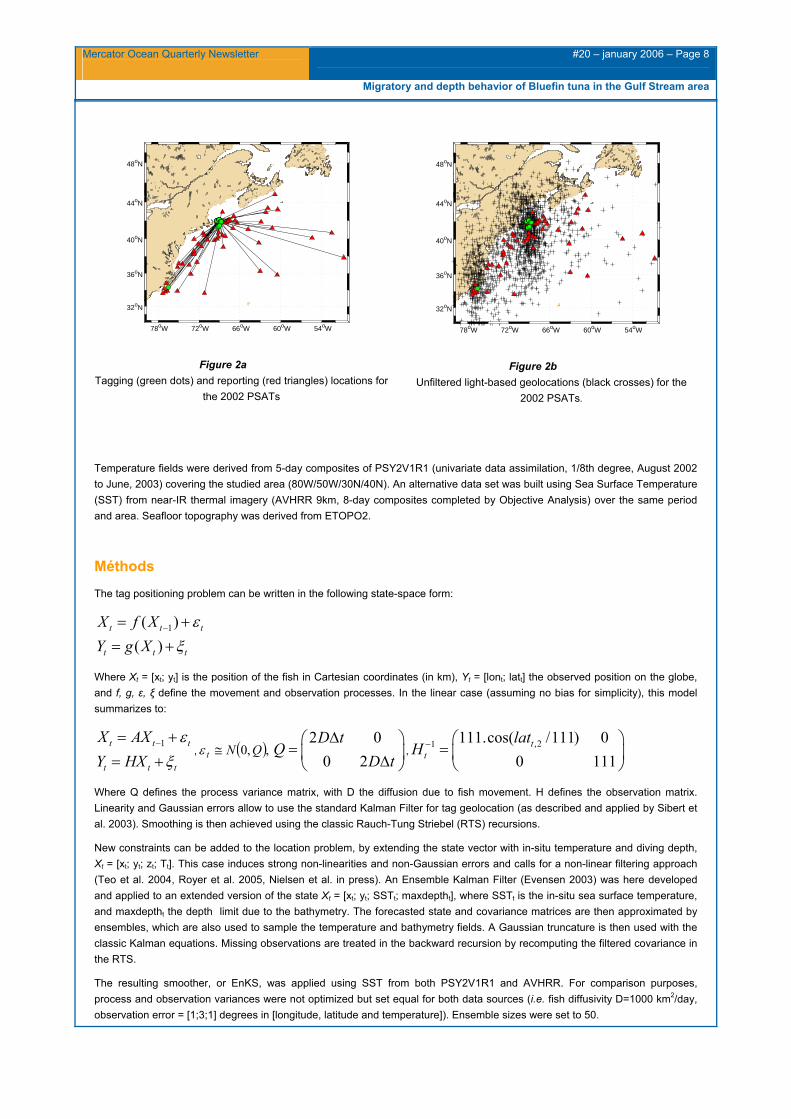
68 PSAT (model PTT-100, Microwave Telemetry, Inc., Columbia, Maryland, USA) were deployed on bluefin tuna in the southern Gulf of Maine in July-August and October 2002 (Wilson et al. 2005). The tags were anchored on fish captured by the purse seiner White Dove Too and the sport-fishing vessel Cookie Too. Attachment durations ranged from 6 to 304 days, with an average of 99 days. Light, depth and temperature records were transmitted through Argos data collection and location service after pop-off (Figure. 2a). Hourly depth data are originally coded into 5.38 meters bins, while hourly temperature records have a resolution of +/- 0.07°C. Light-based positions are computed on a daily basis (Figure.2b).
Mercator Ocean Quarterly Newsletter
#20 – january 2006 – Page 8
Migratory and depth behavior of Bluefin tuna in the Gulf Stream area
Temperature fields were derived from 5-day composites of PSY2V1R1 (univariate data assimilation, 1/8th degree, August 2002 to June, 2003) covering the studied area (80W/50W/30N/40N). An alternative data set was built using Sea Surface Temperature (SST) from near-IR thermal imagery (AVHRR 9km, 8-day composites completed by Objective Analysis) over the same period and area. Seafloor topography was derived from ETOPO2.
Méthods
The tag positioning problem can be written in the following state-space form:
1( )( )
t t t
t t t
X f XY g X
εξ
−= += +
Where Xt = [xt; yt] is the position of the fish in Cartesian coordinates (in km), Yt = [lont; latt] the observed position on the globe, and f, g, ε, ξ define the movement and observation processes. In the linear case (assuming no bias for simplicity), this model summarizes to:
1t t t
t t t
X AXY HX
εξ
−= += +
, ( ),,0 QNt ≅ε2 00 2D t
QD t
∆ = ∆
,,21 111.cos( /111) 0
0 111t
t
latH −
=
Where Q defines the process variance matrix, with D the diffusion due to fish movement. H defines the observation matrix. Linearity and Gaussian errors allow to use the standard Kalman Filter for tag geolocation (as described and applied by Sibert et al. 2003). Smoothing is then achieved using the classic Rauch-Tung Striebel (RTS) recursions.
New constraints can be added to the location problem, by extending the state vector with in-situ temperature and diving depth, Xt = [xt; yt; zt; Tt]. This case induces strong non-linearities and non-Gaussian errors and calls for a non-linear filtering approach (Teo et al. 2004, Royer et al. 2005, Nielsen et al. in press). An Ensemble Kalman Filter (Evensen 2003) was here developed and applied to an extended version of the state Xt = [xt; yt; SSTt; maxdeptht], where SSTt is the in-situ sea surface temperature, and maxdeptht the depth limit due to the bathymetry. The forecasted state and covariance matrices are then approximated by ensembles, which are also used to sample the temperature and bathymetry fields. A Gaussian truncature is then used with the classic Kalman equations. Missing observations are treated in the backward recursion by recomputing the filtered covariance in the RTS.
The resulting smoother, or EnKS, was applied using SST from both PSY2V1R1 and AVHRR. For comparison purposes, process and observation variances were not optimized but set equal for both data sources (i.e. fish diffusivity D=1000 km2/day, observation error = [1;3;1] degrees in [longitude, latitude and temperature]). Ensemble sizes were set to 50.
78oW 72oW 66oW 60oW 54oW
32oN
36oN
40oN
44oN
48oN
Figure 2a Tagging (green dots) and reporting (red triangles) locations for
the 2002 PSATs
78oW 72oW 66oW 60oW 54oW
32oN
36oN
40oN
44oN
48oN
Figure 2b Unfiltered light-based geolocations (black crosses) for the
2002 PSATs.
Mercator Ocean Quarterly Newsletter
#20 – january 2006 – Page 9
Migratory and depth behavior of Bluefin tuna in the Gulf Stream area
Results and discussion
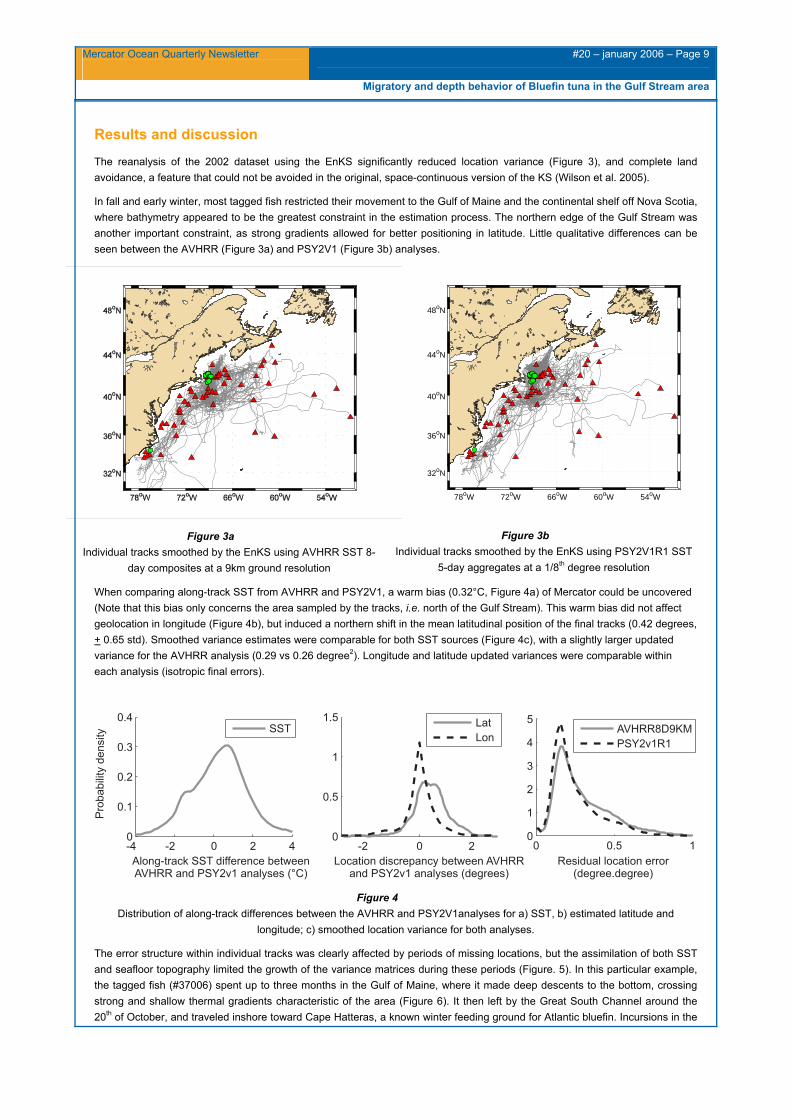
The reanalysis of the 2002 dataset using the EnKS significantly reduced location variance (Figure 3), and complete land avoidance, a feature that could not be avoided in the original, space-continuous version of the KS (Wilson et al. 2005).
In fall and early winter, most tagged fish restricted their movement to the Gulf of Maine and the continental shelf off Nova Scotia, where bathymetry appeared to be the greatest constraint in the estimation process. The northern edge of the Gulf Stream was another important constraint, as strong gradients allowed for better positioning in latitude. Little qualitative differences can be seen between the AVHRR (Figure 3a) and PSY2V1 (Figure 3b) analyses.
Figure 3a Individual tracks smoothed by the EnKS using AVHRR SST 8-
day composites at a 9km ground resolution
78oW 72oW 66oW 60oW 54oW
32oN
36oN
40oN
44oN
48oN
Figure 3b Individual tracks smoothed by the EnKS using PSY2V1R1 SST
5-day aggregates at a 1/8th degree resolution
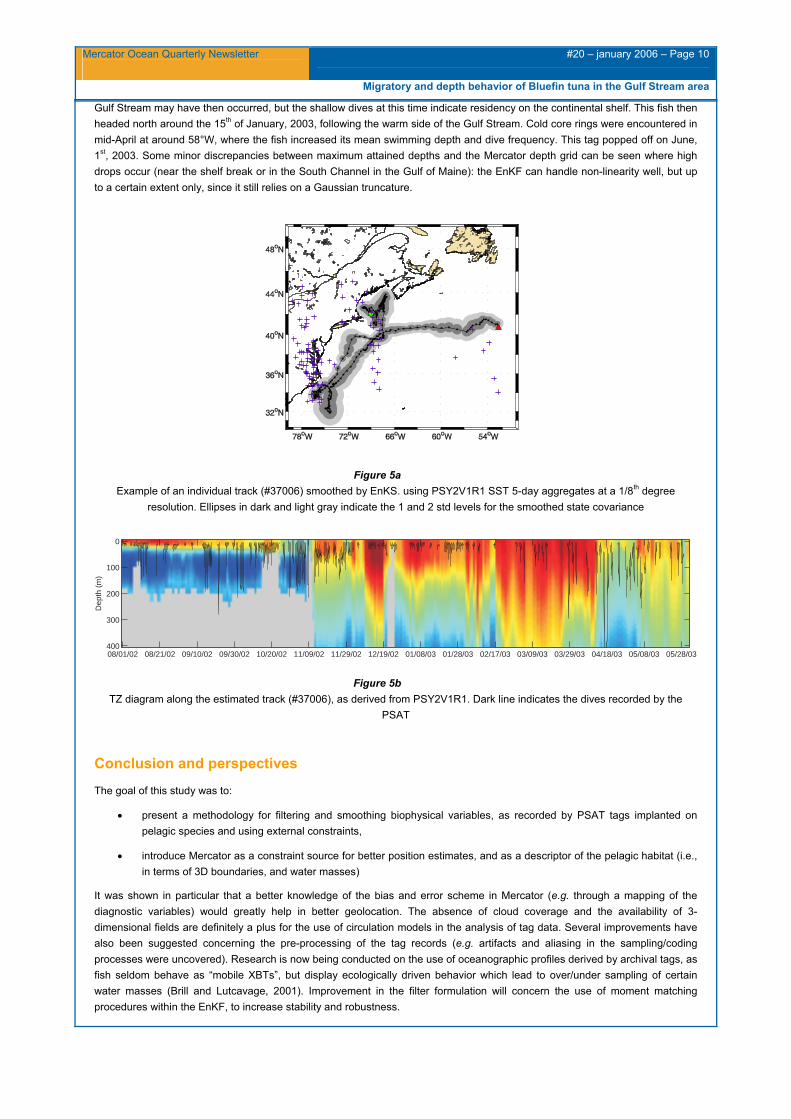
When comparing along-track SST from AVHRR and PSY2V1, a warm bias (0.32°C, Figure 4a) of Mercator could be uncovered (Note that this bias only concerns the area sampled by the tracks, i.e. north of the Gulf Stream). This warm bias did not affect geolocation in longitude (Figure 4b), but induced a northern shift in the mean latitudinal position of the final tracks (0.42 degrees, + 0.65 std). Smoothed variance estimates were comparable for both SST sources (Figure 4c), with a slightly larger updated variance for the AVHRR analysis (0.29 vs 0.26 degree2). Longitude and latitude updated variances were comparable within each analysis (isotropic final errors).
-2 0 20
0.5
1
1.5
-4 -2 0 2 40
0.1
0.2
0.3
0.4
0 0.5 10
1
2
3
4
5AVHRR8D9KM
PSY2v1R1
Lat
LonSST
Along-track SST difference betweenAVHRR and PSY2v1 analyses (°C)
Location discrepancy between AVHRRand PSY2v1 analyses (degrees)
Residual location error(degree.degree)
Pro
ba
bili
tyd
en
sity
Figure 4 Distribution of along-track differences between the AVHRR and PSY2V1analyses for a) SST, b) estimated latitude and
longitude; c) smoothed location variance for both analyses.
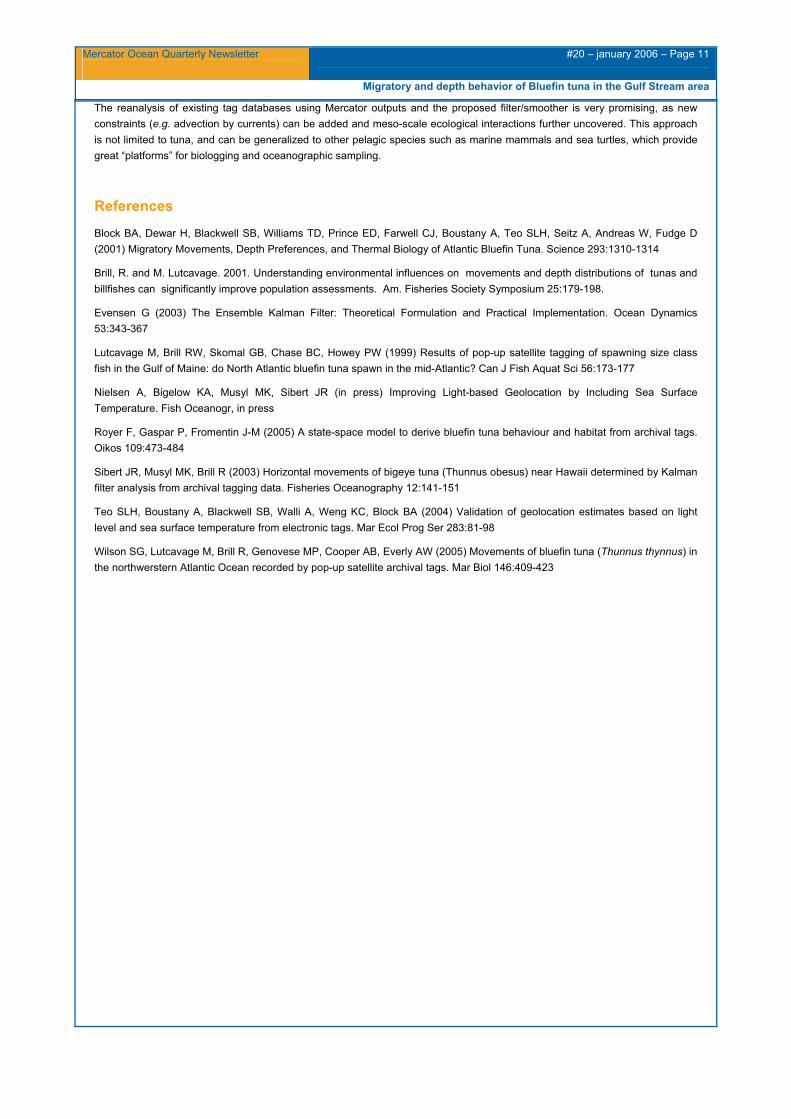
The error structure within individual tracks was clearly affected by periods of missing locations, but the assimilation of both SST and seafloor topography limited the growth of the variance matrices during these periods (Figure. 5). In this particular example, the tagged fish (#37006) spent up to three months in the Gulf of Maine, where it made deep descents to the bottom, crossing strong and shallow thermal gradients characteristic of the area (Figure 6). It then left by the Great South Channel around the 20th of October, and traveled inshore toward Cape Hatteras, a known winter feeding ground for Atlantic bluefin. Incursions in the
Mercator Ocean Quarterly Newsletter
#20 – january 2006 – Page 10
Migratory and depth behavior of Bluefin tuna in the Gulf Stream area
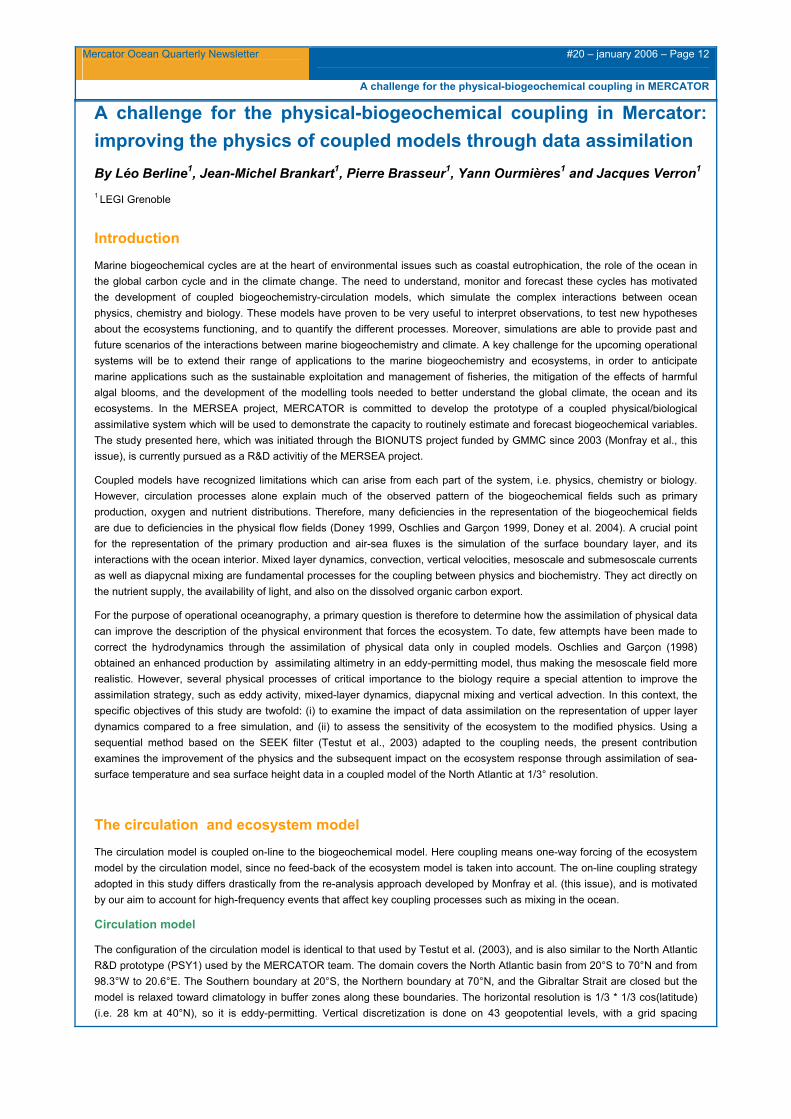
Gulf Stream may have then occurred, but the shallow dives at this time indicate residency on the continental shelf. This fish then headed north around the 15th of January, 2003, following the warm side of the Gulf Stream. Cold core rings were encountered in mid-April at around 58°W, where the fish increased its mean swimming depth and dive frequency. This tag popped off on June, 1st, 2003. Some minor discrepancies between maximum attained depths and the Mercator depth grid can be seen where high drops occur (near the shelf break or in the South Channel in the Gulf of Maine): the EnKF can handle non-linearity well, but up to a certain extent only, since it still relies on a Gaussian truncature.
Figure 5a Example of an individual track (#37006) smoothed by EnKS. using PSY2V1R1 SST 5-day aggregates at a 1/8th degree
resolution. Ellipses in dark and light gray indicate the 1 and 2 std levels for the smoothed state covariance
TZ diagram along the estimated track (#37006), as derived from PSY2V1R1. Dark line indicates the dives recorded by the PSAT
Conclusion and perspectives
The goal of this study was to:
• present a methodology for filtering and smoothing biophysical variables, as recorded by PSAT tags implanted on pelagic species and using external constraints,
• introduce Mercator as a constraint source for better position estimates, and as a descriptor of the pelagic habitat (i.e., in terms of 3D boundaries, and water masses)
It was shown in particular that a better knowledge of the bias and error scheme in Mercator (e.g. through a mapping of the diagnostic variables) would greatly help in better geolocation. The absence of cloud coverage and the availability of 3-dimensional fields are definitely a plus for the use of circulation models in the analysis of tag data. Several improvements have also been suggested concerning the pre-processing of the tag records (e.g. artifacts and aliasing in the sampling/coding processes were uncovered). Research is now being conducted on the use of oceanographic profiles derived by archival tags, as fish seldom behave as “mobile XBTs”, but display ecologically driven behavior which lead to over/under sampling of certain water masses (Brill and Lutcavage, 2001). Improvement in the filter formulation will concern the use of moment matching procedures within the EnKF, to increase stability and robustness.
Mercator Ocean Quarterly Newsletter
#20 – january 2006 – Page 11
Migratory and depth behavior of Bluefin tuna in the Gulf Stream area
The reanalysis of existing tag databases using Mercator outputs and the proposed filter/smoother is very promising, as new constraints (e.g. advection by currents) can be added and meso-scale ecological interactions further uncovered. This approach is not limited to tuna, and can be generalized to other pelagic species such as marine mammals and sea turtles, which provide great “platforms” for biologging and oceanographic sampling.
References
Block BA, Dewar H, Blackwell SB, Williams TD, Prince ED, Farwell CJ, Boustany A, Teo SLH, Seitz A, Andreas W, Fudge D (2001) Migratory Movements, Depth Preferences, and Thermal Biology of Atlantic Bluefin Tuna. Science 293:1310-1314
Brill, R. and M. Lutcavage. 2001. Understanding environmental influences on movements and depth distributions of tunas and billfishes can significantly improve population assessments. Am. Fisheries Society Symposium 25:179-198.
Evensen G (2003) The Ensemble Kalman Filter: Theoretical Formulation and Practical Implementation. Ocean Dynamics 53:343-367
Lutcavage M, Brill RW, Skomal GB, Chase BC, Howey PW (1999) Results of pop-up satellite tagging of spawning size class fish in the Gulf of Maine: do North Atlantic bluefin tuna spawn in the mid-Atlantic? Can J Fish Aquat Sci 56:173-177
Nielsen A, Bigelow KA, Musyl MK, Sibert JR (in press) Improving Light-based Geolocation by Including Sea Surface Temperature. Fish Oceanogr, in press
Royer F, Gaspar P, Fromentin J-M (2005) A state-space model to derive bluefin tuna behaviour and habitat from archival tags. Oikos 109:473-484
Sibert JR, Musyl MK, Brill R (2003) Horizontal movements of bigeye tuna (Thunnus obesus) near Hawaii determined by Kalman filter analysis from archival tagging data. Fisheries Oceanography 12:141-151
Teo SLH, Boustany A, Blackwell SB, Walli A, Weng KC, Block BA (2004) Validation of geolocation estimates based on light level and sea surface temperature from electronic tags. Mar Ecol Prog Ser 283:81-98
Wilson SG, Lutcavage M, Brill R, Genovese MP, Cooper AB, Everly AW (2005) Movements of bluefin tuna (Thunnus thynnus) in the northwerstern Atlantic Ocean recorded by pop-up satellite archival tags. Mar Biol 146:409-423
Mercator Ocean Quarterly Newsletter
#20 – january 2006 – Page 12
A challenge for the physical-biogeochemical coupling in MERCATOR
A challenge for the physical-biogeochemical coupling in Mercator: improving the physics of coupled models through data assimilation By Léo Berline1, Jean-Michel Brankart1, Pierre Brasseur1, Yann Ourmières1 and Jacques Verron1 1 LEGI Grenoble
Introduction
Marine biogeochemical cycles are at the heart of environmental issues such as coastal eutrophication, the role of the ocean in the global carbon cycle and in the climate change. The need to understand, monitor and forecast these cycles has motivated the development of coupled biogeochemistry-circulation models, which simulate the complex interactions between ocean physics, chemistry and biology. These models have proven to be very useful to interpret observations, to test new hypotheses about the ecosystems functioning, and to quantify the different processes. Moreover, simulations are able to provide past and future scenarios of the interactions between marine biogeochemistry and climate. A key challenge for the upcoming operational systems will be to extend their range of applications to the marine biogeochemistry and ecosystems, in order to anticipate marine applications such as the sustainable exploitation and management of fisheries, the mitigation of the effects of harmful algal blooms, and the development of the modelling tools needed to better understand the global climate, the ocean and its ecosystems. In the MERSEA project, MERCATOR is committed to develop the prototype of a coupled physical/biological assimilative system which will be used to demonstrate the capacity to routinely estimate and forecast biogeochemical variables. The study presented here, which was initiated through the BIONUTS project funded by GMMC since 2003 (Monfray et al., this issue), is currently pursued as a R&D activitiy of the MERSEA project.
Coupled models have recognized limitations which can arise from each part of the system, i.e. physics, chemistry or biology. However, circulation processes alone explain much of the observed pattern of the biogeochemical fields such as primary production, oxygen and nutrient distributions. Therefore, many deficiencies in the representation of the biogeochemical fields are due to deficiencies in the physical flow fields (Doney 1999, Oschlies and Garçon 1999, Doney et al. 2004). A crucial point for the representation of the primary production and air-sea fluxes is the simulation of the surface boundary layer, and its interactions with the ocean interior. Mixed layer dynamics, convection, vertical velocities, mesoscale and submesoscale currents as well as diapycnal mixing are fundamental processes for the coupling between physics and biochemistry. They act directly on the nutrient supply, the availability of light, and also on the dissolved organic carbon export.
For the purpose of operational oceanography, a primary question is therefore to determine how the assimilation of physical data can improve the description of the physical environment that forces the ecosystem. To date, few attempts have been made to correct the hydrodynamics through the assimilation of physical data only in coupled models. Oschlies and Garçon (1998) obtained an enhanced production by assimilating altimetry in an eddy-permitting model, thus making the mesoscale field more realistic. However, several physical processes of critical importance to the biology require a special attention to improve the assimilation strategy, such as eddy activity, mixed-layer dynamics, diapycnal mixing and vertical advection. In this context, the specific objectives of this study are twofold: (i) to examine the impact of data assimilation on the representation of upper layer dynamics compared to a free simulation, and (ii) to assess the sensitivity of the ecosystem to the modified physics. Using a sequential method based on the SEEK filter (Testut et al., 2003) adapted to the coupling needs, the present contribution examines the improvement of the physics and the subsequent impact on the ecosystem response through assimilation of sea-surface temperature and sea surface height data in a coupled model of the North Atlantic at 1/3° resolution.
The circulation and ecosystem model
The circulation model is coupled on-line to the biogeochemical model. Here coupling means one-way forcing of the ecosystem model by the circulation model, since no feed-back of the ecosystem model is taken into account. The on-line coupling strategy adopted in this study differs drastically from the re-analysis approach developed by Monfray et al. (this issue), and is motivated by our aim to account for high-frequency events that affect key coupling processes such as mixing in the ocean.
Circulation model
The configuration of the circulation model is identical to that used by Testut et al. (2003), and is also similar to the North Atlantic R&D prototype (PSY1) used by the MERCATOR team. The domain covers the North Atlantic basin from 20°S to 70°N and from 98.3°W to 20.6°E. The Southern boundary at 20°S, the Northern boundary at 70°N, and the Gibraltar Strait are closed but the model is relaxed toward climatology in buffer zones along these boundaries. The horizontal resolution is 1/3 * 1/3 cos(latitude) (i.e. 28 km at 40°N), so it is eddy-permitting. Vertical discretization is done on 43 geopotential levels, with a grid spacing
Mercator Ocean Quarterly Newsletter
#20 – january 2006 – Page 13
A challenge for the physical-biogeochemical coupling in MERCATOR
increasing from 12 m at the surface to 200 m below 1500 m. The atmospheric forcing fields (momentum, heat and freshwater fluxes) are derived from the 6-h ECMWF analysis. Sea-surface temperature is relaxed to the Reynolds weekly analysis, while sea-surface salinity (SSS) is relaxed to the Reynaud seasonal climatology (Reynaud et al., 1998).
Biogeochemical model
For the purpose of this North Atlantic study, a simple pelagic model is used, based on the P3ZD formulation developed by Aumont (1998). The P3ZD model was designed to study the carbon cycle at global scale (Aumont 1998, Aumont et al. 2002, Le Quéré et al. 2003), hence all tracers are expressed in carbon unit. The evolution of each tracer concentration C follows an advective-diffusive equation (1), with a source-minus-sink (sms) term representing the interactions with the other biogeochemical tracers.
)()( 4 CsmszCK
zCKuC
tC
zhh +
∂∂
∂∂
+∇+⋅−∇=∂∂
(1)
Kh is the horizontal diffusivity coefficient equal to 2.5 1019 cm4.s-1, and Kz is the vertical diffusivity coefficient computed from the TKE closure model. Biogeochemical tracers advection uses a low-implicit-diffusivity and positive-definite scheme with two corrections (Smolarkiewicz, 1986).
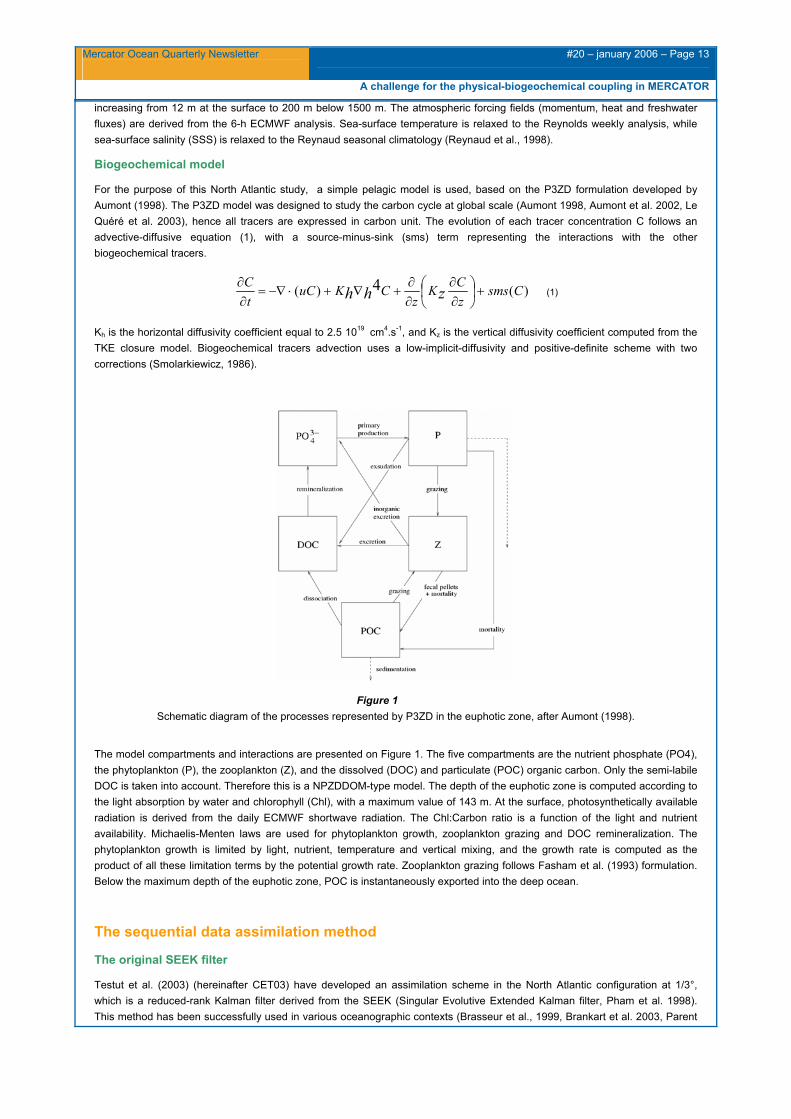
Figure 1 Schematic diagram of the processes represented by P3ZD in the euphotic zone, after Aumont (1998).
The model compartments and interactions are presented on Figure 1. The five compartments are the nutrient phosphate (PO4), the phytoplankton (P), the zooplankton (Z), and the dissolved (DOC) and particulate (POC) organic carbon. Only the semi-labile DOC is taken into account. Therefore this is a NPZDDOM-type model. The depth of the euphotic zone is computed according to the light absorption by water and chlorophyll (Chl), with a maximum value of 143 m. At the surface, photosynthetically available radiation is derived from the daily ECMWF shortwave radiation. The Chl:Carbon ratio is a function of the light and nutrient availability. Michaelis-Menten laws are used for phytoplankton growth, zooplankton grazing and DOC remineralization. The phytoplankton growth is limited by light, nutrient, temperature and vertical mixing, and the growth rate is computed as the product of all these limitation terms by the potential growth rate. Zooplankton grazing follows Fasham et al. (1993) formulation. Below the maximum depth of the euphotic zone, POC is instantaneously exported into the deep ocean.
The sequential data assimilation method
The original SEEK filter
Testut et al. (2003) (hereinafter CET03) have developed an assimilation scheme in the North Atlantic configuration at 1/3°, which is a reduced-rank Kalman filter derived from the SEEK (Singular Evolutive Extended Kalman filter, Pham et al. 1998). This method has been successfully used in various oceanographic contexts (Brasseur et al., 1999, Brankart et al. 2003, Parent
Mercator Ocean Quarterly Newsletter
#20 – january 2006 – Page 14
A challenge for the physical-biogeochemical coupling in MERCATOR
et al., 2003, Testut et al., 2003). The MERCATOR assimilation scheme of the second generation (SAM-2) is similarly inherited from the analysis scheme of the SEEK filter (Brasseur et al., 2006).
The formulation of the assimilation algorithm relies on a low-rank error covariance matrix, which makes the calculations tractable even with state vectors of very large dimension. Several strategies can be adopted to initialize the vectors of the reduced basis. A method involving the computation of empirical orthogonal functions obtained from prior simulations (without assimilation) has been applied in the majority of case studies; this approach leads to corrections of the model trajectory that are multivariate and dynamically consistent. The extrapolation of the data from observed to non-observed variables is performed along the directions represented by these error modes which connect all dynamical variables and grid points of the numerical domain. The 3D modal representation for the error statistics is intended to overcome some of the limitations of OI schemes such as SAM1v2 in anisotropic and non separable regions of the world (De Mey and Benkiran, 2002). Unlike the original SEEK filter, the CET03 scheme doesn’t evolve the error statistics according to the model dynamics. The background error covariance matrix P is specified using the dominant three-dimensional and multivariate EOFs of the free model variability. As in CET03, these EOFs can be calculated locally on a small 3D domain around each water column, so that an observation can only impact a user-defined influence zone around the observation point.
The essence of the scheme implemented in the physical component of the coupled model is based on these generic developments, with several adaptations (such as the vertical extrapolation algorithm) motivated by the coupling needs.
The vertical extrapolation scheme
Preliminary assimilation experiments in the coupled model using the CET03 scheme showed a strong increase of the vertical mixing of biogeochemical tracers in the surface layers. A detailed inspection of the simulation revealed hydrostatic instabilities in the analysed state (Berline 2006). The main origin of this problem lies in the very nature of the method: the filter cannot explicitly take into account non-linear physical constraints on the model state, e.g. the positiveness of the downward vertical density gradient. As a consequence, the analysed state can be anywhere in the linear reduced space of the SEEK filter. This difficulty is not restricted to our method: others studies with sequential method (Brankart et al., 2003) and variational assimilation method (Fujii et al., 2005) have reported the same problem. This fact has motivated the development of a new extrapolation method, hereinafter NEW, which avoids hydrostatic instabilities and allows a better control of the mixed layer. Moreover, corrections are switched off south of 10°N, where assimilation performance is poor for deep layers.
In this method, we only use the surface corrections of T/S fields and SSH estimated by the SEEK filter, and the velocity field correction. The extrapolation is divided in two stages, the mixed layer first, then the ocean interior. Throughout the mixed layer, the same temperature and salinity correction computed at the surface is applied. Below the mixed layer, the vertical extrapolation algorithm is adapted from the isopycnic analysis scheme developed by Brankart et al. (2003) in the context of the MICOM/HYCOM ocean circulation model (Berline 2006). It essentially results in a rearrangement of the water masses on the vertical, following the Cooper and Haines (1996) method.
Data sets
The data assimilated are the sea-surface temperature, the sea-surface height and the sea-surface salinity. SST data consist of composite AVHRR measurements gathered and processed within the NASA Pathfinder project, regridded at a 1/4° resolution available every ten days. SSH data consist of a combination of Topex-Poseidon and ERS altimeter along-track data regridded at a 1/4° resolution, and SSS data are derived from the Levitus monthly climatology. Six days is the length of the assimilation cycle, and is also the length of the time window used for the collection of the assimilated observations. This duration has proven to be adequate for the filter to be efficient in coupled mode.
Experimental design
To compare the coupled model behaviour with and without assimilation, annual simulations were performed. A schematic representation of the experiments is displayed on Figure 2. First a seven-year physical spin-up with climatological atmospheric forcing was realised. Then realistic forcing were applied from 1993 and integration continued until January 1st, 1999. On January 1st, 1997, the biology was inserted, and the coupled model was integrated for two years until January 1st, 1999. Initial conditions for phosphate are taken from the Conkright et al. (1998) climatology. Phytoplankton, zooplankton POC and DOC compartments were set constant in the first 143 m, and null below. Initial values are 0.25 for P, 0.0625 for Z, and 0.04 10-6 mol C .l-1 for POC and DOC.
Mercator Ocean Quarterly Newsletter
#20 – january 2006 – Page 15
A challenge for the physical-biogeochemical coupling in MERCATOR
Figure 2 Schematic representation of the experiments. Physical simulations (thin solid line), biogeochemical simulations (thick solid line), and simulations with assimilation (dashed line). The vertical arrows indicate the origin of the initial conditions for physics (08/96)
and biogeochemical tracers (01/01/98). The analysed period covers the year 1998.
After one year on January 1st, 1998, biology is already spun-up, and the year 1998 can be exploited. This experiment is our reference run, named FREE. The assimilated experiment was conducted in two stages. First, assimilation into the physical model was switched on in August, 1996 and the assimilated run continued until January 1st, 1997. During this assimilation spin-up period, the CET03 scheme was used, because it is better suited to correct the systematic biases observed in the free run than the NEW scheme which only rearranges the water masses. In the second period, the NEW assimilation scheme was used. Spun-up initial conditions for biology from the FREE experiment were inserted on January 1st, 1998. The coupled model with assimilation was integrated for one year until January, 1st 1999. This assimilated experiment is named CORR.
In term of RMS errors with respect to the assimilated variables, the results are comparable to those of the CET03 method, except in summer where SST RMS errors are significantly larger (up to 50%, not shown). We then have two simulations for the year 1998, FREE and CORR, with identical atmospheric forcing. Physical initial conditions are different, but initial biogeochemical conditions are the same. For the FREE simulation, the physical trajectory is continuous. For the CORR simulation, the trajectory is iteratively corrected using SSH, SST and SSS.
Impact of the data assimilation
Mixed layer depth and surface eddy kinetic energy
Theory and observations agree that a realistic seasonal cycle of the mixed layer depth (MLD) is essential for the simulation of biological production. Indeed, the MLD maximum, usually reached in late winter determines the annual nutrient reloading of the euphotic zone. Here, (Figure 3a) we have computed the mixed layer depth maximum as the actual maximum of the 61 model dumps, in order to capture the deepest mixing event of the year. The criterion used to define the mixed layer depth is a 0.2°C deviation from the surface temperature.
Mercator Ocean Quarterly Newsletter
#20 – january 2006 – Page 16
A challenge for the physical-biogeochemical coupling in MERCATOR
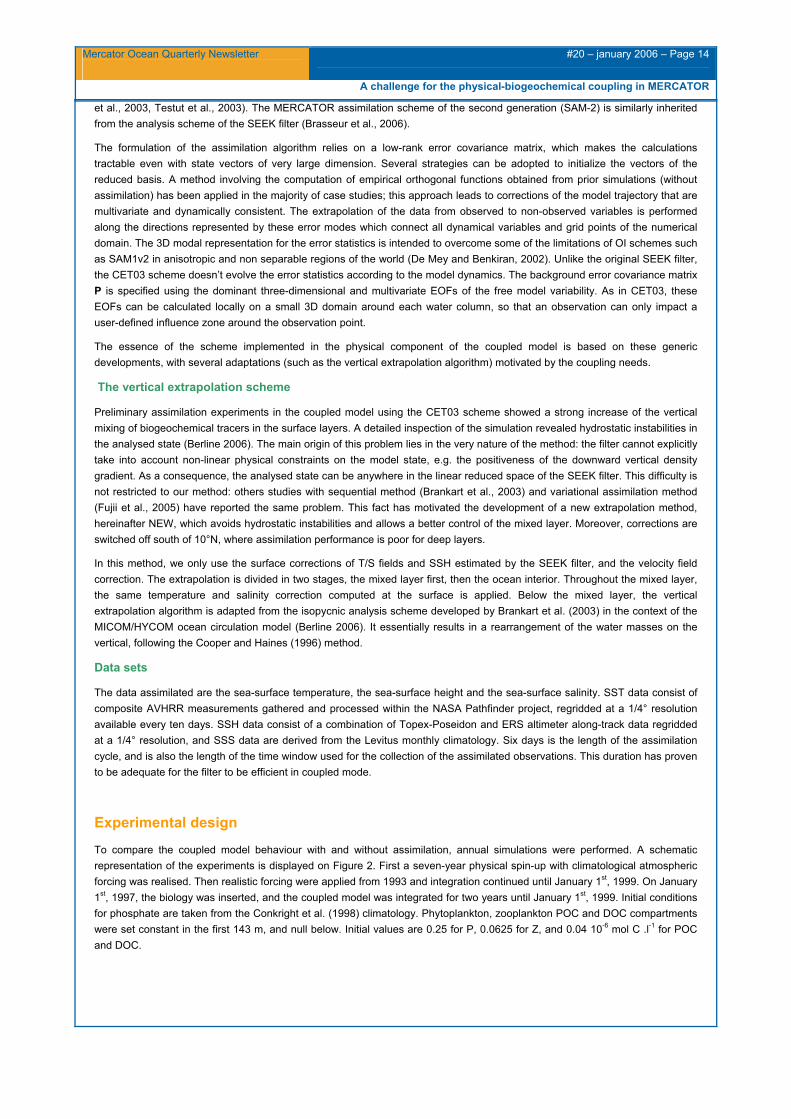
Figure 3a Mixed layer depth maximum for the FREE simulation (top),
the CORR simulation (middle) and the observations from De Boyer Montegut et al. (2004) at 2° resolution (bottom). The
mixed layer depth is defined by a temperature criterion ∆T = 0.2°C. The contour corresponding to MLD=200m for run
FREE is drawn on each plate. Units are meters.
Figure 3b Annual eddy kinetic energy computed at the depth of 55 m for the FREE simulation (top) and the CORR simulation (middle) and computed from altimetric observations for the 1993-2000
period from Ducet et al. (2000) (bottom). Units are cm2.s-2
For latitudes North of 50°N, the MLD picture is similar for the FREE and CORR simulations. Nevertheless very deep MLDs resulting from convection are reduced in the Irminger Sea, and extended in the Labrador Sea. In the FREE simulation the Gulf Stream position is too north, so the north-eastward extension of the 200m mixed layer depth contour line is due to the warm waters brought by the current along the American coast. This point is corrected by assimilation. For mid-latitudes (30°-50°N), the abrupt front which crosses the whole basin is weakened and displaced northward. North of this front, CORR MLDs tend to be shallower in the eastern part of the subtropical gyre. On the contrary, in the western part of the basin, MLDs are not changed, or even increased. The deepened zone centered on 30°N, 40°W is identified as an artefact of the assimilation method, and can not be physically interpreted.
Mixed layer depth estimations computed from observations with the same criterion are available from De Boyer Montegut et al. (2004). Comparison with these observations, and other data such as climatology shows that mixed layer depths are generally overestimated in the two simulations by 100 m in mid-latitudes to 500 m and more at high latitudes. However, East of 45°W assimilation improves the results by reducing the depths from 400 m to 200 m. Near the American coast, South of 35°N, the overestimation of the mixed layer depths may be due to the drift of the T/S properties associated with the poor representation of the Gulf Stream (observed in the FREE simulation), or to the atmospheric forcing. Our assimilation of surface-only data does not appear to be appropriate to correct this systematic error.
Assimilated SSH is computed as the sum of a mean SSH (MSSH) and a sea level anomaly (SLA), available from space. Therefore SSH observations contain information about the mean surface currents and about their variance, and SSH data assimilation is able to correct the mean circulation and also the EKE. The location and magnitude of mean surface currents (not shown) are well represented in the assimilated solution. Figure 3b shows the EKE calculated from simulations and observations. Distribution and magnitude of the EKE in the Gulf Stream, along the North Atlantic Drift and the Azores current are clearly improved by assimilation, but still underestimated. For instance along the Gulf Stream path, simulated maximum values reach only 2000 cm2.s-2 while observations exceed 3000 cm2.s-2. This underestimation is partly explained by the model eddy-permitting resolution, which is unable to resolve the whole spatial variability spectrum contained in the observation.
Nutrient input in the euphotic zone
Phytoplankton growth is mainly limited by light and nutrients. In the euphotic layer, the growth consumes "regenerated" nutrients (made available from remineralisation of already formed organic matter) and "new" nutrients, brought by the circulation from
Mercator Ocean Quarterly Newsletter
#20 – january 2006 – Page 17
A challenge for the physical-biogeochemical coupling in MERCATOR
inorganic sources, e.g. the ocean interior. Therefore the physical nutrient supply in the euphotic zone is a measure of the impact of the physical mechanisms on the primary production. These mechanisms are mainly linked to mixing and advection processes. Assimilation acts on the two processes, by correcting the stratification and the currents.
The maximum depth of the euphotic zone (Ze=143 m) is chosen to compute the nutrient input over the whole basin. The inputs are cumulated over the year 1998 and expressed in mol C .m-2.yr-1. The total input is divided into three components: the vertical diffusive input Qzdif, the vertical advective input Qzadv, and the horizontal advective input Qhadv. The three contributions are computed as follows:
dtzCK
zQ
Tzzdif ∫
∂∂
∂∂
=
0
dzdtCKCuQ
T Zehhhhadv ∫ ∫
∇+⋅∇−=
0 0
4)(
dtCwQzadvT
Ze)(
0∫=
where C is the nutrient concentration, T is equal to one year and Ze equal to 143m.
In the present model, the vertical advective input and hence primary production are greatly overestimated in the equatorial region, so the biogeochemical solution cannot be interpreted south of 15°N. Except this particular problem, the overall distribution of input in the FREE simulation is similar to the results reported by Oschlies (2002c).
Input from vertical mixing
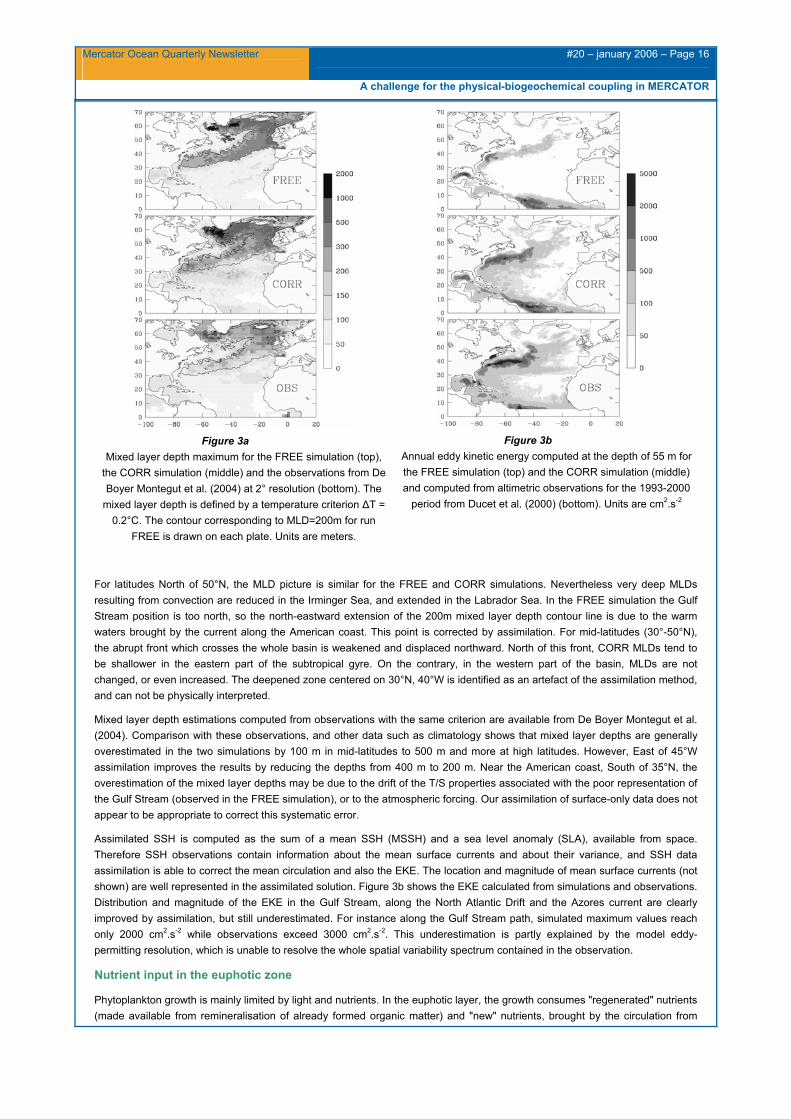
Not surprisingly, the pattern of Qzdif (Figure 4) resembles the pattern of the mixed layer depth maximum for the two simulations. Two different regimes coexist in the North Atlantic in two different areas. The "convective" regime takes place in the Westerlies region and in the high latitudes area, except a region at the North-East of Newfoundland. In these regions, diffusive inputs are superior to 1 mol C .m-2.yr-1 and reach 8 mol C .m-2.yr-1 (equivalent to 1 mol NO3 .m-2.yr-1) near the American coast. Everywhere else, the "diapycnal diffusion" regime exhibits inputs inferior 1 mol C .m-2.yr-1.
Figure 4 Annual nutrient supply by vertical diffusion (Qzdif), calculated at 143 m depth, for the FREE simulation (top) and the CORR
simulation (bottom). The thick lines show the limits of the regions POL (50°N-65°N), MID (35°N-50°N) and TRO (15°N-35°N, 70°W-30°W). Units are mol C. m-2.yr-1.
Assimilation does not change this pattern drastically. In the CORR simulation, Qzdif is significantly reduced along the American coast, and in the Eastern part of the domain. Conversely, Qzdif increases in the Labrador and Irminger seas. In these regions, a comparison with the T/S climatology indicates that the stratification is underestimated, so this increase is probably overestimated. Moreover, the spatial extent of the convective regime is limited. The input spots located in the subtropical gyre centre are due to unrealistic mixing events associated with unbalanced corrections, but are negligible with respect to the total input.
Mercator Ocean Quarterly Newsletter
#20 – january 2006 – Page 18
A challenge for the physical-biogeochemical coupling in MERCATOR
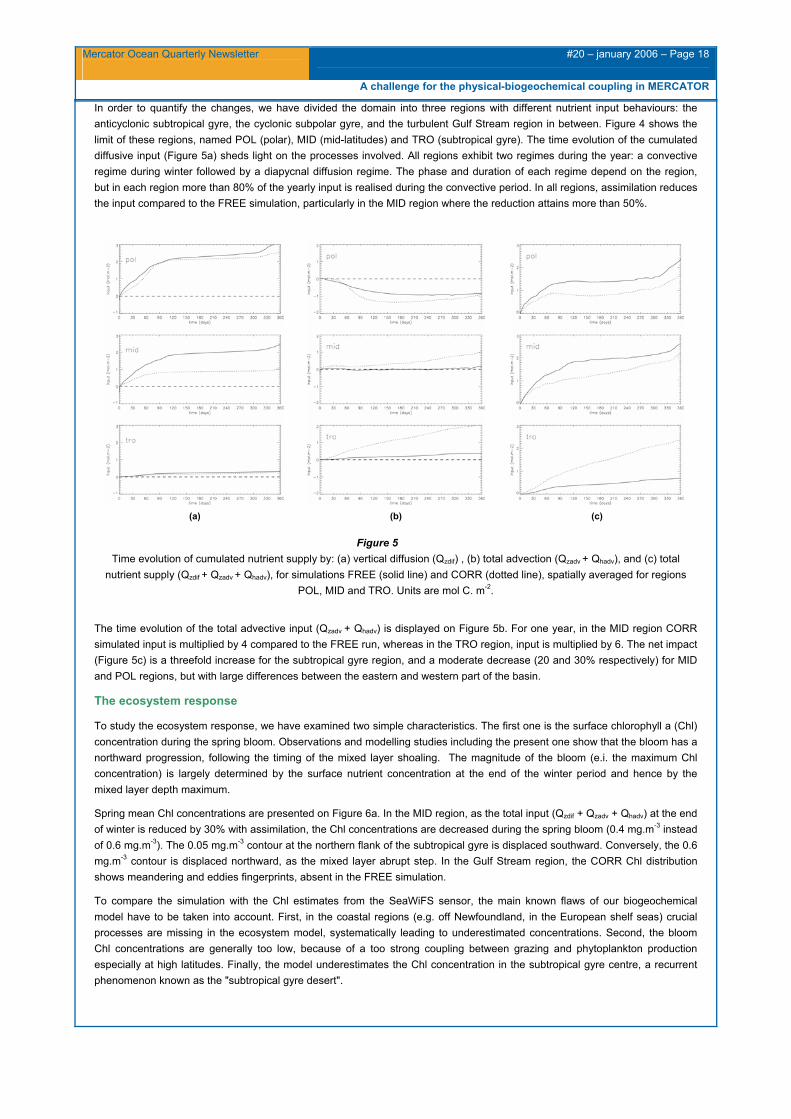
In order to quantify the changes, we have divided the domain into three regions with different nutrient input behaviours: the anticyclonic subtropical gyre, the cyclonic subpolar gyre, and the turbulent Gulf Stream region in between. Figure 4 shows the limit of these regions, named POL (polar), MID (mid-latitudes) and TRO (subtropical gyre). The time evolution of the cumulated diffusive input (Figure 5a) sheds light on the processes involved. All regions exhibit two regimes during the year: a convective regime during winter followed by a diapycnal diffusion regime. The phase and duration of each regime depend on the region, but in each region more than 80% of the yearly input is realised during the convective period. In all regions, assimilation reduces the input compared to the FREE simulation, particularly in the MID region where the reduction attains more than 50%.
(a)
(b)
(c)
Figure 5 Time evolution of cumulated nutrient supply by: (a) vertical diffusion (Qzdif) , (b) total advection (Qzadv + Qhadv), and (c) total
nutrient supply (Qzdif + Qzadv + Qhadv), for simulations FREE (solid line) and CORR (dotted line), spatially averaged for regions POL, MID and TRO. Units are mol C. m-2.
The time evolution of the total advective input (Qzadv + Qhadv) is displayed on Figure 5b. For one year, in the MID region CORR simulated input is multiplied by 4 compared to the FREE run, whereas in the TRO region, input is multiplied by 6. The net impact (Figure 5c) is a threefold increase for the subtropical gyre region, and a moderate decrease (20 and 30% respectively) for MID and POL regions, but with large differences between the eastern and western part of the basin.
The ecosystem response
To study the ecosystem response, we have examined two simple characteristics. The first one is the surface chlorophyll a (Chl) concentration during the spring bloom. Observations and modelling studies including the present one show that the bloom has a northward progression, following the timing of the mixed layer shoaling. The magnitude of the bloom (e.i. the maximum Chl concentration) is largely determined by the surface nutrient concentration at the end of the winter period and hence by the mixed layer depth maximum.
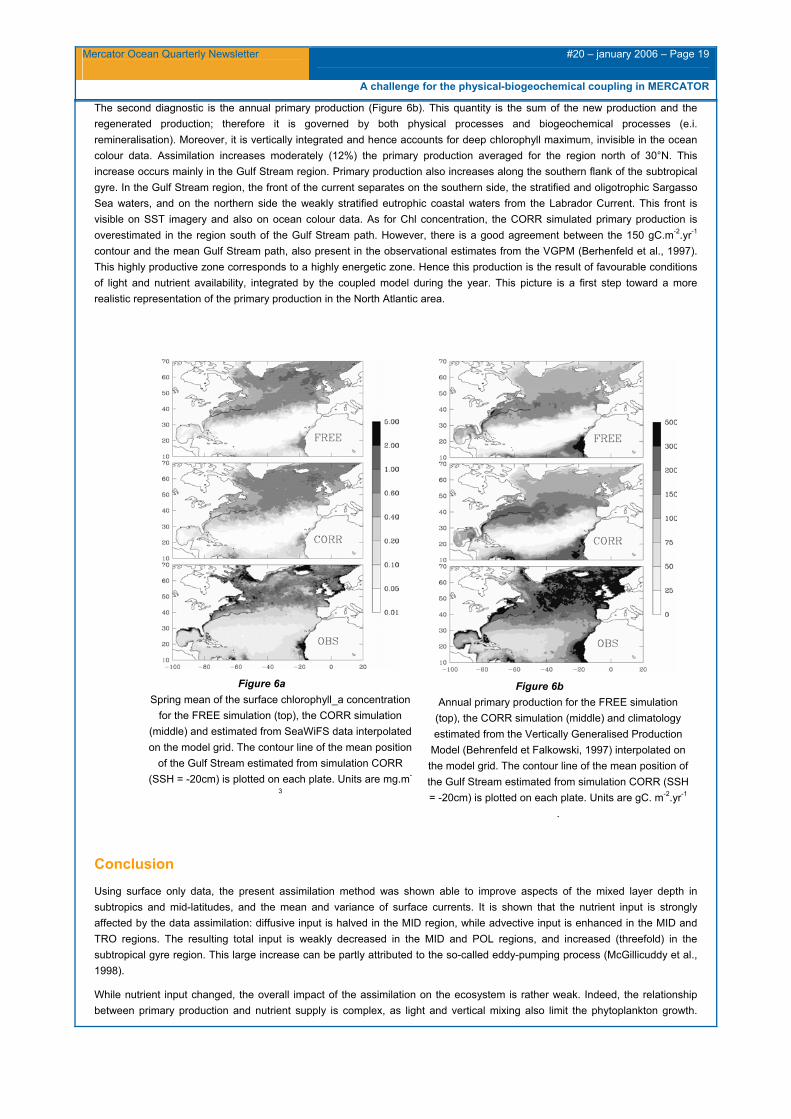
Spring mean Chl concentrations are presented on Figure 6a. In the MID region, as the total input (Qzdif + Qzadv + Qhadv) at the end of winter is reduced by 30% with assimilation, the Chl concentrations are decreased during the spring bloom (0.4 mg.m-3 instead of 0.6 mg.m-3). The 0.05 mg.m-3 contour at the northern flank of the subtropical gyre is displaced southward. Conversely, the 0.6 mg.m-3 contour is displaced northward, as the mixed layer abrupt step. In the Gulf Stream region, the CORR Chl distribution shows meandering and eddies fingerprints, absent in the FREE simulation.
To compare the simulation with the Chl estimates from the SeaWiFS sensor, the main known flaws of our biogeochemical model have to be taken into account. First, in the coastal regions (e.g. off Newfoundland, in the European shelf seas) crucial processes are missing in the ecosystem model, systematically leading to underestimated concentrations. Second, the bloom Chl concentrations are generally too low, because of a too strong coupling between grazing and phytoplankton production especially at high latitudes. Finally, the model underestimates the Chl concentration in the subtropical gyre centre, a recurrent phenomenon known as the "subtropical gyre desert".
Mercator Ocean Quarterly Newsletter
#20 – january 2006 – Page 19
A challenge for the physical-biogeochemical coupling in MERCATOR
The second diagnostic is the annual primary production (Figure 6b). This quantity is the sum of the new production and the regenerated production; therefore it is governed by both physical processes and biogeochemical processes (e.i. remineralisation). Moreover, it is vertically integrated and hence accounts for deep chlorophyll maximum, invisible in the ocean colour data. Assimilation increases moderately (12%) the primary production averaged for the region north of 30°N. This increase occurs mainly in the Gulf Stream region. Primary production also increases along the southern flank of the subtropical gyre. In the Gulf Stream region, the front of the current separates on the southern side, the stratified and oligotrophic Sargasso Sea waters, and on the northern side the weakly stratified eutrophic coastal waters from the Labrador Current. This front is visible on SST imagery and also on ocean colour data. As for Chl concentration, the CORR simulated primary production is overestimated in the region south of the Gulf Stream path. However, there is a good agreement between the 150 gC.m-2.yr-1 contour and the mean Gulf Stream path, also present in the observational estimates from the VGPM (Berhenfeld et al., 1997). This highly productive zone corresponds to a highly energetic zone. Hence this production is the result of favourable conditions of light and nutrient availability, integrated by the coupled model during the year. This picture is a first step toward a more realistic representation of the primary production in the North Atlantic area.
Figure 6a Spring mean of the surface chlorophyll_a concentration
for the FREE simulation (top), the CORR simulation (middle) and estimated from SeaWiFS data interpolated on the model grid. The contour line of the mean position
of the Gulf Stream estimated from simulation CORR (SSH = -20cm) is plotted on each plate. Units are mg.m-
3
Figure 6b Annual primary production for the FREE simulation
(top), the CORR simulation (middle) and climatology estimated from the Vertically Generalised Production
Model (Behrenfeld et Falkowski, 1997) interpolated on the model grid. The contour line of the mean position of the Gulf Stream estimated from simulation CORR (SSH = -20cm) is plotted on each plate. Units are gC. m-2.yr-1
.
Conclusion
Using surface only data, the present assimilation method was shown able to improve aspects of the mixed layer depth in subtropics and mid-latitudes, and the mean and variance of surface currents. It is shown that the nutrient input is strongly affected by the data assimilation: diffusive input is halved in the MID region, while advective input is enhanced in the MID and TRO regions. The resulting total input is weakly decreased in the MID and POL regions, and increased (threefold) in the subtropical gyre region. This large increase can be partly attributed to the so-called eddy-pumping process (McGillicuddy et al., 1998).
While nutrient input changed, the overall impact of the assimilation on the ecosystem is rather weak. Indeed, the relationship between primary production and nutrient supply is complex, as light and vertical mixing also limit the phytoplankton growth.
Mercator Ocean Quarterly Newsletter
#20 – january 2006 – Page 20
A challenge for the physical-biogeochemical coupling in MERCATOR
Maximum Chl concentrations are reduced because of the reduced winter input. Primary production is enhanced in mid-latitudes and along the circumference of the subtropical gyre. The highest increase occurs in the Gulf Stream region, leading to a better agreement with the observations.
These results suggest some directions for future work to be conducted in MERSEA. In order to better constrain the physical state and more specifically the mixed layer properties, the observation system will be improved by the inclusion of subsurface information (e.g. T/S profiles) and the assimilation system will be upgraded by considering a SEEK filter extended to the estimation of ocean-atmosphere fluxes, using an “augmented” state vector (Skachko et al., 2006). A new version of the OPA ocean model based on a free-surface formulation and a parameterization of surface fluxes based on bulk formula will be adopted to this aim. In order to improve the biological component, the biogeochemical model will be complicated using the LOBSTER model developed at LOCEAN. In a future stage, as for the physical component of the system, the development of a biogeochemical state estimation method will be envisaged in conjunction with the assimilation of ocean colour data. Hence, it will be possible to optimize the set of biological model parameters to meet the actual North Atlantic conditions.
References
Aumont, O. 1998. Etude du cycle naturel du carbone dans un modèle 3D de l'océan mondial. Ph.D. Thesis, Université Paris V1.
Aumont, O., Belviso, S., Monfray, P. 2002. Dimethylsulfoniopropionate (dmsp) and dimethylsulfide (dms) sea surface distributions simulated from a global 3-D ocean carbon cycle model. J. Geophys. Res., 107(C4), 148-227.
Behrenfeld, M. J. Falkowski, P. G. 1997. Photosynthetic rates derived from satellite-based chlorophyll concentration. Limnol. Oceanogr., 42(1), 1-20.
Berline L., 2006. Assimilation de données dans un modèle couplé physique-biogéochimie de l’Atlantique Nord, Ph.D. Thesis, Université Joseph Fourier - Grenoble I.
Brankart, J.-M., Testut, C.-E., Brasseur, P., Verron, J. 2003. Implementation of a multivariate data assimilation scheme for isopycnic coordinate ocean models: Application to a 1993-1996 hindcast of the North Atlantic Ocean circulation. J. Geophys. Res., 108 (C3), 3074, doi:10.1029/2001JC001198.
Brasseur, P., Ballabrera, J., Verron, J. 1999. Assimilation of altimetric data in the mid-latitude oceans using the SEEK filter with an eddy-resolving primitive equation model. J. Mar. Syst., 22, 269-294.
Brasseur P., F. Birol, N. Ferry, E. Rémy, C.-E. Testut, B. Tranchant, J.-M. Brankart, J. Verron, L. Bertino, P.-J. van Leuwen and J. Schröter, 2006 : Ocean Data Assimilation in the MERCATOR/MERSEA operational systems, Q. J. R. Met. Soc., in revision.
Conkright, M., O'Brien, T., Levitus, S., Boyer, T., Stephens, C., Antonov, J. 1998. World Ocean Atlas 1998 Vol. 10 : Nutrient and Chlorophyll of the Atlantic Ocean. , NOAA Atlas NESDIS 36, U.S. Government Printing Office, Washington, D.C.
Cooper, M. Haines, K. 1996. Altimetric assimilation with property conservation. J. Geophys. Res., 101, 1059-1077.
De Boyer Montégut, C., Madec, G., Fischer, A. S., Lazar, A., D., I. 2004. Mixed layer depth over the global ocean: an examination of profile data and a profile-based climatology, J. Geophys. Res., 109, C12003, doi:10.1029/2004JC002378.
De Mey P. and M. Benkiran, 2002. A multivariate reduced-order optimal interpolation method and its application to the Mediterranean basin-scale circulation. In: Ocean Forecasting: Conceptual basis and applications, N. Pinardi and J.D. Woods, Eds, Springer-Verlag, Belin, Heidelberg, New York, 472 pp.
Doney, S. C., 1999. Major challenges confronting marine biogeochemical modeling, Global Biogeochem. Cycles, 13(3), 705-714.
Doney, S. C., Lindsay, K., Caldeira, K., Campin, J.-M., Drange, H., Dutay, J.-C., Follows, M., Gao, Y., Gnanadesikan, A., Gruber, N., Ishida, A., Joos, F., Madec, G., Maier-Reimer, E., Marshall, J., Matear, R., Monfray, P., Mouchet, A., Najjar, R. 2004. Evaluating global ocean carbon models: the importance of realistic physics. Global Biogeochem. Cycles, 18. GB3017, doi:10.1029/2003GB002150.
Ducet, N., Le Traon, P., Reverdin, G. 2000. Global high-resolution mapping of ocean circulation from Topex/Poseidon and ERS-1 and -2. J. Geophys. Res., 105(C8), 19477-19498.
Fasham, M., Sarmiento, J., Slater, R.D., Ducklow, H.W., William, R. 1993. Ecosystem behaviour at Bermuda Station "S" and Ocean Weather Station "India": A general circulation model and observational analysis. Global Biogeochem. Cycles, 7, 379-416.
Mercator Ocean Quarterly Newsletter
#20 – january 2006 – Page 21
A challenge for the physical-biogeochemical coupling in MERCATOR
Fujii, Y., Ishizaki, S., Kamachi, M. 2005. Application of nonlinear constraints in a three-dimensional variational ocean analysis. J. Oceanogr., 61, 655-662.
Le Quéré, C., Aumont, O., Monfray, P., Orr, J. 2003. Propagation of climatic events on ocean stratification, marine biology, and CO2: Case studies over the 1979-1999 period. J. Geophys. Res., 108(C12), 148-227, 3375, doi:10.1029/2001JC000920.
Lévy, M., Mémery, L., Madec, G. 1998. The onset of a bloom after deep winter convection in the North Western Mediterranean Sea: mesoscale process study with a primitive equation model. J. Mar. Syst., 16, 7-21.
Lévy, M., Klein, P., Tréguier, A.-M. (2001). Impacts of sub-mesoscale physics on phytoplankton production and subduction, J. Mar. Res., 59, 535-565.
McGillicuddy, D., Robinson, A., Siegel, D., Jannasch, H., Johnson, R., Dickey, T., McNeil, J., Michaels, A., Knap., A. 1998. Influence of mesoscale eddies on new production in the Sargasso Sea. Nature, 394, 263-266.
McGillicuddy, D., Anderson, L., Doney, S. C., Maltrud, M. 2003. Eddy-driven sources and sinks of nutrients in the upper ocean : Results from a 0.1° resolution model of the North Atlantic. Global Biogeochem. Cycles, 17(2), 1035. doi:10.1029/2002GB001987
Oschlies, A. Garçon, V. 1998. Eddy enhancement of primary production in a model of the North Atlantic Ocean. Nature, 394, 266-269.
Oschlies, A. Garçon, V. 1999. An eddy-permitting coupled physical-biological model of the North Atlantic 1. Sensitivity to advection numerics and mixed layer physics. Global Biogeochem. Cycles, 13, 135-160.
Oschlies, A. 2002a. Can eddies make ocean deserts bloom ? Global Biogeochem. Cycles, 16, 53, 1-8.
Oschlies, A. 2002b. Improved representation of upper-ocean dynamics and mixed layer depths in a model of the North Atlantic on switching from eddy-permitting to eddy-resolving grid resolution. J. Phys. Oceanogr., 32, 2277-2298.
Oschlies, A. 2002c. Nutrient supply to the surface waters of the North Atlantic : A model study. J. Geophys. Res., 107, 14, 1-14.
Parent, L., Testut, C., Brankart, J., Verron, J., Brasseur, P., Gourdeau, L. 2003. Comparative assimilation of Topex/Poseidon and ERS altimeter data and of TAO temperature data in the Tropical Pacific Ocean during 1994-1998, and the mean sea-surface height issue. J. Mar. Syst., 40-41, 381-401.
Reynaud, T., LeGrand, P., Mercier, H., Barnier, B. 1998. A New Analysis of Hydrographic Data in the Atlantic and its Application to an Inverse Modelling Study. International WOCE Newsletter, 32, 29-31.
Pham, D., Verron, J., Roubaud, M. 1998. A Singular Evolutive Extended Kalman filter for data assimilation in oceanography. J. Mar. Syst., 16(3-4), 323-340.
Smolarkiewicz, P. K. L., C. T. 1986. The multidimensional positive definite advection transport algorithm: further developments and applications. Journal of Computational physics, 67, 396-438.
Skachko S., Brankart J.M., Brasseur P. and Verron J., 2006. Estimating the turbulent air-sea flux bulk parameters by sequential data assimilation. In preparation.
Spall, S. A. Richards, K. J. 2000. A numerical model of mesoscale frontal instabilities and plankton dynamics - 1. Model formulation and initial experiments. Deep Sea Res., part I, 47, 1261-1301.
Testut, C.-E., Brasseur, P., Brankart, J., Verron, J. 2003. Assimilation of sea-surface temperature and altimetric observations during 1992-1993 into an eddy permitting primitive equation model of the North Atlantic Ocean. J. Mar. Syst., 40-41, 291-316.
Mercator Ocean Quarterly Newsletter
#20 – january 2006 – Page 22
Coupled physical/biogeochemical modelling at mesoscale in the North Atlantic Ocean
Coupled physical/biogeochemical modelling at mesoscale in the North Atlantic Ocean: Rossby waves, a coupled process example By Guillaume Charria1, Isabelle Dadou1, Marie Drévillon2, Jérôme Llido3 and Véronique.Garçon1 Collaboration : Paolo Cipollini4. 1 LEGOS Toulouse, 2 Mercator-Océan Toulouse, 3 Institute for Marine and Atmospheric Research Utrecht (IMAU) The Netherlands, 4.National Oceanography Centre (NOCS) Southampton UK
Introduction
Even if the ocean represents less than 1% of the biomass associated to plants on Earth, it is responsible for about half of the net biosphere photosynthesis. This autotrophic biomass in the ocean is a major element for the climate regulation through processes as carbon dioxide absorption during photosynthesis. Thus, we have to correctly estimate this biomass as well as primary and export productions and processes which control it. This thematic represents the main topic of many international programs such as the IGBP program (International Geosphere – Biosphere program). Oceanic areas with elevated marine biomass represent also important fisheries regions. So the estimation of this biomass is an important scientific and economic challenge. To conduct this kind of process study, it is necessary to use conjointly numerical models and in situ satellite observations. The strong coupling between physics and biogeochemistry at mesoscale (eddies, fronts and especially Rossby waves which we are interested in) requires the use of a coupled physical/biogeochemical model at high resolution.
The aim of our project funded by the “Groupe Mission Mercator Coriolis” (GMMC) is to develop a coupled physical/biogeochemical model especially for the Rossby waves study and to use the ocean color data in order to validate and constrain this coupled model. In fact, recent studies, including those performed in our group (for example: Cipollini et al., 2001; Uz et al., 2001; Charria et al., 2003) have shown a Rossby waves signature (first baroclinic mode) on surface chlorophyll concentration estimated from ocean color data (SeaWiFS sensor). Its influence on export and primary production is unknown and remains to be studied. Also, an important challenge is to use the ocean color data to constrain 3D coupled physical/biogeochemical ocean models at mesoscale for a better understanding of the carbon ocean cycle.
Coupled physical/biogeochemical modelling
A MERCATOR MNATL configuration (model component of the mercator PSY1 prototype system) based on the OPA code (OPA 8.1, Madec et al., 1999), is used. In this configuration, we added several tracers for the coupled physical/biogeochemical studies. Concerning the physical model with a 1/3° resolution (MNATL) we used for our work, a restoring term to the Reynaud et al.’s (1998) climatology for temperature and salinity has been introduced in the Gulf of Cadix (Drillet et al., 2005). The interannual simulation has been initiated from the Reynaud et al.’s (1998) climatology. The chosen biogeochemical model is a simple model with 5 tracers (compartments): dissolved inorganic nitrogen (N), phytoplankton (P), zooplankton (Z), detritus (D), and dissolved organic nitrogen (DON) (Huret et al., 2005). These tracers are expressed in nitrogen currency (mmolN/m3). The biogeochemical model is initialized from the climatology of Conkright (1998) for N. For the biogeochemical tracers advection, the MUSCL (Monotonic Upstream centered Scheme for Conservation Laws) scheme has been used (Estubier and Levy, 2000). With this scheme, the errors of diffusion and dispersion, which result in unrealistic negative concentrations, are minimized. Numerical experiments of the coupled model made with the “Prototype System Mercator” (PSY1V1) based on the North Atlantic model MNATL and assimilating satellite data of Sea Level Anomalies (SLA) have shown unrealistic perturbations of state variables concentrations of the biogeochemical model due to the assimilation scheme used (lifting – lowering following Cooper and Haines, 1996). Thus, we used the coupled model without assimilation in the work presented in this paper. The physical model alone has been integrated through time since January 1st 1995. After one year of integration, the coupled model has been integrated for two spin-up years (1996-1997); the third year (1998) is analyzed. The model has been forced with the ECMWF daily ocean-atmosphere fluxes. A restoring for SST and SSS is done to the Reynolds’ analysis (Reynolds and Smith, 1994) and to Reynaud et al.’s (1998) climatology, respectively.
Mercator Ocean Quarterly Newsletter
#20 – january 2006 – Page 23
Coupled physical/biogeochemical modelling at mesoscale in the North Atlantic Ocean
Coupled model realism
The analyses of the coupled physical/biogeochemical simulations compared with the different in situ data set (WOCE1, AMT2, BATS3, EUMELI4) and satellite data (surface chlorophyll concentrations and estimated primary production with bio-optical models) show a good agreement with the data except some biases. First a northward shift of the Gulf Stream position and too diffusive vertical and horizontal gradients. These biases are reduced using models with higher resolution or using vertical sigma, isopycnal coordinates or partial step parameterization. Two other biases can be noticed: higher nutrients concentrations and surface chlorophyll concentrations as well as a southward shift of the northern border of the oligotrophic gyre. This bias is linked to a too strong remineralization in the biogeochemical model (Charria, 2005).
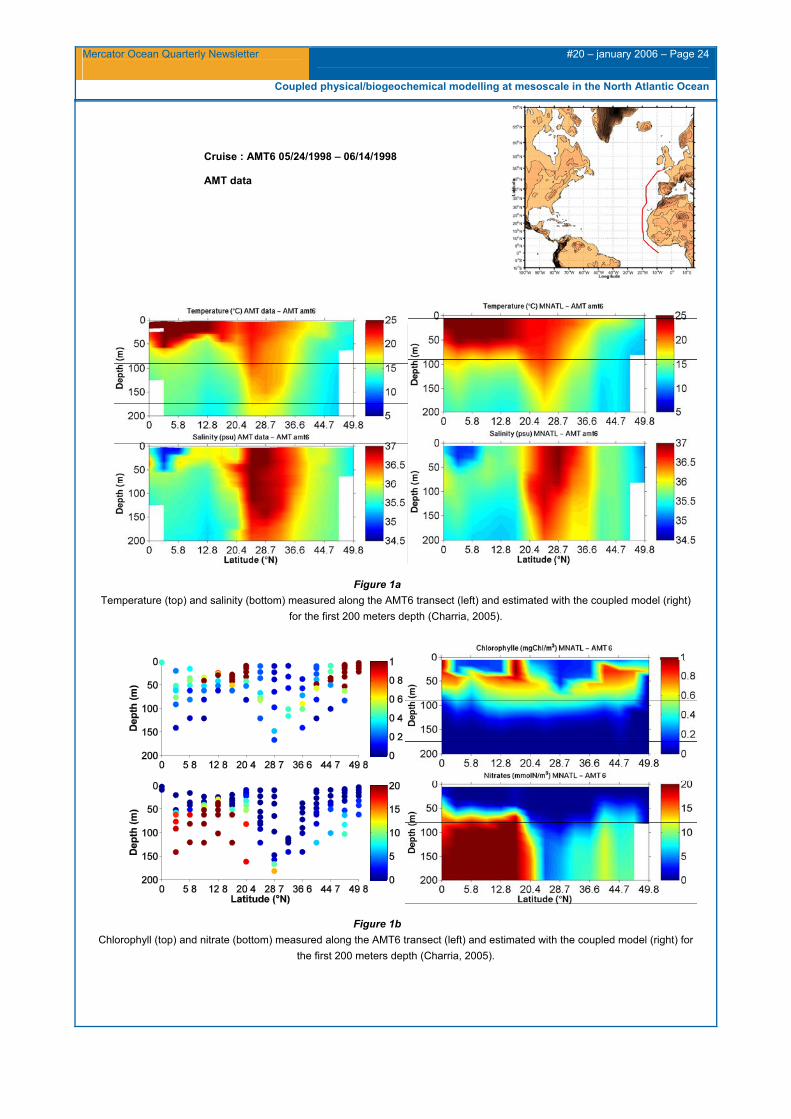
Along the AMT section (from May 24th 1998 to June 14th 1998) between 0°N and 50°N in the eastern part of the North Atlantic basin, the subtropical gyre waters are well represented in the coupled model compared with the observations, except an underestimation of the Mauritania upwelling and salinity concentrations (Figure 1a). At the equator, we can notice fresher waters associated with the Amazon River discharge waters. In fact, these waters are advected eastward by the North Equatorial Counter Current and mixed with the equatorial upwelling waters (Aiken and Bale, 2000). They are well reproduced in the simulated salinity fields. The modelled nitrate and chlorophyll features illustrate the previous mentioned biases with a northern border of the oligotrophic gyre, shifted southward compared with the observations, resulting in higher concentrations for example at 36.6°N (Figure 1b).
1 WOCE : World Ocean Circulation Experiment 2 AMT : Atlantic Meridional Transect 3 BATS : Bermuda Atlantic Time-series Study, site located at 31°40’N, 64°10’W 4 EUMELI : Eutrophic, MEsotrophic et oLIgotrophic JGOFS French Program (Joint Global Ocean Flux Study, oligotrophic site located at 21°N and 31°W
Mercator Ocean Quarterly Newsletter
#20 – january 2006 – Page 24
Coupled physical/biogeochemical modelling at mesoscale in the North Atlantic Ocean
Figure 1a Temperature (top) and salinity (bottom) measured along the AMT6 transect (left) and estimated with the coupled model (right)
for the first 200 meters depth (Charria, 2005).
Figure 1b Chlorophyll (top) and nitrate (bottom) measured along the AMT6 transect (left) and estimated with the coupled model (right) for
the first 200 meters depth (Charria, 2005).
Cruise : AMT6 05/24/1998 – 06/14/1998
AMT data
Mercator Ocean Quarterly Newsletter
#20 – january 2006 – Page 25
Coupled physical/biogeochemical modelling at mesoscale in the North Atlantic Ocean
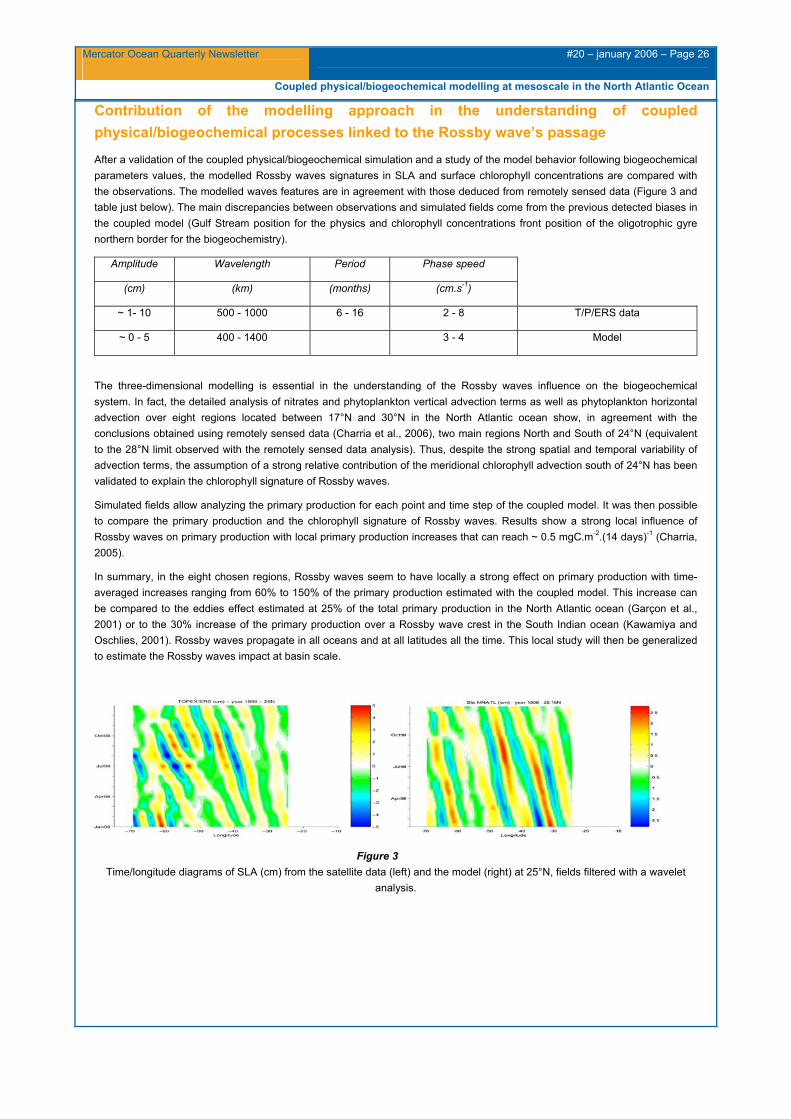
Sensitivity to biogeochemical model parameters values
Sensitivity analyse of surface concentrations to the biogeochemical model parameters values are performed over the pre-bloom, bloom and post-bloom periods (April – July) for the year 1998. Despite the low number of simulation runs, limited by the computed time needed, the obtained information shows a sensitivity of surface concentrations to the microbial loop and sedimentation parameters in the low production regions (NATR, see legend of Figure 2). A stronger sensitivity of the same concentrations to the parameters linked to the primary production and the zooplankton sources and sinks terms is observed in the high production regions (GFST and NADR, see legend of Figure 2). In the actual biogeochemical model, parameters have fixed values at basin scale. To improve performance of the model, this sensitivity study allows identifying a reduced set of parameters (10 out 15 parameters) that it should be possible to constrain using surface information such as ocean color data. This optimization will allow to better estimate remineralization parameters values and thus to better adjust the simulated chlorophyll and nitrates concentrations to the observed fields.
Figure 2 Mean modelled surface chlorophyll concentrations over the sensitivity analyses period (April-July 1998). Five Biogeochemical provinces have been considered (NATR: North Atlantic TRopical gyre Province; NASE and NASW: North Atlantic Subtropical gyral East and West provinces; GFST: GulF STream Province; NADR: North Atlantic DRift Province). For each region, the 5
columns represent the 5 biogeochemical model state variables. Each element of each column represents a sensitivity experiment which the associated variable reacts significantly. The different experiments of green, red, blue, white and orange colors represent parameter values perturbations linked to phytoplankton production, zooplankton grazing, microbial loop with
sedimentation, zooplankton and phytoplankton mortalities and zooplankton excretion, respectively in the biogeochemical model (Charria, 2005).
NASE
NATR
NADR
GFST
NASE
NASW
NATR
Primary Production Grazing Microbial L. and Sed. Z. and P. mortalities Z. Excretion
Sensitivity analyses
Mercator Ocean Quarterly Newsletter
#20 – january 2006 – Page 26
Coupled physical/biogeochemical modelling at mesoscale in the North Atlantic Ocean
Contribution of the modelling approach in the understanding of coupled physical/biogeochemical processes linked to the Rossby wave’s passage
After a validation of the coupled physical/biogeochemical simulation and a study of the model behavior following biogeochemical parameters values, the modelled Rossby waves signatures in SLA and surface chlorophyll concentrations are compared with the observations. The modelled waves features are in agreement with those deduced from remotely sensed data (Figure 3 and table just below). The main discrepancies between observations and simulated fields come from the previous detected biases in the coupled model (Gulf Stream position for the physics and chlorophyll concentrations front position of the oligotrophic gyre northern border for the biogeochemistry).
Amplitude Wavelength Period Phase speed
(cm) (km) (months) (cm.s-1)
~ 1- 10 500 - 1000 6 - 16 2 - 8 T/P/ERS data
~ 0 - 5 400 - 1400 3 - 4 Model
The three-dimensional modelling is essential in the understanding of the Rossby waves influence on the biogeochemical system. In fact, the detailed analysis of nitrates and phytoplankton vertical advection terms as well as phytoplankton horizontal advection over eight regions located between 17°N and 30°N in the North Atlantic ocean show, in agreement with the conclusions obtained using remotely sensed data (Charria et al., 2006), two main regions North and South of 24°N (equivalent to the 28°N limit observed with the remotely sensed data analysis). Thus, despite the strong spatial and temporal variability of advection terms, the assumption of a strong relative contribution of the meridional chlorophyll advection south of 24°N has been validated to explain the chlorophyll signature of Rossby waves.
Simulated fields allow analyzing the primary production for each point and time step of the coupled model. It was then possible to compare the primary production and the chlorophyll signature of Rossby waves. Results show a strong local influence of Rossby waves on primary production with local primary production increases that can reach ~ 0.5 mgC.m-2.(14 days)-1 (Charria, 2005).
In summary, in the eight chosen regions, Rossby waves seem to have locally a strong effect on primary production with time-averaged increases ranging from 60% to 150% of the primary production estimated with the coupled model. This increase can be compared to the eddies effect estimated at 25% of the total primary production in the North Atlantic ocean (Garçon et al., 2001) or to the 30% increase of the primary production over a Rossby wave crest in the South Indian ocean (Kawamiya and Oschlies, 2001). Rossby waves propagate in all oceans and at all latitudes all the time. This local study will then be generalized to estimate the Rossby waves impact at basin scale.
Figure 3 Time/longitude diagrams of SLA (cm) from the satellite data (left) and the model (right) at 25°N, fields filtered with a wavelet
analysis.
Mercator Ocean Quarterly Newsletter
#20 – january 2006 – Page 27
Coupled physical/biogeochemical modelling at mesoscale in the North Atlantic Ocean
References
Aiken, J. et A. J. Bale, 2000. An introduction to the Atlantic Meridional Transect (AMT) programme, Prog. In Oceanogr., 45, 251-256.
Charria, G., F. Mélin, I. Dadou, M.-H. Radenac et V. Garçon. 2003. Rossby wave and ocean colour: The cells uplifting hypothesis in the South Atlantic Subtropical Convergence Zone. Geophys. Res. Lett., 30(3), 1125, doi:10.1029/2002GL016390.
Charria, G., I. Dadou, P. Cipollini, M. Drévillon, P. De Mey, et V. Garçon, 2006. Understanding the influence of Rossby waves on surface chlorophyll concentrations in the North Atlantic ocean, sous presse à Journal of Marine Research.
Charria, 2005. Influence des ondes de Rossby sur le système biogéochimique de l’Océan Atlantique Nord : Utilisation des données couleur de l’eau et d’un modèle couplé physique/biogéochimie. Thèse de l’Université Paul Sabatier, Toulouse, 375 pp.
Cipollini, P., D. Cromwell, P. G. Challenor et S. Raffaglio. 2001. Rossby waves detected in global ocean colour data. Geophys. Res. Lett., 28(2), 323-326.
Conkright, M. E., T. O’Brien, S. Levitus, T. P. Boyer, J. I. Antonov et C. Stephens, 1998. World Ocean Atlas 1998: NOAA Atlas NESDIS 36.U.S. Gov. Printing Office, Wash., D.C., 245 pp.
Cooper, M. et K. Haines, 1996. Data assimilation with water property conservation, J. Geophys. Res, 101, 1059-1077.
Drévillon, M., 2004. Performance assessment of two MERCATOR North Atlantic oceanic prevision prototypes prior to coupling with a biogeochemical model, scientific internal report.
Drillet, Y., R. Bourdalle-Badie, L. Siefridt et C. Le Provost, 2005. Meddies in the Merctaor North Atlantic and Mediterranean sea eddy resolving model, J. Geophys. Res, 110, doi:10.1029/2003JC002170, c03016.
Estubier, A. et M. Lévy, 2000. Quel schéma numérique pour le transport d'organismes biologiques par la circulation océanique. Note Techniques du Pôle de modélisation, Institut Pierre-Simon Laplace, 81pp.
Garçon V., A. Oschlies, S. C. Doney, D. McGillicuddy et J. Waniek, 2001. The role of mesoscale variability on plankton dynamics in the North Atlantic, Deep-Sea Research, II, 48, 2199-2226.
Huret, M., I. Dadou, F. Dumas, P. Lazure, et V. Garçon, 2005. Modelling the biogeochemical activity on the Rio de la Plata estuary and shelf, and biogeochemical processes in the Rio de la Plata plume, Continental. Shelf Research., 25,69-653.
Kawamiya, M. et A. Oschlies. 2001. Formation of a basin-scale surface chlorophyll pattern by Rossby waves. Geophys. Res. Lett., 28(21), 4139-4142.
Madec, G., P. Delecluse, M. Imbard et C. Levy, 1999. OPA 8.1 Ocean General Circulation Model reference manual. Note du pole de modélisation, Institut Pierre-Simon Laplace (IPSL), France, 91pp.
Reynaud, T. P. Legrand, H. Mercier et B.Barnier, 1998. A new analysis of hydrographic data in the Atlantic and its application to an inverse modelling study, International WOCE Newsletters, 32.
Reynolds, R. W. et T. Smith, 1994. Improved global sea surface temperature analysis using optimum interpolation, J. of Climate, 7, 929-948.
Uz B. M., J. A. Yoder et V. Osychny. 2001. Pumping of nutrients to ocean surface waters by the action of propagating planetary waves. Nature, 409, 597-600.
.
Mercator Ocean Quarterly Newsletter
#20 – january 2006 – Page 28
Notebook
Notebook -
Editorial Board
Nathalie Verbrugge
Secretary
Monique Gasc
Articles
News : The marine biology, a challenge for operational oceanography
By Patrick Monfray with contribution of Abdelali El Moussaoui and the BionutsConsortium
Migratory and depth behavior of Bluefin tuna in the Gulf Stream area : how Mercator can help in revealing habitat use by pelagic species
By François Royer, Steve Wilson and Molly Lutcavage
A challenge for the physical-biogeochemical coupling in Mercator : improving the physics of coupled models through data assimilation
By Léo Berline, Jean-Michel Brankart, Pierre Brasseur, Yann Ourmières and Jacques Verron
Coupled physical/biogeochemical modelling at mesoscale in the North Atlantic Ocean : Rossby waves, a coupled process example
By Guillaume Charria, Isabelle Dadou, Marie Drévillon, Jérôme Llido and Véronique Garçon
Contact
Please send us your comments to the following e-mail address : [email protected]