The MERCATOR Quarterly newsletter No 6 - July 2002 - page 1 CNES CNRS/INSU IFREMER IRD METEO-FRANCE SHOM Characteristics of water masses: Re-analysis data compared with in-situ observations By Nathalie Verbrugge 1. Introduction Our study compares the PSY1-V1A001 re-analysis data, covering the period from 1993 to 1998 with, on the one hand, contemporary in-situ observations (ocean profiles) and on the other, temperature and salinity values from Reynaud climatology (Reynaud, 1998). We chose 3 oceanic regions for our study (cf. figure 1): the southern extension of the Gulf Stream (mooring 9), the Azores current (mooring 7) and the Gulf of Mexico (mooring 10). Figure 1: Three of the 22 high-frequency MERCATOR moorings (cf. http://www.mercator.com.fr/html/information/map/mnatl/mnatl_sorties_en.html#mouillages ). Editorial Contents Dear Mercatorians, Summer has come and its newsletter as well. This sixth MERCATOR quarterly has a lot of different items on the menu. The first article compares re-analysis data and in-situ observations. Then come the 'fresh' products: MERCATOR forecasts as support for the recent POSEIDON 284 campaign. Who, what, how... our quiz feature. MERCATOR forecasts and ocean yacht racing: how useful are they? So, adjust your deck chair and switch off your cell phone. It's time for a good read. Characteristics of water masses: Re - analysis data compared with in - situ observations 1. Introduction 2. Methodology: calculating a time series of in - situ observations co - located with the MERCATOR mooring point 3. What we can learn from observations 1. Poorly positioned or missing water masses 2. Mooring 10 (Gulf of Mexico): visualizing mesoscale structures Poseidon 284 campaign Quiz Volvo Race Meteorological situation during the leg Data on currents Competitors' tactical options Results of these options A comparison of analyses, forecasts and observations Conclusion Notebook
Transcript
The MERCATOR Quarterly newsletter
No 6 - July 2002 - page 1
CNESCNRS/INSU
IFREMERIRD
METEO-FRANCESHOM
Characteristics of water masses: Re-analysis data compared with in-situ observations
By Nathalie Verbrugge
1. Introduction
Our study compares the PSY1-V1A001 re-analysis data, covering the period from 1993 to 1998 with, on the one hand, contemporary in-situ observations (ocean profiles) and on the other, temperature and salinity values from Reynaud climatology (Reynaud, 1998). We chose 3 oceanic regions for our study (cf. figure 1): the southern extension of the Gulf Stream (mooring 9), the Azores current (mooring 7) and the Gulf of Mexico (mooring 10).
Figure 1: Three of the 22 high-frequency MERCATOR moorings
Summer has come and its newsletter as well. This sixth MERCATOR quarterly has a lot of different items on the menu. The first article compares re-analysis data and in-situ observations. Then come the 'fresh' products:
MERCATOR forecasts as support for the recent POSEIDON 284 campaign. Who, what, how... our quiz feature. MERCATOR forecasts and ocean yacht racing: how useful are they?
So, adjust your deck chair and switch off your cell phone. It's time for a good read.
Characteristics of water masses: Re-analysis data compared with in-situ observations
1. Introduction 2. Methodology: calculating a time series of
in-situ observations co-located with the MERCATOR mooring point
3. What we can learn from observations 1. Poorly positioned or missing water
masses 2. Mooring 10 (Gulf of Mexico):
visualizing mesoscale structures
Poseidon 284 campaign Quiz Volvo Race
Meteorological situation during the leg Data on currents Competitors' tactical options Results of these options A comparison of analyses, forecasts and observations Conclusion
Characteristics of water masses: Re-analysis data compared with in-situ observations (continued)
2. Methodology: calculating a time series of in-situ observations co-located with the MERCATOR mooring point
Figure 2: Errors for each of the 2 interpolation methods (flat in green and quadratic in yellow) at a depth of 100 metres for the 'Gulf of Mexico' (left) and 'North Madeira XBT' (right) moorings (asterisks). The curves represent the mean values for these errors at intervals of 25 km. The curves are then used to estimate the error for each pseudo-observation.
In the MERCATOR quarterly newsletter No. 4 we described the various in-situ observations and discussed the principle for selecting temperature profiles for the 22 high-frequency MERCATOR mooring points. For well-sampled regions, we now interpolate observations from the corresponding MERCATOR mooring point in order to reconstitute pseudo-observation time series comparable to that of the model. To do this we took observations from within a window of 7 or 21 days around each date t of the model (with 2 passes for the time series between 1993 and 1998). Then, if the data density was sufficient, we estimated the equation for a flat or quadratic surface which would minimize the difference from the observation data ("2D fit"): in other words the best fitting surface for the values observed. We did this calculation for each reference depth, from 10 to 700 metres (cf. Quarterly newsletter no. 4 - article 3). Once we had determined the equation for the drawing, we were able to estimate the value of the pseudo-observation at the MERCATOR mooring point in question. The series of these pseudo-observations (or pseudo-series) were still not as complete as the daily sampling of MERCATOR moorings, so we had to fill in the missing values with a linear interpolation to be able to compare the mooring data with the simulated series. This processing is only done when the time lapse between two pseudo-observations is no more than 3 weeks to ensure that the interpolated values are at least partly representative of the meso-scale variability. Beyond this period, it is assumed that the error on the interpolated values is too great and
that the interpolation no longer represents 'the physical reality'. Interpolation method error: We've seen that for each date t for which the observation density is adequate (to below), we
estimate a pseudo-observation based on all of the available observations (j below). To estimate the interpolation error at each date, we again estimate the parameters for the drawing equation, this time using j-1 observations and then calculate the value of the estimation for the position of the observation withdrawn. The absolute value of the difference between the estimation and its known value gives us the error for this observation. This error is a function of the distance d, chosen as being the median distance between the observation withdrawn and the rest of the data sample. This operation is repeated for each of the d observations and d errors are thus obtained for each distance, dj. Finally, when an analysis has been made
for each date to, we are able to plot an error curve err
of the method as a function of the distance (cf. figure 2). Given the median distance do between the
observations selected for each date to and the mooring
point, we use the estimation err obtained above to calculate the corresponding error for each pseudo-observation. This calculation is done separately for the two methods used for calculating the fitting surface: flat or quadratic.
The MERCATOR Quarterly newsletter
No 6 - July 2002 - page 3
CNESCNRS/INSU
IFREMERIRD
METEO-FRANCESHOM
Characteristics of water masses: Re-analysis data compared with in-situ observations (continued)
3. What we can learn from observations
3.1. Poorly positioned or missing water masses
3.1.1. Mooring 9 (Bermuda Tide): what happened to the 18°C water mass?
To the south of the Gulf Stream current, we can see a water mass located at a depth of about 350 metres and characterised by a temperature of around 18° C (cf. figure 3 - blue curve). This water comes from beyond the Gulf Stream where it forms during intense winter cooling before being transported to the Bermuda region by the Gulf Stream current and its recirculation. A comparison of observed and simulated climatology profiles of the temperature field indicate that this water mass is not represented in the PSY1-v1 re-analysis (cf. figure 3). This is probably because the position of the Gulf Stream in the re-analysis, too far to the north, significantly modifies the formation of this water mass: we can see a strong positive temperature bias in the region of the Gulf Stream which may partly 'block' the winter cooling process.
In addition, analysis of the time series between 200 and 500 metres in the model indicates a negative temperature drift. After a shock due to starting the assimilation at the beginning of 1993, the re-analysis cools by about 1°C over 5 years (cf. figure 4a). This drift, at a depth of 350 metres, does not match the observations, which are, moreover, consistent with the climatology. This mooring is thus an excellent validation criterion for the 18°C modal water. Note that this cooling is partly compensated for in the model by a decrease in salinity at the same depths (cf. figure 4b). Partly only, since we can also see that there is a positive drift of the density field (cf. figure 4c). The model is not in a state of 'equilibrium' and what we are seeing here is a long readjustment of the water masses.
Figure 3:
Climatology temperature profiles from the 1993-1998 re-analysis (mauve curve) and Reynaud climatology
(blue curve).
Figure 4a: Time series of simulated temperature at mooring point 9, 'Bermuda Tide' (smoothed at 30 days: unbroken green curve, raw: dotted red curve) for the 350-metre depth. The observations have also been plotted (blue circles). The size of the circles indicates how closely the observation matches the mooring data: The bigger the circle, the better the observation fits the model point and hence, a priori, the more relevant the observation.
The MERCATOR Quarterly newsletter
No 6 - July 2002 - page 4
CNESCNRS/INSU
IFREMERIRD
METEO-FRANCESHOM
Characteristics of water masses: Re-analysis data compared with in-situ observations (continued)
3.1.2. Mooring 7 (North Madeira XBT)
Mediterranean water In a region to the east of the Atlantic basin, we also find a very characteristic mass of subsurface water which is not correctly reproduced by the re-analysis: water coming from the Mediterranean Sea. This mass of water reaches the Atlantic basin through the straits of Gibraltar. Since it is denser than the surrounding Atlantic waters, it flows westward along the continental shelf before stabilising at a depth of about 1000 metres in the Gulf of Cadiz. It then becomes a distinct water mass characterised by a temperature of 11 to 12°C and salinity of 36.0 to 36.2 psu. Continuing westward, it mixes partially with Atlantic water masses but evolves slowly and can thus be identified by salinity and temperature maxima at a depth of between 800 and 1300 metres. (cf. figure 5 - blue curves).
The temperature and salinity climatology profiles from the A001 re-analysis for 1993 to 1998 do not reproduce these maxima (cf. figure 5 - mauve curves). A comparison with the profiles from Reynaud climatology show that the mean temperature and salinity fields for the model are faithfully reproduced for the first 200 to 300 metres. Below that, however, the characteristics of the water masses are different for the model and observation data, in particular for this Mediterranean water mass.
Figure 5 left/right: Climatology temperature/salinity profiles from the 1993-1998 re-analysis (mauve curve) and Reynaud climatology (blue curve) for Mooring no.7 'North Madeira XBT'.
Figure 4b: Time series of simulated salinity at mooring point 9, 'Bermuda Tide' (smoothed at 30 days: unbroken green curve, raw: dotted red curve) for the 350-metre depth.
Figure 4c: Same as for 4b, but for the density field.
The MERCATOR Quarterly newsletter
No 6 - July 2002 - page 5
CNESCNRS/INSU
IFREMERIRD
METEO-FRANCESHOM
Characteristics of water masses: Re-analysis data compared with in-situ observations (continued)
Temperature and salinity drifts The sampling for the region in the eastern part of the Azores current is particularly good. There are in fact more than 1000 measurement profiles available for the period between 1993 and 1998 and they are evenly distributed. We were thus able to reconstruct a convincing series of pseudo-observations, since the intrinsic errors of the calculation method were often less than 1°C (cf. the mean curve in figure 2). We can thus compare the temporal evolution of the simulated temperature with that of the pseudo-observations (cf. figure 6) between the surface and 700 metres in depth.
Figure 6: The left figure shows the times series for the temperature field in the A001 re-analysis (1993-1998) for the first 700 metres of the ocean at the MERCATOR mooring point, 'North Madeira XBT'. The right figure represents the pseudo temperature series calculated at the same MERCATOR mooring point. The 'blank spaces' indicate the places for which the error on the interpolated data is greater than 2°C. The interpolation was done when there were no more than 21 days between 2 consecutive points.
The first thing we can see is a negative drift in the model at a depth between 500 and 700 metres. At 700 metres, the water changed from 12.5°C in 1993 to 10.5° C in 1998. Unlike the 'Bermuda Tide' mooring, this improved the match with the observations. We are able to confirm that this drift in temperature (T) is also associated with a decrease in salinity (S) simulated between 1993 and 1998. It should be noted that the bias observed between the climatology profiles of the model and Reynaud climatology (cf. figure 5) is thus not representative of the end of the simulation period. It would appear that the balance between the forcing fields, the assimilation of sea level anomalies and relaxation to the climatology are only partially achieved after 6 years of re-analysis. We know, for instance, that assimilation affects the circulation in the basin by modifying the oceanic water masses quickly (adjustment of T/S profiles by the lifting-lowering method) and slowly (horizontal repositioning of T/S structures).
The improvement of the temperature field is particularly noticeable between 400 and 700 metres since the difference between the model and observation data changed from 2 to 3° C in 1993 to less than 0.5°C in 1998 (cf. figure 7). On the other hand, in 1998, the model remained too cold between the base of the mixing layer (<50 metres approximately) and the 400 metre depth. The seasonal cycle is also more evident in the simulation (warmer summer and colder winter on the surface). We can also confirm, moreover, that the model does not evolve satisfactorily at lower than 700 metres. This is because the drift in temperature affects the water masses to a depth of 1100-1200 metres in the region and this cooling means that it cannot be compared with the characteristics of the Mediterranean water mass (cf. figure 5).
Figure 7: Difference between the time series for the temperature field in the A001 re-analysis (1993-1998) at the 'North Madeira XBT' mooring point and the series of co-located pseudo-observations (the black contour in bold indicates the zero transition).
The MERCATOR Quarterly newsletter
No 6 - July 2002 - page 6
CNESCNRS/INSU
IFREMERIRD
METEO-FRANCESHOM
Characteristics of water masses: Re-analysis data compared with in-situ observations (continued)
3.2. Mooring 10 (Gulf of Mexico): visualizing mesoscale structures
Analysis of the temperature series re-analysed for the first 700 metres at the Gulf of Mexico mooring point (cf. figure 8a) reveals considerable seasonal variability up to the sub-surface layer, which is characteristic of the eddy structures observed in this region. It is not easy to compare this result with the observations selected around this mooring point between 1993 and 1998. This is because there are only 140 profiles available in our current data base, between the beginning of the period and June 1996 and none after this date. However, on condition that interpolation is done when the time lapse between two consecutive data measurements is no greater than 3 months (instead of 3 weeks), we are able to visualize part of the 1993 variability associated with these eddies which means that the structures simulated are fairly accurate (cf. figure 8b). As we mentioned, however, in paragraph 2 this significant time lapse of 3 months was not a good idea and we are probably losing a lot of the mesoscale variability, for instance between the beginning of July and the end of September 1993. We will not say anything more about this comparison because of the poor quality of the interpolated series of pseudo-observations.
On the other hand, it is interesting to see that the Reynaud climatology does not contain mesoscale structures (cf. figure 10). Indeed it would appear that most of the profile measurements in this region are taken in May and June. The climatology is thus not representative of this significant seasonal variability, which is visible up to the sub-surface level. A comparison of these measured and simulated profiles, however, reveals that the stratification is insufficient in the simulation: the model is warmer by about 3°C around 400 to 500 metres and cooler by 0.5°C in the first 50 metres. This lack of stratification is apparent throughout the simulation.
Figure 8a: Time series for the temperature field in the A001 re-analysis (1993-1994) for the first 700 metres of the ocean at the MERCATOR 'Gulf of Mexico' mooring point.
Figure 8b: Pseudo temperature series calculated for the first 700 metres of the ocean at the MERCATOR 'Gulf of Mexico' mooring point. The period in question covers the years 1993-1994. The 'blank spaces' indicate the places for which the error on the interpolated data is greater than 2°C. Linear interpolation is done when the time lapse between two consecutive data measurements is no greater than three months. The frames indicate the interpolated values between two data sets at intervals of more than 3 weeks and less than 3 months.
The MERCATOR Quarterly newsletter
No 6 - July 2002 - page 7
CNESCNRS/INSU
IFREMERIRD
METEO-FRANCESHOM
Characteristics of water masses: Re-analysis data compared with in-situ observations (continued)
Figure 10: Climatology temperature profiles from the 1993-1998 re-analysis (on the left) and Reynaud climatology (on the right) for Mooring no.10 'Gulf of Mexico'. The unbroken mauve curves represent the annual means and the dotted curves the monthly means.
To sum up: Some moorings are very well sampled and it is thus possible to reconstruct accurate pseudo-series of colocated observations. This gives a sharp analysis of a wide frequency range of processes (mesoscale, seasonal cycle, deep drift, etc.). It takes a long time for the analysis/forecast system to reach an equilibrium which means that the match with observations is not always improved (simultaneous temperature and salinity drifts). The 18°C modal water of the Bermuda Sea and Mediterranean water are not well represented in the PSY1-v1 re-analysis The mesoscale structures appear to be relevant for the Gulf of Mexico.
Figure 9: Time series of simulated temperature at mooring point 10, 'Gulf of Mexico' (smoothed at 30 days: unbroken green curve, raw: dotted red curve) for the 75-metre depth. The observations have also been plotted for the temperature field (blue circles). The size of the circles indicates how closely the observation matches the mooring data: The bigger the circle, the better the observation fits the model point and hence, a priori, the more relevant the observation.
The MERCATOR Quarterly newsletter
No 6 - July 2002 - page 8
CNESCNRS/INSU
IFREMERIRD
METEO-FRANCESHOM
Poseidon 284 campaign
The sea level map supplied by MERCATOR (figure 1) also shows a clear eddy structure around 26°0-25°N and a front around 20°N. The surface currents (figure 2) do not reveal any clear large structure. In the north, the current is oriented more towards the east (meanders of the Azores Current) while in the south it is oriented more towards the west (Northern Equatorial Current). There is also evidence of coastal currents (Canary Islands Current). There are many mesoscale structures, obviously with many north/south but also east/west exchanges. This is easier to guess from the surface salinity which undergoes more homogeneous atmospheric forcing for the region. AT 150m, the salinity structure reveals the regional circulation even more clearly: transport towards the east in the north, then towards the south-southwest from the Canary Islands towards the Cape Verde islands.
By Eric Greiner, in collaboration with Adreas Oschlies
The Poseidon 284 campaign took place in the northern part of the Cape Verde islands in March 2002. The campaign was led by Andreas Oschlies of the 'Nitrogen Group' at the IFM in Kiel (refer to http://www.ifm.uni-kiel.de) with Paul Kaehler as chief investigator. The aim of the campaign was to identify the nitrate supply routes for the oligotrophic subtropical gyre (including nitrogen fixing, the advection of dissolved organic nitrogen and the reinforced absorption of nitrate through double diffusion). It took place from 10.03.2002 to 22.03.2002, from 18°N to 31°N at 30°W, for fifty stations. MERCATOR was asked to supply forecasts for sea level, surface temperature, the depth of the mixing layer and surface currents, to help plan the stations. The reason is that it is more useful to make observations in a frontal region.
Figure 1: Sea level map during the Poseidon 284 campaign: MERCATOR re-analysis.
Figure 2: Map showing temperature and currents (left) and salinity (right) at 6m (top) and 150m (bottom): MERCATOR re-analysis.
MERCATOR has also provided vertical temperature and salinity cross-sections (figure 3). Soon after he returned from the campaign, Andreas Oschlies sent the in-situ observations which corresponded to MERCATOR forecasts. As a reference, the temperature and salinity climatology is also shown for the month of March.
Figure 3: vertical temperature (left) and salinity (right) cross-sections at 30° West during the Poseidon 284 campaign: observations (top), MERCATOR re-analysis (middle) and climatology (bottom).
The MERCATOR Quarterly newsletter No 6 - July 2002 - page 10
CNESCNRS/INSU
IFREMERIRD
METEO-FRANCESHOM
Poseidon 284 Campaign (continued)
Which are the noteworthy structures in this hydrographic cross-section (figure 4)? First there is a pocket of warm water in the south (marked A in the figure) A salinity maximum is associated with it at the sub-surface level. This can also be seen in the MERCATOR cross-sections.
Between 22°N and 23°N there is a hump in the thermocline and the halocline, located around 150m (marked B in the figure). MERCATOR does not reveal this very well but does however show a cyclonic structure a degree further to the east.
Between 25°N and 26°N we can see another hump in the thermocline. MERCATOR missed this. In fact between B and C, we can see a vein of warm, salty water, which is also identified by MERCATOR which does show two anticyclonic structures, one on either side of the Poseidon section (see the sea level map in figure 1), but without being able to connect them. The result is clearly visible on the salinity map at 150m: the vein of salty water is interrupted exactly at the longitude of the Poseidon section.
Around 29°N-31°N, we can see that the layers of the subtropical thermocline (between 18°C and 20°C) are exposed to the atmosphere (marked D in the figure). This is over-emphasized in MERCATOR.
Deeper down, around 21° S we can see a rising in the 15°C isotherm which corresponds to a cold current flowing towards the west. This can also be seen in the climatology and in MERCATOR. It is due to cold water from the African coasts which is descending towards the southwest. The route taken by this water is probably partly constrained by the extension of the Cape Verde shelf.
Figure 4: the noteworthy structures of the P284 cross-section.
We may conclude by saying that MERCATOR shows structures which are comparable with the observation but which are not always accurate (position not precise enough or insufficient intensity). This information may nevertheless be useful for describing the context of a campaign. Finally, we are again able to confirm that a hydrographic cross-section has much more detail than that of a model with 1/3° of spatial resolution.
The MERCATOR Quarterly newsletter No 6 - July 2002 - page 11
CNESCNRS/INSU
IFREMERIRD
METEO-FRANCESHOM
Quiz
This time you are not asked to guess 'what?' but 'when?'. When was this eddy ejected into the Mexican current? In April, May or June?
The answer is on the next page
The MERCATOR Quarterly newsletter No 6 - July 2002 - page 12
CNESCNRS/INSU
IFREMERIRD
METEO-FRANCESHOM
Quiz: Answer
At the beginning of April (on 3/4/2002) to please the fools. What is quite unusual here is how punctual Nature can be. Indeed, the same map in 2001 shows an eddy in almost the exact same place:
Sea level and temperature map at 300 m on 3/4/2002
Map of surface currents on 4-4-2001
However, more than the exact same date, the oil industry in this region wants to be able to forecast the maximum extension of the Mexico Current (Loop Current) before the separation of the eddy and the maximum speeds at the drilling rigs. Due to it being under-estimated, the biggest eddy in a thousand years ('Millennium Eddy') damaged pumping stations and shut them down for several weeks.
Note that there is a very strong correlation between sea level and temperature at 300m in the MERCATOR PSY1-v1 analyses and that it has shifted 30 degrees towards the right. On the other hand, there is less agreement between the surface currents, the sea level and the temperature at 300m for secondary eddy positions: the bathymetry, coastline and the Mississippi, are also significant.
The MERCATOR Quarterly newsletter No 6 - July 2002 - page 13
CNESCNRS/INSU
IFREMERIRD
METEO-FRANCESHOM
Volvo Race
by Marc Jourdain de Muizon and Eric Greiner in collaboration with Jean-Yves Bernot
The starting signal for the fifth leg of the Volvo race (Ex-Whitbread, around-the-world race with crews and several ports of call) was given on 9th March last. The eight competing yachts left Rio de Janeiro for Miami, which they reached between the 26th and 28th March. The first part of this long leg off the Brazilian coast offered crews the chance to apply their tactical skills in juggling with winds and currents. On this occasion, the sailor Jean-Yves Bernot, tactics expert on the Norwegian boat Djuice, contacted Mercator for forecasts of surface currents. This gave us the occasion to validate the various cut-off dates of Mercator in the shoreline zone and to study the effect of surface currents on an ocean yacht race.
Meteorological situation during the leg
At the time of departure from Rio (23°S) on Sunday 9th March, there was a 5-10 knot north easterly wind, which combined with thermal breeze effects to make an Easterly component during the day (Figure 1).
Figure 1:Map showing winds at departure from Rio on 9th March
During the trip up along the southeast coast of Brazil, the wind turned Easterly and became stronger ultimately becoming the southeast trade winds which the fleet encountered on the 14th March at a latitude of about 10°S. The very localized cumulus effect, added its influence to this general trend, an effect which is particularly strong in tropical zones: The rain clouds, coming from an evaporation/convection/condensation/precipitation cycle of warm, damp air, are characterized by a calm zone under the 'chimney' (evaporation zone) located behind the clouds and a zone of strong winds in front of them (cf. Figure 2). A boat can gain time in front of a cloud and lose even more behind it. It should be noted that sailors can partly predict the route clouds will take by analysing high-resolution satellite data for sea surface temperatures which they receive directly on board.
Figure 2: A zone of strong wind in front of a rain cloud and of weak wind behind it.
When nearing the equator, the wind system changes as boats enter the Inter Tropical Convergence Zone (ITCZ) located approximately between 5°S and 5°N. This zone is characterized by weak, variable winds, rain showers and storms: the Doldrums, or "Pot au noir" (Figure 3). The cloud effects here are predominant. Atmospheric forecasts are not very accurate for this region, including those of Mercator, due to these convective effects. The main problem for this leg is thus to choose where to cross through the Doldrums, covering as short a distance as possible while avoiding being trapped in a calm zone.
Once this zone has been left behind, the boats then run into the stable, north easterly Trade winds system.
The MERCATOR Quarterly newsletter No 6 - July 2002 - page 14
CNESCNRS/INSU
IFREMERIRD
METEO-FRANCESHOM
Volvo Race (continued)
Data on currents
Competitors' tactical options
Given this information on winds and currents, it seems to be a good idea, at least for the beginning of the race, to choose a route close to the coastline to take advantage of the wind, reinforced by the thermal breeze during the first few days, in order to avoid running full tilt against the southern Brazil current. Now only one competitor, (News Corporation, shown in red in figure 7) chose this option. All the others went out to sea and stayed together. This choice, which seems a surprising one, can be explained for two reasons:
The race began (Rio, 23°S) with the boats tacking against a north easterly wind, which was due to become easterly, hence to the right (cf. Figure 1). In this kind of situation, a good tactic consists in sailing way out to sea to be on the right of one's competitors. This means that when the wind turns to come from the right, the lateral difference in relation to the other competitors is transformed into a longitudinal advantage over one's competitors (cf. Figures 5 and 6).
In the first diagram (Figure 5), the two boats have taken different routes for tacking against the wind, they are moving at the same speed but with a lateral shift. In the second diagram (Figure 6), the wind has shifted 30 degrees towards the right. The initial lateral shift induces a longitudinal shift. The boat nearest the wind source now has an advantage.
An east-west current, the Southern Equatorial Current (SEC) crosses the Atlantic along the equator. This current divides into two branches off the northeast point of Brazil: The southern Brazil current (SBC) flowing southwards along the coast and the northern Brazil current (NBC) continuing towards the northwest.
From Recife (8°S), the northern Brazil current, which can reach up to 4 knots (2 m/s) carries sailors west north west along the coast (Figure 4).
Figure 4: Mercator re-analyses on 3rd April for the 13th March 2002
Figure 5
Figure 6
The MERCATOR Quarterly newsletter No 6 - July 2002 - page 15
CNESCNRS/INSU
IFREMERIRD
METEO-FRANCESHOM
Volvo Race (continued)
Another tactical reflex in this kind of situation is to monitor one's direct competitors by staying close to them, in other words by choosing to follow on their heels to avoid the risk of them being able to take advantage of better conditions and get away. On leaving Rio, Illbruck, which was the ranking leader overall, was not worried about News Corporation, which may explain why it did not try to follow it but rather to stick close to Amer Sports I, which was ranked second overall.
Figure 7: Positions of the fleet (12th March - 15th March). Re-analysis of 3rd April for the 13th March Figure 8: 27th February forecast for the 13th March
Results of these options
The option chosen by News Corporation was very profitable, especially during the first few days, but only up to 10°S, when the lack of wind close to the coast then penalized its route at about 10-11°S (5 knots of wind less than offshore). When it joined the same route taken by the rest of the fleet on 14th March around 11°S, News Corporation found itself in an intermediary position, between the stragglers and the leaders who had emerged during the first part of the race. Using the 14-day forecasts and Mercator re-analyses, it's interesting to measure the impact of the current on this boat's position in the fleet, since it was the only one to choose that route.
To do this, we can first calculate the gain in or loss of speed due to the current component parallel to the boat's trajectory (Table 1). We can refine the simulation by taking into account the component perpendicular to the trajectory which increases the distance covered by the boat. The variation in speed due to the current is deduced by means of a centred scheme (vector difference between the mean speed between two consecutive positions and the mean current interpolated around the median position of the boat between these two positions). To do this, we assumed, falsely, that the speed of the boat in relation to the water does not depend on its bearing. This hypothesis can become quite problematic when the current is strong and the wind weak.
The comparisons were based on the positions of Illbruck (leader of the pack which headed out to sea) and News Corporation (closer in to the coast) from 12th to 15th March (from 18° to 7°S), taking two positions per day. These two boats (single-hull, 60' [18 metre] boats, type VO 60) were designed by the same architect (Bruce Farr). Their pure performances are thus theoretically identical.
The MERCATOR Quarterly newsletter No 6 - July 2002 - page 16
CNESCNRS/INSU
IFREMERIRD
METEO-FRANCESHOM
Volvo Race (continued)
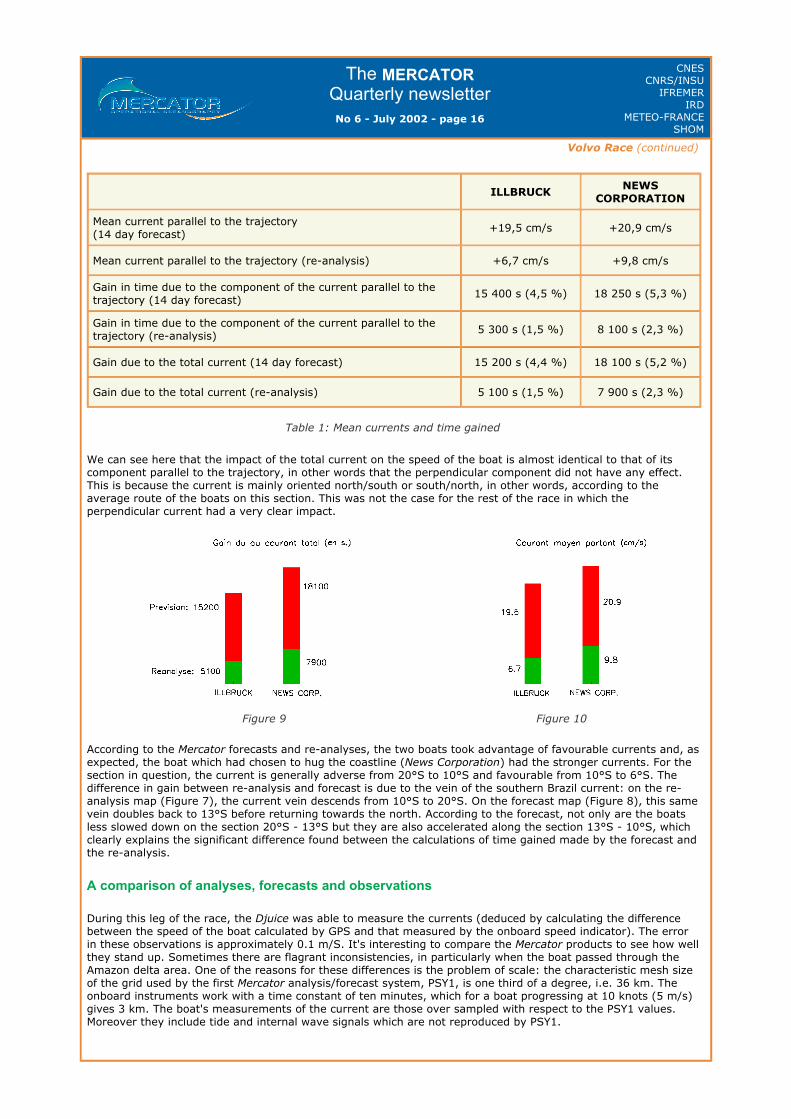
Table 1: Mean currents and time gained
We can see here that the impact of the total current on the speed of the boat is almost identical to that of its component parallel to the trajectory, in other words that the perpendicular component did not have any effect. This is because the current is mainly oriented north/south or south/north, in other words, according to the average route of the boats on this section. This was not the case for the rest of the race in which the perpendicular current had a very clear impact.
According to the Mercator forecasts and re-analyses, the two boats took advantage of favourable currents and, as expected, the boat which had chosen to hug the coastline (News Corporation) had the stronger currents. For the section in question, the current is generally adverse from 20°S to 10°S and favourable from 10°S to 6°S. The difference in gain between re-analysis and forecast is due to the vein of the southern Brazil current: on the re-analysis map (Figure 7), the current vein descends from 10°S to 20°S. On the forecast map (Figure 8), this same vein doubles back to 13°S before returning towards the north. According to the forecast, not only are the boats less slowed down on the section 20°S - 13°S but they are also accelerated along the section 13°S - 10°S, which clearly explains the significant difference found between the calculations of time gained made by the forecast and the re-analysis.
A comparison of analyses, forecasts and observations
During this leg of the race, the Djuice was able to measure the currents (deduced by calculating the difference between the speed of the boat calculated by GPS and that measured by the onboard speed indicator). The error in these observations is approximately 0.1 m/S. It's interesting to compare the Mercator products to see how well they stand up. Sometimes there are flagrant inconsistencies, in particularly when the boat passed through the Amazon delta area. One of the reasons for these differences is the problem of scale: the characteristic mesh size of the grid used by the first Mercator analysis/forecast system, PSY1, is one third of a degree, i.e. 36 km. The onboard instruments work with a time constant of ten minutes, which for a boat progressing at 10 knots (5 m/s) gives 3 km. The boat's measurements of the current are those over sampled with respect to the PSY1 values. Moreover they include tide and internal wave signals which are not reproduced by PSY1.
ILLBRUCK NEWS
CORPORATION
Mean current parallel to the trajectory (14 day forecast)
+19,5 cm/s +20,9 cm/s
Mean current parallel to the trajectory (re-analysis) +6,7 cm/s +9,8 cm/s
Gain in time due to the component of the current parallel to the trajectory (14 day forecast)
15 400 s (4,5 %) 18 250 s (5,3 %)
Gain in time due to the component of the current parallel to the trajectory (re-analysis)
5 300 s (1,5 %) 8 100 s (2,3 %)
Gain due to the total current (14 day forecast) 15 200 s (4,4 %) 18 100 s (5,2 %)
Gain due to the total current (re-analysis) 5 100 s (1,5 %) 7 900 s (2,3 %)
Figure 9
Figure 10
The MERCATOR Quarterly newsletter No 6 - July 2002 - page 17
CNESCNRS/INSU
IFREMERIRD
METEO-FRANCESHOM
Volvo Race (continued)
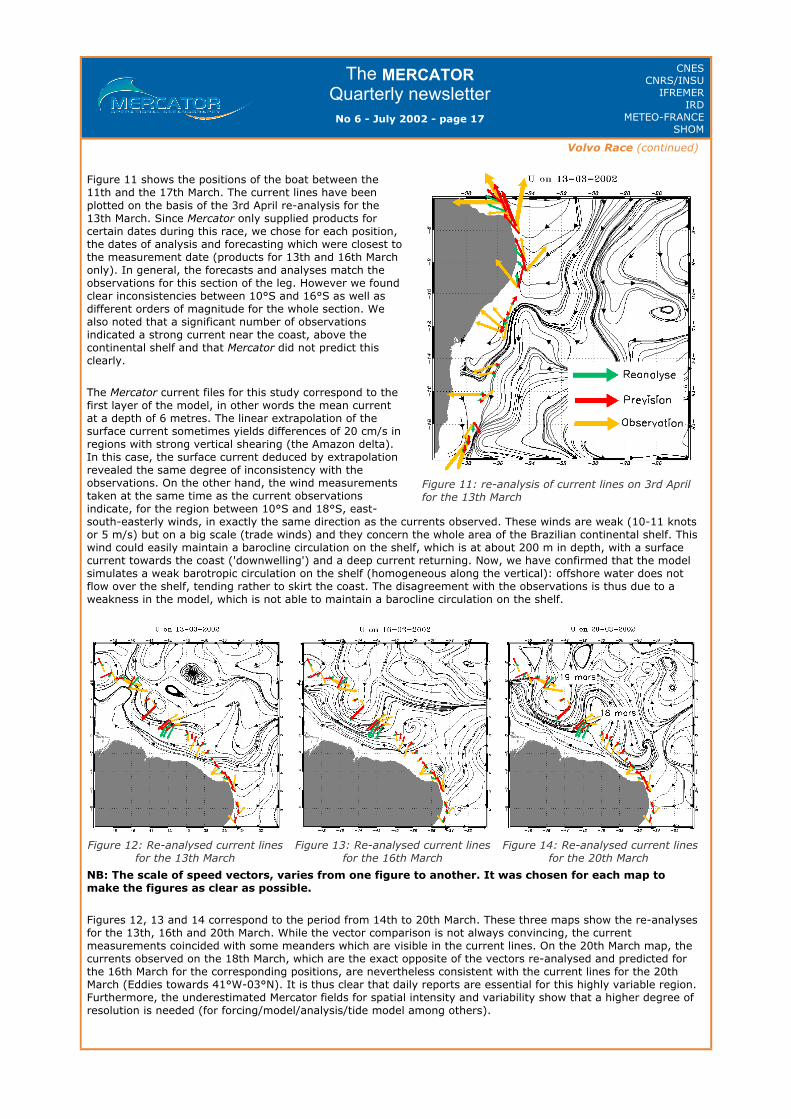
Figure 11 shows the positions of the boat between the 11th and the 17th March. The current lines have been plotted on the basis of the 3rd April re-analysis for the 13th March. Since Mercator only supplied products for certain dates during this race, we chose for each position, the dates of analysis and forecasting which were closest to the measurement date (products for 13th and 16th March only). In general, the forecasts and analyses match the observations for this section of the leg. However we found clear inconsistencies between 10°S and 16°S as well as different orders of magnitude for the whole section. We also noted that a significant number of observations indicated a strong current near the coast, above the continental shelf and that Mercator did not predict this clearly.
The Mercator current files for this study correspond to the first layer of the model, in other words the mean current at a depth of 6 metres. The linear extrapolation of the surface current sometimes yields differences of 20 cm/s in regions with strong vertical shearing (the Amazon delta). In this case, the surface current deduced by extrapolation revealed the same degree of inconsistency with the observations. On the other hand, the wind measurements taken at the same time as the current observations indicate, for the region between 10°S and 18°S, east-south-easterly winds, in exactly the same direction as the currents observed. These winds are weak (10-11 knots or 5 m/s) but on a big scale (trade winds) and they concern the whole area of the Brazilian continental shelf. This wind could easily maintain a barocline circulation on the shelf, which is at about 200 m in depth, with a surface current towards the coast ('downwelling') and a deep current returning. Now, we have confirmed that the model simulates a weak barotropic circulation on the shelf (homogeneous along the vertical): offshore water does not flow over the shelf, tending rather to skirt the coast. The disagreement with the observations is thus due to a weakness in the model, which is not able to maintain a barocline circulation on the shelf.
NB: The scale of speed vectors, varies from one figure to another. It was chosen for each map to make the figures as clear as possible.
Figures 12, 13 and 14 correspond to the period from 14th to 20th March. These three maps show the re-analyses for the 13th, 16th and 20th March. While the vector comparison is not always convincing, the current measurements coincided with some meanders which are visible in the current lines. On the 20th March map, the currents observed on the 18th March, which are the exact opposite of the vectors re-analysed and predicted for the 16th March for the corresponding positions, are nevertheless consistent with the current lines for the 20th March (Eddies towards 41°W-03°N). It is thus clear that daily reports are essential for this highly variable region. Furthermore, the underestimated Mercator fields for spatial intensity and variability show that a higher degree of resolution is needed (for forcing/model/analysis/tide model among others).
Figure 11: re-analysis of current lines on 3rd April for the 13th March
Figure 12: Re-analysed current lines for the 13th March
Figure 13: Re-analysed current lines for the 16th March
Figure 14: Re-analysed current lines for the 20th March
The MERCATOR Quarterly newsletter No 6 - July 2002 - page 18
CNESCNRS/INSU
IFREMERIRD
METEO-FRANCESHOM
Volvo Race (continued)
Figure 16 shows the positions of the boat between the 20th and the 23rd March. The current lines are from the re-analyses of the 10th April for the 21st March. A very fast current was observed around 18°N, which does not match the analyses at all. This observation was made near Barbuda island and this sudden acceleration in speed was probably due to the tide, a phenomenon which was not taken into account by PSY1. This does not mean that the comparisons with other positions well off the coast were good. For certain positions the current was weak and very variable and it was not possible to measure it. This was true in particular for 12°N and 13°N (the 3rd and 4th positions on the map). This strong variability in the zone complicated the analysis and forecasting which meant they were not very reliable.
Conclusion
For the fairly turbulent region of the Amazon delta, the PSY1 system describes current trends which can sometimes be detected by on-the-spot observations. However the analysis and forecasting frequency and the resolution of these products are such that they cannot yet be used for efficient ocean routing: forecasts of large-scale trends are not sufficient. On the other hand, surface currents have a significant effect on sea trajectory times (between 1 and 5%) for a race in which the times taken by two boats may be less than 0.1% on arrival (38 minutes between News Corporation and Amer Sports I for the leg which involved crossing the Atlantic!). The current parameter was not significant for this part of the leg near the coastline, for which the competitors were bunched together. While much still remains to be done to improve the quality of Mercator forecasts in coastline zones, it seems quite possible that they may become very useful for offshore races.
Figure 15: Re-analysed current lines for the 21st March Figure 16: Re-analysed current lines for the 21st March
The MERCATOR Quarterly newsletter No 6 - July 2002 - page 19
CNESCNRS/INSU
IFREMERIRD
METEO-FRANCESHOM
- Notebook -
Next issue: October 2002
The main feature in the next issue will be a case study of the Gulf of Guinea and the interaction between observations, analysis and forecasts.
Recommended reading
Mercator gets special coverage in:
"Jason now surveys the oceans from space". "La Météorologie", 8th series, No37, May 2002, journal of the French Meteorological Society.
OVIDE and MERCATOR: an example of interaction between an operational system and sea research. The OVIDE 2002 campaign (Observatoire de la Variabilité Inter-annuelle à DEcénale en Atlantique Nord -Observatory for inter-annual and decadal variability in the North Atlantic) ended on the 11th July 2002, after 30 days at sea on the N/O Thalassa. The main objective of OVIDE is to map once every 2 years (for a period of 10 years) a hydrographic and geochemical cross-section from Greenland to Portugal. This is needed in order to resolve the low frequency fluctuations of the meridian circulation cell, the heat transport towards Europe, the tracer transport) and the characteristics of water masses. OVIDE contributes to the international CLIVAR programme. This campaign launched 17 floating profilers as part of the ARGO project thus enriching the real-time observation network for the North Atlantic. The campaign used MERCATOR forecasts which were received on board once a week. Data and forecasts were compared in near real time and are available on the campaign Internet site at http://www.ifremer.fr/lpo/ovide/mercator.htm.
Contacts: Pascale Lherminier, Herlé Mercier.
Editors
Corinne Guiose Eric Greiner
Authors
Article 1: N. Verbrugge Article 2: Eric Greiner, in collaboration with Adreas Oschlies Article 3: Marc Jourdain de Muizon and Eric Greiner in collaboration with Jean-Yves Bernot
Acknowledgements
Our thanks to the authors who contributed to this newsletter:
- Nathalie Verbrugge - Andreas Oschlies - Marc Jourdain de Muizon - Jean-Yves Bernot
Address
Please send us your comments to the following e-mail address: