The MERCATOR Quarterly newsletter #5 - April 2002 - page 1 CNES CNRS/INSU IFREMER IRD METEO-FRANCE SHOM Implementation of the high-resolution MERCATOR model for the North Atlantic and Mediterranean regions by Laure Siefridt, Yann Drillet, Romain Bourdallé-Badie, Karine Béranger, Claude Talandier and Eric Greiner The PAM system, introduction The PAM system, experiments and validation Editorial Dear Mercatorians, The time has come to talk about the second MERCATOR prototype. 2002 marks a significant development with the commissioning of the PAM model for operational service. PAM (for Prototype Atlantique Méditerrannée) offers a description of the North Atlantic and Mediterranean regions with very high horizontal resolution. This issue of the newsletter describes how it is being implemented. In addition, since the winter is now over, we’ll be discussing winter convection with a comparison of winter 2000/2001 and winter 20001/2002. Naturally we have not forgotten our quiz, which has been slipped in between the two articles. Now that we’ve filled you in, sit back, put your feet up and have a good read! Contents Implementation of the high resolution MERCATOR model for the North Atlantic and Mediterranean regions The PAM system, introduction The PAM system, experiments and validation General circulation The Carribean and the Gulf of Mexico The Gulf Stream Circulation in the North; deep convection and ocean bottom waters The Northeastern Atlantic; Mediterranean waters and the Azores front Mediterranean circulation Conclusion References Quizz Winter convection: comparative test Introduction Labrador sea Irminger sea and Iceland sea Rockall - Faroe Conclusion Notebook The first MERCATOR analysis and forecasting prototype, PSY1-v1 has been providing near- real-time forecasts since January 2001. Its two-week forecasts, which assimilate analyses of recent past events, are available on Wednesday afternoons. The goal of this first stage was to demonstrate MERCATOR’s effectiveness for routine, near-real-time production. PSY1-v1 was already a very ambitious project. The new PSY2-v1 prototype will be using a no-nonsense numerical ocean model offering refined resolution (~6km) combined with high-quality ocean dynamics. It will thus be possible to reveal a new range of phenomena. As a prelude to real-time use, here is a glimpse of the model’s asymptotic behaviour (spin-up). The model, named Prototype Atlantique-Méditerranée (PAM), provides a description of the North Atlantic (from 9 to 70°N) and Mediterranean regions, with very high horizontal resolution (a rotated Mercator grid at 1/12° for the Atlantic and 1/16° for the Mediterranean, i.e. 5 to 7 km). The vertical resolution ranges from 6m on the surface to 200 m at the bottom of the Mediterranean and 300 m for the Atlantic. The model’s bathymetry comes from the Smith and Sandwell data base, 1997. It uses the OPA, 8.1 version, numerical code, yielding vertical Z coordinates, including a rigid lid assumption, a diagnostic ice condition and a turbulent kinetic energy mixing system with a 1.5 closure scheme. The PAM modelling project drew on both the expertise gained during the CLIPPER research project for high-resolution modelling of the Atlantic and several tools which were developed during this project (NATL code at 1/3°, DIAGOFF diagnostics software, etc).
Transcript
The MERCATOR Quarterly newsletter
#5 - April 2002 - page 1
CNESCNRS/INSU
IFREMERIRD
METEO-FRANCESHOM
Implementation of the high-resolution MERCATOR modelfor the North Atlantic and Mediterranean regions
by Laure Siefridt, Yann Drillet, Romain Bourdallé-Badie, Karine Béranger, Claude Talandier and Eric Greiner
The PAM system, introduction
The PAM system, experiments and validation
Editorial
Dear Mercatorians,
The time has come to talk about the second MERCATOR prototype.
2002 marks a significant development with the commissioning of the PAM model for operational service. PAM (for Prototype Atlantique Méditerrannée) offers a description of the North Atlantic and Mediterranean regions with very high horizontal resolution. This issue of the newsletter describes how it is being implemented.
In addition, since the winter is now over, we’ll be discussing winter convection with a comparison of winter 2000/2001 and winter 20001/2002.
Naturally we have not forgotten our quiz, which has been slipped in between the two articles.
Now that we’ve filled you in, sit back, put your feet up and have a good read!
Contents
Implementation of the high resolution MERCATOR model for the North Atlantic and Mediterranean regions
The PAM system, introduction The PAM system, experiments and validation General circulation The Carribean and the Gulf of Mexico The Gulf Stream Circulation in the North; deep convection and ocean bottom waters The Northeastern Atlantic; Mediterranean waters and the Azores front Mediterranean circulation Conclusion References
Quizz Winter convection: comparative test
Introduction Labrador sea Irminger sea and Iceland sea Rockall-Faroe Conclusion
Notebook
The first MERCATOR analysis and forecasting prototype, PSY1-v1 has been providing near- real-time forecasts since January 2001. Its two-week forecasts, which assimilate analyses of recent past events, are available on Wednesday afternoons. The goal of this first stage was to demonstrate MERCATOR’s effectiveness for routine, near-real-time production.
PSY1-v1 was already a very ambitious project. The new PSY2-v1 prototype will be using a no-nonsense numerical ocean model offering refined resolution (~6km) combined with high-quality ocean dynamics. It will thus be possible to reveal a new range of phenomena. As a prelude to real-time use, here is a glimpse of the model’s asymptotic behaviour (spin-up).
The model, named Prototype Atlantique-Méditerranée (PAM), provides a description of the North Atlantic (from 9 to 70°N) and Mediterranean regions, with very high horizontal resolution (a rotated Mercator grid at 1/12° for the Atlantic and 1/16° for the Mediterranean, i.e. 5 to 7 km). The vertical resolution ranges from 6m on the surface to 200 m at the bottom of the Mediterranean and 300 m for the Atlantic. The model’s bathymetry comes from the Smith and Sandwell data base, 1997.
It uses the OPA, 8.1 version, numerical code, yielding vertical Z coordinates, including a rigid lid assumption, a diagnostic ice condition and a turbulent kinetic energy mixing system with a 1.5 closure scheme. The PAM modelling project drew on both the expertise gained during the CLIPPER research project for high-resolution modelling of the Atlantic and several tools which were developed during this project (NATL code at 1/3°, DIAGOFF diagnostics software, etc).
Implementation of a high-resolution MERCATOR model for the North Atlantic and Mediterranean regions (continued)
General circulation
PAM-05 simulates spin-up, in other words the initial rotation of water masses. The experiment is initialised from a stable state using as input, temperature and salinity conditions taken from Reynaud climatology in the Atlantic, produced for the CLIPPER project, and taken from the MODB in the Mediterranean. The northern and southern boundaries of the domain are of the ‘buffer zone’ type, in other words the model’s temperature and salinity variables are tied to climatological, seasonal variables. A lateral free slip is imposed on land boundaries. Diffusion phenomena are parameterized by means of biharmonic operators whose coefficients are set to –9e9 and –3e9 m²/s² for the dynamics and tracers respectively. Atmospheric forcing is based on operational analyses from the European Centre for Medium-Range Weather Forecasts (ECMWF),
from March 1998 to February 1999.
The atmospheric forcing is applied as a daily constant, except for the wind which is linearly interpolated for each time step. A boundary limit of 40 W/m² is set for the surface at the weekly Reynolds temperature and for the climatological seasonal salinity value to compensate for possible forcing defects and to prevent too great an error occurring in the model.
This article contains a scientific analysis of the long spin-up of the PAM model (for a total period of 11 years). We compare this with simulations done using other model configurations (CLIPPER 1/6° ATL6-V4 and MNATL 1/3° with a southern boundary at 90 North and 20° South).
The general circulation obtained after a simulation of 8 years of (figure 1) is fairly realistic. A map of mean sea surface heights is used to reveal the various principal fronts and currents. We can see the subtropical Atlantic gyre made up of the northern equatorial current, along which tropical waters are heated while moving westward, of the Gulf Stream which carries warm water towards the North and East, of the Azores current which continues directly Eastward and the Canary Islands’ current which flows along the African coast towards the South. We can also see eddies forming in the Yucatan straits from the Carribean current and breaking off in the Gulf of Mexico. As for the subpolar gyre, it consists of the Gulf Stream and its north-western extension, of the Norway and Greenland currents and of the Irminger and Labrador currents, which bring very cold water to the boundary where the Gulf Stream separates from the coast.
Figure 2: Barotropic current function calculated during the eighth year of PAM-05 simulation. Position of sections mentioned in the article.
Figure 1: Mean height of sea surface (in m) calculated during the eight years of PAM-05 simulation.
The Gulf Stream transport at 55° West (145 Sverdrups towards the East through section 3) and the transport in the Straits of Gibraltar (0.9Sv) are fairly realistic. Some transports are too weak, as for the Florida current (25Sv instead of the 30 to 35 Sv observed) and for the subpolar gyre.
The underestimation of transport in the Florida straits is a problem shared by the CLIPPER range of experiments (1°, 1/3°, 1/6°), compounded by other perturbing factors such as the proximity of the buffer zone, the small extent of the domain along the Meridian and the specific forcing applied, which corresponds to a year of low convection and hence a weak thermohaline circulation.
The MERCATOR Quarterly newsletter
#5 - April 2002 - page 3
CNESCNRS/INSU
IFREMERIRD
METEO-FRANCESHOM
Implementation of a high-resolution MERCATOR model for the North Atlantic and Mediterranean regions (continued)
On a meridian section south of Greenland the mean transport for a simulation of ten years was evaluated at 30 Sv for the PAM05 simulation, 30Sv for the MNATL 1/3° simulation and 36Sv for the ATL6-V5 simulation. This could be due to the lager extension of the spatial domain.
The mixing layer (figure 3) shows fairly realistic values even though they are too deep in the convection zones, which is common for OPA code simulations. The convection is much too deep for the Labrador sea and the Irminger sea. Nevertheless, in 1998 there was little convection in these two regions of deep water formation, due to a much greater net heat flux during that winter. On the other hand, in the PAM spin-up simulation, the convection is established in two stages and it would appear that forcing by daily wind, which is particularly changeable and high in energy, overcomes the stabilising effect of heat flux. The combination of forcing and of the poor restratification during the summer had the effect of making the maximum value for the depth of the mixing layer deeper (figure 4), winter after winter.
As for the Mediterranean, some density profiles for the initialising climatology data were unstable and thus contributed to this over-estimated convection. The values reached in the Gulf of Lions correspond to observed maxima. Nevertheless these maxima have never been observed for several years in a row. The formation of deep water in the Gulf of Lions is thus abnormally intense. In the Eastern Mediterranean the depths are no more realistic. The problem has since been resolved by rigorous checking and adjusting of MODB climatological data (Beranger K, 2001).
Figure 3: Mean depth (m) of lixing layer from 25th to 29th March during the 9th year of PAM-05 simulation.
Figure 4: Maximum depth of the mixing layer in the North Atlantic during spin-up.
The MERCATOR Quarterly newsletter
#5 - April 2002 - page 4
CNESCNRS/INSU
IFREMERIRD
METEO-FRANCESHOM
Implementation of a high-resolution MERCATOR model for the North Atlantic and Mediterranean regions (continued)
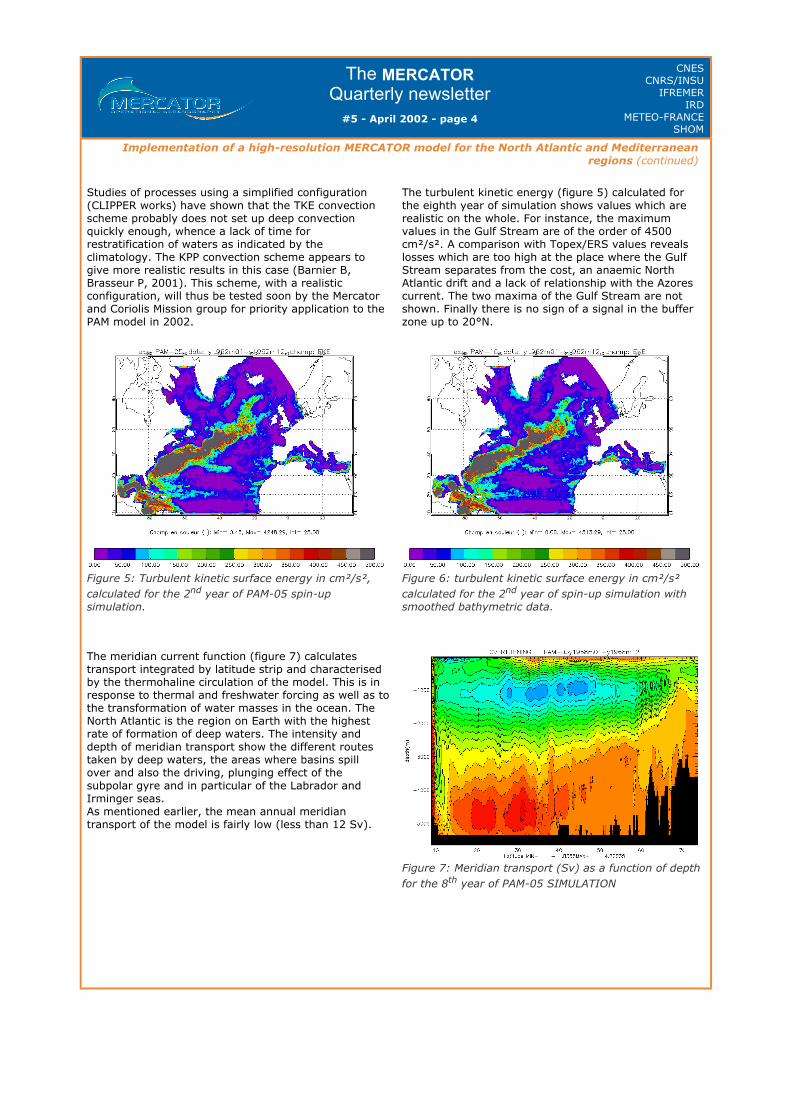
Studies of processes using a simplified configuration (CLIPPER works) have shown that the TKE convection scheme probably does not set up deep convection quickly enough, whence a lack of time for restratification of waters as indicated by the climatology. The KPP convection scheme appears to give more realistic results in this case (Barnier B, Brasseur P, 2001). This scheme, with a realistic configuration, will thus be tested soon by the Mercator and Coriolis Mission group for priority application to the PAM model in 2002.
The turbulent kinetic energy (figure 5) calculated for the eighth year of simulation shows values which are realistic on the whole. For instance, the maximum values in the Gulf Stream are of the order of 4500 cm²/s². A comparison with Topex/ERS values reveals losses which are too high at the place where the Gulf Stream separates from the cost, an anaemic North Atlantic drift and a lack of relationship with the Azores current. The two maxima of the Gulf Stream are not shown. Finally there is no sign of a signal in the buffer zone up to 20°N.
Figure 5: Turbulent kinetic surface energy in cm²/s², calculated for the 2nd year of PAM-05 spin-up simulation.
Figure 6: turbulent kinetic surface energy in cm²/s² calculated for the 2nd year of spin-up simulation with smoothed bathymetric data.
The meridian current function (figure 7) calculates transport integrated by latitude strip and characterised by the thermohaline circulation of the model. This is in response to thermal and freshwater forcing as well as to the transformation of water masses in the ocean. The North Atlantic is the region on Earth with the highest rate of formation of deep waters. The intensity and depth of meridian transport show the different routestaken by deep waters, the areas where basins spill over and also the driving, plunging effect of the subpolar gyre and in particular of the Labrador and Irminger seas. As mentioned earlier, the mean annual meridian transport of the model is fairly low (less than 12 Sv).
Figure 7: Meridian transport (Sv) as a function of depth for the 8th year of PAM-05 SIMULATION
The MERCATOR Quarterly newsletter
#5 - April 2002 - page 5
CNESCNRS/INSU
IFREMERIRD
METEO-FRANCESHOM
Implementation of a high-resolution MERCATOR model for the North Atlantic and Mediterranean regions (continued)
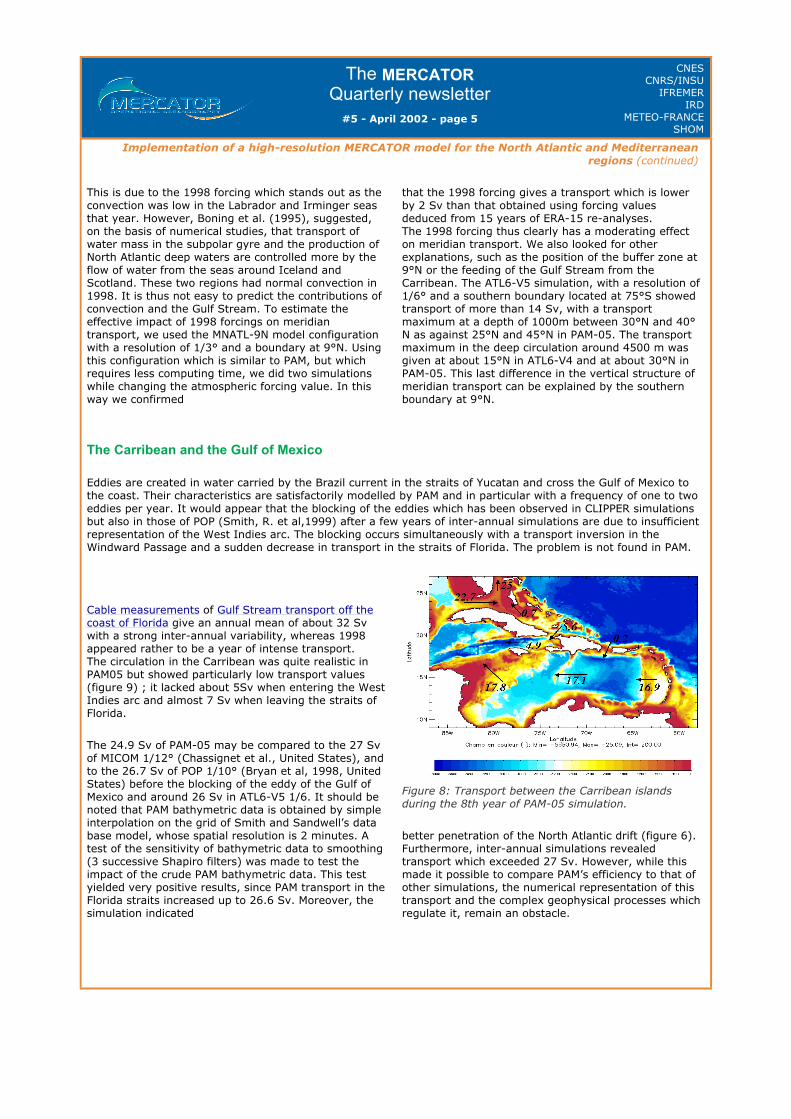
The Carribean and the Gulf of Mexico
Eddies are created in water carried by the Brazil current in the straits of Yucatan and cross the Gulf of Mexico to the coast. Their characteristics are satisfactorily modelled by PAM and in particular with a frequency of one to two eddies per year. It would appear that the blocking of the eddies which has been observed in CLIPPER simulations but also in those of POP (Smith, R. et al,1999) after a few years of inter-annual simulations are due to insufficient representation of the West Indies arc. The blocking occurs simultaneously with a transport inversion in the Windward Passage and a sudden decrease in transport in the straits of Florida. The problem is not found in PAM.
This is due to the 1998 forcing which stands out as the convection was low in the Labrador and Irminger seas that year. However, Boning et al. (1995), suggested, on the basis of numerical studies, that transport of water mass in the subpolar gyre and the production of North Atlantic deep waters are controlled more by the flow of water from the seas around Iceland and Scotland. These two regions had normal convection in 1998. It is thus not easy to predict the contributions of convection and the Gulf Stream. To estimate the effective impact of 1998 forcings on meridian transport, we used the MNATL-9N model configuration with a resolution of 1/3° and a boundary at 9°N. Using this configuration which is similar to PAM, but which requires less computing time, we did two simulations while changing the atmospheric forcing value. In this way we confirmed
that the 1998 forcing gives a transport which is lower by 2 Sv than that obtained using forcing values deduced from 15 years of ERA-15 re-analyses. The 1998 forcing thus clearly has a moderating effect on meridian transport. We also looked for other explanations, such as the position of the buffer zone at 9°N or the feeding of the Gulf Stream from the Carribean. The ATL6-V5 simulation, with a resolution of 1/6° and a southern boundary located at 75°S showed transport of more than 14 Sv, with a transport maximum at a depth of 1000m between 30°N and 40°N as against 25°N and 45°N in PAM-05. The transport maximum in the deep circulation around 4500 m was given at about 15°N in ATL6-V4 and at about 30°N in PAM-05. This last difference in the vertical structure of meridian transport can be explained by the southern boundary at 9°N.
Cable measurements of Gulf Stream transport off the coast of Florida give an annual mean of about 32 Sv with a strong inter-annual variability, whereas 1998 appeared rather to be a year of intense transport. The circulation in the Carribean was quite realistic in PAM05 but showed particularly low transport values (figure 9) ; it lacked about 5Sv when entering the West Indies arc and almost 7 Sv when leaving the straits of Florida.
The 24.9 Sv of PAM-05 may be compared to the 27 Sv of MICOM 1/12° (Chassignet et al., United States), and to the 26.7 Sv of POP 1/10° (Bryan et al, 1998, United States) before the blocking of the eddy of the Gulf of Mexico and around 26 Sv in ATL6-V5 1/6. It should be noted that PAM bathymetric data is obtained by simple interpolation on the grid of Smith and Sandwell’s data base model, whose spatial resolution is 2 minutes. A test of the sensitivity of bathymetric data to smoothing (3 successive Shapiro filters) was made to test the impact of the crude PAM bathymetric data. This test yielded very positive results, since PAM transport in the Florida straits increased up to 26.6 Sv. Moreover, the simulation indicated
Figure 8: Transport between the Carribean islands during the 8th year of PAM-05 simulation.
better penetration of the North Atlantic drift (figure 6). Furthermore, inter-annual simulations revealed transport which exceeded 27 Sv. However, while this made it possible to compare PAM’s efficiency to that of other simulations, the numerical representation of this transport and the complex geophysical processes which regulate it, remain an obstacle.
Implementation of a high-resolution MERCATOR model for the North Atlantic and Mediterranean regions (continued)
The Gulf Stream
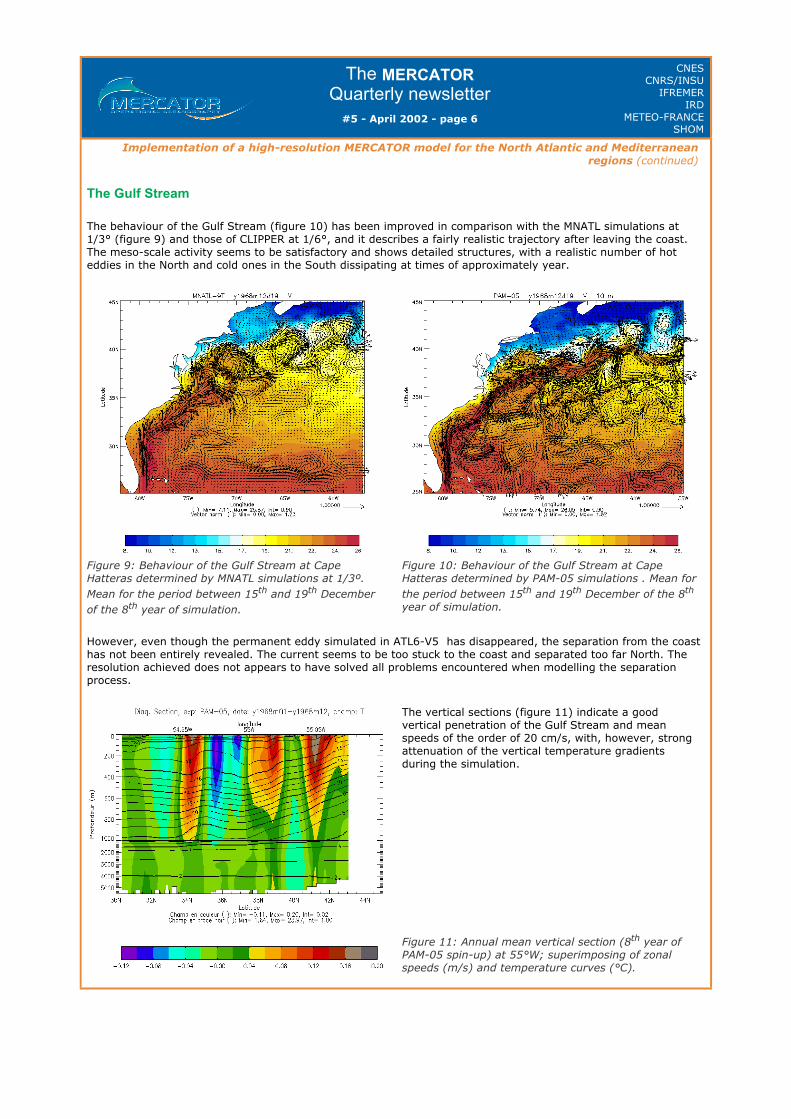
The behaviour of the Gulf Stream (figure 10) has been improved in comparison with the MNATL simulations at 1/3° (figure 9) and those of CLIPPER at 1/6°, and it describes a fairly realistic trajectory after leaving the coast. The meso-scale activity seems to be satisfactory and shows detailed structures, with a realistic number of hot eddies in the North and cold ones in the South dissipating at times of approximately year.
However, even though the permanent eddy simulated in ATL6-V5 has disappeared, the separation from the coast has not been entirely revealed. The current seems to be too stuck to the coast and separated too far North. The resolution achieved does not appears to have solved all problems encountered when modelling the separation process.
Figure 9: Behaviour of the Gulf Stream at Cape Hatteras determined by MNATL simulations at 1/3º. Mean for the period between 15th and 19th December of the 8th year of simulation.
Figure 10: Behaviour of the Gulf Stream at Cape Hatteras determined by PAM-05 simulations . Mean for the period between 15th and 19th December of the 8th year of simulation.
The vertical sections (figure 11) indicate a good vertical penetration of the Gulf Stream and mean speeds of the order of 20 cm/s, with, however, strong attenuation of the vertical temperature gradients during the simulation.
Figure 11: Annual mean vertical section (8th year of PAM-05 spin-up) at 55°W; superimposing of zonal speeds (m/s) and temperature curves (°C).
The MERCATOR Quarterly newsletter
#5 - April 2002 - page 7
CNESCNRS/INSU
IFREMERIRD
METEO-FRANCESHOM
Implementation of a high-resolution MERCATOR model for the North Atlantic and Mediterranean regions (continued)
Circulation in the North; deep convection and ocean bottom waters
The study of a section 1 in the Labrador sea (from 63°W, 55°N to 47°W, 61°N, figures 12 and13) yields a scenario for the development of convection and the formation of deep waters. Indeed, as of the first year of simulation, we observe homogenisation of water in a column of almost 1000m in depth. The vertical surface gradients contract significantly from 0 to 50m as compared with 100 m for the initialisation state in the open Labrador sea. Apart from the restratification problem which has already been mentioned, as related to the TKE scheme, the cause is the Westward return current of the subpolar gyre which drives relatively hot and saline water from the North East Atlantic. This subsurface current rapidly penetrates the Icelandic sea from 200 to 2000m in depth and then invades the Labrador sea from the surface to a depth of 1000m. During simulation the current stabilised at between 700 and 2500 m in the Labrador sea. Over 8 years the salinity thus increased to the maximum of 0.15 PSU at 500m and up to 1 PSU at 100m in the Westward return current.
For a section at 53°N (not shown), while the characteristics appear to have been relatively well reproduced to the East of the mid-Atlantic chain, a homogenisation of the waters at depths between 400 and 2500m may be seen on the Western half. The gradients are confined near the surface, while at 35° West, a vein of saline bottom water has disappeared.
As for section 4 at 53°W (figures 14 and 15) and 64°W (not shown), the error after 8 years seems to be slight. However we can see heating and a significant excess of salt of intermediary waters at a depth of between 800 and 1500 m (increase of 1 PSU at 900 m in depth at 30°N, 53°W, as well as at 30° N, 64°W). The Gulf Stream appears to be stuck to the coast and may again be seen at about 41°N in the form of a salt maximum between 50m and 400m. This growth of the Gulf Stream pushes slightly saline surface waters at depths of between 100 and 500 m from Labrador (around 45°N) towards the North. On the whole the spatial structure and variability are still comparable with those of sections covered during the WOCE (World Circulation Experiment) campaigns.
Figure 12: Vertical salinity section in the Labrador Sea (from 63°W, 55°N to 47°W, 61°N), with Reynaud climatology.
Figure 13: Vertical salinity section in the Labrador Sea (from 63°W, 55°N to 47°W, 61°N), after one year of PAM-05 simulation.
Figure 14: Vertical section of annual mean salinity at 53°W using Reynaud climatology.
Figure 15: Vertical section of annual mean salinity at 53°W during the 8th year of PAM-05 simulation.
The MERCATOR Quarterly newsletter
#5 - April 2002 - page 8
CNESCNRS/INSU
IFREMERIRD
METEO-FRANCESHOM
Implementation of a high-resolution MERCATOR model for the North Atlantic and Mediterranean regions (continued)
The Northeastern Atlantic; Mediterranean waters and the Azores front
Figure 16: Vertical salinity sections in the Gulf of Cadiz at 8.3°W using Reynaud climatology (top left), measured during the Semane mission (top right), simulated by CLIPPER 1/6° (ATL6-V5, bottom left) and by PAM (PAM-05,
bottom right).
In collaboration with the LPO at Brest (Talandier C, Theetten Set Gaillard F, 2001), data from the Cambios, Arcane, Semane and Chaos campaigns were compared for the third and eighth year of simulation. Vertical sections of observations at 8.3° West (figure 16) revealed two Mediterranean water
veins (750m at 1200m), for which PAM only represents the upper vein, stuck closely to the coast and for which, on the contrary, only the lower vein was revealed using Reynaud climatology. It would appear that the representation of the upper vein in PAM is due to a good representation of the bathymetric ridge in the Gulf of Cadiz.
In ATL6-V5 1/6, due to the existence of an open boundary in the Gulf of Cadiz, the sections are close to Reynaud climatology. Finally, the temperature and salinity sections at 40°N (not shown here) indicate too strong a penetration of Mediterrean water towards the West, in PAM. The thickness of the thread of water is however comparable to that of the Arcane campaign. Theta/S diagrams plotted as a comparison with the Semane campaign in particular, confirm these results; only the uppper Mediterranean water vein may be seen in PAM while the ATL6-V5 represents only the lower vein. Significant drifts of water masses have thus been identified and we can see a tendency towards homogenisation of the water
masses, as well as to heating and increased salinity of the waters between 500 and 1000 m. It should be noted that this marked tendency of MNATL inter-annual simulations is however much less significant with PAM. The main problem is the poor representation of basin outflow in models with z coordinates. Mediterranean waters, in spite of the diffusion coefficients used and attempts to adjust bathymetric data (CLIPPER works), do not plunge to the right depth. A solution might be to parameterize the bottom boundary layer as suggested by Beckmand and Dörsher and currently tested in CLIPPER configurations, but also to use ‘partial steps’ which are better for representing model's bathymetry in the last layer of the model.
The MERCATOR Quarterly newsletter
#5 - April 2002 - page 9
CNESCNRS/INSU
IFREMERIRD
METEO-FRANCESHOM
Implementation of a high-resolution MERCATOR model for the North Atlantic and Mediterranean regions (continued)
Mediterranean circulation
Figure 17: Horizontal section at 1000m in the salinity field in March of the 8th year of PAM-05 simulation.
Figure 18: Vertical section through the Meddies as observed during March of the 8th year of PAM-05 simulation.
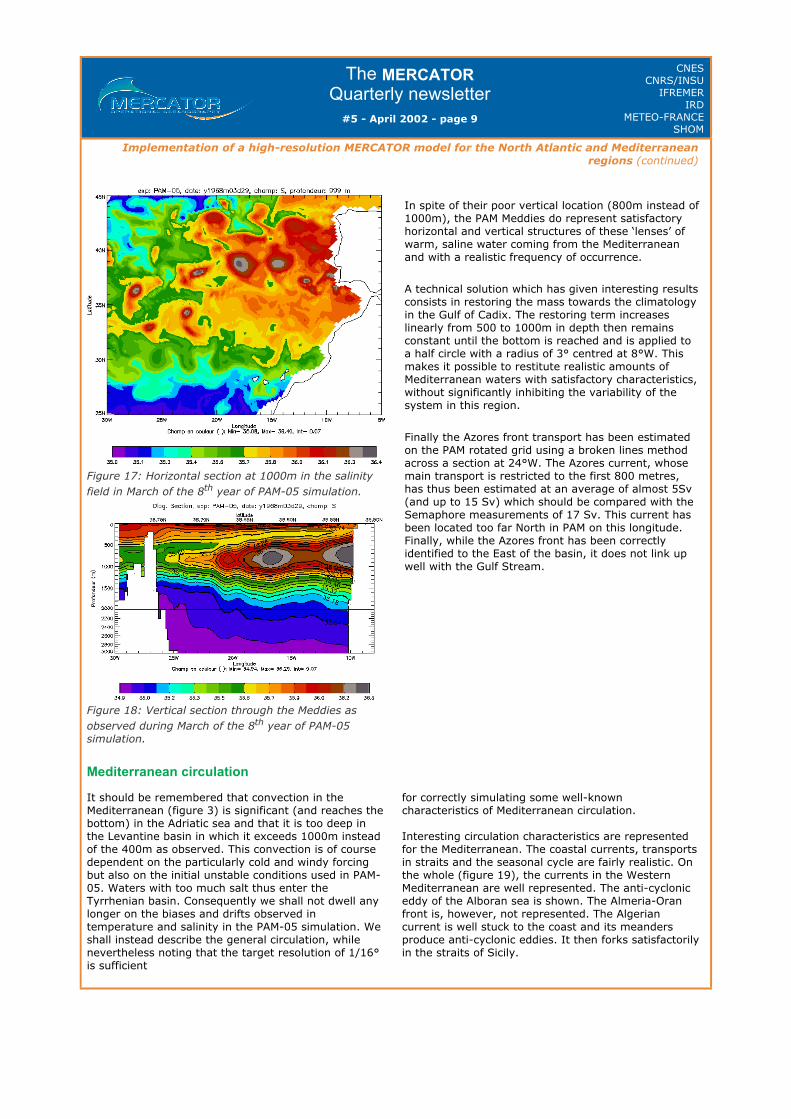
In spite of their poor vertical location (800m instead of 1000m), the PAM Meddies do represent satisfactory horizontal and vertical structures of these ‘lenses’ of warm, saline water coming from the Mediterranean and with a realistic frequency of occurrence.
A technical solution which has given interesting results consists in restoring the mass towards the climatology in the Gulf of Cadix. The restoring term increases linearly from 500 to 1000m in depth then remains constant until the bottom is reached and is applied to a half circle with a radius of 3° centred at 8°W. This makes it possible to restitute realistic amounts of Mediterranean waters with satisfactory characteristics, without significantly inhibiting the variability of the system in this region.
Finally the Azores front transport has been estimated on the PAM rotated grid using a broken lines method across a section at 24°W. The Azores current, whose main transport is restricted to the first 800 metres, has thus been estimated at an average of almost 5Sv (and up to 15 Sv) which should be compared with the Semaphore measurements of 17 Sv. This current has been located too far North in PAM on this longitude. Finally, while the Azores front has been correctly identified to the East of the basin, it does not link up well with the Gulf Stream.
It should be remembered that convection in the Mediterranean (figure 3) is significant (and reaches the bottom) in the Adriatic sea and that it is too deep in the Levantine basin in which it exceeds 1000m instead of the 400m as observed. This convection is of course dependent on the particularly cold and windy forcing but also on the initial unstable conditions used in PAM-05. Waters with too much salt thus enter the Tyrrhenian basin. Consequently we shall not dwell any longer on the biases and drifts observed in temperature and salinity in the PAM-05 simulation. We shall instead describe the general circulation, while nevertheless noting that the target resolution of 1/16° is sufficient
for correctly simulating some well-known characteristics of Mediterranean circulation. Interesting circulation characteristics are represented for the Mediterranean. The coastal currents, transports in straits and the seasonal cycle are fairly realistic. On the whole (figure 19), the currents in the Western Mediterranean are well represented. The anti-cyclonic eddy of the Alboran sea is shown. The Almeria-Oran front is, however, not represented. The Algerian current is well stuck to the coast and its meanders produce anti-cyclonic eddies. It then forks satisfactorily in the straits of Sicily.
The MERCATOR Quarterly newsletter
#5 - April 2002 - page 10
CNESCNRS/INSU
IFREMERIRD
METEO-FRANCESHOM
Implementation of a high-resolution MERCATOR model for the North Atlantic and Mediterranean regions (continued)
Figure 19: Kinetic surface energy in cm²/s² and transports in the various straits in the Mediterranean domain during the 8th year of PAM-05 simulation.
The liguro-provençal current is too wide and too stable, which may be related to too great a transport of water in the Corsican channel (reaching 2.4 Sv in winter) and hence too much Levantine intermediary water, LIW (1 Sv) formed in the Eastern Mediterranean and entering into the Western basin.
In the Eastern Mediterranean, the winter circulation shows a current of Atlantic water which is on the whole stuck to the coast at 22°E, which appears to match recent satellite observations but which contradicts previous circulation schemes plotted from in situ measurements. This may be partly due to the representation of the deep convection in the Levantine basin and in particular the lack of the Rhodes eddy. This lack is itself probably intensified by the relatively strong ECMWF 1998-99 winds and relaxation to the weekly Reynolds temperature (resolution of 1°). One should however note that the representation of the mesoscale structures which have been observed such as the Shik-Mona anti-cyclonic eddy at 34°E and the cyclonic eddy in the Adriatique.
The circulations which have already been described, change in summer, both in position and in intensity. The circulation intensifies in the Aegean sea with an anti-cyclonic circulation to the North in the Dardanelles as well as in the Western edge current. These results fit Kourafalou’s simulation of the Aegean sea (Communication, EGS, 2001), performed as part of the MFSPP project. Likewise, in the Adriatic, one can see the cyclonic circulation of the Southern eddy and the intensification of the Western edge current.
As far as the transports (figure 18) are concerned, one may note in particular a good exchange of water in the Straits of Gibraltar with more than 0.8 Sv whereas bibliographical values give between 0.5 and 1.5 Sv . These should be compared with the estimates of 0.8 Sv during the Canigo campaign (La Fuente et al). In the Sicilian straits, more than 1 Sv have been simulated with peaks at 2 Sv. Finally, the transports in the straits of Bonifacio and Otranto show very clear seasonal cycles, but the values in the straits of Corsica are a bit too high (1.1 Sv).
The MERCATOR Quarterly newsletter
#5 - April 2002 - page 11
CNESCNRS/INSU
IFREMERIRD
METEO-FRANCESHOM
Implementation of a high-resolution MERCATOR model for the North Atlantic and Mediterranean regions (continued)
Conclusion
The primary aim of the simulation was to prove the feasibility of high-resolution forecasting for operational applications. The first immediate consequence of this was a few restrictions, such as for the domain (9°N for the Southern boundary) and for the spin-up (started in 1998).
Once the configuration had been validated and a certain number of resolution parameters calibrated, experiments were conducted with the model at 1/3° to quantify the impact of the design choices, which were, a priori, restrictive. Since the choices proved to be relevant, the long simulation was thus undertaken.
Analysis of its results revealed a certain number of errors common to all simulations done with the OPA model, such as the insufficient plunging of Mediterranean waters in the Atlantic and the non re-stratification of Labrador waters after the strong winter convection. It also lacked a few specific phenomena such as the transport in the straits of Florida and the weak meridian current. Finally, while the separation of the Gulf Stream was improved in comparison with CLIPPER simulations, it appears that the resolution is still not high enough to accurately reproduce this significant characteristic of Atlantic circulation.
Some partial solutions had been defined during simulation of sensitivity, such as the smoothing of the model's bathymetry and the use of a three year mean for the forcing in spin-up mode. Other adjustments were made such as the initial conditions in the Mediterranean, which were stabilised and the introduction in the Gulf of Cadiz of a zone tied to the climatology in order to better project the outflow of Mediterranean waters.
It was thus possible to obtain state of the art simulations of results of models with vertical z coordinates. Finally new paramaterisations were defined and validated by the research community involved in Mercator and it will now be possible to apply these to the PAM model, for instance the parameterising of the bottom boundary layer and the KPP vertical mixing.
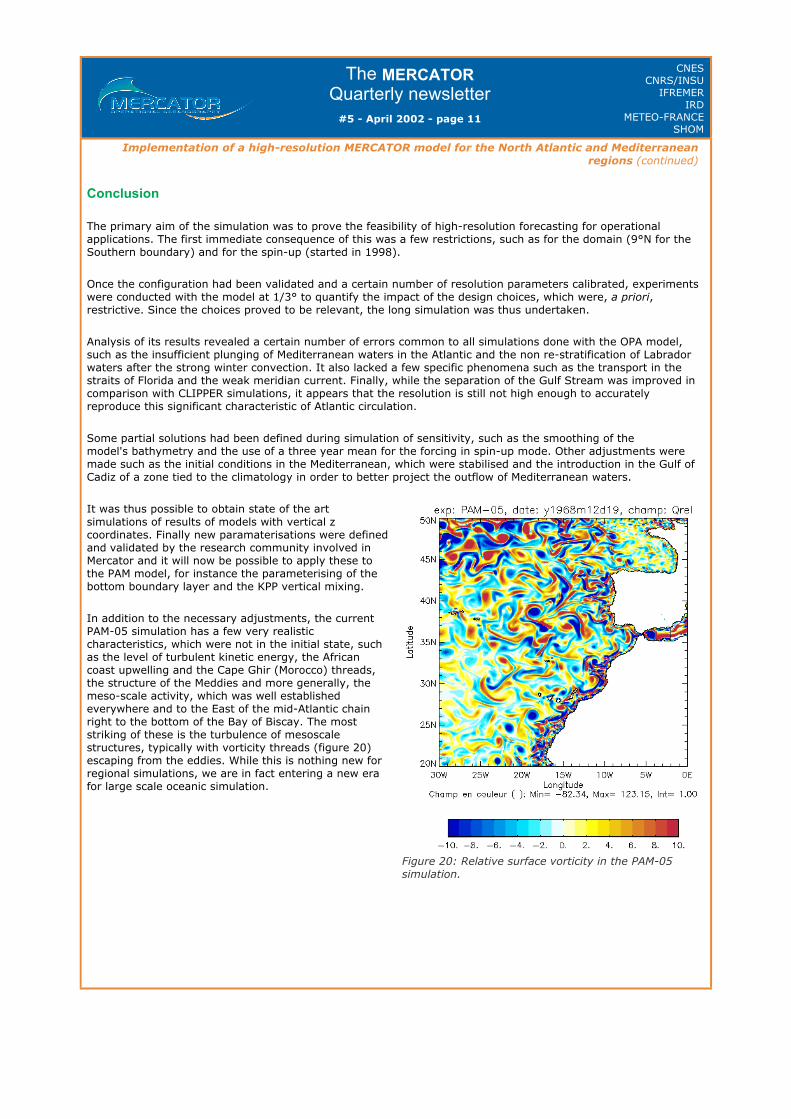
In addition to the necessary adjustments, the current PAM-05 simulation has a few very realistic characteristics, which were not in the initial state, such as the level of turbulent kinetic energy, the African coast upwelling and the Cape Ghir (Morocco) threads, the structure of the Meddies and more generally, the meso-scale activity, which was well established everywhere and to the East of the mid-Atlantic chain right to the bottom of the Bay of Biscay. The most striking of these is the turbulence of mesoscale structures, typically with vorticity threads (figure 20) escaping from the eddies. While this is nothing new for regional simulations, we are in fact entering a new era for large scale oceanic simulation.
Figure 20: Relative surface vorticity in the PAM-05 simulation.
The MERCATOR Quarterly newsletter
#5 - April 2002 - page 12
CNESCNRS/INSU
IFREMERIRD
METEO-FRANCESHOM
Implementation of a high-resolution MERCATOR model for the North Atlantic and Mediterranean regions (continued)
References:
Barnier B, Brasseur P (2001): Modélisation de la couche de mélange océanique et assimilation de donnéees spatiales au moyen du filtre SEEK dans la configuration Atlantique Nord au 1/3 NATL3. Rapport final avril 2001
Béranger K. (2002): Modélisation aux équations primitives à très haute résolution de la circulation générale de la Méditerranée. Rapport annuel janvier 2002.
Madec G., Delecluse P., Imbard M., Lévy C. (1998) OPA8.1 ocean generalcirculation model reference manual, Notes du pôle de modélisation IPSL, 11
Michel S, Messager C (2000): DIAGOFF programme de diagnostics oof-line pour le projet CLIPPER. Manuel d'utilisation juin 2000.
Reynaud T., Legrand P., Mercier H., Barnier B. (1998) A new analysis of hydrographic data in the Atlantic and its application to an inverse modelling study, International WOCE Newsletters, 32
Smith, R. D., M. E. Maltrud, F. O. Bryan, and M. W. Hecht, 1999: Numerical Simulation of the North Atlantic Ocean at 1/10º, submitted to J. Phys.Oceanogr.
Smith W. , Sandwell D. (1997) Global sea floor topography from satellite altimetry and ship depth soundings, Science, 277
Talandier C, Theetten S, Gaillard F (2001): Validation de PAM-05 en Atlantique Nord-Est. Rapport final juin 2001
Treguier et al. (2001): An eddy permitting model of the Atlantic circulation Evaluating open boundary conditions. J. Geophys. Res., in press, August 2001
- Quizz -
This is a map of sea level. The geometrical structure is almost perfect. Who created it?
Answer on the following page
The MERCATOR Quarterly newsletter
#5 - April 2002 - page 13
CNESCNRS/INSU
IFREMERIRD
METEO-FRANCESHOM
- Answer to the quizz -
The North Equatorial counter current, which moves Eastwards between 4°N and 9°N, depending on the position of the ITCZ (inter tropical convergence zone), touches the South Equatorial current which moves Westwards around the equator:
Map showing temperature and current at 100m, on 13-2-2002
In the springtime the Counter-Current is weak and the Equatorial Current destabilizes it. This creates meanders with a more or less organised structure. In some years this structure is almost perfect, as was the case in 1993 and now in 2002. It is then possible to observe the meanders from the Brazilian coast to the African coast, by means of satellite altimetry. To add to this, here is the vertical temperature section seen by MERCATOR:
Sea level, analysis on 13-2-2002
Vertical temperature section at 7°N30', analysis on 13-2-2002
This analysis is similar to that observed in the past (CITHER 1 sea campaign). The only criticism is that the thermocline is not pinched enough (the vertical gradient is too diffuse).
In passing, this date is not only noteworthy for the meanders of the North Equatorial Counter Current, since we can also see a clear eddy activity in the Gulf of Mexico as well as in the region of the Gulf Stream, with very distinct cold rings (cyclonic eddies) shown in blue in the figure. The North Atlantic Current has not been neglected either. Finally, we can even see small anti-cyclonic structures in the Labrador Sea. This extremely contrasted circulation thus marks a very good year; a case study worth remembering.
The MERCATOR Quarterly newsletter
#5 - April 2002 - page 14
CNESCNRS/INSU
IFREMERIRD
METEO-FRANCESHOM
Winter convection: comparative test
by E. Greiner, with G. Reverdin
Introduction
Note
In this study ‘MERCATOR analysis’ means analysis which is done on day D for day D-14. It covers the most observations and is therefore a true ‘re-analysis’. However, in order not to delay publication of this newsletter, fields for the end of March are considered to be day D analyses.
The situation shows a Gulf Stream front which is more north-west of 60°W during the winter of 2002. The subtropical gyre is less intense in the winter of 2002 as shown by the negative difference in sea level. The sea level of the Atlantic façade is clearly higher during the winter of 2002 to the East of 30°W, from Portugal to the Faroe islands. The sea level around Norway and the Denmark straits is also higher. The level on the Western coast of Greenland is much higher. On the other hand, the level of the Labrador sea is lower during the winter of 2002. If we accept the PSY1-v1 analyses, this information on sea level would result in the following surface currents:
Analysed surface currents: JFM 2002 and JFM 2001 The positions of the Irminger and Islande moorings are shown
For the second winter in a row, the PSY1-v1, the first analysis and forecast system for the North Atlantic, at 1/3° has been operated in near-real-time. What has been happening in this new year in the deep convection regions? This new study was designed to gather the most recent information (observations and model results) on this complex topic in order to determine a few lines for future investigation.
The study began with a map showing changes in sea level between the winters of 2001 and 2002:
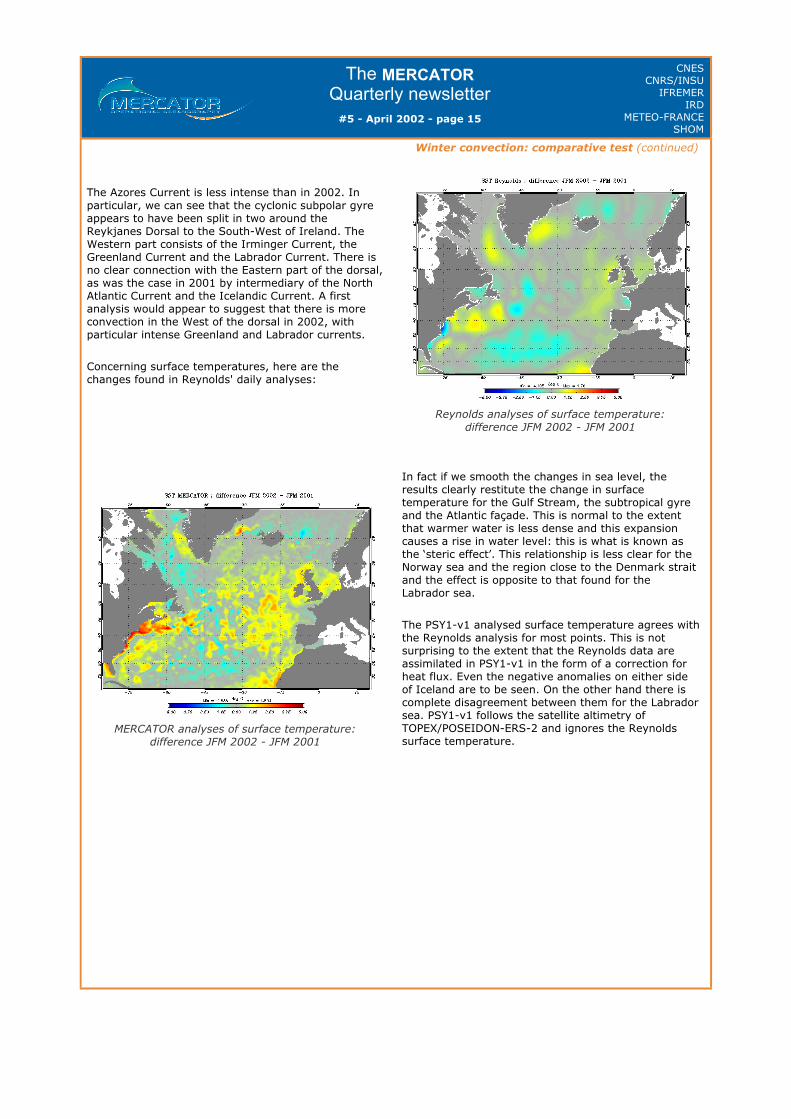
The Azores Current is less intense than in 2002. In particular, we can see that the cyclonic subpolar gyre appears to have been split in two around the Reykjanes Dorsal to the South-West of Ireland. The Western part consists of the Irminger Current, the Greenland Current and the Labrador Current. There is no clear connection with the Eastern part of the dorsal, as was the case in 2001 by intermediary of the North Atlantic Current and the Icelandic Current. A first analysis would appear to suggest that there is more convection in the West of the dorsal in 2002, with particular intense Greenland and Labrador currents.
Concerning surface temperatures, here are the changes found in Reynolds' daily analyses:
In fact if we smooth the changes in sea level, the results clearly restitute the change in surface temperature for the Gulf Stream, the subtropical gyre and the Atlantic façade. This is normal to the extent that warmer water is less dense and this expansion causes a rise in water level: this is what is known as the ‘steric effect’. This relationship is less clear for the Norway sea and the region close to the Denmark strait and the effect is opposite to that found for the Labrador sea.
The PSY1-v1 analysed surface temperature agrees with the Reynolds analysis for most points. This is not surprising to the extent that the Reynolds data are assimilated in PSY1-v1 in the form of a correction for heat flux. Even the negative anomalies on either side of Iceland are to be seen. On the other hand there is complete disagreement between them for the Labrador sea. PSY1-v1 follows the satellite altimetry of TOPEX/POSEIDON-ERS-2 and ignores the Reynolds surface temperature.
The MERCATOR Quarterly newsletter
#5 - April 2002 - page 16
CNESCNRS/INSU
IFREMERIRD
METEO-FRANCESHOM
Winter convection: comparative test (continued)
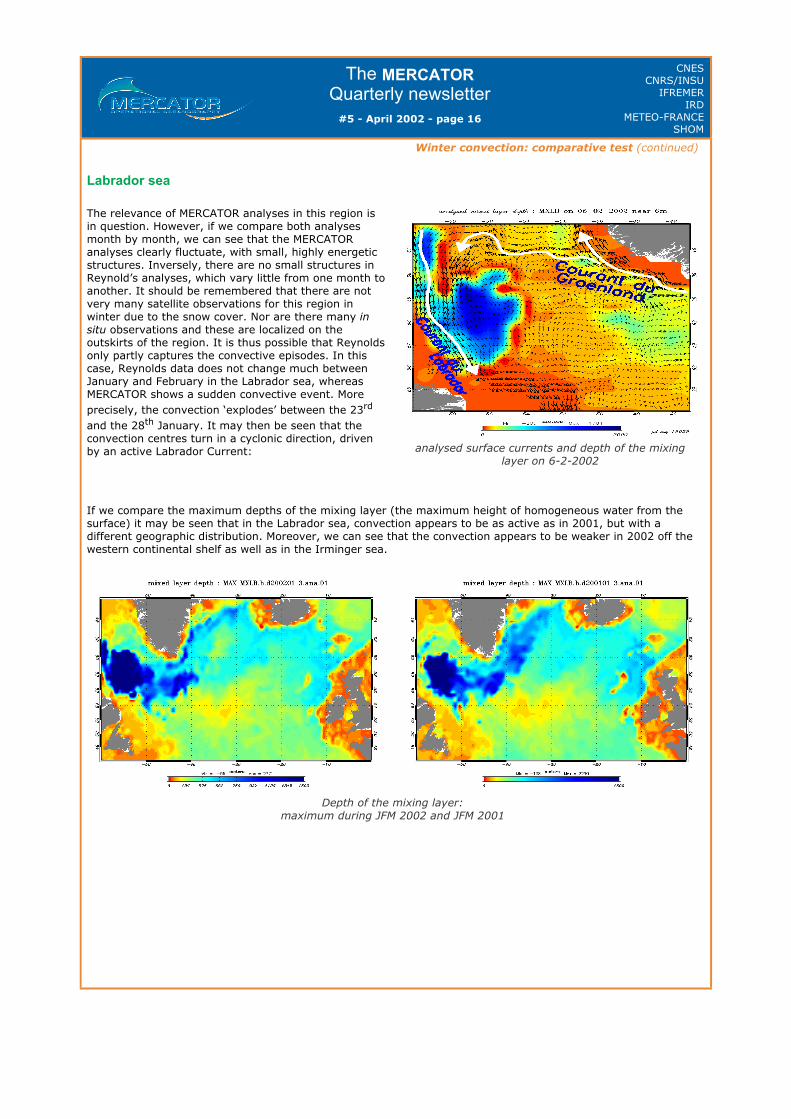
Labrador sea
If we compare the maximum depths of the mixing layer (the maximum height of homogeneous water from the surface) it may be seen that in the Labrador sea, convection appears to be as active as in 2001, but with a different geographic distribution. Moreover, we can see that the convection appears to be weaker in 2002 off the western continental shelf as well as in the Irminger sea.
Depth of the mixing layer: maximum during JFM 2002 and JFM 2001
The relevance of MERCATOR analyses in this region is in question. However, if we compare both analyses month by month, we can see that the MERCATOR analyses clearly fluctuate, with small, highly energetic structures. Inversely, there are no small structures in Reynold’s analyses, which vary little from one month to another. It should be remembered that there are not very many satellite observations for this region in winter due to the snow cover. Nor are there many in situ observations and these are localized on the outskirts of the region. It is thus possible that Reynolds only partly captures the convective episodes. In this case, Reynolds data does not change much between January and February in the Labrador sea, whereas MERCATOR shows a sudden convective event. More precisely, the convection ‘explodes’ between the 23rd and the 28th January. It may then be seen that the convection centres turn in a cyclonic direction, driven by an active Labrador Current:
analysed surface currents and depth of the mixing layer on 6-2-2002
The MERCATOR Quarterly newsletter
#5 - April 2002 - page 17
CNESCNRS/INSU
IFREMERIRD
METEO-FRANCESHOM
Winter convection: comparative test (continued)
To determine what (may have) occurred in the Labrador sea around 56°W-58.5°N, we can look at the density profiles for the begining of January and the end of March. When the convection ends we see that the water around 300m is lighter than it was at the beginning of January:
Potential density profiles in the Labrador convection zone: beginning of January 2002 and end of March 2002
According to the MERCATOR analyses, the southern branch of the Labrador Current (which leaves the coast south of Cape Desolation and approximately follows the 3000m isobath around 61°N) is more intense in 2002 than it was in 2001. It interacts with the convection centre by carrying waters which are slightly less cold. This phenomenon was not apparent in 2001:
Potential density profiles in the Labrador convection zone: beginning January 2001 and end of March 2001
The MERCATOR Quarterly newsletter
#5 - April 2002 - page 18
CNESCNRS/INSU
IFREMERIRD
METEO-FRANCESHOM
Winter convection: comparative test (continued)
The T-S diagrams (potential temperature and density) for this zone can also be compared at the beginning and end of convection for the two years:
T-S diagram in the Labrador convection zone: beginning January 2002 and end of March 2002
T-S diagram inthe Labrador convection zone: beginning January 2001 and end of March 2001
Finally it may seen that in spite of the different scenarios, the results in terms of water masses are quite similar.
The MERCATOR Quarterly newsletter
#5 - April 2002 - page 19
CNESCNRS/INSU
IFREMERIRD
METEO-FRANCESHOM
Winter convection: comparative test (continued)
Irminger sea and Iceland sea
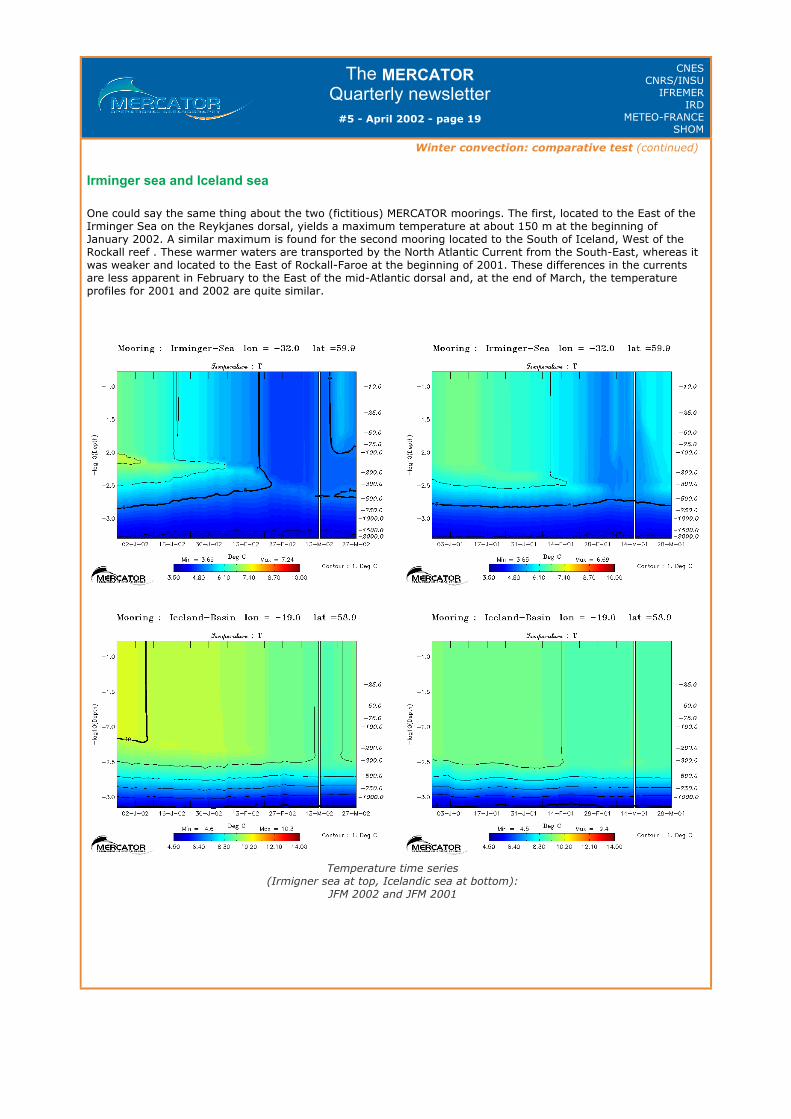
One could say the same thing about the two (fictitious) MERCATOR moorings. The first, located to the East of the Irminger Sea on the Reykjanes dorsal, yields a maximum temperature at about 150 m at the beginning of January 2002. A similar maximum is found for the second mooring located to the South of Iceland, West of the Rockall reef . These warmer waters are transported by the North Atlantic Current from the South-East, whereas it was weaker and located to the East of Rockall-Faroe at the beginning of 2001. These differences in the currents are less apparent in February to the East of the mid-Atlantic dorsal and, at the end of March, the temperature profiles for 2001 and 2002 are quite similar.
Temperature time series (Irmigner sea at top, Icelandic sea at bottom):
JFM 2002 and JFM 2001
The MERCATOR Quarterly newsletter
#5 - April 2002 - page 20
CNESCNRS/INSU
IFREMERIRD
METEO-FRANCESHOM
Winter convection: comparative test (continued)
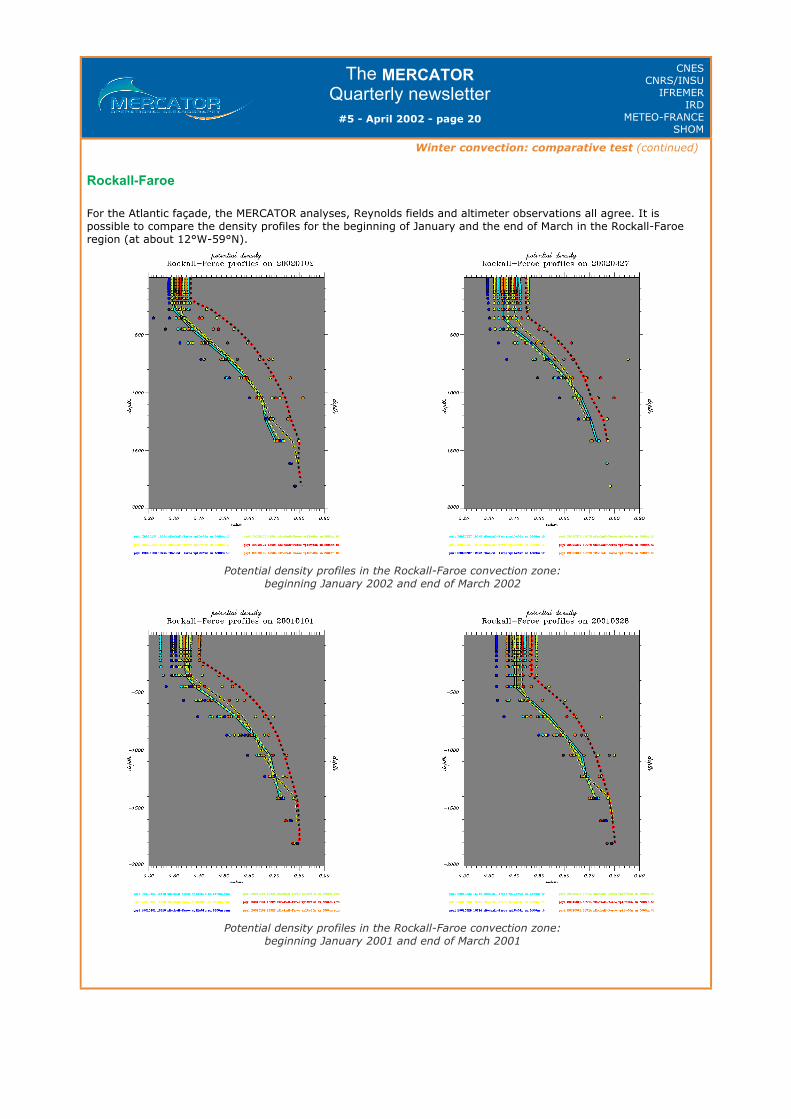
Rockall-Faroe
For the Atlantic façade, the MERCATOR analyses, Reynolds fields and altimeter observations all agree. It is possible to compare the density profiles for the beginning of January and the end of March in the Rockall-Faroe region (at about 12°W-59°N).
Potential density profiles in the Rockall-Faroe convection zone: beginning January 2002 and end of March 2002
Potential density profiles in the Rockall-Faroe convection zone: beginning January 2001 and end of March 2001
The MERCATOR Quarterly newsletter
#5 - April 2002 - page 21
CNESCNRS/INSU
IFREMERIRD
METEO-FRANCESHOM
Winter convection: comparative test (continued)
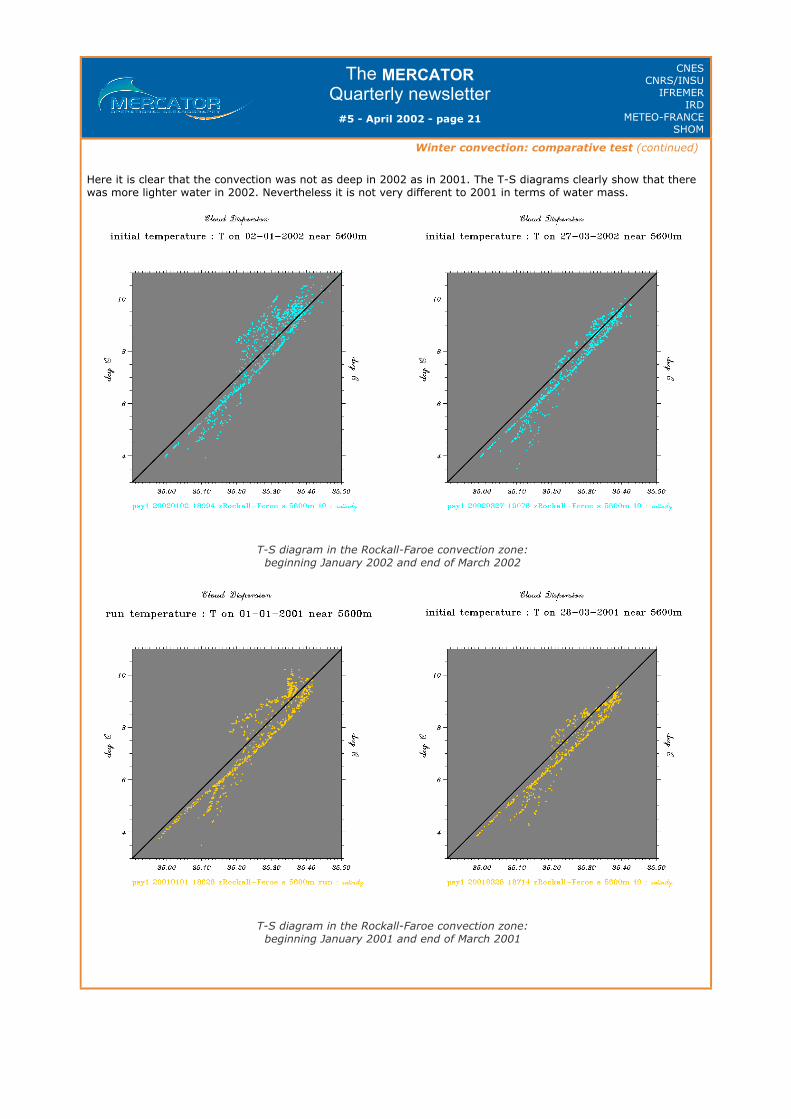
Here it is clear that the convection was not as deep in 2002 as in 2001. The T-S diagrams clearly show that there was more lighter water in 2002. Nevertheless it is not very different to 2001 in terms of water mass.
T-S diagram in the Rockall-Faroe convection zone: beginning January 2002 and end of March 2002
T-S diagram in the Rockall-Faroe convection zone: beginning January 2001 and end of March 2001
The MERCATOR Quarterly newsletter
#5 - April 2002 - page 22
CNESCNRS/INSU
IFREMERIRD
METEO-FRANCESHOM
Winter convection: comparative test (continued)
Conclusion
More generally speaking the winter of 2000-2001 was marked by a slightly negative NAO* index (see a discussion of its impact on winter convection in the Quarterly Newsletter #1). However the ‘90s are noteworthy in particular for their very positive indices. At the end of December 2001, the NAO index was even clearly negative. However, since January 2002, positive values have again been noted (with the magnitude varying according to the calculation method used). On average, the winter of 2001-2002 had a slight NAO+. The NAO thus played a moderate driving role on convection in 2002. It would appear that oceanic advection played a more significant role in 2002 than in 2001 in mixing water masses. There was less formation of deep water in 2002 but it was nevertheless comparable to 2001.
NAO: The North Atlantic Oscillation is the dominant mode of climatic variability in the Northern Atlantic. This type of variability is characterised by a reinforcing of the Azores anticyclone and the Icelandic depression. The Westerly Wind is reinforced thus causing a warmer and more humid land mass in Northern Europe than on average. At sea there is intense convection in all zones (Labrador, Irminger, Iceland). The intensity of this fluctuation can be measured using fairly similar indices, throughout the winter months. The simplest index measures the difference in atmospheric pressure between the Azores and Iceland. The negative phase of the NAO is relatively symmetrical with opposite effects (A colder and dryer Northern Europe). On land, the Loire marks the transition latitude and the effects are felt as far as Russia and the Eastern Mediterranean.
The MERCATOR Quarterly newsletter
#5 - April 2002 - page 23
CNESCNRS/INSU
IFREMERIRD
METEO-FRANCESHOM
- Notebook -
Recommended reading
Mercator gets special coverage in:
Ludions et satellites sondent les caprices de l'océan (Cartesian diver device and satellites probe the ocean’s quirks) Le Monde - 14.03.2002. "The profession of oceanic forecaster remains to be invented"... is Pierre Bahurel’s conclusion to this article describing the indispensable components of operational oceanography.
Feature article: Mettez vous aux courants (Go with the flow) Voiles et voiliers - n° 373 mars 2002. MERCATOR, which provides surface current forecasts each week, has been included in this very comprehensive article on ocean currents.
Editorial board
Corinne Guiose Eric Greiner
Authors
Article 1: Laure Siefridt, Yann Drillet, Romain Bourdallé-Badie, Karine Béranger, Claude Talandier and Eric Greiner Article 2: E. Greiner Article 3: E. Greiner, with G. Reverdin
Acknowledgements
We would like to thank all the authors who contributed to this newsletter and in particular, Gilles Reverdin for his very welcome assistance.
Next issue: July 2002
Now that we have discussed the PAM model, the time has come to deal with the second MERCATOR prototype, PSY-2 and to compare it with the first prototype, which has been in operation since 17th January 2001.
Which new fields will be described ? What will the resolution be? What will PSY-2 contribute? The answers to all of these questions may be found in Newsletter #6!
There is no longer any doubt that we have entered the new era of large scale ocean simulation.
Address
Please send us your comments to the following e-mail address: