Page 1
1
Merchandising Trends: Supporting the Value Proposition
JANUARY 2013
03
04
05
12
14
15
17
19
20
Executive Summary
Introduction
Merchandising Activity
Merchandising Effectiveness
Merchandising Tactics
Trends to Watch
Conclusions
Success Story: Buyer Profile
Resources
Page 2
2 2
© Copyright 2013 SymphonyIRI Group, Inc. All rights reserved.
New Opportunities for Innovation in Merchandising
Merchandising Trends: Supporting the Value Proposition
John A. McIndoe
Senior Vice President, Marketing
SymphonyIRI Group
This month’s Times & Trends points to the fact that many marketers are not taking these risks. Price-only merchandising remains a
dominant trend, yet lift from price-only merchandising is generally much lower versus lift achieved by other tactics.
Is decreased lift due solely to a lack of innovation by marketers? Is the continued growth of online marketing and now mobile marketing
shaping shoppers’ plans before they enter the store and rendering merchandising less relevant? Why are 49 percent of shoppers buying
more private label today (still largely a price-based decision), while price-only merchandising is having a decreasing impact?
To secure answers to these and other questions, marketers must continuously analyze shoppers’ reactions to every facet of new
campaigns—those in the home, on the way to and in the store, as well as online, offline and integrated campaigns. And, this analysis
must be ongoing as market conditions constantly change.
To help answer these questions more comprehensively, I’d like to personally invite you to attend this year’s 2013 SymphonyIRI Summit:
Activate Your Growth Engine. We will hold Summit April 15-17 at the Wynn Las Vegas. Among the many exciting speakers will be Nate
Silver, founder of FiveThirtyEight.com; John Mackey, CEO of Whole Foods; and Jim Lecinski, managing director of Google. New
content, new speakers, new formats! The only constant is our focus on accelerating the growth of your organization. For more
information, click here.
As you implement your merchandizing strategies for this year, I hope you will share your successes, observations and questions. And, I
look forward to seeing you at Summit!
One of the more exciting developments during the past few years has been the emergence and evolution
of mobile marketing. Combining GPS capabilities with mountains of information available down to the
specific household level, it’s increasingly easy to, for example, text a shopper that his favorite snack food
is on sale, based on his location and past purchasing patterns.
The dichotomy of how to reach shoppers in the home when they are researching products and making
lists while also influencing them at the store when they make a final decision has become even more
complex –how to handle marketing to shoppers when they're on the way to the store.
Innovative marketers have exciting new opportunities to create campaigns that reach shoppers in the
home, on the way to and in the store; combined with the near limitless opportunities of integrating online
and offline initiatives. But, to take advantage of these opportunities, marketers must take some risks.
Page 3
3
© Copyright 2013 SymphonyIRI Group, Inc. All rights reserved.
Insight Action
Invest to understand evolving media options
and how key consumers and target shoppers
interact with/respond to various media mixes
Establish carefully targeted, long-term
strategies around everyday value and use
promotional programs on a more limited,
tactical basis to capitalize on short-term
opportunities
Simulate various what-if scenarios by mixing
and matching a variety of different pricing
and promotion conditions to understand the
impact of changing promotions on key
business indicators
On average, merchandising activity within the
drug channel decelerated for the second
consecutive year, yet support across key health
and beauty care categories intensified more
quickly in drug versus the grocery channel
Leverage advanced analytics to understand
how media usage patterns differ across CPG
categories
Average merchandising lift fell sharply in
2012—a trend that is consistent across a
majority of categories and measured
channels
Media usage and new media adoption trends
vary rather significantly across CPG
categories
Executive Summary: Turning Insights Into Action
Merchandising Trends: Supporting the Value Proposition
After subsiding briefly in 2011, merchandising
activity picked up across a majority of CPG
channels in 2012
Despite the fact that lift from price-only
merchandising is generally much lower versus
lift achieved by other tactics, reliance on this
tactic increased across more than half of CPG
categories in 2012
Across channels, maintain a 360-degree
understanding of trip drivers and in-store
conversion and use that information to
develop solutions-based programs that
address high-level consumer needs
Page 4
4
© Copyright 2013 SymphonyIRI Group, Inc. All rights reserved.
Introduction
Simply put, consumers view grocery
shopping differently today than they did
just a decade ago. Several forces have
driven this evolution, but two major forces
stand out as particularly influential.
First, the past decade has brought with it a
proliferation of digital media.
Smartphones, digital coupons, online
retailers—the Internet has carved a wide
path through the consumer packaged
goods (CPG) industry. It has intensified
competition and fragmented shoppers.
But, the Internet is not the only force
notching up CPG competition and slivering
the consumer marketplace: detailed
frequently in Times & Trends, CPG
retailers are helping to blur channel
differences by adjusting store footprints
and locales and competing more heavily
across an array of categories and aisles.
Secondly, the United States is still
grappling with the impacts from The Great
Recession, the longest and deepest
economic slide since The Great
Depression. Indeed, according to
SymphonyIRI’s MarketPulse survey, even
Those CPG marketers that embrace this
opportunity to improve and grow will be
met with ongoing success in the evolving
CPG world. Those that fail to evolve will
find it difficult—even impossible—to remain
relevant and competitive.
This issue of Times & Trends explores
current and emerging merchandising
trends that CPG marketers have embraced
during the past few years in an effort to
satisfy consumers’ rapidly changing
definitions of value.
a full four-and-one-half years after the
official end of the recession, 22% of
consumers are still having difficulty
affording their weekly groceries. Not
surprisingly, the intensity of financial
pressures has had profound impacts on
how consumers live and their grocery
budgets.
The result of these influencers is that the
path to purchase has forever changed.
This is not to say that traditional methods
of in-store merchandising have become
obsolete. Certainly, this is not the case.
Illustrated throughout this report, traditional
tools, including feature only, display only,
combined feature/display and price only
tactics, still play an important role in
educating and activating shoppers.
But, their impact is not quite as powerful as
it had once been. Going forward, the
manner in which these tools are leveraged
must evolve to keep pace with changing
times.
Merchandising Trends: Supporting the Value Proposition
Page 5
5
© Copyright 2013 SymphonyIRI Group, Inc. All rights reserved.
Across 39% of CPG categories,
more than one-
third of volume is sold with
merchandising
support.
% of CPG Categories with Increasing/Declining
Merchandising Activity
Merchandising has long played an
important role in the CPG industry. It
builds excitement, educates consumers
and drives awareness. For these reasons
and more, many categories rely heavily on
merchandising activity to spur purchase
behavior.
During the past couple of years, in fact,
more than one-third of CPG categories
sold considerable volume—30% to 50%—
with merchandising support. And, in 2012,
merchandising activity ticked back up after
briefly subsiding in 2011.
Still, on the whole, the past year has
actually been a year of mixed trends. On
average, merchandising—defined as
displays, feature ads, feature and display
beauty aisles is strong and growing. But,
across other areas, two-thirds of categories
saw support slide. Certainly, some
instances of reduction are the result of
shifts in strategy. But, with competition
high across many CPG categories,
retailers must proceed with caution. Some
of these categories, including beer, wine
and spirits, are rapidly growing categories
that have seen sizable reductions in
merchandising support within the channel.
The pages that follow provide a more
detailed perspective on CPG
merchandising trends.
combined and price reduction only—
increased across just over half of CPG
categories and declined in 47% of
categories.
Trends in the grocery and convenience
channels closely mirror the industry
average, in line with historical
performance.
The drug channel, however, has a different
merchandising story to tell. Within drug,
merchandising activity has been on a
downward slide for a couple of years. In
2012, merchandising slid across 60% of
drug channel categories.
Detailed later in this report, drug channel
merchandising within the health and
Merchandising Activity: Total CPG
Source: SymphonyIRI Market Advantage™; 52 weeks ending 12/2/2012 and same period prior years
42%
67% 47% 40%
60% 47%
35% 47%
60% 44%
70% 52%
58%
33% 53% 60%
40% 53%
65% 53%
40% 56%
30% 48%
2010 2011 2012 2010 2011 2012 2010 2011 2012 2010 2011 2012
MULOC Grocery Drug Convenience
Increasing
Declining
The pace of merchandising activity has been mixed during the past year, with 53% of categories seeing increased support; within the drug channel, merchandising activity declined across 60% of categories.
% Volume, Any Merchandising
Merchandising Trends: Supporting the Value Proposition
Page 6
6
© Copyright 2013 SymphonyIRI Group, Inc. All rights reserved.
% of Categories with Increased Merchandising Activity
By Merchandising Tactic
Multi-Outlet + Convenience
Merchandising Activity: Total CPG
Display-only activity also escalated during
2012, with increases occurring across 59%
of categories. While a majority of these
increases were small, at less than one
point, a number of categories saw
noteworthy increases in volume sold with
display-only actions. For instance, 26% of
air freshener volume sold in 2012 was sold
with merchandising support, reflecting an
increase of more than two points versus
2011 levels. Much of this increase was
attributable to display-only support. For
the year, air freshener unit sales increased
5.6%, despite a decrease in price-only
support.
The only tactic to see a deceleration in
activity in 2012 was combined feature and
display, where 67% of categories saw
volume sold with support decline. A
majority of declines were quite small, at
less than one point. But, examples of
sizable categories that saw volume from
this tactic slide by two or more points are
shelf-stable seafood, where volume sold
with combined feature and display support
fell 2.5 points, and aseptic juices, where
support fell 2.0 points. Neither of these
categories have relied heavily on combined
feature and display activity to move volume
in recent years.
Merchandising support increased across
53% of CPG categories in 2012. This
marks a fairly sizable escalation versus
2011, when 33% of categories enjoyed
increased merchandising support, and it
tells an important story of an industry
looking to serve consumers that remain
firmly entrenched in conservative mode
more than three years after the official end
of The Great Recession.
Detailed throughout this report, many CPG
marketers are targeting their efforts around
rituals that originally emanated from The
Great Recession. They are also looking to
address ongoing concerns, such as
escalating commodity prices, that threaten
to exacerbate the strain on the consumer
wallet.
For instance, price-only merchandising
support increased across 51% of
categories in 2012. Some of this stepped-
up support is meant to off-set particularly
high price increases. Detailed in the
December 2012 edition of Times & Trends,
coffee hit a 14-year high in 2012, with
average price per volume increasing nearly
18%.
This price increase came despite a 4.4-
point increase in volume sold with
merchandising support during the year,
including an increase of 1.9 points in share
of volume with price-only support. For the
year, coffee sold nearly 40% of volume
with merchandising support, including 14%
of volume with price-only support.
43% 46%
51%
31% 33% 33%
59%
51% 51% 53%
Feature & Display
Display-Only Feature-Only Price-Only Any Merchandising
2011
2012
Growth in display only and price-only tactics has escalated, while combined feature/display activity has slowed.
Source: SymphonyIRI Market Advantage™; 52 weeks ending 12/2/2012 and same period prior year
Merchandising Trends: Supporting the Value Proposition
Page 7
7
© Copyright 2013 SymphonyIRI Group, Inc. All rights reserved.
Top 10 Categories by Merchandising Activity Level Multi-Outlet + Convenience
% Volume, Any Merchandising
46%
46%
49%
49%
50%
50%
51%
51%
51%
62%
Frankfurters
Crackers
Salty Snacks
Breakfast Meats
Fz Pizza
Mexican Foods
Chocolate Candy
Ice Cream/Sherbet
Sports Drinks
Carbonated Beverages
Point Change
vs Prior Year
(2.4)
(0.3)
+2.4
+1.6
(1.5)
+1.2
+0.6
+0.1
(2.4)
+2.3
Merchandising Activity: Most Active Categories
Marketers are investing merchandising
dollars in an effort to raise the profile of
categories that cater to home-based eating
and drinking rituals and underscore the
value propositions they offer across these
categories. All of the 10 most
heavilymerchandised categories across the
multi-outlet plus convenience geography
are food or beverage categories.
Across six of these 10 categories,
merchandising support increased during
the past year. This rate of increase is
slightly higher than the industry average of
53%.
In the ice cream/sherbet category, share of
volume sold with merchandising support
increased 2.4 points in 2012. Ice
cream/sherbet is an important frozen foods
category, representing more than 13% of
department sales.1 And, with 43% of
consumers buying treats like ice cream for
at-home enjoyment, and even more often
than before the economic downturn began,
it’s a logical category to pursue for growth.2
With consumers placing increased focus on
preplanning their shopping trips, embracing
promotional strategies that begin to impact
the shopper before she enters the store is
well-advised. Ice cream/sherbet marketers
are on top of this opportunity, as evidenced
by an increase in share of ice
cream/sherbet volume sold with feature-
only support of nearly one point during the
past year.
levels, when 66% of volume was sold with
merchandising support. Carbonated
beverage manufacturers are making cuts
across a majority of measured tactics, with
feature only being the sole tactic to see an
increase during the past year.
Discussed in the December 2012 edition of
Times & Trends, declines in this area are
being influenced by a number of factors,
including increased private label presence
and retail-banner related merchandising
strategies.
This type of strategy is also being
embraced by marketers in other high-
activity level food and beverage categories,
including breakfast meats and carbonated
beverages, which saw share of volume
sold with feature support increase 1.0 and
0.5 points, respectively.
The carbonated beverages category has
historically relied heavily on merchandising
to spur purchase behavior. In fact, today,
62% of volume is sold with some type of
merchandising support. While high, this
figure represents a decline versus 2010
Merchandising support of categories that serve home-based food rituals is strong, though some categories have dialed back
merchandising levels during the past year.
Source: SymphonyIRI Market Advantage™; 52 weeks ending 12/2/2012 and same period prior year
Merchandising Trends: Supporting the Value Proposition
1Source: SymphonyIRI InfoScan Reviews, September 2012; 2 SymphonyIRI MarketPulse Survey Q4 2012
Page 8
8
© Copyright 2013 SymphonyIRI Group, Inc. All rights reserved.
CPG Categories with the Largest Increases/Decreases in Merchandising Activity Level Multi-Outlet + Convenience
% Volume, Any Merchandising: Point Change versus Prior Year
2.4
2.4
2.6
2.7
2.9
3.0
3.1
3.3
4.4
4.7
Ice Cream/Sherbet
Fz Novelties
Mayonnaise
Blades
Fresh Eggs
Luncheon Meats
Pasta
Diapers
Coffee
Batteries
-1.9
-2.2
-2.4
-2.4
-2.5
-2.9
-3.3
-4.3
-4.3
-9.1
Motor Oil
Fz Dinners/Entrees
Carbonated Beverages
Crackers
Shampoo
Fz Seafood
Fz Meat
Fz/Rfg Processed Poultry
Shelf Stable Seafood
Fz/Rfg Poultry
Merchandising Activity: Category Trends
Mentioned earlier in this report, 53% of
categories saw merchandising support
increase during the past year. In several
categories, share of volume sold with
merchandising support increased rather
substantially. These categories cut a wide
swath across the retail store.
Across all of the 10 categories
experiencing the largest increase in
merchandising support, average price per
volume has increased during the same
time period. And, in each of these
categories, increases in price-only actions
are a key driver of overall increased rates
of merchandising support. In some
negative impact on brand equity—after
seeing a product on price cut frequently
and/or for an extended period, the
consumer will come to value the product
based on that lower price and consider the
―regular‖ price to be too high and,
therefore, not a good value.
Many categories show evidence of
marketers understanding and protecting
against these pitfalls. Of the 10 categories
where merchandising activity fell most
sharply, for instance, share of volume sold
with price-only support decreased in
seven. Nearly all of those declines were
greater than one percentage point.
instances, such as luncheon meats and
fresh eggs, price only was the sole tactic to
see an appreciable increase.
While in some categories, such as
aforementioned eggs and luncheon meats,
where price actions are most feasible due
to the need for products to be refrigerated/
frozen, marketers must beware of relying
too heavily on price only actions. First of
all, consumers have grown tired of
pervasive temporary price-cut tactics, as
evidenced by the fact that 66% of
categories have seen lift from price-only
actions decline during the past year.
Secondly, excessive price cutting has a
Note: Among 100 largest CPG categories, based upon MULOC dollar sales.
Changes to price-only actions are key drivers of merchandising trends across many CPG categories, with all of the categories that experienced the largest merchandising activity increases seeing price-only actions escalate and
most of the categories where merchandising activity decreased most sharply seeing price-only actions decline.
Source: SymphonyIRI Market Advantage™; 52 weeks ending 12/2/2012 and same period prior year
Merchandising Trends: Supporting the Value Proposition
Page 9
9
© Copyright 2013 SymphonyIRI Group, Inc. All rights reserved.
% Volume, Any Merchandising Among Leading Health & Beauty Care Categories
Drug vs Grocery Channel
23%
28%
30%
27%
40%
28%
36%
39%
46%
47%
Skin Care
Blades
Sanitary Napkins/Tampons
Diapers
Soap
Healthcare Beauty/Personal Care
17%
27%
31%
20%
45%
30%
42%
42%
46%
64%
Gastrointestinal Tablets
Cold/Allergy/Sinus Tablets
Weight Control/Nutrition Liq/Pwd
Internal Analgesics
Vitamins
Drug
Food
Merchandising Activity: Category Trends - Health & Beauty
Competition for share of spending across
health and beauty care categories has
escalated in recent years, as retailers look
to serve consumers’ self-reliant health and
beauty care behaviors. This is a big
opportunity. According to SymphonyIRI’s
MarketPulse Survey, 40% of consumers
are self-treating for simple ailments and
34% are embracing more do-it-yourself
beauty treatments in an effort to save
money.
To tap into opportunities in these
departments, retailers are using
merchandising to emphasize their value
proposition. For drug retailers, who have
long been considered a destination for
health and beauty purchases, efforts to
protect and grow share are strong. Today,
drug retailers sell an average 32%
Clearly, opportunities across health and
beauty aisles are ripe for grocery retailers,
as well. Still, within grocery, focus on
merchandising support is not quite as
strong as it is in drug.
In grocery, 21% and 27% of health and
beauty volume, respectively, is sold with
merchandising support. And, while
merchandising support has increased
across 49% of beauty categories and 58%
of healthcare categories during the past
year, many of the largest categories in
those departments, including diapers and
internal analgesics, sell less volume with
merchandising support today than they did
in 2009.
of healthcare volume with merchandising
support. This figure has increased four
points during the past several years, with
increases cutting across a majority of
healthcare categories.
Some of those increases have been quite
large. For instance, 64% of vitamin volume
was sold with merchandising support
during the past year, versus 53% in 2009.
In internal analgesics, 46% of volume was
sold with merchandising support in 2012,
up from 33% in 2009.
Beauty categories, too, are enjoying
increased merchandising support within
the drug channel. Today, an average 38%
of the drug channel’s beauty sales are
supported by merchandising, up from 34%
in 2009.
Drug retailers are escalating merchandising support across key health and beauty care categories more quickly versus the grocery channel.
Source: SymphonyIRI Market Advantage™; 52 weeks ending 12/2/2012 and same period prior year
Merchandising Trends: Supporting the Value Proposition
Page 10
10
© Copyright 2013 SymphonyIRI Group, Inc. All rights reserved.
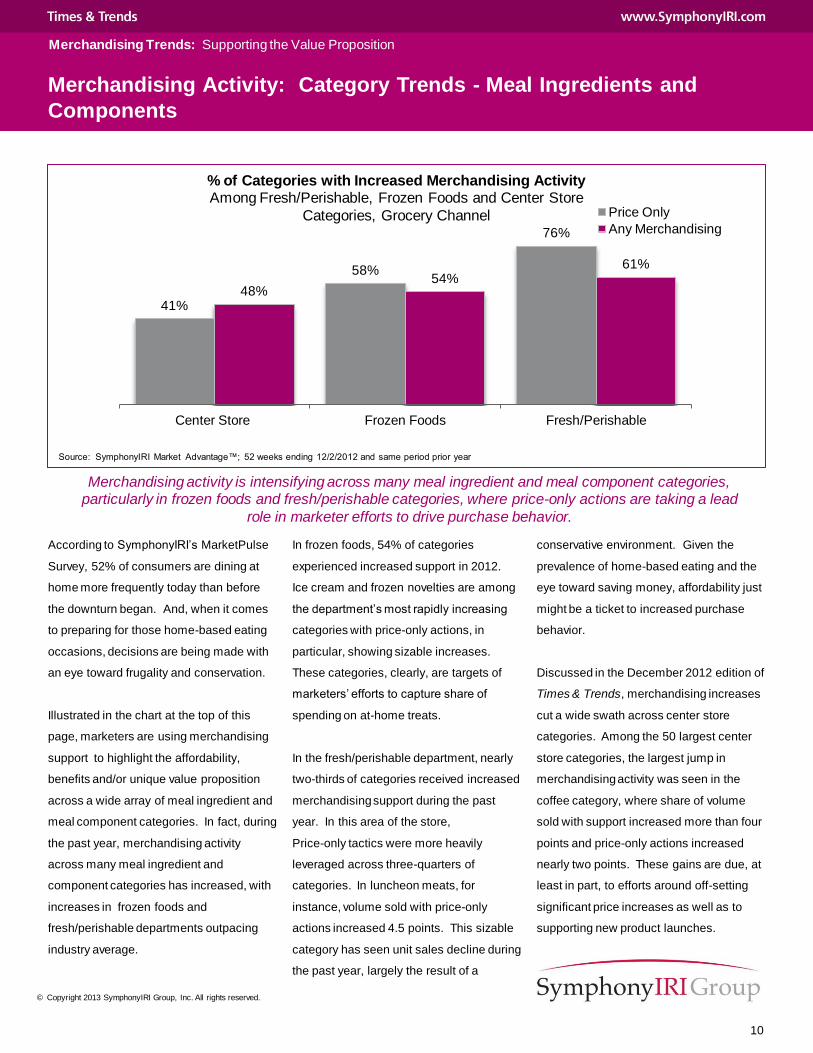
% of Categories with Increased Merchandising Activity Among Fresh/Perishable, Frozen Foods and Center Store
Categories, Grocery Channel
41%
58%
76%
48% 54%
61%
Center Store Frozen Foods Fresh/Perishable
Price Only
Any Merchandising
Merchandising Activity: Category Trends - Meal Ingredients and
Components
According to SymphonyIRI’s MarketPulse
Survey, 52% of consumers are dining at
home more frequently today than before
the downturn began. And, when it comes
to preparing for those home-based eating
occasions, decisions are being made with
an eye toward frugality and conservation.
Illustrated in the chart at the top of this
page, marketers are using merchandising
support to highlight the affordability,
benefits and/or unique value proposition
across a wide array of meal ingredient and
meal component categories. In fact, during
the past year, merchandising activity
across many meal ingredient and
component categories has increased, with
increases in frozen foods and
fresh/perishable departments outpacing
industry average.
conservative environment. Given the
prevalence of home-based eating and the
eye toward saving money, affordability just
might be a ticket to increased purchase
behavior.
Discussed in the December 2012 edition of
Times & Trends, merchandising increases
cut a wide swath across center store
categories. Among the 50 largest center
store categories, the largest jump in
merchandising activity was seen in the
coffee category, where share of volume
sold with support increased more than four
points and price-only actions increased
nearly two points. These gains are due, at
least in part, to efforts around off-setting
significant price increases as well as to
supporting new product launches.
In frozen foods, 54% of categories
experienced increased support in 2012.
Ice cream and frozen novelties are among
the department’s most rapidly increasing
categories with price-only actions, in
particular, showing sizable increases.
These categories, clearly, are targets of
marketers’ efforts to capture share of
spending on at-home treats.
In the fresh/perishable department, nearly
two-thirds of categories received increased
merchandising support during the past
year. In this area of the store,
Price-only tactics were more heavily
leveraged across three-quarters of
categories. In luncheon meats, for
instance, volume sold with price-only
actions increased 4.5 points. This sizable
category has seen unit sales decline during
the past year, largely the result of a
Merchandising activity is intensifying across many meal ingredient and meal component categories, particularly in frozen foods and fresh/perishable categories, where price-only actions are taking a lead
role in marketer efforts to drive purchase behavior.
Source: SymphonyIRI Market Advantage™; 52 weeks ending 12/2/2012 and same period prior year
Merchandising Trends: Supporting the Value Proposition
Page 11
11
© Copyright 2013 SymphonyIRI Group, Inc. All rights reserved.
% of Categories w/ Private Label Merchandising Activity Below Average*
By Merchandising Tactic
Multi-Outlet + Convenience
*Note: Based on % volume with merchandising for total category versus private label
Merchandising Activity: Category Trends - Private Label
has improved somewhat, nine out of 10 of
those shoppers will continue to buy more
private label in the coming year. 2
Additionally, nearly two-thirds of shoppers
are making a shopping list before entering
the retail store, and many of these list-
makers are avoiding purchases that are
not on their lists.3 Together, these trends
underscore the need for private label
marketers to rethink their merchandising
strategies.
Name brand marketers, too, must embrace
and act upon these critical shopper
behaviors. The need to begin to impact
shoppers outside the retail environment is
high and trends indicate that this need will
remain high in the foreseeable future.
merchandising. For instance, today, three
out of four consumers are making CPG
purchase decisions before they enter the
store. Yet, two-thirds of private label
products receive lower-than-average
feature-only support and three-quarters
receive below average combined feature
and display support. In addition, half of
these products saw feature-only support
increase and one-quarter saw combined
feature and display support increase
between 2009 and 2012. When it comes
to these categories, private label marketers
are missing the opportunity to proactively
influence those decisions that are being
made outside the store environment.
As a result of the economic downturn, 49%
of shoppers are buying more private label
today. 1 And, even though the economy
71%
60% 64% 62% 64%
73%
61% 65%
62% 63%
Feature & Display Display-Only Feature-Only Price-Only Any
2011
2012
In general, private brands receive less merchandising support versus their name-brand competitors.
Source: SymphonyIRI Market Advantage™; 52 weeks ending 12/2/2012 and same period prior year
Merchandising Trends: Supporting the Value Proposition
Nearly two-thirds of private label products
receive less merchandising support than
their name brand counterparts. This trend
holds true across measured merchandising
tactics.
Undoubtedly, private label marketers have
done a phenomenal job of elevating the
profile and reputation of their house
brands. Private label penetration is
essentially 100% and, according to
SymphonyIRI’s 2012 Brand & Retailer
Survey, four out of five consumers view
private label solutions as having equal to or
better quality versus than their name brand
counterparts.
Still, private label marketers are missing an
opportunity when it comes to supporting
their own brands with higher levels of
1Source: SymphonyIRI MarketPulse Survey Q4 2012; 2 SIC; 3 SIC
Page 12
12
© Copyright 2013 SymphonyIRI Group, Inc. All rights reserved.
% of CPG Categories by Average Merchandising Lift
2011 & 2012 Multi-Outlet + Convenience
% of CPG Categories with Reduced Merchandising Lift
2011 & 2012 Multi-Outlet + Convenience
Today, 47% of categories receive average
lift of less than 50% from merchandising
support. These categories cut a wide
swath across CPG aisles and include such
categories as milk, dog food and
cold/allergy/sinus tablets. Illustrated on the
following page of this report, even
categories that receive the biggest bump
from merchandising support have seen lift
slide during the past year.
geography. Similar to industry average,
the grocery and drug channels have seen
average lift fall across 70% and 73% of
categories, respectively.
Lift is falling—sometimes rather
significantly—across a wide array of CPG
categories, including some of the most
heavily merchandised categories, detailed
earlier in this report.
For instance, carbonated beverages, which
sells more than 60% of volume with
merchandising support, saw lift decline
more than 14 points during the past year.
And, Mexican foods, which sells half of its
volume with merchandising support, saw
lift slide more than five points during the
same period.
Merchandising Effectiveness: Total CPG
39%
46%
12%
3%
47% 41%
10%
2%
0-49.9% 50-99.9% 100-149.9% 150+%
2011
2012
50% 46% 55%
80% 70% 73%
MULOC Grocery Drug
2011
2012
Lift from merchandising support has declined across a strong majority of categories and, today, nearly half of categories achieve lift of less than 50% from merchandising programs.
% Lift
Merchandising Trends: Supporting the Value Proposition
Source: SymphonyIRI Market Advantage™; 52 weeks ending 12/2/2012 and
same period prior year Source: SymphonyIRI Market Advantage™; 52 weeks ending 12/2/2012 and
same period prior year
Merchandising has many purposes. It is
used to drive awareness of new products,
communicate product benefits and
differentiate a product from its competitors.
Another obvious goal of merchandising is
to spur consumers into action. Generally,
the desired action is to make a purchase.
Merchandising that accomplishes this goal
is said to have achieved sales lift.
The magnitude of lift achieved with
merchandising support varies across
tactics and categories. But, on the whole
and during the past couple of years,
merchandising lift has changed rather
drastically.
In 2012, average lift from merchandising
support declined across 80% of categories
within the multi-outlet plus convenience
Page 13
13
© Copyright 2013 SymphonyIRI Group, Inc. All rights reserved.
% Volume w/ Any
Merch.
Change in % Inc in
Volume w/ Merch
Top 10 CPG Categories by Merchandising Lift Multi-Outlet + Convenience
2012
% Volume Increase w/ Any Merch. Support
119%
120%
122%
126%
129%
129%
129%
133%
134%
142%
Frankfurters
Chocolate Candy
Pasta
Shelf Stable Vegetables
Toilet Tissue
Spaghetti/Italian Sauce
Shortening & Oil
Breakfast Meats
Paper Towels
Shelf Stable Seafood (39.5)
(13.7)
(1.0)
(17.2)
+0.1
(11.7)
(6.5)
(7.9)
(6.4)
(14.0)
Merchandising Effectiveness: Leading Categories
26.9%
36.6%
48.9%
29.7%
36.9%
35.9%
35.0%
41.9%
50.6%
45.8%
CPG marketers are receiving large sales
boosts from merchandising support across
a wide variety of food and key ―staple‖
categories. But, mentioned earlier in this
report, lift has declined across a vast
majority of CPG categories.
One of the key drivers of this decline
trends around pantry stocking. Many of
the categories on the chart at the top of
this page are ―stock up‖ categories—
consumers tend to view sales/promotions
as a good opportunity to beef up or
replenish their supply. But, according to
SymphonyIRI’s MarketPulse survey, 40%
of consumers are making purchases on an
According to a recent Capgemini study, an
estimated 90% of trade promotions have
negative return on investment (ROI) when
issues like cannibalization and execution
costs are considered. But, this need not
be the case. Today, analytic models and
simulator software allow manufacturers
and retailers to evaluate past events and
simulate ―what if‖ scenarios in a way that
will help to identify optimal promotional mix
at a category/brand and/or account level,
and this can significantly reduce—even
eliminate—negative ROI events.
―as needed‖ basis rather than stocking up
in order to keep their weekly budget in
check. This change in mindset has directly
impacted lift achieved by some of these
categories.
The broad-based declines that mark
today’s CPG industry underscore the fact
that ―the old way‖ of doing things is simply
not as impactful as it was in the past.
Marketers need to continue to
merchandise their products, but they must
re-evaluate the strategies used to do so.
Average lift from merchandising is well over 100% across a wide variety of food and “staple” categories, but merchandising impact has lessened across many categories.
Source: SymphonyIRI Market Advantage™; 52 weeks ending 12/2/2012
Note: Among the top 100 CPG categories, based on dollar sales
Merchandising Trends: Supporting the Value Proposition
1Source: Capgemini, A Winning Strategy for Trade Promotion Management
Page 14
14
© Copyright 2013 SymphonyIRI Group, Inc. All rights reserved.
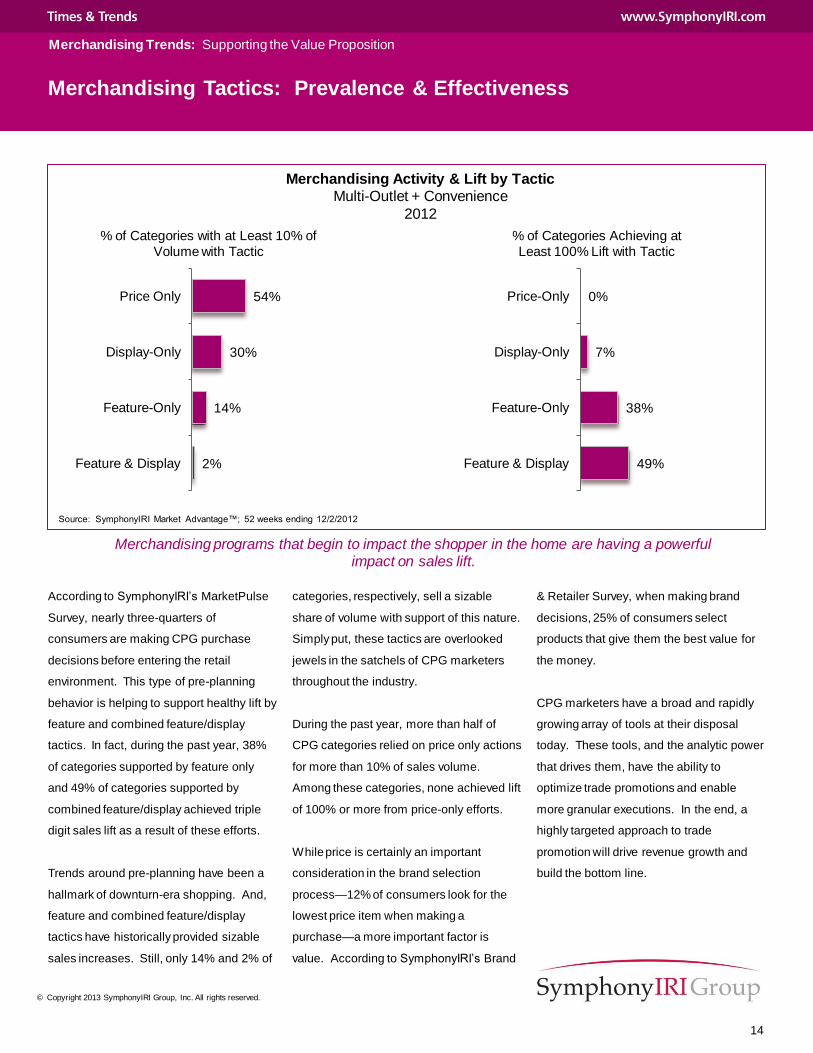
Merchandising Activity & Lift by Tactic Multi-Outlet + Convenience
2012
49%
38%
7%
0%
Feature & Display
Feature-Only
Display-Only
Price-Only
2%
14%
30%
54%
Feature & Display
Feature-Only
Display-Only
Price Only
% of Categories with at Least 10% of
Volume with Tactic
% of Categories Achieving at
Least 100% Lift with Tactic
Merchandising Tactics: Prevalence & Effectiveness
& Retailer Survey, when making brand
decisions, 25% of consumers select
products that give them the best value for
the money.
CPG marketers have a broad and rapidly
growing array of tools at their disposal
today. These tools, and the analytic power
that drives them, have the ability to
optimize trade promotions and enable
more granular executions. In the end, a
highly targeted approach to trade
promotion will drive revenue growth and
build the bottom line.
According to SymphonyIRI’s MarketPulse
Survey, nearly three-quarters of
consumers are making CPG purchase
decisions before entering the retail
environment. This type of pre-planning
behavior is helping to support healthy lift by
feature and combined feature/display
tactics. In fact, during the past year, 38%
of categories supported by feature only
and 49% of categories supported by
combined feature/display achieved triple
digit sales lift as a result of these efforts.
Trends around pre-planning have been a
hallmark of downturn-era shopping. And,
feature and combined feature/display
tactics have historically provided sizable
sales increases. Still, only 14% and 2% of
categories, respectively, sell a sizable
share of volume with support of this nature.
Simply put, these tactics are overlooked
jewels in the satchels of CPG marketers
throughout the industry.
During the past year, more than half of
CPG categories relied on price only actions
for more than 10% of sales volume.
Among these categories, none achieved lift
of 100% or more from price-only efforts.
While price is certainly an important
consideration in the brand selection
process—12% of consumers look for the
lowest price item when making a
purchase—a more important factor is
value. According to SymphonyIRI’s Brand
Merchandising programs that begin to impact the shopper in the home are having a powerful impact on sales lift.
Source: SymphonyIRI Market Advantage™; 52 weeks ending 12/2/2012
Merchandising Trends: Supporting the Value Proposition
Page 15
15
© Copyright 2013 SymphonyIRI Group, Inc. All rights reserved.
Trends to Watch
Technology-driven programs deployed
over digital media and previously
mentioned shopper marketing programs
will see increases, at the expense of more
traditional television and trade promotion
programs.
Technological advances continue to
provide marketers new opportunities and
manners of engaging and informing
shoppers. Savvy marketers will stay
abreast of advances, and continually seek
the opportunity to embrace tools that reach
and resonate with their core and target
shoppers most effectively.
and in-store programs. To accomplish this
feat, savvy companies are changing the
way they do business, embracing new
technologies and analytics in a way that
allows them to identify individual shoppers,
rather than markets or segments. With this
intimate knowledge, marketers are working
to satisfy consumers’ quest for unique and
memorable shopping experiences.
Technology
According to The Path to Purchase
Institute’s Trends 2013 report, promotional
budgets will undergo noteworthy shifts
during the upcoming year.
Forecasted Change to Advertising/Promotion Budget During the Next Year % of Respondents
Source: Path to Purchase Marketing Institute, Shopper Marketing, Trends 2013
27%
37%
12%
11%
5%
53%
44%
55%
42%
21%
20%
20%
32%
47%
74%
Trade Promotions
Traditional Media (TV, print, etc.)
Consumer Promotions
Shopper Marketing
Digital Media (mobile, paid search, etc.)
Budget Decrease Stay the Same Budget Increase
What is your forecast for your advertising and promotion mix over the next year?
CPG marketers are adopting new strategies aimed at capitalizing on new technologies and building more targeted, impactful relationships with consumers.
Evolving trends around in-store marketing
are enabling CPG marketers to rewire their
marketing strategies in a manner that
allows messages to reach target shoppers
early, often and with a high level of
relevance.
Shopper Marketing
Detailed in the May 2012 edition of Times
& Trends, the shopper is in control of
today’s CPG marketplace. It is the job of
the effective marketer to provide shoppers
highly relevant products and support those
products with personal and customized
messages delivered through highly
targeted, direct-to-shopper marketing
Merchandising Trends: Supporting the Value Proposition
Page 16
16
© Copyright 2013 SymphonyIRI Group, Inc. All rights reserved.
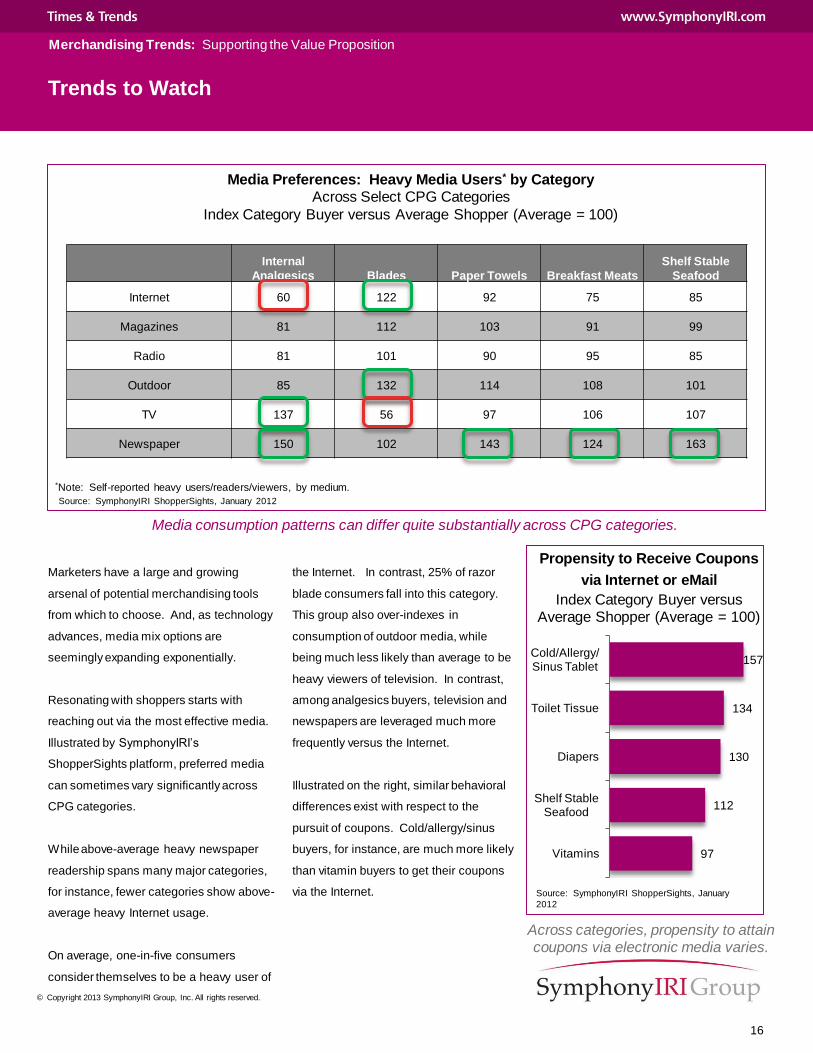
Internal
Analgesics Blades Paper Towels Breakfast Meats
Shelf Stable
Seafood
Internet 60 122 92 75 85
Magazines 81 112 103 91 99
Radio 81 101 90 95 85
Outdoor 85 132 114 108 101
TV 137 56 97 106 107
Newspaper 150 102 143 124 163
Media Preferences: Heavy Media Users* by Category Across Select CPG Categories
Index Category Buyer versus Average Shopper (Average = 100)
Marketers have a large and growing
arsenal of potential merchandising tools
from which to choose. And, as technology
advances, media mix options are
seemingly expanding exponentially.
Resonating with shoppers starts with
reaching out via the most effective media.
Illustrated by SymphonyIRI’s
ShopperSights platform, preferred media
can sometimes vary significantly across
CPG categories.
While above-average heavy newspaper
readership spans many major categories,
for instance, fewer categories show above-
average heavy Internet usage.
On average, one-in-five consumers
consider themselves to be a heavy user of
the Internet. In contrast, 25% of razor
blade consumers fall into this category.
This group also over-indexes in
consumption of outdoor media, while
being much less likely than average to be
heavy viewers of television. In contrast,
among analgesics buyers, television and
newspapers are leveraged much more
frequently versus the Internet.
Illustrated on the right, similar behavioral
differences exist with respect to the
pursuit of coupons. Cold/allergy/sinus
buyers, for instance, are much more likely
than vitamin buyers to get their coupons
via the Internet.
Media consumption patterns can differ quite substantially across CPG categories.
Source: SymphonyIRI ShopperSights, January 2012
Merchandising Trends: Supporting the Value Proposition
*Note: Self-reported heavy users/readers/viewers, by medium.
97
112
130
134
157
Vitamins
Shelf Stable Seafood
Diapers
Toilet Tissue
Cold/Allergy/Sinus Tablet
Propensity to Receive Coupons
via Internet or eMail
Index Category Buyer versus Average Shopper (Average = 100)
Across categories, propensity to attain coupons via electronic media varies.
Source: SymphonyIRI ShopperSights, January
2012
Trends to Watch
Page 17
17
© Copyright 2013 SymphonyIRI Group, Inc. All rights reserved.
Identify new growth opportunities and threats
- Establish a solid everyday pricing strategy for each of your categories/brands,
and supplement with highly targeted, tactical temporary price reductions to
capitalize on existing/emerging short-term opportunities
- Evaluate merchandising activity and lift across your brands versus total category
and competitors across key retail partners to identify gaps
- Collaborate with key retailer partners to identify and test new marketing
vehicles/tactics within and outside the store environment, and across traditional
and new media
Work with key accounts to develop strategies that address market and store-level
shopping patterns and needs
- Invest to understand how your categories/brands fit into your key/target shoppers’
lifestyle and needs story and into the broader goals and objectives of key retail
partners, then develop marketing programs that tie into those avenues
- Continually re-evaluate pricing and merchandising initiatives to ensure they
reinforce your brand equity, and clearly communicate your value proposition to
key consumer targets
- Frequently refresh promotions to remain in lock step with evolving economic and
market conditions and stand out from competitors
Continually measure and monitor pricing and merchandising execution and impact
- Monitor store-level merchandising performance and retail execution among key
retail partners and adjust mid-path, as warranted
- Carefully test all pricing and merchandising initiatives at a micro level prior to roll
out and then closely monitor impact of roll out
Manufacturers seeking to maximize opportunity within the new, emerging retail environment should
consider the following action items:
Conclusions: CPG Manufacturers
Merchandising Trends: Supporting the Value Proposition
Page 18
18
© Copyright 2013 SymphonyIRI Group, Inc. All rights reserved.
Identify new growth opportunities and threats
- Establish a solid everyday pricing strategy for each of your categories/brands,
and supplement with highly targeted, tactical temporary price reductions to
capitalize on existing/emerging short-term opportunities
- Continually assess channel trends and the impact of competitor merchandising
efforts on those trends to determine whether/when/how to adjust your own
merchandising-related efforts
- Build share and loyalty by cross-merchandising of relevant parallel
categories/products
- Stay abreast of new marketing vehicles/tactics, and analyze consumer response
to these new tools versus traditional techniques
Work with key manufacturer partners to develop strategies that address market and
store-level shopping patterns and needs
- Invest to gain a 360-degree understanding of trip drivers, in-store conversion, and
how core shoppers shop for a particular category and to meet their high-level
needs, then develop marketing programs that tie into those avenues
- Build cross-merchandising/cross-promotional programs that make parallel
products easier to locate/access
- When a manufacturer partner proposes a truly innovative program that meets the
needs of core shoppers, consider playing a role in helping to fund the initiative
Continually measure and monitor pricing and merchandising execution and impact
- Monitor merchandising programs at the store level for planned versus actual
performance and adjust mid-path, as warranted
- Use post-promotion analyses to evaluate the performance of past events, and
use that knowledge to continually improve future initiatives
Retailers seeking to maximize opportunity within the new, emerging retail environment should
consider the following action items:
Conclusions: CPG Retailers
Merchandising Trends: Supporting the Value Proposition
Page 19
19
© Copyright 2013 SymphonyIRI Group, Inc. All rights reserved.
Success Story: Category Manager Wins with Sports Promotion!
CHALLENGE
To promote its sponsorship of two regional
racing events and drive sales of its
products among sporting enthusiasts, the
category manager at a leading energy
drink brand approached a major American
retailer to propose an in-store promotion in
several markets where the racing events
were taking place.
Decision makers at the retailer requested
more details on how the profile of the
racing enthusiast lined up with their buyer
profile, so they could gauge the value of
participating in this promotion.
To provide the retailer with detailed and
insightful analysis, the energy drink
category manager asked SymphonyIRI to
provide information to secure placement of
the in-store promotion. He then said that
he needed that information in 24 hours!
APPROACH
Initially, the energy drink manager intended
to segment the retailer’s shoppers by
income to determine which stores were
better suited to support the promotion.
However, SymphonyIRI’s analysis
revealed there was not a correlation
between income and preference to attend
racing events.
RESULTS
Retailer decision makers approved the
energy drink category manager’s proposal
and agreed to place the promotion in
targeted individual stores within its two
divisions. The promotion was shipped to
80 highly targeted stores, about one third
of the stores in two regions.
BENEFITS
Within 24 hours of the request,
SymphonyIRI provided valuable statistics
and research to convince retailer decision
makers to accept the promotion. As a
result, the energy drink manufacturer and
the retailer were able to agree to execute a
highly targeted in-store campaign, which is
expected to yield an estimated $250,000 in
incremental revenue for the manufacturer.
The SymphonyIRI team utilized
ShopperSights™, an innovative shopper
segmentation and targeting solution, to
build the racing fan profile. The team first
built a national racing event consumer
profile and, from that, developed nine
distinct regional profiles of racing fans,
each with a different income level and
variant demographics.
SymphonyIRI then researched large
markets in the target area near the racing
events and looked at stores that over-
indexed for racing enthusiasts and energy
drink brand consumers. This approach
validated that the promotion was in fact
appealing to the retailer’s shoppers at
specific stores. SymphonyIRI targeted
designated market areas (DMA) for
specific retailer stores, allowing for lower-
cost marketing and communications
support for this hyper-local promotion.
Merchandising Trends: Supporting the Value Proposition
Page 20
20
© Copyright 2013 SymphonyIRI Group, Inc. All rights reserved.
Resources
SymphonyIRI ShopperSights™ ShopperSights is a new consumer and shopper targeting
and segmentation solution, delivering actionable insights at
the individual household and store level.
To gain insight into opportunities that exist to leverage unique and actionable content about
consumers and shoppers, and analytical solutions and platforms that drive more effective
and efficient shopper marketing, contact your SymphonyIRI client service representative
regarding custom analyses leveraging the following resources:
SymphonyIRI Price & Trade
Advantage™ Price & Trade Advantage uses advanced analytic
techniques to provide insight on price sensitivities, gaps,
thresholds, competitive implications, and sales volume
decomposition to maximize sales and create the most
effective pricing and trade plans at retail.
Merchandising Trends: Supporting the Value Proposition
Powered by SymphonyIRI Liquid Data, Market Advantage
enables better, faster decisions with a broader level of
marketplace insight than ever before by delivering all edible
and non-edible categories in multiple business views,
ranging from total store, departments and aisles, to eating
occasions, corporate portfolio and brand franchise—all
drillable to the individual UPC level—as well as the ability to
customize category definitions and detailed product
segmentations.
SymphonyIRI Market
Advantage™
Page 21
21
© Copyright 2013 SymphonyIRI Group, Inc. All rights reserved.
FOR MORE INFORMATION
Please contact Susan Viamari at
[email protected]
with questions or comments about this
report.
Corporate Headquarters:
150 North Clinton Street
Chicago, IL 60661
Telephone: +1 312 726 1221
www.SymphonyIRI.com
About SymphonyIRI Group
SymphonyIRI Group, formerly named
Information Resources, Inc. (―IRI‖), is
the global leader in innovative solutions
and services for driving revenue and
profit growth in CPG, retail and
healthcare companies. SymphonyIRI
offers two families of solutions: Core IRI
solutions for market measurement and
Symphony Advantage solutions for
enabling new growth opportunities in
marketing, sales, shopper marketing
and category management.
SymphonyIRI solutions uniquely
combine content, analytics and
technology to deliver maximum impact.
SymphonyIRI helps companies create,
plan and execute forward-looking,
shopper-centric strategies across every
level of the organization. For more
information, visit
www.SymphonyIRI.com.
Merchandising Trends: Supporting the Value Proposition