166


Dedicated
To
My Loving Grand Mother (late) & Parents (late)
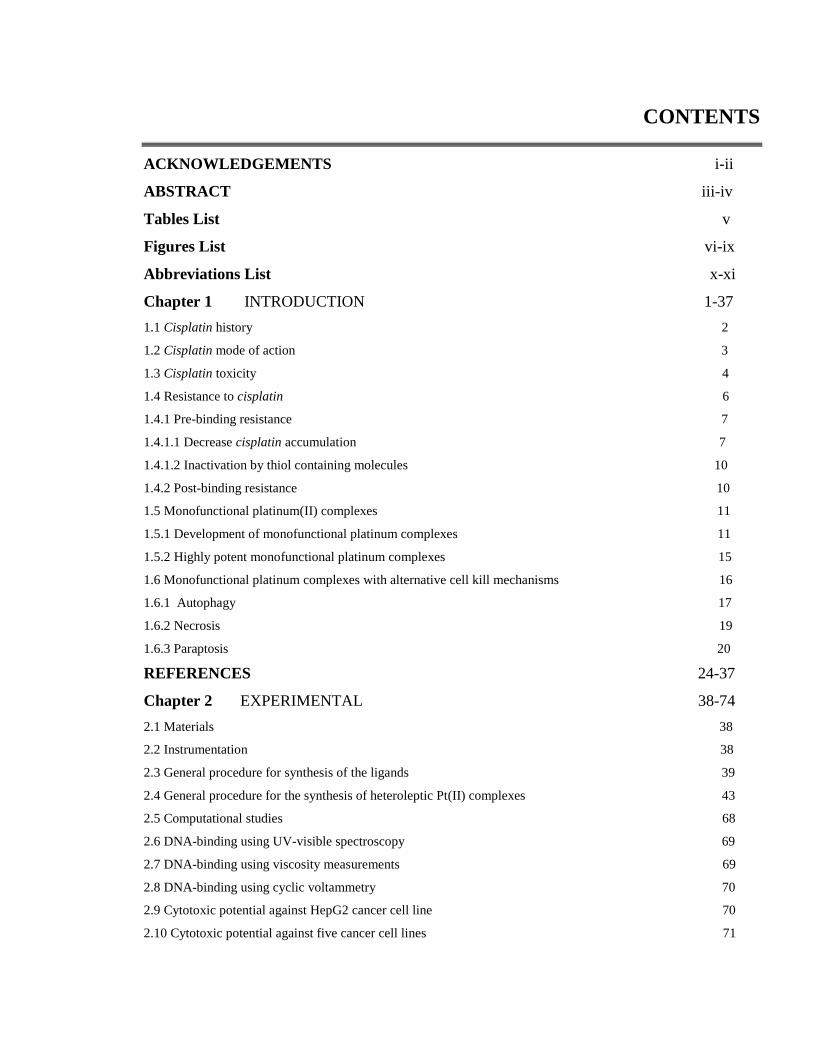
CONTENTS
ACKNOWLEDGEMENTS i-ii
ABSTRACT iii-iv
Tables List v
Figures List vi-ix
Abbreviations List x-xi
Chapter 1 INTRODUCTION 1-37
1.1 Cisplatin history 2
1.2 Cisplatin mode of action 3
1.3 Cisplatin toxicity 4
1.4 Resistance to cisplatin 6
1.4.1 Pre-binding resistance 7
1.4.1.1 Decrease cisplatin accumulation 7
1.4.1.2 Inactivation by thiol containing molecules 10
1.4.2 Post-binding resistance 10
1.5 Monofunctional platinum(II) complexes 11
1.5.1 Development of monofunctional platinum complexes 11
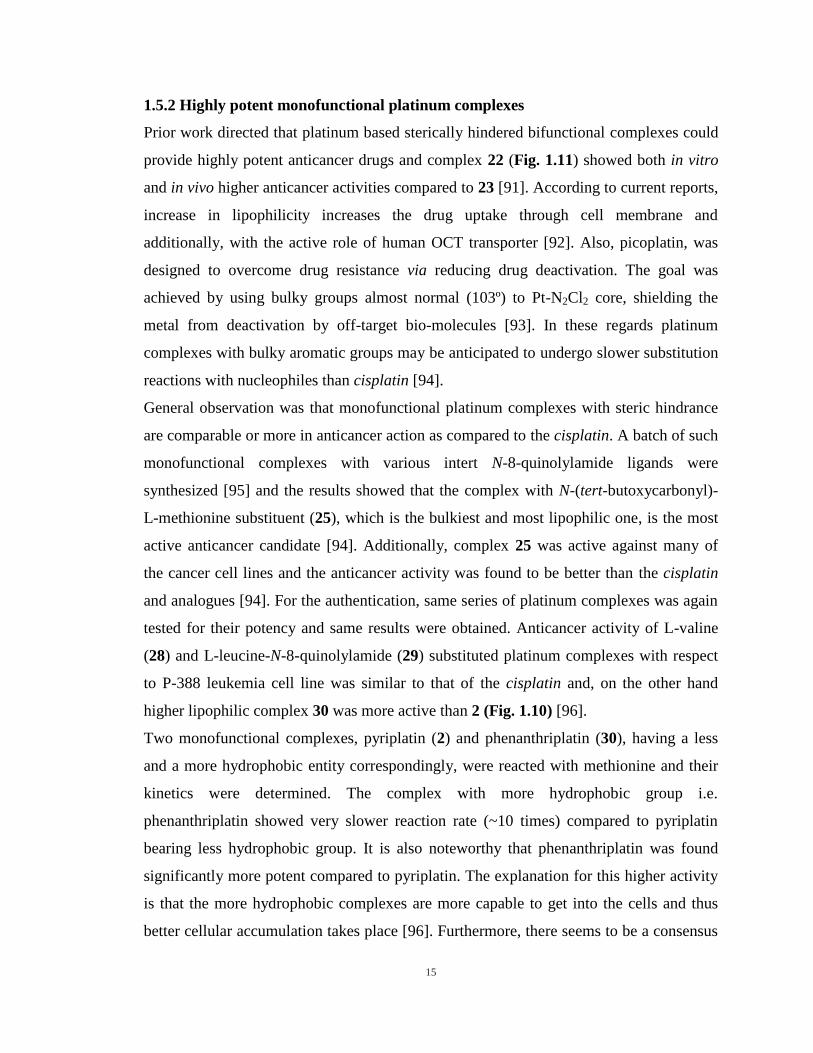
1.5.2 Highly potent monofunctional platinum complexes 15
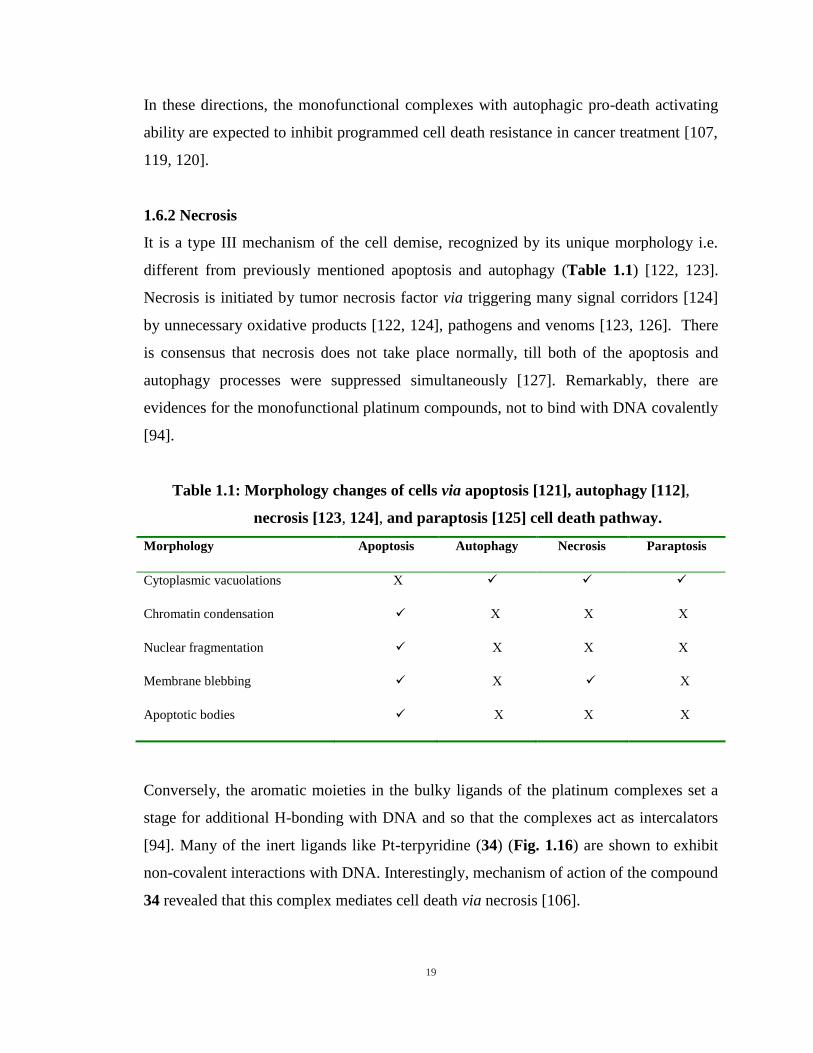
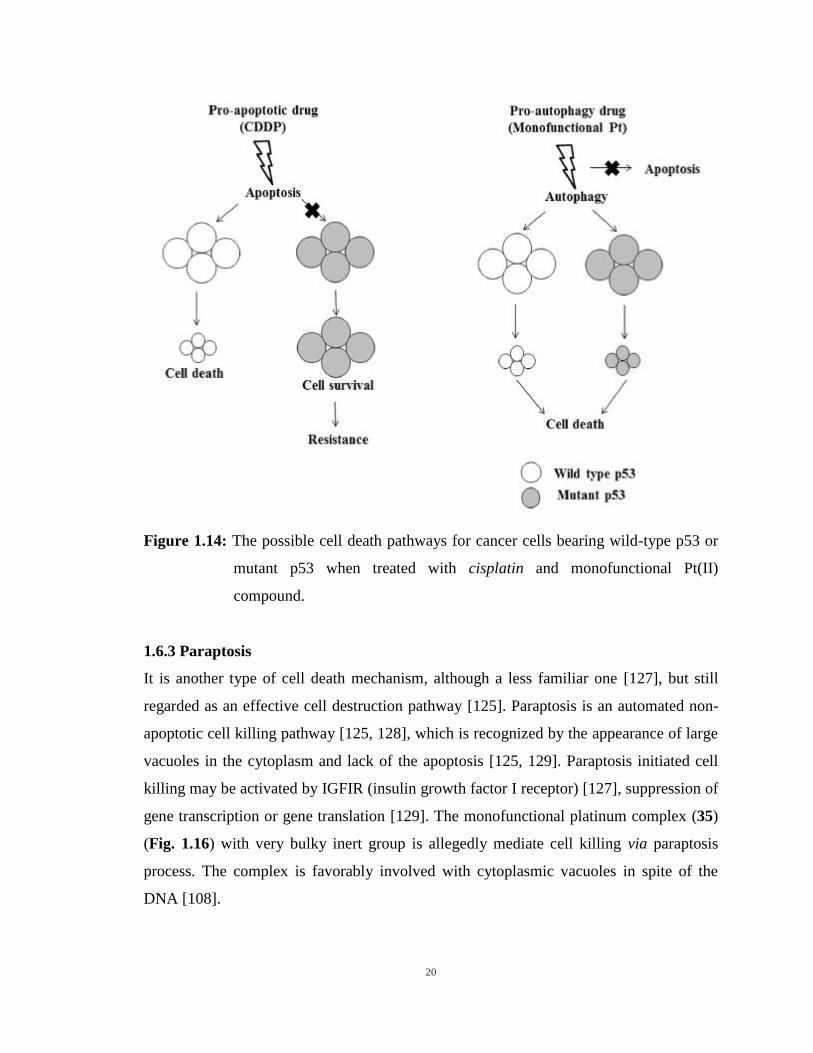
1.6 Monofunctional platinum complexes with alternative cell kill mechanisms 16
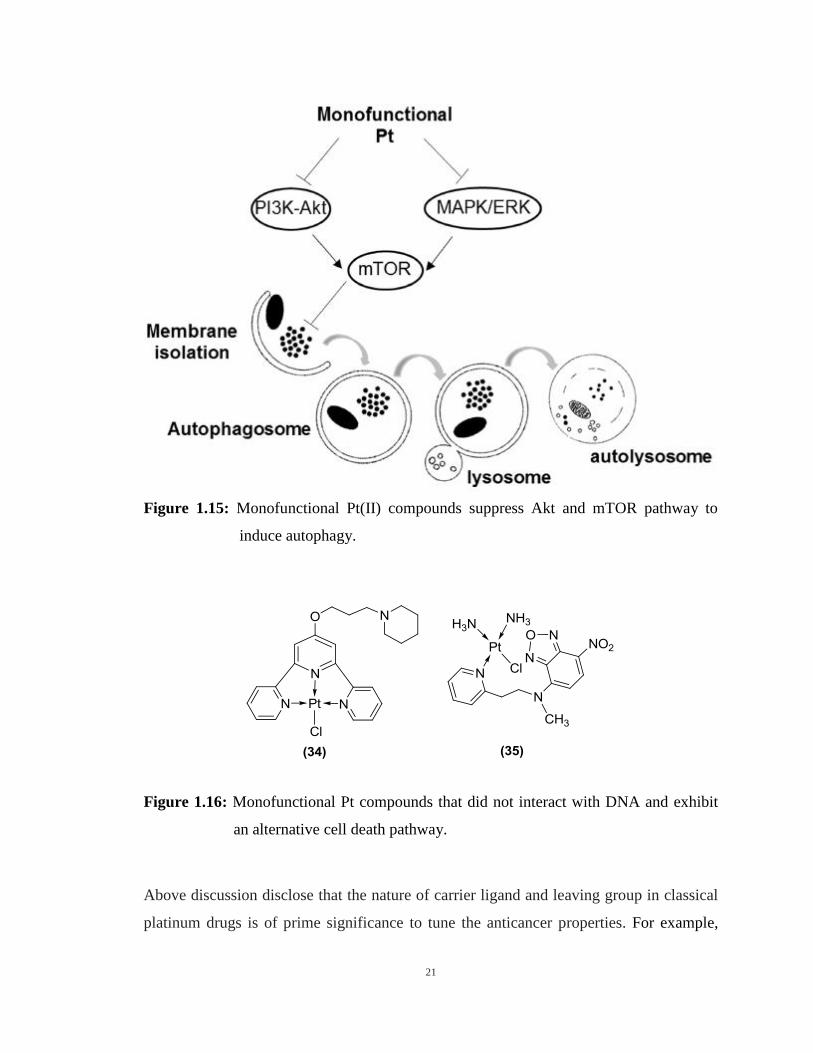
1.6.1 Autophagy 17
1.6.2 Necrosis 19
1.6.3 Paraptosis 20
REFERENCES 24-37
Chapter 2 EXPERIMENTAL 38-74
2.1 Materials 38
2.2 Instrumentation 38
2.3 General procedure for synthesis of the ligands 39
2.4 General procedure for the synthesis of heteroleptic Pt(II) complexes 43
2.5 Computational studies 68
2.6 DNA-binding using UV-visible spectroscopy 69
2.7 DNA-binding using viscosity measurements 69
2.8 DNA-binding using cyclic voltammetry 70
2.9 Cytotoxic potential against HepG2 cancer cell line 70
2.10 Cytotoxic potential against five cancer cell lines 71
2.11 Anticancer activity against LU and MCF-7 cancer cell lines 71
2.12 Cleavage of plasmid DNA 72
REFERENCE 73-74
Chapter 3 RESULTS AND DISCUSSION 75-122
3.1 FT-IR 75
3.2 1H NMR 75
3.3 13
C NMR 76
3.4 31
P NMR 77
3.5 Anticancer study 90
3.5.1 Anticancer activity against HepG2 cell line 90
3.5.2 Anticancer activity against five different cancer cell lines 92
3.5.3 Anticancer activity against LU human lung carcinoma, MCF-7 human breast adenocarcinoma 94
3.6 DNA-Interaction study 95
3.6.1 UV-Visible spectroscopy 96
3.6.2 Viscometry 103
3.6.3 Cyclic voltammetry 106
3.7 Plasmid DNA cleavage 110
3.8 Chloride exchange 112
REFERENCES 119-122
Chapter 4 CRYSTALLOGRAPHIC ANALYSIS AND DFT STUDIES 123-144
4.1 Single crystal X-ray analysis 123
4.2 Crystal packing 128
4.3 Theoretical studies 134
REFERENCES 142-144
CONCLUSION 145-146
LIST OF PUBLICATIONS 147

iii
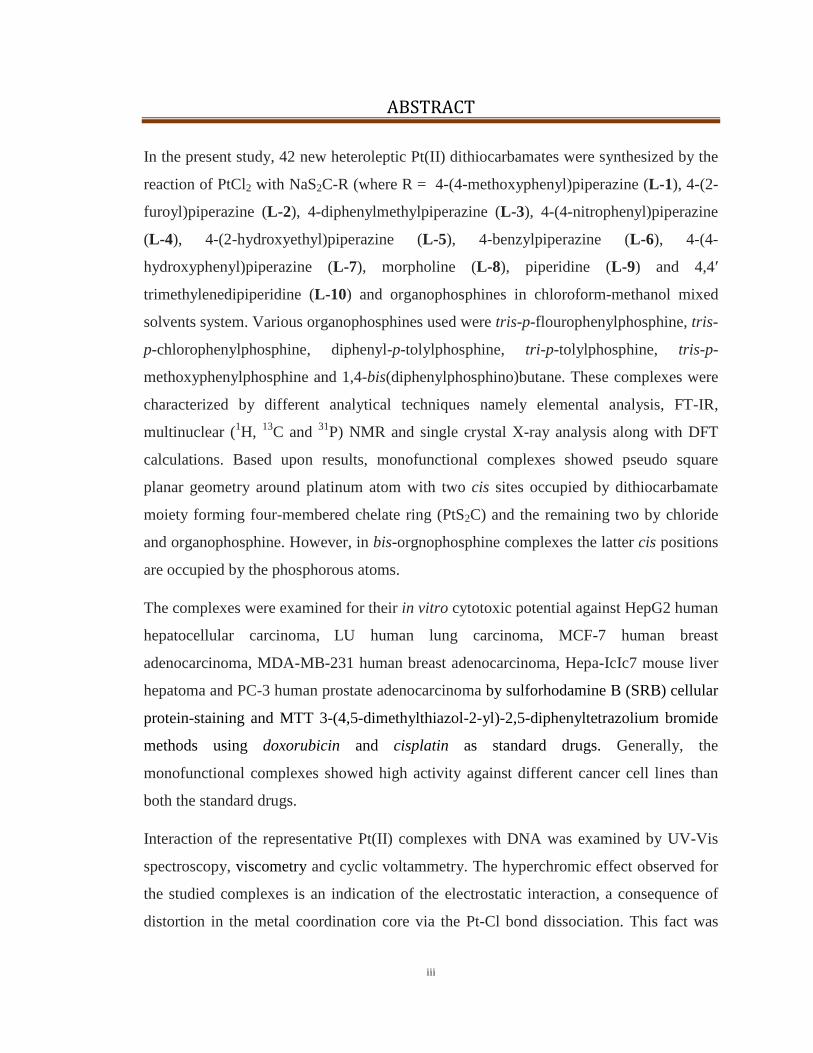
ABSTRACT
In the present study, 42 new heteroleptic Pt(II) dithiocarbamates were synthesized by the
reaction of PtCl2 with NaS2C-R (where R = 4-(4-methoxyphenyl)piperazine (L-1), 4-(2-
furoyl)piperazine (L-2), 4-diphenylmethylpiperazine (L-3), 4-(4-nitrophenyl)piperazine
(L-4), 4-(2-hydroxyethyl)piperazine (L-5), 4-benzylpiperazine (L-6), 4-(4-
hydroxyphenyl)piperazine (L-7), morpholine (L-8), piperidine (L-9) and 4,4ʹ
trimethylenedipiperidine (L-10) and organophosphines in chloroform-methanol mixed
solvents system. Various organophosphines used were tris-p-flourophenylphosphine, tris-
p-chlorophenylphosphine, diphenyl-p-tolylphosphine, tri-p-tolylphosphine, tris-p-
methoxyphenylphosphine and 1,4-bis(diphenylphosphino)butane. These complexes were
characterized by different analytical techniques namely elemental analysis, FT-IR,
multinuclear (1H,
13C and
31P) NMR and single crystal X-ray analysis along with DFT
calculations. Based upon results, monofunctional complexes showed pseudo square
planar geometry around platinum atom with two cis sites occupied by dithiocarbamate
moiety forming four-membered chelate ring (PtS2C) and the remaining two by chloride
and organophosphine. However, in bis-orgnophosphine complexes the latter cis positions
are occupied by the phosphorous atoms.
The complexes were examined for their in vitro cytotoxic potential against HepG2 human
hepatocellular carcinoma,
LU human lung carcinoma, MCF-7 human breast
adenocarcinoma, MDA-MB-231 human breast adenocarcinoma, Hepa-IcIc7 mouse liver
hepatoma and PC-3 human prostate adenocarcinoma by sulforhodamine B (SRB) cellular
protein-staining and MTT 3-(4,5-dimethylthiazol-2-yl)-2,5-diphenyltetrazolium bromide
methods using doxorubicin and cisplatin as standard drugs. Generally, the
monofunctional complexes showed high activity against different cancer cell lines than
both the standard drugs.
Interaction of the representative Pt(II) complexes with DNA was examined by UV-Vis
spectroscopy, viscometry and cyclic voltammetry. The hyperchromic effect observed for
the studied complexes is an indication of the electrostatic interaction, a consequence of
distortion in the metal coordination core via the Pt-Cl bond dissociation. This fact was

iv
further supported by viscometric and cyclic voltammetric results. Furthermore, in order
to get concert evidence regarding the labile nature of Pt-Cl bond, substitution of chloride
by various ligands was followed by FT-IR, 1H and
31P NMR. Plasmid DNA cleavage
studies by agarose gel electrophoresis revealed that these complexes have the ability to
convert super coiled DNA to nicked circular DNA.
v
Tables List
Table Title Page No
1.1: Morphology changes of cells via apoptosis, autophagy, necrosis, and paraptosis cell death pathway 19
3.1: 1H NMR data of the ligands (L1 and L2) and their Pt(II) complexes (1-10) 80
3.2: 1H NMR data of the ligands (L3 and L4) and their Pt(II) complexes (11-19) 81
3.3: 1H NMR data of the ligands (L5 and L6) and their Pt(II) complexes (20-28) 82
3.4: 1H NMR data of the ligands (L7 and L8) and their Pt(II) complexes (29-35) 83
3.5: 1H NMR data of the ligands (L9 and L10) and their Pt(II) complexes (36-42) 84
3.6: 13
C NMR and 31
P NMR data of the ligands (L1 and L2) and their Pt(II) complexes (1-10) 85
3.7: 13
C NMR and 31
P NMR data of the ligands (L3 and L4) and their Pt(II) complexes (11-19) 86
3.8: 13
C NMR and 31
P NMR data of the ligands (L5 and L6) and their Pt(II) complexes (20-28) 87
3.9: 13
C NMR and 31
P NMR data of the ligands (L7 and L8) and their Pt(II) complexes (29-35) 88
3.10: 13
C NMR and 31
P NMR data of the ligands (L9 and L10) and their Pt(II) complexes (36-42) 89
3.11: IC50 values of the selected Pt(II) complexes against HepG2 cell line 91
3.12: IC50 values (µM) of the complexes (1, 2 and 6) against five different cancer cell lines 93
3.13: IC50 values (µM) of the complexes against Lu and MCF-7 cancer cell lines 95 95
3.14: Binding constants (K) and Gibb’s free energies (ΔG) of selected Pt(II) complexes based upon
UV- visible spectroscopic data 97
3.15: 31
P NMR peaks (ppm) of the representative complexes in the presence of different exchangeable
ligands 115
4.1: Crystal data and structure refinement for the complexes 1, 2 and 6 125
4.2: Crystal data and structure refinement for the complexes 25 and 29 126
4.3: Selected bond lengths of the complexes 1, 2, 6, 25 and 29 127
4.4: Selected bond angles of the complexes 1, 2, 6, 25 and 29 127
4.5: Various weak non-covalent interactions (Å) forming 1D and 3D networks for crystal packing 133
4.6: Comparison of the selected bond lengths by theoretical and X-ray calculations for the complexes 1, 2,
6 and 25 136
4.7: Comparison of the selected bond angles by theoretical and X-ray calculations for the complexes 1, 2, 6
and 25 136
4.8: Pt···H and Pt···C distances (Å) of the optimized structures of the representative complexes 137
4.9: NBO atomic charges of representative complexes from natural population analysis 140
4.10: Molecular properties of representative complexes 141
vi
Figures List
Figure Title Page No
1.1: Structures of globally used platinum anticancer drugs. 3
1.2: Different pathways of cisplatin before and after it enters the cell. 4
1.3: Pathophysiological events in cisplatin nephrotoxicity. 5
1.4: Affected parts of cochlea during ototoxicity. 6
1.5: Schematic diagram of hCtr1 structure, showing 190 amino acid residues, each represented by a circle.
The extracellularly located N-terminus, and intracellularly located C-terminus are indicated. The N-
terminal region contains two each His-rich (yellow) and Met-rich (red) motifs. The C-terminal His/Cys
residues are also indicated. 8
1.6: Schematic diagram showing transport of copper and cisplatin in and out of the cell. 9
1.7: General structure of monofunctional platinum(II) complexes. 11
1.8: Structure of ethidium-containing monofunctional complex. 12
1.9: General structure of cationic monofunctional complexes active in the S180a, P388 and L1210 screen. 13
1.10: Structures of monofunctional complexes 2-21. 14
1.11: Structures of bifunctional (22-24) and monofunctional (25-30) Pt(II) complexes with increasing
hydrophobicity and enhanced anticancer activity. 16
1.12: Monofunctional Pt(II) complexes that form Pt-DNA crosslink to induce apoptosis of the cancer cells. 17
1.13: The fate of cancer cells when they are induced by stress. 18
1.14: The possible cell death pathways for cancer cells bearing wild-type p53 or mutant p53 when treated
with cisplatin and monofunctional Pt(II) compound. 20
1.15: Monofunctional Pt(II) compounds suppress Akt and mTOR pathway to induce autophagy. 21
1.16: Monofunctional Pt compounds that did not interact with DNA and exhibit an alternative cell death
pathway. 21
1.17: General structure of the complex having two inert ligands and a labile ligand 22
3.1: Resonance forms of the dithiocarbamic-NCSS moiety. 75
3.2: The 1H NMR spectrum of the representative ligand (L1). 77
3.3: The 1H NMR spectrum of the representative monofunctional Pt(II) complex (2). 78
3.4: The 13
C NMR spectrum of the representative ligand (L1). 78
3.5: The 13
C NMR spectrum of the representative monofunctional Pt(II) complex (2). 79
3.6: The 31
P NMR spectrum of the representative monofunctional Pt(II) complex (2). 79
3.7: Comparison of IC50 (µM) values of the representative compounds against HepG2 cell line. 91
3.8: Comparison of IC50 (µM) values of the representative compounds against HepG2 cell line. 92
3.9: Comparison of IC50 (µM) values of 1, 2 and 6 against five different cancer cell lines. 93
3.10: Structure of 1 showing to have hydrogen bonding ability due to presence of flouro moieties. 94
3.11: Structure of 6 showing to have hydrogen bonding ability due to presence of flouro moieties. 94
vii
3.12: Absorbance of 35µM complex (1) in the absence (a) and presence of (b) 5µM, (c) 15µM, (d) 20µM,
(e) 25µM and (f) 30 µM DNA. The inset graph represents the plot of Ao/A-Ao vs. 1/[DNA] (µM)-1
for
calculation of binding constant (K) and Gibb’s free energy (ΔG). 98
3.13: Absorbance of 25µM complex (2) in the absence (a) and presence of (b) 5µM, (c) 10µM, (d) 15µM,
(e) 20µM and (f) 25µM DNA. The inset graph represents the plot of Ao/A-Ao vs. 1/[DNA] (µM)-1
for
calculation of binding constant (K) and Gibb’s free energy (ΔG). 99
3.14: Absorbance of 25µM complex (6) in the absence (a) and presence of (b) 3µM, (c) 6µM, (d) 9µM, (e)
12µM, (f) 15 µM and (f) 18µM DNA. The inset graph represents the plot of Ao/A-Ao vs. 1/[DNA]
(µM)-1
for calculation of binding constant (K) and Gibb’s free energy (ΔG). 100
3.15: Absorbance of 60 µM complex (16) in the absence (a) and presence of (b) 3µM, (c) 6µM, (d) 9µM,
(e) 12µM, (f) 15 µM, (g) 18µM and (h) 21µM DNA. The inset graph represents the plot of Ao/A-Ao
vs. 1/[DNA] (µM)-1
for calculation of binding constant (K) and Gibb’s free energy (ΔG). 101
3.16: Absorbance of 100 µM complex (18) in the absence (a) and presence of (b) 5µM, (c) 10µM, (d)
15µM and (e) 20µM DNA. The inset graph represents the plot of Ao/A-Ao vs. 1/[DNA] (µM)-1
for
calculation of binding constant (K) and Gibb’s free energy (ΔG). 102
3.17: Absorbance of 100 µM complex (19) in the absence (a) and presence of (b) 5µM, (c) 10µM, (d)
15µM, (e) 20µM, (f) 25µM and (g) 30µM DNA. The inset graph represents the plot of Ao/A-Ao vs.
1/[DNA] (µM)-1
for calculation of binding constant (K) and Gibb’s free energy (ΔG). 103
3.18: Effects of increasing amounts of complexes 1-5 on the relative viscosities of CT-DNA at room
temperature, [DNA] = 100µM, r = [complex]/[DNA]. 104
3.19: Effects of increasing amounts of complexes 6-10 on the relative viscosities of CT-DNA at room
temperature, [DNA] = 100µM, r = [complex]/[DNA]. 104
3.20: Effects of increasing amounts of complexes 11-15 on the relative viscosities of CT-DNA at room
temperature, [DNA] = 100µM, r = [complex]/[DNA]. 105
3.21: Effects of increasing amounts of complexes 16-19 on the relative viscosities of CT-DNA at room
temperature, [DNA] = 100µM, r = [complex]/[DNA]. 105
3.22: Representative cyclic voltammogram of 1mM complex 2 in the absence of DNA (red) and in the
presence of 80 µM DNA (black) in DMSO with 0.5 M TBAP as supporting electrolyte at 50 mVs-1
scan rate. 106
3.23: Cyclic voltamograms of 1 mM complex 2 with 0.5 M TBAP as supporting electrolyte in the absence
(red) and presence of 20 μM DNA (green), 40 μM DNA (black), 60 μM DNA (blue) and 80 μM
DNA (orange) showing a decrease in current. 107
3.24: Representative plot of log (I/Io-I) versus log (1/[DNA]) for determination of binding constant of
complex (2). 107
3.25: Representative cyclic voltammogram of 1mM complex 2 at different (50-500 mVs-1
) scan rates in
DMSO with 0.5 M TBAP as supporting electrolyte. 108
viii
3.26: Representative cyclic voltammogram of 1mM complex 2 in the presence of 20 µM DNA at different
(50-500 mVs-1
) scan rates in DMSO with 0.5 M TBAP as supporting electrolyte. 108
3.27: Representative plot for determination of diffusion coefficients of free drug (2) and drug-DNA adduct. 109
3.28: Effect of complexes 4, 5, 7, 8, 9, 10, 11, 12, 13, 14, 18, 19 and 28 (50 µg/ml) on the cleavage of
pUC19 DNA(12.5 μg/ml) in Tris–HCl buffer (0.1 M, pH 7.4) at 37 °C after incubation for 6 h. Form
I = suppercoiled DNA, Form II = nicked circular DNA. 110
3.29: Effect of complexes 1, 2 and 6 (50 µg/ml) on the cleavage of pUC19 DNA (12.5 μg/ml) in Tris–HCl
buffer (0.1 M, pH 7.4) at 37 °C after incubation for 6 h. Form I = suppercoiled DNA, Form II =
nicked circular DNA. 110
3.30: Effect of concentration of complexes (a) 1 and (b) 4, on the cleavage of pUC19 DNA(12.5 μg/ml) in
Tris–HCl buffer (0.1 M, pH 7.4) at 37 °C after incubation for 6 h. 111
3.31: Comparison of IR spectra of representative complex 32 and its product 32a showing appearance of
new peaks due to thiocyanate attachment via N or S atom. 112
3.32: Comparison of 1HNMR spectra of representative complex 32 and its product 32a showing no change
in the peak positions. 112
3.33: Comparison of 31
P NMR spectra of the representative complex 32 and its product 32a showing small
upfield shift. 113
3.34: 31
P NMR spectra of the complex 32 (25 mM) in the presence of equal molar solution of iodide ions
recorded after 10, 20 and 30 min. of mixing. 114
3.35: 31
P NMR spectra of the complex 34 (25 mM) in the presence of excess of thiourea recorded after 2, 4
and 6 hours of mixing. 114
3.36: 31
PNMR spectra of the complex 32 (10 mM) in the presence of equal molar solution of
diethyldithiocarbamate recorded after different intervals of time. 115
3.37: Spectrum of change of absorbance with respect to time using diethyldithiocarbamate (110 µM) and
complex 32 (10 µM). Insight is the graphs between Ln ∆Abs verses time. 116
3.38: Spectrum of change of absorbance with respect to time using diethyldithiocarbamate (115 µM) and
complex 32 (10 µM). Inset is the graphs between Ln ∆Abs verses time. 117
3.39: Spectrum of change of absorbance with respect to time using diethyldithiocarbamate (120 µM) and
complex 32 (10 µM). Inett is the graphs between Ln ∆Abs verses time. 117
3.40: Spectrum of change of absorbance with respect to time using diethyldithiocarbamate (125 µM) and
complex 32 (10 µM). Insight is the graphs between Ln ∆Abs verses time. 118
3.41: Graph between apparent rate constants vs different concentrations of DT (diethyldithiocarbamate). 118
4.1: Structures of monofunctional complexes (1, 2, 6 and 25). 124
4.2: Structure of complex (29) showing pseudo-square planner geometry. 124
4.3: Crystal structures of the complexes (1, 2, 6, and 25) showing steric hindrance from aromatic C-H
groups of organophosphine, C-Pt distance (black), H-Pt distance (red). 130
4.4: 1D-supramolecular chains in 3D-crystal packing of 1, 2, 6 and 25. 131
ix
4.5: The 3D-crystal packing of 1 along b-axis (a), 2 along b-axis (b), 6 along a-axis (c) and 25 along b-axis
(d). 132
4.6: The crystal packing of 29, 1D-packing through methanol bridging (a), 3D-packing along a-axis (b). 134
4.7: Comparison of single crystal XRD structure (a) and optimized structure (b) of the representative
complex 2. 135
4.8: Optimized structures of the complexes (1 and 2) showing steric hindrance from aromatic C-H groups
of organophosphine, C-Pt distance (black), H-Pt distance (red). 137
4.9: Structures of representative monofunctional complexes having atomic charge at each atom
representing from color of each atom, assessed from natural population analysis. Change from green
or red to black represents change of atomic charge (positive or negative) towards neutrality. 138
4.10: Frontier orbitals of the representative complexes showing energy difference between HOMO and
LUMO orbitals. 139
1
Chapter 1
INTRODUCTION
Cancer or malignant tumor/neoplasm is a group of diseases involving uncontrolled
growth of abnormal cells in one body part and propagate to other organs with the passage
of time [1]. Cancer is caused by changes to genes that control the way our cells function,
especially how they grow or divide. There are mainly four types of genes, namely proto-
oncogenes (involved in normal cell growth), tumor suppressor genes (also involved in
controlling cell growth), DNA repair genes (involved in fixing damaged DNA) and self-
destruction genes (genes that direct a cell to die), which are affected and cause cancer.
There are over 100 diverse known cancers affecting human’s life [1], thus responsible for
14.6% of the total human deaths according to the world health organization (WHO) [2].
Chemotherapy, surgery, radiotherapy, hormone therapy, immunotherapy, biological
therapy, photodynamic therapy, hyperthermia, bone marrow and stem cell transplant or
their combination therapies are the main remedies which are being used to control
malignancy. Among these cancer healing strategies, chemotherapy, use of anticancer
drugs to treat cancerous cells, is being used from many years. There are variety of such
chemotherapeutics each with its own mechanism of action such as alkylating agents,
antitumor antibiotics, antimetabolites, antimicrotubule agents and platinum complexes.
Alkylating agents alter structure of the guanine base of DNA via alkyl substitution,
exemplified by nitrogen mustard (mechlorethamine, cyclophosphamide, chlorambucil,
melphalan and ifosfamide), nitrosureas (carmustine, lomustine and streptozocin),
alkylsulfonates (busulfan) etc. However, carcinogenicity to normal cells [3], cell-cycle
non-specific nature and high activity in resting phase of the cell are associated adverse
effects of this class of drugs.
Antitumor antibiotics are natural products produced by species of soil fungus
Streptomyces. These drugs are considered cell-cycle specific and interrupt DNA and
ultimately cells replication. Such drugs include anthracyclines (doxorubicin,
daunorubicin, epirubicin), chromomycins (dactinomycin, plicamycin) and miscellaneous
(mitomycin, bleomycin). Antimetabolites, chemicals having structural resemblance to
2
metabolites that they interfere with [4], induce cell death during the S phase of the cell
growth either incorporated into RNA and DNA or inhibit enzymes needed for nucleic
acid production [5]. Antimetabolites include methotrexate, fluoropyrimidines (e.g. 5FU,
capecitabine), cytocine arabinose (e.g. cytarabine), gemcitabine etc. Antimicrotubule
agents {taxanes (docetaxel and paclitaxel), Vinca alkaloids (vincristine, vinorelbine, and
vinblastine), and estramustine phosphate} interfere with microtubules (cellular structures
that help move chromosomes during mitosis) and obstruct cell growth by arresting
mitosis [6-8]. Other way to treat cancer involves the use of monoclonal antibodies that
bind only to cancer cell-specific antigens and induce an immunological response against
the target cancer cell. Monoclonal antibodies include alemtuzumab, bevacizumab,
trastuzumab etc [9].
1.1 Cisplatin history
After 120 years of cisplatin synthesis by Peyrone in 1845 [10], its biological action was
discovered serendipitously during an experiment designed to study the electric current
effect on the growth of Escherichia coli bacteria cell. It was observed that a cell subjected
to electric current formed long filaments but at the cost of reduction in their number, thus
tend to the conclusion that only cell division was repressed but not cell growth. However,
further investigations unveiled that the division stops due to platinum dissolution from
electrode into the medium rather than electric current [11]. Several platinum complexes
tested for anti-proliferative effect on bacteria cells and later on mice revealed cisplatin
has the highest antitumor activity [12]. In 1972, the first clinical trial result was
published [13] and in 1978 it was approved by the FDA (Food and Drug Administration)
for clinical administration [14]. This discovery was a corner stone which persuaded the
interest in anticancer metallo-drugs. Nowadays, cisplatin is used widely as an effective
anticancer drug in the regimen of chemotherapeutic administration, including testicular,
head and neck, ovarian, small cell lung cancer and esophageal cancer [15]. The curing
rate can exceed over 90% in case of testicular and ovarian cancer, if the tumor is
diagnosed in the earlier stage [16, 17]. To improve cisplatin activity by inhibiting
cisplatin-DNA lesions repair, it is also used in combinatorial treatments with other
anticancer drugs like 5-fluorouracil and arabinofuranosylcytosine [18]. Later on, two
analogues drugs, carboplatin and oxaliplatin, received clinical status in United States.
3
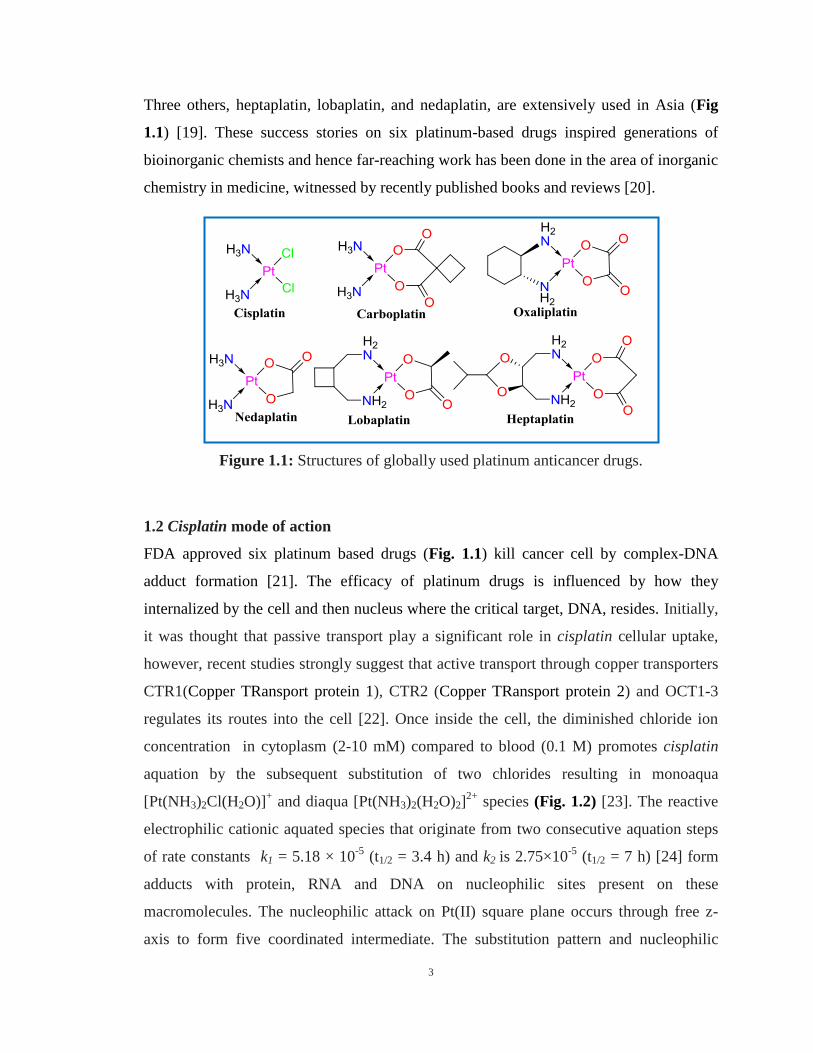
Three others, heptaplatin, lobaplatin, and nedaplatin, are extensively used in Asia (Fig
1.1) [19]. These success stories on six platinum-based drugs inspired generations of
bioinorganic chemists and hence far-reaching work has been done in the area of inorganic
chemistry in medicine, witnessed by recently published books and reviews [20].
Figure 1.1: Structures of globally used platinum anticancer drugs.
1.2 Cisplatin mode of action
FDA approved six platinum based drugs (Fig. 1.1) kill cancer cell by complex-DNA
adduct formation [21]. The efficacy of platinum drugs is influenced by how they
internalized by the cell and then nucleus where the critical target, DNA, resides. Initially,
it was thought that passive transport play a significant role in cisplatin cellular uptake,
however, recent studies strongly suggest that active transport through copper transporters
CTR1(Copper TRansport protein 1), CTR2 (Copper TRansport protein 2) and OCT1-3
regulates its routes into the cell [22]. Once inside the cell, the diminished chloride ion
concentration in cytoplasm (2-10 mM) compared to blood (0.1 M) promotes cisplatin
aquation by the subsequent substitution of two chlorides resulting in monoaqua
[Pt(NH3)2Cl(H2O)]+ and diaqua [Pt(NH3)2(H2O)2]
2+ species (Fig. 1.2) [23]. The reactive
electrophilic cationic aquated species that originate from two consecutive aquation steps
of rate constants k1 = 5.18 × 10⁻⁵
(t1/2 = 3.4 h) and k2 is 2.75×10⁻⁵
(t1/2 = 7 h) [24] form
adducts with protein, RNA and DNA on nucleophilic sites present on these
macromolecules. The nucleophilic attack on Pt(II) square plane occurs through free z-
axis to form five coordinated intermediate. The substitution pattern and nucleophilic
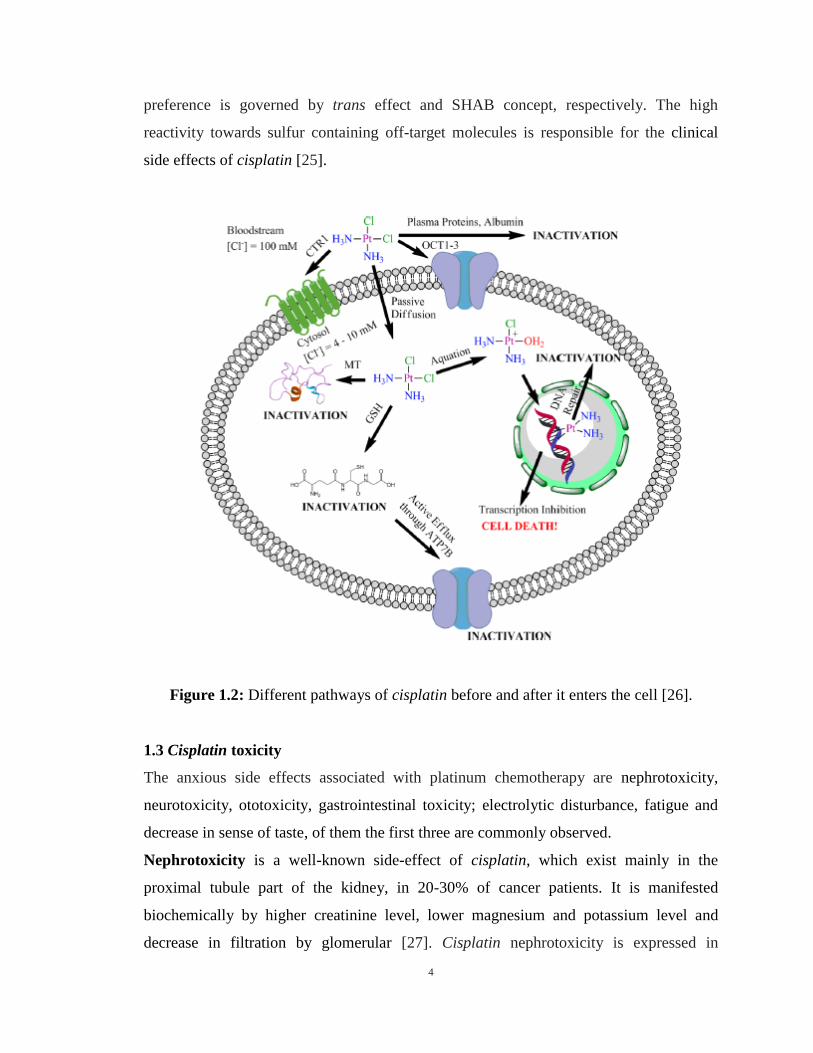
4
preference is governed by trans effect and SHAB concept, respectively. The high
reactivity towards sulfur containing off-target molecules is responsible for the clinical
side effects of cisplatin [25].
Figure 1.2: Different pathways of cisplatin before and after it enters the cell [26].
1.3 Cisplatin toxicity
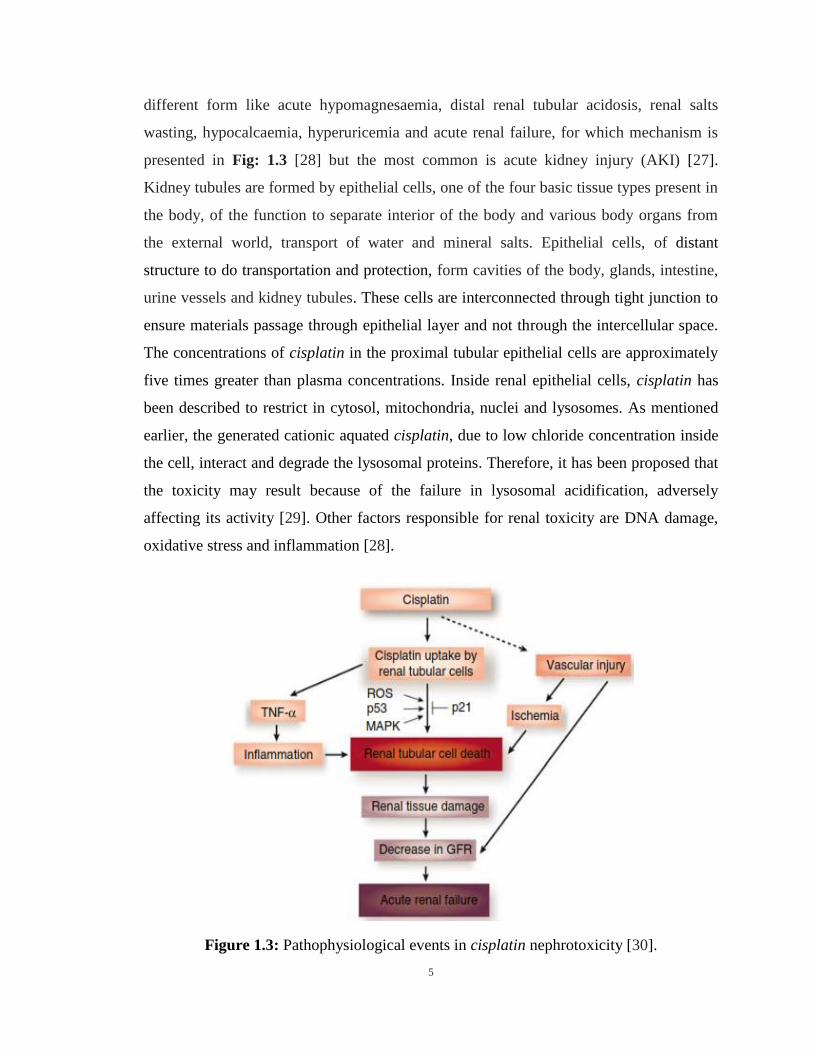
The anxious side effects associated with platinum chemotherapy are nephrotoxicity,
neurotoxicity, ototoxicity, gastrointestinal toxicity; electrolytic disturbance, fatigue and
decrease in sense of taste, of them the first three are commonly observed.
Nephrotoxicity is a well-known side-effect of cisplatin, which exist mainly in the
proximal tubule part of the kidney, in 20-30% of cancer patients. It is manifested
biochemically by higher creatinine level, lower magnesium and potassium level and
decrease in filtration by glomerular [27]. Cisplatin nephrotoxicity is expressed in
5
different form like acute hypomagnesaemia, distal renal tubular acidosis, renal salts
wasting, hypocalcaemia, hyperuricemia and acute renal failure, for which mechanism is
presented in Fig: 1.3 [28] but the most common is acute kidney injury (AKI) [27].
Kidney tubules are formed by epithelial cells, one of the four basic tissue types present in
the body, of the function to separate interior of the body and various body organs from
the external world, transport of water and mineral salts. Epithelial cells, of distant
structure to do transportation and protection, form cavities of the body, glands, intestine,
urine vessels and kidney tubules. These cells are interconnected through tight junction to
ensure materials passage through epithelial layer and not through the intercellular space.
The concentrations of cisplatin in the proximal tubular epithelial cells are approximately
five times greater than plasma concentrations. Inside renal epithelial cells, cisplatin has
been described to restrict in cytosol, mitochondria, nuclei and lysosomes. As mentioned
earlier, the generated cationic aquated cisplatin, due to low chloride concentration inside
the cell, interact and degrade the lysosomal proteins. Therefore, it has been proposed that
the toxicity may result because of the failure in lysosomal acidification, adversely
affecting its activity [29]. Other factors responsible for renal toxicity are DNA damage,
oxidative stress and inflammation [28].
Figure 1.3: Pathophysiological events in cisplatin nephrotoxicity [30].
6
Neurotoxicity, first reported in 1970, is another dose-limiting side-effect of the cisplatin.
The cisplatin causes neurotoxic effects upon the peripheral nervous system (PNS) and the
central nervous system (CNS), initially characterized by painful paresthesias occurs
during the first few cycles of the drug. After several treatments with cisplatin vibration
sense loss , ataxia and paraesthesia become evident [31]. The degree of platinum-DNA
cross-links in dorsal root ganglion (DRG) neurons at a given additive dose is directly
related with the degree of neurotoxicity. The platinum drugs affect the axons, myelin
sheath, neuronal cell body and the glial structures of the neurons in PNS and CNS.
Although detailed mechanism of neurotoxicity is not yet known but it is suggested that
failure of DNA repair system in neuron cell is responsible for neuronal apoptosis.
Neurotoxicity, due to its irreversible nature, is one of the dangerous cisplatin related side
effects [32].
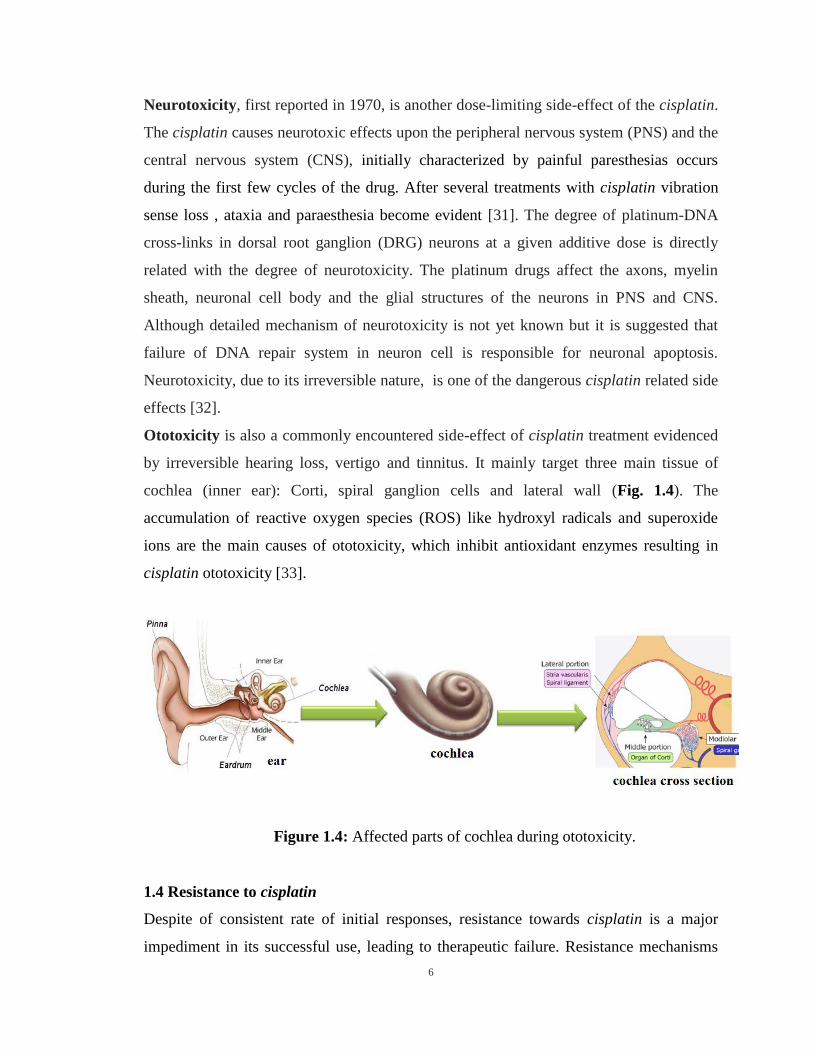
Ototoxicity is also a commonly encountered side-effect of cisplatin treatment evidenced
by irreversible hearing loss, vertigo and tinnitus. It mainly target three main tissue of
cochlea (inner ear): Corti, spiral ganglion cells and lateral wall (Fig. 1.4). The
accumulation of reactive oxygen species (ROS) like hydroxyl radicals and superoxide
ions are the main causes of ototoxicity, which inhibit antioxidant enzymes resulting in
cisplatin ototoxicity [33].
Figure 1.4: Affected parts of cochlea during ototoxicity.
1.4 Resistance to cisplatin
Despite of consistent rate of initial responses, resistance towards cisplatin is a major
impediment in its successful use, leading to therapeutic failure. Resistance mechanisms
7
arise as a consequence of intracellular changes, which are generally divided into: pre-
binding and post-binding mechanisms [34]. Pre-binding mechanism hinders cisplatin
access to DNA and post-binding mechanism hamper apoptosis, an ultimate result of the
cisplatin DNA interaction.
1.4.1 Pre-binding resistance
There are two mechanisms by which cancer cell evade the cisplatin cytotoxicity prior
reaching the nuclear DNA and other cytoplasmic targets i.e (i) reduced cisplatin
accumulation due to less uptake and greater efflux, and (ii) Inactivation by glutathione
(GSH), methionine, metallothioneins (MT) and other cytoplasmic organelles baring
nucleophilic sites.
1.4.1.1 Decrease cisplatin accumulation
About 20–70% reduction in cisplatin concentration, either due to less uptake or greater
efflux, has been perceived in cisplatin resistant cell lines [35]. It has long been accepted
that cisplatin is internalized by the cell through passive transport but later studies showed
that cisplatin do so through active transport by Cu transporter hCTR1 [36, 37]. It has
been established that copper homeostasis play a significant role in cisplatin uptake.
Reduced expression of hCtr1 protein in several cisplatin resistant cell lines was correlated
with the cisplatin sensitivity levels [38]. Moreover, it was noticed that many cell lines
having resistance to Pt-drugs also display cross-resistance to copper and vice versa [39].
Based upon these results, it has been proposed that Cu and Pt share same transporter
system. It has been noticed that by comparing the resistant and sensitive SR2 cell line of
small cell lung carcinoma, the resistant cell down-regulates the protein expression of
hCtr1 more than half of its corresponding sensitive cell line [40]. Furthermore, the hCtr1
mouse embryonic fibroblasts provide 3-2 fold increase in resistance than their wild-type
transfected cell due to considerably less accumulation of the cisplatin [41]. According to
structural and functional analyses of hCtr1, it consist of 190 amino acids [42] having
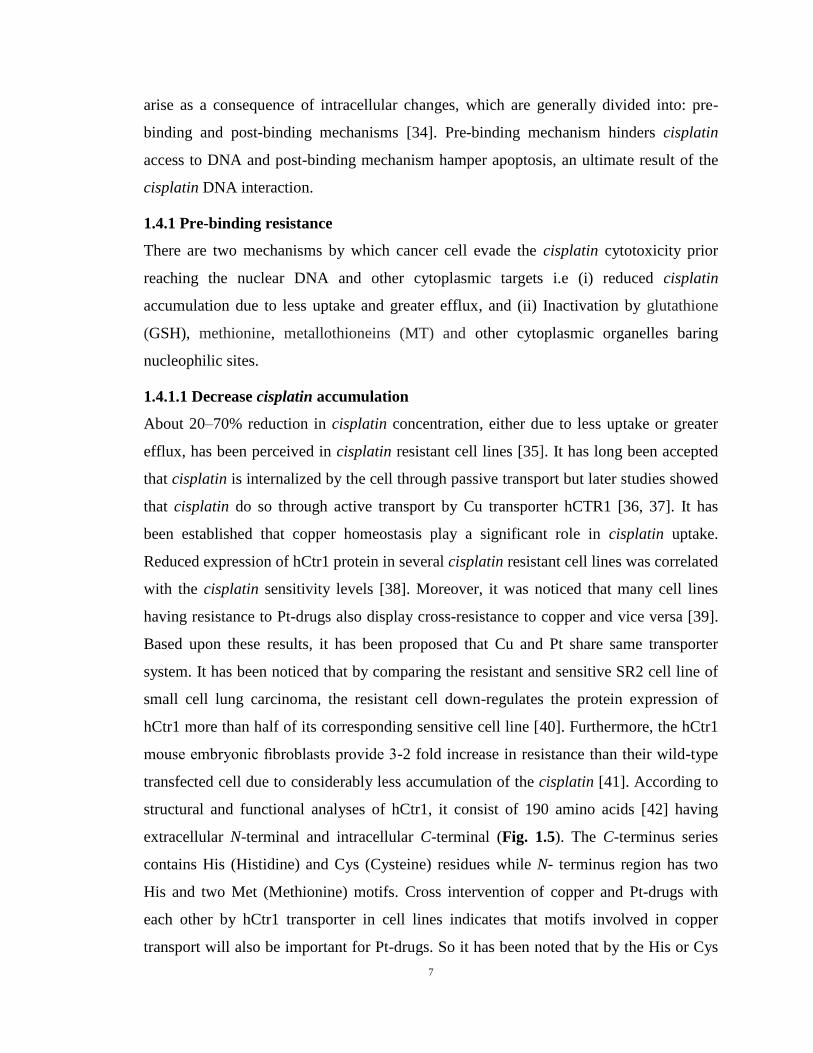
extracellular N-terminal and intracellular C-terminal (Fig. 1.5). The C-terminus series
contains His (Histidine) and Cys (Cysteine) residues while N- terminus region has two
His and two Met (Methionine) motifs. Cross intervention of copper and Pt-drugs with
each other by hCtr1 transporter in cell lines indicates that motifs involved in copper
transport will also be important for Pt-drugs. So it has been noted that by the His or Cys
8
motif of C-terminal deletion do not show any effect on Pt-drugs transport, however,
removal of Met-rich motifs from N-terminal of hCtr1 significantly disturb the
transportation, indicating that this motif is involved in cisplatin cross-linkage [43]. In
some cell Na+/K
+ATPase was noted to involve in the cellular uptake of cisplatin. For
instance, in human ovarian cancer cell line the cisplatin accumulation is reduced to 50%
by inhibiting Na+/K
+ATPase via pre-treatment of cells with oubain (inhibitor of Na/K
ATPase), thus indicated seminal role of the cell membrane potential in cisplatin uptake
[44,45].
Figure 1.5: Schematic diagram of hCtr1 structure, showing 190 amino acid residues,
each represented by a circle. The extracellularly located N-terminus, and
intracellularly located C-terminus are indicated. The N-terminal region
contains two each His-rich (yellow) and Met-rich (red) motifs. The C-
terminal His/Cys residues are also indicated [43].
Moreover, benzaldehyde and other similar compounds interrupt intracellular
accumulation of cisplatin presumably due to formation of Schiff bases with integral
membrane transport proteins [46-49].
In addition to the aforesaid mechanisms, reduced cisplatin cellular accumulation might
also occur by higher drug efflux. The multi-drug resistance protein (MRP), a sub class of
ATP-binding cassette (ABC) transporter, has been believed to involve in the Pt-drugs
ejection from the cell [50]. Among seven members (MRP1-7) of MRP, MRP2 (Multidrug
9
resistance-associated protein 2) also known as canalicular multispecific organic anion
transporter 1 (cMOAT) or ATP-binding cassette sub-family C member 2 (ABCC2) play
an imperative role in cisplatin efflux, if bonded with glutathione [51]. After the discovery
of hCTR1 role in cisplatin uptake, interest was diverted towards two Cu transporting P-
type ATPase, ATP7A and ATP7B, which are responsible for extruding Cu from the cell
[52]. These proteins, located in Golgi body apparatus, maintain Cu homeostasis by
forming Cu vesicle and expel them out of the cell membrane. ATP7A is mainly
expressed in small intestine where Cu is absorbed from the nutrient, whereas ATP7B,
mostly present in liver and kidney cells, remove excess of Cu into the bile [53]. In
human, the over expression of ATP7B (epidermoid carcinoma cells) and ATP7A {in
esophageal squamous cell cancer (ESCC)} proteins results in enhancement in cisplatin
resistance [54-55] suggest their involvement in the Pt-drugs efflux (Fig. 1.6).
Figure 1.6: Schematic diagram showing transport of copper and cisplatin in and out of
the cell.
10
1.4.1.2 Inactivation by thiol containing molecules
In addition to platinum-DNA contacts, aquated cisplatin is also diverted to off-target
biological nucleophiles present in the cytoplasm such as GSH, methionine,
metallothioneins and other cysteine-rich proteins, a significant factor contributing in the
drug resistance. These binding events significantly hamper cisplatin access to DNA as
platinum-thiol adducts can be easily kicked out of the cell by MRP2. Furthermore, it
reduces the cytotoxicity by impeding the conversion of mono-adducts to cross-links [56].
The role of off-target platinum-protein interactions is not yet fully explored [57].
1.4.2 Post-binding resistance
For induction of apoptosis (programmed cell death), formation and persistence of
cisplatin-DNA adducts are desirable, however, these intra and inter-strand adducts are
impaired often, and consequently, the resistance cells get hold of repairing or acquire
ability to tolerate the unpaired DNA lesion. Out of the five recognized DNA repair
pathways namely nucleotide excision repair (NER), mismatch repair (MMR), double-
strand break repair, direct repair and base excision repair (BER), the first two
mechanisms play a key role in mediating resistance [58]. NER, a complex biochemical
process, is regulated by several proteins, especially the excision repair cross-
complementation group 1 (ERCC1) protein that play pivotal role in DNA lesion repair
[59, 60]. Elevated level of ERCC1 in the resistance cell line, as revealed by both in vitro
assays and clinical studies, is responsible for preferential removal of lesion and enabling
the DNA repair [62, 62]. The hypersensitivity of testicular cancer cells to cisplatin, more
than 90% success rate, is due to low expression of ERCC1 [63]. Alternatively, other
proteins such as high mobility group (HMG)-domain proteins, for example, potentiate
cisplatin activity by selectively bind to cytotoxic platinum lesions and shielding those
from NER proteins, a phenomenon commonly called as “repair shielding” [64-72].
Hence, high expression of HMG-domain proteins was correlated with hypersensitivity of
the cell to cisplatin [73,74].
In addition, MMR pathway detects and corrects the mismatches before replication and
transcription. MMR consist of number of proteins among those MLH1 and MSH2 are
key for GpG error recognition, and hence less expressed in the resistant cell [75-77].
Apoptosis can be triggered, if cellular damage is surpassed a certain threshold level,
11
nevertheless the value varies from cell to cell. The p35 tumor suppressor gene repair
DNA damage caused by cisplatin, if mutation level is low and promotes apoptosis
otherwise. The deficiency of MMR and dysfunction of p35 tumor suppressor gene enable
the DNA to tolerate the damage [35].
1.5 Monofunctional platinum(II) complexes
Design and development of structurally dissimilar complexes to cisplatin and analogues
is one of many approaches being used to mitigate the damaging side effects (toxicity and
resistance) in Pt-based chemotherapy. In this context, monofunctional platinum(II)
complexes that violate the classical structure-activity relationships (SARs) attracted
special attraction. Much work has been done on monofunctional complexes generally
containing a labile chloride and three non-labile nitrogen-donor ligands (Fig. 1.7). The
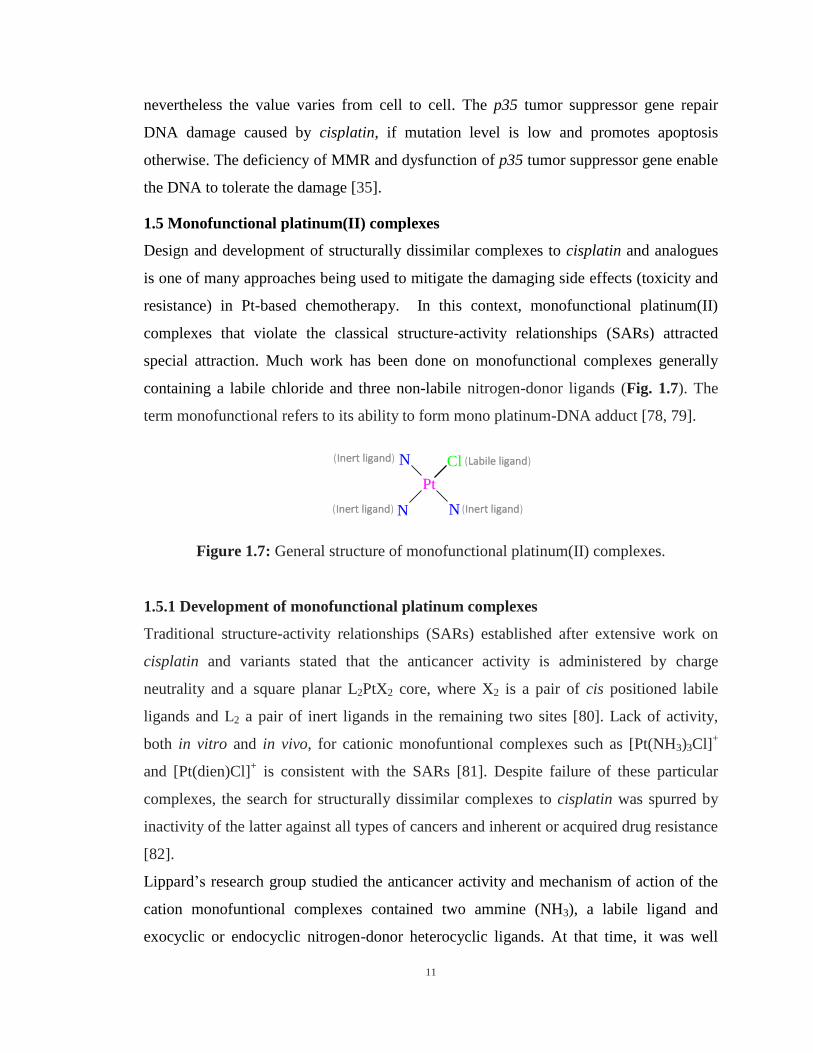
term monofunctional refers to its ability to form mono platinum-DNA adduct [78, 79].
Figure 1.7: General structure of monofunctional platinum(II) complexes.
1.5.1 Development of monofunctional platinum complexes
Traditional structure-activity relationships (SARs) established after extensive work on
cisplatin and variants stated that the anticancer activity is administered by charge
neutrality and a square planar L2PtX2 core, where X2 is a pair of cis positioned labile
ligands and L2 a pair of inert ligands in the remaining two sites [80]. Lack of activity,
both in vitro and in vivo, for cationic monofuntional complexes such as [Pt(NH3)3Cl]+
and [Pt(dien)Cl]+ is consistent with the SARs [81]. Despite failure of these particular
complexes, the search for structurally dissimilar complexes to cisplatin was spurred by
inactivity of the latter against all types of cancers and inherent or acquired drug resistance
[82].
Lippard’s research group studied the anticancer activity and mechanism of action of the
cation monofuntional complexes contained two ammine (NH3), a labile ligand and
exocyclic or endocyclic nitrogen-donor heterocyclic ligands. At that time, it was well
Pt
N
NN
Cl (Labile ligand)(Inert ligand)
(Inert ligand) (Inert ligand)
12
accepted that cisplatin exerts anticancer action via bifunctional adduct formation with the
DNA. However, to enhance anticancer efficacy and to curtail side effects of platinum
chemotherapy, cisplatin was used in combination with other anticancer drugs including
DNA intercalators such as doxorubicin. In order to explore the synergistic effect of
platinum compounds and intercalators, Lippard et al made an attempt to platinate the
DNA containing classical intercalator ethidium. An alteration in platination pattern on
the duplex was observed [83, 84] that was attributed to switch in DNA binding mode
from bifunctional to monofunctional, and this proposition was confirmed experimentally
by the subsequent work [85]. In this context, the initial work demonstrated that ethidium
removal on extensive dialysis and inertness of cisplatin to ethidium in solution indicated
lack of ethidium-Pt bond formation. However, succeeding experiments turned down the
idea of no Pt-ethidium covalent bond formation. The term ternary complex composed of
ethidium-Pt-DNA was proposed for the first time by Leng research group [86]. Using
three intercalators, acridine, ethidium and proflavin, they observed that the latter two
tightly bound to DNA and hence could not be removed by extraction, filtration at acidic
pH, or thin-layer chromatography at basic pH. This led to the proposition of ternary
complex formation composed of cis-[Pt(NH3)2]2+
unit, intercalator and DNA. The
proposition was confirmed by florescent measurements, which revealed that the optical
absorption of cis-[Pt(NH3)2(ethidium)Cl]2+
match those of DNA platinated in the
presence of ethidium. Further, it was noted that the DNA promote ligand substitution of
chloride for ethidium [87]. In order to confirm coordination of either of the two exocyclic
nitrogens, N3 and N8, the differential thermochromic behavior was carried out that
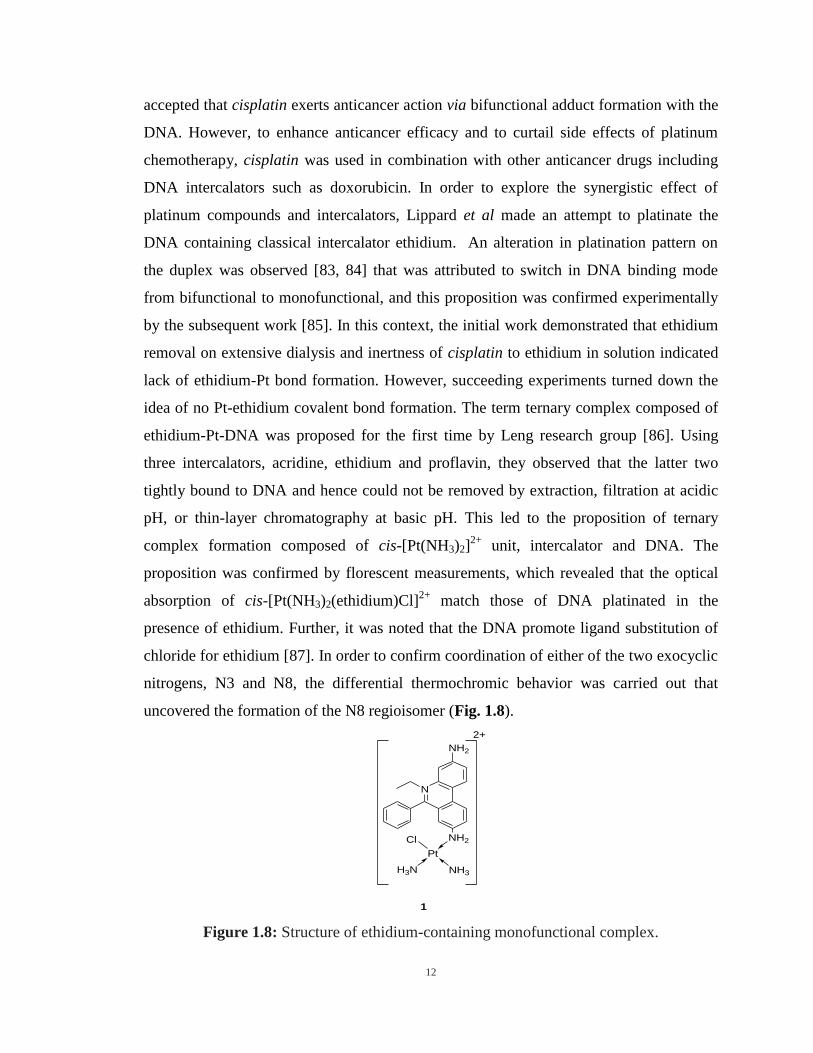
uncovered the formation of the N8 regioisomer (Fig. 1.8).
Figure 1.8: Structure of ethidium-containing monofunctional complex.
Pt
H3N NH3
Cl NH2
N
NH2
1
2+
13
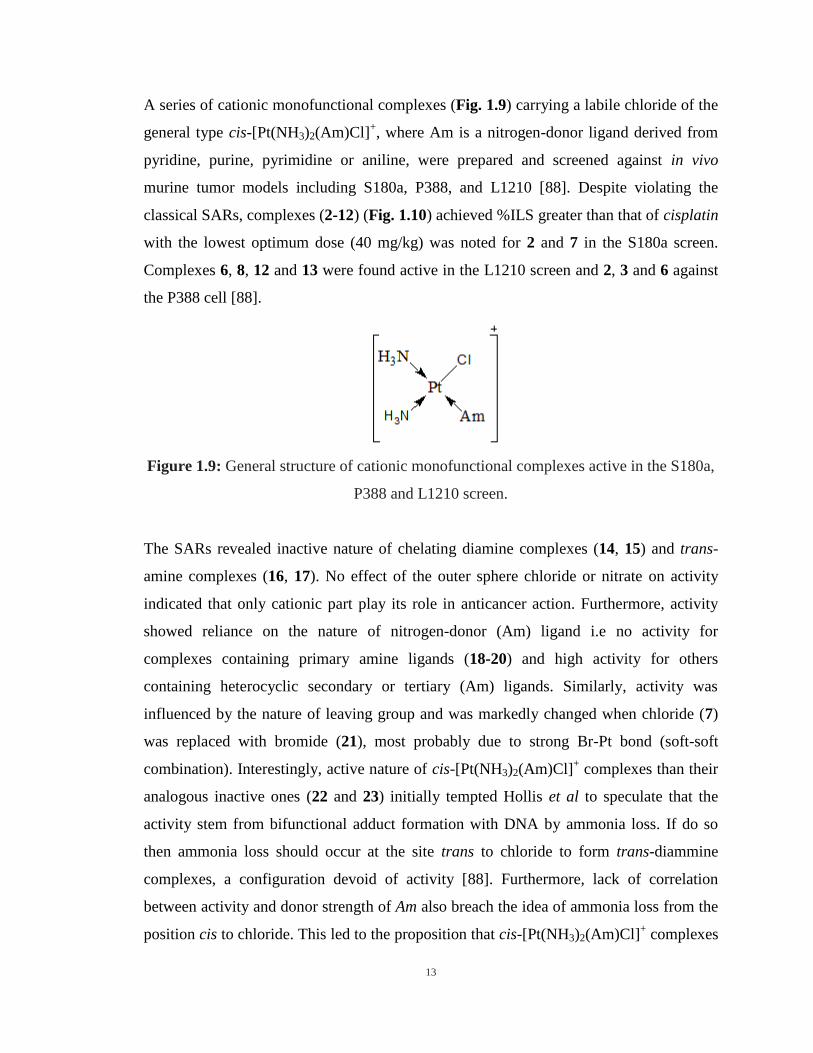
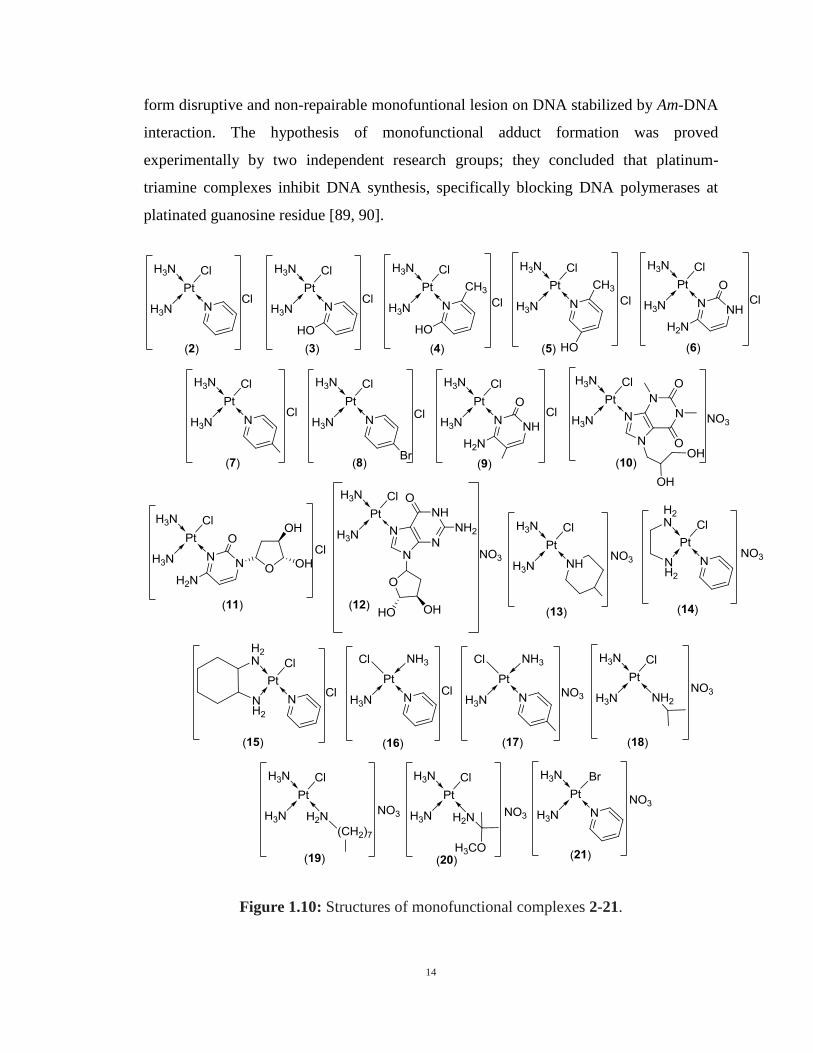
A series of cationic monofunctional complexes (Fig. 1.9) carrying a labile chloride of the
general type cis-[Pt(NH3)2(Am)Cl]+, where Am is a nitrogen-donor ligand derived from
pyridine, purine, pyrimidine or aniline, were prepared and screened against in vivo
murine tumor models including S180a, P388, and L1210 [88]. Despite violating the
classical SARs, complexes (2-12) (Fig. 1.10) achieved %ILS greater than that of cisplatin
with the lowest optimum dose (40 mg/kg) was noted for 2 and 7 in the S180a screen.
Complexes 6, 8, 12 and 13 were found active in the L1210 screen and 2, 3 and 6 against
the P388 cell [88].
Figure 1.9: General structure of cationic monofunctional complexes active in the S180a,
P388 and L1210 screen.
The SARs revealed inactive nature of chelating diamine complexes (14, 15) and trans-
amine complexes (16, 17). No effect of the outer sphere chloride or nitrate on activity
indicated that only cationic part play its role in anticancer action. Furthermore, activity
showed reliance on the nature of nitrogen-donor (Am) ligand i.e no activity for
complexes containing primary amine ligands (18-20) and high activity for others
containing heterocyclic secondary or tertiary (Am) ligands. Similarly, activity was
influenced by the nature of leaving group and was markedly changed when chloride (7)
was replaced with bromide (21), most probably due to strong Br-Pt bond (soft-soft
combination). Interestingly, active nature of cis-[Pt(NH3)2(Am)Cl]+ complexes than their
analogous inactive ones (22 and 23) initially tempted Hollis et al to speculate that the
activity stem from bifunctional adduct formation with DNA by ammonia loss. If do so
then ammonia loss should occur at the site trans to chloride to form trans-diammine
complexes, a configuration devoid of activity [88]. Furthermore, lack of correlation
between activity and donor strength of Am also breach the idea of ammonia loss from the
position cis to chloride. This led to the proposition that cis-[Pt(NH3)2(Am)Cl]+ complexes
14
form disruptive and non-repairable monofuntional lesion on DNA stabilized by Am-DNA
interaction. The hypothesis of monofunctional adduct formation was proved
experimentally by two independent research groups; they concluded that platinum-
triamine complexes inhibit DNA synthesis, specifically blocking DNA polymerases at
platinated guanosine residue [89, 90].
Figure 1.10: Structures of monofunctional complexes 2-21.
15
1.5.2 Highly potent monofunctional platinum complexes
Prior work directed that platinum based sterically hindered bifunctional complexes could
provide highly potent anticancer drugs and complex 22 (Fig. 1.11) showed both in vitro
and in vivo higher anticancer activities compared to 23 [91]. According to current reports,
increase in lipophilicity increases the drug uptake through cell membrane and
additionally, with the active role of human OCT transporter [92]. Also, picoplatin, was
designed to overcome drug resistance via reducing drug deactivation. The goal was
achieved by using bulky groups almost normal (103º) to Pt-N2Cl2 core, shielding the
metal from deactivation by off-target bio-molecules [93]. In these regards platinum
complexes with bulky aromatic groups may be anticipated to undergo slower substitution
reactions with nucleophiles than cisplatin [94].
General observation was that monofunctional platinum complexes with steric hindrance
are comparable or more in anticancer action as compared to the cisplatin. A batch of such
monofunctional complexes with various intert N-8-quinolylamide ligands were
synthesized [95] and the results showed that the complex with N-(tert-butoxycarbonyl)-
L-methionine substituent (25), which is the bulkiest and most lipophilic one, is the most
active anticancer candidate [94]. Additionally, complex 25 was active against many of
the cancer cell lines and the anticancer activity was found to be better than the cisplatin
and analogues [94]. For the authentication, same series of platinum complexes was again
tested for their potency and same results were obtained. Anticancer activity of L-valine
(28) and L-leucine-N-8-quinolylamide (29) substituted platinum complexes with respect
to P-388 leukemia cell line was similar to that of the cisplatin and, on the other hand
higher lipophilic complex 30 was more active than 2 (Fig. 1.10) [96].
Two monofunctional complexes, pyriplatin (2) and phenanthriplatin (30), having a less
and a more hydrophobic entity correspondingly, were reacted with methionine and their
kinetics were determined. The complex with more hydrophobic group i.e.
phenanthriplatin showed very slower reaction rate (~10 times) compared to pyriplatin
bearing less hydrophobic group. It is also noteworthy that phenanthriplatin was found
significantly more potent compared to pyriplatin. The explanation for this higher activity
is that the more hydrophobic complexes are more capable to get into the cells and thus
better cellular accumulation takes place [96]. Furthermore, there seems to be a consensus
16
that the connections developed between aromatic rings of the compounds and DNA,
unrecognizable for the NER mechanism are responsible for the anticancer action [96].
Experiments were executed to recognize the mechanism of action of pyriplatin and
phenanthriplatin through RNA polymerase II inhibition studies. Both theoretical [97] and
experimental [97, 98] studies revealed that the mechanism of action of monofunctional
platinum complexes is different from that of cisplatin i.e. gene transcription is handled
herein, via inhibition of Pol II-mediated transcription by the virtue of bulky ligands [97,
98].
Figure 1.11: Structures of bifunctional (22-24) and monofunctional (25-30) Pt(II)
complexes with increasing hydrophobicity and enhanced anticancer
activity.
1.6 Monofunctional platinum complexes with alternative cell kill mechanisms
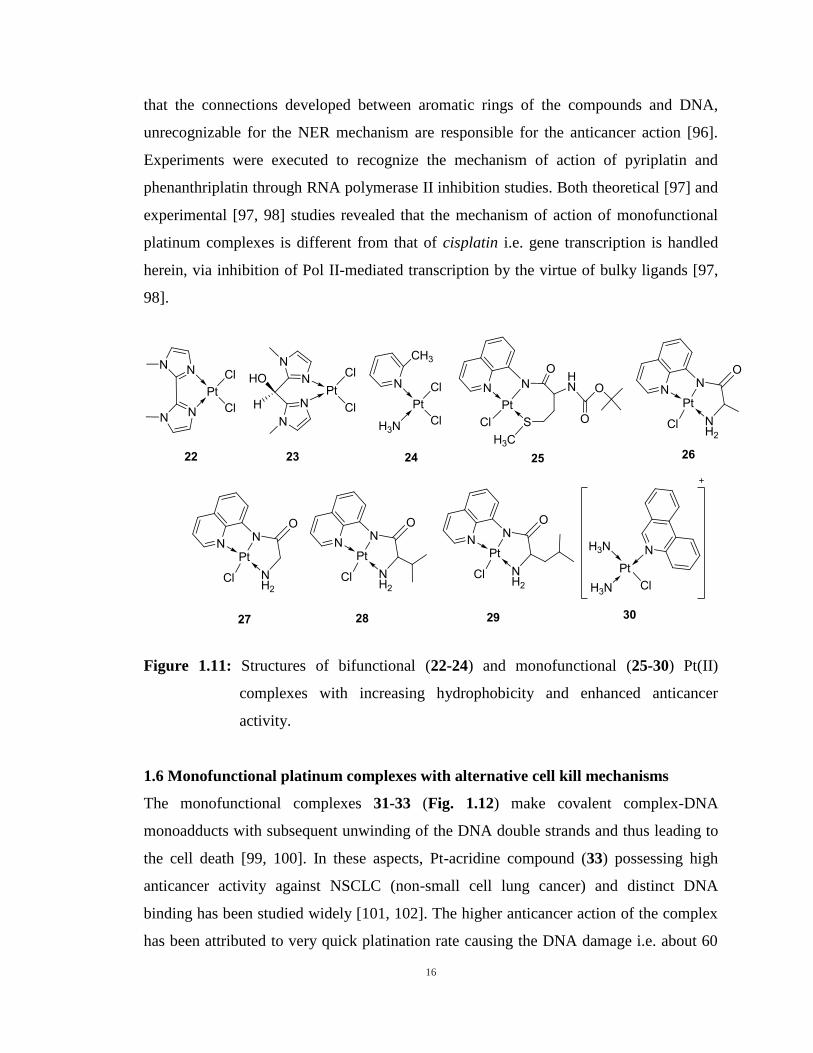
The monofunctional complexes 31-33 (Fig. 1.12) make covalent complex-DNA
monoadducts with subsequent unwinding of the DNA double strands and thus leading to
the cell death [99, 100]. In these aspects, Pt-acridine compound (33) possessing high
anticancer activity against NSCLC (non-small cell lung cancer) and distinct DNA
binding has been studied widely [101, 102]. The higher anticancer action of the complex
has been attributed to very quick platination rate causing the DNA damage i.e. about 60
17
folds higher compared to cisplatin [103]. Along with these Pt-DNA monoadducts, the
complex also has the ability of intercalation within the DNA bases via acridine moiety
[104]. Nevertheless, literature suggests that like monofunctional complexes based on
other groups lack the cross-linking with DNA for the apoptosis. On the other hand, few
such platinum complexes have the ability of intercalation [105] while few others don’t
have [106]. DNA unwinding essay revealed that some of the monofunctional platinum
compounds don’t alter the DNA structure, as no evidence could be noticed in the essay,
signifying that they induce the cell death via some “non-apoptotic process”; since it is
believed that apoptosis is mediated by DNA interaction of the platinum complexes. In
literature, non-apoptotic processes like autophagy [107], necrosis [106] and parapoptosis
[108] are present in the view of platinum(II) monofunctional complexes.
Figure 1.12: Monofunctional Pt(II) complexes that form Pt-DNA crosslink to induce
apoptosis of the cancer cells.
1.6.1 Autophagy
Although the history of autophagy is around 40 years old [103] but achieved a significant
attention of the researchers in the biological processes recently. Autophagy is a pro-
survival mechanism, in which organelles are self-metabolized in strained situations like
starvation, hypoxia and chemotherapy etc. [109, 110]. It is generally believed that
autophagy process facilitates acquired resistance to anticancer drugs [109, 111, 112]. In
these directions, inhibition of autophagy genes like BECN1, Atg5, by using 3-
methyladenine/chloroquine to mediate apoptosis upon chemotherapy is also a part of the
18
literature [110, 111]. Conversely, recent observations revealed that autophagy may act as
pro-death initiator and ultimately leading to autophagic cell death (25) [113]. This type of
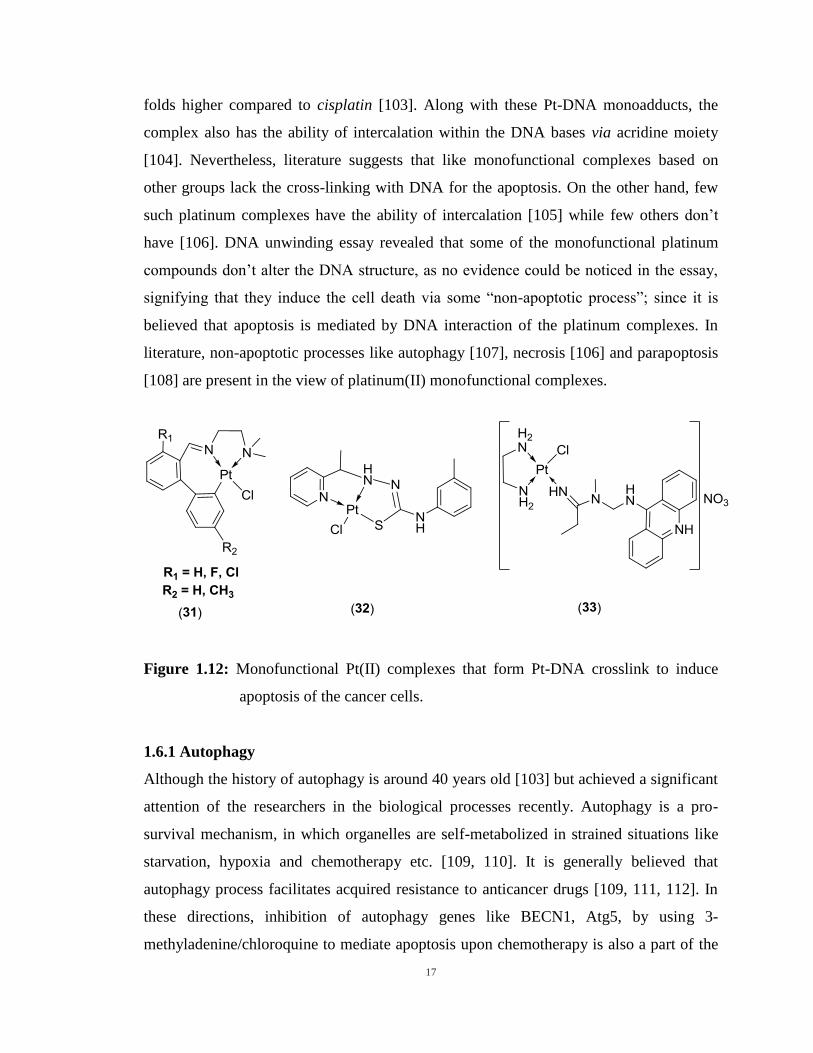
cell death usually depends upon unique cell morphology. Herein, cytoplasm is found to
be encapsulated by a distinct bi-layer (Table 1.1) [112, 113]. The enzyme p53 is
malignant inhibitor that controls the cell response to the DNA breakdown and induces
apoptosis via triggering signal pathways to facilitate transcription and cell cycle arrest
[114, 115]. The conventional platinum based anticancer drugs may induce apoptosis in
tumor cells having wild-type p53 [115-118]. Conversely, mutant p53 present in many of
the tumor cell kinds is incapable of mediating apoptosis (Fig. 1.13), thus leading to drug
resistance [118] (Fig. 1.14). Autophagy, type II apoptotic process is evidenced in
malignant cells cured with monofunctional platinum(II) compounds (25) [107]. The class
of the platinum complexes inhibited Akt signal (cell life sign) and turned on MAPK/Erk
pathway, thus suppressing the mTOR to stimulate autophagy process (Fig. 1.15) [107]. In
this way, monofunctional platinum complexes destroy the tumor cells at the expense of
autophagy, without considering the p53 situation (Fig. 1.14) [118].
Figure 1.13: The fate of cancer cells when they are induced by stress.
19
In these directions, the monofunctional complexes with autophagic pro-death activating
ability are expected to inhibit programmed cell death resistance in cancer treatment [107,
119, 120].
1.6.2 Necrosis
It is a type III mechanism of the cell demise, recognized by its unique morphology i.e.
different from previously mentioned apoptosis and autophagy (Table 1.1) [122, 123].
Necrosis is initiated by tumor necrosis factor via triggering many signal corridors [124]
by unnecessary oxidative products [122, 124], pathogens and venoms [123, 126]. There
is consensus that necrosis does not take place normally, till both of the apoptosis and
autophagy processes were suppressed simultaneously [127]. Remarkably, there are
evidences for the monofunctional platinum compounds, not to bind with DNA covalently
[94].
Table 1.1: Morphology changes of cells via apoptosis [121], autophagy [112],
necrosis [123, 124], and paraptosis [125] cell death pathway.
Morphology Apoptosis Autophagy Necrosis Paraptosis
Cytoplasmic vacuolations Χ
Chromatin condensation Χ Χ Χ
Nuclear fragmentation Χ Χ Χ
Membrane blebbing Χ Χ
Apoptotic bodies Χ Χ Χ
Conversely, the aromatic moieties in the bulky ligands of the platinum complexes set a
stage for additional H-bonding with DNA and so that the complexes act as intercalators
[94]. Many of the inert ligands like Pt-terpyridine (34) (Fig. 1.16) are shown to exhibit
non-covalent interactions with DNA. Interestingly, mechanism of action of the compound
34 revealed that this complex mediates cell death via necrosis [106].
20
Figure 1.14: The possible cell death pathways for cancer cells bearing wild-type p53 or
mutant p53 when treated with cisplatin and monofunctional Pt(II)
compound.
1.6.3 Paraptosis
It is another type of cell death mechanism, although a less familiar one [127], but still
regarded as an effective cell destruction pathway [125]. Paraptosis is an automated non-
apoptotic cell killing pathway [125, 128], which is recognized by the appearance of large
vacuoles in the cytoplasm and lack of the apoptosis [125, 129]. Paraptosis initiated cell
killing may be activated by IGFIR (insulin growth factor I receptor) [127], suppression of
gene transcription or gene translation [129]. The monofunctional platinum complex (35)
(Fig. 1.16) with very bulky inert group is allegedly mediate cell killing via paraptosis
process. The complex is favorably involved with cytoplasmic vacuoles in spite of the
DNA [108].
21
Figure 1.15: Monofunctional Pt(II) compounds suppress Akt and mTOR pathway to
induce autophagy.
Figure 1.16: Monofunctional Pt compounds that did not interact with DNA and exhibit
an alternative cell death pathway.
Above discussion disclose that the nature of carrier ligand and leaving group in classical
platinum drugs is of prime significance to tune the anticancer properties. For example,
22
bidentate chelating carboxylate ligand render slower reactions to carboplatin and
similarly, chelating 1,2 diaminocyclohexane and oxalate ligands make oxaliplatin more
stable and hence low ototoxic and nephrotoxic [130, 131]. Cisplatin and carboplatin form
bifunctional intra-strand cross links in DNA owing to the same carrier ligand (ammine)
[132] while, oxaliplatin forms both inter- and intra-strand cross links with DNA [133] in
the presence of chelating 1,2-diaminocyclohexane ligand. Furthermore, 1,2-
diaminocyclohexane enables oxaliplatin to make bulkier and more hydrophobic
oxaliplatin-DNA adducts than both cisplatin and carboplatin. These bulkier adducts are
able to inhibit DNA replication more effectively compared to cisplatin and carboplatin
[134]. On the other hand, the damaging side effects (toxicity and resistance) of cisplatin
and analogues have been mitigated by using monofunctional platinum(II) complexes
particularly by pyriplatin and phenanthriplatin, having different mechanism of actions.
This suggests that nature of the attached ligands is also important in tuning the
mechanism of action along with anticancer properties of the monofunctional platinum(II)
complexes i.e. for instance, hydrophobic phenanthridine ligand is found to be responsible
for greater cellular uptake and potency of phenanthriplatin as compared to pyriplatin.
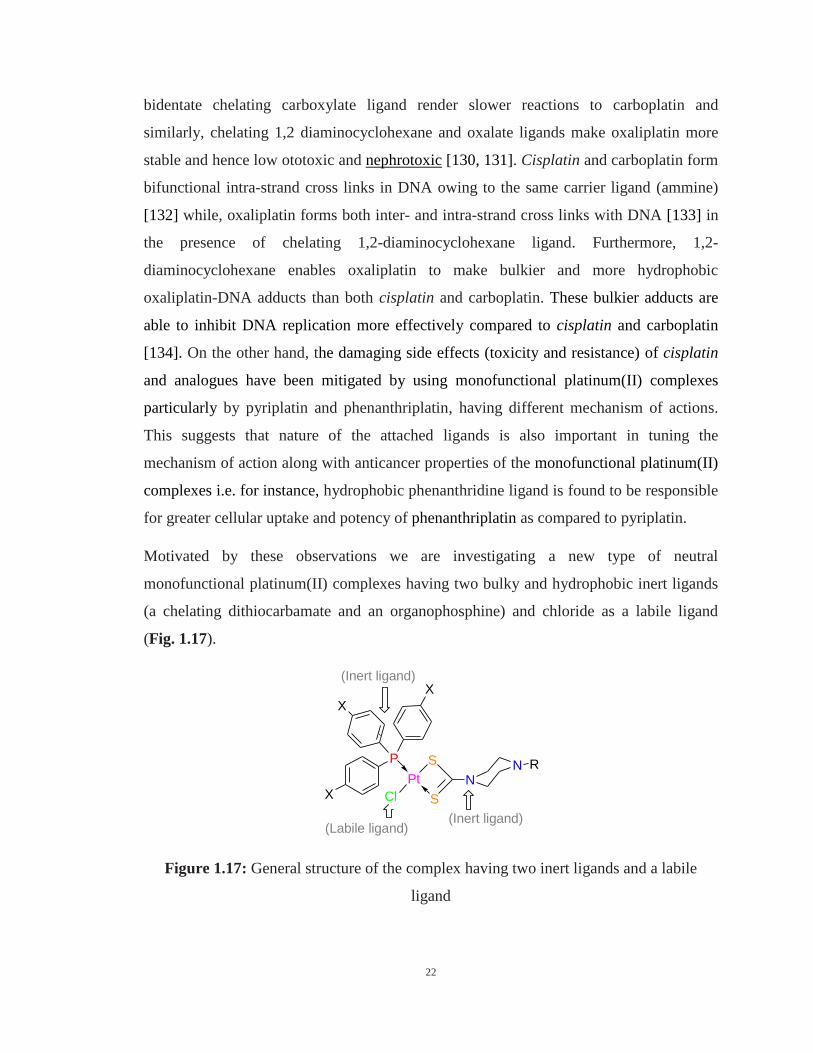
Motivated by these observations we are investigating a new type of neutral
monofunctional platinum(II) complexes having two bulky and hydrophobic inert ligands
(a chelating dithiocarbamate and an organophosphine) and chloride as a labile ligand
(Fig. 1.17).
Figure 1.17: General structure of the complex having two inert ligands and a labile
ligand
Pt
Cl
P S
S
N
X
N R
X
X
(Inert ligand)
(Inert ligand)(Labile ligand)
23
These complexes are expected to have lower resistance because of low reactivity towards
off-target sulfur containing bio-molecules due to strong binding of the dithiocarbamate
and organophosphine (SHAB concept) ligands. Lower toxicity may be anticipated for
these complexes, as dithiocarbamates are being used as inhibitors of cisplatin induced
nephrotoxicity and renal toxicity [135]. Likewise, potential shielding of platinum square
plane by aromatic C-H groups of organophosphine and also greater cellular uptake
because of more bulky and hydrophobic ligands make them attractive candidates for the
anticancer investigations. The mechanism of action of these complexes is expected to be
different from that of cisplatin and analogues due to different structural chemistry of the
attached ligands.
24
REFERENCES
1. Hong, W. K.; Holland, J. F., Holland-Frei cancer medicine 8, PMPH-USA
2010, Vol. 8, 2021 pages.
2. "The top 10 causes of death fact sheet N°310", WHO. May 2014, Retrieved 10
June 2014.
3. Warwick, G., The mechanism of action of alkylating agents, AACR 1963.
4. Smith, A. L., Oxford dictionary of biochemistry and molecular biology,
Oxford University Press 1997, page. 43, ISBN 0-19-854768-4.
5. Peters, G.; Van der Wilt, C.; Van Moorsel, C.; Kroep, J.; Bergman, A.;
Ackland, S., Basis for effective combination cancer chemotherapy with
antimetabolites, Pharmacol. Ther. 2000, 87, 227-253.
6. Earhart, R. H., In Docetaxel (Taxotere): Preclinical and general clinical
information, Semin. Oncol. 1999, 8-13.
7. Rowinsky, M.; Eric, K., The development and clinical utility of the taxane
class of antimicrotubule chemotherapy agents, Annu. Rev. Med. 1997, 48,
353-374.
8. Hudes, G. R.; Nathan, F. E.; Khater, C.; Greenberg, R.; Gomella, L.; Stern,
C.; McAleer, C., In Paclitaxel plus estramustine in metastatic hormone-
refractory prostate cancer, Semin. Oncol. 1995, 41-45.
9. Satyanarayana, P.; Murali, M., Development and validation of LC method for
the estimation of gefitinib in pharmaceutical dosage form, IJRPC 2011, 1,
338-341.
10. Kauffman, G. B.; Pentimalli, R.; Doldi, S.; Hall, M. D., Michele Peyrone
(1813-1883), Discoverer of cisplatin, Platin. Met. Rev. 2010, 54, 250-256.
11. Rosenberg, B.; Van Camp, L.; Krigas, T., Inhibition of cell division in
Escherichia coli by electrolysis products from a platinum electrode, Nature
1965, 205, 698-699.
12. Rosenberg, B.; Vancamp, L., Platinum compounds: a new class of potent
antitumour agents, Nature 1969, 222, 385-386.
25
13. Rossof, A. H.; Slayton, R. E.; Perlia, C. P., Preliminary clinical experience
with cis‐diamminedichloroplatinum(II), Cancer 1972, 30, 1451-1456.
14. Ortega Carrasco, E.; Maréchal, J.-D.; i Falcó, L., Prediction of biometallic
interactions: challenges and applications, 2015.
15. Wang, D.; Lippard, S. J., Cellular processing of platinum anticancer drugs,
Nat. Rev. Drug. Discov. 2005, 4, 307-320.
16. Jayson, G. C.; Kohn, E. C.; Kitchener, H. C.; Ledermann, J. A., Ovarian
cancer, Lancet 2014, 384, 1376-1388.
17. Giaccone, G., Clinical perspectives on platinum resistance, Drugs 2000, 59, 9-
17.
18. Kuroki, M.; Nakano, S.; Mitsugi, K.; Ichinose, I.; Anzai, K.; Nakamura, M.;
Nagafuchi, S.; Niho, Y., In vivo comparative therapeutic study of optimal
administration of 5-fluorouracil and cisplatin using a newly established HST-1
human squamous-carcinoma cell line, Cancer Chemother. Pharmacol. 1992,
29, 273-276.
19. Kelland, L., The resurgence of platinum-based cancer chemotherapy, Nat.
Rev. Cancer 2007, 7, 573-584.
20. Fanelli, M.; Formica, M.; Fusi, V.; Giorgi, L.; Micheloni, M.; Paoli, P., New
trends in platinum and palladium complexes as antineoplastic agents, Coord.
Chem. Rev. 2016, 310, 41-79.
21. Lippard, S. J., New chemistry of an old molecule: cis-[Pt(NH3)2Cl2], Science
1982, 218, 1075-1082.
22. Lippert, B., Cisplatin: chemistry and biochemistry of a leading anticancer
drug, John Wiley & Sons 1999.
23. Michalke, B., Platinum speciation used for elucidating activation or inhibition
of Pt-containing anti-cancer drugs, J. Trace. Elem. Med. Biol. 2010, 24, 69-77.
24. Berners-Price, S. J.; Frenkiel, T. A.; Frey, U.; Ranford, J. D.; Sadler, P. J.,
Hydrolysis products of cisplatin: pKa determinations via [1H,
15N] NMR
spectroscopy, J. Chem. Soc. Chem. Commun. 1992, 10, 789-791.
26
25. Dedon, P. C.; Borch, R. F., Characterization of the reactions of platinum
antitumor agents with biologic and nonbiologic sulfur-containing
nucleophiles, Biochem. Pharmacol. 1987, 36, 1955-1964.
26. Johnstone, T. C.; Wilson, J. J.; Lippard, S. J., Monofunctional and higher-
valent platinum anticancer agents, Inorg. Chem. 2013, 52, 12234-12249.
27. Miller, R. P.; Tadagavadi, R. K.; Ramesh, G.; Reeves, W. B., Mechanisms of
cisplatin nephrotoxicity, Toxins 2010, 2, 2490-2518.
28. Baradaran, A.; Tavafi, M.; Ardalan, M.-R.; Rafieian-Kopaei, M., Cisplatin;
nephrotoxicity and beyond, Ann. Res. Antioxid. 2016, 1. 1-6.
29. Leibbrandt, M. E.; Wolfgang, G. H.; Metz, A. L.; Ozobia, A. A.; Haskins, J.
R., Critical subcellular targets of cisplatin and related platinum analogs in rat
renal proximal tubule cells, Kidney Int. 1995, 48, 761-770.
30. Pabla, N.; Dong, Z., Cisplatin nephrotoxicity: mechanisms and renoprotective
strategies, Kidney Int. 2008, 73, 994-1007.
31. Thomson, D., Cisplatin-based therapy: a neurological and neuropsychological
review, Psychooncology 2000, 9, 29-39.
32. McWhinney, S. R.; Goldberg, R. M.; McLeod, H. L., Platinum neurotoxicity
pharmacogenetics, Mol. Cancer Ther. 2009, 8, 10-16.
33. Waissbluth, S.; Peleva, E.; Daniel, S. J., Platinum-induced ototoxicity: a
review of prevailing ototoxicity criteria, Eur. Arch. Oto-Rhino-Laryngol.
2016, 1-10.
34. Kartalou, M.; Essigmann, J. M., Mechanisms of resistance to cisplatin, Mutat.
Res. 2001, 478, 23-43.
35. Siddik, Z. H., Cisplatin: mode of cytotoxic action and molecular basis of
resistance, Oncogene 2003, 22, 7265-7279.
36. Gately, D.; Howell, S., Cellular accumulation of the anticancer agent
cisplatin, Br. J. Cancer 1993, 67, 1171.
37. Blair, B. G.; Larson, C. A.; Safaei, R.; Howell, S. B., Copper transporter 2
regulates the cellular accumulation and cytotoxicity of cisplatin and
carboplatin, Clin. Cancer Res. 2009, 15, 4312-4321.
27
38. Song, I.-S.; Savaraj, N.; Siddik, Z. H.; Liu, P.; Wei, Y.; Wu, C. J.; Kuo, M. T.,
Role of human copper transporter Ctr1 in the transport of platinum-based
antitumor agents in cisplatin-sensitive and cisplatin-resistant cells, Mol.
Cancer Ther. 2004, 3, 1543-1549.
39. Safaei, R.; Howell, S. B., Copper transporters regulate the cellular
pharmacology and sensitivity to Pt drugs, Crit. Rev. Oncol. Hematol. 2005,
53, 13-23.
40. Song, I.; Savaraj, N.; Siddik, Z. H.; Liu, P.; Wei, Y.; Wu, C.; Kuo, M. T.,
Role of human copper transporter Ctr1 in the transport of platinum-based
antitumor agents in cisplatin-sensitive and cisplatin-resistant cells, AACR
2005.
41. Holzer, A. K.; Manorek, G. H.; Howell, S. B., Contribution of the major
copper influx transporter CTR1 to the cellular accumulation of cisplatin,
carboplatin and oxaliplatin, Mol. Pharmacol. 2006, 70, 1390-1394.
42. Safaei, R.; Holzer, A. K.; Katano, K.; Samimi, G.; Howell, S. B., The role of
copper transporters in the development of resistance to Pt drugs, J. Inorg.
Biochem. 2004, 98, 1607-1613.
43. Kuo, M. T.; Chen, H. H.; Song, I.-S.; Savaraj, N.; Ishikawa, T., The roles of
copper transporters in cisplatin resistance, Cancer Metast. Rev. 2007, 26, 71-
83.
44. Andrews, P. A.; Velury, S.; Mann, S. C.; Howell, S. B., cis-Diamminedi-
chloroplatinum(II) accumulation in sensitive and resistant human ovarian
carcinoma cells, Cancer Res. 1988, 48, 68-73.
45. Sharp, S. Y.; Rogers, P. M.; Kelland, L. R., Transport of cisplatin and bis-
acetato-ammine-dichlorocyclohexylamine Platinum(IV)(JM216) in human
ovarian carcinoma cell lines: identification of a plasma membrane protein
associated with cisplatin resistance, Clin. Cancer Res. 1995, 1, 981-989.
46. Dornish, J.; Melvik, J.; Pettersen, E., Reduced cellular uptake of cis-
dichlorodiammine-platinum by benzaldehyde, Anticancer Res. 1985, 6, 583-
588.
28
47. Dornish, J. M.; Pettersen, E. O., Protection from cis-dichlorodiammine
platinum-induced cell inactivation by aldehydes involves cell membrane
amino groups, Cancer Lett. 1985, 29, 235-243.
48. Dornish, J.; Pettersen, E., Modulation of cis-dichlorodiammineplatinum(II)-
induced cytotoxicity by benzaldehyde derivatives, Cancer Lett. 1989, 46, 63-
68.
49. Pettersen, E.; Schwarze, P.; Dornish, J.; Nesland, J., Antitumour effect of
benzylidene-glucose (BG) in rats with chemically induced hepatocellular
carcinoma, Anticancer Res. 1985, 6, 147-152.
50. Kruh, G. D.; Belinsky, M. G., The MRP family of drug efflux pumps,
Oncogene 2003, 22, 7537.
51. Yamasaki, M.; Makino, T.; Masuzawa, T.; Kurokawa, Y.; Miyata, H.;
Takiguchi, S.; Nakajima, K.; Fujiwara, Y.; Matsuura, N.; Mori, M., Role of
multidrug resistance protein 2 (MRP2) in chemoresistance and clinical
outcome in oesophageal squamous cell carcinoma, Br. J. Cancer 2011, 104,
707-713.
52. La Fontaine, S.; Mercer, J. F., Trafficking of the copper-ATPases, ATP7A and
ATP7B: role in copper homeostasis, Arch. Biochem. Biophys. 2007, 463, 149-
167.
53. Prohaska, J. R.; Gybina, A. A., Intracellular copper transport in mammals, J.
Nutr. 2004, 134, 1003-1006.
54. Li, Z.-h.; Zheng, R.; Chen, J.-t.; Jia, J.; Qiu, M., The role of copper transporter
ATP7A in platinum-resistance of esophageal squamous cell cancer (ESCC), J.
Cancer 2016, 7, 2085.
55. Nakayama, K.; Miyazaki, K.; Kanzaki, A.; Fukumoto, M.; Takebayashi, Y.,
Expression and cisplatin sensitivity of copper-transporting P-type adenosine
triphosphatase (ATP7B) in human solid carcinoma cell lines, Oncol. Rep.
2001, 8, 1285-1287.
56. Galluzzi, L.; Senovilla, L.; Vitale, I.; Michels, J.; Martins, I.; Kepp, O.;
Castedo, M.; Kroemer, G., Molecular mechanisms of cisplatin resistance,
Oncogene 2012, 31, 1869-1883.
29
57. Casini, A.; Reedijk, J., Interactions of anticancer Pt compounds with proteins:
an overlooked topic in medicinal inorganic chemistry, Chem. Sci. 2012, 3,
3135-3144.
58. Martin, L. P.; Hamilton, T. C.; Schilder, R. J., Platinum resistance: The role of
DNA repair pathways, Clin. Cancer Res. 2008, 14, 1291-1295.
59. Sancar, A., Mechanisms of DNA excision repair, Science 1994, 266, 1954-
1956.
60. Friedberg, E. C., How nucleotide excision repair protects against cancer, Nat.
Rev. Cancer 2001, 1, 22-33.
61. Ferry, K. V.; Hamilton, T. C.; Johnson, S. W., Increased nucleotide excision
repair in cisplatin-resistant ovarian cancer cells: role of ERCC1–XPF,
Biochem. Pharmacol. 2000, 60, 1305-1313.
62. Zhou, W.; Gurubhagavatula, S.; Liu, G.; Park, S.; Neuberg, D. S.; Wain, J. C.;
Lynch, T. J.; Su, L.; Christiani, D. C., Excision repair cross-complementation
group 1 polymorphism predicts overall survival in advanced non-small cell
lung cancer patients treated with platinum-based chemotherapy, Clin. Cancer
Res. 2004, 10, 4939-4943.
63. Bosl, G. J.; Motzer, R. J., Testicular germ-cell cancer, N. Engl. J. Med. 1997,
337, 242-254.
64. Zhang, C. X.; Chang, P. V.; Lippard, S. J., Identification of nuclear proteins
that interact with platinum-modified DNA by photo affinity labeling, J. Am.
Chem. Soc. 2004, 126, 6536-6537.
65. Guggenheim, E. R.; Xu, D.; Zhang, C. X.; Chang, P. V.; Lippard, S. J., Photo
affinity isolation and identification of proteins in cancer cell extracts that bind
to platinum‐modified DNA, ChemBioChem 2009, 10, 141-157.
66. Pil, P. M.; Lippard, S. J., Specific binding of chromosomal protein HMG1 to
DNA damaged by the anticancer drug cisplatin, Science 1992, 256, 234-237.
67. Zlatanova, J.; Yaneva, J.; Leuba, S. H., Proteins that specifically recognize
cisplatin-damaged DNA: a clue to anticancer activity of cisplatin, FASEB J.
1998, 12, 791-799.
30
68. Chow, C. S.; Barnes, C. M.; Lippard, S. J., A single HMG domain in high-
mobility group 1 protein binds to DNAs as small as 20 base pairs containing
the major cisplatin adduct, Biochemistry 1995, 34, 2956-2964.
69. Dunham, S. U.; Lippard, S. J., DNA sequence context and protein compos-
ition modulate HMG-domain protein recognition of cisplatin-modified DNA,
Biochemistry 1997, 36, 11428-11436.
70. Ohndorf, U.-M.; Rould, M. A.; He, Q.; Pabo, C. O.; Lippard, S. J., Basis for
recognition of cisplatin-modified DNA by high-mobility-group proteins,
Nature 1999, 399, 708-712.
71. McA'Nulty, M. M.; Lippard, S. J., The HMG-domain protein Ixr1 blocks
excision repair of cisplatin-DNA adducts in yeast, Mutat. Res. 1996, 362, 75-
86.
72. Huang, J.-C.; Zamble, D. B.; Reardon, J. T.; Lippard, S. J.; Sancar, A., HMG-
domain proteins specifically inhibit the repair of the major DNA adduct of the
anticancer drug cisplatin by human excision nuclease, Proc. Natl. Acad. Sci.
USA 1994, 91, 10394-10398.
73. He, Q.; Liang, C. H.; Lippard, S. J., Steroid hormones induce HMG1 over
expression and sensitize breast cancer cells to cisplatin and carboplatin, Proc.
Natl. Acad. Sci. USA 2000, 97, 5768-5772.
74. Catena, R.; Escoffier, E.; Caron, C.; Khochbin, S.; Martianov, I.; Davidson, I.,
HMGB4, a novel member of the HMGB family, is preferentially expressed in
the mouse testis and localizes to the basal pole of elongating spermatids, Biol.
Reprod. 2009, 80, 358-366.
75. Li, G.-M., Mechanisms and functions of DNA mismatch repair, Cell Res.
2008, 18, 85-98.
76. Kunkel, T. A.; Erie, D. A., DNA mismatch repair, Annu. Rev. Biochem. 2005,
74, 681-710.
77. Mello, J. A.; Acharya, S.; Fishel, R.; Essigmann, J. M., The mismatch-repair
protein hMSH2 binds selectively to DNA adducts of the anticancer drug
cisplatin, Chem. Biol. 1996, 3, 579-589.
31
78. Guo, W.-J.; Zhang, Y.-M.; Zhang, L.; Huang, B.; Tao, F.-F.; Chen, W.; Guo,
Z.-J.; Xu, Q.; Sun, Y., Novel monofunctional platinum(II) complex Mono-Pt
induces apoptosis-independent autophagic cell death in human ovarian
carcinoma cells, distinct from cisplatin, Autophagy 2013, 9, 996-1008.
79. Suntharalingam, K.; Mendoza, O.; Duarte, A. A.; Mann, D. J.; Vilar, R., A
platinum complex that binds non-covalently to DNA and induces cell death
via a different mechanism than cisplatin, Metallomics 2013, 5, 514-523.
80. Wheate, N. J.; Walker, S.; Craig, G. E.; Oun, R., The status of platinum
anticancer drugs in the clinic and in clinical trials, Dalton trans. 2010, 39,
8113-8127.
81. Bursova, V.; Kasparkova, J.; Hofr, C.; Brabec, V., Effects of monofunctional
adducts of platinum(II) complexes on thermodynamic stability and energetics
of DNA duplexes, Biophys. J. 2005, 88, 1207-1214.
82. Kelland, L. R., New platinum antitumor complexes, Crit. Rev. Oncol.
Hematol. 1993, 15, 191-219.
83. Tullius, T. D.; Lippard, S. J., Ethidium bromide changes the nuclease-
sensitive DNA binding sites of the antitumor drug cis-
diamminedichloroplatinum(II), Proc. Natl. Acad. Sci. USA 1982, 79, 3489-
3492.
84. Malinge, J.-M.; Leng, M., Reaction of nucleic acids and cis-
diamminedichloroplatinum(II) in the presence of intercalating agents, Proc.
Natl. Acad. Sci. USA 1986, 83, 6317-6321.
85. Lippard, S. J.; Ushay, H. M.; Merkel, C. M.; Poirier, M. C., Use of antibodies
to probe the stereochemistry of antitumor platinum drug binding to DNA,
Biochemistry 1983, 22, 5165-5168.
86. Malinge, J.-M.; Schwartz, A.; Leng, M., Characterization of the ternary
complexes formed in the reaction of cis-diamminedichloroplatinum(II),
ethidium bromide and nucleic acids, Nucleic Acids Res. 1987, 15, 1779-1797.
87. Sundquist, W. I.; Bancroft, D. P.; Chassot, L.; Lippard, S. J., DNA promotes
the reaction of cis-diamminedichloroplatinum(II) with the exocyclic amino
groups of ethidium bromide, J. Am. Chem. Soc. 1988, 110, 8559-8560.
32
88. Hollis, L. S.; Amundsen, A. R.; Stern, E. W., Chemical and biological
properties of a new series of cis-diammineplatinum(II) antitumor agents
containing three nitrogen donors: cis-[Pt(NH3)2(N-donor) Cl]+, J. Med. Chem.
1989, 32, 128-136.
89. Hollis, L. S.; Sundquist, W. I.; Burstyn, J. N.; Heiger-Bernays, W. J.; Bellon,
S. F.; Ahmed, K. J.; Amundsen, A. R.; Stern, E. W.; Lippard, S. J.,
Mechanistic studies of a novel class of trisubstituted platinum(II) antitumor
agents, Cancer Res. 1991, 51, 1866-1875.
90. Lempers, E.; Bloemink, M.; Brouwer, J.; Kidani, Y.; Reedijk, J., The new
antitumor compound, cis-[Pt(NH3)2(4-methylpyridine)Cl]Cl, does not form
N7, N7-d (GpG) chelates with DNA. An unexpected preference for platinum
binding at the 5′ G in d (GpG), J. Inorg. Biochem. 1990, 40, 23-35.
91. Bloemink, M. J.; Engelking, H.; Karentzopoulos, S.; Krebs, B.; Reedijk, J.,
Synthesis, crystal structure, antitumor activity, and DNA-binding properties of
the new active platinum compound (bis-(N-methylimidazol-2-yl)carbinol)
dichloroplatinum(II), lacking a NH moiety and of the inactive analog dichloro
(N1, N
1‘-dimethyl-2,2‘-biimidazole)platinum(II), Inorg. Chem. 1996, 35, 619-
627.
92. Michelakis, E.; Webster, L.; Mackey, J., Dichloroacetate (DCA) as a potential
metabolic-targeting therapy for cancer, Br. J. Cancer 2008, 99, 989-994.
93. Hamilton, G.; Olszewski, U., Picoplatin pharmacokinetics and chemotherapy
of non-small cell lung cancer, Expert Opin. Drug Metab. Toxicol. 2013, 9,
1381-1390.
94. Bauer, C.; Peleg‐Shulman, T.; Gibson, D.; Wang, A. H. J., Monofunctional
platinum amine complexes destabilize DNA significantly, Eur. J. Biochem.
1998, 256, 253-260.
95. Zhang, J.; Wang, X.; Tu, C.; Lin, J.; Ding, J.; Lin, L.; Wang, Z.; He, C.; Yan,
C.; You, X., Monofunctional platinum complexes showing potent cytotoxicity
against human liver carcinoma cell line BEL-7402, J. Med. Chem. 2003, 46,
3502-3507.
33
96. Park, G. Y.; Wilson, J. J.; Song, Y.; Lippard, S. J., Phenanthriplatin, a
monofunctional DNA-binding platinum anticancer drug candidate with
unusual potency and cellular activity profile, Proc. Natl. Acad. Sci. USA 2012,
109, 11987-11992.
97. Wang, D.; Zhu, G.; Huang, X.; Lippard, S. J., X-ray structure and mechanism
of RNA polymerase II stalled at an antineoplastic monofunctional platinum-
DNA adduct, Proc. Natl. Acad. Sci. USA 2010, 107, 9584-9589.
98. Kellinger, M. W.; Park, G. Y.; Chong, J.; Lippard, S. J.; Wang, D., Effect of a
monofunctional phenanthriplatin-DNA adduct on RNA polymerase II
transcriptional fidelity and translesion synthesis, J. Am. Chem. Soc. 2013, 135,
13054-13061.
99. Cortés, R.; Crespo, M.; Davin, L.; Martín, R.; Quirante, J.; Ruiz, D.;
Messeguer, R.; Calvis, C.; Baldomà, L.; Badia, J., Seven-membered
cycloplatinated complexes as a new family of anticancer agents. X-ray
characterization and preliminary biological studies, Eur. J. Med. Chem. 2012,
54, 557-566.
100. Ferraz, K. S.; Da Silva, J. G.; Costa, F. M.; Mendes, B. M.; Rodrigues, B. L.;
dos Santos, R. G.; Beraldo, H., N (4)-Tolyl-2-acetylpyridine thiosemi-
carbazones and their platinum(II, IV) and gold(III) complexes: cytotoxicity
against human glioma cells and studies on the mode of action, Biometals
2013, 26, 677-691.
101. Ma, Z.; Choudhury, J. R.; Wright, M. W.; Day, C. S.; Saluta, G.; Kucera, G.
L.; Bierbach, U., A non-cross-linking platinum-acridine agent with potent
activity in non-small-cell lung cancer, J. Med. Chem. 2008, 51, 7574-7580.
102. Graham, L. A.; Wilson, G. M.; West, T. K.; Day, C. S.; Kucera, G. L.;
Bierbach, U., Unusual reactivity of a potent platinum–acridine hybrid
antitumor agent, ACS Med. Chem. Lett. 2011, 2, 687-691.
103. Qiao, X.; Zeitany, A. E.; Wright, M. W.; Essader, A. S.; Levine, K. E.;
Kucera, G. L.; Bierbach, U., Analysis of the DNA damage produced by a
platinum–acridine antitumor agent and its effects in NCI-H460 lung cancer
cells, Metallomics 2012, 4, 645-652.
34
104. Baruah, H.; Rector, C. L.; Monnier, S. M.; Bierbach, U., Mechanism of action
of non cisplatin type DNA-targeted platinum anticancer agents: DNA
interactions of novel acridinylthioureas and their platinum conjugates,
Biochem. Pharmacol. 2002, 64, 191-200.
105. Kostrhunova, H.; Malina, J.; Pickard, A. J.; Stepankova, J.; Vojtiskova, M.;
Kasparkova, J.; Muchova, T.; Rohlfing, M. L.; Bierbach, U.; Brabec, V.,
Replacement of a thiourea with an amidine group in a monofunctional
platinum–acridine antitumor agent. Effect on DNA interactions, DNA adduct
recognition and repair, Mol. Pharm. 2011, 8, 1941-1954.
106. Xian Chong, S.; Chik Fun Au-Yeung, S.; Kin Wah To, K., Monofunctional
platinum(II) compounds–shifting the paradigm in designing new Pt-based
anticancer agents, Curr. Med. Chem. 2016, 23, 1268-1285.
107. Guo, W.-J.; Zhang, Y.-M.; Zhang, L.; Huang, B.; Tao, F.-F.; Chen, W.; Guo,
Z.-J.; Xu, Q.; Sun, Y., Novel monofunctional platinum(II) complex mono-Pt
induces apoptosis-independent autophagic cell death in human ovarian
carcinoma cells, distinct from cisplatin, Autophagy 2013, 9, 996-1008.
108. Wu, S.; Wang, X.; Zhu, C.; Song, Y.; Wang, J.; Li, Y.; Guo, Z.,
Monofunctional platinum complexes containing a 4-nitrobenzo-2-oxa-1,3-
diazole fluorophore: Distribution in tumour cells, Dalton Trans. 2011, 40,
10376-10382.
109. Sui, X.; Chen, R.; Wang, Z.; Huang, Z.; Kong, N.; Zhang, M.; Han, W.; Lou,
F.; Yang, J.; Zhang, Q., Autophagy and chemotherapy resistance: a promising
therapeutic target for cancer treatment, Cell Death Dis. 2013, 4, e838.
110. Dalby, K.; Tekedereli, I.; Lopez-Berestein, G.; Ozpolat, B., Targeting the pro-
death and pro-survival functions of autophagy as novel therapeutic strategies
in cancer, Autophagy 2010, 6, 322-329.
111. Amaravadi, R. K.; Yu, D.; Lum, J. J.; Bui, T.; Christophorou, M. A.; Evan, G.
I.; Thomas-Tikhonenko, A.; Thompson, C. B., Autophagy inhibition enhances
therapy-induced apoptosis in a Myc-induced model of lymphoma, J. Clin.
Invest. 2007, 117, 326-336.
35
112. Wang, J.; Wu, G. S., Role of autophagy in cisplatin resistance in ovarian
cancer cells, J. Biol. Chem. 2014, 289, 17163-17173.
113. Denton, D.; Xu, T.; Kumar, S., Autophagy as a pro-death pathway, Immunol.
Cell Biol. 2015, 93, 35-42.
114. Lakin, N. D.; Jackson, S. P., Regulation of p53 in response to DNA damage,
Oncogene 1999, 18, 7644-7655.
115. Zamble, D. B.; Jacks, T.; Lippard, S. J., p53-Dependent and-independent
responses to cisplatin in mouse testicular teratocarcinoma cells, Proc. Natl.
Acad. Sci. USA 1998, 95, 6163-6168.
116. Hagopian, G. S.; Mills, G. B.; Khokhar, A. R.; Bast, R. C.; Siddik, Z. H.,
Expression of p53 in cisplatin resistant ovarian cancer cell lines: modulation
with the novel platinum analogue (1R, 2R-diaminocyclohexane)(trans-
diacetato)(dichloro)platinum(IV), Clin. Cancer Res. 1999, 5, 655-663.
117. Bragado, P.; Armesilla, A.; Silva, A.; Porras, A., Apoptosis by cisplatin
requires p53 mediated p38α MAPK activation through ROS generation,
Apoptosis 2007, 12, 1733-1742.
118. García-Cano, J.; Ambroise, G.; Pascual-Serra, R.; Carrión, M. C.; Serrano-
Oviedo, L.; Ortega-Muelas, M.; Cimas, F. J.; Sabater, S.; Ruiz-Hidalgo, M. J.;
Perez, I. S., Exploiting the potential of autophagy in cisplatin therapy: A new
strategy to overcome resistance, Oncotarget 2015, 6, 15551-15565.
119. Amaravadi, R. K.; Yu, D.; Lum, J. J.; Bui, T.; Christophorou, M. A.; Evan, G.
I.; Thomas-Tikhonenko, A.; Thompson, C. B., Autophagy inhibition enhances
therapy-induced apoptosis in a myc-induced model of lymphoma, J. Clin.
Invest. 2007, 117, 326-336.
120. Lefranc, F.; Facchini, V.; Kiss, R., Proautophagic drugs: a novel means to
combat apoptosis-resistant cancers, with a special emphasis on glioblastomas,
Oncologist 2007, 12, 1395-1403.
121. Clarke, P. G., Developmental cell death: morphological diversity and multiple
mechanisms, Anat. Embryol. 1990, 181, 195-213.
122. Golstein, P.; Kroemer, G., Cell death by necrosis: towards a molecular
definition, Trends Biochem. Sci. 2007, 32, 37-43.
36
123. Wang, X.; Feng, Y.; Wang, N.; Cheung, F.; Tan, H. Y.; Zhong, S.; Li, C.;
Kobayashi, S., Chinese medicines induce cell death: the molecular and
cellular mechanisms for cancer therapy, BioMed Res. Int. 2014, 2014, 1-14.
124. Galluzzi, L.; Kroemer, G., Necroptosis: a specialized pathway of programmed
necrosis, Cell 2008, 135, 1161-1163.
125. Sperandio, S.; Poksay, K.; De Belle, I.; Lafuente, M.; Liu, B.; Nasir, J.;
Bredesen, D., Paraptosis: mediation by MAP kinases and inhibition by AIP-
1/Alix, Cell Death Differ. 2004, 11, 1066-1075.
126. Larocque, K.; Ovadje, P.; Djurdjevic, S.; Mehdi, M.; Green, J.; Pandey, S.,
Novel analogue of colchicine induces selective pro-death autophagy and
necrosis in human cancer cells, PloS One 2014, 9, e87064.
127. Degenhardt, K.; Mathew, R.; Beaudoin, B.; Bray, K.; Anderson, D.; Chen, G.;
Mukherjee, C.; Shi, Y.; Gélinas, C.; Fan, Y., Autophagy promotes tumor cell
survival and restricts necrosis, inflammation, and tumorigenesis, Cancer cell
2006, 10, 51-64.
128. Gandin, V.; Pellei, M.; Tisato, F.; Porchia, M.; Santini, C.; Marzano, C., A
novel copper complex induces paraptosis in colon cancer cells via the
activation of ER stress signaling, J. Cell. Mol. Med. 2012, 16, 142-151.
129. Sperandio, S.; de Belle, I.; Bredesen, D. E., An alternative, nonapoptotic form
of programmed cell death, Proc. Natl. Acad. Sci. USA 2000, 97, 14376-14381.
130. Apps, M. G.; Choi, E. H.; Wheate, N. J., The state-of-play and future of
platinum drugs, Endocr.-Relat. Cancer, 2015, 22, R219-R233.
131. Pasetto, L. M.; D’Andrea, M. R.; Rossi, E.; Monfardini, S., Oxaliplatin-
related neurotoxicity: how and why?, Crit. Rev. Oncol. Hematol., 2006, 59,
159-168.
132. Wing, R. M.; Pjura, P.; Drew, H. R.; Dickerson, R. E., The primary mode of
binding of cisplatin to a B-DNA dodecamer: CGCGAATTCGCG, EMBO J.,
1984, 3, 1201-1206.
133. Graham, J.; Muhsin, M.; Kirkpatrick, P., Oxaliplatin, Nat. Rev. Drug
Discovery, 2004, 3, 11-12.
37
134. Misset, J. L.; Bleiberg, H.; Sutherland, W.; Bekradda, M.; Cvitkovic, E.,
Oxaliplatin clinical activity: a review, Crit. Rev. Oncol. Hematol., 2000, 35,
75-93.
135. Shimada, H.; Sugimachi, N.; Funakoshi, T.; kojima, S., Prevention of renal
toxicity of cis-diamminedichloroplatinum by dithiocarbamates in rats,
Toxicol. Lett., 1993, 66, 193-198.
Chapter 2
EXPERIMENTAL
38
2.1 Materials
Precursors such as benzylpiperazine, 1-(2-furoyl)piperazine, diphenylmethylpiperazine,
4-nitrophenylpiperazine, 4-methoxyphenylpiperazinne, 4-hydroxyphenylpiperazine, 2-
hydroxyethylpiperazine, 4-(3-(piperidin-3-yl)propyl)piperidine and tris-(4-flourophenyl)-
phosphine were purchased from Sigma-Aldrich. Other precursors such as tris-(4-
chlorophenyl)phosphine, tris-(p-tolyl)phosphine, (diphenyl-p-tolyl)phosphine, bis-
diphenyldiphosphinobutane and platinum(II) chloride were procured from Wako Japan
and carbon disulfide from Riedel-de Haën. All the reagents were used without further
purification owing to their analytical grade quality. Solvents obtained from Daejung,
Sigma-Aldrich and Scharlau were dried-up by standard methods [1, 2]. CT-DNA (calf
thymus), acetic acid, ethylenediaminetetraacetic acid disodium salt, penicillin-G, pyruvic
acid, L-glutamine, sodium dodecyl sulfate (SDS), sodium sarcosinate, sodium chloride,
streptomycin sulfate, thiazolyl blue tetrazolium bromide (MTT), Triton X-100 and trizma
base were also acquired from Sigma-Aldrich. Dulbecco’s Modified Eagle Medium
(DMEM) and fetal bovine serum (FBS) were purchased from GibcoBRL, Gaithersburg,
MD.
2.2 Instrumentation
Melting points were determined in a capillary tube using Gallenkamp (U.K) electro-
thermal melting point apparatus. IR spectra in the range of 4000-200 cm-1
were acquired
on a Thermo Scientific Nicolet-6700 FT-IR Spectrophotometer. Elemental analysis was
performed using a CE-440 Elemental Analyzer (Exeter Analytical, Inc.). 1H,
13C and
31P
NMR were recorded on a Bruker instrument using TMS (1H and
13C) and phosphoric acid
(31
P) as an internal reference. Chemical shifts are presented in ppm and coupling constant
(J) values are presented in Hz. The multiplicities of signals in 1H NMR are given with
chemical shifts (s = singlet, d = doublet, t = triplet, dd = doublet of a doublet, m =
multiplet). The X-ray single crystal analysis of the crystalline complexes was performed
by Bruker Kapa APEX-II CCD diffractometer assembled with a CCD detector set 40.0
mm from crystal. Different intensities were measured from a sealed ceramic diffraction
tube (SIEMENS) having monochromatic Mo-Kα radiation. Structures of the complexes
were solved by using Patterson and DIRDIF method. Further refinement on F2 was
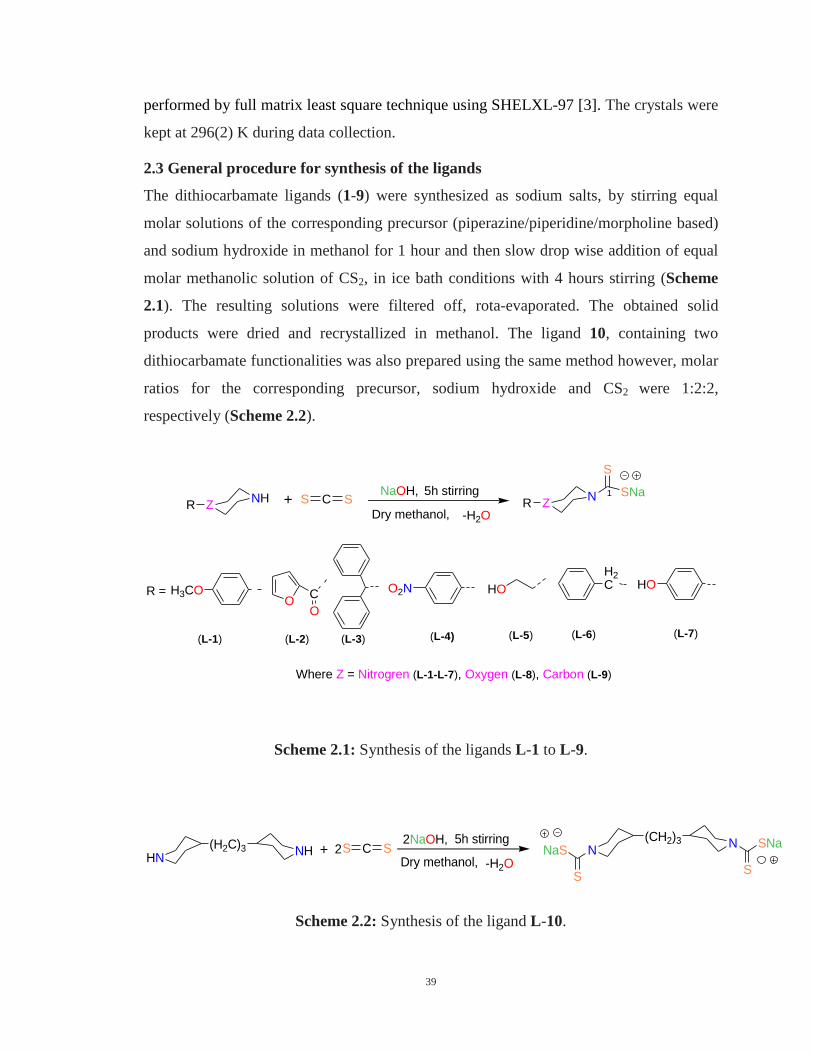
39
performed by full matrix least square technique using SHELXL-97 [3]. The crystals were
kept at 296(2) K during data collection.
2.3 General procedure for synthesis of the ligands
The dithiocarbamate ligands (1-9) were synthesized as sodium salts, by stirring equal
molar solutions of the corresponding precursor (piperazine/piperidine/morpholine based)
and sodium hydroxide in methanol for 1 hour and then slow drop wise addition of equal
molar methanolic solution of CS2, in ice bath conditions with 4 hours stirring (Scheme
2.1). The resulting solutions were filtered off, rota-evaporated. The obtained solid
products were dried and recrystallized in methanol. The ligand 10, containing two
dithiocarbamate functionalities was also prepared using the same method however, molar
ratios for the corresponding precursor, sodium hydroxide and CS2 were 1:2:2,
respectively (Scheme 2.2).
R ZNH
NaOH,+
5h stirring
Dry methanol,R Z
N SNa
S
1C SS
-H2O
H2CHOR =
(L-1)
H3COO
C
O
(L-2) (L-3)
O2N
(L-4) (L-5) (L-6)
HO
(L-7)
Where Z = Nitrogren (L-1-L-7), Oxygen (L-8), Carbon (L-9)
Scheme 2.1: Synthesis of the ligands L-1 to L-9.
2NaOH,+
5h stirring
Dry methanol,C SS
-H2O2(H2C)3 NH
HN
(CH2)3 NN
S
SNa
S
NaS
Scheme 2.2: Synthesis of the ligand L-10.
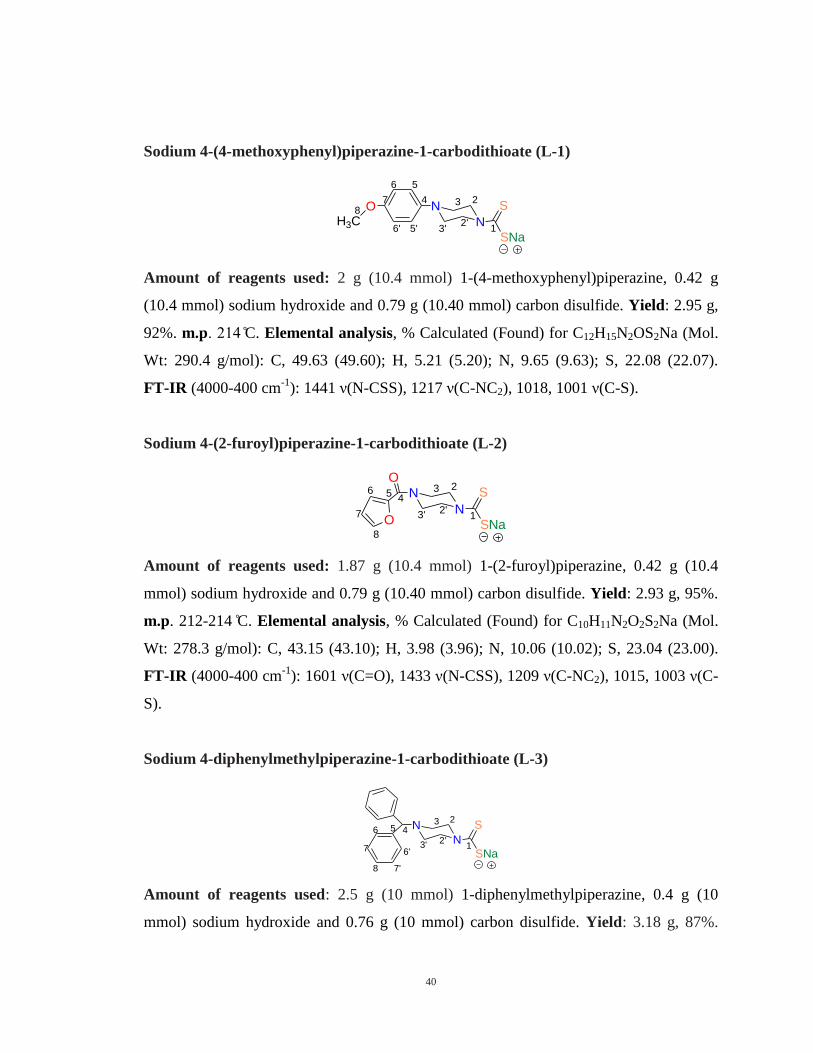
40
Sodium 4-(4-methoxyphenyl)piperazine-1-carbodithioate (L-1)
1
2
2'
3
3'
N
N
OH3C
SNa
S4
56
5'6'
78
Amount of reagents used: 2 g (10.4 mmol) 1-(4-methoxyphenyl)piperazine, 0.42 g
(10.4 mmol) sodium hydroxide and 0.79 g (10.40 mmol) carbon disulfide. Yield: 2.95 g,
92%. m.p. C. Elemental analysis, % Calculated (Found) for C12H15N2OS2Na (Mol.
Wt: 290.4 g/mol): C, 49.63 (49.60); H, 5.21 (5.20); N, 9.65 (9.63); S, 22.08 (22.07).
FT-IR (4000-400 cm-1
): 1441 ν(N-CSS), 1217 ν(C-NC2), 1018, 1001 ν(C-S).
Sodium 4-(2-furoyl)piperazine-1-carbodithioate (L-2)
2
2'
3
3'
N
N
SNa
S
1
456
7
8
O
O
Amount of reagents used: 1.87 g (10.4 mmol) 1-(2-furoyl)piperazine, 0.42 g (10.4
mmol) sodium hydroxide and 0.79 g (10.40 mmol) carbon disulfide. Yield: 2.93 g, 95%.
m.p. 212-214 C. Elemental analysis, % Calculated (Found) for C10H11N2O2S2Na (Mol.
Wt: 278.3 g/mol): C, 43.15 (43.10); H, 3.98 (3.96); N, 10.06 (10.02); S, 23.04 (23.00).
FT-IR (4000-400 cm-1
): 1601 ν(C=O), 1433 ν(N-CSS), 1209 ν(C-NC2), 1015, 1003 ν(C-
S).
Sodium 4-diphenylmethylpiperazine-1-carbodithioate (L-3)
2
2'
3
3'
N
N
SNa
S
1
456
6'7
7'8
Amount of reagents used: 2.5 g (10 mmol) 1-diphenylmethylpiperazine, 0.4 g (10
mmol) sodium hydroxide and 0.76 g (10 mmol) carbon disulfide. Yield: 3.18 g, 87%.
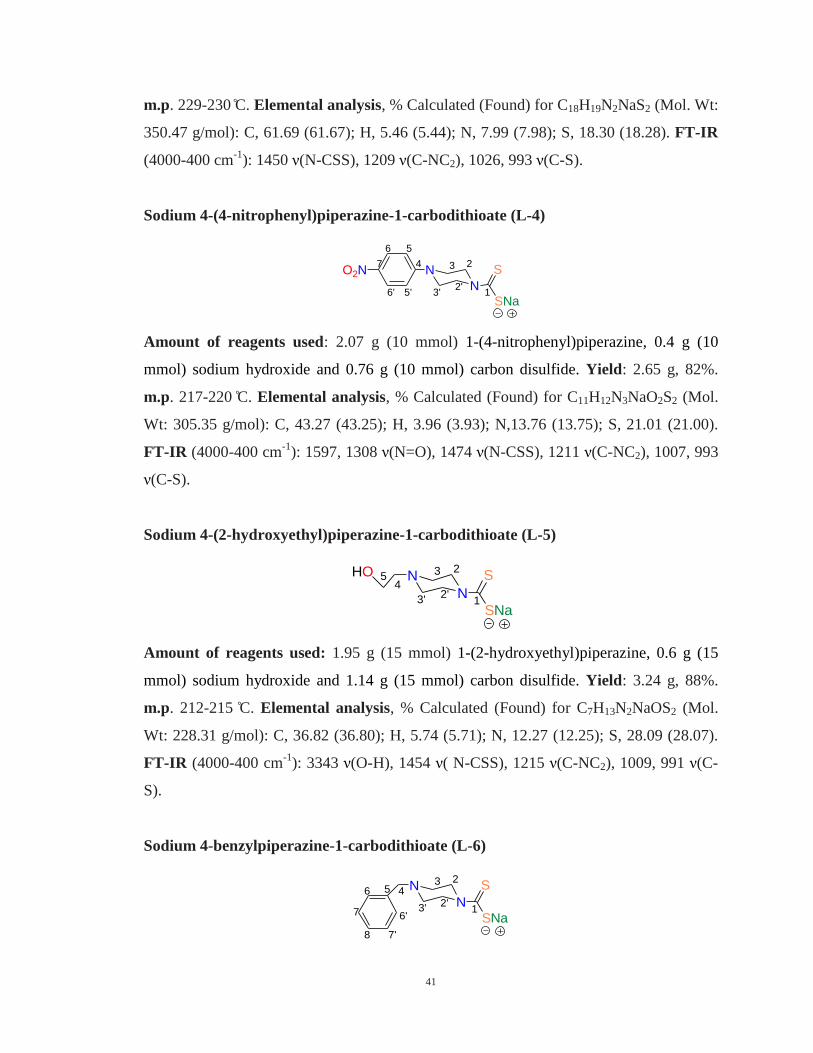
41
m.p. 229-230 C. Elemental analysis, % Calculated (Found) for C18H19N2NaS2 (Mol. Wt:
350.47 g/mol): C, 61.69 (61.67); H, 5.46 (5.44); N, 7.99 (7.98); S, 18.30 (18.28). FT-IR
(4000-400 cm-1
): 1450 ν(N-CSS), 1209 ν(C-NC2), 1026, 993 ν(C-S).
Sodium 4-(4-nitrophenyl)piperazine-1-carbodithioate (L-4)
2
2'
3
3'
N
N
O2N
SNa
S4
56
5'6'
7
1
Amount of reagents used: 2.07 g (10 mmol) 1-(4-nitrophenyl)piperazine, 0.4 g (10
mmol) sodium hydroxide and 0.76 g (10 mmol) carbon disulfide. Yield: 2.65 g, 82%.
m.p. 217-220 C. Elemental analysis, % Calculated (Found) for C11H12N3NaO2S2 (Mol.
Wt: 305.35 g/mol): C, 43.27 (43.25); H, 3.96 (3.93); N,13.76 (13.75); S, 21.01 (21.00).
FT-IR (4000-400 cm-1
): 1597, 1308 ν(N=O), 1474 ν(N-CSS), 1211 ν(C-NC2), 1007, 993
ν(C-S).
Sodium 4-(2-hydroxyethyl)piperazine-1-carbodithioate (L-5)
2
2'
3
3'
N
N
SNa
S
1
45HO
Amount of reagents used: 1.95 g (15 mmol) 1-(2-hydroxyethyl)piperazine, 0.6 g (15
mmol) sodium hydroxide and 1.14 g (15 mmol) carbon disulfide. Yield: 3.24 g, 88%.
m.p. 212-215 C. Elemental analysis, % Calculated (Found) for C7H13N2NaOS2 (Mol.
Wt: 228.31 g/mol): C, 36.82 (36.80); H, 5.74 (5.71); N, 12.27 (12.25); S, 28.09 (28.07).
FT-IR (4000-400 cm-1
): 3343 ν(O-H), 1454 ν( N-CSS), 1215 ν(C-NC2), 1009, 991 ν(C-
S).
Sodium 4-benzylpiperazine-1-carbodithioate (L-6)
2
2'
3
3'
N
N
SNa
S
1
456
6'7
7'8
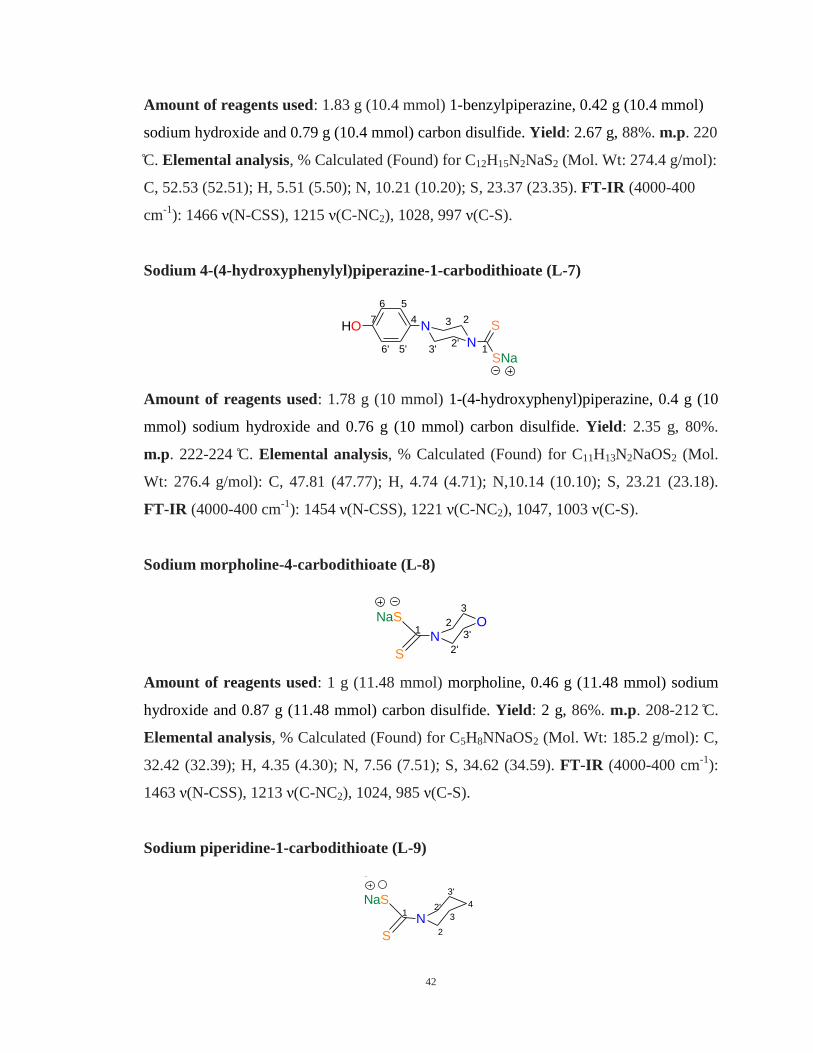
42
Amount of reagents used: 1.83 g (10.4 mmol) 1-benzylpiperazine, 0.42 g (10.4 mmol)
sodium hydroxide and 0.79 g (10.4 mmol) carbon disulfide. Yield: 2.67 g, 88%. m.p. 220
C. Elemental analysis, % Calculated (Found) for C12H15N2NaS2 (Mol. Wt: 274.4 g/mol):
C, 52.53 (52.51); H, 5.51 (5.50); N, 10.21 (10.20); S, 23.37 (23.35). FT-IR (4000-400
cm-1
): 1466 ν(N-CSS), 1215 ν(C-NC2), 1028, 997 ν(C-S).
Sodium 4-(4-hydroxyphenylyl)piperazine-1-carbodithioate (L-7)
2
2'
3
3'
N
N
HO
SNa
S4
56
5'6'
7
1
Amount of reagents used: 1.78 g (10 mmol) 1-(4-hydroxyphenyl)piperazine, 0.4 g (10
mmol) sodium hydroxide and 0.76 g (10 mmol) carbon disulfide. Yield: 2.35 g, 80%.
m.p. 222-224 C. Elemental analysis, % Calculated (Found) for C11H13N2NaOS2 (Mol.
Wt: 276.4 g/mol): C, 47.81 (47.77); H, 4.74 (4.71); N,10.14 (10.10); S, 23.21 (23.18).
FT-IR (4000-400 cm-1
): 1454 ν(N-CSS), 1221 ν(C-NC2), 1047, 1003 ν(C-S).
Sodium morpholine-4-carbodithioate (L-8)
NaS
S
NO
12
2'
3
3'
Amount of reagents used: 1 g (11.48 mmol) morpholine, 0.46 g (11.48 mmol) sodium
hydroxide and 0.87 g (11.48 mmol) carbon disulfide. Yield: 2 g, 86%. m.p. 208-212 C.
Elemental analysis, % Calculated (Found) for C5H8NNaOS2 (Mol. Wt: 185.2 g/mol): C,
32.42 (32.39); H, 4.35 (4.30); N, 7.56 (7.51); S, 34.62 (34.59). FT-IR (4000-400 cm-1
):
1463 ν(N-CSS), 1213 ν(C-NC2), 1024, 985 ν(C-S).
Sodium piperidine-1-carbodithioate (L-9)
NaS
S
N1
2
2'3
3'
4

43
Amount of reagents used: 0.862 g (10.12 mmol) piperidine, 0.405 g (10.12 mmol)
sodium hydroxide and 0.77 g (10.4 mmol) carbon disulfide. Yield: 1.73 g, 85%. m.p.
226-228 C. Elemental analysis, % Calculated (Found) for C6H10NNaS2 (Mol. Wt: 183.3
g/mol): C, 39.32 (39.27); H, 5.50 (5.48); N, 7.64(7.60); S, 34.99 (34.96). FT-IR (4000-
400 cm-1
): 1470 ν(N-CSS), 1215 ν(C-NC2), 1020, 999 ν(C-S).
Sodium 4,4ʹ-trimethylenedipiperidine-1-carbodithioate (L-10)
NaS
S
N
SNa
S
N1
2
2'
3
3'
4 5
6
Amount of reagents used: 2.1 g (10 mmol) 4-(3-(piperidin-3-yl)propyl)piperidine, 0.4 g
(10 mmol) sodium hydroxide and 0.76 g (10 mmol) carbon disulfide. Yield: 2.96 g, 91%.
m.p. 204-206 C. Elemental analysis, % Calculated (Found) for C15H24N2Na2S4 (Mol.
Wt: 406.6 g/mol): C, 44.31 (44.30); H, 5.95 (5.92); N, 6.89 (6.87); S, 31.54 (31.52).
FT-IR (4000-400 cm-1
): 1464 ν(N-CSS), 1207 ν(C-NC2), 1026, 999 ν(C-S).
2.4 General procedure for the synthesis of hetroleptic Pt(II) complexes
Heteroleptic platinum(II) complexes (1-37) containing dithiocarbamate, organophosphine
and chloride ligands were synthesized by simultaneous and dropwise addition of the
corresponding organophosphine (1 mmol) in chloroform and sodium salt of the dithio-
carbamate ligand (1 mmol) in methanol into the chloroform suspension of platinum(II)
chloride (1 mmol ) and refluxing the reaction mixture for 5 hours (Schemes 2.3 & 2.4).
The resulting solutions were filtered off and rota-evaporated to get the solid products,
which were then dissolved in acetone to remove sodium chloride, a side product of the
reaction. After filtration, rota-evaporation and drying, the products were then
recrystallized in chloroform and methanol.
Dinuclear heteroleptic platinum(II) complexes (38-42) were prepared adopting the same
general procedure however, molar ratios for the platinum(II) chloride, corresponding
organophosphine and dithiocarbamate ligands were 2:2:1 respectively (Schemes 2.5 &
2.6).
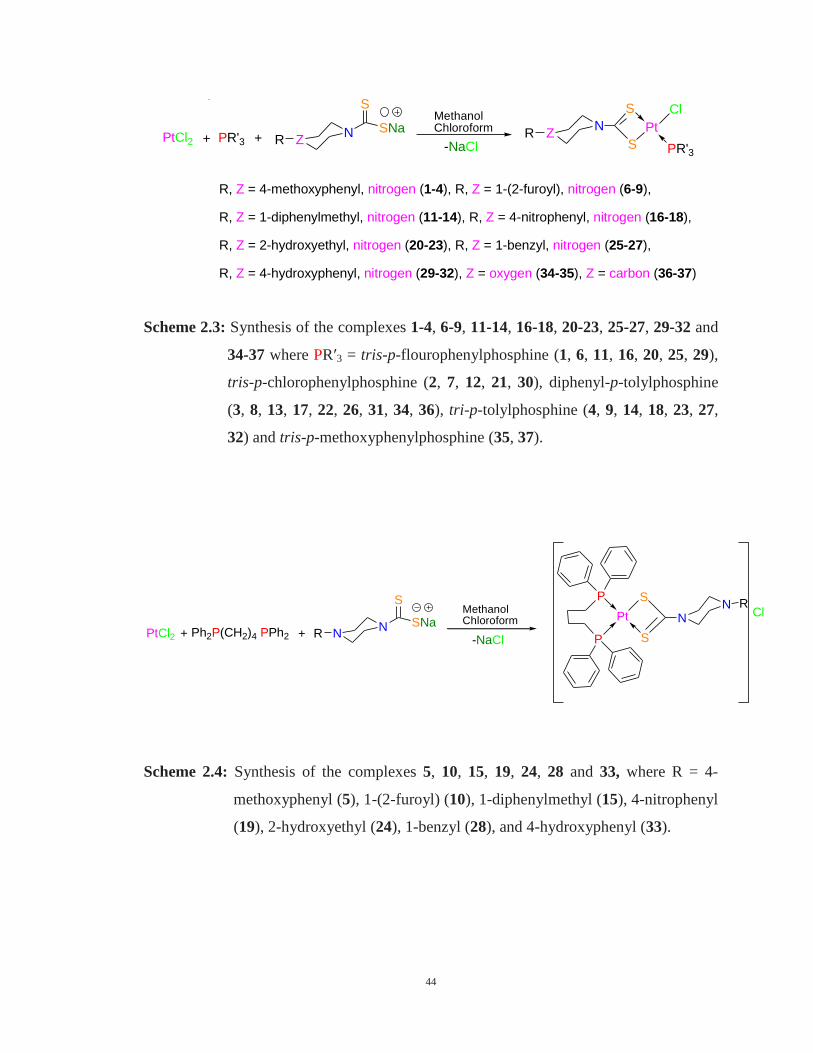
44
PtCl2 + RPR'3 ZN SNa
S
+
MethanolChloroform R Z
N
S
S
Pt
Cl
-NaCl PR'3
R, Z = 4-methoxyphenyl, nitrogen (1-4), R, Z = 1-(2-furoyl), nitrogen (6-9),
R, Z = 1-diphenylmethyl, nitrogen (11-14), R, Z = 4-nitrophenyl, nitrogen (16-18),
R, Z = 2-hydroxyethyl, nitrogen (20-23), R, Z = 1-benzyl, nitrogen (25-27),
R, Z = 4-hydroxyphenyl, nitrogen (29-32), Z = oxygen (34-35), Z = carbon (36-37)
Scheme 2.3: Synthesis of the complexes 1-4, 6-9, 11-14, 16-18, 20-23, 25-27, 29-32 and
34-37 where PRʹ3 = tris-p-flourophenylphosphine (1, 6, 11, 16, 20, 25, 29),
tris-p-chlorophenylphosphine (2, 7, 12, 21, 30), diphenyl-p-tolylphosphine
(3, 8, 13, 17, 22, 26, 31, 34, 36), tri-p-tolylphosphine (4, 9, 14, 18, 23, 27,
32) and tris-p-methoxyphenylphosphine (35, 37).
PtCl2 + RPh2P(CH2)4 PPh2 NN SNa
S
+
MethanolChloroform
-NaCl
Pt
P S
S
NN R
P
Cl
Scheme 2.4: Synthesis of the complexes 5, 10, 15, 19, 24, 28 and 33, where R = 4-
methoxyphenyl (5), 1-(2-furoyl) (10), 1-diphenylmethyl (15), 4-nitrophenyl
(19), 2-hydroxyethyl (24), 1-benzyl (28), and 4-hydroxyphenyl (33).
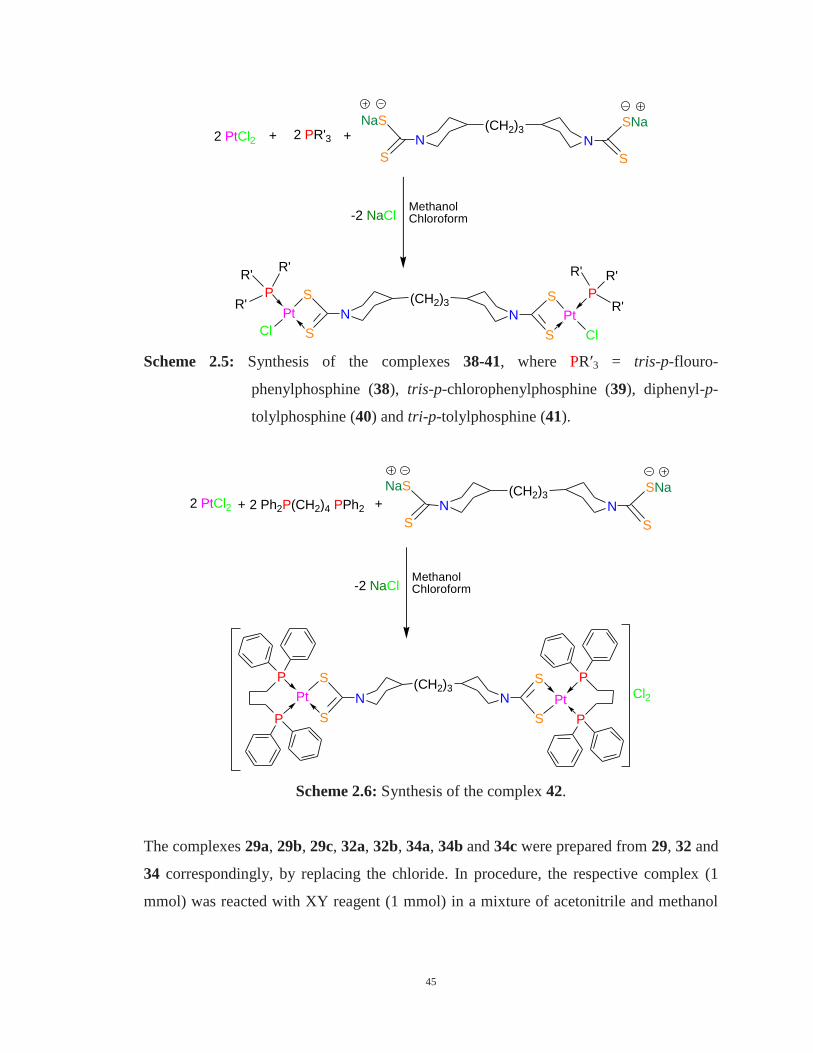
45
NaS
S
N(CH2)3
SNa
S
N
Pt
Cl
P S
S
R'N
R'R'
(CH2)3Pt
Cl
PS
S
R'N
R' R'
2 PtCl2 + 2 PR'3 +
MethanolChloroform-2 NaCl
Scheme 2.5: Synthesis of the complexes 38-41, where PRʹ3 = tris-p-flouro-
phenylphosphine (38), tris-p-chlorophenylphosphine (39), diphenyl-p-
tolylphosphine (40) and tri-p-tolylphosphine (41).
Pt
P S
S
N(CH2)3
P
Cl2Pt
PS
S P
N
2 PtCl2 + 2 Ph2P(CH2)4 PPh2 +
NaS
S
N(CH2)3
SNa
S
N
MethanolChloroform-2 NaCl
Scheme 2.6: Synthesis of the complex 42.
The complexes 29a, 29b, 29c, 32a, 32b, 34a, 34b and 34c were prepared from 29, 32 and
34 correspondingly, by replacing the chloride. In procedure, the respective complex (1
mmol) was reacted with XY reagent (1 mmol) in a mixture of acetonitrile and methanol
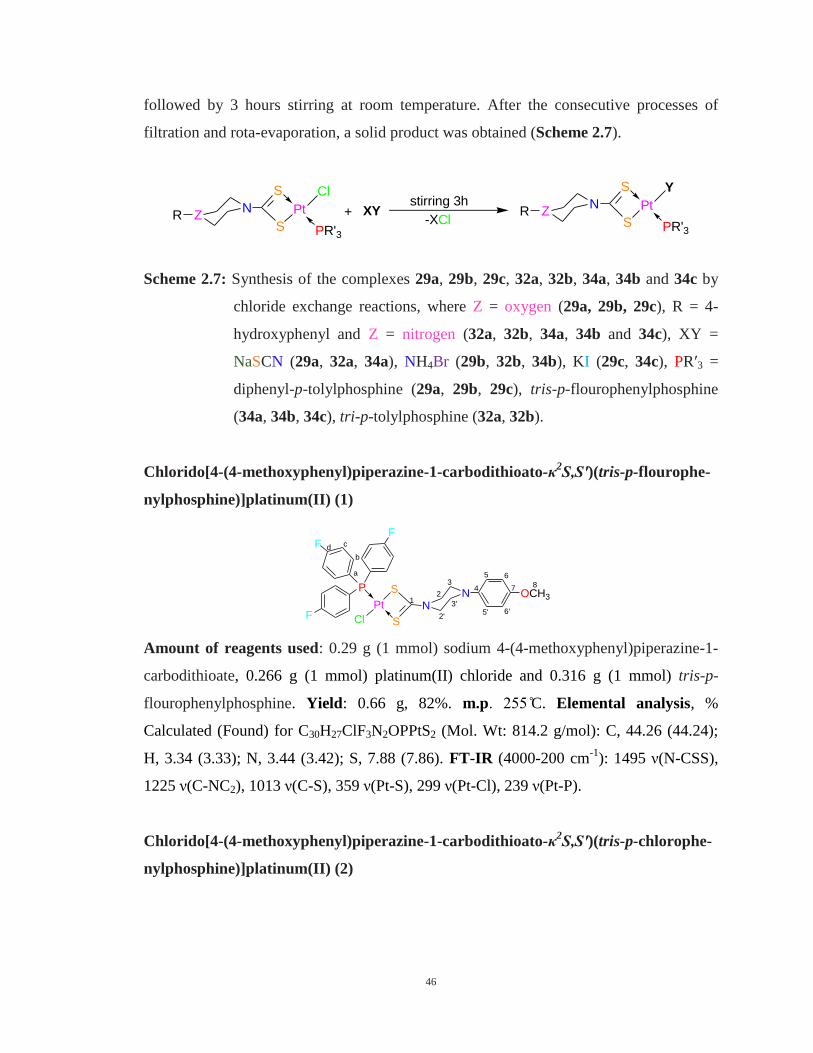
46
followed by 3 hours stirring at room temperature. After the consecutive processes of
filtration and rota-evaporation, a solid product was obtained (Scheme 2.7).
R ZN
S
S
Pt
Cl
PR'3
+ XYstirring 3h
-XClR Z
N
S
S
Pt
Y
PR'3
Scheme 2.7: Synthesis of the complexes 29a, 29b, 29c, 32a, 32b, 34a, 34b and 34c by
chloride exchange reactions, where Z = oxygen (29a, 29b, 29c), R = 4-
hydroxyphenyl and Z = nitrogen (32a, 32b, 34a, 34b and 34c), XY =
NaSCN (29a, 32a, 34a), NH4Br (29b, 32b, 34b), KI (29c, 34c), PRʹ3 =
diphenyl-p-tolylphosphine (29a, 29b, 29c), tris-p-flourophenylphosphine
(34a, 34b, 34c), tri-p-tolylphosphine (32a, 32b).
Chlorido[4-(4-methoxyphenyl)piperazine-1-carbodithioato-κ2S,Sʹ)(tris-p-flourophe-
nylphosphine)]platinum(II) (1)
Pt
Cl
P S
S
N
F
N OCH312
3
3'
2'
4
5 6
7
a
b
cd
F
F
6'5'
8
Amount of reagents used: 0.29 g (1 mmol) sodium 4-(4-methoxyphenyl)piperazine-1-
carbodithioate, 0.266 g (1 mmol) platinum(II) chloride and 0.316 g (1 mmol) tris-p-
flourophenylphosphine. Yield: 0.66 g, 82%. m.p. C. Elemental analysis, %
Calculated (Found) for C30H27ClF3N2OPPtS2 (Mol. Wt: 814.2 g/mol): C, 44.26 (44.24);
H, 3.34 (3.33); N, 3.44 (3.42); S, 7.88 (7.86). FT-IR (4000-200 cm-1
): 1495 ν(N-CSS),
1225 ν(C-NC2), 1013 ν(C-S), 359 ν(Pt-S), 299 ν(Pt-Cl), 239 ν(Pt-P).
Chlorido[4-(4-methoxyphenyl)piperazine-1-carbodithioato-κ2S,Sʹ)(tris-p-chlorophe-
nylphosphine)]platinum(II) (2)
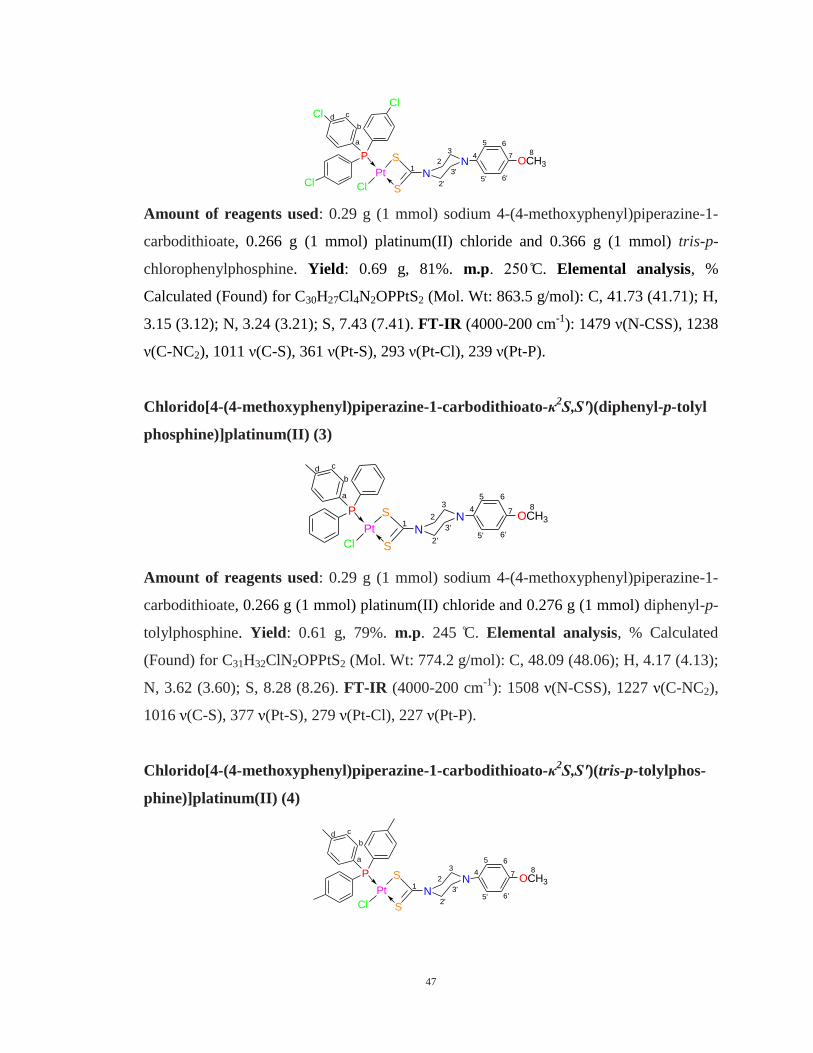
47
Pt
Cl
P S
S
N
Cl
N OCH31
2
3
3'
2'
4
5 6
7
a
b
cd
Cl
Cl
6'5'
8
Amount of reagents used: 0.29 g (1 mmol) sodium 4-(4-methoxyphenyl)piperazine-1-
carbodithioate, 0.266 g (1 mmol) platinum(II) chloride and 0.366 g (1 mmol) tris-p-
chlorophenylphosphine. Yield: 0.69 g, 81%. m.p. C. Elemental analysis, %
Calculated (Found) for C30H27Cl4N2OPPtS2 (Mol. Wt: 863.5 g/mol): C, 41.73 (41.71); H,
3.15 (3.12); N, 3.24 (3.21); S, 7.43 (7.41). FT-IR (4000-200 cm-1
): 1479 ν(N-CSS), 1238
ν(C-NC2), 1011 ν(C-S), 361 ν(Pt-S), 293 ν(Pt-Cl), 239 ν(Pt-P).
Chlorido[4-(4-methoxyphenyl)piperazine-1-carbodithioato-κ2S,Sʹ)(diphenyl-p-tolyl
phosphine)]platinum(II) (3)
Pt
Cl
P S
S
NN OCH3
12
3
3'
2'
4
5 6
7
a
b
cd
6'5'
8
Amount of reagents used: 0.29 g (1 mmol) sodium 4-(4-methoxyphenyl)piperazine-1-
carbodithioate, 0.266 g (1 mmol) platinum(II) chloride and 0.276 g (1 mmol) diphenyl-p-
tolylphosphine. Yield: 0.61 g, 79%. m.p. 245 C. Elemental analysis, % Calculated
(Found) for C31H32ClN2OPPtS2 (Mol. Wt: 774.2 g/mol): C, 48.09 (48.06); H, 4.17 (4.13);
N, 3.62 (3.60); S, 8.28 (8.26). FT-IR (4000-200 cm-1
): 1508 ν(N-CSS), 1227 ν(C-NC2),
1016 ν(C-S), 377 ν(Pt-S), 279 ν(Pt-Cl), 227 ν(Pt-P).
Chlorido[4-(4-methoxyphenyl)piperazine-1-carbodithioato-κ2S,Sʹ)(tris-p-tolylphos-
phine)]platinum(II) (4)
Pt
Cl
P S
S
NN OCH3
12
3
3'
2'
4
5 6
7
a
b
cd
6'5'
8
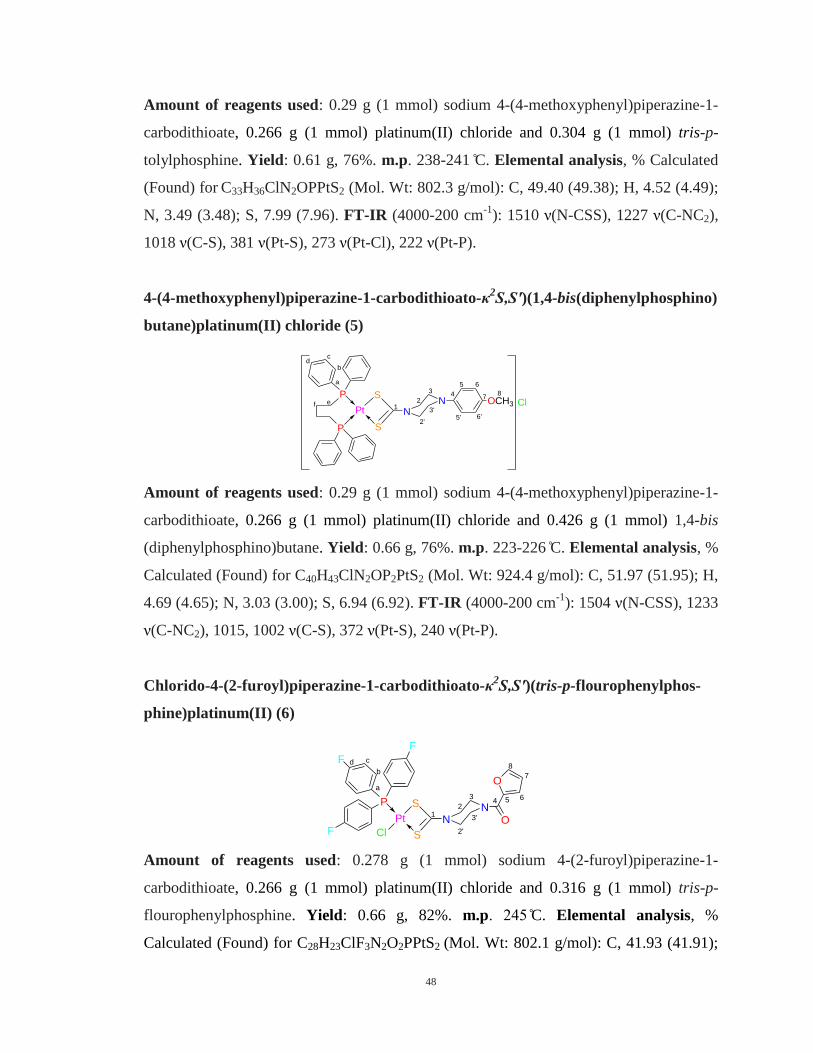
48
Amount of reagents used: 0.29 g (1 mmol) sodium 4-(4-methoxyphenyl)piperazine-1-
carbodithioate, 0.266 g (1 mmol) platinum(II) chloride and 0.304 g (1 mmol) tris-p-
tolylphosphine. Yield: 0.61 g, 76%. m.p. 238-241 C. Elemental analysis, % Calculated
(Found) for C33H36ClN2OPPtS2 (Mol. Wt: 802.3 g/mol): C, 49.40 (49.38); H, 4.52 (4.49);
N, 3.49 (3.48); S, 7.99 (7.96). FT-IR (4000-200 cm-1
): 1510 ν(N-CSS), 1227 ν(C-NC2),
1018 ν(C-S), 381 ν(Pt-S), 273 ν(Pt-Cl), 222 ν(Pt-P).
4-(4-methoxyphenyl)piperazine-1-carbodithioato-κ2S,Sʹ)(1,4-bis(diphenylphosphino)
butane)platinum(II) chloride (5)
Pt
P S
S
NN
P
ClOCH312
3
2'
3'
4
5 6
7
6'5'
a
b
cd
ef
8
Amount of reagents used: 0.29 g (1 mmol) sodium 4-(4-methoxyphenyl)piperazine-1-
carbodithioate, 0.266 g (1 mmol) platinum(II) chloride and 0.426 g (1 mmol) 1,4-bis
(diphenylphosphino)butane. Yield: 0.66 g, 76%. m.p. 223-226 C. Elemental analysis, %
Calculated (Found) for C40H43ClN2OP2PtS2 (Mol. Wt: 924.4 g/mol): C, 51.97 (51.95); H,
4.69 (4.65); N, 3.03 (3.00); S, 6.94 (6.92). FT-IR (4000-200 cm-1
): 1504 ν(N-CSS), 1233
ν(C-NC2), 1015, 1002 ν(C-S), 372 ν(Pt-S), 240 ν(Pt-P).
Chlorido-4-(2-furoyl)piperazine-1-carbodithioato-κ2S,Sʹ)(tris-p-flourophenylphos-
phine)platinum(II) (6)
Pt
Cl
P S
S
N
F
N
O
O1
2
3
2'
3'
4 5 6
7
8
a
b
cd
F
F
Amount of reagents used: 0.278 g (1 mmol) sodium 4-(2-furoyl)piperazine-1-
carbodithioate, 0.266 g (1 mmol) platinum(II) chloride and 0.316 g (1 mmol) tris-p-
flourophenylphosphine. Yield: 0.66 g, 82%. m.p. C. Elemental analysis, %
Calculated (Found) for C28H23ClF3N2O2PPtS2 (Mol. Wt: 802.1 g/mol): C, 41.93 (41.91);
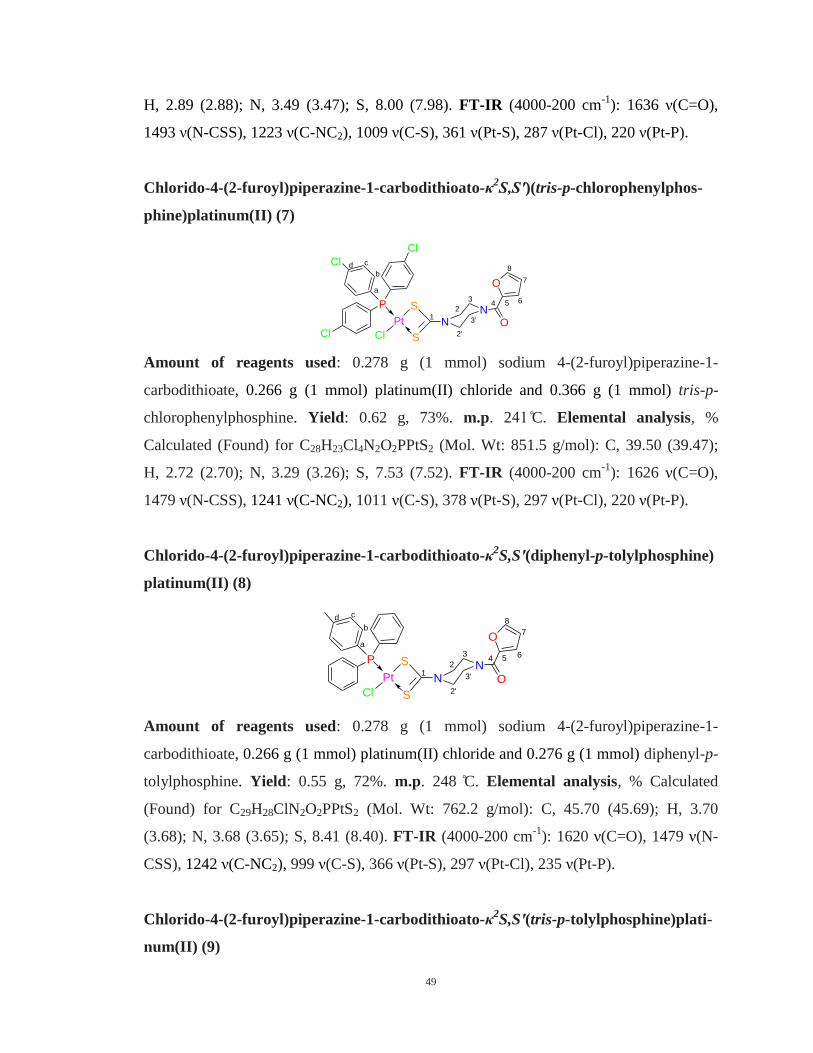
49
H, 2.89 (2.88); N, 3.49 (3.47); S, 8.00 (7.98). FT-IR (4000-200 cm-1
): 1636 ν(C=O),
1493 ν(N-CSS), 1223 ν(C-NC2), 1009 ν(C-S), 361 ν(Pt-S), 287 ν(Pt-Cl), 220 ν(Pt-P).
Chlorido-4-(2-furoyl)piperazine-1-carbodithioato-κ2S,Sʹ)(tris-p-chlorophenylphos-
phine)platinum(II) (7)
Pt
Cl
P S
S
N
Cl
N
O
O1
2
3
2'
3'
4 5 6
7
8
a
b
cd
Cl
Cl
Amount of reagents used: 0.278 g (1 mmol) sodium 4-(2-furoyl)piperazine-1-
carbodithioate, 0.266 g (1 mmol) platinum(II) chloride and 0.366 g (1 mmol) tris-p-
chlorophenylphosphine. Yield: 0.62 g, 73%. m.p. 2 C. Elemental analysis, %
Calculated (Found) for C28H23Cl4N2O2PPtS2 (Mol. Wt: 851.5 g/mol): C, 39.50 (39.47);
H, 2.72 (2.70); N, 3.29 (3.26); S, 7.53 (7.52). FT-IR (4000-200 cm-1
): 1626 ν(C=O),
1479 ν(N-CSS), 1241 ν(C-NC2), 1011 ν(C-S), 378 ν(Pt-S), 297 ν(Pt-Cl), 220 ν(Pt-P).
Chlorido-4-(2-furoyl)piperazine-1-carbodithioato-κ2S,Sʹ(diphenyl-p-tolylphosphine)
platinum(II) (8)
Pt
Cl
P S
S
NN
O
O1
2
3
2'
3'
4 5 6
7
8
a
b
cd
Amount of reagents used: 0.278 g (1 mmol) sodium 4-(2-furoyl)piperazine-1-
carbodithioate, 0.266 g (1 mmol) platinum(II) chloride and 0.276 g (1 mmol) diphenyl-p-
tolylphosphine. Yield: 0.55 g, 72%. m.p. 248 C. Elemental analysis, % Calculated
(Found) for C29H28ClN2O2PPtS2 (Mol. Wt: 762.2 g/mol): C, 45.70 (45.69); H, 3.70
(3.68); N, 3.68 (3.65); S, 8.41 (8.40). FT-IR (4000-200 cm-1
): 1620 ν(C=O), 1479 ν(N-
CSS), 1242 ν(C-NC2), 999 ν(C-S), 366 ν(Pt-S), 297 ν(Pt-Cl), 235 ν(Pt-P).
Chlorido-4-(2-furoyl)piperazine-1-carbodithioato-κ2S,Sʹ(tris-p-tolylphosphine)plati-
num(II) (9)
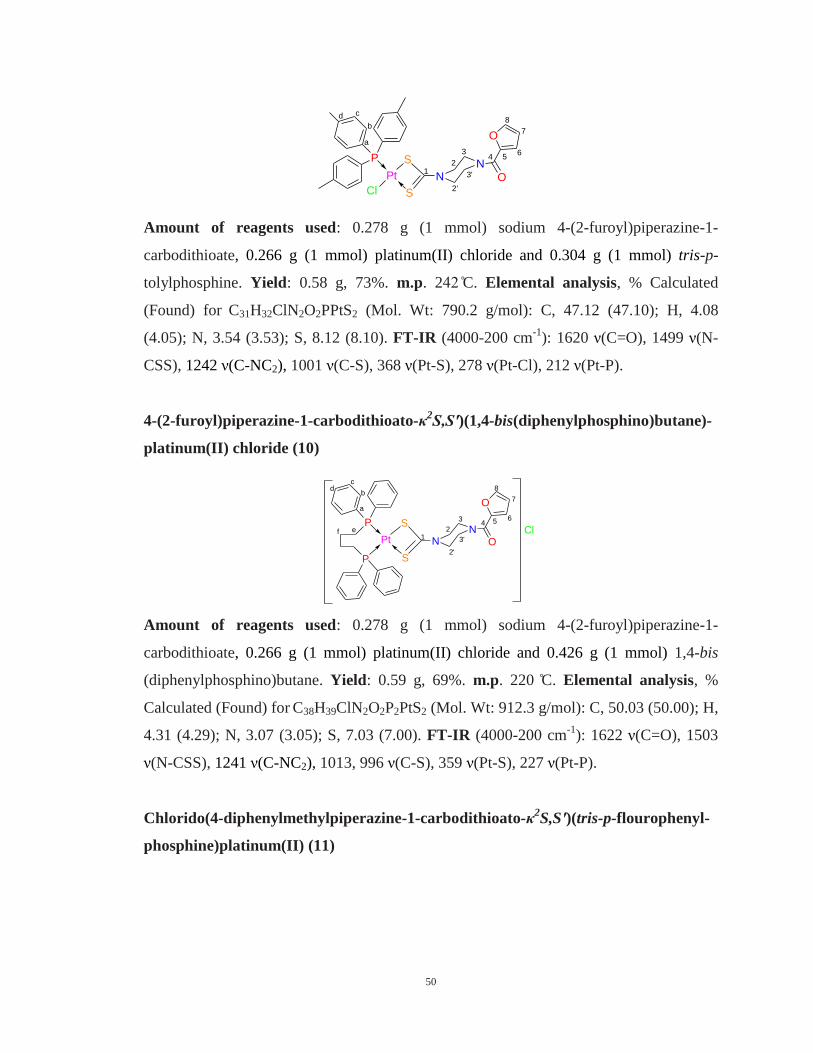
50
Pt
Cl
P S
S
NN
O
O1
2
3
2'
3'
4 56
7
8
a
b
cd
Amount of reagents used: 0.278 g (1 mmol) sodium 4-(2-furoyl)piperazine-1-
carbodithioate, 0.266 g (1 mmol) platinum(II) chloride and 0.304 g (1 mmol) tris-p-
tolylphosphine. Yield: 0.58 g, 73%. m.p. 2 C. Elemental analysis, % Calculated
(Found) for C31H32ClN2O2PPtS2 (Mol. Wt: 790.2 g/mol): C, 47.12 (47.10); H, 4.08
(4.05); N, 3.54 (3.53); S, 8.12 (8.10). FT-IR (4000-200 cm-1
): 1620 ν(C=O), 1499 ν(N-
CSS), 1242 ν(C-NC2), 1001 ν(C-S), 368 ν(Pt-S), 278 ν(Pt-Cl), 212 ν(Pt-P).
4-(2-furoyl)piperazine-1-carbodithioato-κ2S,Sʹ)(1,4-bis(diphenylphosphino)butane)-
platinum(II) chloride (10)
Pt
P S
S
NN
P
Cl1
2
3
2'
3'
4 5 6
7
a
b
cd
ef
8
O
O
Amount of reagents used: 0.278 g (1 mmol) sodium 4-(2-furoyl)piperazine-1-
carbodithioate, 0.266 g (1 mmol) platinum(II) chloride and 0.426 g (1 mmol) 1,4-bis
(diphenylphosphino)butane. Yield: 0.59 g, 69%. m.p. 220 C. Elemental analysis, %
Calculated (Found) for C38H39ClN2O2P2PtS2 (Mol. Wt: 912.3 g/mol): C, 50.03 (50.00); H,
4.31 (4.29); N, 3.07 (3.05); S, 7.03 (7.00). FT-IR (4000-200 cm-1
): 1622 ν(C=O), 1503
ν(N-CSS), 1241 ν(C-NC2), 1013, 996 ν(C-S), 359 ν(Pt-S), 227 ν(Pt-P).
Chlorido(4-diphenylmethylpiperazine-1-carbodithioato-κ2S,Sʹ)(tris-p-flourophenyl-
phosphine)platinum(II) (11)
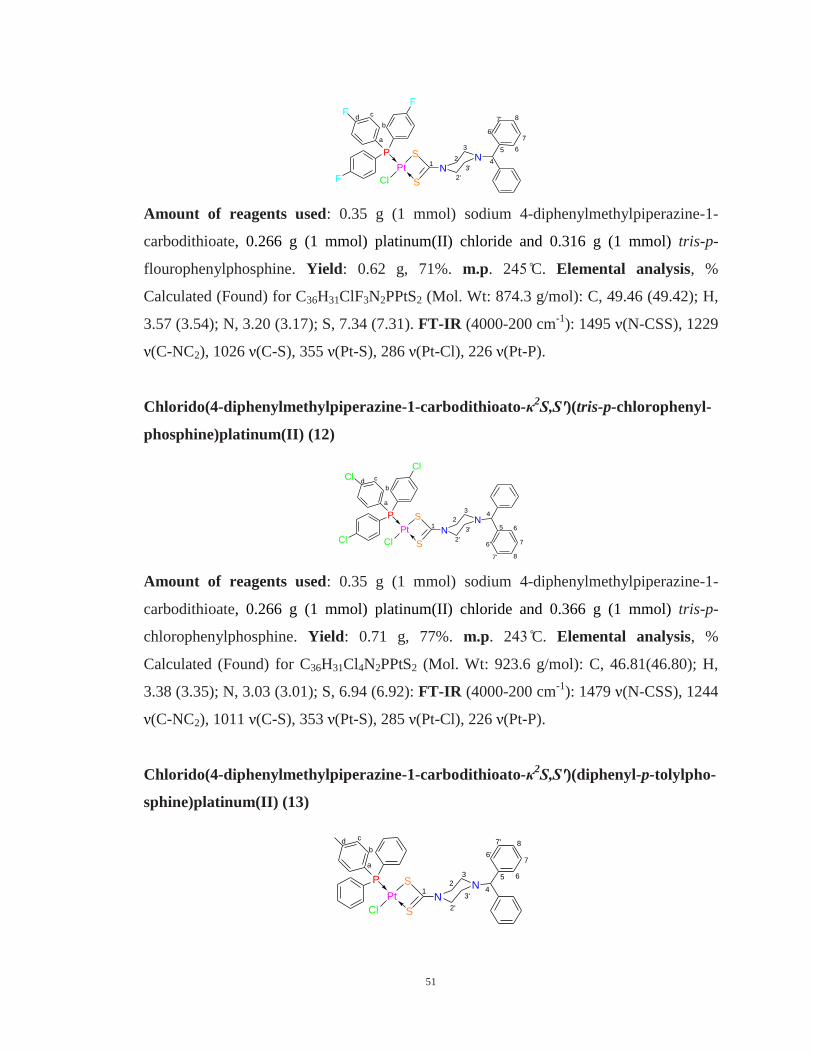
51
Pt
Cl
P S
S
NF
FF
N1
2
3
4
5 6
7
87'
6'
3'
2'
a
b
cd
Amount of reagents used: 0.35 g (1 mmol) sodium 4-diphenylmethylpiperazine-1-
carbodithioate, 0.266 g (1 mmol) platinum(II) chloride and 0.316 g (1 mmol) tris-p-
flourophenylphosphine. Yield: 0.62 g, 71%. m.p. 2 C. Elemental analysis, %
Calculated (Found) for C36H31ClF3N2PPtS2 (Mol. Wt: 874.3 g/mol): C, 49.46 (49.42); H,
3.57 (3.54); N, 3.20 (3.17); S, 7.34 (7.31). FT-IR (4000-200 cm-1
): 1495 ν(N-CSS), 1229
ν(C-NC2), 1026 ν(C-S), 355 ν(Pt-S), 286 ν(Pt-Cl), 226 ν(Pt-P).
Chlorido(4-diphenylmethylpiperazine-1-carbodithioato-κ2S,Sʹ)(tris-p-chlorophenyl-
phosphine)platinum(II) (12)
Pt
Cl
P S
S
NCl
ClCl
N1
2
34
5 6
7
87'
6'
3'
2'
a
b
cd
Amount of reagents used: 0.35 g (1 mmol) sodium 4-diphenylmethylpiperazine-1-
carbodithioate, 0.266 g (1 mmol) platinum(II) chloride and 0.366 g (1 mmol) tris-p-
chlorophenylphosphine. Yield: 0.71 g, 77%. m.p. 2 C. Elemental analysis, %
Calculated (Found) for C36H31Cl4N2PPtS2 (Mol. Wt: 923.6 g/mol): C, 46.81(46.80); H,
3.38 (3.35); N, 3.03 (3.01); S, 6.94 (6.92): FT-IR (4000-200 cm-1
): 1479 ν(N-CSS), 1244
ν(C-NC2), 1011 ν(C-S), 353 ν(Pt-S), 285 ν(Pt-Cl), 226 ν(Pt-P).
Chlorido(4-diphenylmethylpiperazine-1-carbodithioato-κ2S,Sʹ)(diphenyl-p-tolylpho-
sphine)platinum(II) (13)
Pt
Cl
P S
S
NN
12
3
4
5 6
7
87'
6'
a
2'
3'
b
cd
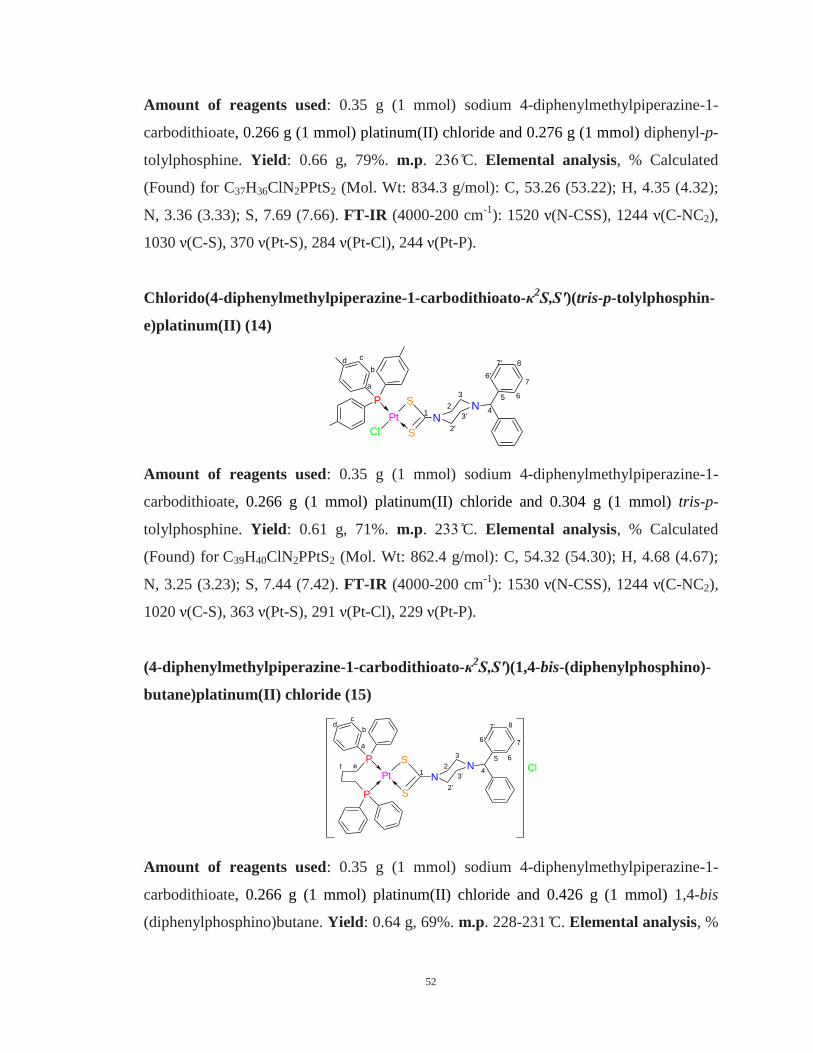
52
Amount of reagents used: 0.35 g (1 mmol) sodium 4-diphenylmethylpiperazine-1-
carbodithioate, 0.266 g (1 mmol) platinum(II) chloride and 0.276 g (1 mmol) diphenyl-p-
tolylphosphine. Yield: 0.66 g, 79%. m.p. 2 C. Elemental analysis, % Calculated
(Found) for C37H36ClN2PPtS2 (Mol. Wt: 834.3 g/mol): C, 53.26 (53.22); H, 4.35 (4.32);
N, 3.36 (3.33); S, 7.69 (7.66). FT-IR (4000-200 cm-1
): 1520 ν(N-CSS), 1244 ν(C-NC2),
1030 ν(C-S), 370 ν(Pt-S), 284 ν(Pt-Cl), 244 ν(Pt-P).
Chlorido(4-diphenylmethylpiperazine-1-carbodithioato-κ2S,Sʹ)(tris-p-tolylphosphin-
e)platinum(II) (14)
Pt
Cl
P S
S
NN
12
3
2'
3'4
5 6
7
87'
6'
a
b
cd
Amount of reagents used: 0.35 g (1 mmol) sodium 4-diphenylmethylpiperazine-1-
carbodithioate, 0.266 g (1 mmol) platinum(II) chloride and 0.304 g (1 mmol) tris-p-
tolylphosphine. Yield: 0.61 g, 71%. m.p. 2 C. Elemental analysis, % Calculated
(Found) for C39H40ClN2PPtS2 (Mol. Wt: 862.4 g/mol): C, 54.32 (54.30); H, 4.68 (4.67);
N, 3.25 (3.23); S, 7.44 (7.42). FT-IR (4000-200 cm-1
): 1530 ν(N-CSS), 1244 ν(C-NC2),
1020 ν(C-S), 363 ν(Pt-S), 291 ν(Pt-Cl), 229 ν(Pt-P).
(4-diphenylmethylpiperazine-1-carbodithioato-κ2S,Sʹ)(1,4-bis-(diphenylphosphino)-
butane)platinum(II) chloride (15)
Pt
P S
S
NN
P
Cl1
2
3
2'
3'4
5 6
7
87'
6'
ef
a
b
cd
Amount of reagents used: 0.35 g (1 mmol) sodium 4-diphenylmethylpiperazine-1-
carbodithioate, 0.266 g (1 mmol) platinum(II) chloride and 0.426 g (1 mmol) 1,4-bis
(diphenylphosphino)butane. Yield: 0.64 g, 69%. m.p. 228-231 C. Elemental analysis, %
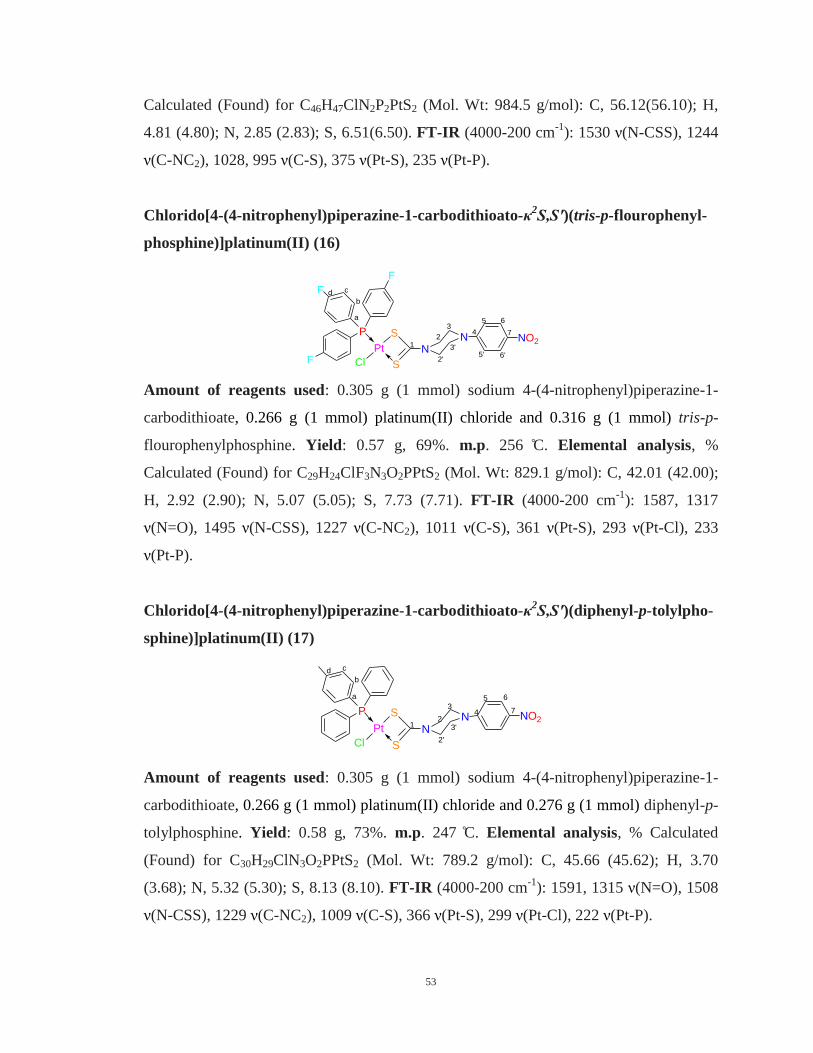
53
Calculated (Found) for C46H47ClN2P2PtS2 (Mol. Wt: 984.5 g/mol): C, 56.12(56.10); H,
4.81 (4.80); N, 2.85 (2.83); S, 6.51(6.50). FT-IR (4000-200 cm-1
): 1530 ν(N-CSS), 1244
ν(C-NC2), 1028, 995 ν(C-S), 375 ν(Pt-S), 235 ν(Pt-P).
Chlorido[4-(4-nitrophenyl)piperazine-1-carbodithioato-κ2S,Sʹ)(tris-p-flourophenyl-
phosphine)]platinum(II) (16)
Pt
Cl
P S
S
N
F
N NO212
3
3'
2'
4
5 6
7
a
b
cd
F
F
6'5'
Amount of reagents used: 0.305 g (1 mmol) sodium 4-(4-nitrophenyl)piperazine-1-
carbodithioate, 0.266 g (1 mmol) platinum(II) chloride and 0.316 g (1 mmol) tris-p-
flourophenylphosphine. Yield: 0.57 g, 69%. m.p. 256 C. Elemental analysis, %
Calculated (Found) for C29H24ClF3N3O2PPtS2 (Mol. Wt: 829.1 g/mol): C, 42.01 (42.00);
H, 2.92 (2.90); N, 5.07 (5.05); S, 7.73 (7.71). FT-IR (4000-200 cm-1
): 1587, 1317
ν(N=O), 1495 ν(N-CSS), 1227 ν(C-NC2), 1011 ν(C-S), 361 ν(Pt-S), 293 ν(Pt-Cl), 233
ν(Pt-P).
Chlorido[4-(4-nitrophenyl)piperazine-1-carbodithioato-κ2S,Sʹ)(diphenyl-p-tolylpho-
sphine)]platinum(II) (17)
Pt
Cl
P S
S
NN NO2
12
3
3'
2'
4
5 6
7
a
b
cd
Amount of reagents used: 0.305 g (1 mmol) sodium 4-(4-nitrophenyl)piperazine-1-
carbodithioate, 0.266 g (1 mmol) platinum(II) chloride and 0.276 g (1 mmol) diphenyl-p-
tolylphosphine. Yield: 0.58 g, 73%. m.p. 247 C. Elemental analysis, % Calculated
(Found) for C30H29ClN3O2PPtS2 (Mol. Wt: 789.2 g/mol): C, 45.66 (45.62); H, 3.70
(3.68); N, 5.32 (5.30); S, 8.13 (8.10). FT-IR (4000-200 cm-1
): 1591, 1315 ν(N=O), 1508
ν(N-CSS), 1229 ν(C-NC2), 1009 ν(C-S), 366 ν(Pt-S), 299 ν(Pt-Cl), 222 ν(Pt-P).
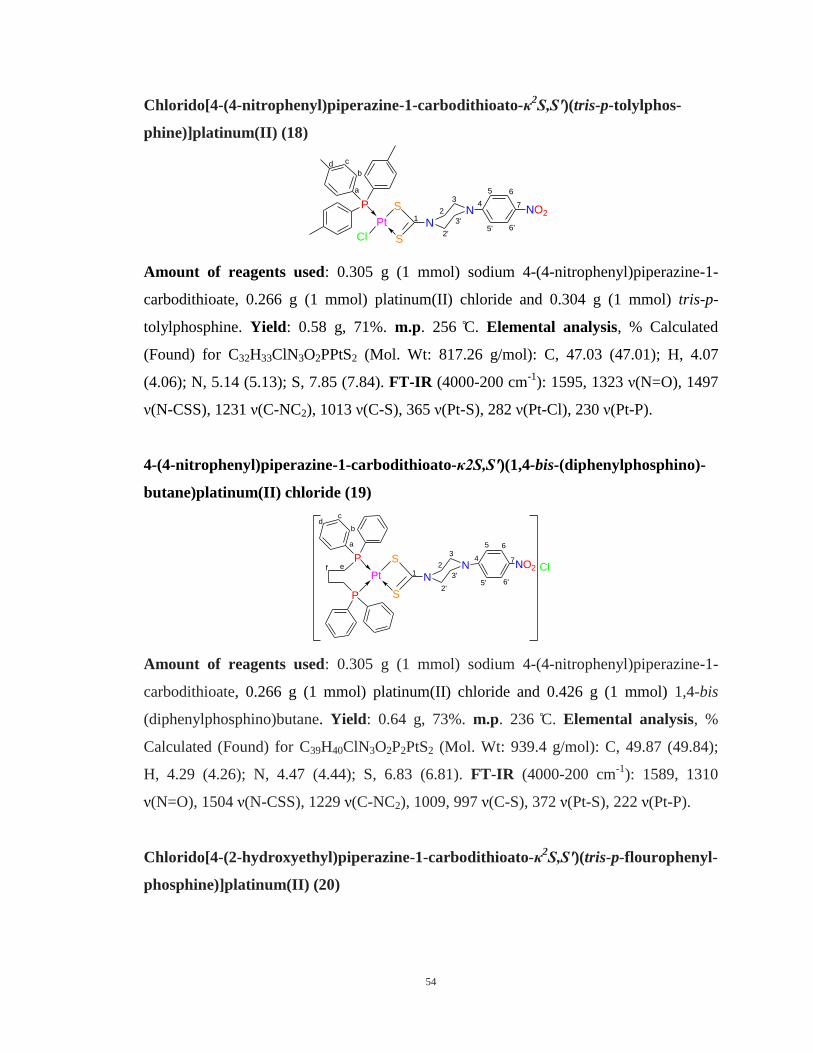
54
Chlorido[4-(4-nitrophenyl)piperazine-1-carbodithioato-κ2S,Sʹ)(tris-p-tolylphos-
phine)]platinum(II) (18)
Pt
Cl
P S
S
NN NO2
12
3
3'
2'
4
5 6
7
a
b
cd
6'5'
Amount of reagents used: 0.305 g (1 mmol) sodium 4-(4-nitrophenyl)piperazine-1-
carbodithioate, 0.266 g (1 mmol) platinum(II) chloride and 0.304 g (1 mmol) tris-p-
tolylphosphine. Yield: 0.58 g, 71%. m.p. 256 C. Elemental analysis, % Calculated
(Found) for C32H33ClN3O2PPtS2 (Mol. Wt: 817.26 g/mol): C, 47.03 (47.01); H, 4.07
(4.06); N, 5.14 (5.13); S, 7.85 (7.84). FT-IR (4000-200 cm-1
): 1595, 1323 ν(N=O), 1497
ν(N-CSS), 1231 ν(C-NC2), 1013 ν(C-S), 365 ν(Pt-S), 282 ν(Pt-Cl), 230 ν(Pt-P).
4-(4-nitrophenyl)piperazine-1-carbodithioato-κ2S,Sʹ)(1,4-bis-(diphenylphosphino)-
butane)platinum(II) chloride (19)
Pt
P S
S
NN
P
ClNO21
2
3
2'
3'
4
5 6
7
6'5'
ef
a
b
cd
Amount of reagents used: 0.305 g (1 mmol) sodium 4-(4-nitrophenyl)piperazine-1-
carbodithioate, 0.266 g (1 mmol) platinum(II) chloride and 0.426 g (1 mmol) 1,4-bis
(diphenylphosphino)butane. Yield: 0.64 g, 73%. m.p. 236 C. Elemental analysis, %
Calculated (Found) for C39H40ClN3O2P2PtS2 (Mol. Wt: 939.4 g/mol): C, 49.87 (49.84);
H, 4.29 (4.26); N, 4.47 (4.44); S, 6.83 (6.81). FT-IR (4000-200 cm-1
): 1589, 1310
ν(N=O), 1504 ν(N-CSS), 1229 ν(C-NC2), 1009, 997 ν(C-S), 372 ν(Pt-S), 222 ν(Pt-P).
Chlorido[4-(2-hydroxyethyl)piperazine-1-carbodithioato-κ2S,Sʹ)(tris-p-flourophenyl-
phosphine)]platinum(II) (20)
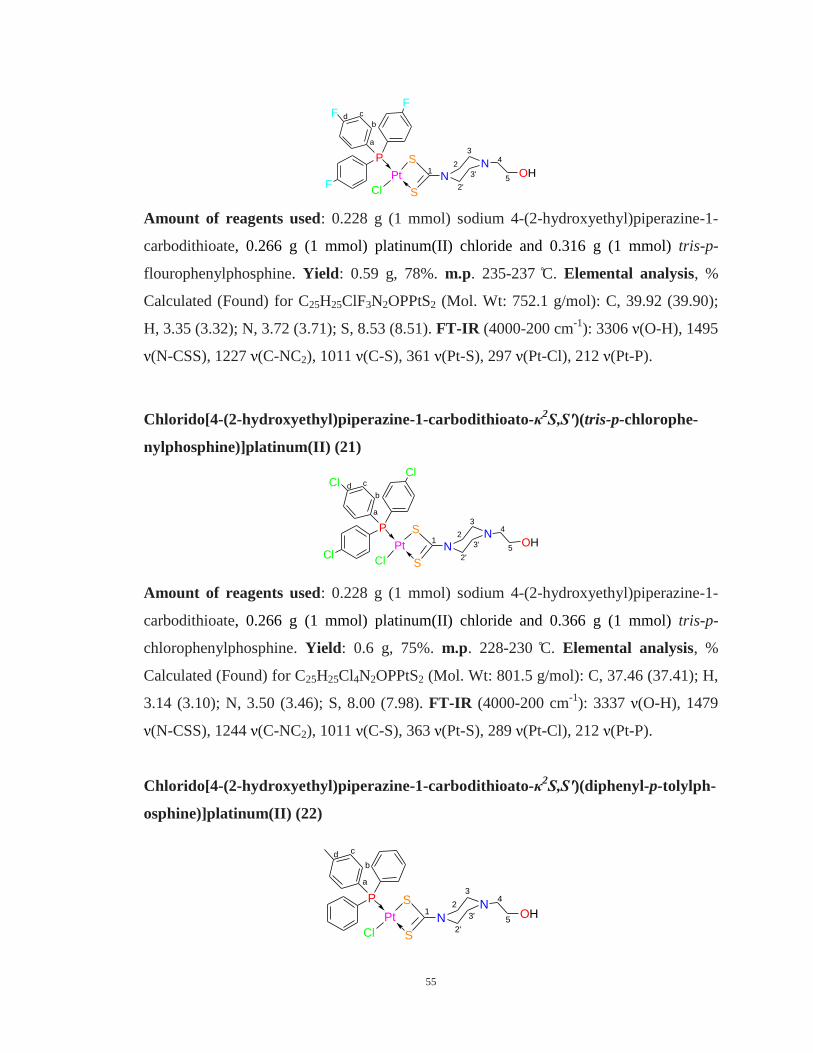
55
Pt
Cl
P S
S
NF
FF
NOH1
2
3
3'
2'
4
5
a
b
cd
Amount of reagents used: 0.228 g (1 mmol) sodium 4-(2-hydroxyethyl)piperazine-1-
carbodithioate, 0.266 g (1 mmol) platinum(II) chloride and 0.316 g (1 mmol) tris-p-
flourophenylphosphine. Yield: 0.59 g, 78%. m.p. 235-237 C. Elemental analysis, %
Calculated (Found) for C25H25ClF3N2OPPtS2 (Mol. Wt: 752.1 g/mol): C, 39.92 (39.90);
H, 3.35 (3.32); N, 3.72 (3.71); S, 8.53 (8.51). FT-IR (4000-200 cm-1
): 3306 ν(O-H), 1495
ν(N-CSS), 1227 ν(C-NC2), 1011 ν(C-S), 361 ν(Pt-S), 297 ν(Pt-Cl), 212 ν(Pt-P).
Chlorido[4-(2-hydroxyethyl)piperazine-1-carbodithioato-κ2S,Sʹ)(tris-p-chlorophe-
nylphosphine)]platinum(II) (21)
Pt
Cl
P S
S
NCl
ClCl
NOH1
2
3
3'
2'
4
5
a
b
cd
Amount of reagents used: 0.228 g (1 mmol) sodium 4-(2-hydroxyethyl)piperazine-1-
carbodithioate, 0.266 g (1 mmol) platinum(II) chloride and 0.366 g (1 mmol) tris-p-
chlorophenylphosphine. Yield: 0.6 g, 75%. m.p. 228-230 C. Elemental analysis, %
Calculated (Found) for C25H25Cl4N2OPPtS2 (Mol. Wt: 801.5 g/mol): C, 37.46 (37.41); H,
3.14 (3.10); N, 3.50 (3.46); S, 8.00 (7.98). FT-IR (4000-200 cm-1
): 3337 ν(O-H), 1479
ν(N-CSS), 1244 ν(C-NC2), 1011 ν(C-S), 363 ν(Pt-S), 289 ν(Pt-Cl), 212 ν(Pt-P).
Chlorido[4-(2-hydroxyethyl)piperazine-1-carbodithioato-κ2S,Sʹ)(diphenyl-p-tolylph-
osphine)]platinum(II) (22)
Pt
Cl
P S
S
NN
OH12
3
3'
2'
4
5
a
b
cd
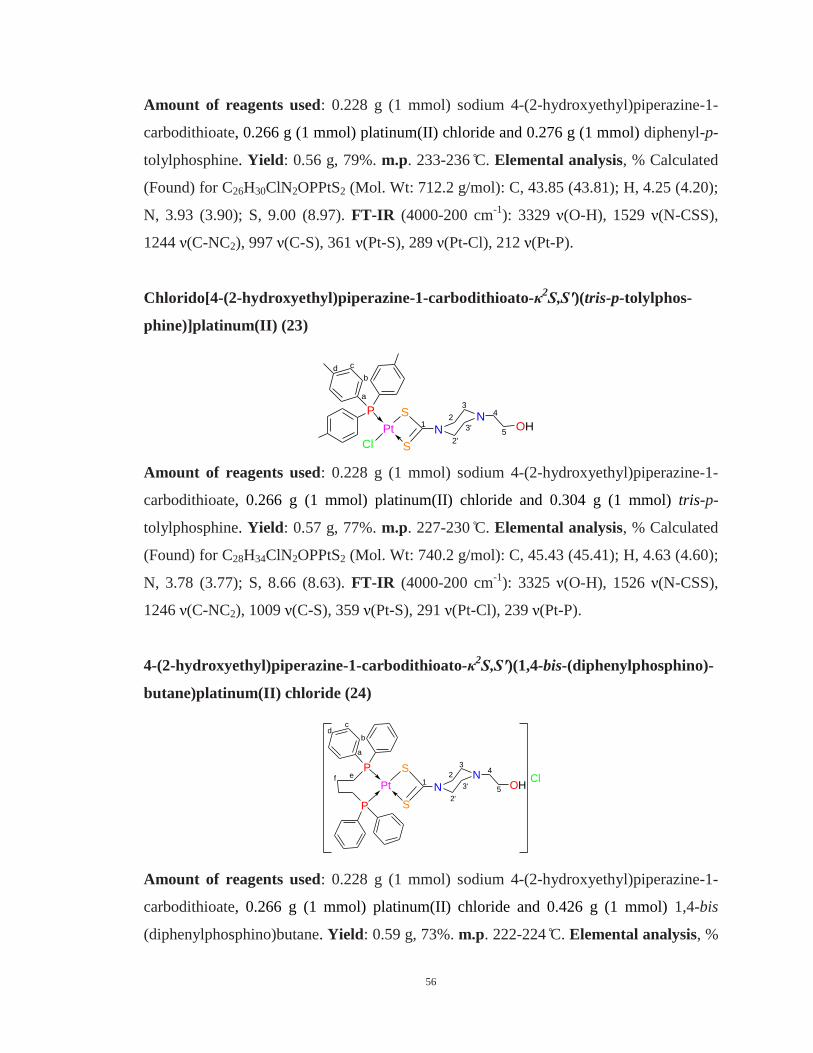
56
Amount of reagents used: 0.228 g (1 mmol) sodium 4-(2-hydroxyethyl)piperazine-1-
carbodithioate, 0.266 g (1 mmol) platinum(II) chloride and 0.276 g (1 mmol) diphenyl-p-
tolylphosphine. Yield: 0.56 g, 79%. m.p. 233-236 C. Elemental analysis, % Calculated
(Found) for C26H30ClN2OPPtS2 (Mol. Wt: 712.2 g/mol): C, 43.85 (43.81); H, 4.25 (4.20);
N, 3.93 (3.90); S, 9.00 (8.97). FT-IR (4000-200 cm-1
): 3329 ν(O-H), 1529 ν(N-CSS),
1244 ν(C-NC2), 997 ν(C-S), 361 ν(Pt-S), 289 ν(Pt-Cl), 212 ν(Pt-P).
Chlorido[4-(2-hydroxyethyl)piperazine-1-carbodithioato-κ2S,Sʹ)(tris-p-tolylphos-
phine)]platinum(II) (23)
Pt
Cl
P S
S
NN
OH12
3
3'
2'
4
5
a
b
cd
Amount of reagents used: 0.228 g (1 mmol) sodium 4-(2-hydroxyethyl)piperazine-1-
carbodithioate, 0.266 g (1 mmol) platinum(II) chloride and 0.304 g (1 mmol) tris-p-
tolylphosphine. Yield: 0.57 g, 77%. m.p. 227-230 C. Elemental analysis, % Calculated
(Found) for C28H34ClN2OPPtS2 (Mol. Wt: 740.2 g/mol): C, 45.43 (45.41); H, 4.63 (4.60);
N, 3.78 (3.77); S, 8.66 (8.63). FT-IR (4000-200 cm-1
): 3325 ν(O-H), 1526 ν(N-CSS),
1246 ν(C-NC2), 1009 ν(C-S), 359 ν(Pt-S), 291 ν(Pt-Cl), 239 ν(Pt-P).
4-(2-hydroxyethyl)piperazine-1-carbodithioato-κ2S,Sʹ)(1,4-bis-(diphenylphosphino)-
butane)platinum(II) chloride (24)
Pt
P S
S
NN
P
ClOH1
2
3
2'
3'
4
5
a
b
cd
ef
Amount of reagents used: 0.228 g (1 mmol) sodium 4-(2-hydroxyethyl)piperazine-1-
carbodithioate, 0.266 g (1 mmol) platinum(II) chloride and 0.426 g (1 mmol) 1,4-bis
(diphenylphosphino)butane. Yield: 0.59 g, 73%. m.p. 222-224 C. Elemental analysis, %
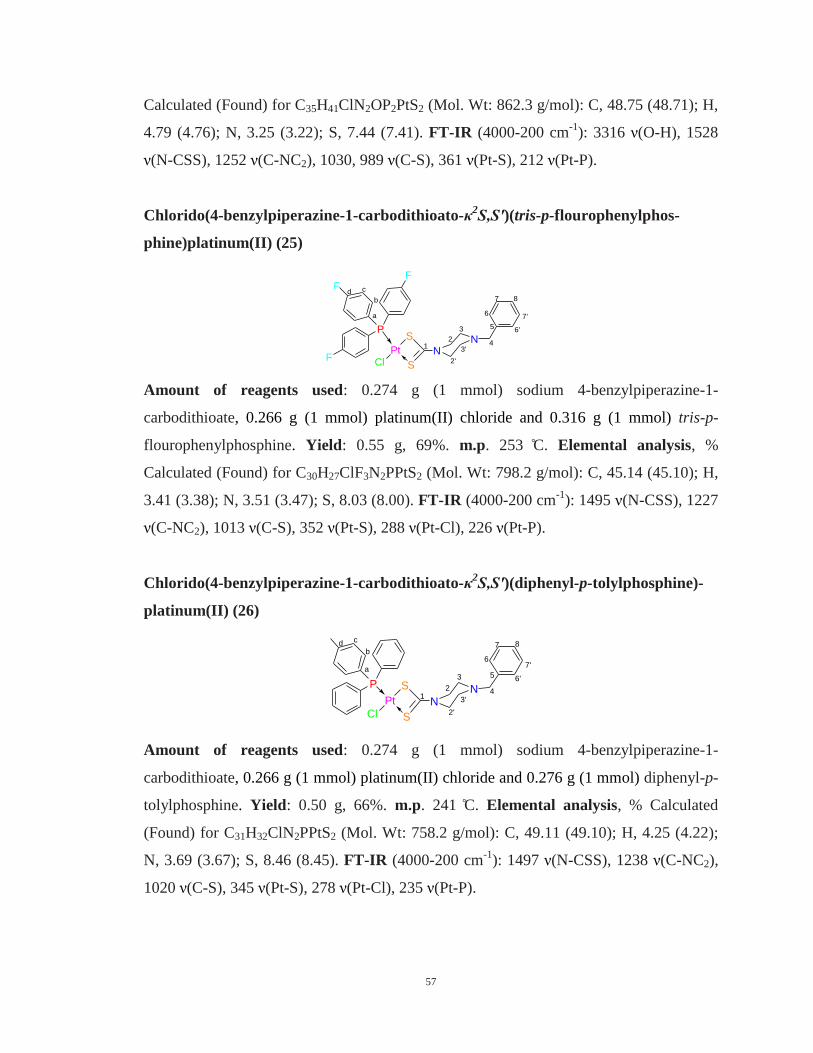
57
Calculated (Found) for C35H41ClN2OP2PtS2 (Mol. Wt: 862.3 g/mol): C, 48.75 (48.71); H,
4.79 (4.76); N, 3.25 (3.22); S, 7.44 (7.41). FT-IR (4000-200 cm-1
): 3316 ν(O-H), 1528
ν(N-CSS), 1252 ν(C-NC2), 1030, 989 ν(C-S), 361 ν(Pt-S), 212 ν(Pt-P).
Chlorido(4-benzylpiperazine-1-carbodithioato-κ2S,Sʹ)(tris-p-flourophenylphos-
phine)platinum(II) (25)
PtCl
PS
S
NF
FF
N1
2
3
4
5
6
7 8
6'
7'
2'
3'
a
b
cd
Amount of reagents used: 0.274 g (1 mmol) sodium 4-benzylpiperazine-1-
carbodithioate, 0.266 g (1 mmol) platinum(II) chloride and 0.316 g (1 mmol) tris-p-
flourophenylphosphine. Yield: 0.55 g, 69%. m.p. 253 C. Elemental analysis, %
Calculated (Found) for C30H27ClF3N2PPtS2 (Mol. Wt: 798.2 g/mol): C, 45.14 (45.10); H,
3.41 (3.38); N, 3.51 (3.47); S, 8.03 (8.00). FT-IR (4000-200 cm-1
): 1495 ν(N-CSS), 1227
ν(C-NC2), 1013 ν(C-S), 352 ν(Pt-S), 288 ν(Pt-Cl), 226 ν(Pt-P).
Chlorido(4-benzylpiperazine-1-carbodithioato-κ2S,Sʹ)(diphenyl-p-tolylphosphine)-
platinum(II) (26)
PtCl
P S
S
NN
12
2'
3
3'4
5
6
7 8
7'
6'
a
b
cd
Amount of reagents used: 0.274 g (1 mmol) sodium 4-benzylpiperazine-1-
carbodithioate, 0.266 g (1 mmol) platinum(II) chloride and 0.276 g (1 mmol) diphenyl-p-
tolylphosphine. Yield: 0.50 g, 66%. m.p. 241 C. Elemental analysis, % Calculated
(Found) for C31H32ClN2PPtS2 (Mol. Wt: 758.2 g/mol): C, 49.11 (49.10); H, 4.25 (4.22);
N, 3.69 (3.67); S, 8.46 (8.45). FT-IR (4000-200 cm-1
): 1497 ν(N-CSS), 1238 ν(C-NC2),
1020 ν(C-S), 345 ν(Pt-S), 278 ν(Pt-Cl), 235 ν(Pt-P).
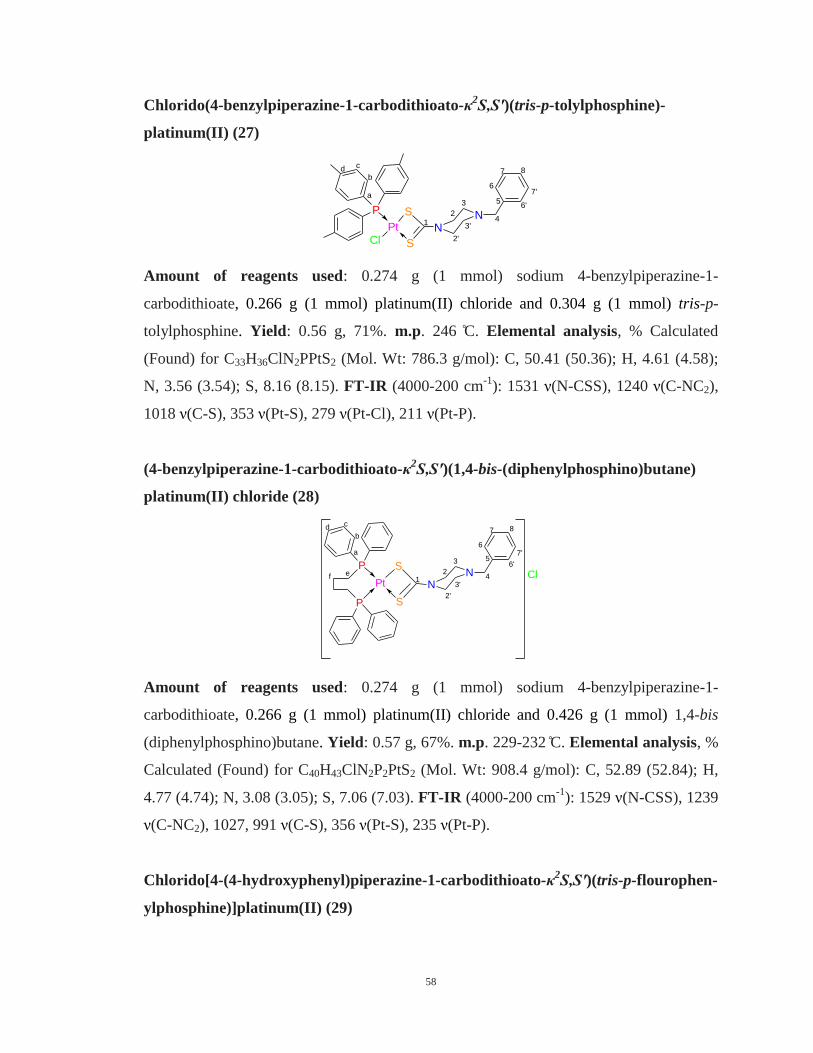
58
Chlorido(4-benzylpiperazine-1-carbodithioato-κ2S,Sʹ)(tris-p-tolylphosphine)-
platinum(II) (27)
PtCl
P S
S
NN
12
2'
3
3'4
5
6
7 8
7'
6'
a
b
cd
Amount of reagents used: 0.274 g (1 mmol) sodium 4-benzylpiperazine-1-
carbodithioate, 0.266 g (1 mmol) platinum(II) chloride and 0.304 g (1 mmol) tris-p-
tolylphosphine. Yield: 0.56 g, 71%. m.p. 246 C. Elemental analysis, % Calculated
(Found) for C33H36ClN2PPtS2 (Mol. Wt: 786.3 g/mol): C, 50.41 (50.36); H, 4.61 (4.58);
N, 3.56 (3.54); S, 8.16 (8.15). FT-IR (4000-200 cm-1
): 1531 ν(N-CSS), 1240 ν(C-NC2),
1018 ν(C-S), 353 ν(Pt-S), 279 ν(Pt-Cl), 211 ν(Pt-P).
(4-benzylpiperazine-1-carbodithioato-κ2S,Sʹ)(1,4-bis-(diphenylphosphino)butane)
platinum(II) chloride (28)
Pt
P S
S
NN
P
Cl1
2
3
4
5
6
7 8
6'
7'
3'
2'
ef
a
b
cd
Amount of reagents used: 0.274 g (1 mmol) sodium 4-benzylpiperazine-1-
carbodithioate, 0.266 g (1 mmol) platinum(II) chloride and 0.426 g (1 mmol) 1,4-bis
(diphenylphosphino)butane. Yield: 0.57 g, 67%. m.p. 229-232 C. Elemental analysis, %
Calculated (Found) for C40H43ClN2P2PtS2 (Mol. Wt: 908.4 g/mol): C, 52.89 (52.84); H,
4.77 (4.74); N, 3.08 (3.05); S, 7.06 (7.03). FT-IR (4000-200 cm-1
): 1529 ν(N-CSS), 1239
ν(C-NC2), 1027, 991 ν(C-S), 356 ν(Pt-S), 235 ν(Pt-P).
Chlorido[4-(4-hydroxyphenyl)piperazine-1-carbodithioato-κ2S,Sʹ)(tris-p-flourophen-
ylphosphine)]platinum(II) (29)
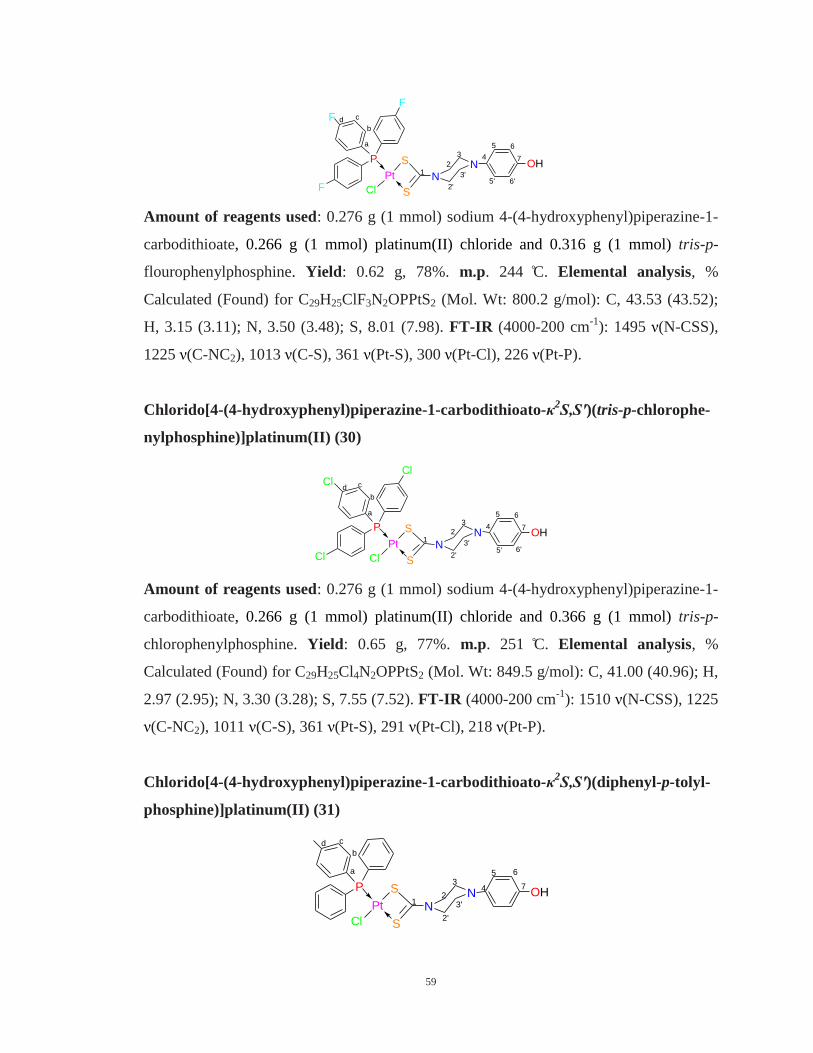
59
Pt
Cl
P S
S
N
F
N OH1
2
3
3'
2'
4
5 6
7
a
b
cd
F
F
6'5'
Amount of reagents used: 0.276 g (1 mmol) sodium 4-(4-hydroxyphenyl)piperazine-1-
carbodithioate, 0.266 g (1 mmol) platinum(II) chloride and 0.316 g (1 mmol) tris-p-
flourophenylphosphine. Yield: 0.62 g, 78%. m.p. 244 C. Elemental analysis, %
Calculated (Found) for C29H25ClF3N2OPPtS2 (Mol. Wt: 800.2 g/mol): C, 43.53 (43.52);
H, 3.15 (3.11); N, 3.50 (3.48); S, 8.01 (7.98). FT-IR (4000-200 cm-1
): 1495 ν(N-CSS),
1225 ν(C-NC2), 1013 ν(C-S), 361 ν(Pt-S), 300 ν(Pt-Cl), 226 ν(Pt-P).
Chlorido[4-(4-hydroxyphenyl)piperazine-1-carbodithioato-κ2S,Sʹ)(tris-p-chlorophe-
nylphosphine)]platinum(II) (30)
Pt
Cl
P S
S
NCl
ClCl
N OH1
2
34
5 6
7
6'5'3'
2'
a
b
cd
Amount of reagents used: 0.276 g (1 mmol) sodium 4-(4-hydroxyphenyl)piperazine-1-
carbodithioate, 0.266 g (1 mmol) platinum(II) chloride and 0.366 g (1 mmol) tris-p-
chlorophenylphosphine. Yield: 0.65 g, 77%. m.p. 251 C. Elemental analysis, %
Calculated (Found) for C29H25Cl4N2OPPtS2 (Mol. Wt: 849.5 g/mol): C, 41.00 (40.96); H,
2.97 (2.95); N, 3.30 (3.28); S, 7.55 (7.52). FT-IR (4000-200 cm-1
): 1510 ν(N-CSS), 1225
ν(C-NC2), 1011 ν(C-S), 361 ν(Pt-S), 291 ν(Pt-Cl), 218 ν(Pt-P).
Chlorido[4-(4-hydroxyphenyl)piperazine-1-carbodithioato-κ2S,Sʹ)(diphenyl-p-tolyl-
phosphine)]platinum(II) (31)
Pt
Cl
P S
S
NN OH
12
3
3'
2'
4
5 6
7
a
b
cd
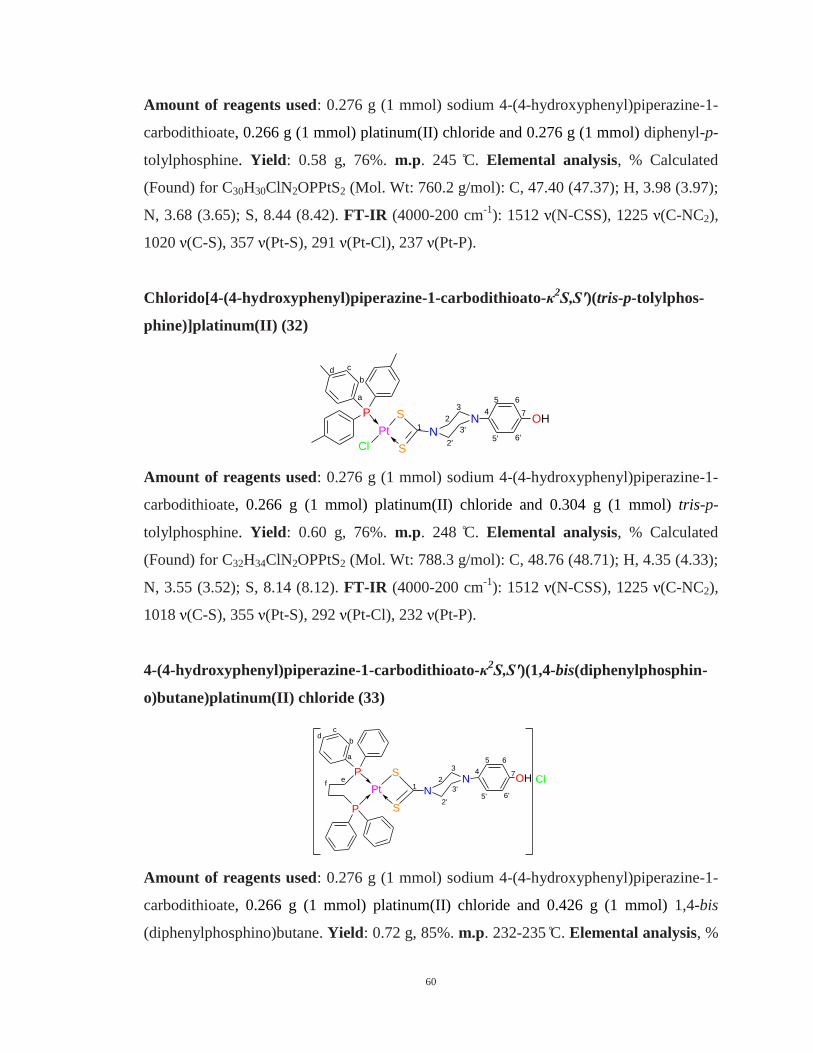
60
Amount of reagents used: 0.276 g (1 mmol) sodium 4-(4-hydroxyphenyl)piperazine-1-
carbodithioate, 0.266 g (1 mmol) platinum(II) chloride and 0.276 g (1 mmol) diphenyl-p-
tolylphosphine. Yield: 0.58 g, 76%. m.p. 245 C. Elemental analysis, % Calculated
(Found) for C30H30ClN2OPPtS2 (Mol. Wt: 760.2 g/mol): C, 47.40 (47.37); H, 3.98 (3.97);
N, 3.68 (3.65); S, 8.44 (8.42). FT-IR (4000-200 cm-1
): 1512 ν(N-CSS), 1225 ν(C-NC2),
1020 ν(C-S), 357 ν(Pt-S), 291 ν(Pt-Cl), 237 ν(Pt-P).
Chlorido[4-(4-hydroxyphenyl)piperazine-1-carbodithioato-κ2S,Sʹ)(tris-p-tolylphos-
phine)]platinum(II) (32)
Pt
Cl
P S
S
NN OH
12
3
3'
2'
4
5 6
7
a
b
cd
6'5'
Amount of reagents used: 0.276 g (1 mmol) sodium 4-(4-hydroxyphenyl)piperazine-1-
carbodithioate, 0.266 g (1 mmol) platinum(II) chloride and 0.304 g (1 mmol) tris-p-
tolylphosphine. Yield: 0.60 g, 76%. m.p. 248 C. Elemental analysis, % Calculated
(Found) for C32H34ClN2OPPtS2 (Mol. Wt: 788.3 g/mol): C, 48.76 (48.71); H, 4.35 (4.33);
N, 3.55 (3.52); S, 8.14 (8.12). FT-IR (4000-200 cm-1
): 1512 ν(N-CSS), 1225 ν(C-NC2),
1018 ν(C-S), 355 ν(Pt-S), 292 ν(Pt-Cl), 232 ν(Pt-P).
4-(4-hydroxyphenyl)piperazine-1-carbodithioato-κ2S,Sʹ)(1,4-bis(diphenylphosphin-
o)butane)platinum(II) chloride (33)
Pt
P S
S
NN
P
ClOH1
2
3
2'
3'
4
5 6
7
6'5'
a
b
cd
ef
Amount of reagents used: 0.276 g (1 mmol) sodium 4-(4-hydroxyphenyl)piperazine-1-
carbodithioate, 0.266 g (1 mmol) platinum(II) chloride and 0.426 g (1 mmol) 1,4-bis
(diphenylphosphino)butane. Yield: 0.72 g, 85%. m.p. 232-235 C. Elemental analysis, %
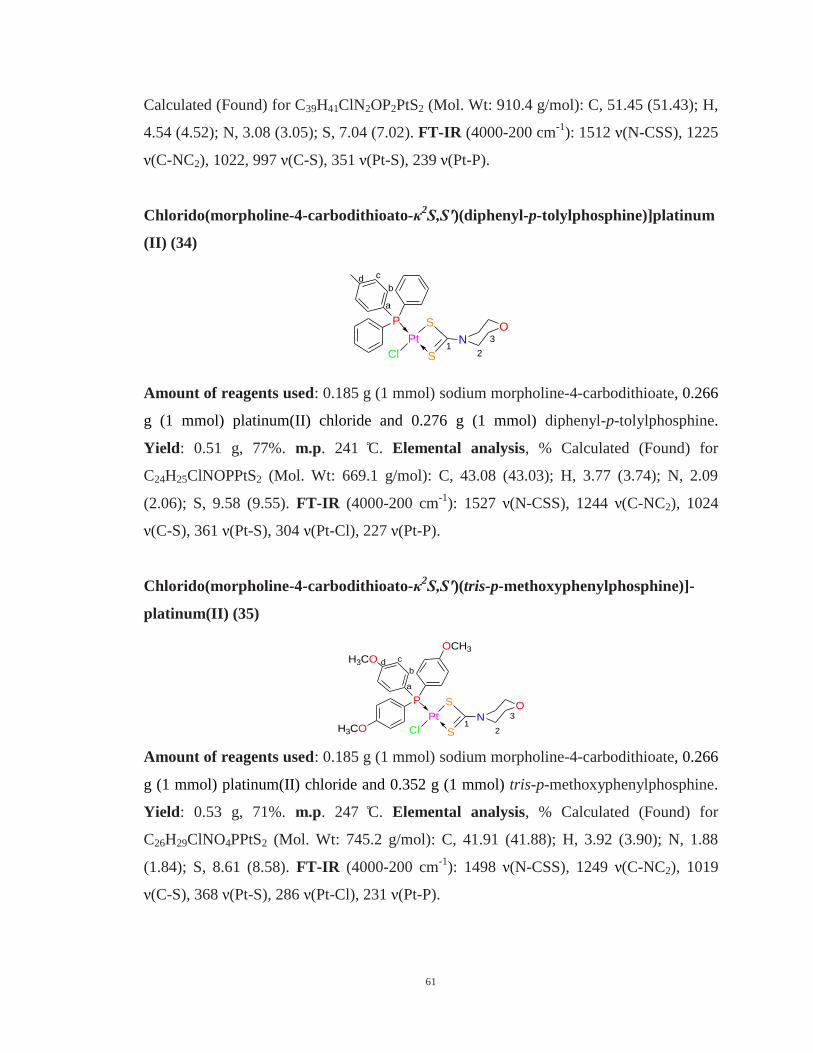
61
Calculated (Found) for C39H41ClN2OP2PtS2 (Mol. Wt: 910.4 g/mol): C, 51.45 (51.43); H,
4.54 (4.52); N, 3.08 (3.05); S, 7.04 (7.02). FT-IR (4000-200 cm-1
): 1512 ν(N-CSS), 1225
ν(C-NC2), 1022, 997 ν(C-S), 351 ν(Pt-S), 239 ν(Pt-P).
Chlorido(morpholine-4-carbodithioato-κ2S,Sʹ)(diphenyl-p-tolylphosphine)]platinum
(II) (34)
Pt
Cl
P S
S
NO
12
3
a
b
cd
Amount of reagents used: 0.185 g (1 mmol) sodium morpholine-4-carbodithioate, 0.266
g (1 mmol) platinum(II) chloride and 0.276 g (1 mmol) diphenyl-p-tolylphosphine.
Yield: 0.51 g, 77%. m.p. 241 C. Elemental analysis, % Calculated (Found) for
C24H25ClNOPPtS2 (Mol. Wt: 669.1 g/mol): C, 43.08 (43.03); H, 3.77 (3.74); N, 2.09
(2.06); S, 9.58 (9.55). FT-IR (4000-200 cm-1
): 1527 ν(N-CSS), 1244 ν(C-NC2), 1024
ν(C-S), 361 ν(Pt-S), 304 ν(Pt-Cl), 227 ν(Pt-P).
Chlorido(morpholine-4-carbodithioato-κ2S,Sʹ)(tris-p-methoxyphenylphosphine)]-
platinum(II) (35)
Pt
Cl
P S
S
N
H3CO
O
12
3
a
b
cd
OCH3
H3CO
Amount of reagents used: 0.185 g (1 mmol) sodium morpholine-4-carbodithioate, 0.266
g (1 mmol) platinum(II) chloride and 0.352 g (1 mmol) tris-p-methoxyphenylphosphine.
Yield: 0.53 g, 71%. m.p. 247 C. Elemental analysis, % Calculated (Found) for
C26H29ClNO4PPtS2 (Mol. Wt: 745.2 g/mol): C, 41.91 (41.88); H, 3.92 (3.90); N, 1.88
(1.84); S, 8.61 (8.58). FT-IR (4000-200 cm-1
): 1498 ν(N-CSS), 1249 ν(C-NC2), 1019
ν(C-S), 368 ν(Pt-S), 286 ν(Pt-Cl), 231 ν(Pt-P).
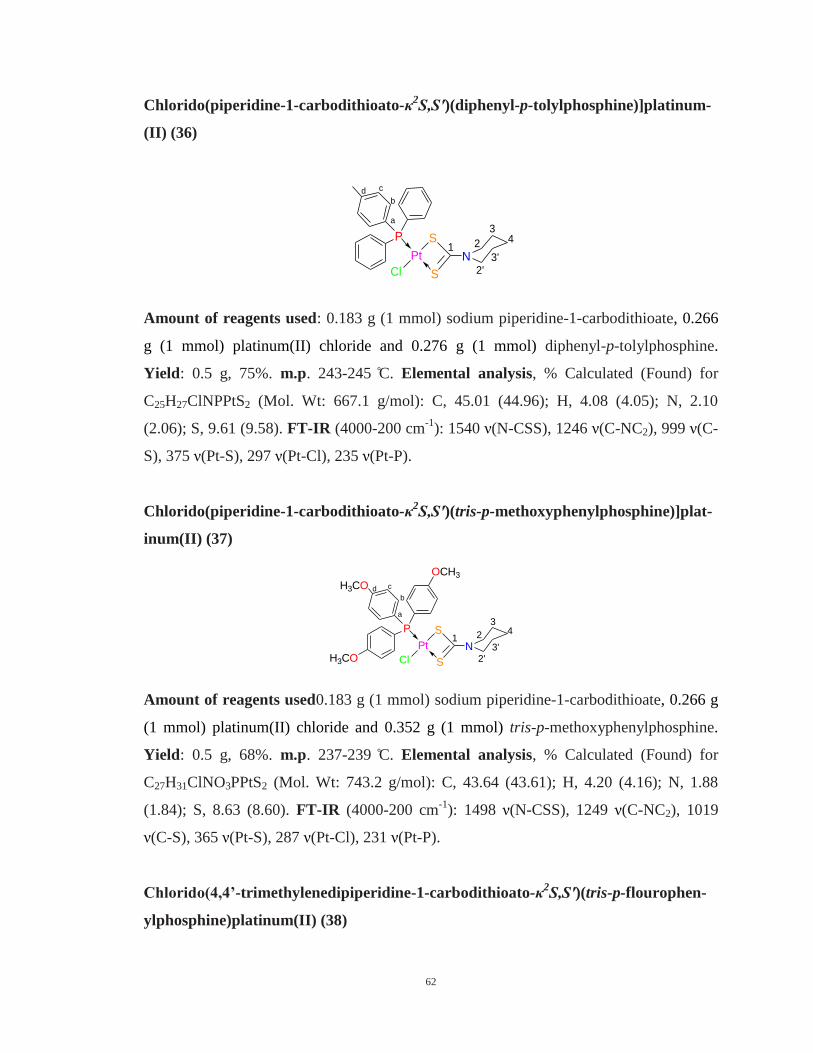
62
Chlorido(piperidine-1-carbodithioato-κ2S,Sʹ)(diphenyl-p-tolylphosphine)]platinum-
(II) (36)
Amount of reagents used: 0.183 g (1 mmol) sodium piperidine-1-carbodithioate, 0.266
g (1 mmol) platinum(II) chloride and 0.276 g (1 mmol) diphenyl-p-tolylphosphine.
Yield: 0.5 g, 75%. m.p. 243-245 C. Elemental analysis, % Calculated (Found) for
C25H27ClNPPtS2 (Mol. Wt: 667.1 g/mol): C, 45.01 (44.96); H, 4.08 (4.05); N, 2.10
(2.06); S, 9.61 (9.58). FT-IR (4000-200 cm-1
): 1540 ν(N-CSS), 1246 ν(C-NC2), 999 ν(C-
S), 375 ν(Pt-S), 297 ν(Pt-Cl), 235 ν(Pt-P).
Chlorido(piperidine-1-carbodithioato-κ2S,Sʹ)(tris-p-methoxyphenylphosphine)]plat-
inum(II) (37)
Pt
Cl
P S
S
N
H3CO
1 2
2'
3
3'
4
OCH3
H3CO
a
b
cd
Amount of reagents used0.183 g (1 mmol) sodium piperidine-1-carbodithioate, 0.266 g
(1 mmol) platinum(II) chloride and 0.352 g (1 mmol) tris-p-methoxyphenylphosphine.
Yield: 0.5 g, 68%. m.p. 237-239 C. Elemental analysis, % Calculated (Found) for
C27H31ClNO3PPtS2 (Mol. Wt: 743.2 g/mol): C, 43.64 (43.61); H, 4.20 (4.16); N, 1.88
(1.84); S, 8.63 (8.60). FT-IR (4000-200 cm-1
): 1498 ν(N-CSS), 1249 ν(C-NC2), 1019
ν(C-S), 365 ν(Pt-S), 287 ν(Pt-Cl), 231 ν(Pt-P).
Chlorido(4,4’-trimethylenedipiperidine-1-carbodithioato-κ2S,Sʹ)(tris-p-flourophen-
ylphosphine)platinum(II) (38)
Pt
Cl
P S
S
N1 2
2'
3
3'
4
a
b
cd
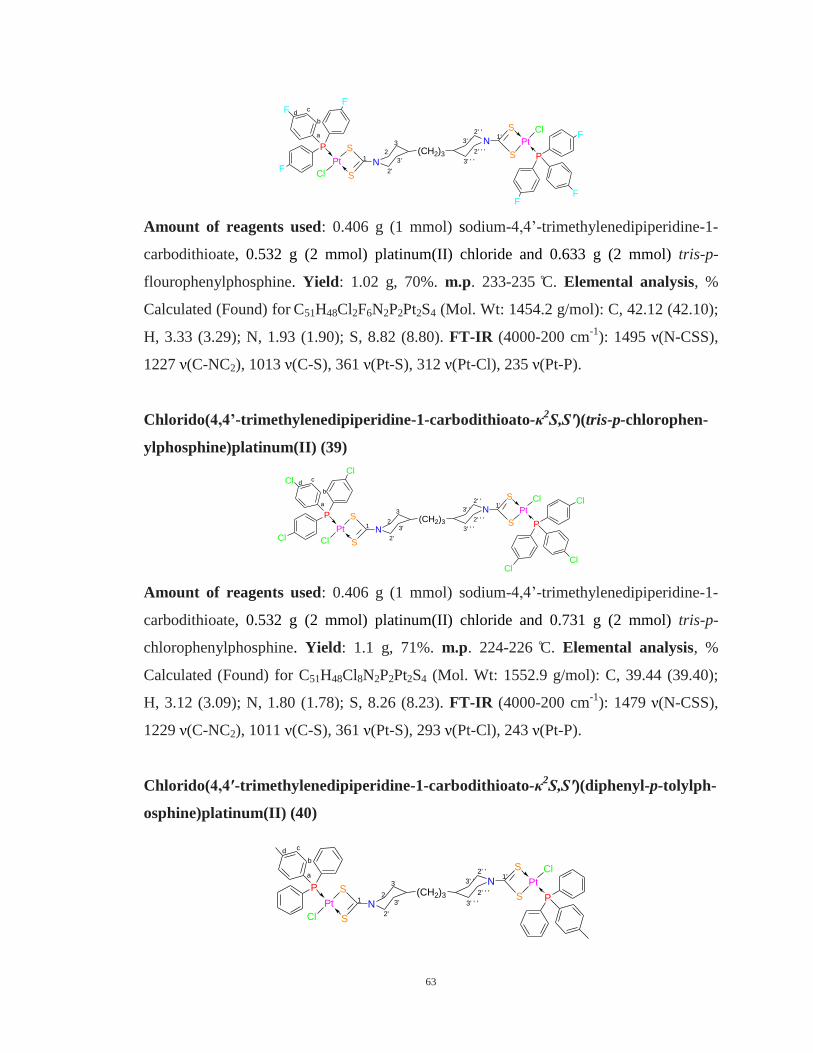
63
Pt
Cl
P S
S
NF
FF
(CH2)3
Pt
Cl
PS
S
NF
FF
12
3
2'
3'
1'2' '
2' ' '
3' '
3' ' '
a
b
cd
Amount of reagents used: 0.406 g (1 mmol) sodium- , ’-trimethylenedipiperidine-1-
carbodithioate, 0.532 g (2 mmol) platinum(II) chloride and 0.633 g (2 mmol) tris-p-
flourophenylphosphine. Yield: 1.02 g, 70%. m.p. 233-235 C. Elemental analysis, %
Calculated (Found) for C51H48Cl2F6N2P2Pt2S4 (Mol. Wt: 1454.2 g/mol): C, 42.12 (42.10);
H, 3.33 (3.29); N, 1.93 (1.90); S, 8.82 (8.80). FT-IR (4000-200 cm-1
): 1495 ν(N-CSS),
1227 ν(C-NC2), 1013 ν(C-S), 361 ν(Pt-S), 312 ν(Pt-Cl), 235 ν(Pt-P).
Chlorido(4,4’-trimethylenedipiperidine-1-carbodithioato-κ2S,Sʹ)(tris-p-chlorophen-
ylphosphine)platinum(II) (39)
Pt
Cl
P S
S
NCl
ClCl
(CH2)3
Pt
Cl
PS
S
NCl
ClCl
12
3
2'
3'
1'2' '
2' ' '
3' '
3' ' '
a
b
cd
Amount of reagents used: 0.406 g (1 mmol) sodium- , ’-trimethylenedipiperidine-1-
carbodithioate, 0.532 g (2 mmol) platinum(II) chloride and 0.731 g (2 mmol) tris-p-
chlorophenylphosphine. Yield: 1.1 g, 71%. m.p. 224-226 C. Elemental analysis, %
Calculated (Found) for C51H48Cl8N2P2Pt2S4 (Mol. Wt: 1552.9 g/mol): C, 39.44 (39.40);
H, 3.12 (3.09); N, 1.80 (1.78); S, 8.26 (8.23). FT-IR (4000-200 cm-1
): 1479 ν(N-CSS),
1229 ν(C-NC2), 1011 ν(C-S), 361 ν(Pt-S), 293 ν(Pt-Cl), 243 ν(Pt-P).
Chlorido(4,4ʹ-trimethylenedipiperidine-1-carbodithioato-κ2S,Sʹ)(diphenyl-p-tolylph-
osphine)platinum(II) (40)
Pt
Cl
P S
S
N(CH2)3
Pt
Cl
PS
S
N
12
3
2'
3'
1'2' '
2' ' '
3' '
3' ' '
a
b
cd
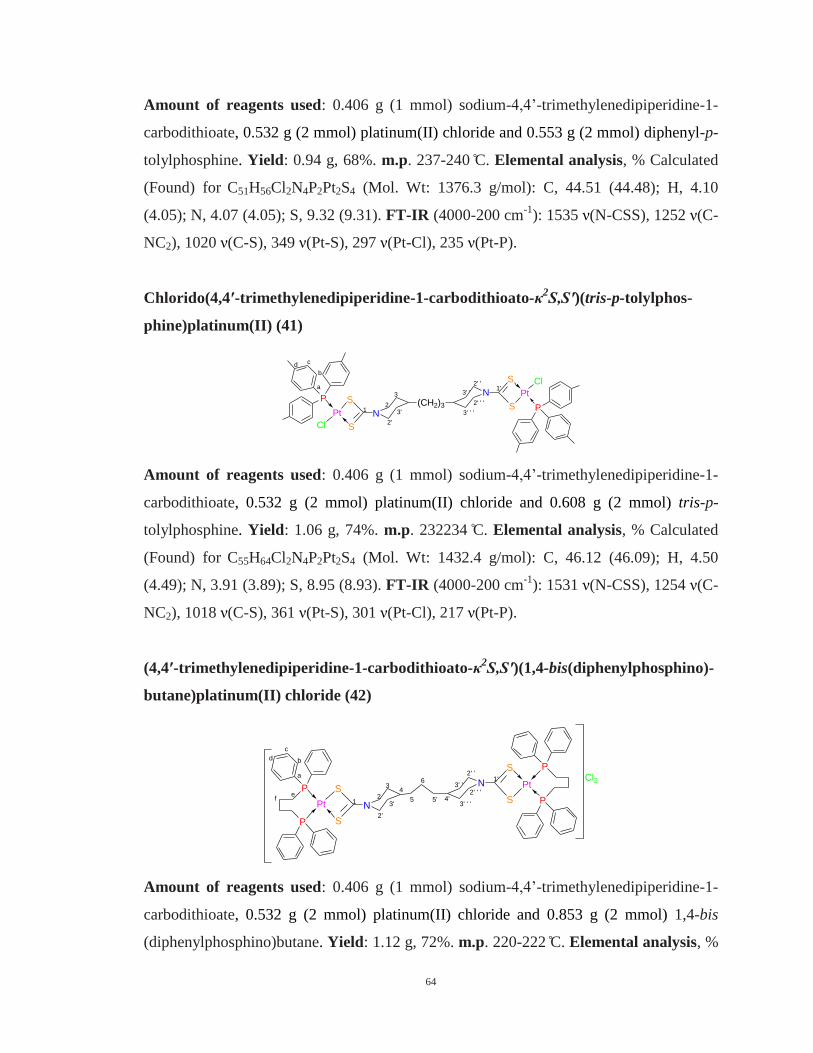
64
Amount of reagents used: 0.406 g (1 mmol) sodium- , ’-trimethylenedipiperidine-1-
carbodithioate, 0.532 g (2 mmol) platinum(II) chloride and 0.553 g (2 mmol) diphenyl-p-
tolylphosphine. Yield: 0.94 g, 68%. m.p. 237-240 C. Elemental analysis, % Calculated
(Found) for C51H56Cl2N4P2Pt2S4 (Mol. Wt: 1376.3 g/mol): C, 44.51 (44.48); H, 4.10
(4.05); N, 4.07 (4.05); S, 9.32 (9.31). FT-IR (4000-200 cm-1
): 1535 ν(N-CSS), 1252 ν(C-
NC2), 1020 ν(C-S), 349 ν(Pt-S), 297 ν(Pt-Cl), 235 ν(Pt-P).
Chlorido(4,4ʹ-trimethylenedipiperidine-1-carbodithioato-κ2S,Sʹ)(tris-p-tolylphos-
phine)platinum(II) (41)
Pt
Cl
P S
S
N(CH2)3
Pt
Cl
PS
S
N
12
3
2'
3'
1'2' '
2' ' '
3' '
3' ' '
a
b
cd
Amount of reagents used: 0.406 g (1 mmol) sodium- , ’-trimethylenedipiperidine-1-
carbodithioate, 0.532 g (2 mmol) platinum(II) chloride and 0.608 g (2 mmol) tris-p-
tolylphosphine. Yield: 1.06 g, 74%. m.p. 232234 C. Elemental analysis, % Calculated
(Found) for C55H64Cl2N4P2Pt2S4 (Mol. Wt: 1432.4 g/mol): C, 46.12 (46.09); H, 4.50
(4.49); N, 3.91 (3.89); S, 8.95 (8.93). FT-IR (4000-200 cm-1
): 1531 ν(N-CSS), 1254 ν(C-
NC2), 1018 ν(C-S), 361 ν(Pt-S), 301 ν(Pt-Cl), 217 ν(Pt-P).
(4,4ʹ-trimethylenedipiperidine-1-carbodithioato-κ2S,Sʹ)(1,4-bis(diphenylphosphino)-
butane)platinum(II) chloride (42)
Pt
P S
S
N
P
Cl2Pt
PS
S
N
P
12
3
2'
3'
1'2' '
2' ' '3' '
3' ' '
a
b
c
d
ef
4
4'5 5'
6
Amount of reagents used: 0.406 g (1 mmol) sodium- , ’-trimethylenedipiperidine-1-
carbodithioate, 0.532 g (2 mmol) platinum(II) chloride and 0.853 g (2 mmol) 1,4-bis
(diphenylphosphino)butane. Yield: 1.12 g, 72%. m.p. 220-222 C. Elemental analysis, %
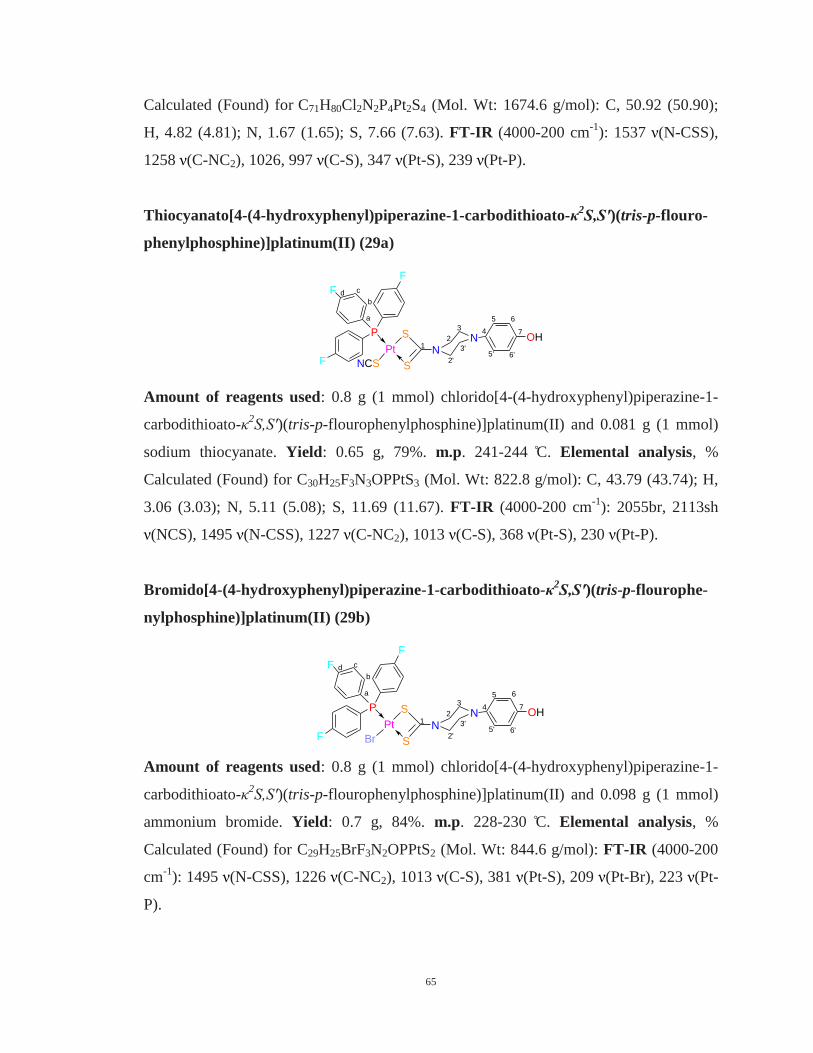
65
Calculated (Found) for C71H80Cl2N2P4Pt2S4 (Mol. Wt: 1674.6 g/mol): C, 50.92 (50.90);
H, 4.82 (4.81); N, 1.67 (1.65); S, 7.66 (7.63). FT-IR (4000-200 cm-1
): 1537 ν(N-CSS),
1258 ν(C-NC2), 1026, 997 ν(C-S), 347 ν(Pt-S), 239 ν(Pt-P).
Thiocyanato[4-(4-hydroxyphenyl)piperazine-1-carbodithioato-κ2S,Sʹ)(tris-p-flouro-
phenylphosphine)]platinum(II) (29a)
Pt
NCS
P S
S
N
F
N OH1
2
3
3'
2'
4
5 6
7
a
b
cd
F
F
6'5'
Amount of reagents used: 0.8 g (1 mmol) chlorido[4-(4-hydroxyphenyl)piperazine-1-
carbodithioato-κ2S,Sʹ)(tris-p-flourophenylphosphine)]platinum(II) and 0.081 g (1 mmol)
sodium thiocyanate. Yield: 0.65 g, 79%. m.p. 241-244 C. Elemental analysis, %
Calculated (Found) for C30H25F3N3OPPtS3 (Mol. Wt: 822.8 g/mol): C, 43.79 (43.74); H,
3.06 (3.03); N, 5.11 (5.08); S, 11.69 (11.67). FT-IR (4000-200 cm-1
): 2055br, 2113sh
ν(NCS), 1495 ν(N-CSS), 1227 ν(C-NC2), 1013 ν(C-S), 368 ν(Pt-S), 230 ν(Pt-P).
Bromido[4-(4-hydroxyphenyl)piperazine-1-carbodithioato-κ2S,Sʹ)(tris-p-flourophe-
nylphosphine)]platinum(II) (29b)
Pt
Br
P S
S
N
F
N OH1
2
3
3'
2'
4
5 6
7
a
b
cd
F
F
6'5'
Amount of reagents used: 0.8 g (1 mmol) chlorido[4-(4-hydroxyphenyl)piperazine-1-
carbodithioato-κ2S,Sʹ)(tris-p-flourophenylphosphine)]platinum(II) and 0.098 g (1 mmol)
ammonium bromide. Yield: 0.7 g, 84%. m.p. 228-230 C. Elemental analysis, %
Calculated (Found) for C29H25BrF3N2OPPtS2 (Mol. Wt: 844.6 g/mol): FT-IR (4000-200
cm-1
): 1495 ν(N-CSS), 1226 ν(C-NC2), 1013 ν(C-S), 381 ν(Pt-S), 209 ν(Pt-Br), 223 ν(Pt-
P).
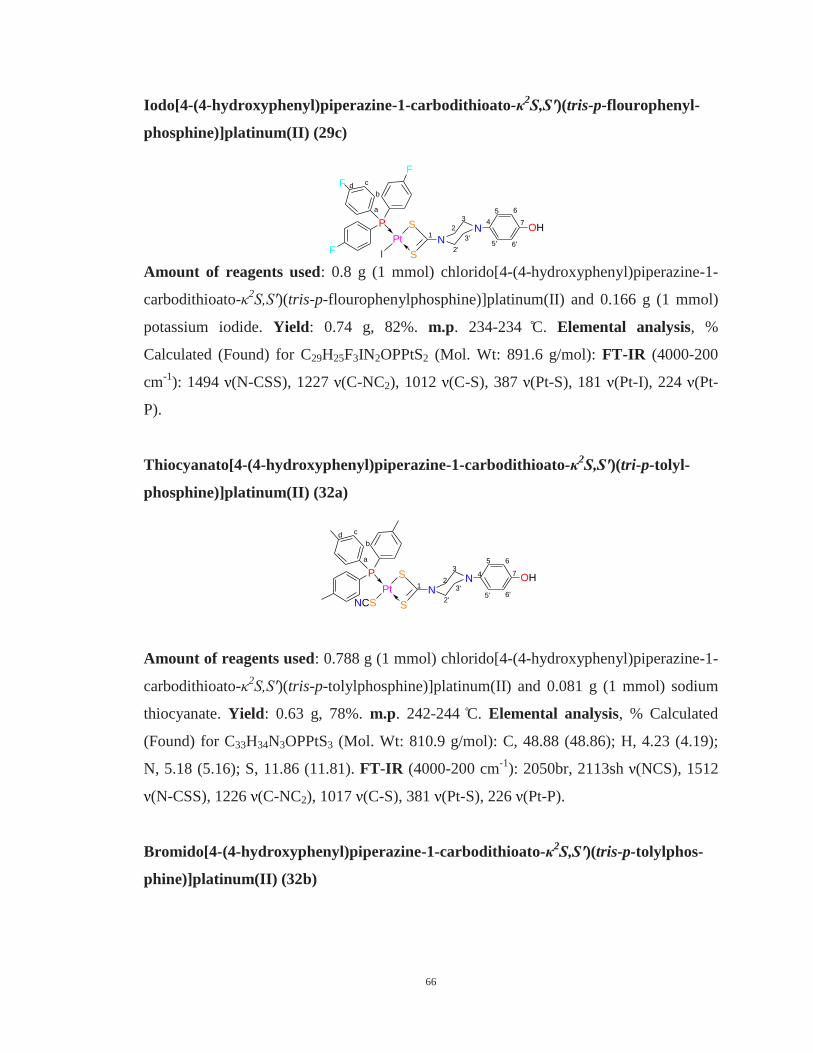
66
Iodo[4-(4-hydroxyphenyl)piperazine-1-carbodithioato-κ2S,Sʹ)(tris-p-flourophenyl-
phosphine)]platinum(II) (29c)
Amount of reagents used: 0.8 g (1 mmol) chlorido[4-(4-hydroxyphenyl)piperazine-1-
carbodithioato-κ2S,Sʹ)(tris-p-flourophenylphosphine)]platinum(II) and 0.166 g (1 mmol)
potassium iodide. Yield: 0.74 g, 82%. m.p. 234-234 C. Elemental analysis, %
Calculated (Found) for C29H25F3IN2OPPtS2 (Mol. Wt: 891.6 g/mol): FT-IR (4000-200
cm-1
): 1494 ν(N-CSS), 1227 ν(C-NC2), 1012 ν(C-S), 387 ν(Pt-S), 181 ν(Pt-I), 224 ν(Pt-
P).
Thiocyanato[4-(4-hydroxyphenyl)piperazine-1-carbodithioato-κ2S,Sʹ)(tri-p-tolyl-
phosphine)]platinum(II) (32a)
Pt
NCS
P S
S
NN OH
12
3
3'
2'
4
5 6
7
a
b
cd
6'5'
Amount of reagents used: 0.788 g (1 mmol) chlorido[4-(4-hydroxyphenyl)piperazine-1-
carbodithioato-κ2S,Sʹ)(tris-p-tolylphosphine)]platinum(II) and 0.081 g (1 mmol) sodium
thiocyanate. Yield: 0.63 g, 78%. m.p. 242-244 C. Elemental analysis, % Calculated
(Found) for C33H34N3OPPtS3 (Mol. Wt: 810.9 g/mol): C, 48.88 (48.86); H, 4.23 (4.19);
N, 5.18 (5.16); S, 11.86 (11.81). FT-IR (4000-200 cm-1
): 2050br, 2113sh ν(NCS), 1512
ν(N-CSS), 1226 ν(C-NC2), 1017 ν(C-S), 381 ν(Pt-S), 226 ν(Pt-P).
Bromido[4-(4-hydroxyphenyl)piperazine-1-carbodithioato-κ2S,Sʹ)(tris-p-tolylphos-
phine)]platinum(II) (32b)
Pt
I
P S
S
N
F
N OH1
2
3
3'
2'
4
5 6
7
a
b
cd
F
F
6'5'
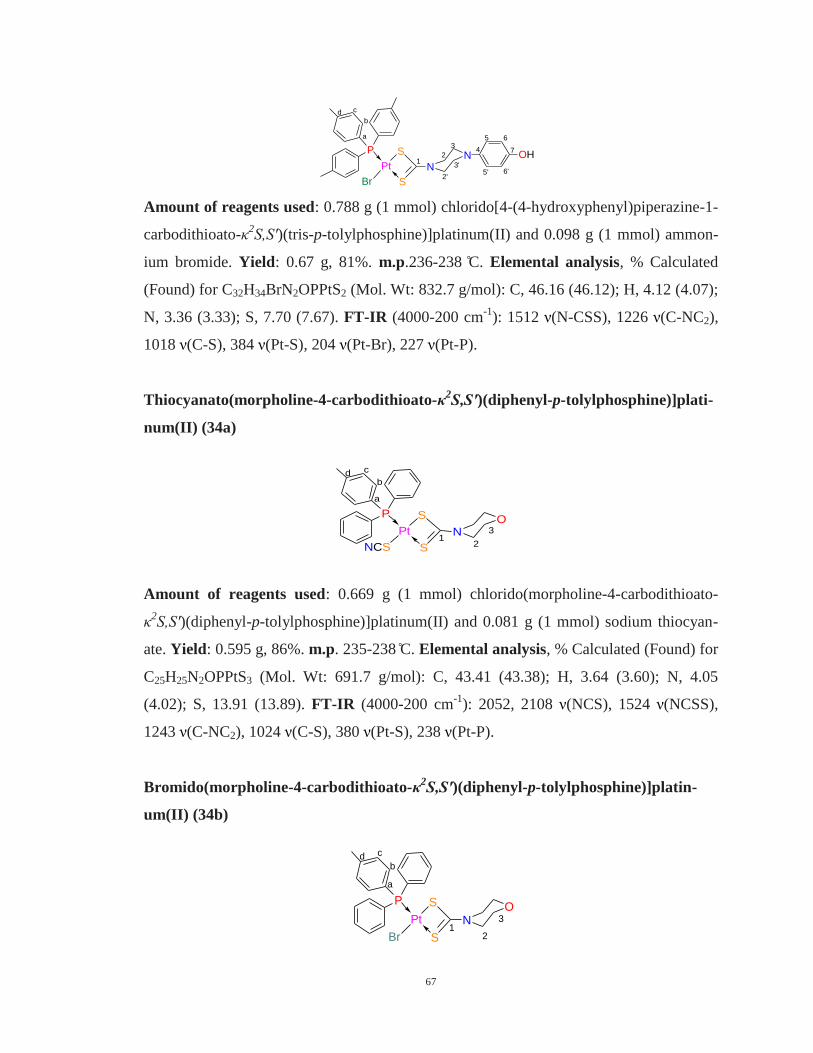
67
Pt
Br
P S
S
NN OH
12
3
3'
2'
4
5 6
7
a
b
cd
6'5'
Amount of reagents used: 0.788 g (1 mmol) chlorido[4-(4-hydroxyphenyl)piperazine-1-
carbodithioato-κ2S,Sʹ)(tris-p-tolylphosphine)]platinum(II) and 0.098 g (1 mmol) ammon-
ium bromide. Yield: 0.67 g, 81%. m.p.236-238 C. Elemental analysis, % Calculated
(Found) for C32H34BrN2OPPtS2 (Mol. Wt: 832.7 g/mol): C, 46.16 (46.12); H, 4.12 (4.07);
N, 3.36 (3.33); S, 7.70 (7.67). FT-IR (4000-200 cm-1
): 1512 ν(N-CSS), 1226 ν(C-NC2),
1018 ν(C-S), 384 ν(Pt-S), 204 ν(Pt-Br), 227 ν(Pt-P).
Thiocyanato(morpholine-4-carbodithioato-κ2S,Sʹ)(diphenyl-p-tolylphosphine)]plati-
num(II) (34a)
Amount of reagents used: 0.669 g (1 mmol) chlorido(morpholine-4-carbodithioato-
κ2S,Sʹ)(diphenyl-p-tolylphosphine)]platinum(II) and 0.081 g (1 mmol) sodium thiocyan-
ate. Yield: 0.595 g, 86%. m.p. 235-238 C. Elemental analysis, % Calculated (Found) for
C25H25N2OPPtS3 (Mol. Wt: 691.7 g/mol): C, 43.41 (43.38); H, 3.64 (3.60); N, 4.05
(4.02); S, 13.91 (13.89). FT-IR (4000-200 cm-1
): 2052, 2108 ν(NCS), 1524 ν(NCSS),
1243 ν(C-NC2), 1024 ν(C-S), 380 ν(Pt-S), 238 ν(Pt-P).
Bromido(morpholine-4-carbodithioato-κ2S,Sʹ)(diphenyl-p-tolylphosphine)]platin-
um(II) (34b)
Pt
Br
P S
S
NO
12
3
a
b
cd
Pt
NCS
P S
S
NO
12
3
a
b
cd
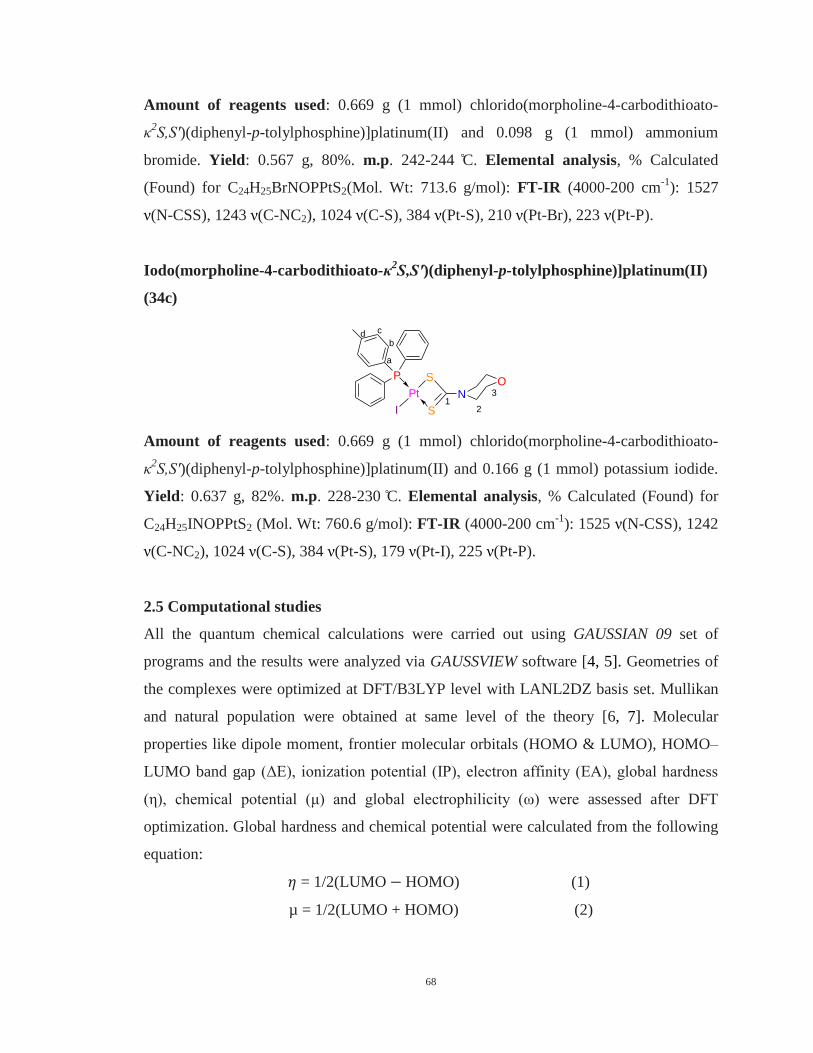
68
Amount of reagents used: 0.669 g (1 mmol) chlorido(morpholine-4-carbodithioato-
κ2S,Sʹ)(diphenyl-p-tolylphosphine)]platinum(II) and 0.098 g (1 mmol) ammonium
bromide. Yield: 0.567 g, 80%. m.p. 242-244 C. Elemental analysis, % Calculated
(Found) for C24H25BrNOPPtS2(Mol. Wt: 713.6 g/mol): FT-IR (4000-200 cm-1
): 1527
ν(N-CSS), 1243 ν(C-NC2), 1024 ν(C-S), 384 ν(Pt-S), 210 ν(Pt-Br), 223 ν(Pt-P).
Iodo(morpholine-4-carbodithioato-κ2S,Sʹ)(diphenyl-p-tolylphosphine)]platinum(II)
(34c)
Pt
I
P S
S
NO
12
3
a
b
cd
Amount of reagents used: 0.669 g (1 mmol) chlorido(morpholine-4-carbodithioato-
κ2S,Sʹ)(diphenyl-p-tolylphosphine)]platinum(II) and 0.166 g (1 mmol) potassium iodide.
Yield: 0.637 g, 82%. m.p. 228-230 C. Elemental analysis, % Calculated (Found) for
C24H25INOPPtS2 (Mol. Wt: 760.6 g/mol): FT-IR (4000-200 cm-1
): 1525 ν(N-CSS), 1242
ν(C-NC2), 1024 ν(C-S), 384 ν(Pt-S), 179 ν(Pt-I), 225 ν(Pt-P).
2.5 Computational studies
All the quantum chemical calculations were carried out using GAUSSIAN 09 set of
programs and the results were analyzed via GAUSSVIEW software [4, 5]. Geometries of
the complexes were optimized at DFT/B3LYP level with LANL2DZ basis set. Mullikan
and natural population were obtained at same level of the theory [6, 7]. Molecular
properties like dipole moment, frontier molecular orbitals (HOMO & LUMO), HOMO–
LUMO band gap (ΔE), ionization potential (IP), electron affinity (EA), global hardness
(η), chemical potential (μ) and global electrophilicity (ω) were assessed after DFT
optimization. Global hardness and chemical potential were calculated from the following
equation:
= 1/2(LUMO HOMO) (1)
µ = 1/2(LUMO + HOMO) (2)
69
2.6 DNA-binding using UV-visible spectroscopy
The CT-DNA (20 mg) was dissolved in double deionized water to prepare stock solution
and then its concentration was determined spectrophotometrically at 260 nm using
epsilon value of 6600 M-1
cm-1
[8]. The value of A260/A280 ~1.9 confirmed protein free
nature of the DNA. The UV absorption titrations were performed by keeping
concentration of the prepared complexes fixed and varying the DNA concentration.
During titration, same DNA concentrations were added to both reference and sample
cuvettes to eliminate the absorbance of DNA itself. After ~5 min of the solutions mixing,
absorption spectra were recorded at room temperature in a range of 200-800 nm. The
titration procedures were repeated until there was no change in the spectra for four
titrations at least; indicating binding saturation had been achieved. Benesi–Hildebrand
equation [9] was used to determine the association/binding constants.
=
Where K is the association/binding constant, Aₒ and A are the absorbances of the
complex and its adduct with DNA respectively, and ɛG and ɛH–G are the absorption
coefficients of the compound and the compound-DNA adduct, respectively. The Gibb’s
free energy (ΔG) was determined from the following equation:
ΔG = RT ln K
Where R is the general gas constant (8.314 J K-1
mol-1
) and T is the temperature (298 K).
2.7 DNA-binding using viscosity measurements
Viscosity measurements were carried out using a glass viscometer at room temperature.
A 100 µM solution of the DNA and a series of solutions, containing this constant DNA
concentration with varying concentrations of the complexes (50, 100, 150, 200 and 250
µM), were prepared in DMSO. A digital stopwatch was used to measure the flow time
and an average flow time of three readings was calculated for each solution. First relative
viscosity “ηo” of DNA to solvent was calculated and then relative viscosities (η) of series
of the solutions containing constant DNA and varying concentrations of the complexes
70
were measured. The values of relative specific viscosities (η/(ηo)) were plotted against
[Complex]/[DNA] ratio [10].
2.8 DNA-binding using cyclic voltammetry
Cyclic voltammetric measurements were performed for 2 on Biologic SP-300 cyclic
voltammeter running with EC-lab Express V 5.40 software Japan having three electrodes
system i.e. Pt-disc as working electrode, Pt-wire as counter electrode and Ag/AgCl as
reference electrode. Analytical grade TBAP was used as supporting electrolyte. Before
every reading, working electrode was polished with alumina powder and rinsed with
distilled water [11]. Nitrogen gas (99.9%) was purged through the working solution to
avoid oxygen interference. Drug-DNA binding constant was determined with equation:
log(1/[DNA]) = logK + log(I/Io −I)
Where K is the binding constant, Io and I are the peak currents of free drug and DNA-
bound drug respectively. Following form of Randles–Sevcik equation was used for the
calculation of diffusion coefficients [11]:
Ipa = 2.99 × 10⁵n (αn)
1/2 ACo
Do 1/2
V1/2
Where Ipa is the anodic peak current, Co is the reductant’s concentration in mol cm−
, A is
the geometric area of the electrode in cm2, n is the number of electrons involved in the
process and Do is the diffusion coefficient in cm2
s−
.
2.9 Cytotoxic potential against HepG2 cancer cell line
Human hepatocellular carcinoma (HepG2) cells were maintained in DMEM containing
FBS (10%), Na-pyruvate (1 mM), L-glutamine (2 mM), penicillin (100 µg/ml) and
streptomycin (100 µg/ml) under a humidified atmosphere at 5% CO2 and 37 °C.
Cytotoxicity of the representative complexes (3-5, 7-14, 17-19, 25, 27, 28, 38-42) was
measured by MTT assay [12]. In short, HepG2 cultures (>90% viability; 1.5×10⁵
cells/ml) were exposed to six different concentrations (1, 3, 10, 30, 100 and 300 µM) of
the complexes, doxorubicin and cisplatin for 24 hours. As experimental controls,
unexposed samples, DMSO (solvent) treated and non-cellular background samples i.e.,
71
‘media only’ and ‘compounds only’ were included in each experiment. Then cultures
were incubated with MTT solution (0.5 mg/ml) for 3 hours at 37 °C to produce formazan
crystals which were dissolved in acidified 10% SDS and absorbance was measured at 565
nm by using a microplate reader (AMP PLATOS R-496). Relative percent viability of the
treated samples was calculated using the following formula:
Relative percent viability = [Abs (565)test Abs (565)compound control/Abs (565)unexposed control
Abs (565)media] × 100,
Where Abs (565)test and Abs (565)unexposed control represent the optical density at 565 nm for
the treated samples and untreated control samples respectively. Abs (565)compound control
and Abs (565)media represent background optical density and was measured in compound
only and media only samples respectively. IC50 values for the compounds representing
the concentrations at which 50% of cell growth is inhibited, were calculated.
2.10 Cytotoxic potential against five cancer cell lines
Sulforhodamine B (SRB) cellular protein-staining method [13] was used to evaluate the
cytotoxic potential of the three representative complexes 1, 2 and 6 towards proliferation
of five different human cancer cell lines. Cancer cells (1 104 cells in 190 µl of the
complete media) were plated in 96-well plates containing the tested compounds dissolved
in 100% DMSO and incubated (37 , 5% CO2 in humidified air) for 72 hours. The
incubation was stopped at the end with tri-chloroacetic acid. The cells were washed, air
dried and stained with SRB solution, and after that optical densities (ODs) were measured
at 515 nm using a microplate reader. A zero-day control was performed in each case by
adding an equivalent number of cells to several wells, incubating at 37 for 30 min and
processing as described above. The percentage cell survival was calculated using the
following formula:
2.11 Anticancer activity against LU and MCF-7 cancer cell lines
Cytotoxicity of the complexes was also investigated against LU (human lung carcinoma)
and MCF-7 (human breast adenocarcinoma) by the same MTT procedure as described
72
above, except exposing these cell lines herein, to six different concentrations (1, 3, 10,
30, 100, and 300 µM) of the complexes and cisplatin for 48 hours.
2.12 Cleavage of plasmid DNA
Plasmid DNA (pUC 19) cleavage activity of the complexes was monitored by using
agarose gel electrophoresis [14]. In a typical experiment, supercoiled pUC 19 DNA (12.5
μg/ml, μl) in Tris-HCl (100 mM, pH 7.4) was treated with different complex
concentrations, followed by dilution with the mentioned buffer to a total volume of μl.
The samples were then incubated at 37 for 6 hours and loaded on a 0.7% agarose gel
containing . μg/ml ethidium bromide. Electrophoresis was carried out at 40 V for 30
min in TAE buffer and run in duplicate. DNA-bands were visualized in UV light and then
photographed followed by estimation of their intensity using a gel documentation system.
73
REFERENCES
1. Armarego, W. L.; Chai, C. L. L., Purification of laboratory chemicals,
Butterworth-Heinemann 2013.
2. Armarego W.L.; C.L.L. Chai, Purification of Laboratory Chemicals, 7th Edition,
Butterworth-Heinemann, Elsevier Inc., Burlington 2009.
3. Sheldrick, G. M., A short history of SHELX, Acta Crystallogr. Sect. A, 2008, 64,
112-122.
4. Frisch, M.; Trucks, G.; Schlegel, H. B.; Scuseria, G.; Robb, M.; Cheeseman, J.;
Scalmani, G.; Barone, V.; Mennucci, B.; Petersson, G., Gaussian 09, revision a.
02, gaussian. Inc., Wallingford, CT 2009, 200.
5. Frisch, A.; Nielsen, A.; Holder, A., GAUSSIANVIEW Users Manual, Gaussian
Inc., Pittsburgh PA, 2000.
6. Abdel-Ghani, N.; Mansour, A., Molecular structures of antitumor active Pd (II)
and Pt (II) complexes of N, N-donor benzimidazole methyl ester, J. Coord. Chem.
2012, 65, 763-779.
7. Zhang, G.; Musgrave, C. B., Comparison of DFT methods for molecular orbital
eigenvalue calculations, J. Phys. Chem. A 2007, 111, 1554-1561.
8. Reichmann, M.; Rice, S.; Thomas, C.; Doty, P., A further examination of the
molecular weight and size of desoxypentose nucleic acid, J. Am. Chem. Soc.
1954, 76, 3047-3053.
9. Shujha, S.; Shah, A.; Muhammad, N.; Ali, S.; Qureshi, R.; Khalid, N.; Meetsma,
A., Diorganotin (IV) derivatives of ONO tridentate Schiff base: synthesis, crystal
structure, in vitro antimicrobial, anti-leishmanial and DNA binding studies, Eur.
J. Med. Chem. 2010, 45, 2902-2911.
10. Shi, S.; Liu, J.; Li, J.; Zheng, K.-C.; Huang, X.-M.; Tan, C.-P.; Chen, L.-M.; Ji,
L.-N., Synthesis, characterization and DNA-binding of novel chiral complexes Δ-
and Λ-[Ru(bpy)2L]2+
(L = o-mopip and p-mopip), J. Inorg. Biochem. 2006, 100,
385-395.
11. Holze, R., CMA Brett, AMO Brett: Electrochemistry-Principles, methods and
applications, Oxford University Press, Oxford, ISBN 0‐19‐855388‐9, 1993, 427.
74
12. Mosmann, T., Rapid colorimetric assay for cellular growth and survival:
application to proliferation and cytotoxicity assays, J. Immunol. Methods 1983,
65, 55-63.
13. You, M.; Wickramaratne, D. M.; Silva, G. L.; Chai, H.; Chagwedera, T. E.;
Farnsworth, N. R.; Cordell, G. A.; Kinghorn, A. D.; Pezzuto, J. M., (-)-
Roemerine, an aporphine alkaloid from Annona senegalensis that reverses the
multidrug-resistance phenotype with cultured cells, J. Nat. Prod. 1995, 58, 598-
604.
14. Raman, N.; Thalamuthu, S.; Dhaveethuraja, J.; Neelakandan, M.; Banerjee, S.,
DNA cleavage and antimicrobial activity studies on transition metal (II)
complexes of 4-aminoantipyrine derivative, J. Chil. Chem. Soc. 2008, 53, 1439-
1443.
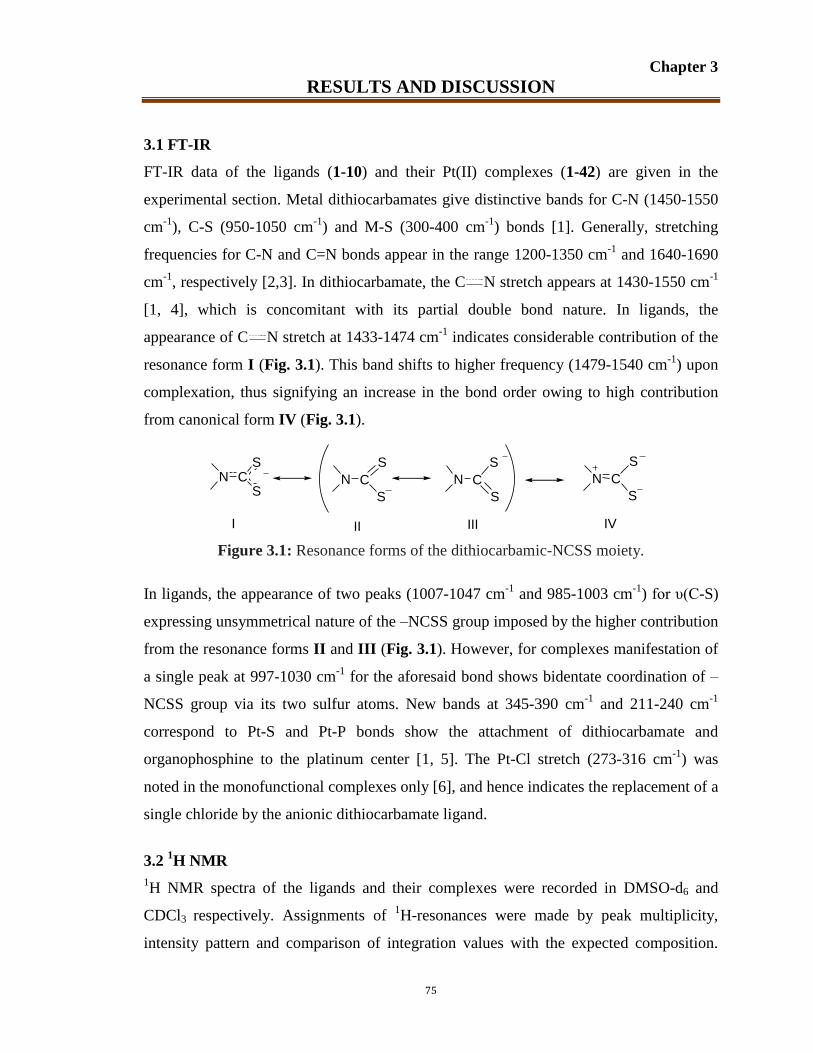
Chapter 3
RESULTS AND DISCUSSION
75
3.1 FT-IR
FT-IR data of the ligands (1-10) and their Pt(II) complexes (1-42) are given in the
experimental section. Metal dithiocarbamates give distinctive bands for C-N (1450-1550
cm-1
), C-S (950-1050 cm-1
) and M-S (300-400 cm-1
) bonds [1]. Generally, stretching
frequencies for C-N and C=N bonds appear in the range 1200-1350 cm-1
and 1640-1690
cm-1
, respectively [2,3]. In dithiocarbamate, the C N stretch appears at 1430-1550 cm-1
[1, 4], which is concomitant with its partial double bond nature. In ligands, the
appearance of C N stretch at 1433-1474 cm-1
indicates considerable contribution of the
resonance form I (Fig. 3.1). This band shifts to higher frequency (1479-1540 cm-1
) upon
complexation, thus signifying an increase in the bond order owing to high contribution
from canonical form IV (Fig. 3.1).
N CS
SN C
S
S
N C
S
S
N C
S
S
I II III IV
Figure 3.1: Resonance forms of the dithiocarbamic-NCSS moiety.
In ligands, the appearance of two peaks (1007-1047 cm-1
and 985-1003 cm-1
) for υ(C-S)
expressing unsymmetrical nature of the –NCSS group imposed by the higher contribution
from the resonance forms II and III (Fig. 3.1). However, for complexes manifestation of
a single peak at 997-1030 cm-1
for the aforesaid bond shows bidentate coordination of –
NCSS group via its two sulfur atoms. New bands at 345-390 cm-1
and 211-240 cm-1
correspond to Pt-S and Pt-P bonds show the attachment of dithiocarbamate and
organophosphine to the platinum center [1, 5]. The Pt-Cl stretch (273-316 cm-1
) was
noted in the monofunctional complexes only [6], and hence indicates the replacement of a
single chloride by the anionic dithiocarbamate ligand.
3.2 1H NMR
1H NMR spectra of the ligands and their complexes were recorded in DMSO-d6 and
CDCl3 respectively. Assignments of 1H-resonances were made by peak multiplicity,
intensity pattern and comparison of integration values with the expected composition.
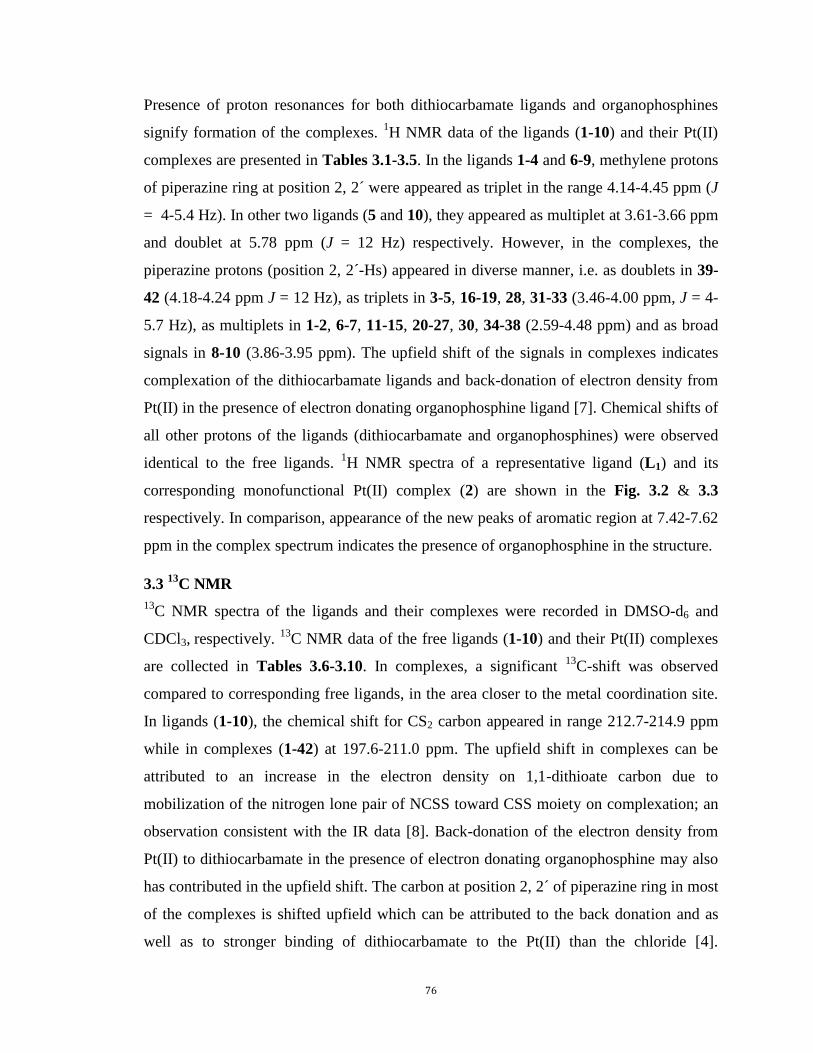
76
Presence of proton resonances for both dithiocarbamate ligands and organophosphines
signify formation of the complexes. 1H NMR data of the ligands (1-10) and their Pt(II)
complexes are presented in Tables 3.1-3.5. In the ligands 1-4 and 6-9, methylene protons
of piperazine ring at position 2, 2´ were appeared as triplet in the range 4.14-4.45 ppm (J
= 4-5.4 Hz). In other two ligands (5 and 10), they appeared as multiplet at 3.61-3.66 ppm
and doublet at 5.78 ppm (J = 12 Hz) respectively. However, in the complexes, the
piperazine protons (position 2, 2´-Hs) appeared in diverse manner, i.e. as doublets in 39-
42 (4.18-4.24 ppm J = 12 Hz), as triplets in 3-5, 16-19, 28, 31-33 (3.46-4.00 ppm, J = 4-
5.7 Hz), as multiplets in 1-2, 6-7, 11-15, 20-27, 30, 34-38 (2.59-4.48 ppm) and as broad
signals in 8-10 (3.86-3.95 ppm). The upfield shift of the signals in complexes indicates
complexation of the dithiocarbamate ligands and back-donation of electron density from
Pt(II) in the presence of electron donating organophosphine ligand [7]. Chemical shifts of
all other protons of the ligands (dithiocarbamate and organophosphines) were observed
identical to the free ligands. 1H NMR spectra of a representative ligand (L1) and its
corresponding monofunctional Pt(II) complex (2) are shown in the Fig. 3.2 & 3.3
respectively. In comparison, appearance of the new peaks of aromatic region at 7.42-7.62
ppm in the complex spectrum indicates the presence of organophosphine in the structure.
3.3 13
C NMR
13C NMR spectra of the ligands and their complexes were recorded in DMSO-d6 and
CDCl3, respectively. 13
C NMR data of the free ligands (1-10) and their Pt(II) complexes
are collected in Tables 3.6-3.10. In complexes, a significant 13
C-shift was observed
compared to corresponding free ligands, in the area closer to the metal coordination site.
In ligands (1-10), the chemical shift for CS2 carbon appeared in range 212.7-214.9 ppm
while in complexes (1-42) at 197.6-211.0 ppm. The upfield shift in complexes can be
attributed to an increase in the electron density on 1,1-dithioate carbon due to
mobilization of the nitrogen lone pair of NCSS toward CSS moiety on complexation; an
observation consistent with the IR data [8]. Back-donation of the electron density from
Pt(II) to dithiocarbamate in the presence of electron donating organophosphine may also
has contributed in the upfield shift. The carbon at position 2, 2´ of piperazine ring in most
of the complexes is shifted upfield which can be attributed to the back donation and as
well as to stronger binding of dithiocarbamate to the Pt(II) than the chloride [4].
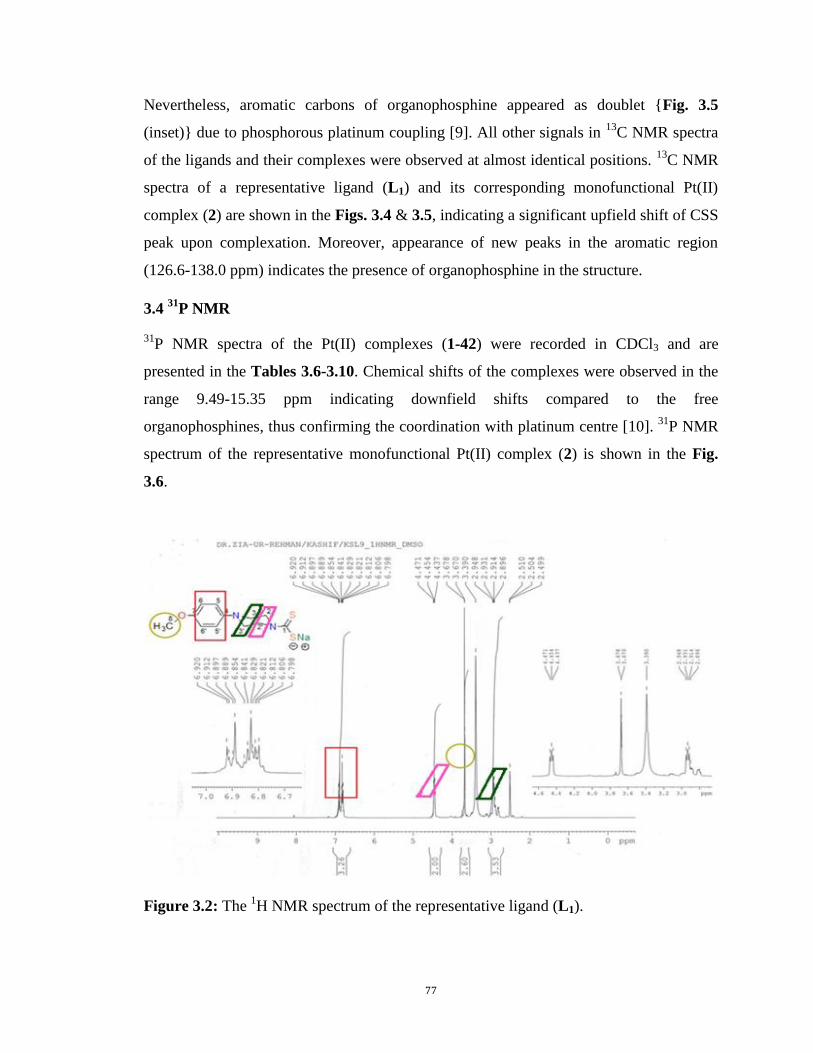
77
Nevertheless, aromatic carbons of organophosphine appeared as doublet {Fig. 3.5
(inset)} due to phosphorous platinum coupling [9]. All other signals in 13
C NMR spectra
of the ligands and their complexes were observed at almost identical positions. 13
C NMR
spectra of a representative ligand (L1) and its corresponding monofunctional Pt(II)
complex (2) are shown in the Figs. 3.4 & 3.5, indicating a significant upfield shift of CSS
peak upon complexation. Moreover, appearance of new peaks in the aromatic region
(126.6-138.0 ppm) indicates the presence of organophosphine in the structure.
3.4 31
P NMR
31P NMR spectra of the Pt(II) complexes (1-42) were recorded in CDCl3 and are
presented in the Tables 3.6-3.10. Chemical shifts of the complexes were observed in the
range 9.49-15.35 ppm indicating downfield shifts compared to the free
organophosphines, thus confirming the coordination with platinum centre [10]. 31
P NMR
spectrum of the representative monofunctional Pt(II) complex (2) is shown in the Fig.
3.6.
Figure 3.2: The 1H NMR spectrum of the representative ligand (L1).
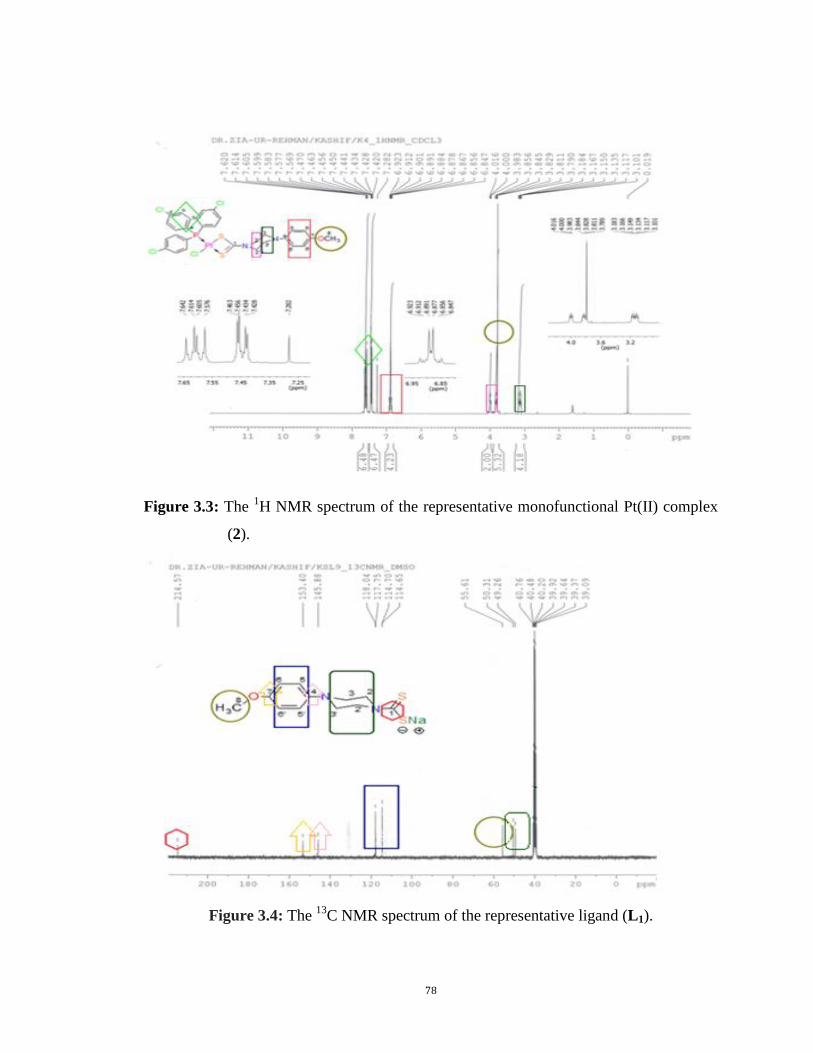
78
Figure 3.3: The 1H NMR spectrum of the representative monofunctional Pt(II) complex
(2).
Figure 3.4: The 13
C NMR spectrum of the representative ligand (L1).
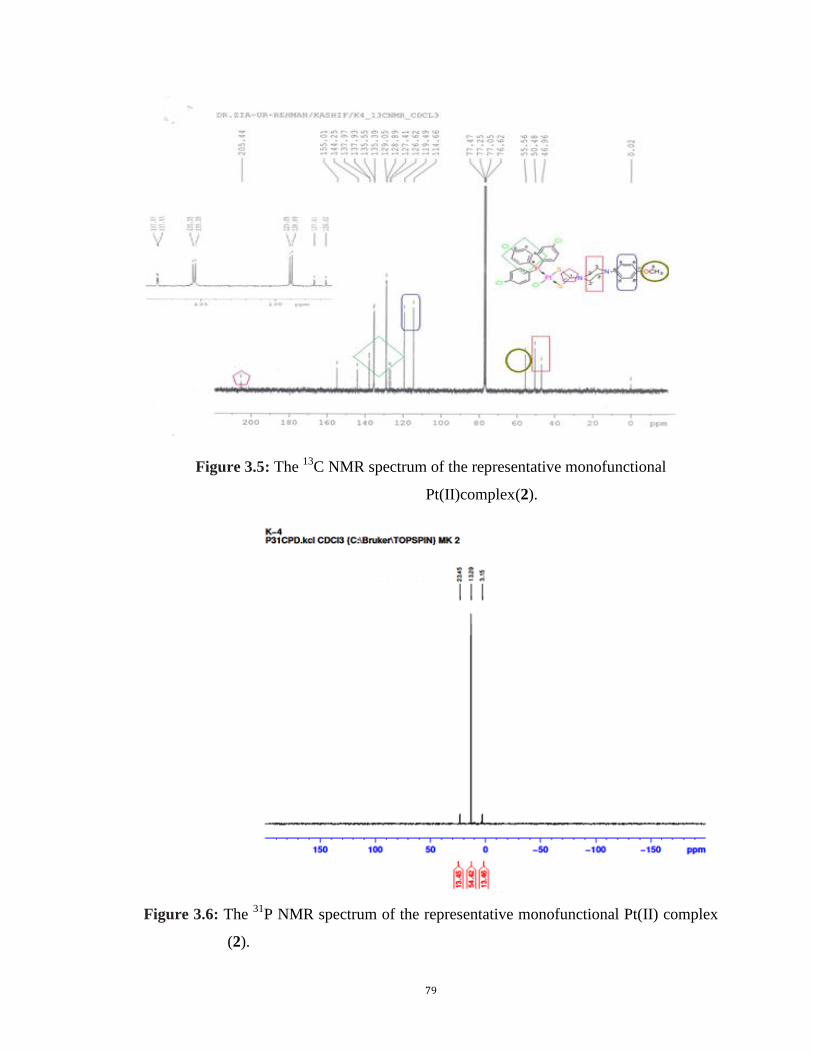
79
Figure 3.5: The 13
C NMR spectrum of the representative monofunctional
Pt(II)complex(2).
Figure 3.6: The 31
P NMR spectrum of the representative monofunctional Pt(II) complex
(2).
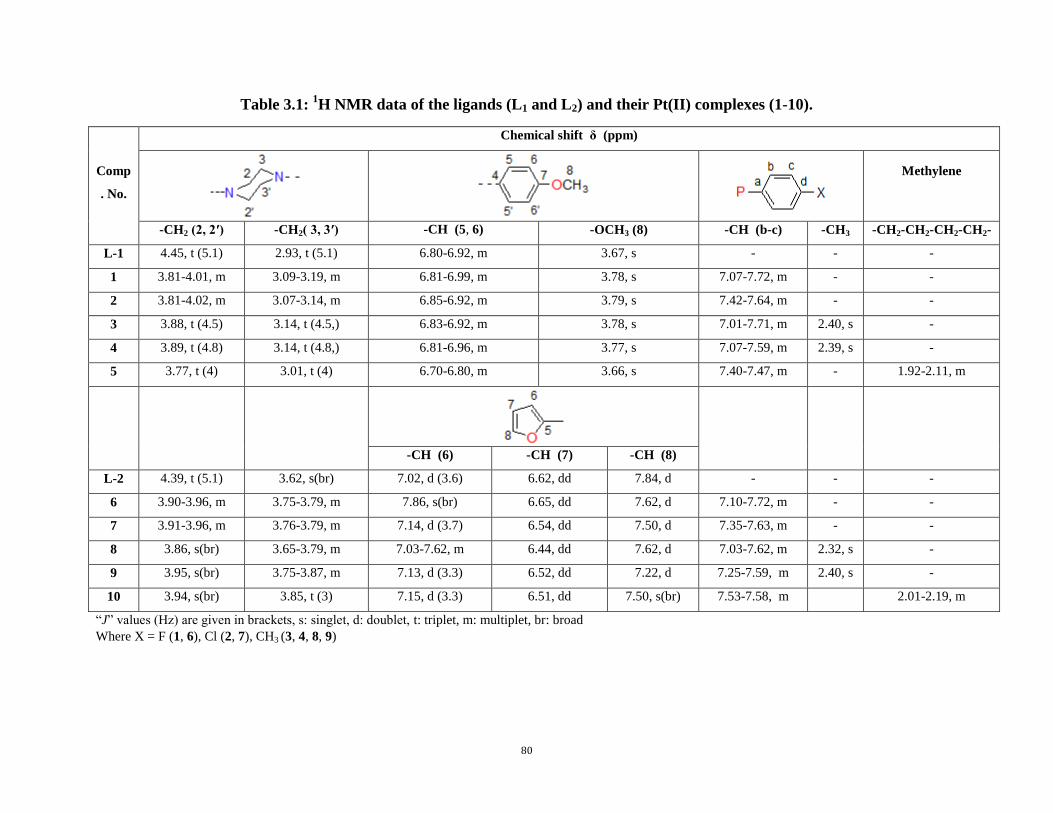
80
Table 3.1: 1H NMR data of the ligands (L1 and L2) and their Pt(II) complexes (1-10).
“J” values (Hz) are given in brackets, s: singlet, d: doublet, t: triplet, m: multiplet, br: broad
Where X = F (1, 6), Cl (2, 7), CH3 (3, 4, 8, 9)
Comp
. No.
Chemical shift δ (ppm)
Methylene
-CH2 (2, 2′) -CH2( 3, 3′) -CH (5, 6) -OCH3 (8) -CH (b-c) -CH3 -CH2-CH2-CH2-CH2-
L-1 4.45, t (5.1) 2.93, t (5.1) 6.80-6.92, m 3.67, s - - -
1 3.81-4.01, m 3.09-3.19, m 6.81-6.99, m 3.78, s 7.07-7.72, m - -
2 3.81-4.02, m 3.07-3.14, m 6.85-6.92, m 3.79, s 7.42-7.64, m - -
3 3.88, t (4.5) 3.14, t (4.5,) 6.83-6.92, m 3.78, s 7.01-7.71, m 2.40, s -
4 3.89, t (4.8) 3.14, t (4.8,) 6.81-6.96, m 3.77, s 7.07-7.59, m 2.39, s -
5 3.77, t (4) 3.01, t (4) 6.70-6.80, m 3.66, s 7.40-7.47, m - 1.92-2.11, m
-CH (6) -CH (7) -CH (8)
L-2 4.39, t (5.1) 3.62, s(br) 7.02, d (3.6) 6.62, dd 7.84, d - - -
6 3.90-3.96, m 3.75-3.79, m 7.86, s(br) 6.65, dd 7.62, d 7.10-7.72, m - -
7 3.91-3.96, m 3.76-3.79, m 7.14, d (3.7) 6.54, dd 7.50, d 7.35-7.63, m - -
8 3.86, s(br) 3.65-3.79, m 7.03-7.62, m 6.44, dd 7.62, d 7.03-7.62, m 2.32, s -
9 3.95, s(br) 3.75-3.87, m 7.13, d (3.3) 6.52, dd 7.22, d 7.25-7.59, m 2.40, s -
10 3.94, s(br) 3.85, t (3) 7.15, d (3.3) 6.51, dd 7.50, s(br) 7.53-7.58, m
2.01-2.19, m
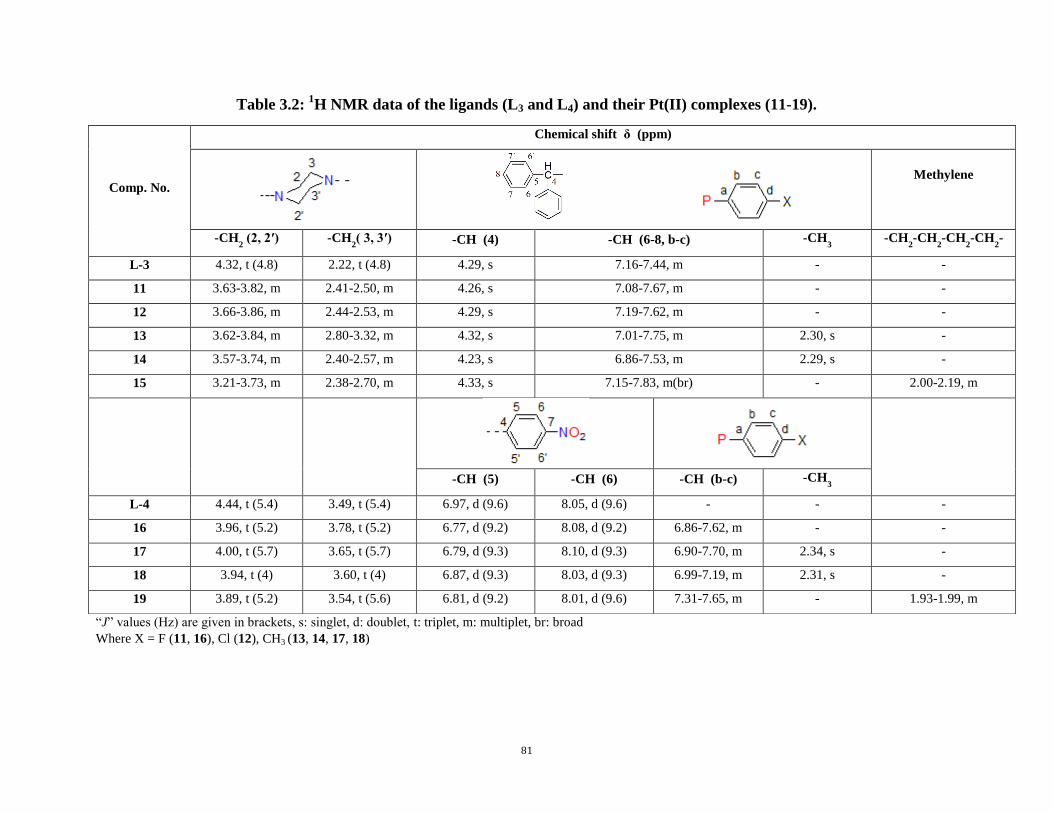
81
Table 3.2: 1H NMR data of the ligands (L3 and L4) and their Pt(II) complexes (11-19).
“J” values (Hz) are given in brackets, s: singlet, d: doublet, t: triplet, m: multiplet, br: broad
Where X = F (11, 16), Cl (12), CH3 (13, 14, 17, 18)
Comp. No.
Chemical shift δ (ppm)
Methylene
-CH2 (2, 2′) -CH
2( 3, 3′) -CH (4) -CH (6-8, b-c) -CH
3 -CH
2-CH
2-CH
2-CH
2-
L-3 4.32, t (4.8) 2.22, t (4.8) 4.29, s 7.16-7.44, m - -
11 3.63-3.82, m 2.41-2.50, m 4.26, s 7.08-7.67, m - -
12 3.66-3.86, m 2.44-2.53, m 4.29, s 7.19-7.62, m - -
13 3.62-3.84, m 2.80-3.32, m 4.32, s 7.01-7.75, m 2.30, s -
14 3.57-3.74, m 2.40-2.57, m 4.23, s 6.86-7.53, m 2.29, s -
15 3.21-3.73, m 2.38-2.70, m 4.33, s 7.15-7.83, m(br) - 2.00-2.19, m
-CH (5) -CH (6) -CH (b-c) -CH3
L-4 4.44, t (5.4) 3.49, t (5.4) 6.97, d (9.6) 8.05, d (9.6) - - -
16 3.96, t (5.2) 3.78, t (5.2) 6.77, d (9.2) 8.08, d (9.2) 6.86-7.62, m - -
17 4.00, t (5.7) 3.65, t (5.7) 6.79, d (9.3) 8.10, d (9.3) 6.90-7.70, m 2.34, s -
18 3.94, t (4) 3.60, t (4) 6.87, d (9.3) 8.03, d (9.3) 6.99-7.19, m 2.31, s -
19 3.89, t (5.2) 3.54, t (5.6) 6.81, d (9.2) 8.01, d (9.6) 7.31-7.65, m - 1.93-1.99, m
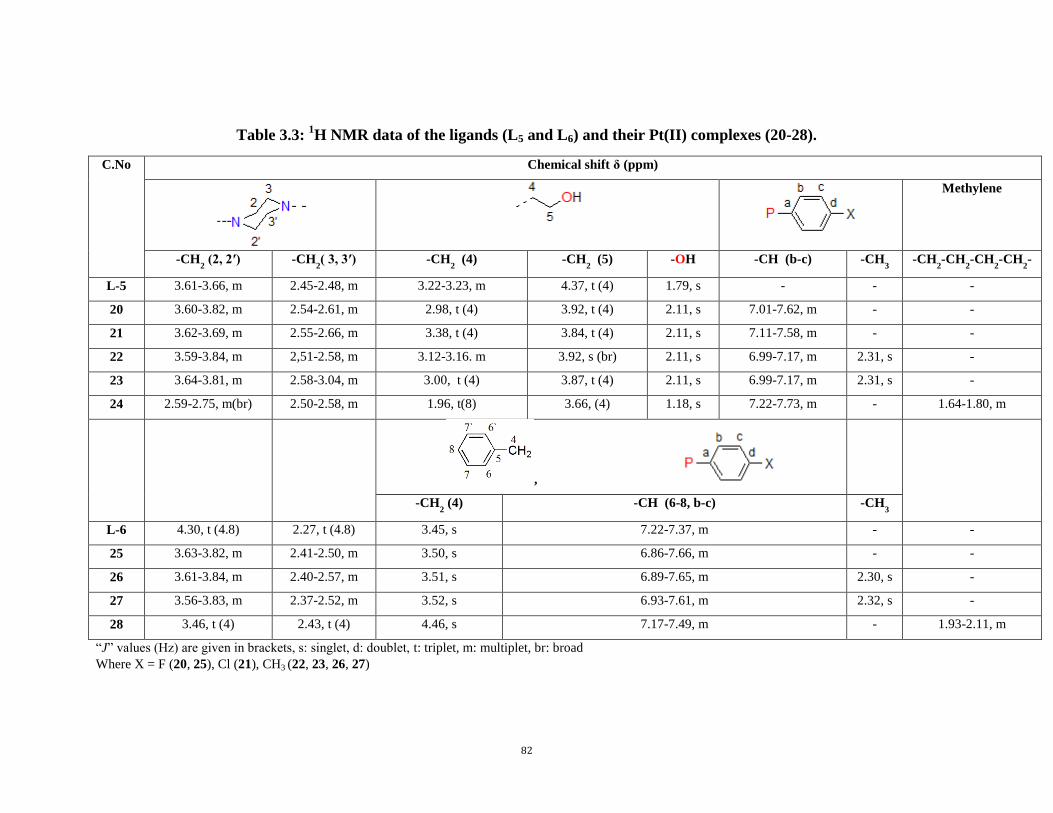
82
Table 3.3: 1H NMR data of the ligands (L5 and L6) and their Pt(II) complexes (20-28).
C.No Chemical shift δ (ppm)
Methylene
-CH2 (2, 2′) -CH
2( 3, 3′) -CH
2 (4) -CH
2 (5) -OH -CH (b-c) -CH
3 -CH
2-CH
2-CH
2-CH
2-
L-5 3.61-3.66, m 2.45-2.48, m 3.22-3.23, m 4.37, t (4) 1.79, s - - -
20 3.60-3.82, m 2.54-2.61, m 2.98, t (4) 3.92, t (4) 2.11, s 7.01-7.62, m - -
21 3.62-3.69, m 2.55-2.66, m 3.38, t (4) 3.84, t (4) 2.11, s 7.11-7.58, m - -
22 3.59-3.84, m 2,51-2.58, m 3.12-3.16. m 3.92, s (br) 2.11, s 6.99-7.17, m 2.31, s -
23 3.64-3.81, m 2.58-3.04, m 3.00, t (4) 3.87, t (4) 2.11, s 6.99-7.17, m 2.31, s -
24 2.59-2.75, m(br) 2.50-2.58, m 1.96, t(8) 3.66, (4) 1.18, s 7.22-7.73, m - 1.64-1.80, m
,
-CH2 (4) -CH (6-8, b-c) -CH
3
L-6 4.30, t (4.8) 2.27, t (4.8) 3.45, s 7.22-7.37, m - -
25 3.63-3.82, m 2.41-2.50, m 3.50, s 6.86-7.66, m - -
26 3.61-3.84, m 2.40-2.57, m 3.51, s 6.89-7.65, m 2.30, s -
27 3.56-3.83, m 2.37-2.52, m 3.52, s 6.93-7.61, m 2.32, s -
28 3.46, t (4) 2.43, t (4) 4.46, s 7.17-7.49, m - 1.93-2.11, m
“J” values (Hz) are given in brackets, s: singlet, d: doublet, t: triplet, m: multiplet, br: broad
Where X = F (20, 25), Cl (21), CH3 (22, 23, 26, 27)
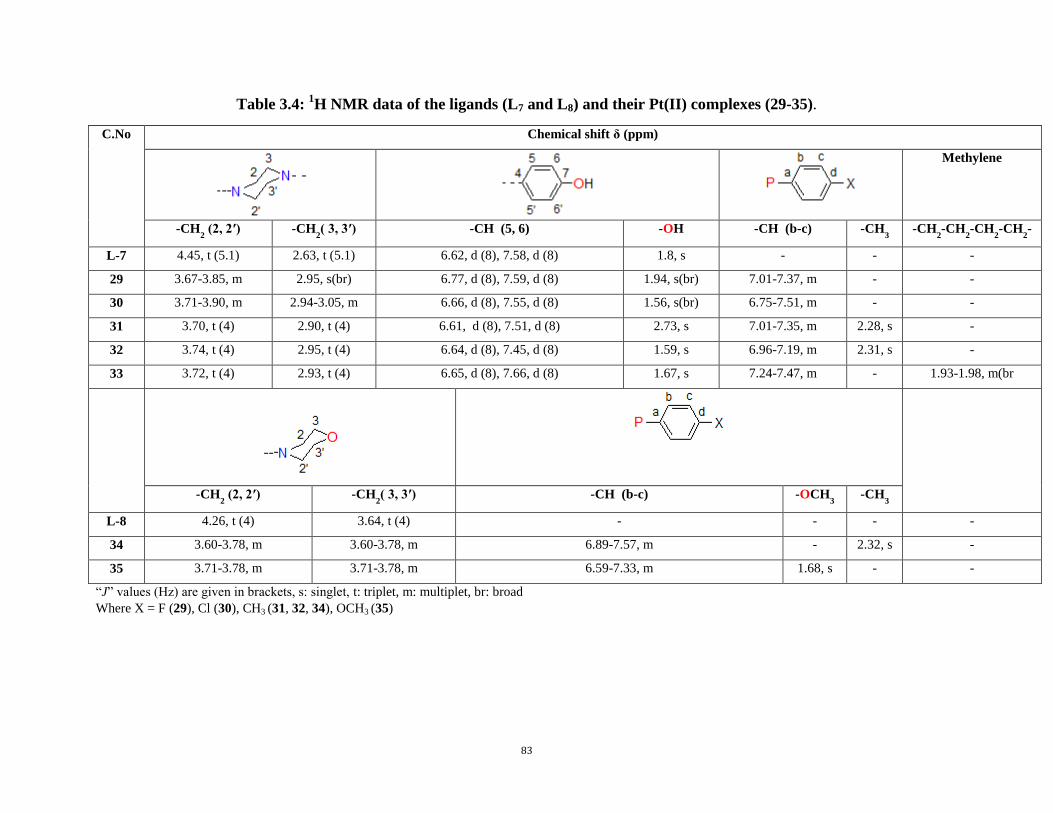
83
Table 3.4: 1H NMR data of the ligands (L7 and L8) and their Pt(II) complexes (29-35).
C.No Chemical shift δ (ppm)
Methylene
-CH2 (2, 2′) -CH
2( 3, 3′) -CH (5, 6) -OH -CH (b-c) -CH
3 -CH
2-CH
2-CH
2-CH
2-
L-7 4.45, t (5.1) 2.63, t (5.1) 6.62, d (8), 7.58, d (8) 1.8, s - - -
29 3.67-3.85, m 2.95, s(br) 6.77, d (8), 7.59, d (8) 1.94, s(br) 7.01-7.37, m - -
30 3.71-3.90, m 2.94-3.05, m 6.66, d (8), 7.55, d (8) 1.56, s(br) 6.75-7.51, m - -
31 3.70, t (4) 2.90, t (4) 6.61, d (8), 7.51, d (8) 2.73, s 7.01-7.35, m 2.28, s -
32 3.74, t (4) 2.95, t (4) 6.64, d (8), 7.45, d (8) 1.59, s 6.96-7.19, m 2.31, s -
33 3.72, t (4) 2.93, t (4) 6.65, d (8), 7.66, d (8) 1.67, s 7.24-7.47, m - 1.93-1.98, m(br
-CH2 (2, 2′) -CH
2( 3, 3′) -CH (b-c) -OCH
3 -CH
3
L-8 4.26, t (4) 3.64, t (4) - - - -
34 3.60-3.78, m 3.60-3.78, m 6.89-7.57, m - 2.32, s -
35 3.71-3.78, m 3.71-3.78, m 6.59-7.33, m 1.68, s - -
“J” values (Hz) are given in brackets, s: singlet, t: triplet, m: multiplet, br: broad
Where X = F (29), Cl (30), CH3 (31, 32, 34), OCH3 (35)
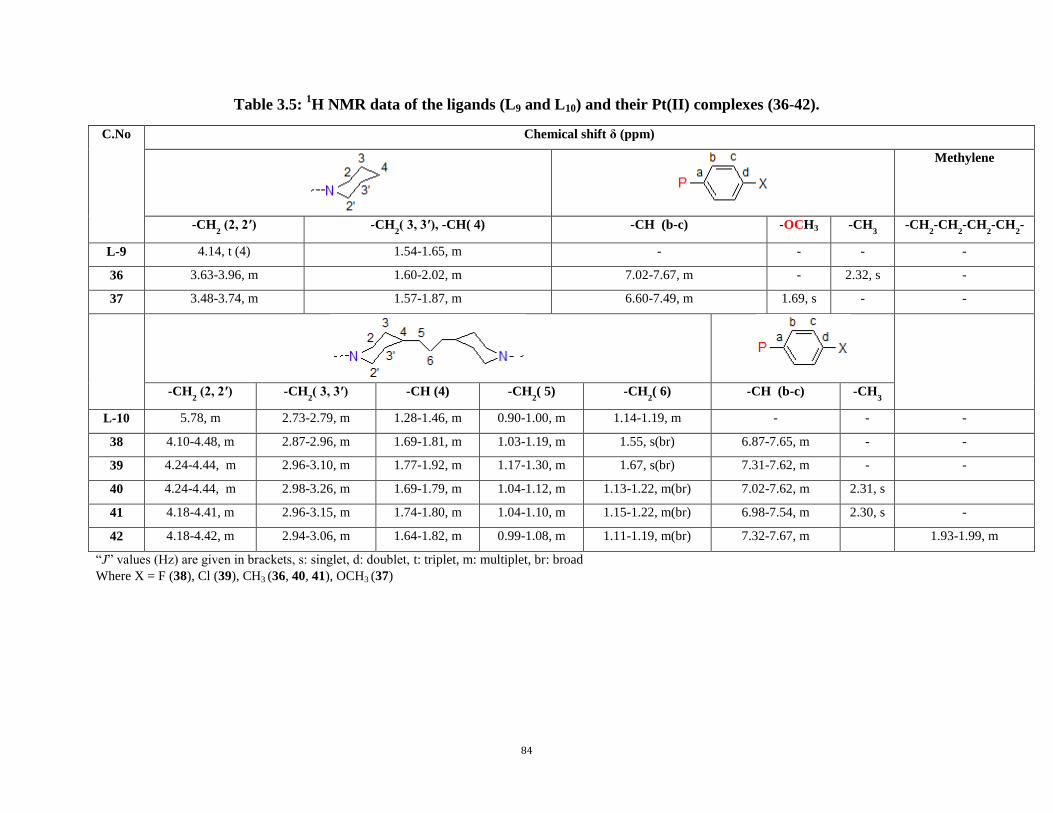
84
Table 3.5: 1H NMR data of the ligands (L9 and L10) and their Pt(II) complexes (36-42).
C.No Chemical shift δ (ppm)
Methylene
-CH2 (2, 2′) -CH
2( 3, 3′), -CH( 4) -CH (b-c) -OCH3 -CH
3 -CH
2-CH
2-CH
2-CH
2-
L-9 4.14, t (4) 1.54-1.65, m - - - -
36 3.63-3.96, m 1.60-2.02, m 7.02-7.67, m - 2.32, s -
37 3.48-3.74, m 1.57-1.87, m 6.60-7.49, m 1.69, s - -
-CH2 (2, 2′) -CH
2( 3, 3′) -CH (4) -CH
2( 5) -CH
2( 6) -CH (b-c) -CH
3
L-10 5.78, m 2.73-2.79, m 1.28-1.46, m 0.90-1.00, m 1.14-1.19, m - - -
38 4.10-4.48, m 2.87-2.96, m 1.69-1.81, m 1.03-1.19, m 1.55, s(br) 6.87-7.65, m - -
39 4.24-4.44, m 2.96-3.10, m 1.77-1.92, m 1.17-1.30, m 1.67, s(br) 7.31-7.62, m - -
40 4.24-4.44, m 2.98-3.26, m 1.69-1.79, m 1.04-1.12, m 1.13-1.22, m(br) 7.02-7.62, m 2.31, s
41 4.18-4.41, m 2.96-3.15, m 1.74-1.80, m 1.04-1.10, m 1.15-1.22, m(br) 6.98-7.54, m 2.30, s -
42 4.18-4.42, m 2.94-3.06, m 1.64-1.82, m 0.99-1.08, m 1.11-1.19, m(br) 7.32-7.67, m 1.93-1.99, m
“J” values (Hz) are given in brackets, s: singlet, d: doublet, t: triplet, m: multiplet, br: broad
Where X = F (38), Cl (39), CH3 (36, 40, 41), OCH3 (37)
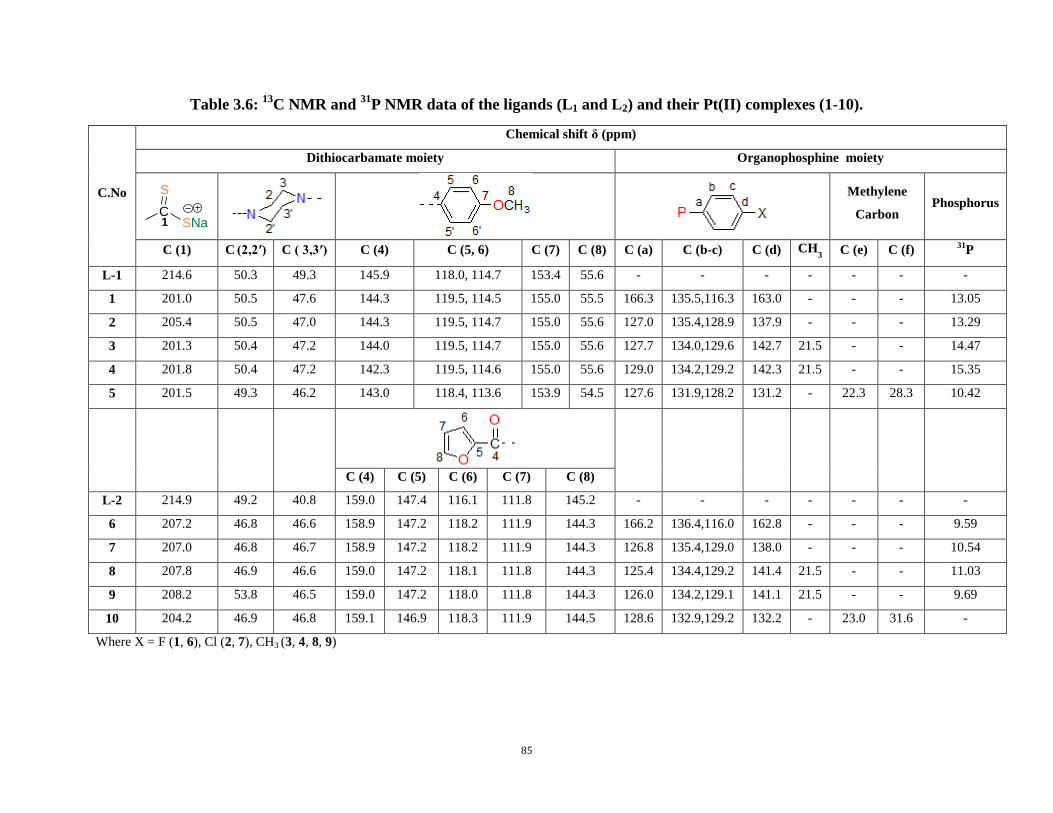
85
Table 3.6: 13
C NMR and 31
P NMR data of the ligands (L1 and L2) and their Pt(II) complexes (1-10).
C.No
Chemical shift δ (ppm)
Dithiocarbamate moiety Organophosphine moiety
Methylene
Carbon Phosphorus
C (1) C (2,2′) C ( 3,3′) C (4) C (5, 6) C (7) C (8) C (a) C (b-c) C (d) CH
3 C (e) C (f)
31P
L-1 214.6 50.3 49.3 145.9 118.0, 114.7 153.4 55.6 - - - - - - -
1 201.0 50.5 47.6 144.3 119.5, 114.5 155.0 55.5 166.3 135.5,116.3 163.0 - - - 13.05
2 205.4 50.5 47.0 144.3 119.5, 114.7 155.0 55.6 127.0 135.4,128.9 137.9 - - - 13.29
3 201.3 50.4 47.2 144.0 119.5, 114.7 155.0 55.6 127.7 134.0,129.6 142.7 21.5 - - 14.47
4 201.8 50.4 47.2 142.3 119.5, 114.6 155.0 55.6 129.0 134.2,129.2 142.3 21.5 - - 15.35
5 201.5 49.3 46.2 143.0 118.4, 113.6 153.9 54.5 127.6 131.9,128.2 131.2 - 22.3 28.3 10.42
C (4) C (5) C (6) C (7) C (8)
L-2 214.9 49.2 40.8 159.0 147.4 116.1 111.8 145.2 - - - - - - -
6 207.2 46.8 46.6 158.9 147.2 118.2 111.9 144.3 166.2 136.4,116.0 162.8 - - - 9.59
7 207.0 46.8 46.7 158.9 147.2 118.2 111.9 144.3 126.8 135.4,129.0 138.0 - - - 10.54
8 207.8 46.9 46.6 159.0 147.2 118.1 111.8 144.3 125.4 134.4,129.2 141.4 21.5 - - 11.03
9 208.2 53.8 46.5 159.0 147.2 118.0 111.8 144.3 126.0 134.2,129.1 141.1 21.5 - - 9.69
10 204.2 46.9 46.8 159.1 146.9 118.3 111.9 144.5 128.6 132.9,129.2 132.2 - 23.0 31.6 -
Where X = F (1, 6), Cl (2, 7), CH3 (3, 4, 8, 9)
C
S
SNa1
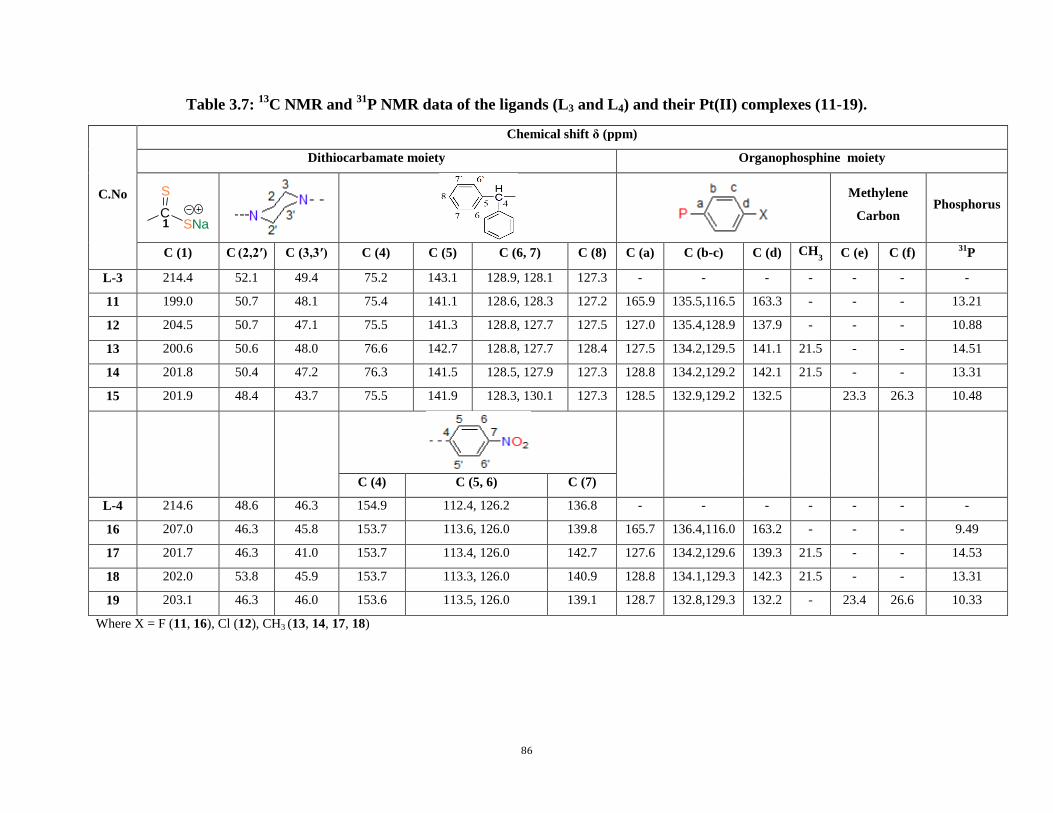
86
Table 3.7: 13
C NMR and 31
P NMR data of the ligands (L3 and L4) and their Pt(II) complexes (11-19).
C.No
Chemical shift δ (ppm)
Dithiocarbamate moiety Organophosphine moiety
Methylene
Carbon Phosphorus
C (1) C (2,2′) C (3,3′) C (4) C (5) C (6, 7) C (8) C (a) C (b-c) C (d) CH
3 C (e) C (f)
31P
L-3 214.4 52.1 49.4 75.2 143.1 128.9, 128.1 127.3 - - - - - - -
11 199.0 50.7 48.1 75.4 141.1 128.6, 128.3 127.2 165.9 135.5,116.5 163.3 - - - 13.21
12 204.5 50.7 47.1 75.5 141.3 128.8, 127.7 127.5 127.0 135.4,128.9 137.9 - - - 10.88
13 200.6 50.6 48.0 76.6 142.7 128.8, 127.7 128.4 127.5 134.2,129.5 141.1 21.5 - - 14.51
14 201.8 50.4 47.2 76.3 141.5 128.5, 127.9 127.3 128.8 134.2,129.2 142.1 21.5 - - 13.31
15 201.9 48.4 43.7 75.5 141.9 128.3, 130.1 127.3 128.5 132.9,129.2 132.5
23.3 26.3 10.48
C (4) C (5, 6) C (7)
L-4 214.6 48.6 46.3 154.9 112.4, 126.2 136.8 - - - - - - -
16 207.0 46.3 45.8 153.7 113.6, 126.0 139.8 165.7 136.4,116.0 163.2 - - - 9.49
17 201.7 46.3 41.0 153.7 113.4, 126.0 142.7 127.6 134.2,129.6 139.3 21.5 - - 14.53
18 202.0 53.8 45.9 153.7 113.3, 126.0 140.9 128.8 134.1,129.3 142.3 21.5 - - 13.31
19 203.1 46.3 46.0 153.6 113.5, 126.0 139.1 128.7 132.8,129.3 132.2 - 23.4 26.6 10.33
Where X = F (11, 16), Cl (12), CH3 (13, 14, 17, 18)
C
S
SNa1
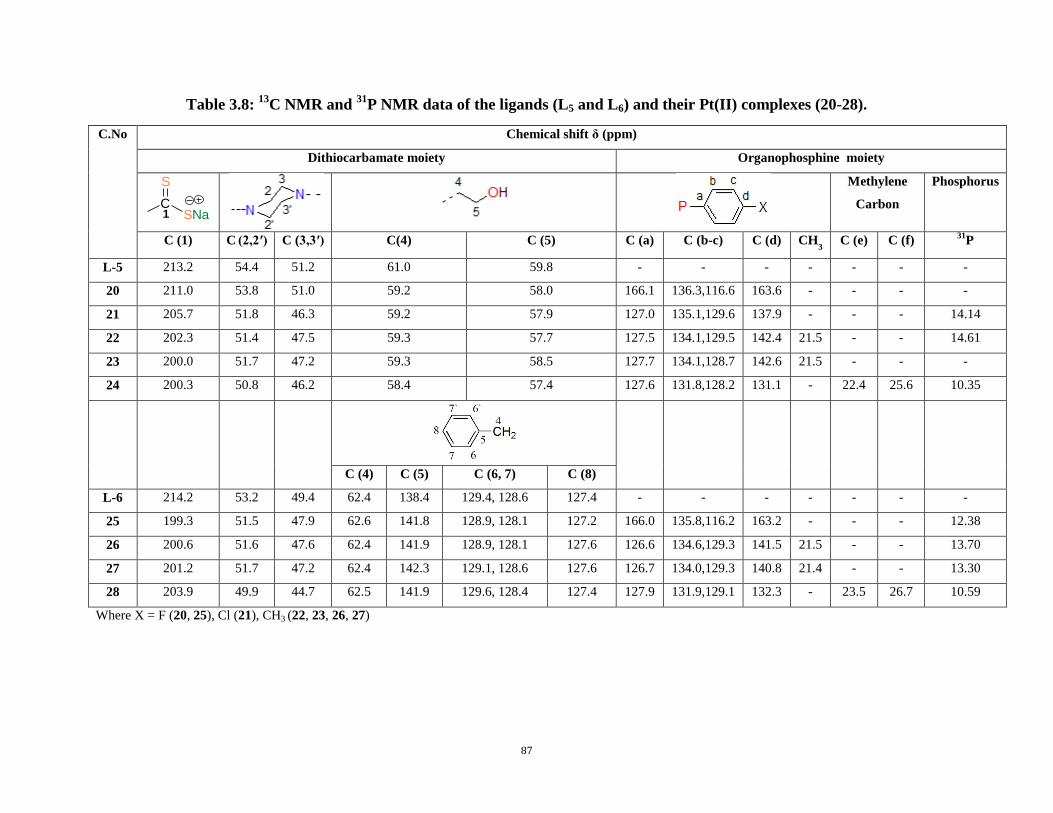
87
Table 3.8: 13
C NMR and 31
P NMR data of the ligands (L5 and L6) and their Pt(II) complexes (20-28).
C.No Chemical shift δ (ppm)
Dithiocarbamate moiety Organophosphine moiety
Methylene
Carbon
Phosphorus
C (1) C (2,2′) C (3,3′) C(4) C (5) C (a) C (b-c) C (d) CH
3 C (e) C (f)
31P
L-5 213.2 54.4 51.2 61.0 59.8 - - - - - - -
20 211.0 53.8 51.0 59.2 58.0 166.1 136.3,116.6 163.6 - - - -
21 205.7 51.8 46.3 59.2 57.9 127.0 135.1,129.6 137.9 - - - 14.14
22 202.3 51.4 47.5 59.3 57.7 127.5 134.1,129.5 142.4 21.5 - - 14.61
23 200.0 51.7 47.2 59.3 58.5 127.7 134.1,128.7 142.6 21.5 - - -
24 200.3 50.8 46.2 58.4 57.4 127.6 131.8,128.2 131.1 - 22.4 25.6 10.35
C (4) C (5) C (6, 7) C (8)
L-6 214.2 53.2 49.4 62.4 138.4 129.4, 128.6 127.4 - - - - - - -
25 199.3 51.5 47.9 62.6 141.8 128.9, 128.1 127.2 166.0 135.8,116.2 163.2 - - - 12.38
26 200.6 51.6 47.6 62.4 141.9 128.9, 128.1 127.6 126.6 134.6,129.3 141.5 21.5 - - 13.70
27 201.2 51.7 47.2 62.4 142.3 129.1, 128.6 127.6 126.7 134.0,129.3 140.8 21.4 - - 13.30
28 203.9 49.9 44.7 62.5 141.9 129.6, 128.4 127.4 127.9 131.9,129.1 132.3 - 23.5 26.7 10.59
Where X = F (20, 25), Cl (21), CH3 (22, 23, 26, 27)
C
S
SNa1
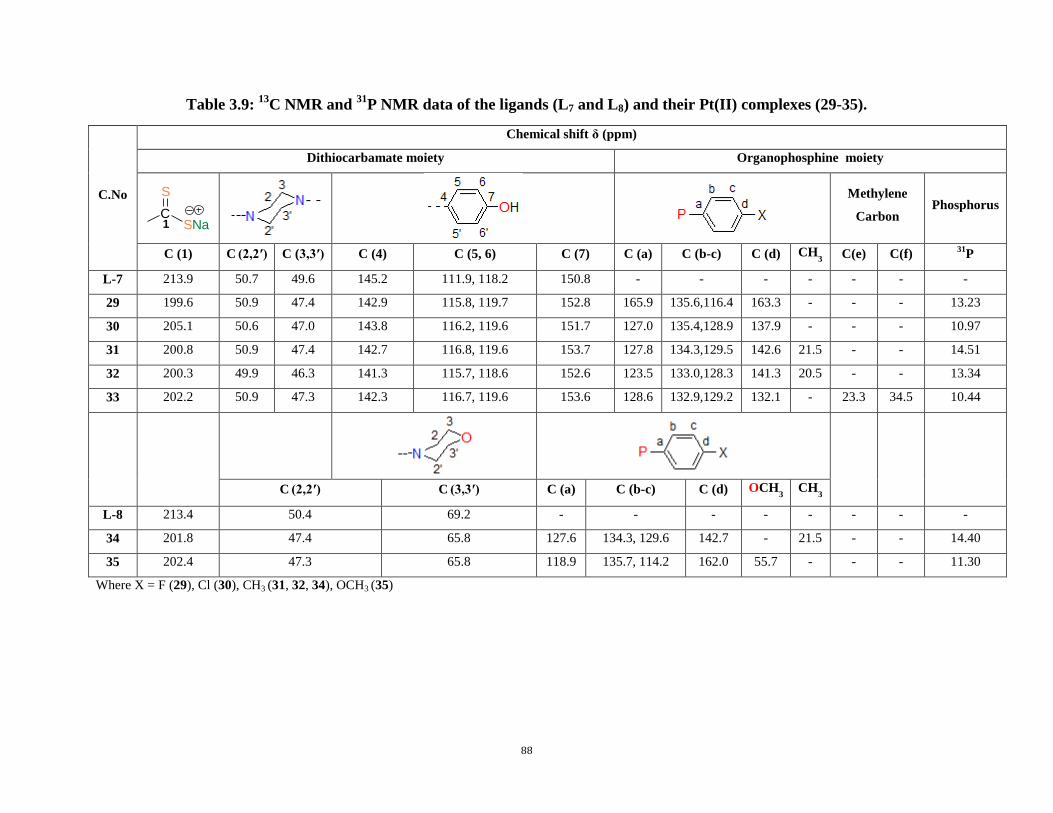
88
Table 3.9: 13
C NMR and 31
P NMR data of the ligands (L7 and L8) and their Pt(II) complexes (29-35).
C.No
Chemical shift δ (ppm)
Dithiocarbamate moiety Organophosphine moiety
Methylene
Carbon Phosphorus
C (1) C (2,2′) C (3,3′) C (4) C (5, 6) C (7) C (a) C (b-c) C (d) CH
3 C(e) C(f)
31P
L-7 213.9 50.7 49.6 145.2 111.9, 118.2 150.8 - - - - - - -
29 199.6 50.9 47.4 142.9 115.8, 119.7 152.8 165.9 135.6,116.4 163.3 - - - 13.23
30 205.1 50.6 47.0 143.8 116.2, 119.6 151.7 127.0 135.4,128.9 137.9 - - - 10.97
31 200.8 50.9 47.4 142.7 116.8, 119.6 153.7 127.8 134.3,129.5 142.6 21.5 - - 14.51
32 200.3 49.9 46.3 141.3 115.7, 118.6 152.6 123.5 133.0,128.3 141.3 20.5 - - 13.34
33 202.2 50.9 47.3 142.3 116.7, 119.6 153.6 128.6 132.9,129.2 132.1 - 23.3 34.5 10.44
C (2,2′) C
(3,3′) C (a) C (b-c) C (d) OCH
3 CH
3
L-8 213.4 50.4 69.2 - - - - - - - -
34 201.8 47.4 65.8 127.6 134.3, 129.6 142.7 - 21.5 - - 14.40
35 202.4 47.3 65.8 118.9 135.7, 114.2 162.0 55.7 - - - 11.30
Where X = F (29), Cl (30), CH3 (31, 32, 34), OCH3 (35)
C
S
SNa1
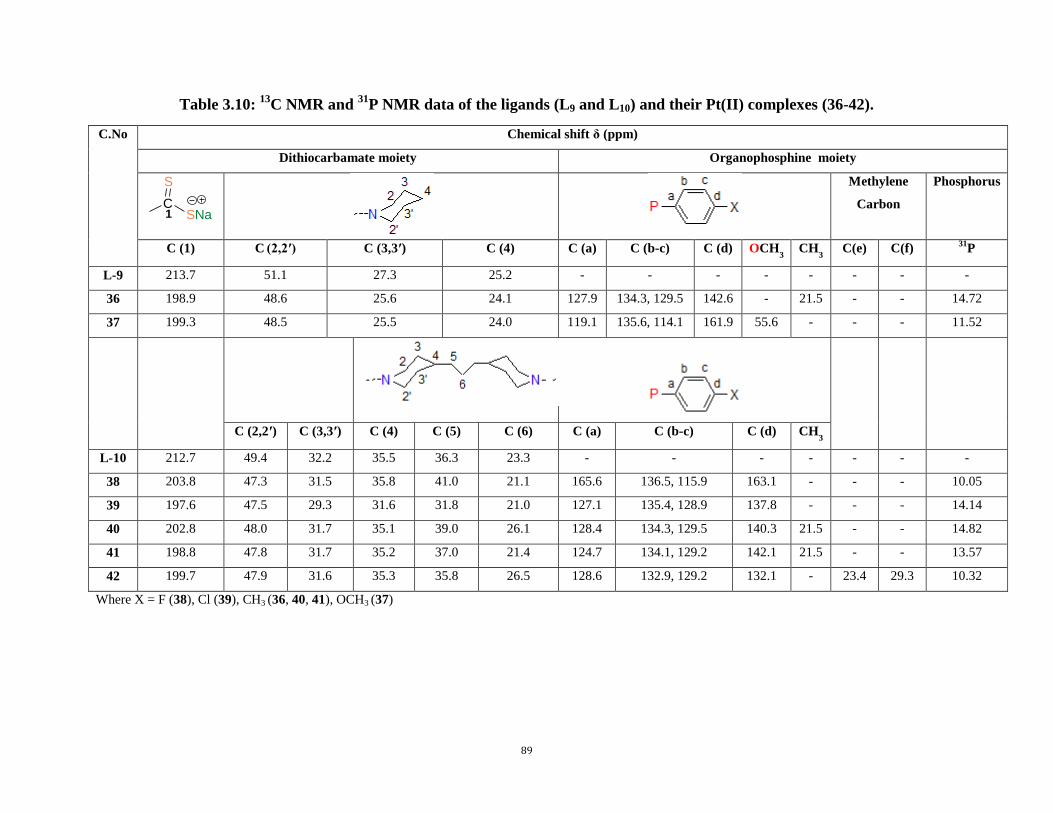
89
Table 3.10: 13
C NMR and 31
P NMR data of the ligands (L9 and L10) and their Pt(II) complexes (36-42).
C.No Chemical shift δ (ppm)
Dithiocarbamate moiety Organophosphine moiety
Methylene
Carbon
Phosphorus
C (1) C (2,2′) C (3,3ʹ) C (4) C (a) C (b-c) C (d) OCH
3 CH
3 C(e) C(f)
31P
L-9 213.7 51.1 27.3 25.2 - - - - - - - -
36 198.9 48.6 25.6 24.1 127.9 134.3, 129.5 142.6 - 21.5 - - 14.72
37 199.3 48.5 25.5 24.0 119.1 135.6, 114.1 161.9 55.6 - - - 11.52
C (2,2ʹ) C (3,3ʹ) C (4) C (5) C (6) C (a) C (b-c) C (d) CH3
L-10 212.7 49.4 32.2 35.5 36.3 23.3 - - - - - - -
38 203.8 47.3 31.5 35.8 41.0 21.1 165.6 136.5, 115.9 163.1 - - - 10.05
39 197.6 47.5 29.3 31.6 31.8 21.0 127.1 135.4, 128.9 137.8 - - - 14.14
40 202.8 48.0 31.7 35.1 39.0 26.1 128.4 134.3, 129.5 140.3 21.5 - - 14.82
41 198.8 47.8 31.7 35.2 37.0 21.4 124.7 134.1, 129.2 142.1 21.5 - - 13.57
42 199.7 47.9 31.6 35.3 35.8 26.5 128.6 132.9, 129.2 132.1 - 23.4 29.3 10.32
Where X = F (38), Cl (39), CH3 (36, 40, 41), OCH3 (37)
C
S
SNa1
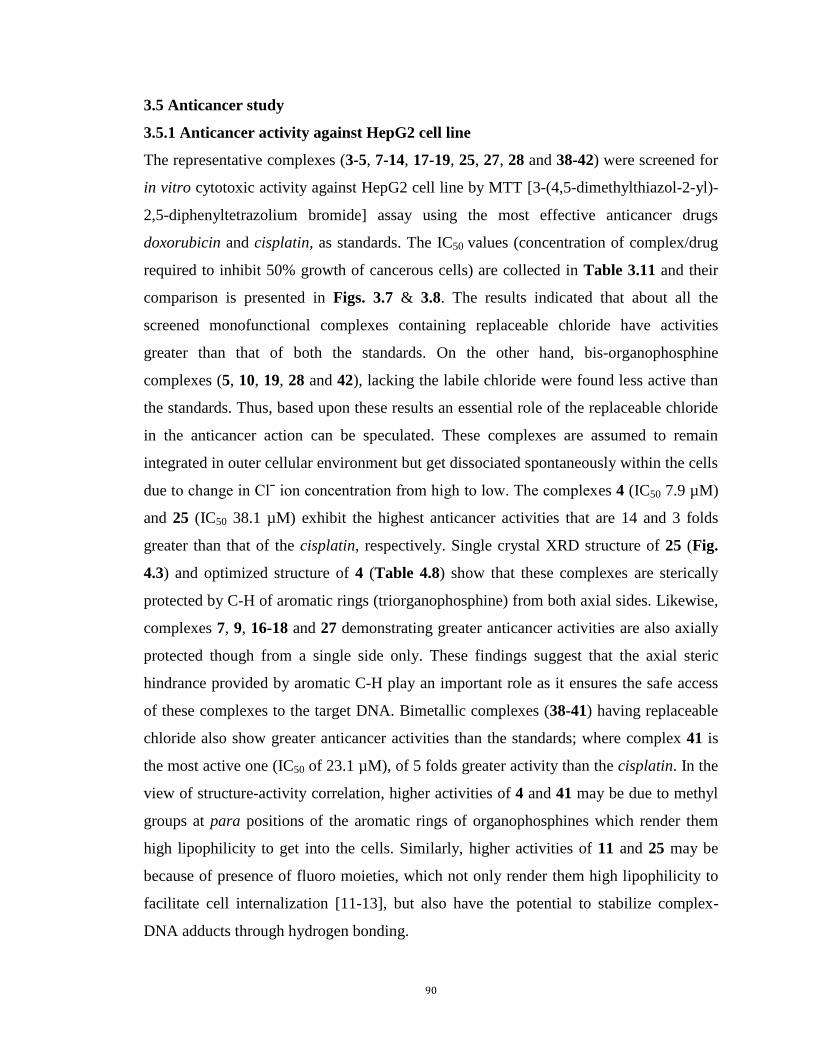
90
3.5 Anticancer study
3.5.1 Anticancer activity against HepG2 cell line
The representative complexes (3-5, 7-14, 17-19, 25, 27, 28 and 38-42) were screened for
in vitro cytotoxic activity against HepG2 cell line by MTT [3-(4,5-dimethylthiazol-2-yl)-
2,5-diphenyltetrazolium bromide] assay using the most effective anticancer drugs
doxorubicin and cisplatin, as standards. The IC50 values (concentration of complex/drug
required to inhibit 50% growth of cancerous cells) are collected in Table 3.11 and their
comparison is presented in Figs. 3.7 & 3.8. The results indicated that about all the
screened monofunctional complexes containing replaceable chloride have activities
greater than that of both the standards. On the other hand, bis-organophosphine
complexes (5, 10, 19, 28 and 42), lacking the labile chloride were found less active than
the standards. Thus, based upon these results an essential role of the replaceable chloride
in the anticancer action can be speculated. These complexes are assumed to remain
integrated in outer cellular environment but get dissociated spontaneously within the cells
due to change in Clˉ ion concentration from high to low. The complexes 4 (IC50 7.9 µM)
and 25 (IC50 38.1 µM) exhibit the highest anticancer activities that are 14 and 3 folds
greater than that of the cisplatin, respectively. Single crystal XRD structure of 25 (Fig.
4.3) and optimized structure of 4 (Table 4.8) show that these complexes are sterically
protected by C-H of aromatic rings (triorganophosphine) from both axial sides. Likewise,
complexes 7, 9, 16-18 and 27 demonstrating greater anticancer activities are also axially
protected though from a single side only. These findings suggest that the axial steric
hindrance provided by aromatic C-H play an important role as it ensures the safe access
of these complexes to the target DNA. Bimetallic complexes (38-41) having replaceable
chloride also show greater anticancer activities than the standards; where complex 41 is
the most active one (IC50 of 23.1 µM), of 5 folds greater activity than the cisplatin. In the
view of structure-activity correlation, higher activities of 4 and 41 may be due to methyl
groups at para positions of the aromatic rings of organophosphines which render them
high lipophilicity to get into the cells. Similarly, higher activities of 11 and 25 may be
because of presence of fluoro moieties, which not only render them high lipophilicity to
facilitate cell internalization [11-13], but also have the potential to stabilize complex-
DNA adducts through hydrogen bonding.
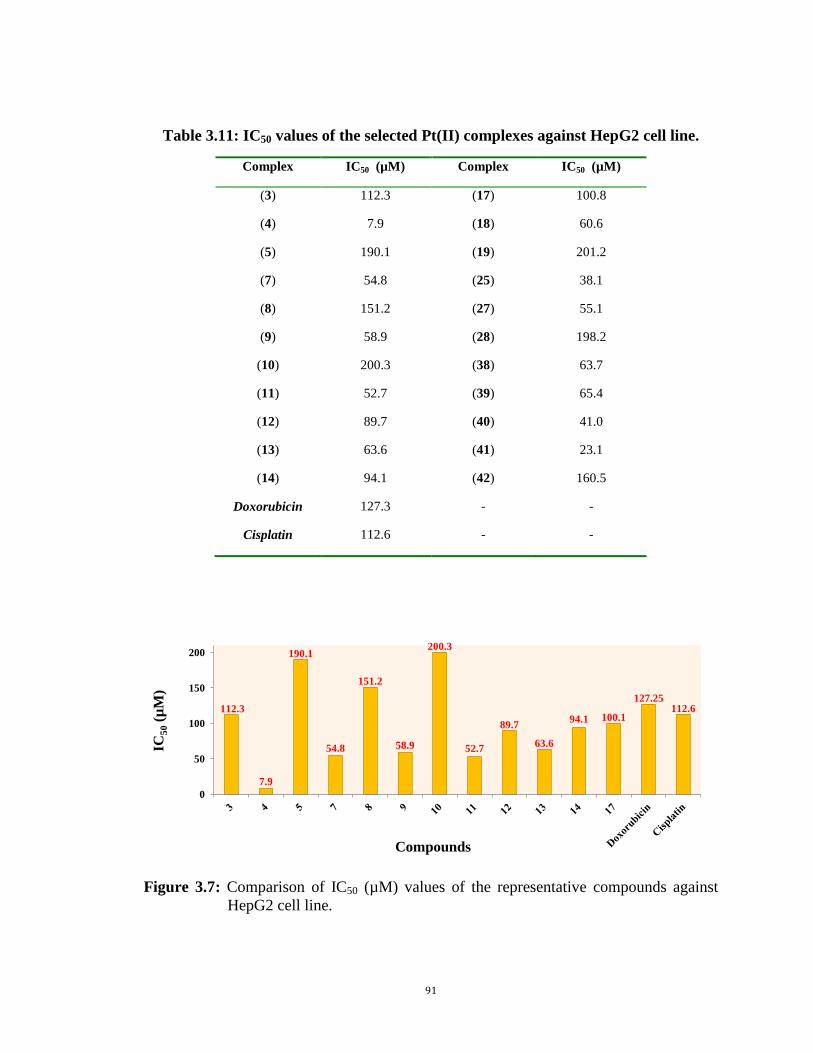
91
Table 3.11: IC50 values of the selected Pt(II) complexes against HepG2 cell line.
Complex IC50 (µM) Complex IC50 (µM)
(3) 112.3 (17) 100.8
(4) 7.9 (18) 60.6
(5) 190.1 (19) 201.2
(7) 54.8 (25) 38.1
(8) 151.2 (27) 55.1
(9) 58.9 (28) 198.2
(10) 200.3 (38) 63.7
(11) 52.7 (39) 65.4
(12) 89.7 (40) 41.0
(13) 63.6 (41) 23.1
(14) 94.1 (42) 160.5
Doxorubicin 127.3 - -
Cisplatin 112.6 - -
Figure 3.7: Comparison of IC50 (µM) values of the representative compounds against
HepG2 cell line.
112.3
7.9
190.1
54.8
151.2
58.9
200.3
52.7
89.7
63.6
94.1 100.1
127.25 112.6
0
50
100
150
200
Compounds
IC5
0 (
µM
)
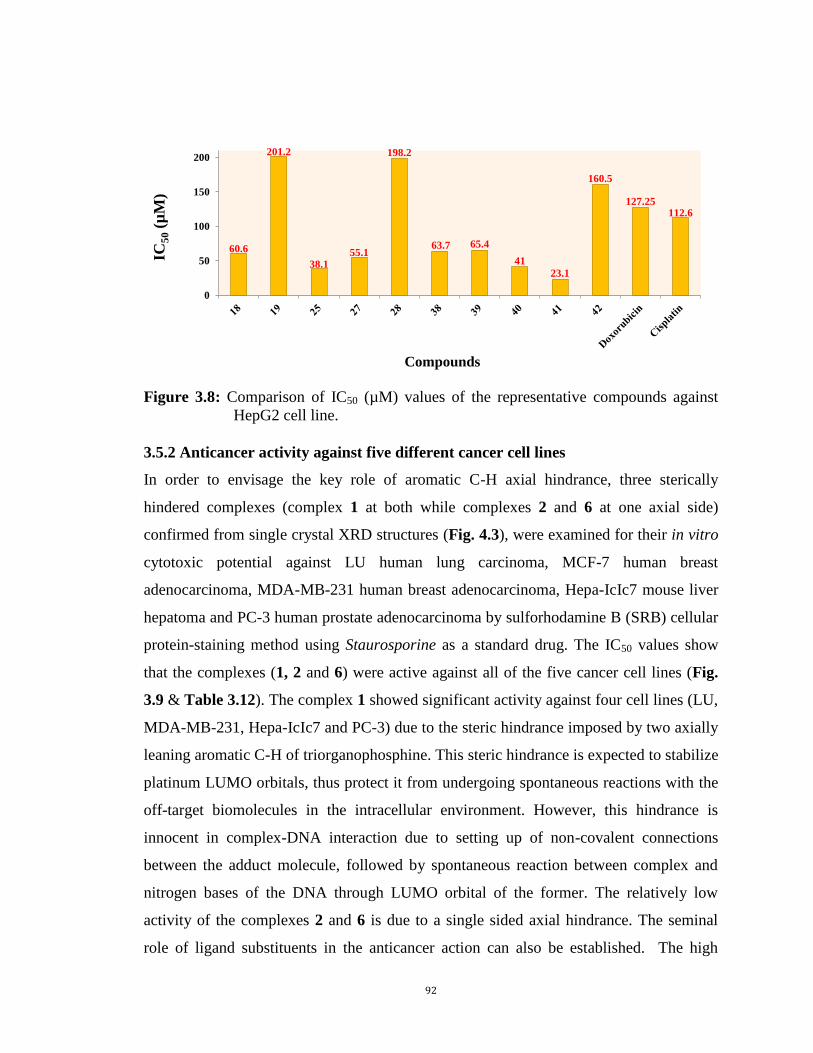
92
Figure 3.8: Comparison of IC50 (µM) values of the representative compounds against
HepG2 cell line.
3.5.2 Anticancer activity against five different cancer cell lines
In order to envisage the key role of aromatic C-H axial hindrance, three sterically
hindered complexes (complex 1 at both while complexes 2 and 6 at one axial side)
confirmed from single crystal XRD structures (Fig. 4.3), were examined for their in vitro
cytotoxic potential against LU human lung carcinoma, MCF-7 human breast
adenocarcinoma, MDA-MB-231 human breast adenocarcinoma, Hepa-IcIc7 mouse liver
hepatoma and PC-3 human prostate adenocarcinoma by sulforhodamine B (SRB) cellular
protein-staining method using Staurosporine as a standard drug. The IC50 values show
that the complexes (1, 2 and 6) were active against all of the five cancer cell lines (Fig.
3.9 & Table 3.12). The complex 1 showed significant activity against four cell lines (LU,
MDA-MB-231, Hepa-IcIc7 and PC-3) due to the steric hindrance imposed by two axially
leaning aromatic C-H of triorganophosphine. This steric hindrance is expected to stabilize
platinum LUMO orbitals, thus protect it from undergoing spontaneous reactions with the
off-target biomolecules in the intracellular environment. However, this hindrance is
innocent in complex-DNA interaction due to setting up of non-covalent connections
between the adduct molecule, followed by spontaneous reaction between complex and
nitrogen bases of the DNA through LUMO orbital of the former. The relatively low
activity of the complexes 2 and 6 is due to a single sided axial hindrance. The seminal
role of ligand substituents in the anticancer action can also be established. The high
60.6
201.2
38.1 55.1
198.2
63.7 65.4
41
23.1
160.5
127.25 112.6
0
50
100
150
200
Compounds
IC5
0 (
µM
)
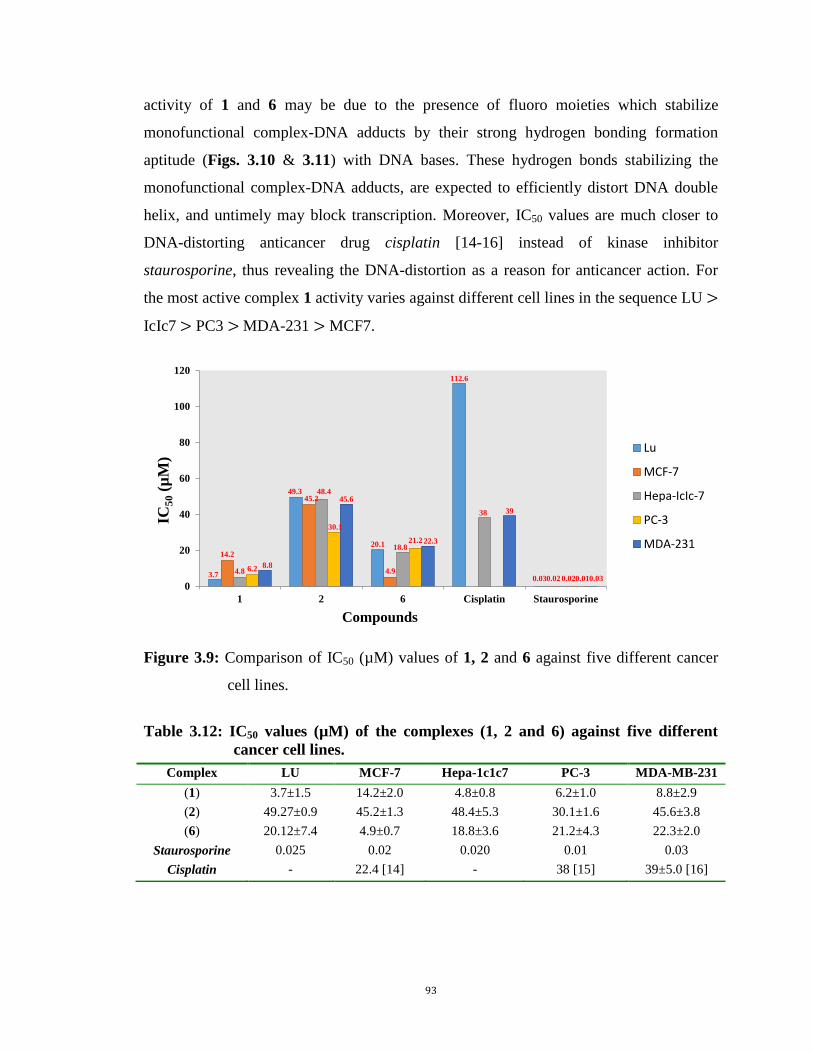
93
activity of 1 and 6 may be due to the presence of fluoro moieties which stabilize
monofunctional complex-DNA adducts by their strong hydrogen bonding formation
aptitude (Figs. 3.10 & 3.11) with DNA bases. These hydrogen bonds stabilizing the
monofunctional complex-DNA adducts, are expected to efficiently distort DNA double
helix, and untimely may block transcription. Moreover, IC50 values are much closer to
DNA-distorting anticancer drug cisplatin [14-16] instead of kinase inhibitor
staurosporine, thus revealing the DNA-distortion as a reason for anticancer action. For
the most active complex 1 activity varies against different cell lines in the sequence LU
IcIc7 PC3 MDA-231 MCF7.
Figure 3.9: Comparison of IC50 (µM) values of 1, 2 and 6 against five different cancer
cell lines.
Table 3.12: IC50 values (µM) of the complexes (1, 2 and 6) against five different
cancer cell lines.
3.7
49.3
20.1
112.6
0.03
14.2
45.2
4.9 0.02
4.8
48.4
18.8
38
0.02
6.2
30.1
21.2
0.01
8.8
45.6
22.3
39
0.03 0
20
40
60
80
100
120
1 2 6 Cisplatin Staurosporine
Lu
MCF-7
Hepa-IcIc-7
PC-3
MDA-231
IC5
0 (
µM
)
Compounds
Complex LU MCF-7 Hepa-1c1c7 PC-3 MDA-MB-231
(1) 3.7±1.5 14.2±2.0 4.8±0.8 6.2±1.0 8.8±2.9
(2) 49.27±0.9 45.2±1.3 48.4±5.3 30.1±1.6 45.6±3.8
(6) 20.12±7.4 4.9±0.7 18.8±3.6 21.2±4.3 22.3±2.0
Staurosporine 0.025 0.02 0.020 0.01 0.03
Cisplatin - 22.4 [14] - 38 [15] 39±5.0 [16]
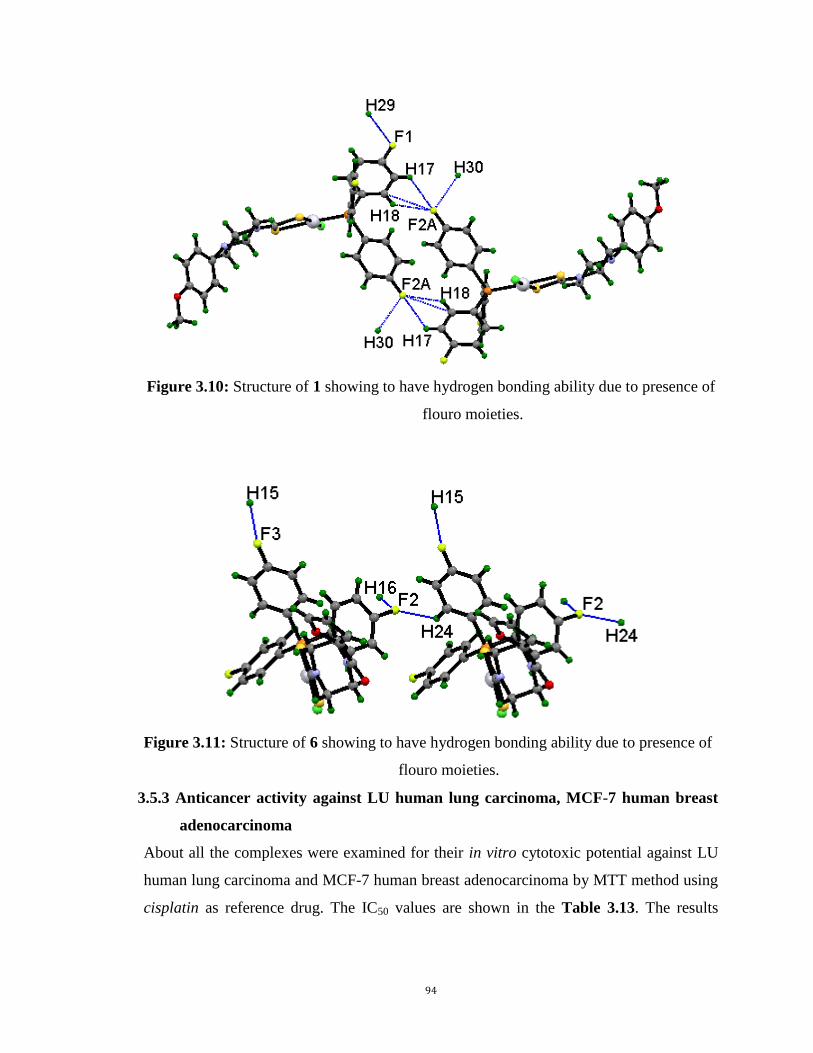
94
Figure 3.10: Structure of 1 showing to have hydrogen bonding ability due to presence of
flouro moieties.
Figure 3.11: Structure of 6 showing to have hydrogen bonding ability due to presence of
flouro moieties.
3.5.3 Anticancer activity against LU human lung carcinoma, MCF-7 human breast
adenocarcinoma
About all the complexes were examined for their in vitro cytotoxic potential against LU
human lung carcinoma and MCF-7 human breast adenocarcinoma by MTT method using
cisplatin as reference drug. The IC50 values are shown in the Table 3.13. The results
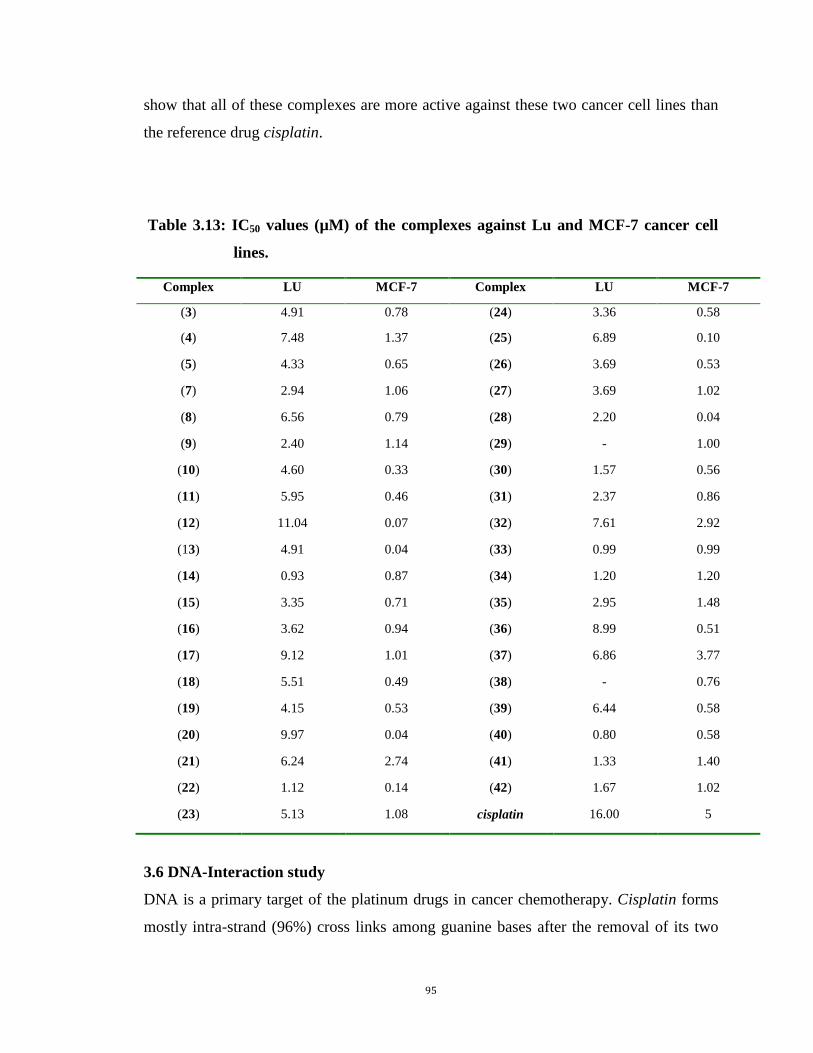
95
show that all of these complexes are more active against these two cancer cell lines than
the reference drug cisplatin.
Table 3.13: IC50 values (µM) of the complexes against Lu and MCF-7 cancer cell
lines.
3.6 DNA-Interaction study
DNA is a primary target of the platinum drugs in cancer chemotherapy. Cisplatin forms
mostly intra-strand (96%) cross links among guanine bases after the removal of its two
Complex LU MCF-7 Complex LU MCF-7
(3) 4.91 0.78 (24) 3.36 0.58
(4) 7.48 1.37 (25) 6.89 0.10
(5) 4.33 0.65 (26) 3.69 0.53
(7) 2.94 1.06 (27) 3.69 1.02
(8) 6.56 0.79 (28) 2.20 0.04
(9) 2.40 1.14 (29) - 1.00
(10) 4.60 0.33 (30) 1.57 0.56
(11) 5.95 0.46 (31) 2.37 0.86
(12) 11.04 0.07 (32) 7.61 2.92
(13) 4.91 0.04 (33) 0.99 0.99
(14) 0.93 0.87 (34) 1.20 1.20
(15) 3.35 0.71 (35) 2.95 1.48
(16) 3.62 0.94 (36) 8.99 0.51
(17) 9.12 1.01 (37) 6.86 3.77
(18) 5.51 0.49 (38) - 0.76
(19) 4.15 0.53 (39) 6.44 0.58
(20) 9.97 0.04 (40) 0.80 0.58
(21) 6.24 2.74 (41) 1.33 1.40
(22) 1.12 0.14 (42) 1.67 1.02
(23) 5.13 1.08 cisplatin 16.00 5
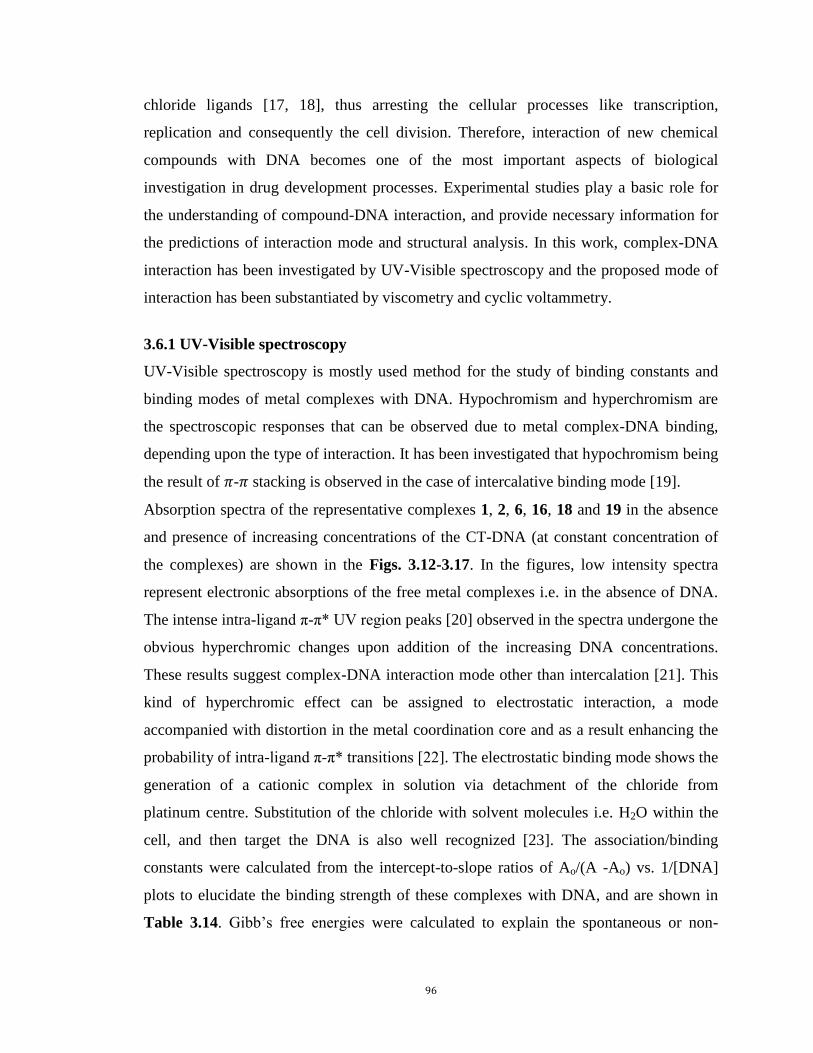
96
chloride ligands [17, 18], thus arresting the cellular processes like transcription,
replication and consequently the cell division. Therefore, interaction of new chemical
compounds with DNA becomes one of the most important aspects of biological
investigation in drug development processes. Experimental studies play a basic role for
the understanding of compound-DNA interaction, and provide necessary information for
the predictions of interaction mode and structural analysis. In this work, complex-DNA
interaction has been investigated by UV-Visible spectroscopy and the proposed mode of
interaction has been substantiated by viscometry and cyclic voltammetry.
3.6.1 UV-Visible spectroscopy
UV-Visible spectroscopy is mostly used method for the study of binding constants and
binding modes of metal complexes with DNA. Hypochromism and hyperchromism are
the spectroscopic responses that can be observed due to metal complex-DNA binding,
depending upon the type of interaction. It has been investigated that hypochromism being
the result of - stacking is observed in the case of intercalative binding mode [19].
Absorption spectra of the representative complexes 1, 2, 6, 16, 18 and 19 in the absence
and presence of increasing concentrations of the CT-DNA (at constant concentration of
the complexes) are shown in the Figs. 3.12-3.17. In the figures, low intensity spectra
represent electronic absorptions of the free metal complexes i.e. in the absence of DNA.
The intense intra-ligand π-π* UV region peaks [20] observed in the spectra undergone the
obvious hyperchromic changes upon addition of the increasing DNA concentrations.
These results suggest complex-DNA interaction mode other than intercalation [21]. This
kind of hyperchromic effect can be assigned to electrostatic interaction, a mode
accompanied with distortion in the metal coordination core and as a result enhancing the
probability of intra-ligand π-π* transitions [22]. The electrostatic binding mode shows the
generation of a cationic complex in solution via detachment of the chloride from
platinum centre. Substitution of the chloride with solvent molecules i.e. H2O within the
cell, and then target the DNA is also well recognized [23]. The association/binding
constants were calculated from the intercept-to-slope ratios of Ao/(A -Ao) vs. 1/[DNA]
plots to elucidate the binding strength of these complexes with DNA, and are shown in
Table 3.14. Gibb’s free energies were calculated to explain the spontaneous or non-
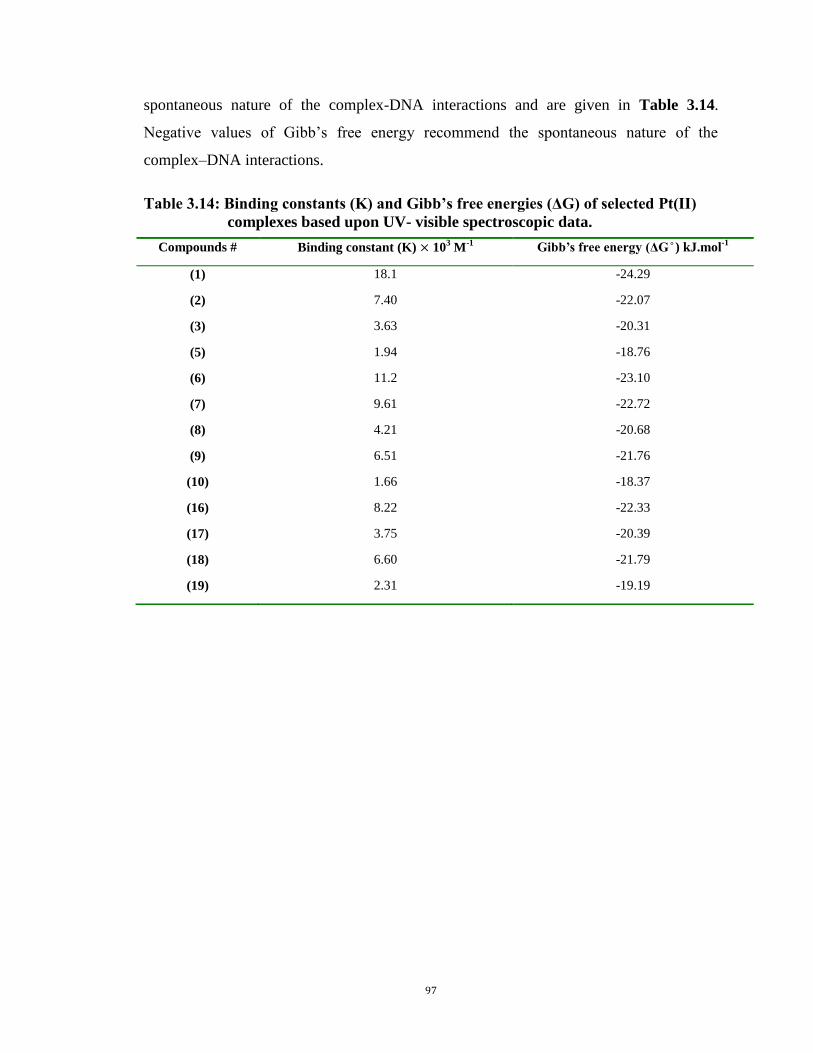
97
spontaneous nature of the complex-DNA interactions and are given in Table 3.14.
Negative values of Gibb’s free energy recommend the spontaneous nature of the
complex–DNA interactions.
Table 3.14: Binding constants (K) and Gibb’s free energies (ΔG) of selected Pt(II)
complexes based upon UV- visible spectroscopic data.
Compounds # Binding constant (K) 103 M
-1 Gibb’s free energ (ΔG ) kJ.mol
-1
(1) 18.1 -24.29
(2) 7.40 -22.07
(3) 3.63 -20.31
(5) 1.94 -18.76
(6) 11.2 -23.10
(7) 9.61 -22.72
(8) 4.21 -20.68
(9) 6.51 -21.76
(10) 1.66 -18.37
(16) 8.22 -22.33
(17) 3.75 -20.39
(18) 6.60 -21.79
(19) 2.31 -19.19
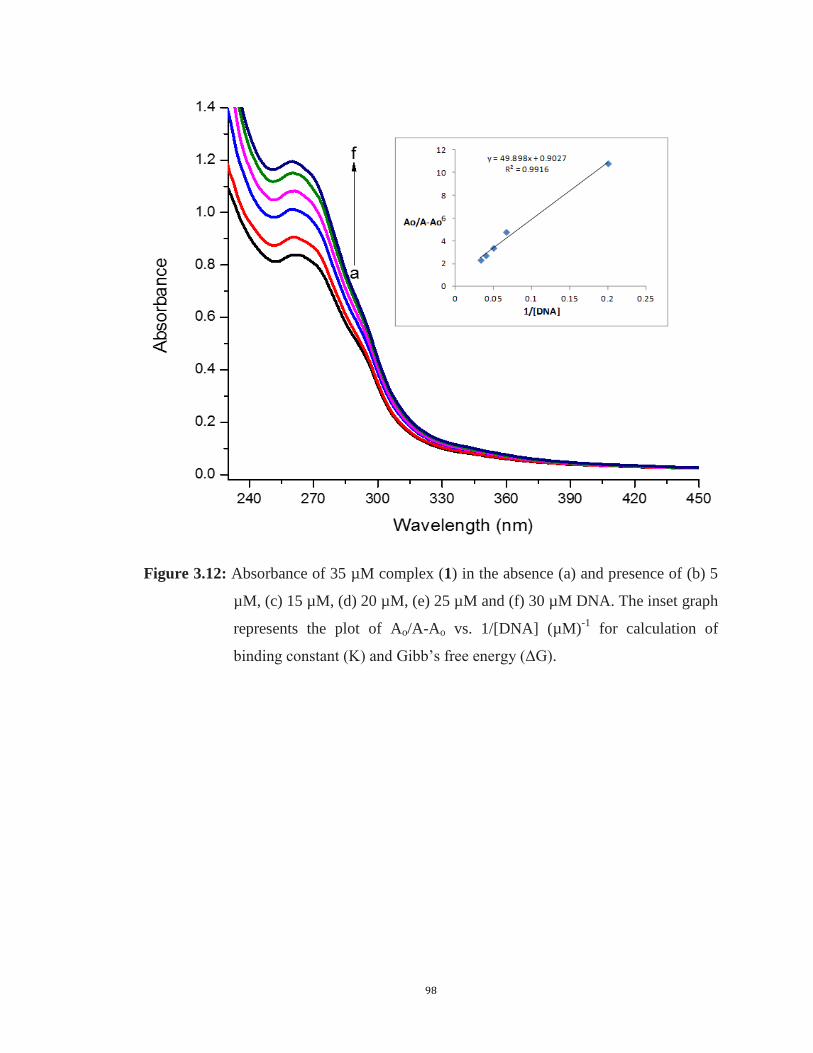
98
Figure 3.12: Absorbance of 35 µM complex (1) in the absence (a) and presence of (b) 5
µM, (c) 15 µM, (d) 20 µM, (e) 25 µM and (f) 30 µM DNA. The inset graph
represents the plot of Ao/A-Ao vs. 1/[DNA] (µM)-1
for calculation of
binding constant (K) and Gibb’s free energy (ΔG).
99
Figure 3.13: Absorbance of 25 µM complex (2) in the absence (a) and presence of (b) 5
µM, (c) 10 µM, (d) 15 µM, (e) 20 µM and (f) 25 µM DNA. The inset graph
represents the plot of Ao/A-Ao vs. 1/[DNA] (µM)-1
for calculation of
binding constant (K) and Gibb’s free energy (ΔG).
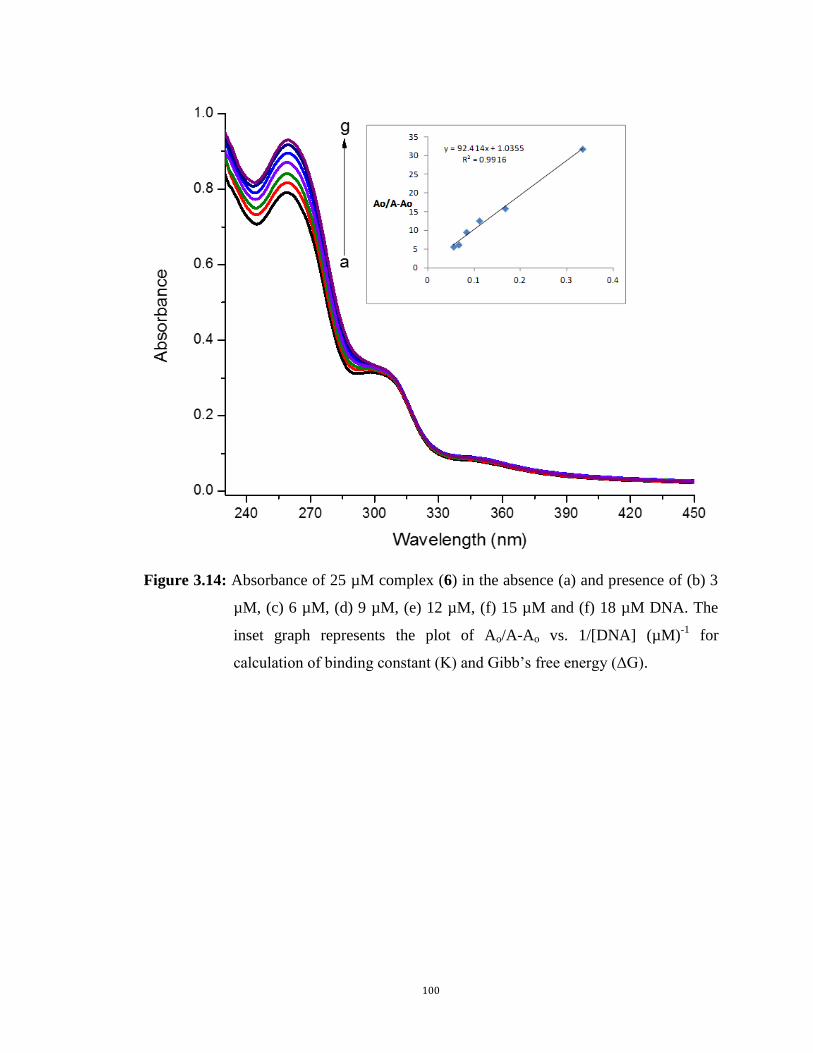
100
Figure 3.14: Absorbance of 25 µM complex (6) in the absence (a) and presence of (b) 3
µM, (c) 6 µM, (d) 9 µM, (e) 12 µM, (f) 15 µM and (f) 18 µM DNA. The
inset graph represents the plot of Ao/A-Ao vs. 1/[DNA] (µM)-1
for
calculation of binding constant (K) and Gibb’s free energy (ΔG).
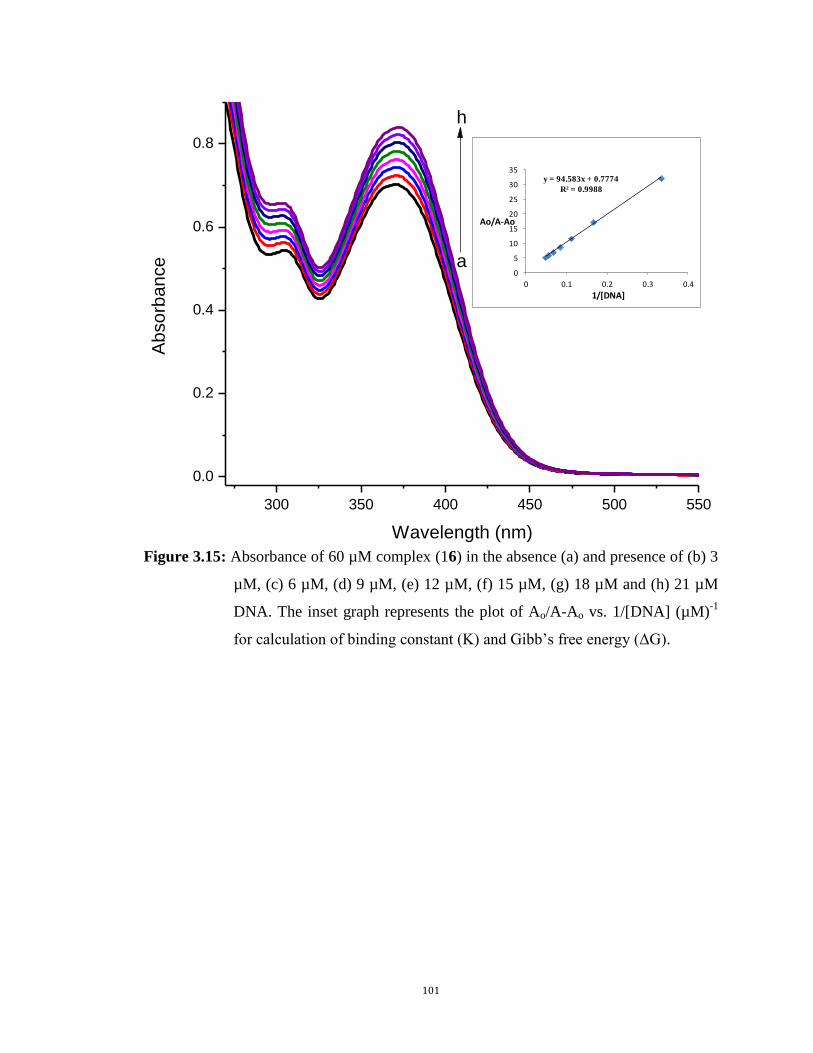
101
Figure 3.15: Absorbance of 60 µM complex (16) in the absence (a) and presence of (b) 3
µM, (c) 6 µM, (d) 9 µM, (e) 12 µM, (f) 15 µM, (g) 18 µM and (h) 21 µM
DNA. The inset graph represents the plot of Ao/A-Ao vs. 1/[DNA] (µM)-1
for calculation of binding constant (K) and Gibb’s free energy (ΔG).
300 350 400 450 500 550
0.0
0.2
0.4
0.6
0.8A
bso
rba
nce
Wavelength (nm)
a
h
y = 94.583x + 0.7774
R² = 0.9988
0
5
10
15
20
25
30
35
0 0.1 0.2 0.3 0.4
Ao/A-Ao
1/[DNA]
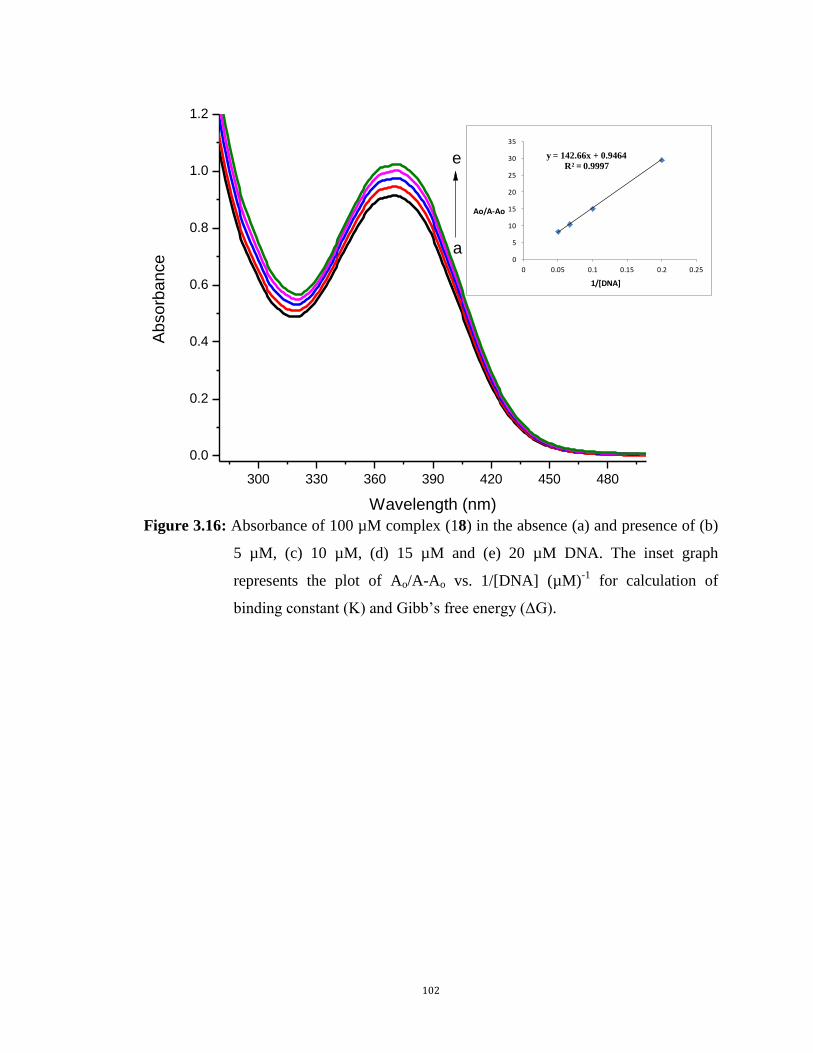
102
Figure 3.16: Absorbance of 100 µM complex (18) in the absence (a) and presence of (b)
5 µM, (c) 10 µM, (d) 15 µM and (e) 20 µM DNA. The inset graph
represents the plot of Ao/A-Ao vs. 1/[DNA] (µM)-1
for calculation of
binding constant (K) and Gibb’s free energy (ΔG).
300 330 360 390 420 450 480
0.0
0.2
0.4
0.6
0.8
1.0
1.2
Ab
so
rba
nce
Wavelength (nm)
a
e y = 142.66x + 0.9464
R² = 0.9997
0
5
10
15
20
25
30
35
0 0.05 0.1 0.15 0.2 0.25
Ao/A-Ao
1/[DNA]
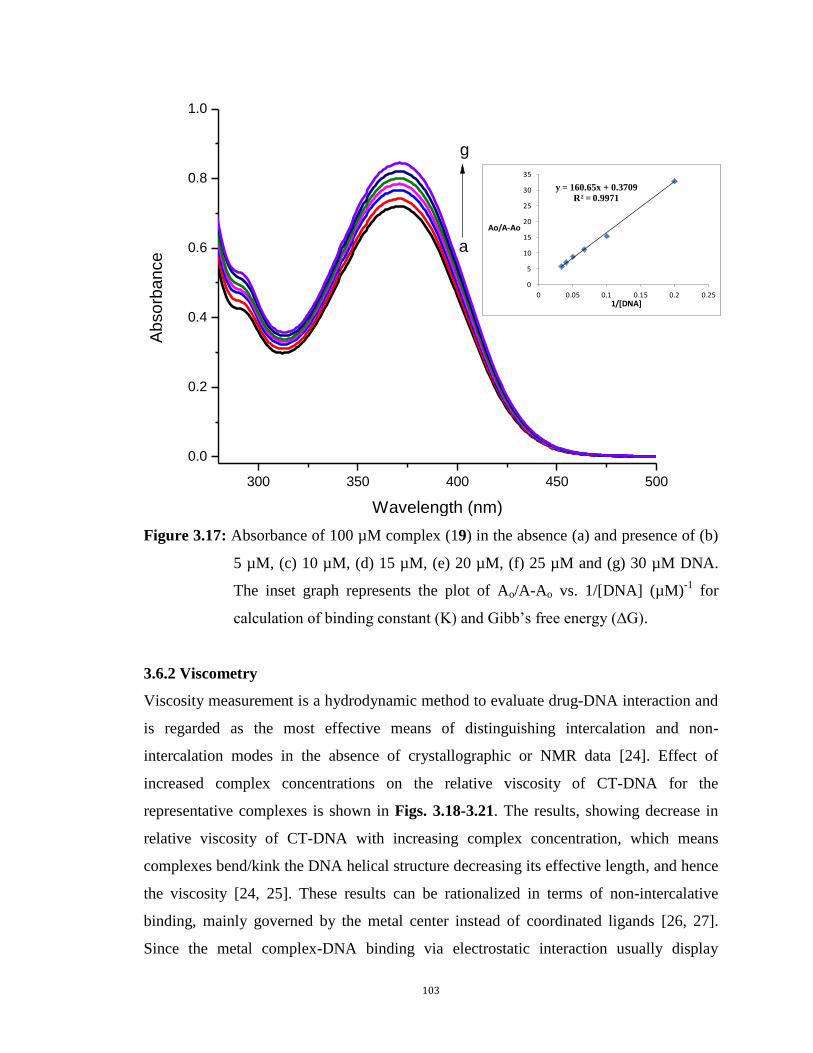
103
Figure 3.17: Absorbance of 100 µM complex (19) in the absence (a) and presence of (b)
5 µM, (c) 10 µM, (d) 15 µM, (e) 20 µM, (f) 25 µM and (g) 30 µM DNA.
The inset graph represents the plot of Ao/A-Ao vs. 1/[DNA] (µM)-1
for
calculation of binding constant (K) and Gibb’s free energy (ΔG).
3.6.2 Viscometry
Viscosity measurement is a hydrodynamic method to evaluate drug-DNA interaction and
is regarded as the most effective means of distinguishing intercalation and non-
intercalation modes in the absence of crystallographic or NMR data [24]. Effect of
increased complex concentrations on the relative viscosity of CT-DNA for the
representative complexes is shown in Figs. 3.18-3.21. The results, showing decrease in
relative viscosity of CT-DNA with increasing complex concentration, which means
complexes bend/kink the DNA helical structure decreasing its effective length, and hence
the viscosity [24, 25]. These results can be rationalized in terms of non-intercalative
binding, mainly governed by the metal center instead of coordinated ligands [26, 27].
Since the metal complex-DNA binding via electrostatic interaction usually display
300 350 400 450 500
0.0
0.2
0.4
0.6
0.8
1.0
Ab
so
rba
nce
Wavelength (nm)
a
g
y = 160.65x + 0.3709
R² = 0.9971
0
5
10
15
20
25
30
35
0 0.05 0.1 0.15 0.2 0.251/[DNA]
Ao/A-Ao
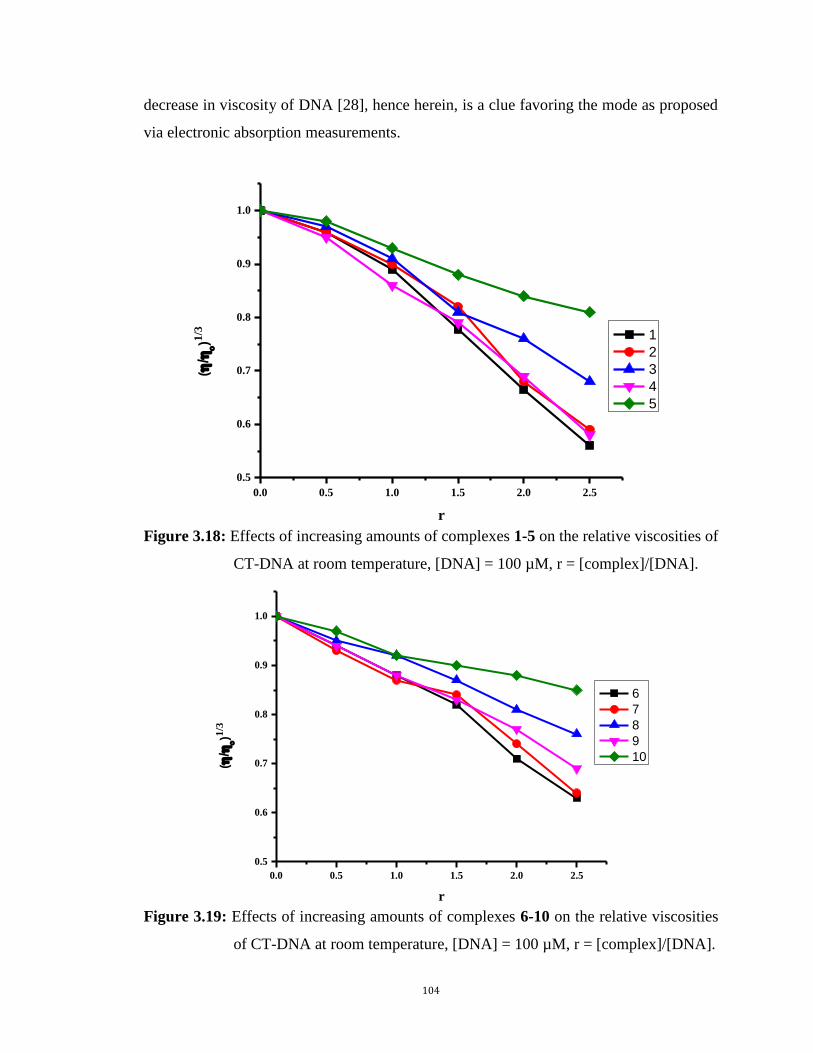
104
decrease in viscosity of DNA [28], hence herein, is a clue favoring the mode as proposed
via electronic absorption measurements.
0.0 0.5 1.0 1.5 2.0 2.5
0.5
0.6
0.7
0.8
0.9
1.0(
/)1
/3
r
1
2
3
4
5
Figure 3.18: Effects of increasing amounts of complexes 1-5 on the relative viscosities of
CT-DNA at room temperature, [DNA] = 100 µM, r = [complex]/[DNA].
0.0 0.5 1.0 1.5 2.0 2.5
0.5
0.6
0.7
0.8
0.9
1.0
(/
)1
/3
r
6
7
8
9
10
Figure 3.19: Effects of increasing amounts of complexes 6-10 on the relative viscosities
of CT-DNA at room temperature, [DNA] = 100 µM, r = [complex]/[DNA].
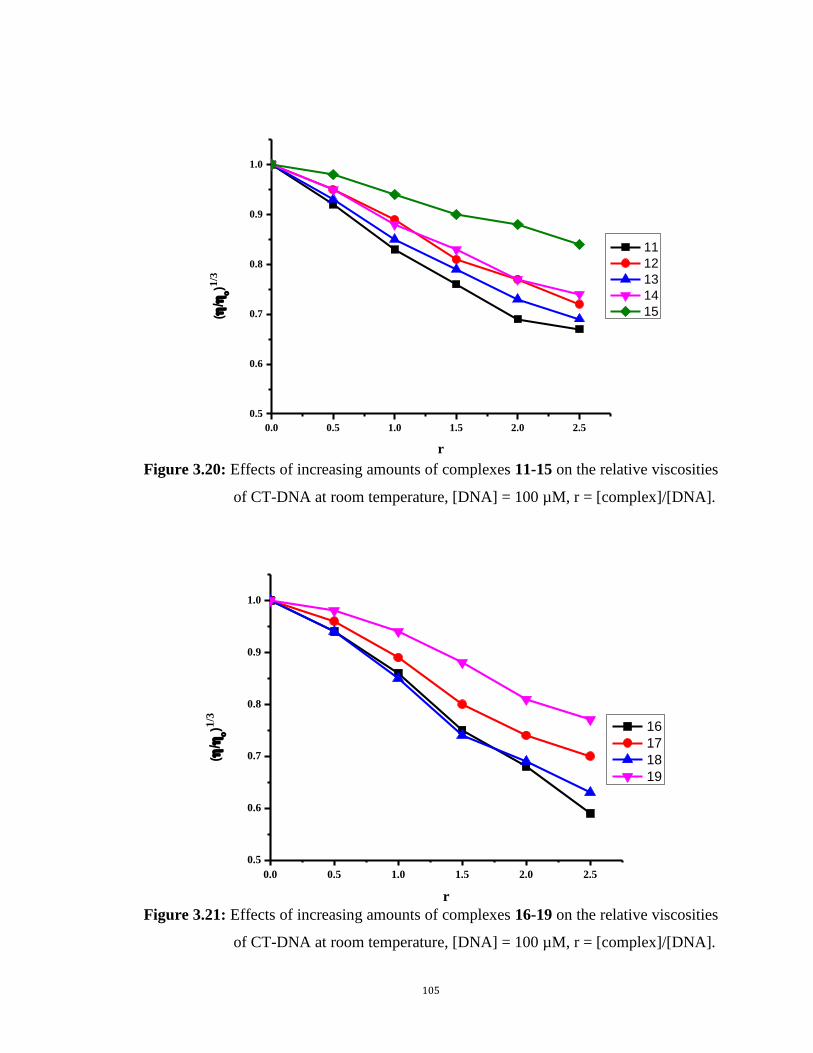
105
0.0 0.5 1.0 1.5 2.0 2.5
0.5
0.6
0.7
0.8
0.9
1.0
(/
)1
/3
r
11
12
13
14
15
Figure 3.20: Effects of increasing amounts of complexes 11-15 on the relative viscosities
of CT-DNA at room temperature, [DNA] = 100 µM, r = [complex]/[DNA].
0.0 0.5 1.0 1.5 2.0 2.5
0.5
0.6
0.7
0.8
0.9
1.0
(/
)1
/3
r
16
17
18
19
Figure 3.21: Effects of increasing amounts of complexes 16-19 on the relative viscosities
of CT-DNA at room temperature, [DNA] = 100 µM, r = [complex]/[DNA].
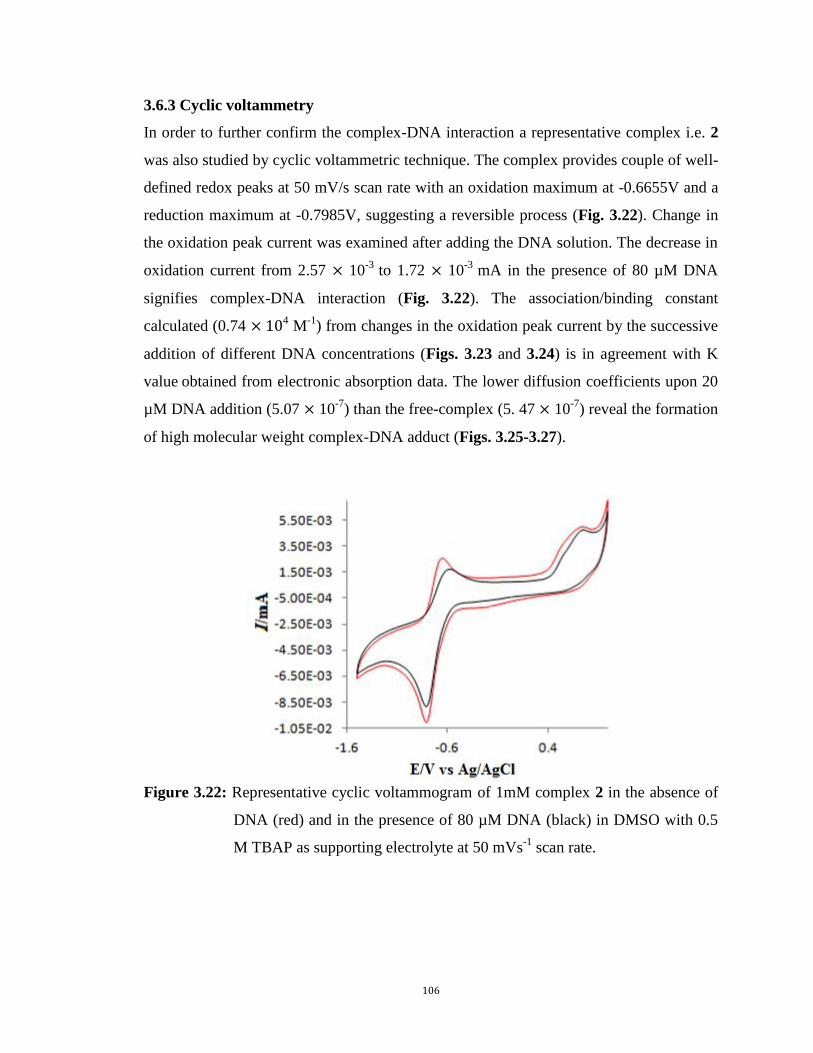
106
3.6.3 Cyclic voltammetry
In order to further confirm the complex-DNA interaction a representative complex i.e. 2
was also studied by cyclic voltammetric technique. The complex provides couple of well-
defined redox peaks at 50 mV/s scan rate with an oxidation maximum at -0.6655V and a
reduction maximum at -0.7985V, suggesting a reversible process (Fig. 3.22). Change in
the oxidation peak current was examined after adding the DNA solution. The decrease in
oxidation current from 2.57 10-3
to 1.72 10-3
mA in the presence of 80 µM DNA
signifies complex-DNA interaction (Fig. 3.22). The association/binding constant
calculated (0.74 4 M
-1) from changes in the oxidation peak current by the successive
addition of different DNA concentrations (Figs. 3.23 and 3.24) is in agreement with K
value obtained from electronic absorption data. The lower diffusion coefficients upon 20
µM DNA addition (5.07 10-7
) than the free-complex (5. 47 10-7
) reveal the formation
of high molecular weight complex-DNA adduct (Figs. 3.25-3.27).
Figure 3.22: Representative cyclic voltammogram of 1mM complex 2 in the absence of
DNA (red) and in the presence of 80 µM DNA (black) in DMSO with 0.5
M TBAP as supporting electrolyte at 50 mVs-1
scan rate.
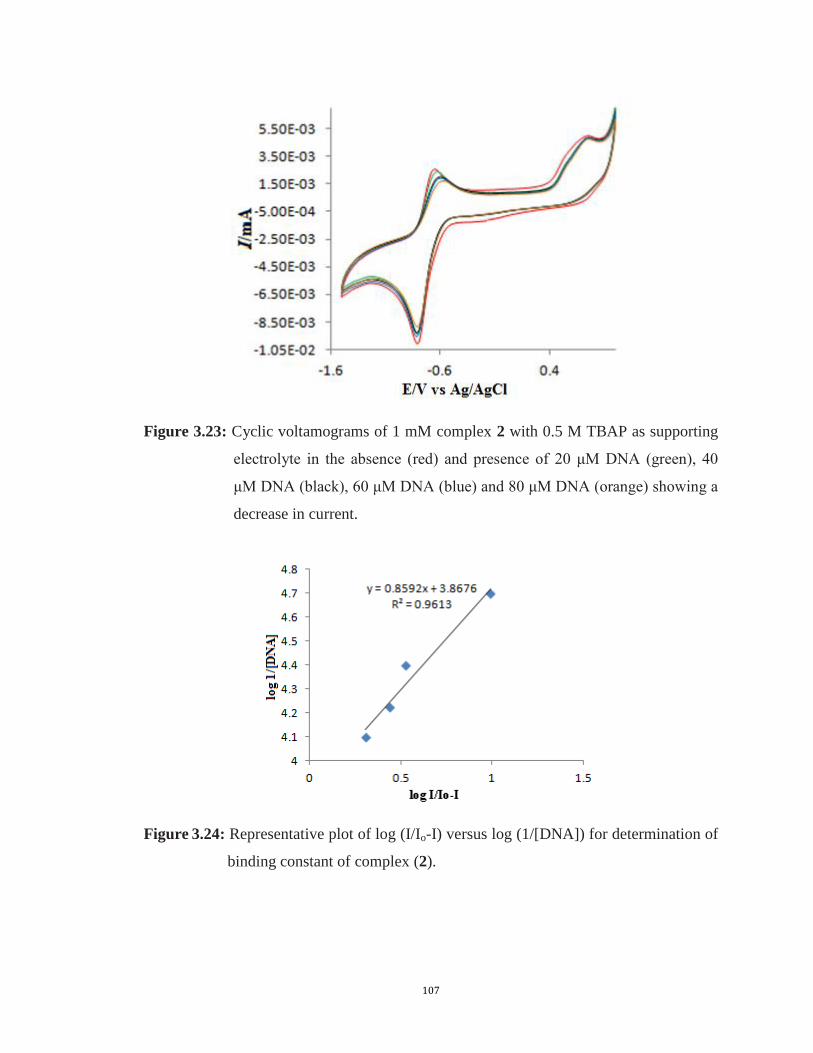
107
Figure 3.23: Cyclic voltamograms of 1 mM complex 2 with 0.5 M TBAP as supporting
electrolyte in the absence (red) and presence of 20 μM DNA (green), 40
μM DNA (black), 60 μM DNA (blue) and 80 μM DNA (orange) showing a
decrease in current.
Figure 3.24: Representative plot of log (I/Io-I) versus log (1/[DNA]) for determination of
binding constant of complex (2).
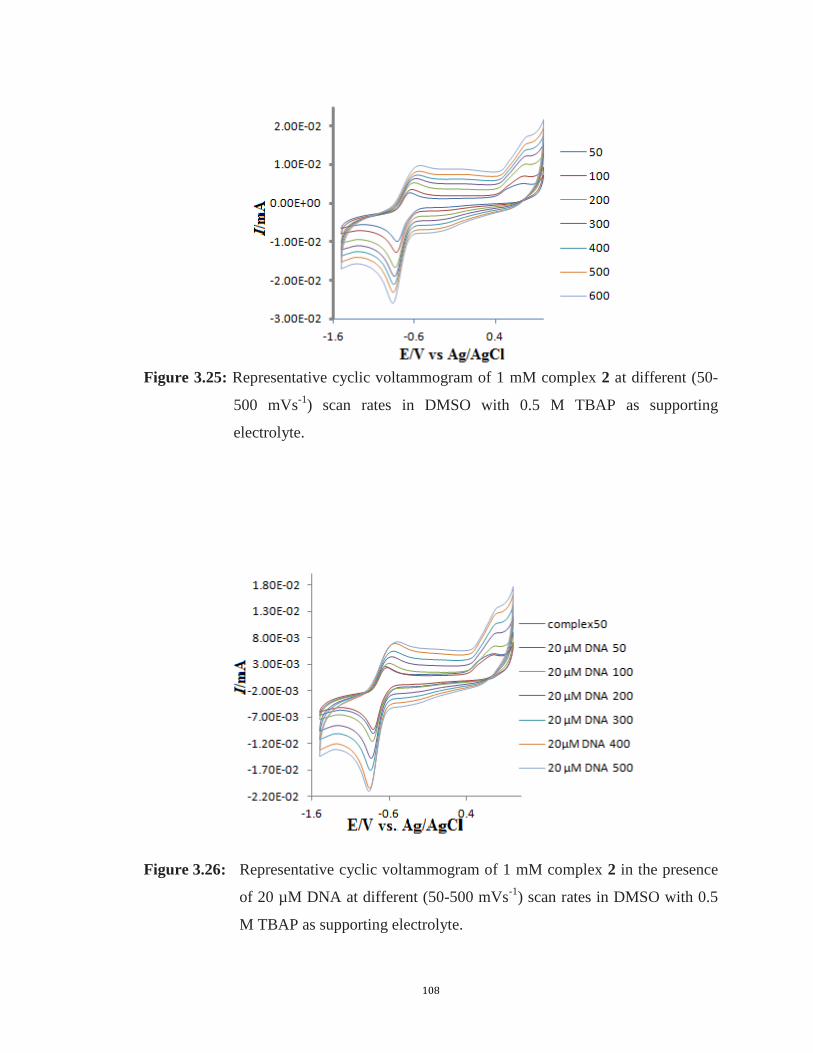
108
Figure 3.25: Representative cyclic voltammogram of 1 mM complex 2 at different (50-
500 mVs-1
) scan rates in DMSO with 0.5 M TBAP as supporting
electrolyte.
Figure 3.26: Representative cyclic voltammogram of 1 mM complex 2 in the presence
of 20 µM DNA at different (50-500 mVs-1
) scan rates in DMSO with 0.5
M TBAP as supporting electrolyte.
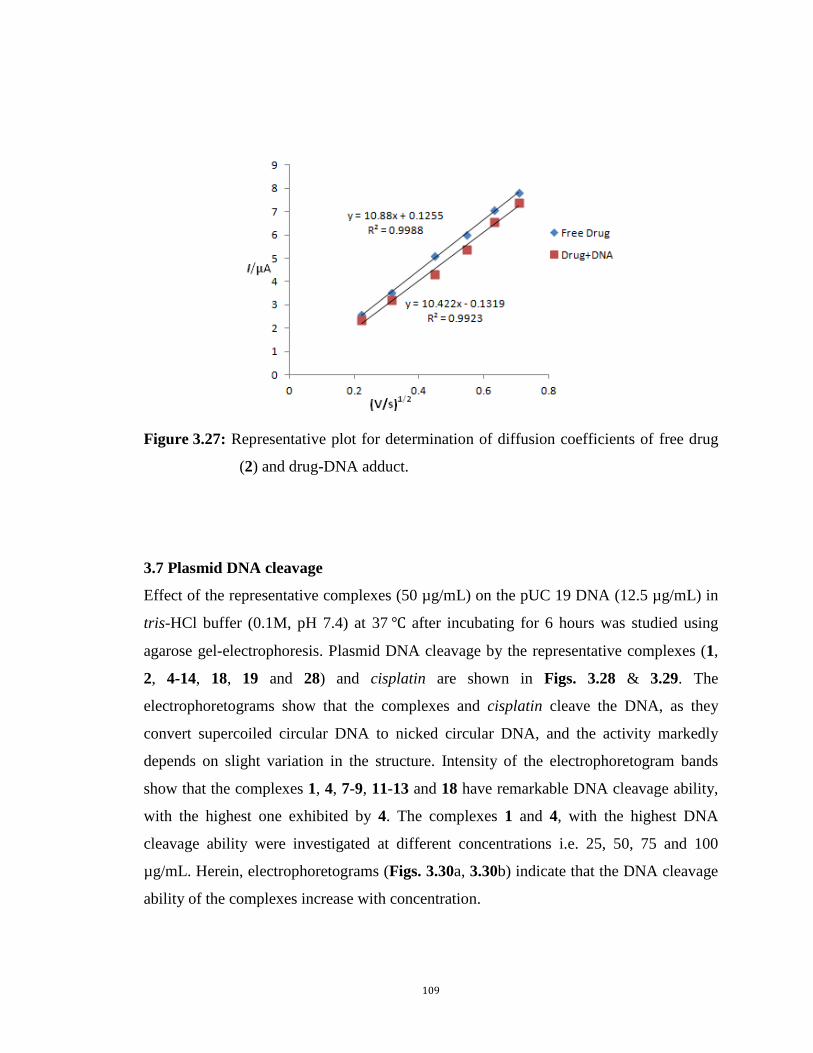
109
Figure 3.27: Representative plot for determination of diffusion coefficients of free drug
(2) and drug-DNA adduct.
3.7 Plasmid DNA cleavage
Effect of the representative complexes (50 µg/mL) on the pUC 19 DNA (12.5 µg/mL) in
tris-HCl buffer (0.1M, pH 7.4) at 37 after incubating for 6 hours was studied using
agarose gel-electrophoresis. Plasmid DNA cleavage by the representative complexes (1,
2, 4-14, 18, 19 and 28) and cisplatin are shown in Figs. 3.28 & 3.29. The
electrophoretograms show that the complexes and cisplatin cleave the DNA, as they
convert supercoiled circular DNA to nicked circular DNA, and the activity markedly
depends on slight variation in the structure. Intensity of the electrophoretogram bands
show that the complexes 1, 4, 7-9, 11-13 and 18 have remarkable DNA cleavage ability,
with the highest one exhibited by 4. The complexes 1 and 4, with the highest DNA
cleavage ability were investigated at different concentrations i.e. 25, 50, 75 and 100
µg/mL. Herein, electrophoretograms (Figs. 3.30a, 3.30b) indicate that the DNA cleavage
ability of the complexes increase with concentration.
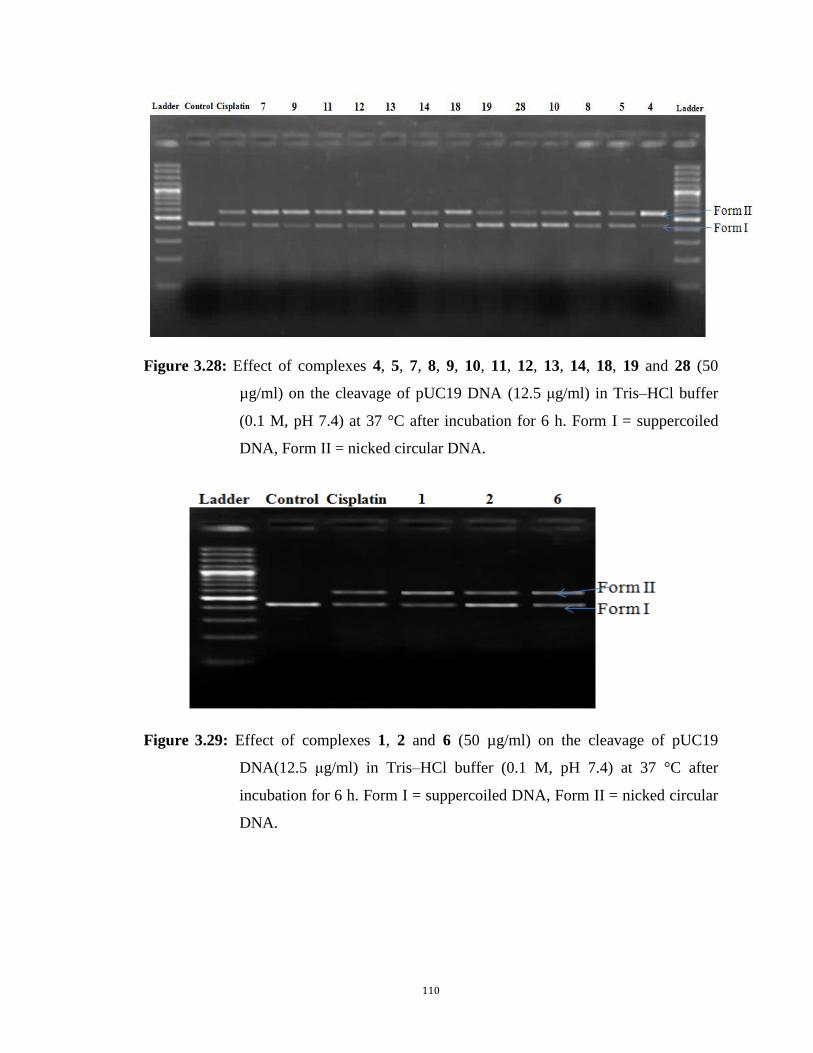
110
Figure 3.28: Effect of complexes 4, 5, 7, 8, 9, 10, 11, 12, 13, 14, 18, 19 and 28 (50
µg/ml) on the cleavage of pUC19 DNA (12.5 μg/ml) in Tris–HCl buffer
(0.1 M, pH 7.4) at 37 °C after incubation for 6 h. Form I = suppercoiled
DNA, Form II = nicked circular DNA.
Figure 3.29: Effect of complexes 1, 2 and 6 (50 µg/ml) on the cleavage of pUC19
DNA(12.5 μg/ml) in Tris–HCl buffer (0.1 M, pH 7.4) at 37 °C after
incubation for 6 h. Form I = suppercoiled DNA, Form II = nicked circular
DNA.
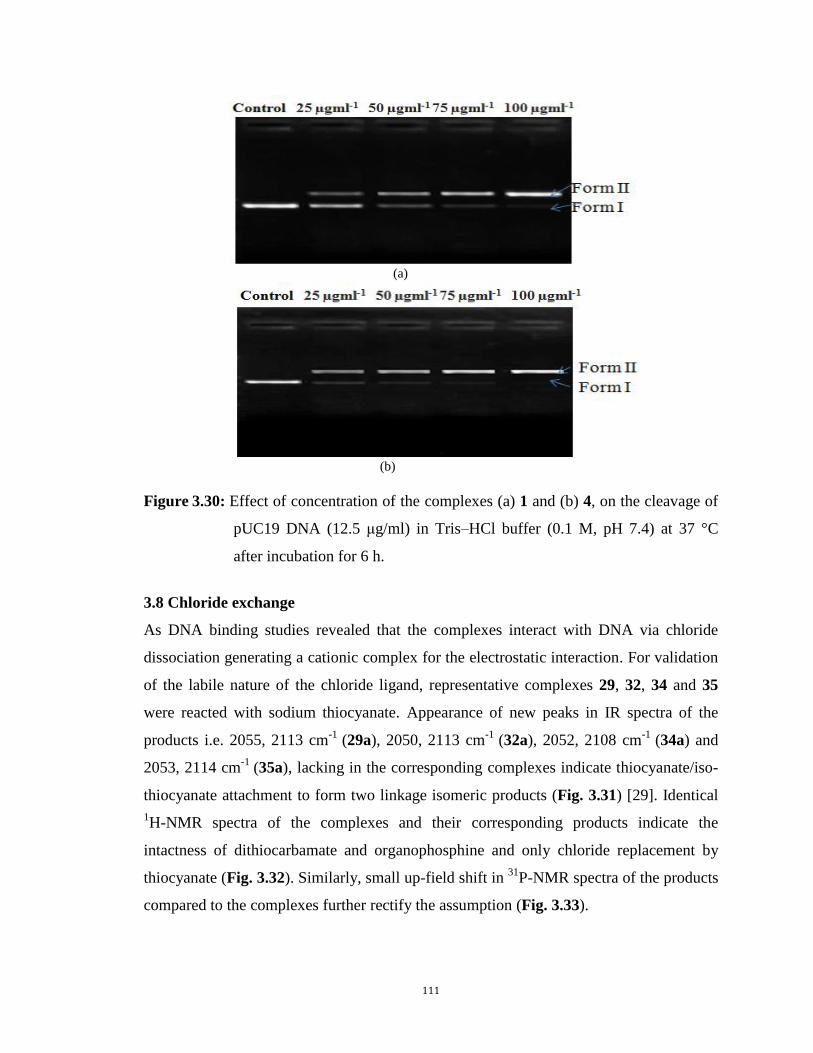
111
(a)
(b)
Figure 3.30: Effect of concentration of the complexes (a) 1 and (b) 4, on the cleavage of
pUC19 DNA (12.5 μg/ml) in Tris–HCl buffer (0.1 M, pH 7.4) at 37 °C
after incubation for 6 h.
3.8 Chloride exchange
As DNA binding studies revealed that the complexes interact with DNA via chloride
dissociation generating a cationic complex for the electrostatic interaction. For validation
of the labile nature of the chloride ligand, representative complexes 29, 32, 34 and 35
were reacted with sodium thiocyanate. Appearance of new peaks in IR spectra of the
products i.e. 2055, 2113 cm-1
(29a), 2050, 2113 cm-1
(32a), 2052, 2108 cm-1
(34a) and
2053, 2114 cm-1
(35a), lacking in the corresponding complexes indicate thiocyanate/iso-
thiocyanate attachment to form two linkage isomeric products (Fig. 3.31) [29]. Identical
1H-NMR spectra of the complexes and their corresponding products indicate the
intactness of dithiocarbamate and organophosphine and only chloride replacement by
thiocyanate (Fig. 3.32). Similarly, small up-field shift in 31
P-NMR spectra of the products
compared to the complexes further rectify the assumption (Fig. 3.33).
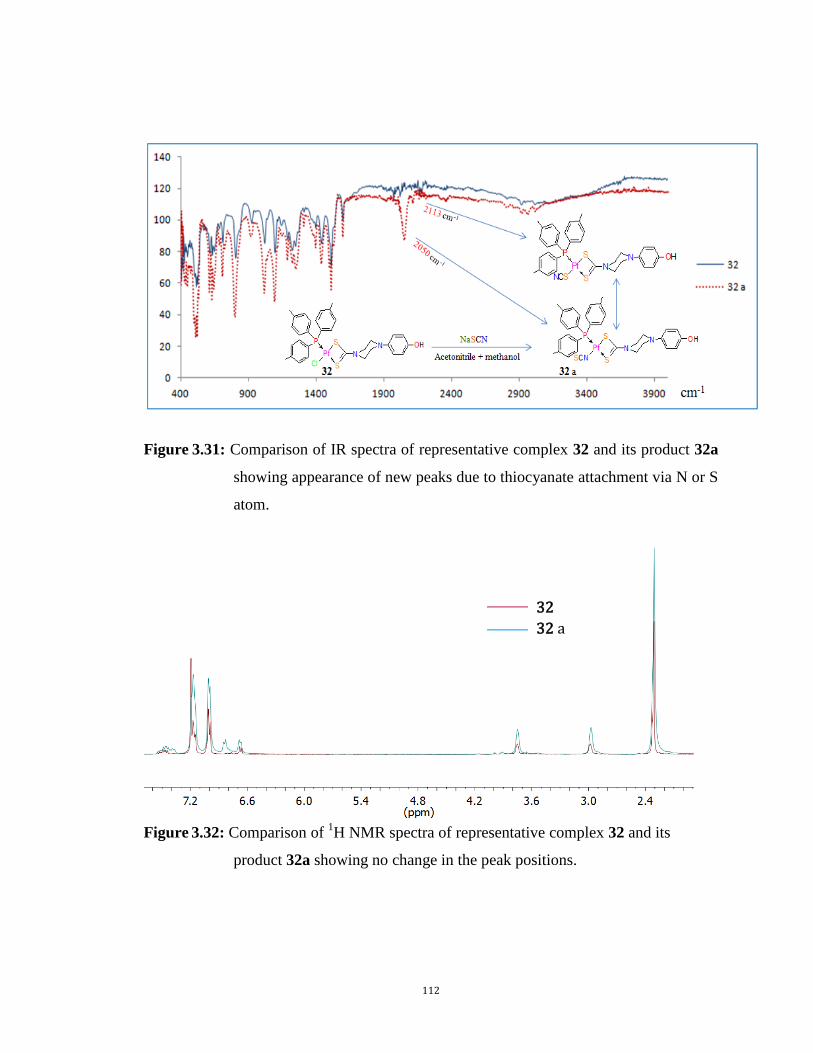
112
Figure 3.31: Comparison of IR spectra of representative complex 32 and its product 32a
showing appearance of new peaks due to thiocyanate attachment via N or S
atom.
Figure 3.32: Comparison of
1H NMR spectra of representative complex 32 and its
product 32a showing no change in the peak positions.
32
32 a
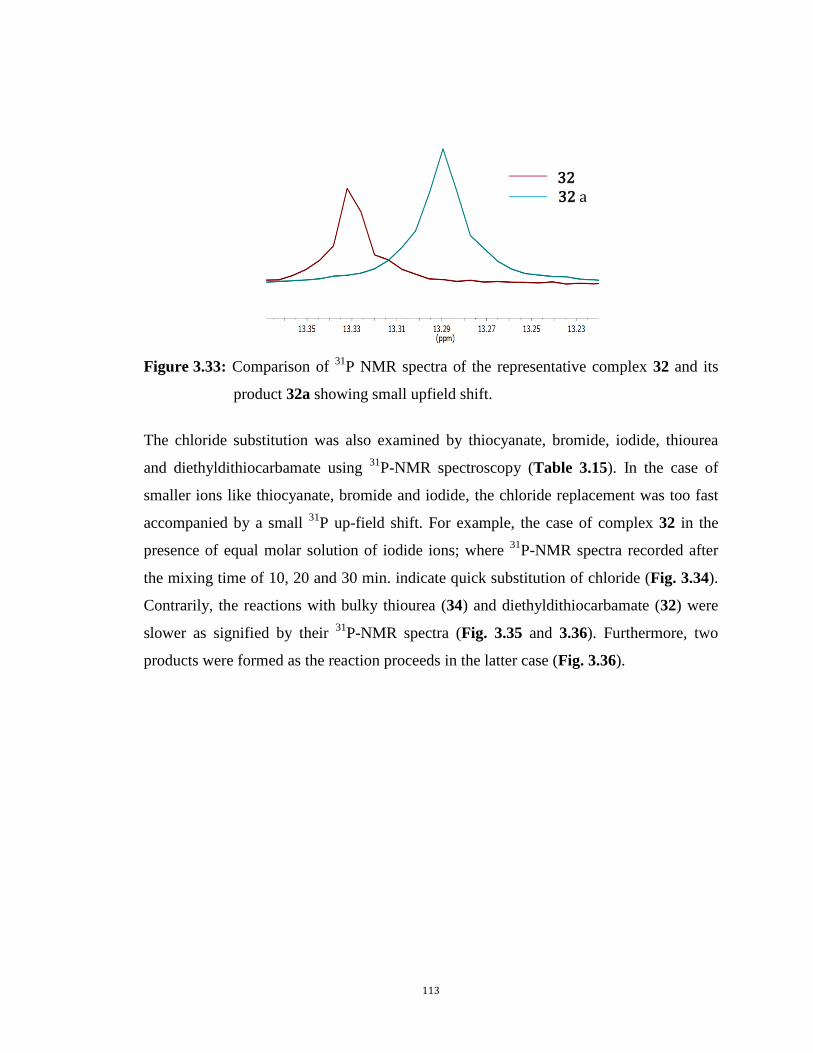
113
Figure 3.33: Comparison of 31
P NMR spectra of the representative complex 32 and its
product 32a showing small upfield shift.
The chloride substitution was also examined by thiocyanate, bromide, iodide, thiourea
and diethyldithiocarbamate using 31
P-NMR spectroscopy (Table 3.15). In the case of
smaller ions like thiocyanate, bromide and iodide, the chloride replacement was too fast
accompanied by a small 31
P up-field shift. For example, the case of complex 32 in the
presence of equal molar solution of iodide ions; where 31
P-NMR spectra recorded after
the mixing time of 10, 20 and 30 min. indicate quick substitution of chloride (Fig. 3.34).
Contrarily, the reactions with bulky thiourea (34) and diethyldithiocarbamate (32) were
slower as signified by their 31
P-NMR spectra (Fig. 3.35 and 3.36). Furthermore, two
products were formed as the reaction proceeds in the latter case (Fig. 3.36).
32 32 a
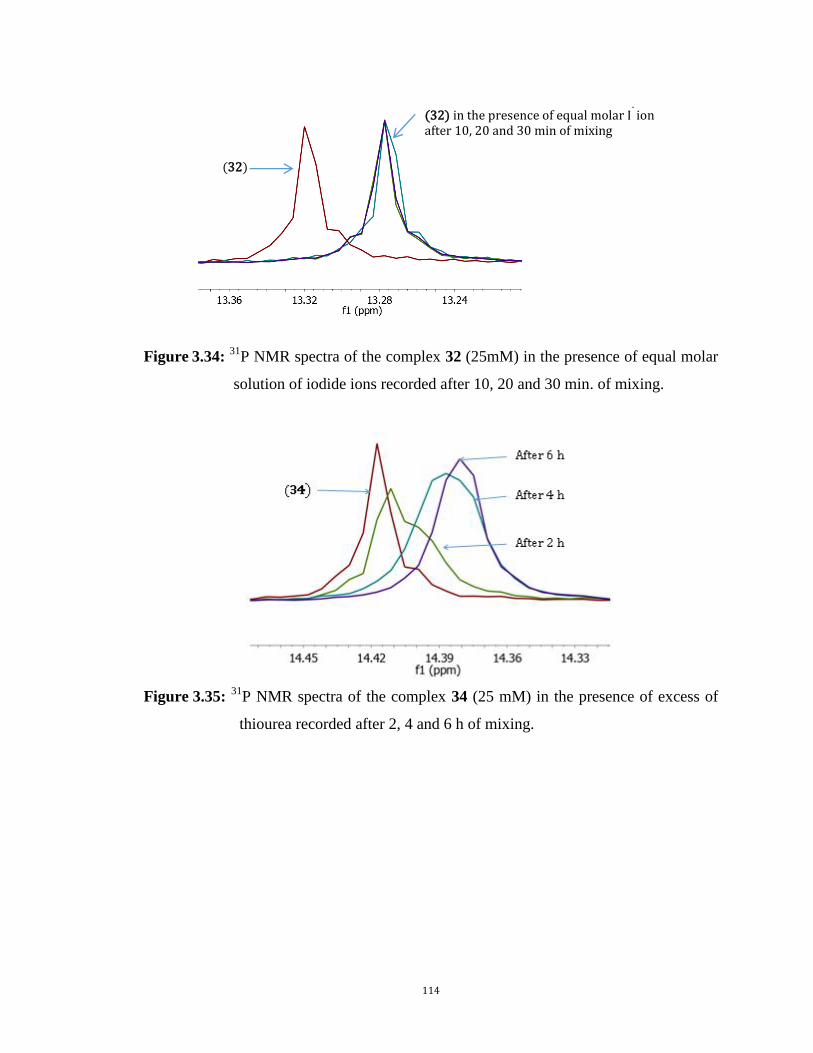
114
Figure 3.34: 31
P NMR spectra of the complex 32 (25mM) in the presence of equal molar
solution of iodide ions recorded after 10, 20 and 30 min. of mixing.
Figure 3.35:
31P NMR spectra of the complex 34 (25 mM) in the presence of excess of
thiourea recorded after 2, 4 and 6 h of mixing.
(32)
(32) in the presence of equal molar I- ion
after 10, 20 and 30 min of mixing
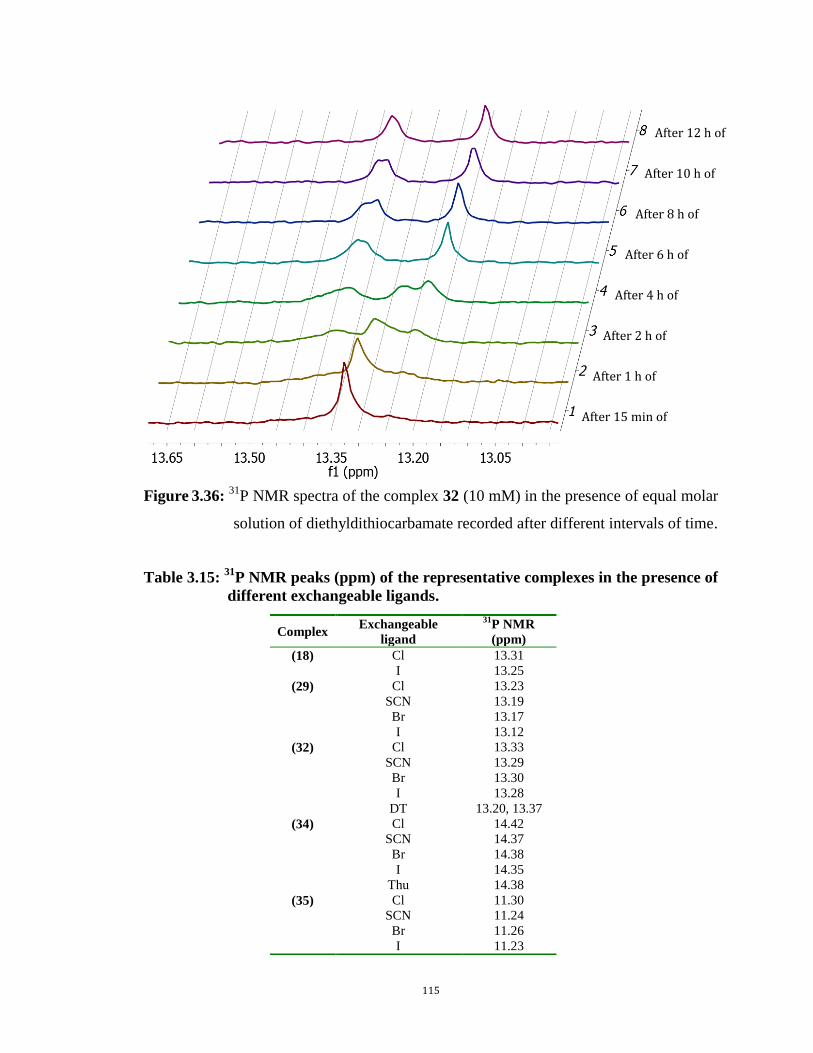
115
Figure 3.36:
31P NMR spectra of the complex 32 (10 mM) in the presence of equal molar
solution of diethyldithiocarbamate recorded after different intervals of time.
Table 3.15: 31
P NMR peaks (ppm) of the representative complexes in the presence of
different exchangeable ligands.
Complex Exchangeable
ligand
31P NMR
(ppm)
(18) Cl 13.31
I 13.25
(29) Cl 13.23
SCN 13.19
Br 13.17
I 13.12
(32) Cl 13.33
SCN 13.29
Br 13.30
I 13.28
DT 13.20, 13.37
(34) Cl 14.42
SCN 14.37
Br 14.38
I 14.35
Thu 14.38
(35) Cl 11.30
SCN 11.24
Br 11.26
I 11.23
After 15 min of mixing
After 1 h of mixing
After 2 h of mixing
After 4 h of mixing
After 6 h of mixing
After 8 h of mixing
After 10 h of mixing
After 12 h of mixing
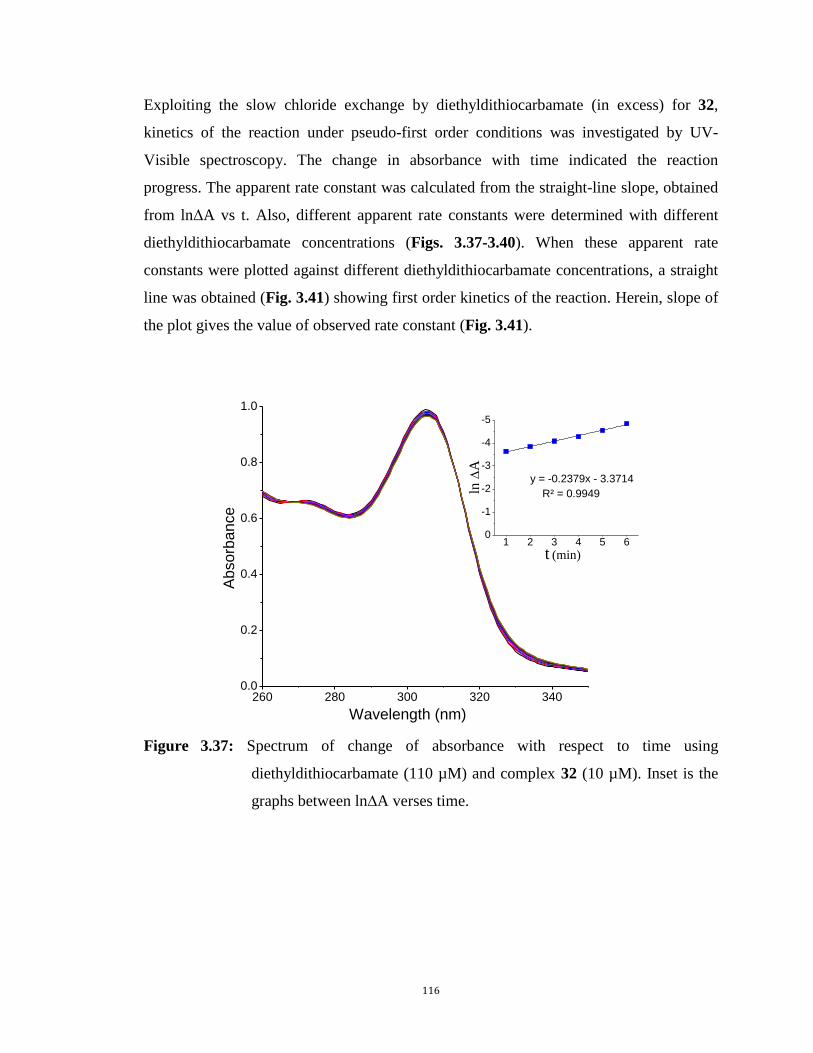
116
Exploiting the slow chloride exchange by diethyldithiocarbamate (in excess) for 32,
kinetics of the reaction under pseudo-first order conditions was investigated by UV-
Visible spectroscopy. The change in absorbance with time indicated the reaction
progress. The apparent rate constant was calculated from the straight-line slope, obtained
from lnΔA vs t. Also, different apparent rate constants were determined with different
diethyldithiocarbamate concentrations (Figs. 3.37-3.40). When these apparent rate
constants were plotted against different diethyldithiocarbamate concentrations, a straight
line was obtained (Fig. 3.41) showing first order kinetics of the reaction. Herein, slope of
the plot gives the value of observed rate constant (Fig. 3.41).
Figure 3.37: Spectrum of change of absorbance with respect to time using
diethyldithiocarbamate (110 µM) and complex 32 (10 µM). Inset is the
graphs between ln∆A verses time.
260 280 300 320 3400.0
0.2
0.4
0.6
0.8
1.0
1 2 3 4 5 60
-1
-2
-3
-4
-5
y = -0.2379x - 3.3714
R² = 0.9949
Ab
so
rba
nce
Wavelength (nm)
ln
A
t (min)
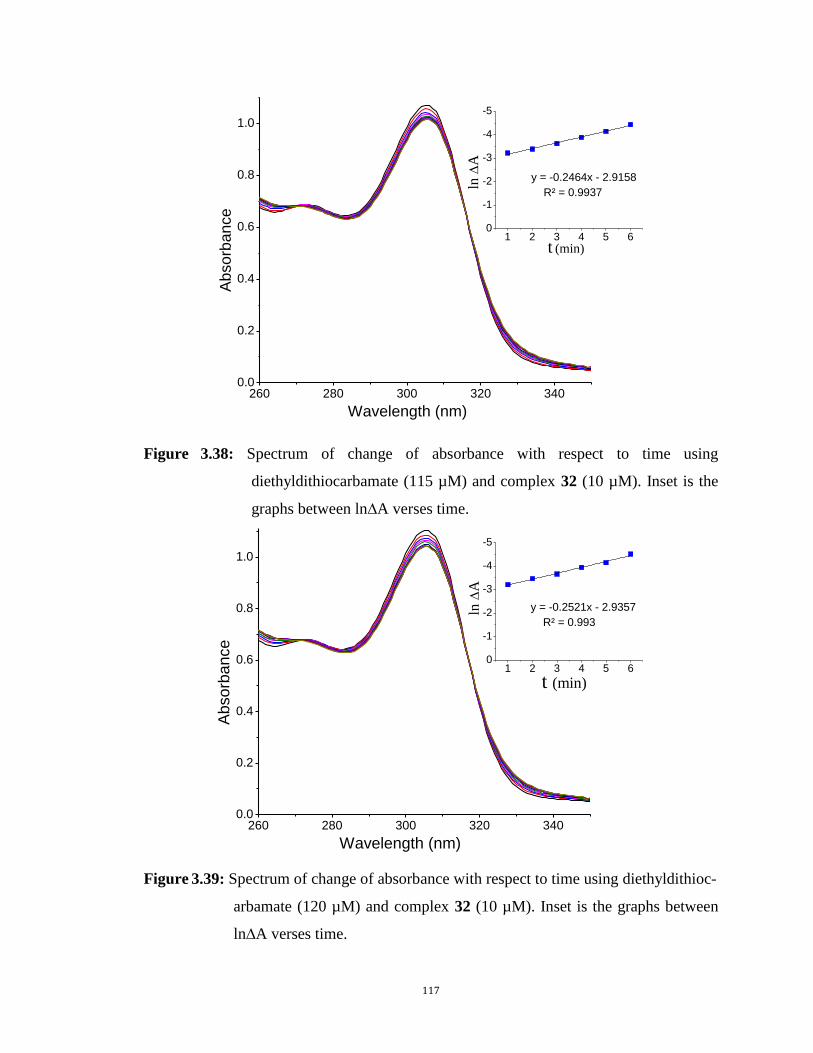
117
Figure 3.38: Spectrum of change of absorbance with respect to time using
diethyldithiocarbamate (115 µM) and complex 32 (10 µM). Inset is the
graphs between ln∆A verses time.
Figure 3.39: Spectrum of change of absorbance with respect to time using diethyldithioc-
arbamate (120 µM) and complex 32 (10 µM). Inset is the graphs between
ln∆A verses time.
260 280 300 320 3400.0
0.2
0.4
0.6
0.8
1.0
1 2 3 4 5 60
-1
-2
-3
-4
-5
Ab
so
rba
nce
Wavelength (nm)
y = -0.2464x - 2.9158
R² = 0.9937
ln
A
t (min)
260 280 300 320 3400.0
0.2
0.4
0.6
0.8
1.0
1 2 3 4 5 60
-1
-2
-3
-4
-5
y = -0.2521x - 2.9357
R² = 0.993
t (min)
Ab
so
rba
nce
Wavelength (nm)
ln
A
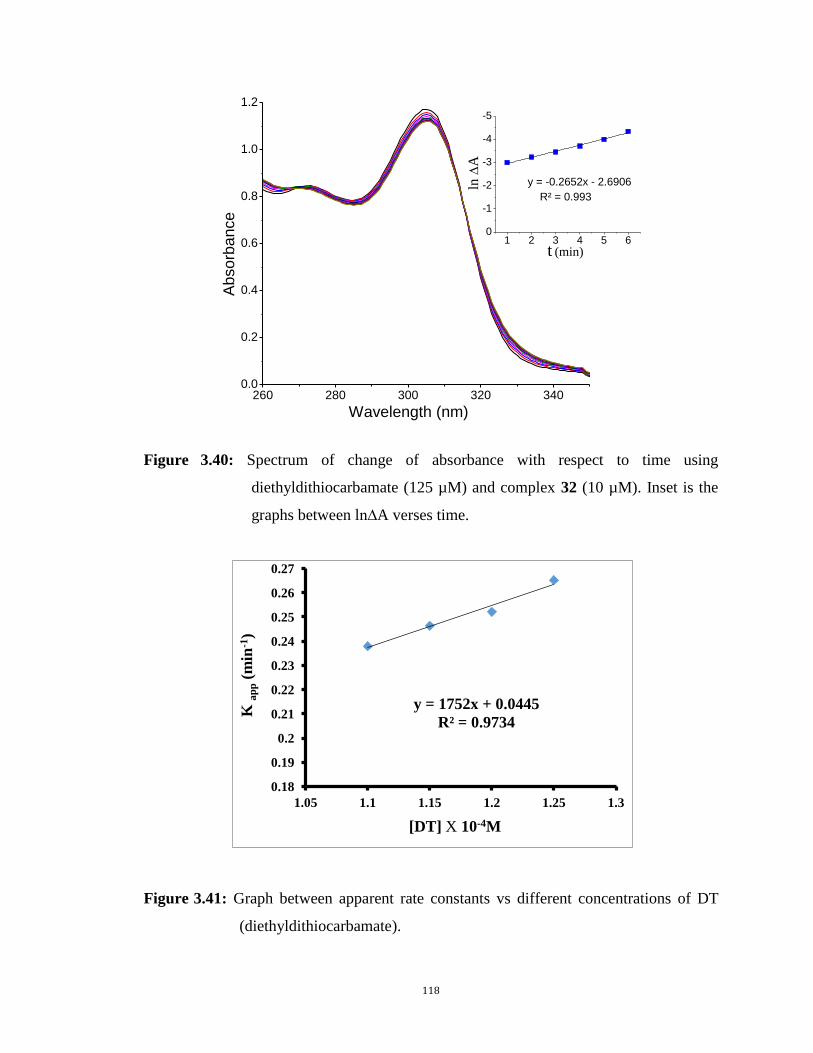
118
Figure 3.40: Spectrum of change of absorbance with respect to time using
diethyldithiocarbamate (125 µM) and complex 32 (10 µM). Inset is the
graphs between ln∆A verses time.
Figure 3.41: Graph between apparent rate constants vs different concentrations of DT
(diethyldithiocarbamate).
260 280 300 320 3400.0
0.2
0.4
0.6
0.8
1.0
1.2
1 2 3 4 5 60
-1
-2
-3
-4
-5
Ab
so
rba
nce
Wavelength (nm)
y = -0.2652x - 2.6906
R² = 0.993
ln
A
t (min)
y = 1752x + 0.0445
R² = 0.9734
0.18
0.19
0.2
0.21
0.22
0.23
0.24
0.25
0.26
0.27
1.05 1.1 1.15 1.2 1.25 1.3
[DT] X 10-4M
K a
pp (
min
-1)
119
REFERENCES
1. Brown, D. A.; Glass, W. K.; Burke, M. A., The general use of IR spectral criteria
in discussions of the bonding and structure of metal dithiocarbamates,
Spectrochim. Acta, Part A 1976, 32, 137-143.
2. Siddiqi, K. S.; Nami, S. A.; Chebude, Y., Template synthesis of symmetrical
transition metal dithiocarbamates, J. Braz. Chem. Soc. 2006, 17, 107-112.
3. Risberg, E. D.; Mink, J.; Abbasi, A.; Skripkin, M. Y.; Hajba, L.; Lindqvist-Reis,
P.; Bencze, É.; Sandström, M., Ambidentate coordination in hydrogen bonded
dimethyl sulfoxide,(CH3)2SO⋯ H3O+, and in dichlorobis (dimethyl sulfoxide)
palladium(II) and platinum(II) solid solvates, by vibrational and sulfur K-edge X-
ray absorption spectroscopy, Dalton Trans. 2009, 8, 1328-1338.
4. Ajibade, P. A.; Idemudia, O. G., Synthesis, characterization, and antibacterial
studies of Pd (II) and Pt (II) complexes of some diaminopyrimidine derivatives,
Bioinorg. Chem. Appl. 2013, 2013, 1-8.
5. Khan, H.; Badshah, A.; Said, M.; Murtaza, G.; Ahmad, J.; Jean‐Claude, B. J.;
Todorova, M.; Butler, I. S., Anticancer metallopharmaceutical agents based on
mixed‐ligand palladium(II) complexes with dithiocarbamates and tertiary
organophosphine ligands, Appl. Organomet. Chem. 2013, 27, 387-395.
6. Khan, H.; Badshah, A.; Murtaz, G.; Said, M.; Neuhausen, C.; Todorova, M.; Jean-
Claude, B. J.; Butler, I. S., Synthesis, characterization and anticancer studies of
mixed ligand dithiocarbamate palladium(II) complexes, Eur. J. Med. Chem. 2011,
46, 4071-4077.
7. Muhammad, N.; Shuja, S.; Ali, S.; Butler, I. S.; Meetsma, A.; Khan, M., New
dimeric, trimeric and supramolecular organotin(IV) dithiocarboxylates: Synthesis,
structural characterization and biocidal activities, Polyhedron 2009, 28, 3439-
3448.
8. Chen, Y.; Guo, Z.; Parsons, S.; Sadler, P. J., Stereospecific and kinetic control
over the hydrolysis of a sterically hindered platinum picoline anticancer complex,
Chem. Eur. J. 1998, 4, 672-676.
120
9. Pregosin, P. S.; Kunz, R. W., 31
P and 13
C NMR of transition metal phosphine
complexes, Springer Science & Business Media 2012, Vol. 16.
10. Cobley, C. J.; Pringle, P. G., Probing the bonding of phosphines and phosphites to
platinum by NMR. Correlations of 1J (PtP) and Hammett substituent constants for
phosphites and phosphines coordinated to platinum(II) and platinum(0), Inorg.
Chim. Acta 1997, 265, 107-115.
11. er en, . Kl un, . Kryeziu, K. anchuk, . Alte, . K rner, W.; Heffeter, P.;
Berger, W.; Turel, I., Structure-Related Mode-of-Action Differences of
Anticancer Organoruthenium Complexes with β-Diketonates, J. Med. Chem.
2015, 58, 3984-3996.
12. Maschke, M.; Alborzinia, H.; Lieb, M.; Wölfl, S.; Metzler‐Nolte, N., Structure–
Activity Relationship of Trifluoromethyl‐Containing Metallocenes:
Electrochemistry, Lipophilicity, Cytotoxicity, and ROS Production,
ChemMedChem 2014, 9, 1188-1194.
13. Renfrew, A. K.; Scopelliti, R.; Dyson, P. J., Use of perfluorinated phosphines to
provide thermomorphic anticancer complexes for heat-based tumor targeting,
Inorg. Chem. 2010, 49, 2239-2246.
14. Altaf, M.; Monim-ul-Mehboob, M.; Seliman, A. A.; Sohail, M.; Wazeer, M. I.;
Isab, A. A.; Li, L.; Dhuna, V.; Bhatia, G.; Dhuna, K., Synthesis, characterization
and anticancer activity of gold(I) complexes that contain tri-tert-butylphosphine
and dialkyl dithiocarbamate ligands, Eur. J. Med. Chem. 2015, 95, 464-472.
15. McPherson, R.; Galettis, P.; De Souza, P., Enhancement of the activity of
phenoxodiol by cisplatin in prostate cancer cells, Br. J. Cancer 2009, 100, 649-
655.
16. Pope, A. J.; Bruce, C.; Kysela, B.; Hannon, M. J., Issues surrounding standard
cytotoxicity testing for assessing activity of non-covalent DNA-binding metallo-
drugs, Dalton Trans. 2010, 39, 2772-2774.
17. Rosenberg, B.; Van Camp, L.; Krigas, T., Inhibition of cell division in
Escherichia coli by electrolysis products from a platinum electrode, Nature 1965,
205, 698-699.
121
18. O'Dwyer, P. J.; Stevenson, J. P.; Johnson, S. W., Cisplatin: chemistry and
biochemistry of a leading anticancer drug, 1999, 29-69.
19. Sirajuddin, M.; Ali, S.; Badshah, A., Drug–DNA interactions and their study by
UV–Visible, fluorescence spectroscopies and cyclic voltametry, J. Photochem.
Photobiol. B 2013, 124, 1-19.
20. Zhang, Q.-L.; Liu, J.-G.; Liu, J.; Xue, G.-Q.; Li, H.; Liu, J.-Z.; Zhou, H.; Qu, L.-
H.; Ji, L.-N., DNA-binding and photocleavage studies of cobalt(III) mixed-
polypyridyl complexes containing 2-(2-chloro-5-nitrophenyl) imidazo[4, 5-f][1,
10] phenanthroline, J. Inorg. Biochem. 2001, 85, 291-296.
21. Bloomfield, V. A.; Crothers, D. M.; Tinoco, I., Physical chemistry of nucleic
acids. Harper & Row New York 1974, Vol. 432.
22. Arjmand, F.; Aziz, M., Synthesis and characterization of dinuclear macrocyclic
cobalt(II), copper(II) and zinc(II) complexes derived from 2, 2, 2′, 2′-S, S [bis
(bis-N, N-2-thiobenzimidazolyloxalato-1, 2-ethane)]: DNA binding and cleavage
studies, Eur. J. Med. Chem. 2009, 44, 834-844.
23. Dougan, S. J.; Habtemariam, A.; McHale, S. E.; Parsons, S.; Sadler, P. J.,
Catalytic organometallic anticancer complexes, Proc. Natl. Acad. Sci. USA 2008,
105, 11628-11633.
24. Shi, S.; Liu, J.; Li, J.; Zheng, K.-C.; Huang, X.-M.; Tan, C.-P.; Chen, L.-M.; Ji,
L.-N., Synthesis, characterization and DNA-binding of novel chiral complexes Δ-
and Λ-[Ru(bpy)2L] 2+
(L = o-mopip and p-mopip), J. Inorg. Biochem. 2006, 100,
385-395.
25. Satyanarayana, S.; Dabrowiak, J. C.; Chaires, J. B., Tris(phenanthroline)
ruthenium(II) enantiomer interactions with DNA: mode and specificity of
binding, Biochemistry 1993, 32, 2573-2584.
26. Villarreal, W.; Colina-Vegas, L.; Rodrigues de Oliveira, C.; Tenorio, J. C.;
Ellena, J.; Gozzo, F. C.; Cominetti, M. R.; Ferreira, A. G.; Ferreira, M. A. B.;
Navarro, M., Chiral platinum(II) complexes featuring phosphine and chloroquine
ligands as cytotoxic and monofunctional DNA-binding agents, Inorg. Chem.
2015, 54, 11709-11720.
122
27. Aleksić, M. M. Kapetanović, V., An overview of the optical and electrochemical
methods for detection of DNA–drug interactions, Acta Chim. Slov. 2014, 61, 555-
573.
28. Satyanarayana, S.; Dabrowiak, J. C.; Chaires, J. B., Neither. DELTA.-nor.
LAMBDA.-tris(phenanthroline) ruthenium(II) binds to DNA by classical
intercalation, Biochemistry 1992, 31, 9319-9324.
29. Slater, G. P.; Manville, J. F., Analysis of thiocyanates and isothiocyanates by
ammonia chemical ionization gas chromatography-mass spectrometry and gas
chromatography-Fourier transfo, J. Chromatogr. A 1993, 648, 433-443.
Chapter 4
CRYSTALLOGRAPHIC ANALYSIS AND DFT STUDIES
123
4.1 Single crystal X-ray analysis
Crystal data and structure refinement parameters for the heteroleptic Pt(II) complexes 1,
2, 6, 25 and 29 with different crystal systems (monoclinic & orthorhombic) and space
groups (P21/c & Pbca) are given in the Tables 4.1 & 4.2. The selected bond lengths (Å)
and bond angles (˚) are shown in the Tables 4.3 & 4.4 respectively.
Monofunctional complexes (1, 2, 6, 25) show pseudo square-planar geometry around
platinum atom with two cis sites occupied by dithiocarbamate chelate forming four-
membered ring (PtS2C), along with cis positioned chloride and organophosphine (Figs.
4.1 and 4.2). The S(1)-Pt(1)-S(2) angles {74.91(4 1, 2, 75.04(6 6, 75.31(3
25} are smaller than ideal value 90 confirming pseudo cis position of the two sulfur
atoms due to chelate restriction. This distortion also lowers down trans S(1)-Pt(1)-Cl(1)
angle {170.37(4 1, 168.52(1 2 and 168.16(6 6, 169.42(3 25} by around 10-12o than
ideal value of 180 , thus resulting in pseudo square planar geometry. Two sulfurs
coordinate slightly asymmetrically with a short {2.2766(12) 1; 2.293(4) 2; 2.2923(16) 6,
2.2821(8) 25} and a long {2.3574(12) 1; 2.343(4) 2; 2.3527(15) 6, 2.3556(9) 25} Pt-S
bond being attributed to the trans-influence of the phosphine. However, the magnitude of
asymmetry varies in these complexes {ΔPt-S of 0.0808 Å (1) 0.05 Å (2) 0.0604 Å (6),
0.0.0735 Å 25}. This asymmetry in Pt-S bonds due to trans effect of the ligand is typical
for square-planar system. The bond lengths of C(1)-S(1) {1.718(4) Å 1, 1.741(18) Å 2,
1.728(6) Å 6, 1.730(3) Å 25} and C(1)-S(2) {1.717(5) Å 1, 1.712(14) 2, 1.724(6)Å 6,
1.721(3) Å 25} are in between C-S single (1.82 Å) and double bond (1.60 Å) [1].
Similarly, C(1)-N(1) bond lengths 1.306(5) Å 1,1.31(2) Å 2 and 1.314(7) Å 6, 1.309(4) Å
25} are shorter than single (1.47 Å) and longer than double bond (1.28 Å) [2], thus
confirming a resonance phenomenon in NCSS moiety.
Similarly, crystal structures of bis-organophosphine complex (29) having no replaceable
chloride also shows pseudo square-planar geometry around platinum atom with two cis
sites occupied by dithiocarbamate chelate forming four-membered ring (PtS2C). While
two remaining cis sites occupied by two phosphorous atoms of 4-
bis(diphenylphosphino)butane to form seven-membered metallacycle (Fig. 4.2). Due to
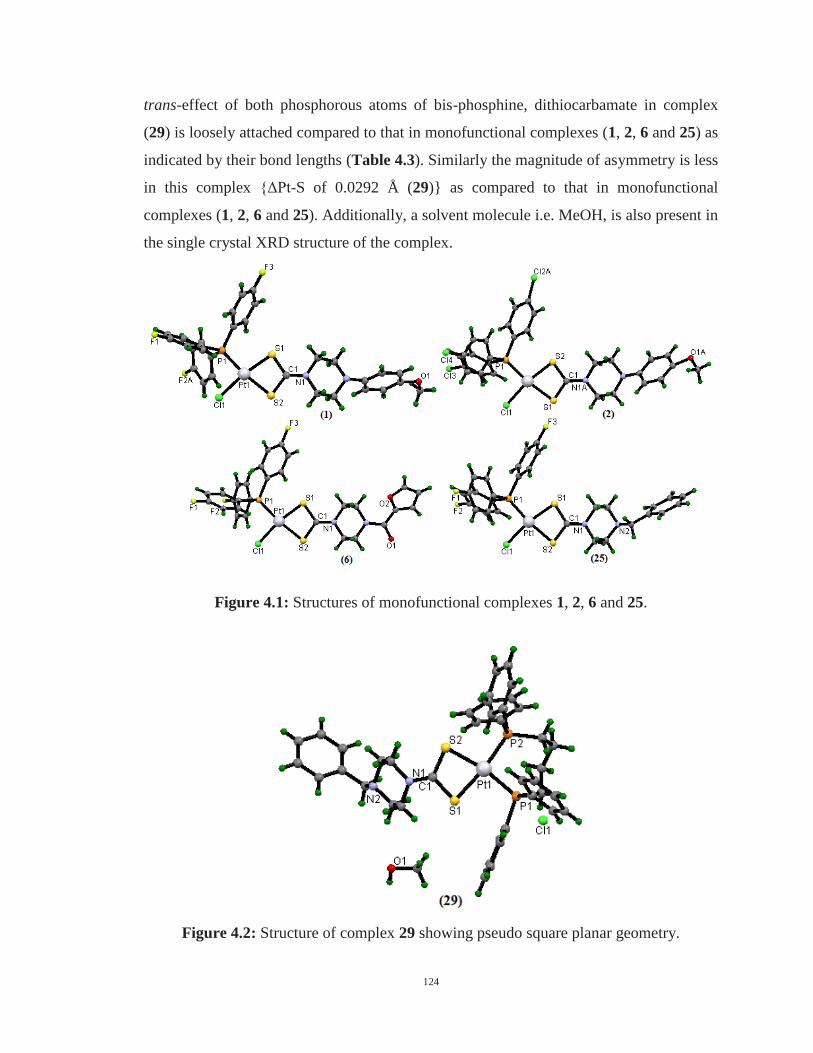
124
trans-effect of both phosphorous atoms of bis-phosphine, dithiocarbamate in complex
(29) is loosely attached compared to that in monofunctional complexes (1, 2, 6 and 25) as
indicated by their bond lengths (Table 4.3). Similarly the magnitude of asymmetry is less
in this complex {ΔPt-S of 0.0292 Å (29)} as compared to that in monofunctional
complexes (1, 2, 6 and 25). Additionally, a solvent molecule i.e. MeOH, is also present in
the single crystal XRD structure of the complex.
Figure 4.1: Structures of monofunctional complexes 1, 2, 6 and 25.
Figure 4.2: Structure of complex 29 showing pseudo square planar geometry.
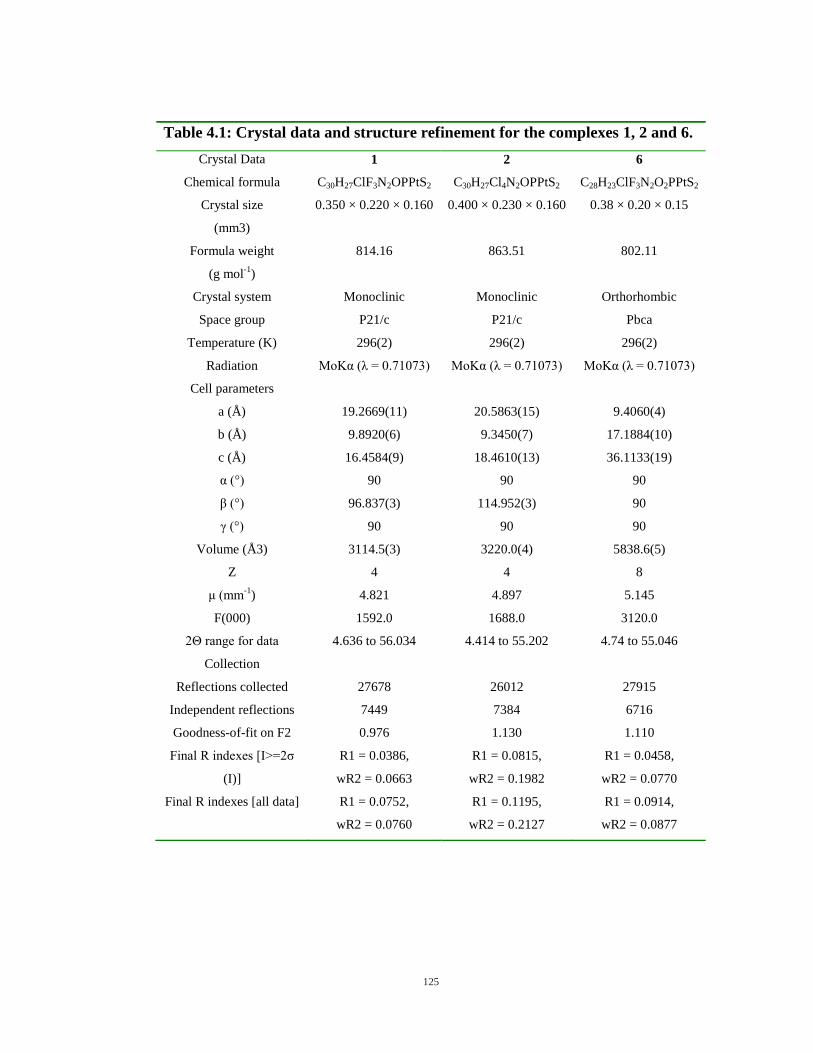
125
Table 4.1: Crystal data and structure refinement for the complexes 1, 2 and 6.
Crystal Data 1 2 6
Chemical formula C30H27ClF3N2OPPtS2 C30H27Cl4N2OPPtS2 C28H23ClF3N2O2PPtS2
Crystal size
(mm3)
0.350 × 0.220 × 0.160 0.400 × 0.230 × 0.160 0.38 × 0.20 × 0.15
Formula weight
(g mol-1
)
814.16 863.51 802.11
Crystal system Monoclinic Monoclinic Orthorhombic
Space group P21/c P21/c Pbca
Temperature (K) 296(2) 296(2) 296(2)
Radiation MoKα λ = 0 0 3 MoKα λ = 0 0 3 MoKα λ = 0 0 3
Cell parameters
a (Å) 19.2669(11) 20.5863(15) 9.4060(4)
b (Å) 9.8920(6) 9.3450(7) 17.1884(10)
c (Å) 16.4584(9) 18.4610(13) 36.1133(19)
α ° 90 90 90
β ° 96.837(3) 114.952(3) 90
γ ° 90 90 90
Volume (Å3) 3114.5(3) 3220.0(4) 5838.6(5)
Z 4 4 8
μ mm-1
) 4.821 4.897 5.145
F(000) 1592.0 1688.0 3120.0
2Θ range for data
Collection
4.636 to 56.034 4.414 to 55.202 4.74 to 55.046
Reflections collected 27678 26012 27915
Independent reflections 7449 7384 6716
Goodness-of-fit on F2 0.976 1.130 1.110
Final R indexes [I>=2σ
(I)]
R1 = 0.0386,
wR2 = 0.0663
R1 = 0.0815,
wR2 = 0.1982
R1 = 0.0458,
wR2 = 0.0770
Final R indexes [all data] R1 = 0.0752,
wR2 = 0.0760
R1 = 0.1195,
wR2 = 0.2127
R1 = 0.0914,
wR2 = 0.0877
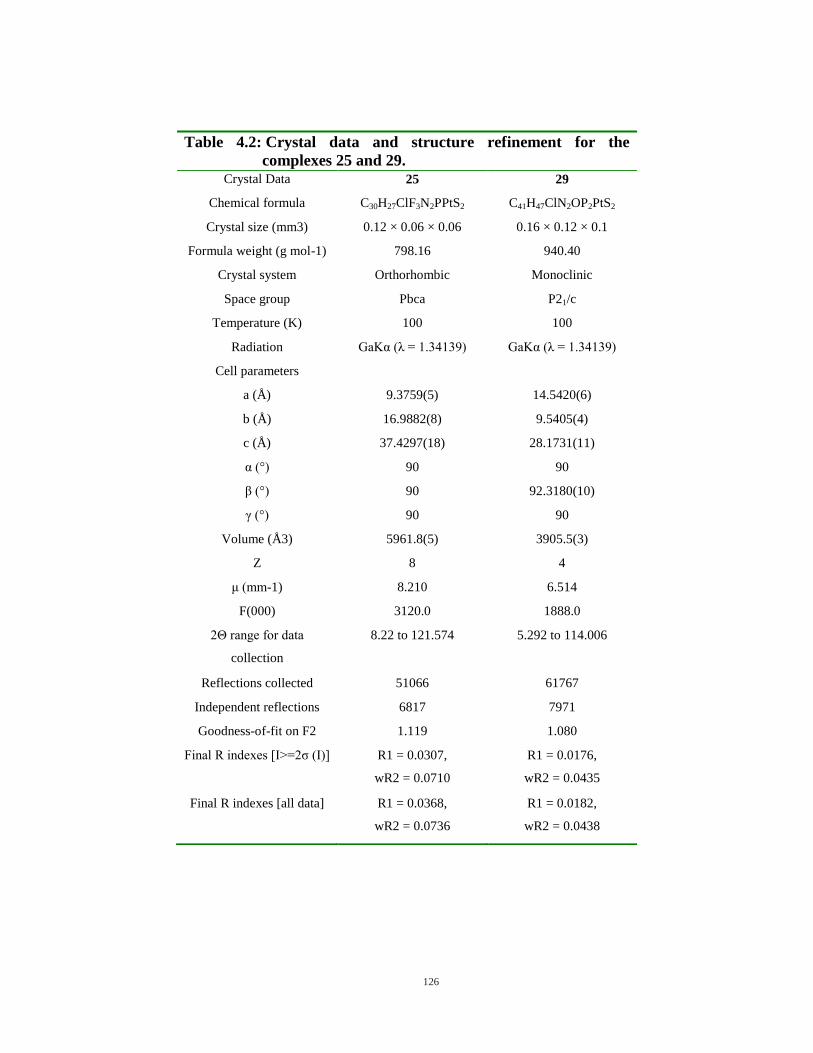
126
Table 4.2: Crystal data and structure refinement for the
complexes 25 and 29. Crystal Data 25 29
Chemical formula C30H27ClF3N2PPtS2 C41H47ClN2OP2PtS2
Crystal size (mm3) 0.12 × 0.06 × 0.06 0.16 × 0.12 × 0.1
Formula weight (g mol-1) 798.16 940.40
Crystal system Orthorhombic Monoclinic
Space group Pbca P21/c
Temperature (K) 100 100
Radiation GaKα λ = 3 3 GaKα λ = 3 3
Cell parameters
a (Å) 9.3759(5) 14.5420(6)
b (Å) 16.9882(8) 9.5405(4)
c (Å) 37.4297(18) 28.1731(11)
α ° 90 90
β ° 90 92.3180(10)
γ ° 90 90
Volume (Å3) 5961.8(5) 3905.5(3)
Z 8 4
μ mm-1) 8.210 6.514
F(000) 3120.0 1888.0
2Θ range for data
collection
8.22 to 121.574 5.292 to 114.006
Reflections collected 51066 61767
Independent reflections 6817 7971
Goodness-of-fit on F2 1.119 1.080
Final R indexes [I>=2σ I ] R1 = 0.0307,
wR2 = 0.0710
R1 = 0.0176,
wR2 = 0.0435
Final R indexes [all data] R1 = 0.0368,
wR2 = 0.0736
R1 = 0.0182,
wR2 = 0.0438
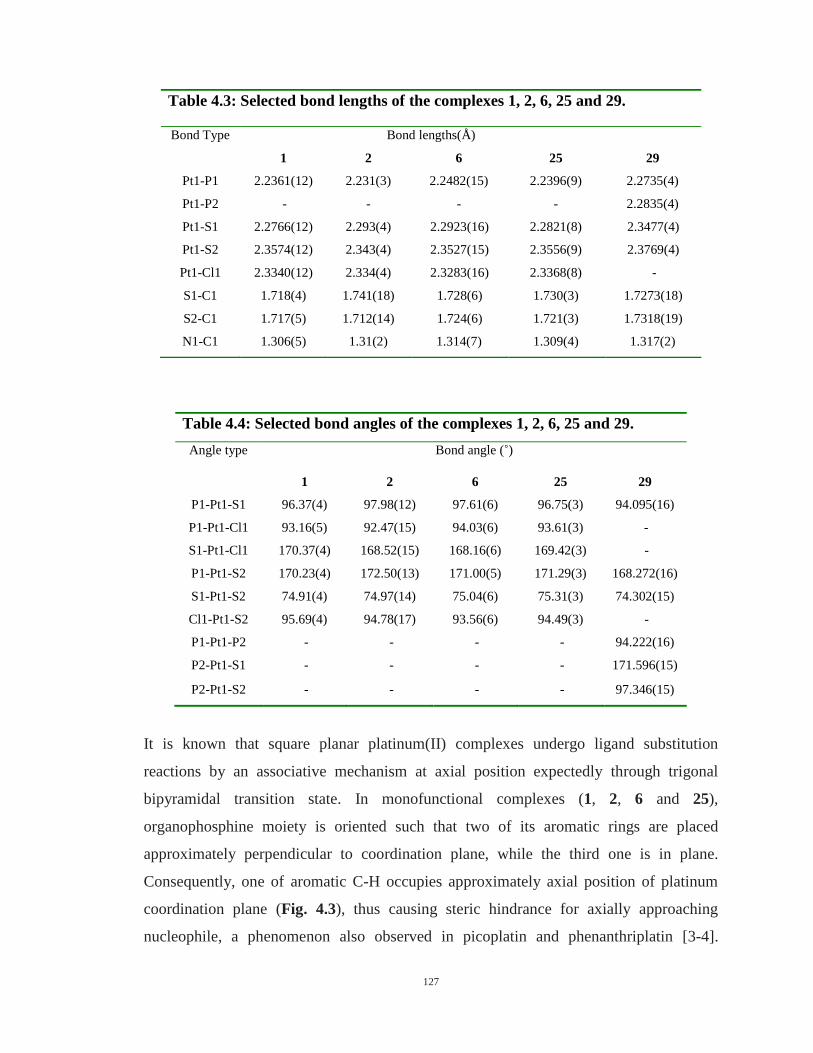
127
It is known that square planar platinum(II) complexes undergo ligand substitution
reactions by an associative mechanism at axial position expectedly through trigonal
bipyramidal transition state. In monofunctional complexes (1, 2, 6 and 25),
organophosphine moiety is oriented such that two of its aromatic rings are placed
approximately perpendicular to coordination plane, while the third one is in plane.
Consequently, one of aromatic C-H occupies approximately axial position of platinum
coordination plane (Fig. 4.3), thus causing steric hindrance for axially approaching
nucleophile, a phenomenon also observed in picoplatin and phenanthriplatin [3-4].
Table 4.3: Selected bond lengths of the complexes 1, 2, 6, 25 and 29.
Bond Type
Bond lengths(Å)
1 2 6 25 29
Pt1-P1 2.2361(12) 2.231(3) 2.2482(15) 2.2396(9) 2.2735(4)
Pt1-P2 - - - - 2.2835(4)
Pt1-S1 2.2766(12) 2.293(4) 2.2923(16) 2.2821(8) 2.3477(4)
Pt1-S2 2.3574(12) 2.343(4) 2.3527(15) 2.3556(9) 2.3769(4)
Pt1-Cl1 2.3340(12) 2.334(4) 2.3283(16) 2.3368(8) -
S1-C1 1.718(4) 1.741(18) 1.728(6) 1.730(3) 1.7273(18)
S2-C1 1.717(5) 1.712(14) 1.724(6) 1.721(3) 1.7318(19)
N1-C1 1.306(5) 1.31(2) 1.314(7) 1.309(4) 1.317(2)
Table 4.4: Selected bond angles of the complexes 1, 2, 6, 25 and 29.
Angle type Bond angle (˚)
1 2 6 25 29
P1-Pt1-S1 96.37(4) 97.98(12) 97.61(6) 96.75(3) 94.095(16)
P1-Pt1-Cl1 93.16(5) 92.47(15) 94.03(6) 93.61(3) -
S1-Pt1-Cl1 170.37(4) 168.52(15) 168.16(6) 169.42(3) -
P1-Pt1-S2 170.23(4) 172.50(13) 171.00(5) 171.29(3) 168.272(16)
S1-Pt1-S2 74.91(4) 74.97(14) 75.04(6) 75.31(3) 74.302(15)
Cl1-Pt1-S2 95.69(4) 94.78(17) 93.56(6) 94.49(3) -
P1-Pt1-P2 - - - - 94.222(16)
P2-Pt1-S1 - - - - 171.596(15)
P2-Pt1-S2 - - - - 97.346(15)
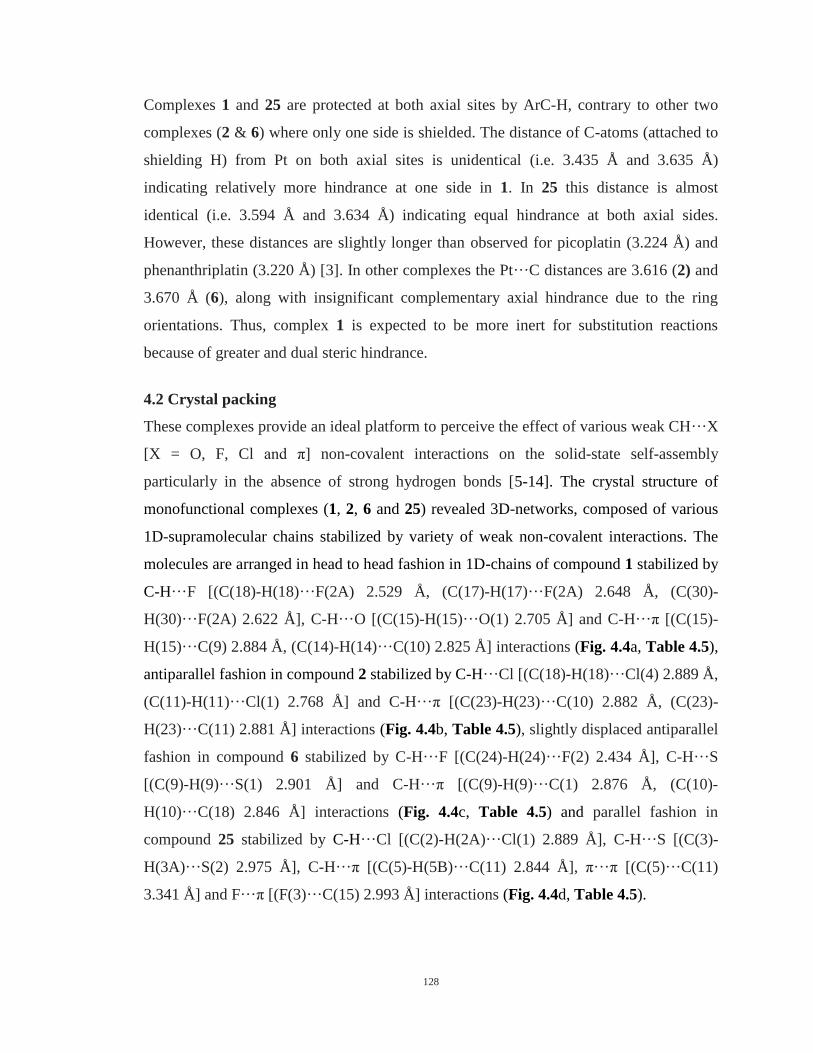
128
Complexes 1 and 25 are protected at both axial sites by ArC-H, contrary to other two
complexes (2 & 6) where only one side is shielded. The distance of C-atoms (attached to
shielding H) from Pt on both axial sites is unidentical (i.e. 3.435 Å and 3.635 Å)
indicating relatively more hindrance at one side in 1. In 25 this distance is almost
identical (i.e. 3.594 Å and 3.634 Å) indicating equal hindrance at both axial sides.
However, these distances are slightly longer than observed for picoplatin (3.224 Å) and
phenanthriplatin (3.220 Å) [3]. In other complexes the Pt···C distances are 3.616 (2) and
3.670 Å (6), along with insignificant complementary axial hindrance due to the ring
orientations. Thus, complex 1 is expected to be more inert for substitution reactions
because of greater and dual steric hindrance.
4.2 Crystal packing
These complexes provide an ideal platform to perceive the effect of various weak CH···X
[X = O, F, Cl and π] non-covalent interactions on the solid-state self-assembly
particularly in the absence of strong hydrogen bonds [5-14]. The crystal structure of
monofunctional complexes (1, 2, 6 and 25) revealed 3D-networks, composed of various
1D-supramolecular chains stabilized by variety of weak non-covalent interactions. The
molecules are arranged in head to head fashion in 1D-chains of compound 1 stabilized by
C-H···F [(C(18)-H(18)···F(2A) 2.529 Å, (C(17)-H(17)···F(2A) 2.648 Å, (C(30)-
H(30)···F(2A) 2.622 Å], C-H···O [(C(15)-H(15)···O(1) 2.705 Å] and C-H···π [(C(15)-
H(15)···C(9) 2.884 Å, (C(14)-H(14)···C(10) 2.825 Å] interactions (Fig. 4.4a, Table 4.5),
antiparallel fashion in compound 2 stabilized by C-H···Cl [(C(18)-H(18)···Cl(4) 2.889 Å,
(C(11)-H(11)···Cl(1) 2.768 Å] and C-H···π [(C(23)-H(23)···C(10) 2.882 Å, (C(23)-
H(23)···C(11) 2.881 Å] interactions (Fig. 4.4b, Table 4.5), slightly displaced antiparallel
fashion in compound 6 stabilized by C-H···F [(C(24)-H(24)···F(2) 2.434 Å], C-H···S
[(C(9)-H(9)···S(1) 2.901 Å] and C-H···π [(C(9)-H(9)···C(1) 2.876 Å, (C(10)-
H(10)···C(18) 2.846 Å] interactions (Fig. 4.4c, Table 4.5) and parallel fashion in
compound 25 stabilized by C-H···Cl [(C(2)-H(2A)···Cl(1) 2.889 Å], C-H···S [(C(3)-
H(3A)···S(2) 2.975 Å], C-H···π [(C(5)-H(5B)···C(11) 2.844 Å], π···π [(C(5)···C(11)
3.341 Å] and F···π [(F(3)···C(15) 2.993 Å] interactions (Fig. 4.4d, Table 4.5).
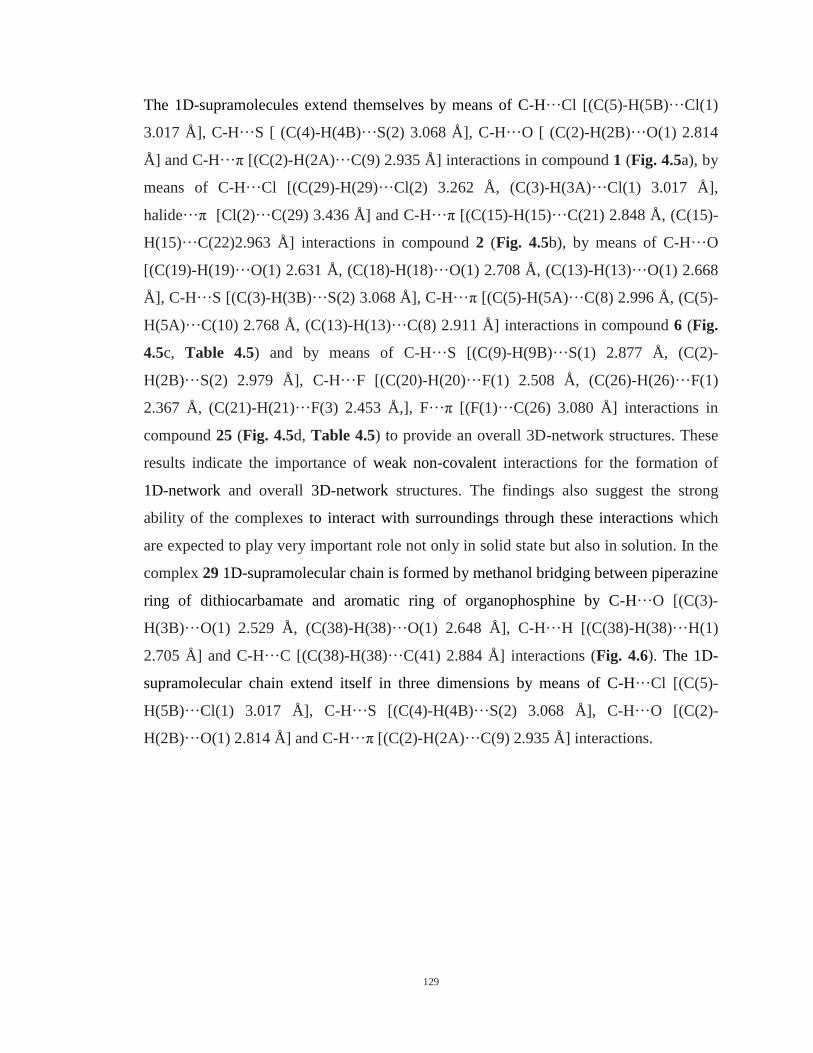
129
The 1D-supramolecules extend themselves by means of C-H···Cl [(C(5)-H(5B)···Cl(1)
3.017 Å], C-H···S [ (C(4)-H(4B)···S(2) 3.068 Å], C-H···O [ (C(2)-H(2B)···O(1) 2.814
Å] and C-H···π [(C(2)-H(2A)···C(9) 2.935 Å] interactions in compound 1 (Fig. 4.5a), by
means of C-H···Cl [(C(29)-H(29)···Cl(2) 3.262 Å, (C(3)-H(3A)···Cl(1) 3.017 Å],
halide···π [Cl(2)···C(29) 3.436 Å] and C-H···π [(C(15)-H(15)···C(21) 2.848 Å, (C(15)-
H(15)···C(22)2.963 Å] interactions in compound 2 (Fig. 4.5b), by means of C-H···O
[(C(19)-H(19)···O(1) 2.631 Å, (C(18)-H(18)···O(1) 2.708 Å, (C(13)-H(13)···O(1) 2.668
Å], C-H···S [(C(3)-H(3B)···S(2) 3.068 Å], C-H···π [(C(5)-H(5A)···C(8) 2.996 Å, (C(5)-
H(5A)···C(10) 2.768 Å, (C(13)-H(13)···C(8) 2.911 Å] interactions in compound 6 (Fig.
4.5c, Table 4.5) and by means of C-H···S [(C(9)-H(9B)···S(1) 2.877 Å, (C(2)-
H(2B)···S(2) 2.979 Å], C-H···F [(C(20)-H(20)···F(1) 2.508 Å, (C(26)-H(26)···F(1)
2.367 Å, (C(21)-H(21)···F(3) 2.453 Å,], F···π [(F(1)···C(26) 3.080 Å] interactions in
compound 25 (Fig. 4.5d, Table 4.5) to provide an overall 3D-network structures. These
results indicate the importance of weak non-covalent interactions for the formation of
1D-network and overall 3D-network structures. The findings also suggest the strong
ability of the complexes to interact with surroundings through these interactions which
are expected to play very important role not only in solid state but also in solution. In the
complex 29 1D-supramolecular chain is formed by methanol bridging between piperazine
ring of dithiocarbamate and aromatic ring of organophosphine by C-H···O [(C(3)-
H(3B)···O(1) 2.529 Å, (C(38)-H(38)···O(1) 2.648 Å], C-H···H [(C(38)-H(38)···H(1)
2.705 Å] and C-H···C [(C(38)-H(38)···C(41) 2.884 Å] interactions (Fig. 4.6). The 1D-
supramolecular chain extend itself in three dimensions by means of C-H···Cl [(C(5)-
H(5B)···Cl(1) 3.017 Å], C-H···S [(C(4)-H(4B)···S(2) 3.068 Å], C-H···O [(C(2)-
H(2B)···O(1) 2.814 Å] and C-H···π [(C(2)-H(2A)···C(9) 2.935 Å] interactions.
130
Figure 4.3: Crystal structures of the complexes (1, 2, 6 and 25) showing steric hindrance
from aromatic C-H groups of organophosphine, C-Pt distance (black), H-Pt
distance (red).
3.634Å
3.594Å
3.135Å
3.059Å
(25)
3.67Å 3.16Å
(6)
3.635Å
3.435Å
3.076Å
2.851Å
3.616Å
3.112Å
(1) (2)
131
(a) (b)
(c) (d)
Figure 4.4: 1D-supramolecular chains in 3D-crystal packing of 1, 2, 6 and 25.
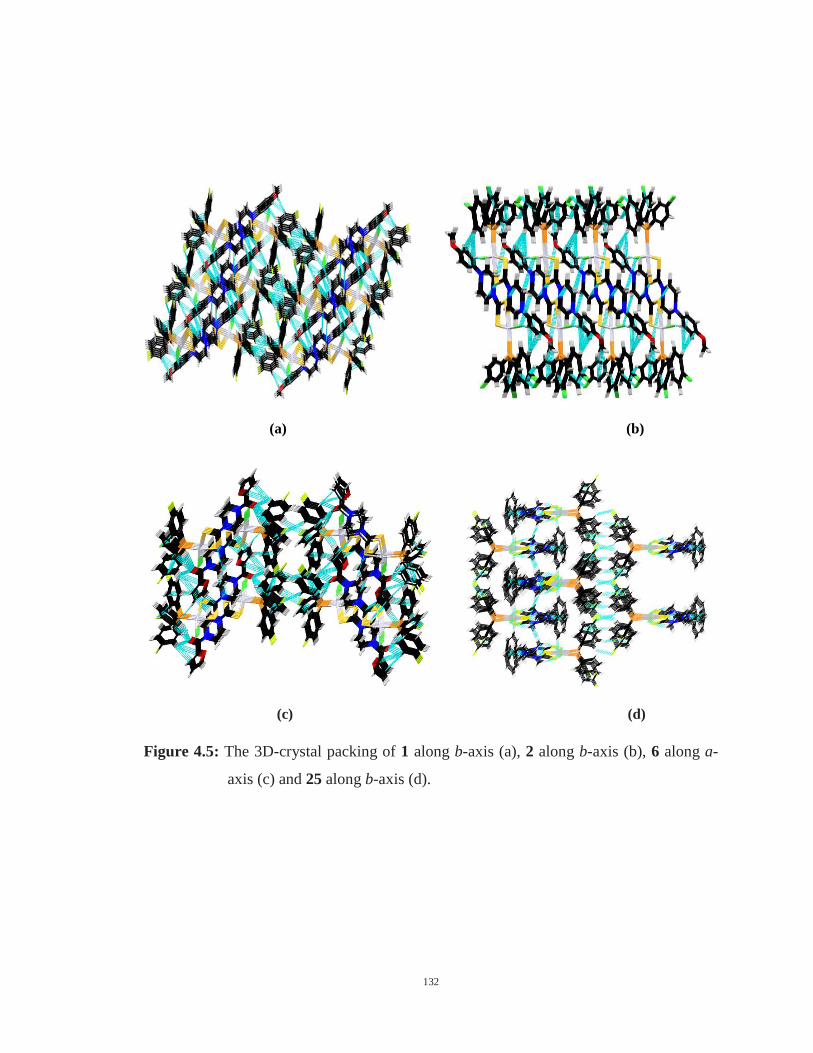
132
(a) (b)
(c)
(d)
Figure 4.5: The 3D-crystal packing of 1 along b-axis (a), 2 along b-axis (b), 6 along a-
axis (c) and 25 along b-axis (d).
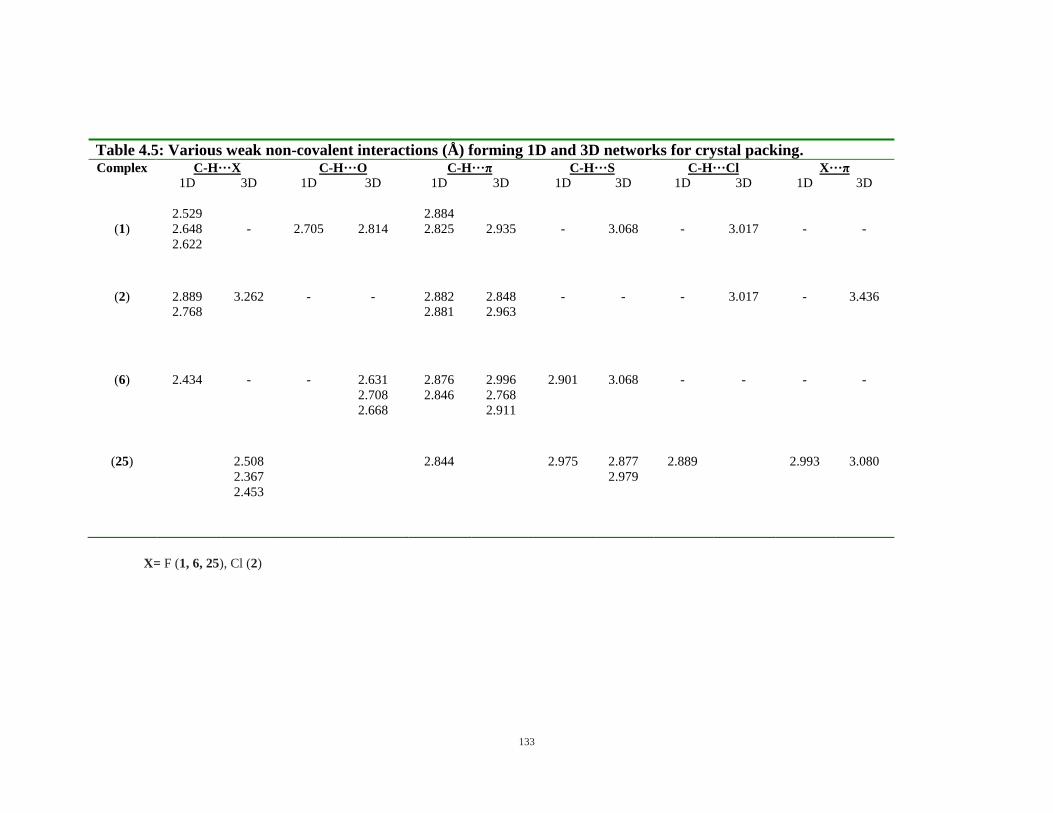
133
X= F (1, 6, 25), Cl (2)
Table 4.5: Various weak non-covalent interactions (Å) forming 1D and 3D networks for crystal packing. Complex C-H···X C-H···O C-H···π C-H···S C-H···Cl X···π
(1)
1D 3D 1D 3D 1D 3D
1D 3D 1D 3D 1D 3D
2.529
2.648
2.622
-
2.705
2.814
2.884
2.825
2.935
-
3.068
-
3.017
-
-
(2)
2.889
2.768
3.262
-
-
2.882
2.881
2.848
2.963
-
-
-
3.017
-
3.436
(6)
2.434
-
-
2.631
2.708
2.668
2.876
2.846
2.996
2.768
2.911
2.901
3.068
-
-
-
-
(25) 2.508
2.367
2.453
2.844 2.975 2.877
2.979
2.889 2.993 3.080
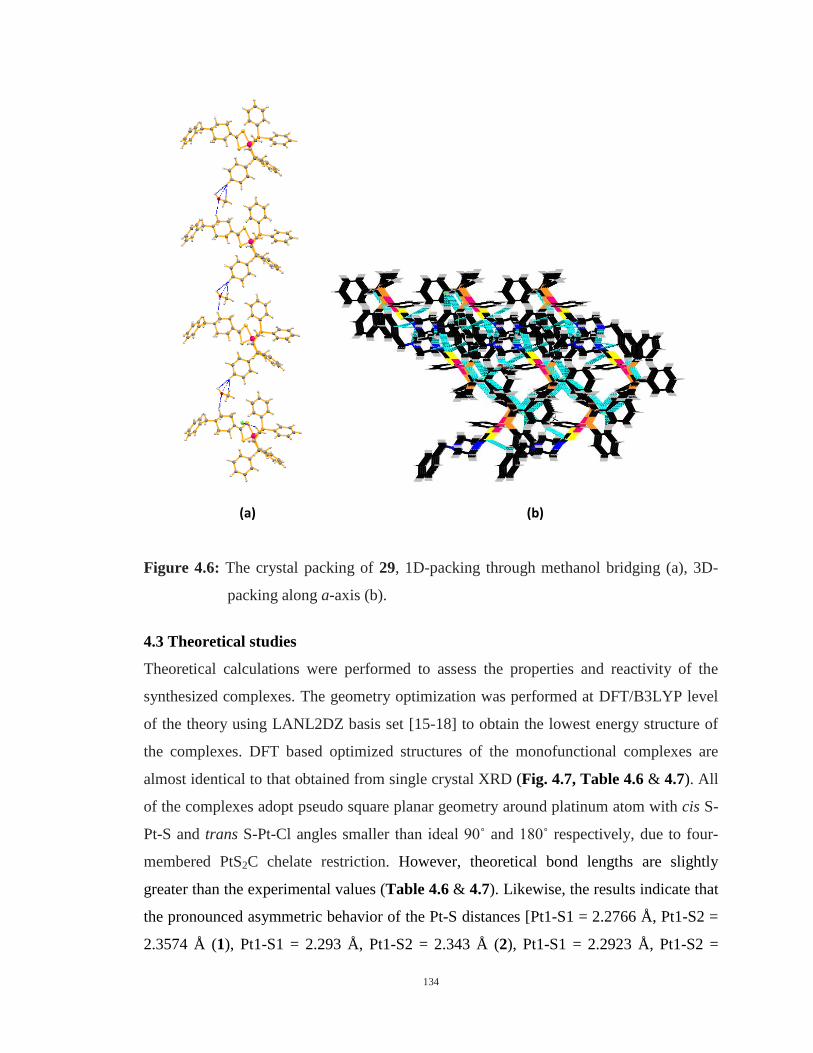
134
(a) (b)
Figure 4.6: The crystal packing of 29, 1D-packing through methanol bridging (a), 3D-
packing along a-axis (b).
4.3 Theoretical studies
Theoretical calculations were performed to assess the properties and reactivity of the
synthesized complexes. The geometry optimization was performed at DFT/B3LYP level
of the theory using LANL2DZ basis set [15-18] to obtain the lowest energy structure of
the complexes. DFT based optimized structures of the monofunctional complexes are
almost identical to that obtained from single crystal XRD (Fig. 4.7, Table 4.6 & 4.7). All
of the complexes adopt pseudo square planar geometry around platinum atom with cis S-
Pt-S and trans S-Pt-Cl angles smaller than ideal 0˚ and 80˚ respectively, due to four-
membered PtS2C chelate restriction. However, theoretical bond lengths are slightly
greater than the experimental values (Table 4.6 & 4.7). Likewise, the results indicate that
the pronounced asymmetric behavior of the Pt-S distances [Pt1-S1 = 2.2766 Å, Pt1-S2 =
2.3574 Å (1), Pt1-S1 = 2.293 Å, Pt1-S2 = 2.343 Å (2), Pt1-S1 = 2.2923 Å, Pt1-S2 =
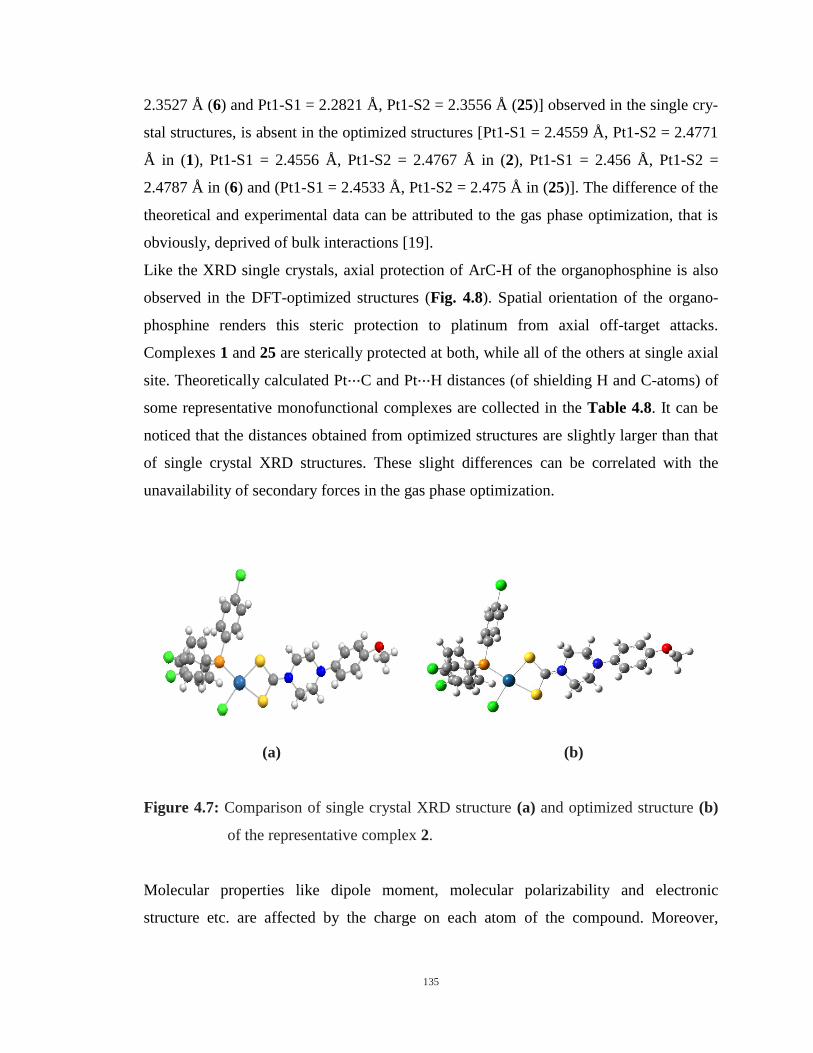
135
2.3527 Å (6) and Pt1-S1 = 2.2821 Å, Pt1-S2 = 2.3556 Å (25)] observed in the single cry-
stal structures, is absent in the optimized structures [Pt1-S1 = 2.4559 Å, Pt1-S2 = 2.4771
Å in (1), Pt1-S1 = 2.4556 Å, Pt1-S2 = 2.4767 Å in (2), Pt1-S1 = 2.456 Å, Pt1-S2 =
2.4787 Å in (6) and (Pt1-S1 = 2.4533 Å, Pt1-S2 = 2.475 Å in (25)]. The difference of the
theoretical and experimental data can be attributed to the gas phase optimization, that is
obviously, deprived of bulk interactions [19].
Like the XRD single crystals, axial protection of ArC-H of the organophosphine is also
observed in the DFT-optimized structures (Fig. 4.8). Spatial orientation of the organo-
phosphine renders this steric protection to platinum from axial off-target attacks.
Complexes 1 and 25 are sterically protected at both, while all of the others at single axial
site. Theoretically calculated Pt···C and Pt···H distances (of shielding H and C-atoms) of
some representative monofunctional complexes are collected in the Table 4.8. It can be
noticed that the distances obtained from optimized structures are slightly larger than that
of single crystal XRD structures. These slight differences can be correlated with the
unavailability of secondary forces in the gas phase optimization.
(a) (b)
Figure 4.7: Comparison of single crystal XRD structure (a) and optimized structure (b)
of the representative complex 2.
Molecular properties like dipole moment, molecular polarizability and electronic
structure etc. are affected by the charge on each atom of the compound. Moreover,
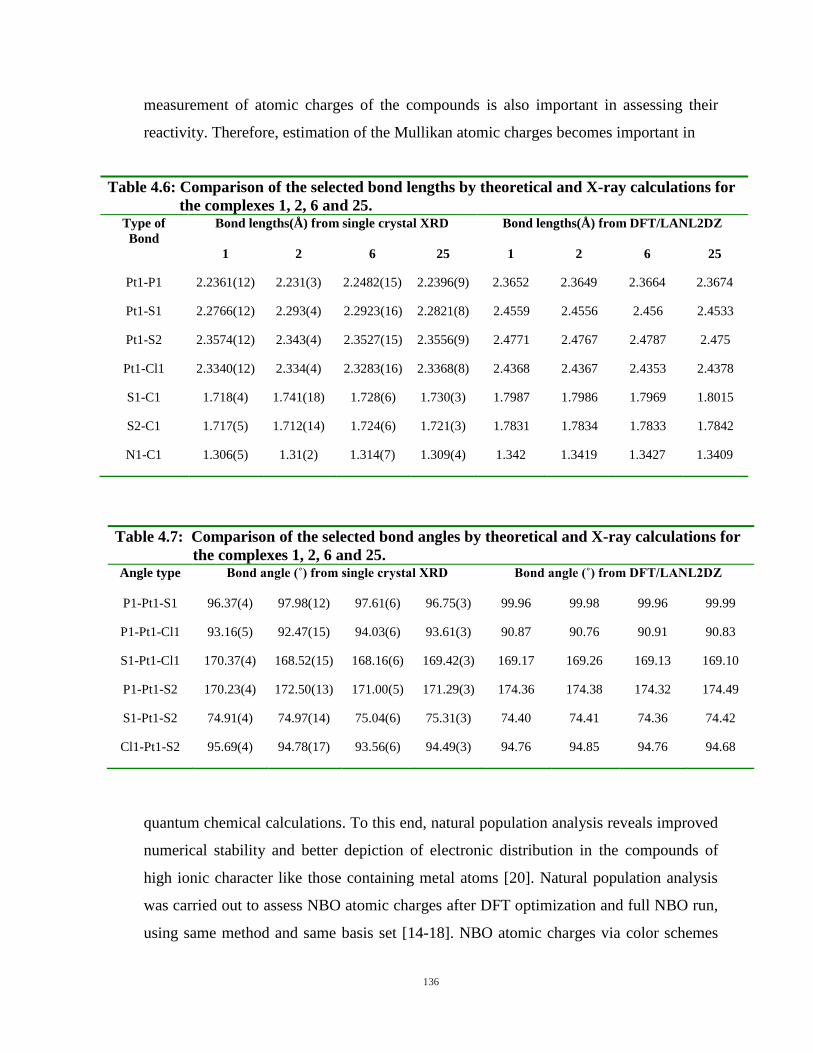
136
measurement of atomic charges of the compounds is also important in assessing their
reactivity. Therefore, estimation of the Mullikan atomic charges becomes important in
quantum chemical calculations. To this end, natural population analysis reveals improved
numerical stability and better depiction of electronic distribution in the compounds of
high ionic character like those containing metal atoms [20]. Natural population analysis
was carried out to assess NBO atomic charges after DFT optimization and full NBO run,
using same method and same basis set [14-18]. NBO atomic charges via color schemes
Table 4.6: Comparison of the selected bond lengths by theoretical and X-ray calculations for
the complexes 1, 2, 6 and 25. Type of
Bond
Bond lengths(Å) from single crystal XRD
Bond lengths(Å) from DFT/LANL2DZ
1 2 6 25 1 2 6 25
Pt1-P1 2.2361(12) 2.231(3) 2.2482(15) 2.2396(9) 2.3652 2.3649 2.3664 2.3674
Pt1-S1 2.2766(12) 2.293(4) 2.2923(16) 2.2821(8) 2.4559 2.4556 2.456 2.4533
Pt1-S2 2.3574(12) 2.343(4) 2.3527(15) 2.3556(9) 2.4771 2.4767 2.4787 2.475
Pt1-Cl1 2.3340(12) 2.334(4) 2.3283(16) 2.3368(8) 2.4368 2.4367 2.4353 2.4378
S1-C1 1.718(4) 1.741(18) 1.728(6) 1.730(3) 1.7987 1.7986 1.7969 1.8015
S2-C1 1.717(5) 1.712(14) 1.724(6) 1.721(3) 1.7831 1.7834 1.7833 1.7842
N1-C1 1.306(5) 1.31(2) 1.314(7) 1.309(4) 1.342 1.3419 1.3427 1.3409
Table 4.7: Comparison of the selected bond angles by theoretical and X-ray calculations for
the complexes 1, 2, 6 and 25. Angle type
Bond angle (˚) from single crystal XRD
Bond angle (˚) from DFT/LANL2DZ
P1-Pt1-S1 96.37(4) 97.98(12) 97.61(6) 96.75(3) 99.96 99.98 99.96 99.99
P1-Pt1-Cl1 93.16(5) 92.47(15) 94.03(6) 93.61(3) 90.87 90.76 90.91 90.83
S1-Pt1-Cl1 170.37(4) 168.52(15) 168.16(6) 169.42(3) 169.17 169.26 169.13 169.10
P1-Pt1-S2 170.23(4) 172.50(13) 171.00(5) 171.29(3) 174.36 174.38 174.32 174.49
S1-Pt1-S2 74.91(4) 74.97(14) 75.04(6) 75.31(3) 74.40 74.41 74.36 74.42
Cl1-Pt1-S2 95.69(4) 94.78(17) 93.56(6) 94.49(3) 94.76 94.85 94.76 94.68
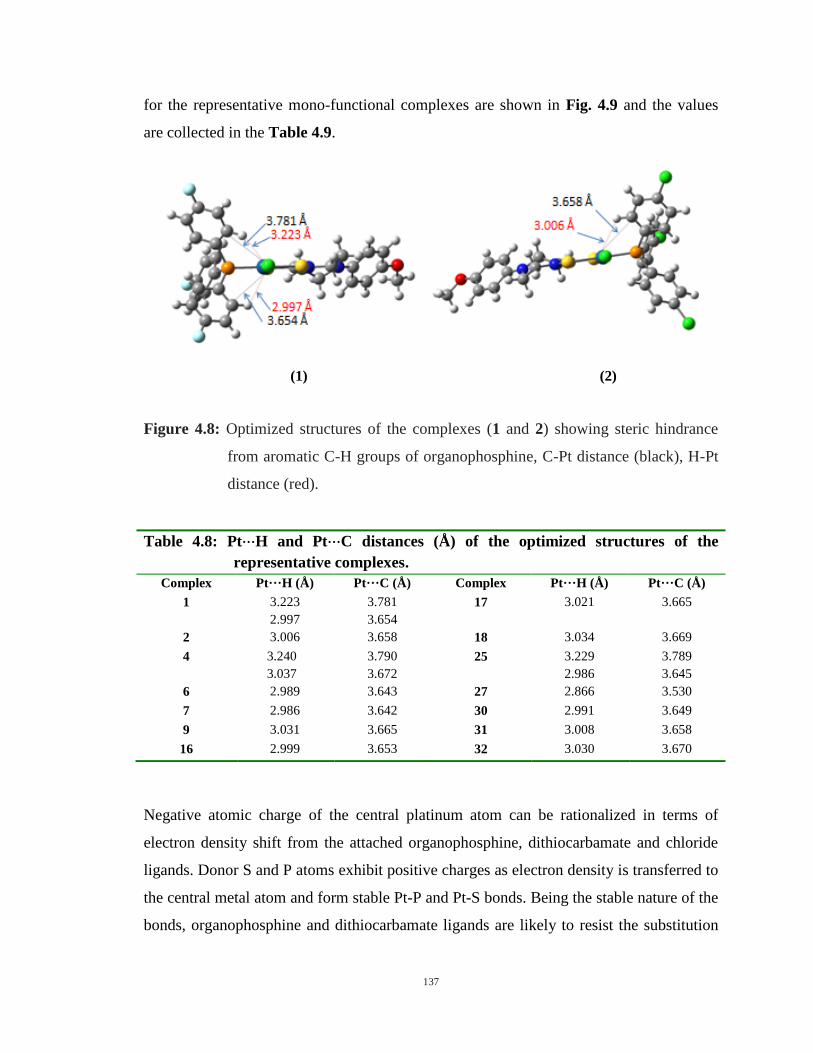
137
for the representative mono-functional complexes are shown in Fig. 4.9 and the values
are collected in the Table 4.9.
(1) (2)
Figure 4.8: Optimized structures of the complexes (1 and 2) showing steric hindrance
from aromatic C-H groups of organophosphine, C-Pt distance (black), H-Pt
distance (red).
Table 4.8: Pt···H and Pt···C distances (Å) of the optimized structures of the
representative complexes.
Complex Pt···H (Å) Pt···C (Å) Complex Pt···H (Å) Pt···C (Å)
1 3.223
2.997
3.781
3.654
17 3.021 3.665
2 3.006 3.658 18 3.034 3.669
4 3.240
3.037
3.790
3.672
25 3.229
2.986
3.789
3.645
6 2.989 3.643 27 2.866 3.530
7 2.986 3.642 30 2.991 3.649
9 3.031 3.665 31 3.008 3.658
16 2.999 3.653 32 3.030 3.670
Negative atomic charge of the central platinum atom can be rationalized in terms of
electron density shift from the attached organophosphine, dithiocarbamate and chloride
ligands. Donor S and P atoms exhibit positive charges as electron density is transferred to
the central metal atom and form stable Pt-P and Pt-S bonds. Being the stable nature of the
bonds, organophosphine and dithiocarbamate ligands are likely to resist the substitution
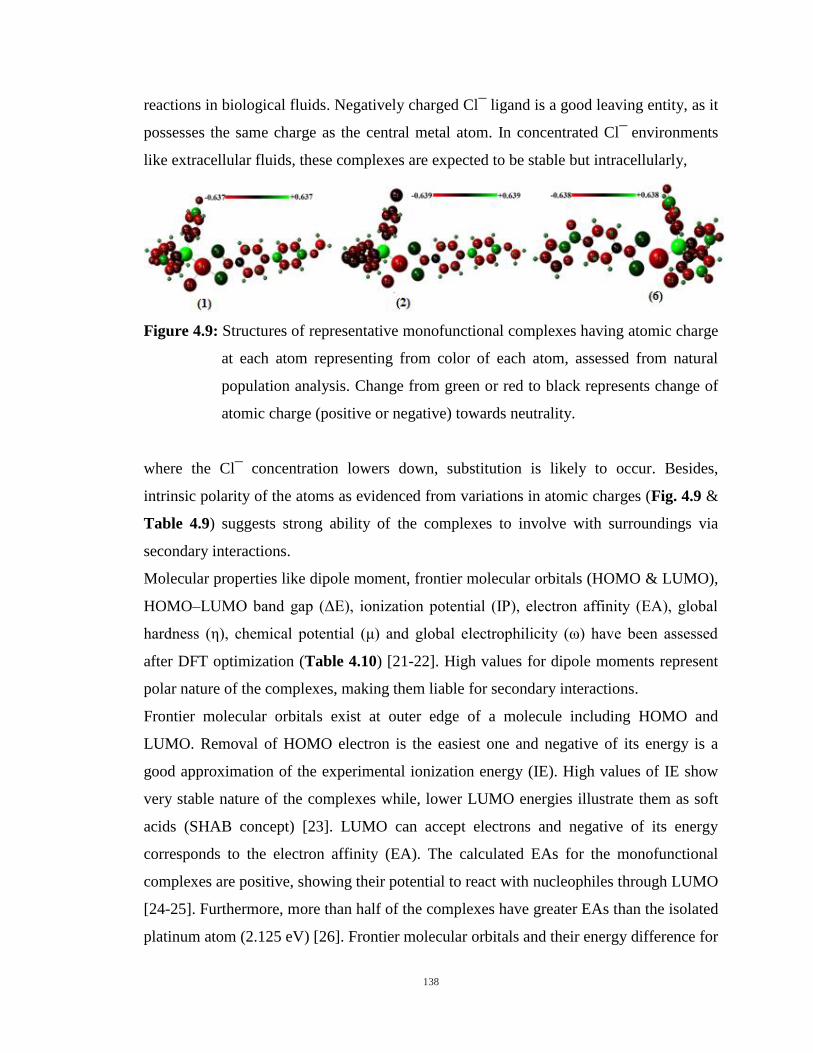
138
reactions in biological fluids. Negatively charged Cl¯ ligand is a good leaving entity, as it
possesses the same charge as the central metal atom. In concentrated Cl¯ environments
like extracellular fluids, these complexes are expected to be stable but intracellularly,
Figure 4.9: Structures of representative monofunctional complexes having atomic charge
at each atom representing from color of each atom, assessed from natural
population analysis. Change from green or red to black represents change of
atomic charge (positive or negative) towards neutrality.
where the Cl¯ concentration lowers down, substitution is likely to occur. Besides,
intrinsic polarity of the atoms as evidenced from variations in atomic charges (Fig. 4.9 &
Table 4.9) suggests strong ability of the complexes to involve with surroundings via
secondary interactions.
Molecular properties like dipole moment, frontier molecular orbitals (HOMO & LUMO),
HOMO–LUMO band gap ΔE , ionization potential IP , electron affinity EA , global
hardness η , chemical potential μ and global electrophilicity ω have been assessed
after DFT optimization (Table 4.10) [21-22]. High values for dipole moments represent
polar nature of the complexes, making them liable for secondary interactions.
Frontier molecular orbitals exist at outer edge of a molecule including HOMO and
LUMO. Removal of HOMO electron is the easiest one and negative of its energy is a
good approximation of the experimental ionization energy (IE). High values of IE show
very stable nature of the complexes while, lower LUMO energies illustrate them as soft
acids (SHAB concept) [23]. LUMO can accept electrons and negative of its energy
corresponds to the electron affinity (EA). The calculated EAs for the monofunctional
complexes are positive, showing their potential to react with nucleophiles through LUMO
[24-25]. Furthermore, more than half of the complexes have greater EAs than the isolated
platinum atom (2.125 eV) [26]. Frontier molecular orbitals and their energy difference for
139
the representative monofunctional complexes are shown in Fig. 4.10 & Table 4.10. Large
energy difference is an indication of stable nature of the complexes [27]. Chemical
potential evaluated for the complexes show their ability to undergo spontaneous
reactions. The chemical potential can also be correlated with the structures i.e. complexes
with ArC-H protected platinum center from both the axial sites, have low potential to
undergo spontaneous reactions and vice versa for the one side shielded complexes.
Figure 4.10: Frontier orbitals of the representative complexes showing energy difference
between HOMO and LUMO orbitals.
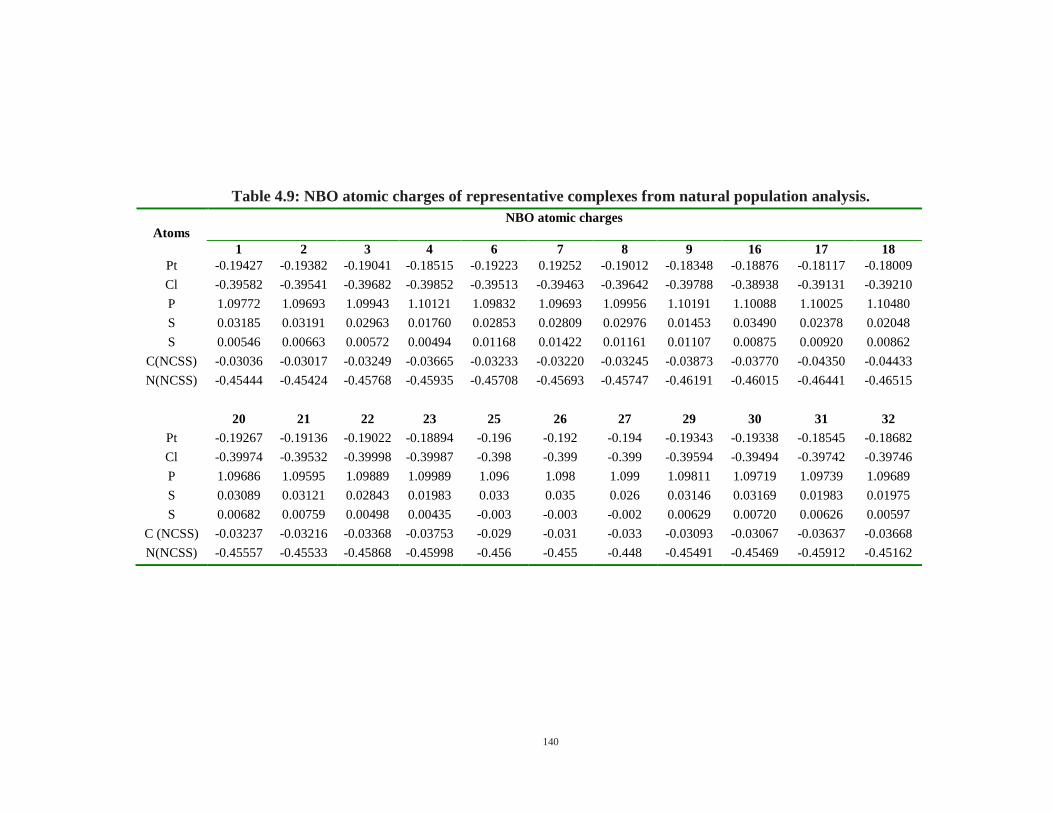
140
Table 4.9: NBO atomic charges of representative complexes from natural population analysis.
Atoms
NBO atomic charges
1 2 3 4 6 7 8 9 16 17 18
Pt -0.19427 -0.19382 -0.19041 -0.18515 -0.19223 0.19252 -0.19012 -0.18348 -0.18876 -0.18117 -0.18009
Cl -0.39582 -0.39541 -0.39682 -0.39852 -0.39513 -0.39463 -0.39642 -0.39788 -0.38938 -0.39131 -0.39210
P 1.09772 1.09693 1.09943 1.10121 1.09832 1.09693 1.09956 1.10191 1.10088 1.10025 1.10480
S 0.03185 0.03191 0.02963 0.01760 0.02853 0.02809 0.02976 0.01453 0.03490 0.02378 0.02048
S 0.00546 0.00663 0.00572 0.00494 0.01168 0.01422 0.01161 0.01107 0.00875 0.00920 0.00862
C(NCSS) -0.03036 -0.03017 -0.03249 -0.03665 -0.03233 -0.03220 -0.03245 -0.03873 -0.03770 -0.04350 -0.04433
N(NCSS) -0.45444 -0.45424 -0.45768 -0.45935 -0.45708 -0.45693 -0.45747 -0.46191 -0.46015 -0.46441 -0.46515
20 21 22 23 25 26 27 29 30 31 32
Pt -0.19267 -0.19136 -0.19022 -0.18894 -0.196 -0.192 -0.194 -0.19343 -0.19338 -0.18545 -0.18682
Cl -0.39974 -0.39532 -0.39998 -0.39987 -0.398 -0.399 -0.399 -0.39594 -0.39494 -0.39742 -0.39746
P 1.09686 1.09595 1.09889 1.09989 1.096 1.098 1.099 1.09811 1.09719 1.09739 1.09689
S 0.03089 0.03121 0.02843 0.01983 0.033 0.035 0.026 0.03146 0.03169 0.01983 0.01975
S 0.00682 0.00759 0.00498 0.00435 -0.003 -0.003 -0.002 0.00629 0.00720 0.00626 0.00597
C (NCSS) -0.03237 -0.03216 -0.03368 -0.03753 -0.029 -0.031 -0.033 -0.03093 -0.03067 -0.03637 -0.03668
N(NCSS) -0.45557 -0.45533 -0.45868 -0.45998 -0.456 -0.455 -0.448 -0.45491 -0.45469 -0.45912 -0.45162
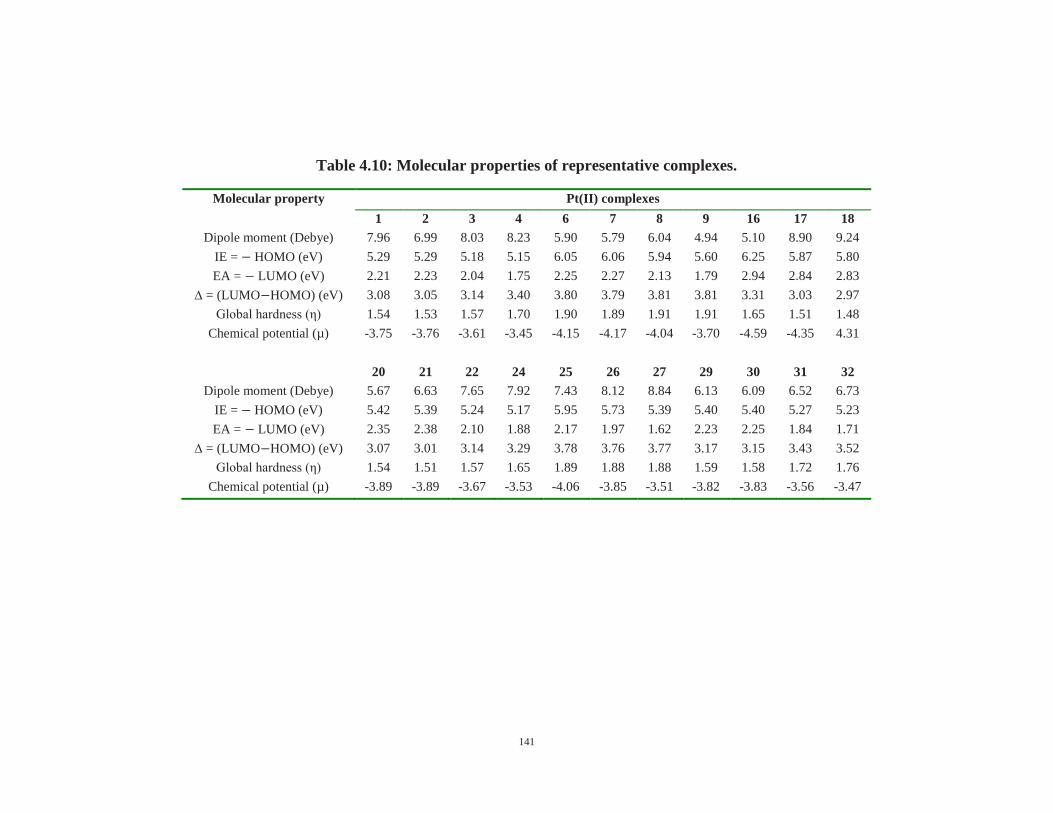
141
Table 4.10: Molecular properties of representative complexes.
Molecular property Pt(II) complexes
1 2 3 4 6 7 8 9 16 17 18
Dipole moment (Debye) 7.96 6.99 8.03 8.23 5.90 5.79 6.04 4.94 5.10 8.90 9.24
IE = HOMO (eV) 5.29 5.29 5.18 5.15 6.05 6.06 5.94 5.60 6.25 5.87 5.80
EA = LUMO (eV) 2.21 2.23 2.04 1.75 2.25 2.27 2.13 1.79 2.94 2.84 2.83
∆ = (LUMO HOMO) (eV) 3.08 3.05 3.14 3.40 3.80 3.79 3.81 3.81 3.31 3.03 2.97
Global hardness η 1.54 1.53 1.57 1.70 1.90 1.89 1.91 1.91 1.65 1.51 1.48
Chemical potential (µ) -3.75 -3.76 -3.61 -3.45 -4.15 -4.17 -4.04 -3.70 -4.59 -4.35 4.31
20 21 22 24 25 26 27 29 30 31 32
Dipole moment (Debye) 5.67 6.63 7.65 7.92 7.43 8.12 8.84 6.13 6.09 6.52 6.73
IE = HOMO (eV) 5.42 5.39 5.24 5.17 5.95 5.73 5.39 5.40 5.40 5.27 5.23
EA = LUMO (eV) 2.35 2.38 2.10 1.88 2.17 1.97 1.62 2.23 2.25 1.84 1.71
∆ = (LUMO HOMO) (eV) 3.07 3.01 3.14 3.29 3.78 3.76 3.77 3.17 3.15 3.43 3.52
Global hardness η 1.54 1.51 1.57 1.65 1.89 1.88 1.88 1.59 1.58 1.72 1.76
Chemical potential (µ) -3.89 -3.89 -3.67 -3.53 -4.06 -3.85 -3.51 -3.82 -3.83 -3.56 -3.47
142
REFERENCES
1. Khan, H.; Badshah, A.; Murtaz, G.; Said, M.; Neuhausen, C.; Todorova, M.; Jean-
Claude, B. J.; Butler, I. S., Synthesis, characterization and anticancer studies of
mixed ligand dithiocarbamate palladium (II) complexes, Eur. J. Med. Chem.
2011, 46, 4071-4077.
2. Muhammad, N.; Shuja, S.; Ali, S.; Butler, I. S.; Meetsma, A.; Khan, M., New
dimeric, trimeric and supramolecular organotin (IV) dithiocarboxylates:
Synthesis, structural characterization and biocidal activities Polyhedron 2009, 28 ,
3439-3448.
3. Park, G. Y.; Wilson, J. J.; Song, Y.; Lippard, S. J., Phenanthriplatin, a
monofunctional DNA-binding platinum anticancer drug candidate with unusual
potency and cellular activity profile, Proc. Natl. Acad. Sci. USA 2012, 109,
11987-11992.
4. Chen, Y.; Guo, Z.; Parsons, S.; Sadler, P. J., Stereospecific and kinetic control
over the hydrolysis of a sterically hindered platinum picoline anticancer complex,
Chem. Eur. J. 1998, 4 (4), 672-676.
5. Laungani, A. C.; Keller, M.; Slattery, J. M.; Krossing, I.; Breit, B., Cooperative
Effect of a Classical and a Weak Hydrogen Bond for the Metal‐Induced
Construction of a Self‐Assembled β‐Turn Mimic, Chem. Eur. J. 2009, 15, 10405-
10422.
6. Howard, J. A.; Hoy, V. J.; O'Hagan, D.; Smith, G. T., How good is fluorine as a
hydrogen bond acceptor, Tetrahedron 1996, 52, 12613-12622.
7. Thalladi, V. R.; Weiss, H.-C.; Bläser, D.; Boese, R.; Nangia, A.; Desiraju, G. R.,
C− H···F Interactions in the Crystal Structures of Some Fluorobenzenes, J. Am.
Chem. Soc. 1998, 120, 8702-8710.
8. Dunitz, J. D.; Taylor, R., Organic fluorine hardly ever accepts hydrogen bonds,
Chem. Eur. J. 1997, 3, 89-98.
9. Pervez, H.; Ahmad, M.; Hadda, T. B.; Toupet, L.; Naseer, M. M., Synthesis and
fluorine-mediated interactions in methanol-encapsulated solid state self-assembly
of an isatin-thiazoline hybrid, J. Mol. Struct. 2015, 1098, 124-129.
143
10. Hameed, A.; Shafiq, Z.; Yaqub, M.; Hussain, M.; Ahmad, H. B.; Tahir, M. N.;
Naseer, M. M., Robustness of a thioamide {⋯ H–N–C [double bond, length as m-
dash] S} 2 synthon: synthesis and the effect of substituents on the formation of
layered to cage-like supramolecular networks in coumarin–thiosemicarbazone
hybrids, New J. Chem. 2015, 39, 6052-6061.
11. Jawaria, R.; Hussain, M.; Shafiq, Z.; Ahmad, H. B.; Tahir, M. N.; Shad, H. A.;
Naseer, M. M., Robustness of thioamide dimer synthon, carbon bonding and
thioamide–thioamide stacking in ferrocene-based thiosemicarbazones,
CrystEngComm 2015, 17, 2553-2561.
12. Anam, F.; Abbas, A.; Lo, K. M.; Hameed, S.; Naseer, M. M., Homologous 1, 3,
5-triarylpyrazolines: synthesis, CH⋯ π interactions guided self-assembly and
effect of alkyloxy chain length on DNA binding properties, New J. Chem. 2014,
38, 5617-5625.
13. Ahmad, M.; Pervez, H.; Hadda, T. B.; Toupet, L.; Naseer, M. M., Synthesis and
solid state self-assembly of an isatin–thiazoline hybrid driven by three self-
complementary dimeric motifs, Tetrahedron Lett. 2014, 55, 5400-5403.
14. Naseer, M. M.; Hameed, S., Layer-by-layer assembly of supramolecular
hexagonal blocks driven by CH–π and π–π interactions, CrystEngComm 2012, 14,
4247-4250.
15. Frisch, M.; Trucks, G.; Schlegel, H. B.; Scuseria, G.; Robb, M.; Cheeseman, J.;
Scalmani, G.; Barone, V.; Mennucci, B.; Petersson, G., Gaussian 09, revision a.
02, gaussian. Inc., Wallingford, CT 2009, 200.
16. Frisch, A.; Nielsen, A.; Holder, A., GAUSSIANVIEW Users Manual, Gaussian
Inc., Pittsburgh PA, 2000.
17. Abdel-Ghani, N.; Mansour, A., Molecular structures of antitumor active Pd (II)
and Pt (II) complexes of N, N-donor benzimidazole methyl ester, J. Coord.
Chem. 2012, 65, 763-779.
18. Zhang, G.; Musgrave, C. B., Comparison of DFT methods for molecular orbital
eigenvalue calculations, J. Phys. Chem. A 2007, 111, 1554-1561.
144
19. Sathiyaraj, E.; Gurumoorthy, G.; Thirumaran, S., Nickel (II) dithiocarbamate
complexes containing the pyrrole moiety for sensing anions and synthesis of
nickel sulfide and nickel oxide nanoparticles, New J. Chem. 2015, 39, 5336-5349.
20. Reed, A. E.; Weinstock, R. B.; Weinhold, F., Natural population analysis, J.
Chem. Phys. 1985, 83, 735-746.
21. Khan, S. Z.; Amir, M. K.; Ullah, I.; Aamir, A.; Pezzuto, J. M.; Kondratyuk, T.;
Bélanger‐Gariepy, F.; Ali, A.; Khan, S.; Zia-ur-Rehman, New heteroleptic
palladium (II) dithiocarbamates: synthesis, characterization, packing and
anticancer activity against five different cancer cell lines. Appl. Organomet.
Chem. 2016, 6, 392-398.
22. Shahabadi, N.; Falsafi, M., Experimental and molecular docking studies on DNA
binding interaction of adefovir dipivoxil: Advances toward treatment of hepatitis
B virus infections, Spectrochim. Acta, Part A, 2014, 125, 154-159.
23. Miessler, G. L.; Tarr, D. A., Inorganic Chemistry, 2nd ed. Prentice-Hall 1999,
p.181-185.
24. IUPAC, Compendium of Chemical Terminology, 2nd
ed. (the "Gold Book")
(1997), Online corrected version: (2006) "Electron affinity".
25. Andersen, T., Atomic negative ions: structure, dynamics and collisions, Phys.
Rep. 2004, 394, 157-313.
26. Bilodeau, R. C.; Scheer, M.; Haugen, H. K.; Brooks, R. L., Near-threshold laser
spectroscopy of iridium and platinum negative ions: Electron affinities and the
threshold law, Phys.Rev. A 1999, 61, 012505.
27. Toosy, N. K. A.; Raissi, H.; Zaboli, M., Theoretical calculations of intramolecular
hydrogen bond of the 2-Amino-2, 4, 6-cycloheptatrien-1-one in the gas phase and
solution: Substituent effects and their positions, J. Theor. Comput. Chem. 2016,
15, 1650063.
145
CONCLUSION
New heteroleptic platinum(II) dithiocarbamates have been synthesized and characterized
by different analytical techniques such as elemental analysis, FT-IR, multinuclear (1H,
13C and
31P) NMR and X-ray single crystal analysis along with DFT calculations. In the
FT-IR spectra, the presence of Pt-S peak (345-390 cm-1
) and an increase in the stretching
frequency for C-N (1479-1540 cm-1
) upon complexation than the free ligands (1433-1474
cm-1
) indicated the platinum-dithiocarbamate coordination. The Pt-Cl, only in mono-
functional complexes, and Pt-P peaks were observed at 273-316 cm-1
and 211-240 cm-1
,
respectively. Additionally, complexes formation was further confirmed by the occurrence
of proton resonances for both dithiocarbamate and organophosphine. In 13
C NMR, an
upfield shift in CSS signal of complexes (197.6-211.0 ppm) than the free ligands (212.7-
214.9 ppm) confirmed the Pt-dithiocarbamate coordination. This upfield shift can be
attributed to shielding of the CSS carbon due to mobilization of the nitrogen lone pair
upon complexation. The organophosphine-platinum coordination was assessed by the
downfield shift in 31
P NMR signal than the free organophosphine. The crystal structures
of monofunctional complexes (1, 2, 6 and 25) showed pseudo square planar geometries
imposed by the chelate restriction of dithiocarbamate that also resulted in Pt-Sshort
{2.2766(12) 1; 2.293(4) 2; 2.2923(16) 6, 2.2821(8) 25} and Pt-Slong {2.3574(12) 1;
2.343(4) 2; 2.3527(15) 6, 2.3556(9) 25} bonds. This dissimilarity in Pt-S bonds can also
be attributed to more tran-effect of the organophosphine than chloride. Due to trans-
effect of both phosphorous atoms of the bis-organophosphine, dithiocarbamate ligand in
complex 29 is relatively loosely attached, as established by Pt-S bond lengths, compare to
that in monofunctional complexes (1, 2, 6 and 25). Similarly, the magnitude of
asymmetry is less in 29 {ΔPt-S of 0.0292 Å} than the monofunctional ones {ΔPt-S of
0.0808 Å 1, 0.05 Å 2 0.0604 Å 6, 0.0.0735 Å 25}. The C-S bond lengths are in between
C-S single (1.82 Å) and double (1.60 Å) bonds. Similarly, C-N bond lengths are shorter
than the single (1.47 Å) and longer than the double (1.28 Å) bonds, thus confirming the
resonance phenomenon in NCSS moiety. The packing diagrams suggested that molecules
are self-assembled in solid state via non-covalent (C-H···F, C-H···Cl, C-H···O, C-H···S,
C-H···π, F···π and Cl···π interactions to form fascinating supramolecular architectures.
146
Anticancer screening results against different cancer cell lines revealed that most of the
studied complexes have better anticancer activity than the standard drugs doxorubicin
and cisplatin. Like pyriplatin and phenanthriplatin, steric hindrance from C-H groups of
organophosphine plays an important role for the safe entree of these complexes to the
DNA, a critical target for anticancer Pt-drugs. Furthermore, presence of the lipophilic
substituents in the organophosphines enhances the activity by facilitating the cell
internalization process. Similarly, presence of fluoro moiety not only upsurges the
lipophilicity, but also stabilizes the complex-DNA adduct through H-bonding. The results
of DNA-binding studies indicated that the complexes-DNA interaction is mainly non-
intercalative, ensuing by chloride dissociation. A slow chloride exchange with the bulky
ligands (thiourea and diethyldithiocarbamate) than the smaller ones such as thiocyanate,
bromide and iodide is an indication that these complexes are relatively inert to S-
containing off-target biomolecules. The results of DNA cleavage assay showed that the
conversion of super coiled DNA to nicked circular DNA, and the cleavage ability
increases with concentration.
147
LIST OF PUBLICATIONS
1. Amir, M. K.; Zia-ur-Rehman.; Hayat, F.; Khan, S. Z.; Hogarth, G.;
Kondratyuk, T.; Pezzuto, J. M.; Tahir, M. N., Monofunctional platinum (ii)
dithiocarbamate complexes: synthesis, characterization and anticancer
activity. RSC Advances 2016, 6, 110517-110524.
2. Amir, M. K.; Zia-ur-Rehman.; Khan, S. Z.; Hayat, F.; Hassan, A.; Butler, I.
S., Anticancer activity, DNA-binding and DNA-denaturing aptitude of
palladium (II) dithiocarbamates. Inorganica Chimica Acta 2016, 451, 31-40.
3. Khan, S. Z.; Amir, M. K.; Abbasi, R.; Tahir, M. N.; Zia-ur-Rehman, New 3D
and 2D supramolecular heteroleptic palladium (II) dithiocarbamates as potent
anticancer agents. Journal of Coordination Chemistry 2016, 69, 2999-3009.
4. Khan, S. Z.; Amir, M. K.; Ullah, I.; Aamir, A.; Pezzuto, J. M.; Kondratyuk,
T.; Bélanger‐Gariepy, F.; Ali, A.; Khan, S.; Zia-ur-Rehman, New heteroleptic
palladium (II) dithiocarbamates: synthesis, characterization, packing and
anticancer activity against five different cancer cell lines. Applied
Organometallic Chemistry 2016, 6, 392-398.
5. Khan, S. Z.; Amir, M. K.; Naseer, M. M.; Abbasi, R.; Mazhar, K.; Tahir, M.
N.; Awan, I. Z.; Zia-Ur-Rehman, Heteroleptic Pd (II) dithiocarbamates:
synthesis, characterization, packing and in vitro anticancer activity against
HeLa cell line. Journal of Coordination Chemistry 2015, 68, 2539-2551.
6. Amir, M. K.; Zia-ur-Rehman.; Khan, S.; Shah, A.; Butler, I. S., Anticancer
activity of organotin (IV) carboxylates. Inorganica Chimica Acta 2014, 423,
14-25.


