IZA DP No. 3418 Meta-Analysis of Empirical Evidence on the Labour Market Impacts of Immigration Simonetta Longhi Peter Nijkamp Jacques Poot DISCUSSION PAPER SERIES Forschungsinstitut zur Zukunft der Arbeit Institute for the Study of Labor March 2008
Transcript
IZA DP No. 3418
Meta-Analysis of Empirical Evidence on theLabour Market Impacts of Immigration
Simonetta LonghiPeter NijkampJacques Poot
DI
SC
US
SI
ON
PA
PE
R S
ER
IE
S
Forschungsinstitutzur Zukunft der ArbeitInstitute for the Studyof Labor
March 2008
Meta-Analysis of Empirical Evidence on the Labour Market Impacts of
Any opinions expressed here are those of the author(s) and not those of IZA. Research published in this series may include views on policy, but the institute itself takes no institutional policy positions. The Institute for the Study of Labor (IZA) in Bonn is a local and virtual international research center and a place of communication between science, politics and business. IZA is an independent nonprofit organization supported by Deutsche Post World Net. The center is associated with the University of Bonn and offers a stimulating research environment through its international network, workshops and conferences, data service, project support, research visits and doctoral program. IZA engages in (i) original and internationally competitive research in all fields of labor economics, (ii) development of policy concepts, and (iii) dissemination of research results and concepts to the interested public. IZA Discussion Papers often represent preliminary work and are circulated to encourage discussion. Citation of such a paper should account for its provisional character. A revised version may be available directly from the author.
Meta-Analysis of Empirical Evidence on the Labour Market Impacts of Immigration
The increasing proportion of immigrants in the population of many countries has raised concerns about the ‘absorption capacity’ of the labour market, and fuelled extensive empirical research in countries that attract migrants. In previous papers we synthesized the conclusions of this empirical literature by means of meta-analyses of the impact of immigration on wages and employment of native-born workers. While we have shown that the labour market impacts in terms of wages and employment are rather small, the sample of studies available to generate comparable effect sizes was severely limited by the heterogeneity in study approaches. In the present paper, we take an encompassing approach and consider a broad range of labour market outcomes: wages, employment, unemployment and labour force participation. We compare 45 primary studies published between 1982 and 2007 for a total of 1,572 effect sizes. We trichotomise the various labour market outcomes as benefiting, harming or not affecting the native born, and use an ordered probit model to assess the relationship between this observed impact and key study characteristics such as type of country, methodology, period of investigation and type of migrant. JEL Classification: C51, F22, J31, J61 Keywords: immigration, labour market, factor substitution, comparative research,
meta-analysis Corresponding author: Simonetta Longhi Institute for Social and Economic Research University of Essex Colchester, Essex CO4 3SQ United Kingdom Email: [email protected]
Economic theory alone cannot give a decisive answer about the expected impact of
immigration on the labour market. Careful empirical research is needed because an
influx of migrants triggers a range of responses from local employers, housing and
other markets, native-born and earlier-immigrant households, investors, the public
sector, etc. The answer matters because migration continues to grow globally. While
the total number of people living outside their country of birth is still no more than
about 3 percent of the world population, in many developed countries immigrants
account for more than ten percent of the population and in, for example, the ‘New
World’ countries Canada, Australia and New Zealand immigrants are more than one
fifth of the population (e.g. World Bank, 2006).
During the last two decades there have been many empirical studies of the
economic impact of immigration but it is not easy to make meaningful comparisons
between such studies because of major differences in data and study design. Meta-
analysis provides a scientific way of synthesising empirical studies to detect whether
consensus conclusions are emerging in the literature and whether differences in
results across studies can be explained (e.g., Cooper and Hedges, 1994).
In two earlier papers, we used meta-analysis to summarise previous studies of
the impact of immigration on the labour market. In Longhi et al. (2005a) we analysed
18 papers that provided 348 estimates of the effect of immigration on wages of the
native-born population. We found that a one percentage point increase in the share of
immigrants in the population would lower wages of the native-born population by
about 0.1 percent on average across studies. When migrants are about one tenth of the
population this translates into a very small elasticity of a 0.01 percent decline in the
average wage for a 1 percent increase in the number of immigrants. In Longhi et al.
(2005b) we compared nine recent studies that yielded 165 estimates of the impact of
immigration on job displacement among native workers and found, similarly, that on
average a one percent increase in the immigration population would leave the native
born virtually unaffected: their employment would decline by a mere 0.02 percent.
While at face value the number of estimates used to derive these meta-analytic
averages is reasonably high, they are sourced from a relatively small number of
primary studies, and multiple estimates from any one study are clearly not
independent estimates. However, empirical research in economics is driven by a
‘competition of ideas’ and replication in order to derive precise estimates is much less
1
valued in general than designing a new econometric model that is innovative and
unique in some respects. It is clear that from the perspective of policy formulation,
both features of research are desirable. 1 It is useful to obtain relatively precise
estimates but it is also useful to obtain a measure of the extent of variability of
estimates under a wide range of different specifications. Meta-analysis can serve both
purposes. On the one hand it can generate more precise estimates by pooling study
results, while on the other it can attribute part of the variance across studies to known
study characteristics.
However, estimates are only quantitatively comparable when there is a
common metric, such as an elasticity (which is dimensionless). Sometimes elasticities
can be derived from results that are reported in level form, but in many cases the
available information is insufficient to obtain directly comparable quantities. To
improve comparability we focus in this paper on the statistical significance of the
empirical results. Study results are translated into whether the impact of immigration
on a local labour market is shown to be ‘harming’ the native born, ‘benefiting’ the
native born, or leaving them unaffected. The latter applies to all cases in which the
impact of immigration on a labour market outcome is statistically insignificant. It is
clear that the present study draws no conclusions as to the magnitude of ‘harm’ or
‘benefit’, but is nonetheless able to identify on which dimension of labour market
impact past empirical findings are more conclusive and the extent to which this is
linked to study characteristics.
The labour market outcomes that are considered in this meta-analysis are
wages, employment, labour force participation, and unemployment. The next section
describes how the primary studies were selected and how the study results have been
transformed into so-called ‘effect sizes’. This is followed by a descriptive summary of
the effect sizes across studies.
An important issue in meta-analysis is the extent to which published estimates
are a biased sample of all research conducted. This can happen when statistically
insignificant results are less likely to be submitted for publication or are more likely to
be rejected in the refereeing process. This issue is addressed in Section 3.
In the penultimate section we assess the extent to which primary study
conclusions are linked to particular study characteristics by means of multivariate
1 See Hamermesh (2007) for the benefits of, and greater need for, replication in economics.
2
analysis. We first estimate probit models in which study outcomes are coded as
confirming that immigrants have a negative impact on labour market outcomes of
natives, finding that the impact is positive, or generating inconclusive results. The
robustness analysis is based on WLS regression models of Fisher’s Zr statistics, which
are a transformation of partial correlation coefficients of primary studies. The final
section offers a retrospective view.
2. The primary studies and their effect sizes
2.1. The selection of the primary studies
There are presently hundreds of empirical studies on the impacts of immigration on
labour markets of host countries. These vary widely in terms of methodology used
and the nature of the data on which estimates are based. In study selection, there is a
trade-off between comprehensiveness and size of the meta-sample on the one hand
(which improves the extent to which the meta-sample is representative of all earlier
research) and relative homogeneity of the study objects on the other (which facilitates
the calculation of a summary measure).
For this paper, we have selected only primary studies that estimate the impact
of immigration using a multivariate regression framework. By far, the majority of
labour market impact studies use this framework. Secondly, immigration must be
quantified in the primary study by either the stock of immigrants, or the share of
immigrants in the population, or a change in one of these two variables (i.e.
immigration flows). Moreover, studies were only selected when the dependent
variable in the regression model refers to either: wages, employment, unemployment,
or labour force participation of the native born or of earlier immigrants, or a change in
one of these four variables. Hence, primary study regressions have the specification:
jjj my εβ ++= αxj (1)
in which is the labour market variable analysed in the primary study, and is
the corresponding measure of immigration (with observations j = 1, 2,…, n; n
coinciding with the number of available observations in the primary study). The row
vector x
jy jm
j consists of the values of the covariates (with column coefficient vector α);
3
and jε is the stochastic error term. The parameter β is the estimate of the impact of
immigration on the labour market, and is the parameter of interest in our meta-
analysis.
Often meta-analyses aim at computing a weighted average of estimated β
coefficients, which in that context are referred to as effect sizes. Besides obtaining an
average effect size, the objective of meta-analysis is also to explain the variability of
the effect sizes across studies. However, it is clear that this is only meaningful when
the estimates are either dimensionless (as in the case of elasticities) or when the
measurement units of both the dependent variable and of the level of immigration are
the same across studies, or can be converted to the same units. The presence of
different units of measurement severely limits the quantitative comparability across
studies.
To exploit the availability of a large sample of studies, a different approach is
adopted here that focuses on the sign and statistical significance of the estimated β
coefficients, as measured by their observed t statistics. Using t statistics, the requisites
of comparability across primary studies are less stringent and allow the inclusion of a
larger number of studies in the meta-analysis. The trade-off that we are facing is that
the focus on statistical significance increases the number of observations of the meta-
analysis but does not inform on the quantitative impact. Our previous studies of the
quantitative impacts (Longhi et al. 2005a; 2005b) suggested wages and employment
of natives were largely unaffected by immigration. If the meta samples of those earlier
studies could be enlarged, we do not expect that this broad conclusion would be
overturned (as it is in a qualitative sense the consensus of the vast majority of studies),
but a larger meta-sample might provide a more efficient means of estimating the
impact of study characteristics on study outcomes. Moreover, we can assess for which
type of labour market impact the results are relatively more conclusive. These are the
objectives of the present paper.
The standard neoclassical partial labour market model suggests that the impact
of an exogenous increase in immigration depends on the extent to which immigrants
and the native born are substitutes. In the simplest model of immigrants and natives
being perfect substitutes, an increase in immigration is expected to lower the wage
paid to the native born and therefore also their labour force participation (assuming no
backward bending aggregate labour supply curve). Given that some displacement will
4
take place, employment of the native born is expected to decrease and unemployment
to increase. A meta-analysis is able to detect whether the empirical evidence is able to
confirm or reject these predictions of the standard partial labour market model, and
whether this evidence is statistically strong or weak.
Of course, the theoretical predictions of the labour market impacts will depend
on the assumed micro foundations of the response of the economy to an immigration
shock and the implications of the adopted theory for the specification of the
regression model. Moving away from the basic partial labour market model, different
theoretical predictions may result. For example, Ottaviano and Peri (2006) argued that
a correct interpretation cannot be made unless a general equilibrium perspective is
adopted, in which the adjustment of the physical capital stock is taken into account. In
addition, they assume that migrants are imperfect substitutes for natives, even at the
level of narrowly defined education-experience groups. In such a framework, the
expectation is that immigration may raise the wages of the native born, thus benefiting
rather than harming natives.
We code the conclusions of regressions of the labour market impact on the
level of immigration in a qualitative way. The labour market impact is considered to
be harmful to natives when the t statistic on the immigration variable is negative and
statistically significant (at a preset significance level). The labour market impact is
considered to be beneficial to natives when the t statistic on the immigration variable
is positive and statistically significant. When the t statistic is statistically insignificant,
this is interpreted as immigration leaving the native born unaffected.2 An ordered
probit model is used to investigate the relationship between the conclusions of the
regression models and their specifications. We also transform the observed t statistics
into Fisher’s Zr statistics and use a weighted least squares (WLS) regression model as
an alternative means of linking study conclusions to study characteristics.
2.2. The primary studies: descriptive statistics
In this meta-analysis we include 45 primary studies, from which we have collected
1572 effect sizes in the form of t statistics: 854 t statistics on the impact of
immigration on wages; 500 on employment, 185 on unemployment, and 33 on labour
2 High wages, employment and labour force participation are all considered to be beneficial to natives. For unemployment, we reverse the sign of the t statistic so that a statistically significant positive t statistic is again evidence of a positive impact on natives.
5
force participation (see Table 1). Of the 1572 effect sizes, 905 originate from studies
using US data; 40 of these t statistics refer to the impact on the labour market of the
state of California only (Peri, 2007), while 14 refer to evidence for New York City
only (Howell and Mueller, 1997). Our meta-analysis also includes 422 effect sizes
generated by studies of eight European countries (Austria, France, Germany,
Netherlands, Norway, Portugal, Spain, and the UK); 50 estimates computed by
considering the immigration impact across 15 EU countries (Angrist and Kugler,
2003; Jean and Jimenez, 2007); and 18 estimates computed from regressions with
data from 19 OECD countries (Jean and Jimenez, 2007). The remaining 177 t
statistics refer to the labour market impact in three other countries: Australia, Canada,
and Israel.
TABLE 1 ABOUT HERE
By taking absolute values of the 1572 t statistics, we find that studies on
wages and employment yield averages of 2.565 and 2.105, i.e. the ‘average’
regression is ‘conclusive’ at the 5 percent level, taking into account the number of
observations in each of the considered studies. For unemployment and labour force
participation, the averages are 1.383 and 1.568 respectively. Hence the evidence
regarding these labour market impacts is inconclusive in the ‘average’ regression. 3
The distribution of the effect sizes is shown in Table 2. Although about half of
the effect sizes (815) are not statistically significant at the 10 percent level, the
number of t statistics that suggest a conclusively negative impact (447) is larger than
the number of t statistics that suggest a conclusively positive impact (310). Average t
statistics are shown at the bottom of Table 2. Despite the relatively large number of
statistically insignificant effect sizes, the average of the positive t statistics for wages
is 2.248 (just below the threshold of statistical significance at one percent level),
while the average of the negative ones is -2.882. This clearly suggests a lack of
consensus in the empirical literature as to whether immigration has a positive or
negative (statistically significant) impact on wages in general. For employment the
non-negative t statistics average to 1.846 – corresponding to a level of statistical 3 Since 86 of the 185 observations for the impact of immigration on unemployment are collected from the same study and because of the small number of observations on the impact of immigration on labour force participation, the results of the analysis focusing on these two variables should be interpreted with caution.
6
significance of ten percent – while the negative ones average to -2.316, corresponding
to a level of statistical significance of five percent. For unemployment and labour
force participation, 78.9 percent and 60.6 percent of t statistics are statistically
insignificant at the 10 percent level. It is worth noting, however, that despite the lack
of a general consensus, the evidence that immigration has a negative impact on labour
natives outcomes of natives is slightly stronger than the evidence in favour of a
positive impact across all four dimensions: wages, employment, unemployment and
labour force participation.
TABLE 2 ABOUT HERE
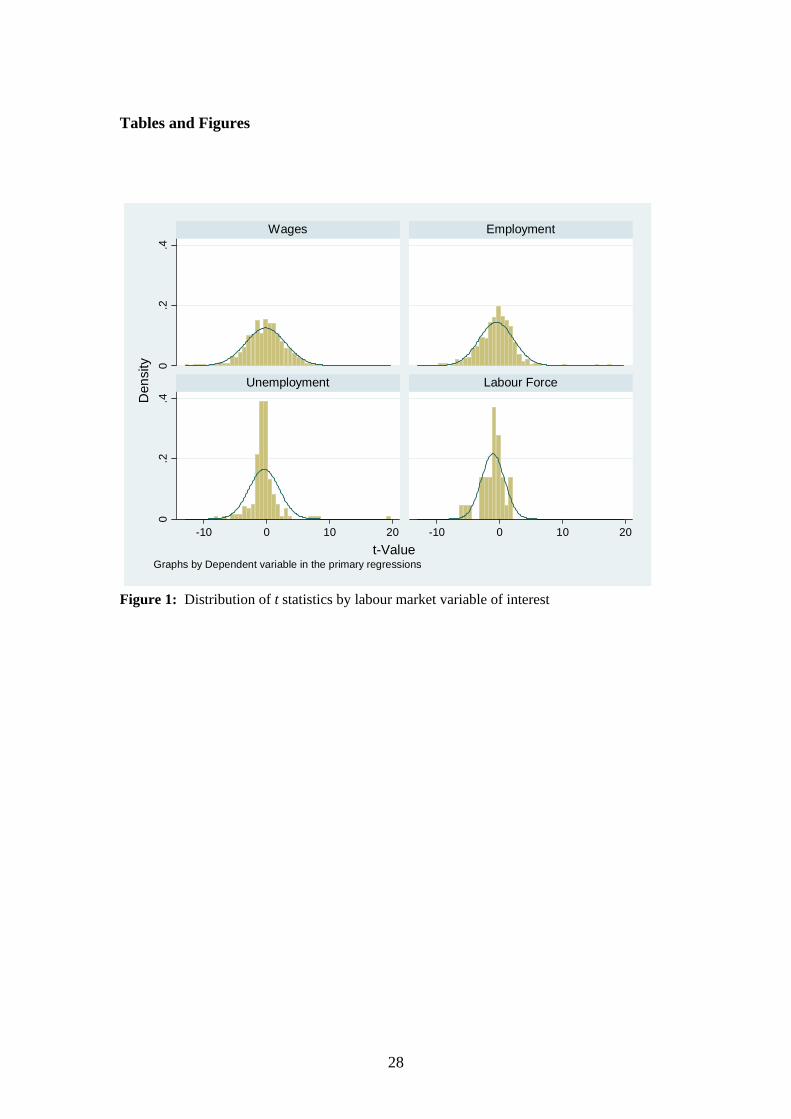
FIGURE 1 ABOUT HERE
Figure 1 shows the distribution of the t statistics separately for wage,
employment, unemployment and the labour force participation.4 While for wages and
employment, the distributions of the t statistics appear close to a normal distribution
centred on zero, for unemployment and labour force participation a large number of
very small effect sizes make the distribution rather different from normal with too
little density in the tails.
2.3. Moderator variables and descriptive statistics
Because t statistics for any given data generating process are increasing at the rate of
the square root of the sample size, a common alternative effect size measure that
controls for sample size variation is the Fisher Zr statistic. This is based on the partial
correlation coefficient ri derived from the primary regression that generated effect size
i:
ii
ii
dft
tr
+=
2 (2)
in which ti is the t statistic and dfi the degrees of freedom associated with the i th
regression. As noted earlier, when a primary study estimates the impact of
4 For ease of representation three extremely high t statistics (from regressions in Grossman, 1982; Borjas, 2006; and Kugler and Yuksel, 2006) have been excluded from Figures 1 and 2, although we do include them in the meta regression models.
7
immigration on unemployment, the sign of the t statistic has been inverted, so that a
positive correlation coincides with immigration being beneficial to labour market
outcomes of natives. Since for some studies the number of degrees of freedom of the
regression is not reported and not easily derived (for example, because some dummy
variables or covariates are not explicitly listed), the computation of the Zr statistics is
in practice based on the sample size Ni rather than the degrees of freedom. Because
most studies are based on relatively large samples, the difference is negligible.
The Fisher Zr statistic is then calculated as:
⎟⎟⎠
⎞⎜⎜⎝
⎛−+
=i
iri r
rZ11ln
21 (3)
The asymptotic standard error of the Zr statistic is given by:
( )3
1−
=i
ri N
Zse (4)
Frequency distributions of the t statistics across study characteristics are
reported in Table 3a, while Table 3b provides a descriptive summary of the Zr
statistics across the same characteristics. Column (1) of Table 3a shows the
percentage of effect sizes that correspond to a significantly negative impact of
immigration on native labour market outcomes (at the 5 percent level). Column (2)
shows the percentage of regressions that yield statistically insignificant impacts on the
native born. Finally, column (3) shows the percentage of t statistics that correspond to
a positive and statistically significant effect of immigration on labour market
outcomes of the native born. While the figures in the first row of Table 3a refer to the
whole sample, the remaining rows refer to sub-samples of the dataset. These sub-
samples are defined on the basis of the characteristics of the primary studies that we
expect to have an influence on the primary regression models. The variables recording
these study characteristics of the primary studies are called moderator variables in
meta-analysis. They are usually representing qualitative information that is coded in
the form of dummy variables.
8
Using the 5 percent significance level, Table 3a shows that 24.9 percent of the
effect sizes confirm a negative impact, 17.0 percent confirm a positive impact (19.7
percent) and 58.1 percent are inconclusive. These proportions vary somewhat
depending on the specific aspect of the labour market analysed: the proportion of
inconclusive effect sizes is the highest for unemployment (81.6 percent) and the
lowest for wages (51.4 percent).
Descriptive statistics of 1513 Zr statistics are shown in Table 3b.5 The first
row shows the unweighted mean, standard deviation, minimum and maximum value
for the whole dataset. The Zr statistics range from a minimum of −0.818 to a
maximum of 1.136, with a mean of only −0.022 and a standard deviation of 0.153.
The remaining rows of Table 3b show descriptive statistics for sub-samples of the
dataset. The categories used are the same as in Table 3a.
TABLE 3A ABOUT HERE
TABLE 3B ABOUT HERE
Using the information in Tables 3a and 3b, we can assess the extent to which
the distribution of effect sizes is affected by study characteristics. Here we consider
these only one by one descriptively. In Section 4 we adopt a multivariate analysis that
takes account of correlations between study characteristics as well.
Of the 1572 effect sizes, 652 are published in academic journals; 112 are
published in books; and 808 have been collected from working papers or unpublished
papers. Effect sizes collected from studies published in academic journals might be of
higher quality (due to the refereeing process). On the other hand, these might be more
affected by the problem of publication bias (Begg, 1994; Florax, 2002). Dummies for
the kind of publication in our meta-analysis will enable us to test whether primary
studies published in academic journals tend to draw conclusions that are
systematically different than those of primary studies published in books or as
working papers. More than 60 percent of effect sizes published in books or as
working papers are inconclusive. This proportion decreases to 52.6 percent for those
effect sizes published in academic journals. The mean Zr statistic for those effect sizes
5 Five observations were dropped because the standard errors were zero up to the smallest reported digit after the decimal point, while another 54 observations were dropped because the number of observations of the primary study regression could not be found.
9
published in academic journals is, however, very similar to the mean Zr statistic of
those effect sizes published in books, while it is much closer to zero for those effect
sizes published in working papers. In Section 3 we will assess to what extent this
finding is related to publication bias.
If more recent studies use better datasets and econometric techniques, we
might expect these to give a more precise picture of the impact of immigration on the
labour market. We therefore classify the primary studies on the basis of the decade in
which the most recent version of the paper has been published: 1980s, 1990s and in
2000s. It is clear from Table 3 that, following the two 1980s contributions by
Grossman (1982) and Borjas (1987), this literature has been growing rapidly during
the 1990s and 2000s. We collected 51 effect sizes from the two primary studies
published in the 1980s; 433 from the 19 primary studies published in the 1990s; and
1088 effect sizes from the 24 primary studies published in the 2000s. Grossman
(1982) and Borjas (1987) were rather more conclusive (in the sense of confirming a
negative impact of wages of the native born) than the subsequent studies on average.
As expected, being based on only two primary studies, the distribution of Zr statistics
from the 1980s has the smallest standard deviation.
With respect to impacts across the four labour market outcomes (wages,
employment, unemployment and labour force participation), Table 3 suggests that the
evidence of a decline in labour force participation of the native born is relatively
stronger than evidence of detrimental effects on the other labour market outcomes.
Large adjustments in the labour force participation might explain small adjustments in
wages and/or (un-)employment in response to immigration (see, e.g., Johannsson and
Shulman, 2003; Johannsson and Weiler, 2004).
Most of the literature estimates the impact of immigration on wages. In our
sample 854 effect sizes compute the impact of immigration on wages, against 500
computed on employment. Of the 185 effect sizes estimating the impact of
immigration on unemployment, 86 were sourced from the study by Gilpin et al.
(2006). So far, only 33 effect sizes of the impact of immigration on labour force
participation were obtained. Table 3a and Table 3b show that the frequencies of
negative and statistically significant t values and negative Zr values respectively is
greater for labour force participation than the other impacts.
In Longhi et al. (2005a) we found that immigration has a bigger negative
impact on wages in the US while in Longhi et al. (2005b) we found the negative
10
employment effect on the native born was greater in the non-US, predominantly
European, countries. This conclusion is plausible given that wage effects may be
expected to be greater in the more flexible labour market (the US) while employment
effects may be greater in the less flexible labour market (such as in some European
countries). Table 3 aggregates the t values and Zr values across the four types of
labour market impact for studies on the US, the EU, and other countries. Table 3a
shows that the measured impact of immigration is more often significantly negative in
the US than in Europe. However, the impact is much more often significantly
negative in regressions run for ‘other’ countries.6 Similarly, the mean Zr statistic is the
most negative for the ‘other’ countries.
We found in earlier research that elasticities that are computed using
geographically narrower definitions of the labour market tend to find much smaller
impacts of immigration. When focussing on statistical significance, Table 3a shows
that significantly negative t statistics are relatively more frequent for studies using
large geographical areas (such as nations), while in Table 3b the least negative mean
Zr statistic is found for the very small regions. Taken together these results reconfirm
that labour market impacts of immigration are less detectable in the smaller
geographical areas, which are more open to various adjustment mechanisms such as
trade, internal migration and capital mobility.
There are different conceptual frameworks to estimate the impact of
immigration on the labour market, even when limiting the focus to regression models
only. The most common are the ‘area’ approach and the ‘factor proportions’
approach. The area approach exploits the fact that immigration is spatially highly
concentrated, so that a negative spatial correlation may be expected between the
proportion of the labour force in local labour markets that are immigrants and the
wages of natives who they can substitute for. We label this approach ‘data driven’.
The factor proportions approach has a much stronger theoretical basis in that it
analyses the wage effect of immigration by considering native and immigrant workers
as separate production inputs. After assuming a certain elasticity of substitution
between skilled and unskilled workers – usually derived from other studies – and
accounting for the distribution of immigrants across skill categories (in many
countries immigrants have significantly lower skills than natives on average), the 6 We include those effect sizes estimating the impact of immigration by pooling OECD countries (Jean and Jimenez, 2007) in all three groups: US, EU, and Other countries.
11
elasticities of substitution between native and immigrant workers are estimated. We
label this approach ‘economic’. Although it has been suggested in the literature that
studies applying the factor proportions approach tend to find a larger effect of
immigration on natives than those applying the area approach (e.g., Borjas et al., 1996
and Friedberg, 2001), Longhi et al. (2005a) found that the economic approach tended
to generate effect sizes that were on average closer to zero. We test here whether these
different approaches systematically lead to different results in terms of statistical
significance. We also distinguish effect sizes that can be interpreted as derived from
‘natural experiments’, although they were estimated by means of regression equations
in the form of equation (1). These studies are Hunt (1992); Carrington and de Lima
(1996); Friedberg (2001); and Angrist and Kugler (2003). Table 3a suggests that
‘natural experiments’ and ‘economic approaches’ are more likely to find insignificant
effects than the ‘data driven’ approach. The most negative mean Zr statistic is also
found for the latter approach.
One robust finding from the literature, confirmed by previous meta-analyses
(Longhi et al. 2005a, 2005b), is that previous immigrants have more to fear from
further immigration that the native born, primarily because the former are closer
substitutes to new inflows than the latter. With respect to statistical significance, this
conclusion is reinforced by Table 3b (in which the mean Zr statistic is the most
negative for immigrants), but –somewhat surprisingly – in Table 3a 27.0 percent of
the t statistics associated with regression coefficients measuring the impact on natives
is less than -1.96, whereas this is the case for only 16.8 percent of t statistics of
coefficients measuring the impact on immigrants. The distribution of t statistics for
studies that measure the impact on ‘everybody’ is not a weighted average of the
distributions of the impact on natives and immigrants. The former has been obtained
from regressions using different data sources and specifications. They have the largest
percentage of inconclusive results (Table 3a) and the greatest standard deviation of Zr
statistics (Table 3b).
It has been suggested that substitutability between natives and immigrants –
and therefore the impact of immigration on natives – is likely to differ across
education groups (e.g. Ottaviano and Peri, 2005). A large number of primary studies
estimate the impact of an increase in the proportion of immigrants on high- or on low-
skill natives. In such regressions, there is often no differentiation of immigrants by
skill group. Instead, other primary studies compute the proportion of immigrants by
12
skill groups to estimate its impact on natives of that specific group. However, when
all groups are estimated in the same regression, the resulting effect size averages out
the skill-group-specific impacts. Although it is only a rough indicator, we include in
our analysis a dummy for whether the effect sizes focus on high-skill natives, low-
skill natives, or make no distinction across skill groups. The descriptive statistics in
Table 3a suggest that t statistics coming from regressions that measure the impact on
high skill workers find the least support for a statistically significant negative impact
of immigration.
While 822 effect sizes estimate the impact of immigration using data for only
one year; 750 are based on pooled cross-sections. The effect sizes estimated using
cross-section data might underestimate the impact of immigration: first-differences
should be used to capture the short-run effects of immigration, since they would be
less affected by city-specific unobserved characteristics that might influence
immigrant density and/or natives’ outcomes (e.g., Friedberg and Hunt, 1995; Altonji
and Card, 1991). However, most studies – especially for the US – use census data,
thus computing first-differences over rather long periods. In that case, the assumption
of time-invariant location effects is less tenable. In our database the time span
between the first and the last year used in the primary estimations ranges from one
year – for those estimations computed using cross-section data – to 40 years for those
estimations computed using five censuses (from 1960 to 2000). It is clear from Table
3a that those effect sizes estimated using pooled data tend to find a statistically
insignificant impact of immigration more often than effect sizes estimated using
cross-section data. In addition, the mean Zr statistic is indeed more negative for the
latter.
In summary, the most statistically significant negative impacts are found for
cross-sectional data, studies based on the area approach (data driven), in relatively
large geographical areas, and in studied countries other than the US and Europe.
Further, both Table 3a and Table 3b suggest more conclusively negative impacts
reported in journal articles. With respect to the type of labour market impact, both
tables suggest more frequent statistically negative results on labour force participation,
followed by wages, employment and unemployment. Also, both tables suggest that
those effect sizes focusing specifically on low-skilled natives tend to find a negative
impact of immigration less frequently than those computing elasticities that are
averaged across the skill distribution.
13
These results may be affected by the extent to which estimates are less likely
to be reported when they are inconclusive. Referees of journal are more likely to
reject studies with weak or inconclusive results than those that claim a high level of
statistical significance. The former studies are more likely to be ‘parked’ in working
paper series or in book chapters. This can be seen from Table 3a, which shows that
the percentage of inconclusive effect sizes is 52.6 percent for journal articles, but
more than 60 percent for books and working papers. The next section reports on
methods to detect publication bias resulting from selective reporting of results in the
available literature.
3. Publication bias
Because of the tendency of authors, referees and editors to favour the publication of
statistically significant results, the sample of available studies and, to a lesser extent
of effect sizes, is likely to be biased toward more (statistically) significant results (e.g.
Stanley et al., 2004; Glaeser, 2006). We reduce the impact of publication bias by
including both published and unpublished studies, and by sampling all estimates
published in each primary study (see also Longhi et al., 2005a).
If primary studies finding statistically significant results are more likely to be
published, we would expect small t statistics to be underrepresented. As shown in
Figure 1, however, the distribution of the t statistics is not only very close to
normality, at least for wage and employment impacts, but since it is centred on values
very close to zero, this clearly shows that small t statistics are not underrepresented in
our sample of primary effect sizes. The finding, that immigration has no (statistically)
significant (negative) impact on the labour market, is likely to be considered an
interesting result by authors, referees and editors – worthy of publication. Hence, in
this specific subject, publication bias is less likely to be a problem even when it is
present.
The heterogeneity of our effect sizes, and the need for moderator variables
makes the formal ‘FAT’ test for publication bias (Stanley, 2005) inappropriate. The
‘MST’ test for meta-significance, however, can give us further – indirect – insights
into publication bias. We regress the natural logarithm of the absolute value of the t
statistics on the log of the square root of the sample size collected from the primary
studies, as suggested by Card and Krueger (1995) and by Stanley (2005):
14
( ) iipi Nt ξωδ +++= γsilnln (5)
To partially correct for the heterogeneity of the effect sizes, the row vector si
includes the study characteristics with column coefficient vector γ. Sampling theory
predicts that if there is a genuine effect of immigration on the labour market and there
is no publication bias, the hypothesis test that ωp = 1 based on the estimate pω̂ from
the above regression should not be rejected. However, if immigration has no impact
on the local labour market, we should not find a relationship between t statistics and
sample sizes. Instead, we should find that the hypothesis that ωp = 0 will not be
rejected (Stanley, 2005). The presence of a genuine effect of immigration on the
labour market, coinciding with a 95 percent confidence interval for the estimated pω̂
in between zero and one, might be due to publication bias, or to the fact that
researchers might change their specification to enhance their results (e.g., Glaeser,
2006), or to changes over time in the impact that immigration has on the labour
market (Card and Krueger, 1995). An estimated value of pω̂ that is significantly less
than zero would indicate publication bias and no genuine effect (Stanley, 2005).
Table 4 shows the results of our meta-significance tests. The model in column
(1) is computed on all effect sizes. Column (2) is based on the effect sizes estimating
the impact of immigration on wages only, while column (3) reports the regression for
those effect sizes estimating the impact of immigration on employment. The
regression coefficients are all less than one. 7 The one in column (1) is significant at
the 10 percent level and in column (3) at the 5 percent level. There is therefore some
evidence of publication bias in the reporting of primary employment regressions. This
also affects the MST regression involving all effect sizes. However, there is no
evidence of publication bias influencing the wage regressions, but at the same time
there is also no evidence from this regression that there is a real statistically
significant effect.
The impact of publication bias on this literature is likely to relatively minor, as
noted above. We saw from Table 3a that the percentage of regressions with
statistically significant t statistics at the 5 percent level was 29.6 percent in the case of
7 These results are not affected by the outliers with very large t statistics that we dropped from the figures: the test for publication bias generate roughly the same results with and without such effect sizes.
15
refereed journal articles and 22.2 percent in the case of the usually non-refereed
working papers. Similarly, the mean Zr statistic found for regressions from journal
articles is -0.035 as compared with -0.010 for working papers (and the mean Zr for
books of -0.033 being rather similar to that for journal articles). Hence there are
differences, but they are not huge. As shown in Figure 1, we find similar distributions
of the t statistics for those effect sizes estimating the impact of immigration on wages,
or on employment separately. In both cases the distribution is close to normal.
TABLE 4 ABOUT HERE
Another technique to identify publication bias is the use of funnel plots. These
are depicted in Figures 2a and 2b. Funnel plots are scatter plots of Zr statistics against
the square root of the primary study sample size. Publication bias can be detected by
means of these plots if they are noticeably asymmetric. While there is a slight
evidence of some ‘missing’ positive Zr values at relatively small sample sizes, on the
whole the funnel plots are rather symmetric. This reconfirms that publication bias
does not appear to be a major issue in the present meta-analysis.
FIGURE 2 ABOUT HERE
4. Multivariate analysis
4.1. Probit models
Because effect sizes are based on t statistics derived from a large sample of
heterogeneous primary studies, it would not be meaningful to assess the impact of
study characteristics on the observed effect sizes by means of a standard meta-
regression model. Instead, we assume that the true impact of immigration on the
labour market is a continuous but latent process (k*) from which we observe only
three possible outcomes related to the t statistic of each effect size. The t statistic is
coded as k = –1 when the immigration variable has a negative coefficient in
regressions of the labour market outcomes for natives and the coefficient is
statistically significant; k = +1 when the primary study regression coefficient is
16
positive and statistically significant; and k = 0 when the estimated coefficient is
statistically insignificant.8
We also assume that the impact of immigration can be expressed as a linear
function of the aforementioned characteristics of the primary studies (si):
ki* = siλ + ζi (6)
where ζi is assumed normally distributed. We observe k = –1 when the impact of
immigration in the labour market is negative and statistically significant and this is
assumed to coincide with ki* ≤ μ1. Further, k = +1 when the impact of immigration on
the labour market is positive and statistically significant (ki* ≥ μ2); while k = 0 when
the impact of immigration is positive or negative, but the t statistic is not statistically
significant, which is assumed to be the case when μ1 < ki* < μ2. The parameters μ1
and μ2 have to be estimated within the probit model.
We have experimented with three different thresholds of statistical
significance (10, 5 and 1 percent) and applied the same ordered probit model
specification to each threshold. The results are very robust to these changes. We
report in Table 5 only the results which use the threshold of the one percent level of
statistical significance. Column (1) reports the results of the probit model for all effect
sizes. Column (2) reports results for effect sizes on wage impacts only, while column
(3) is concerned with employment impacts only. To facilitate the interpretation, the
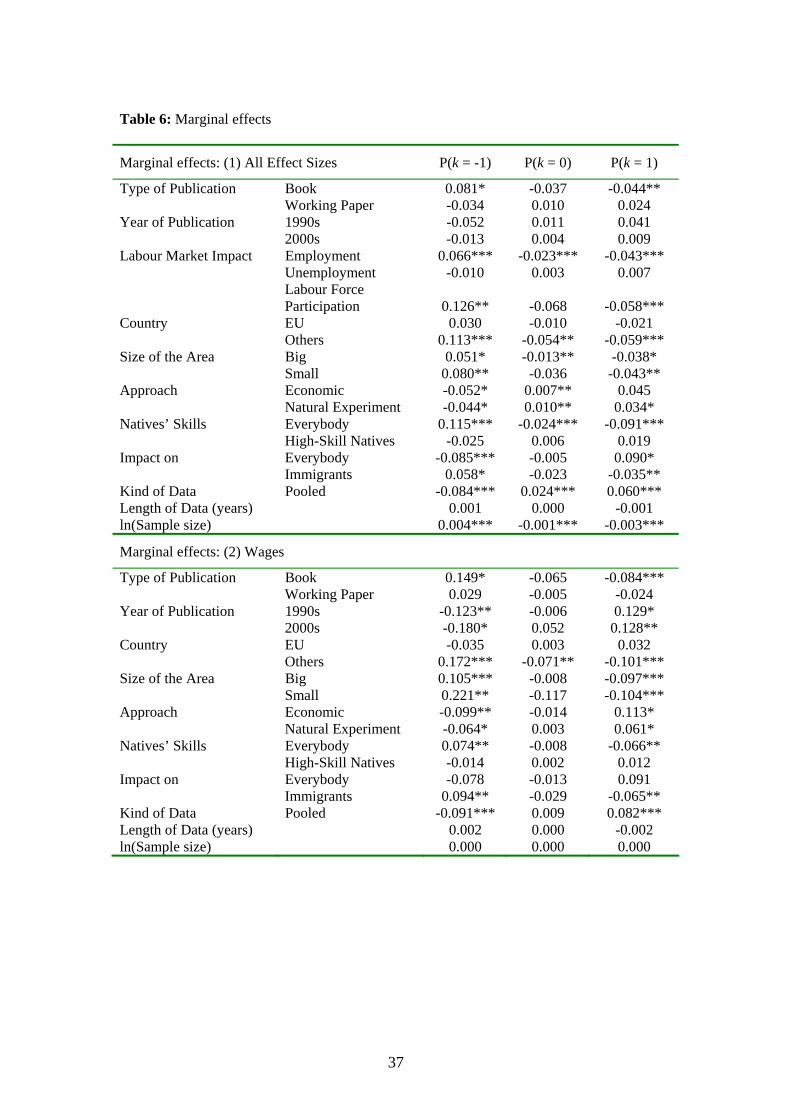
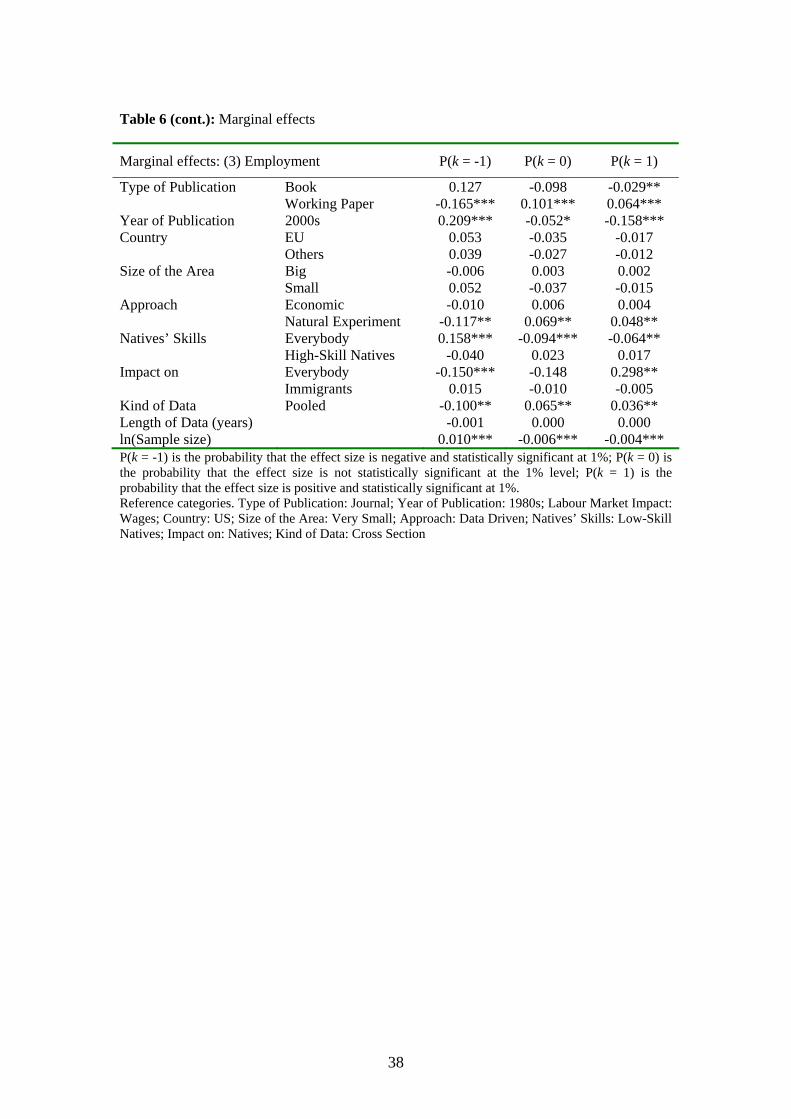
marginal effects of the probit analysis are reported in Table 6. Corresponding to the
three models of Table 5, Table 6 consists of three blocks: one for all effect sizes, one
for wage effects and one for employment effects. The marginal effects identify the
change in the probability of each outcome (-1, 0 and 1) to changes in the moderator
variables. The results of probit analysis that take account of correlations between
study characteristics may yield results that differ somewhat from the descriptive
bivariate analysis of Table 3.
8 It might be argued that using a probit model should be avoided since it leads to a loss of information compared with running a meta-regression on the t statistics. However, if authors and readers are interested in the sign and statistical significance of an effect size, they will pay attention to whether the t statistic passes a certain threshold of statistical significance, rather than be concerned with the specific value of the t statistic. The probit model thus trades such ‘loss of information’ for a higher clarity of the results.
17
Tables 3a and 3b suggested that a prior expectation (from the partial labour
market model) of a negative impact is more likely to be confirmed for studies
focussing on labour force participation. We see from Table 5 that the effect sizes that
estimate the impact of immigration on labour force participation tend to confirm this
prior more often than those estimating the impact of immigration on wages. Table 6
also suggests that those effect sizes computed from the impact on labour force
participation are more likely to accept – and less likely to reject – the prior of a
negative impact of immigration on these labour market outcomes. However, Tables 5
and 6 show that the same is also true for employment relative to wages, a conclusion
that could not be seen in the descriptive summary in Table 3. Together, these results
suggest that the rather small impact that immigration has on wages might be due to
relatively larger adjustments to labour force participation and to employment of
natives.
Among the different approaches – economic, natural experiments or data
driven – those effect sizes estimated using natural experiments and the economic
approach seem to offer less support for the prior of a negative impact of immigration
on the labour market, while they seem to be more likely to find a positive impact of
immigration. Those effect sizes estimating the impact of immigration in ‘big’ or
‘small’ areas do seem to confirm the prior of a negative impact more often than those
using ‘very small’ areas. Somewhat surprisingly, those effect sizes that estimate the
impact of immigration averaging it by different natives’ skill groups seem to find a
negative impact of immigration more often than those focusing on high skill or low
skill groups only.
As we saw earlier based on Table 3, Tables 5 and 6 suggest also that those
effect sizes estimating the impact of immigration on ‘other’ countries tend to confirm
the prior of a negative impact more often than those estimating the impact of
immigration on the US or the EU. Those effect sizes estimating the impact of
immigration on earlier immigrants tend to confirm the prior more often than those
estimating the impact of immigration on natives, while the reverse happens for those
studies that consider natives and immigrants together. Hence, earlier migrants are
much more affected by further immigration than the native-born population, which
reinforces often cited findings such as those by Ottaviano and Peri (2006) for the US.
Finally, effect sizes estimated using pooled data seem to reject the prior of a negative
impact more often than those estimated using cross-section data.
18
Given that large samples are more likely to yield statistical significance of
primary regression coefficient, we include the natural logarithm of the sample size in
the ordered probit regression. The coefficient of this variable is statistically significant
and negative, thus pointing in the direction of a small bias towards accepting the prior
of a negative impact of immigration on the labour market (as also noted in the
previous section). Table 6 also suggests that those primary studies with large sample
sizes are more likely to find support for the prior of a negative impact of immigration,
and are not only less likely to find statistically insignificant results, but are also less
likely to find results that reject the prior.
TABLE 5 ABOUT HERE
TABLE 6 ABOUT HERE
Given the relatively high number of effect sizes estimating the impact of
immigration on wages or on employment, we have also estimated the probit model
separately for these two sub-groups of effect sizes. The chosen threshold level to
classify the t statistics is again the 1 percent level of statistical significance. The
results are in the second and third column of Table 5, while the marginal effects are in
the second and third panel of Table 6, as noted earlier.
The results suggest that those effect sizes estimating the impact of
immigration on wages or on employment that are published in books are less likely to
find a positive impact of immigration than those published in academic journals.
Those effect sizes estimating the impact of immigration on employment that are
published in working papers are less likely to confirm, and more likely to reject, the
prior of a negative impact than those published in academic journals. Studies
published in academic journals, therefore, do not seem to be ‘biased’ against finding a
negative impact of immigration; at least, not more than those studies appearing in
books or still in their working paper form.
Those effect sizes estimating the impact of immigration on employment that
were published recently are more likely to confirm the prior of a negative impact.
With respect to wages, it is the opposite. Those estimating the impact of immigration
on wages published during the 1990s and 2000s are less likely to confirm the prior,
and more likely to find a positive impact of immigration. If we believe that more
recent studies are – on average – of better quality, we might conclude that
19
immigration is more likely to have a negative impact of on employment than
previously thought; while the impact on wages seems nowadays less likely to be
negative, and more likely to be positive.
Consistent with the idea that various forms of adjustments in an open labour
market might lead to the underestimation of the impact of immigration, the results in
Tables 5 and 6 show that those effect sizes estimating the impact of immigration on
wages using relatively larger areas seem to confirm the prior more often than those
computed using very small areas. This difference regarding the area of the observed
labour markets does not seem to hold for those effect sizes estimating the impact on
employment. Also, column (2) of Table 5 and the middle panel of Table 6 show once
again that the negative wage impact is more likely to be confirmed when it concerns
earlier immigrants rather than the native born, supporting the idea that immigrants and
natives are at most imperfect substitutes. With respect to employment, we find – as
would be theoretically expected – that overall employment following an immigration
influx would grow. This is indicated by the positive coefficient on ‘everybody’ in
column (3) of Table 5 being significant at the one percent level. Similarly, the third
panel of Table 6 shows a lesser likelihood of employment decline for everybody and a
greater likelihood of employment increase.
Those effect sizes estimated using pooled data are more likely to reject the
prior of a negative impact than cross-section analyses. Studies focussing on the EU
are as likely to find a negative impact on employment and wages as those focussing
on the US; however, those studies estimating the impact of immigration on wages in
‘other’ countries seem to confirm the prior of a negative impact more often than those
estimating the wage impact of immigration for the US. Consistently with the results in
column (1) of Table 5, those studies estimating the impact of immigration as averages
of different natives’ skill groups seem to find negative impact of immigration more
often than those focusing on one skill group only. Finally, the statistical significance
of the log of the sample size suggests evidence of publication bias with respect to the
employment impact, but not with respect to the wage impact.
4.2. Robustness analysis
As a final sensitivity check, we also ran regression model on Fisher’s Zr statistics.
These are models of the form:
20
= sriZ iθ + ηi (7)
in which the row vector si again represents the characteristics of the study (moderator
variables) that yielded effect size i. Because it is known that the variance of Zr is
inversely related to the number of observations in the primary study (see equation (4)),
the regression model must be estimated by Weighted Least Squares, in which each
regression observation is weighted by the inverse of the estimated standard error of
the Zr statistic of the study.
The results of the estimation of equation (7), not shown here but available on
request, are consistent with those of the probit analysis. First, studies that used a
natural experiment to gauge the impact of immigration on wage or employment are
associated with higher Zr values, i.e. less likely to yield a statistically significant
negative impact.
The comparison between the EU and US (the reference group) is particularly
interesting. The overall impact in EU studies is less negative, possibly due to the
labour market adjustment in Europe being less following an immigration shock.
However, when comparing the impact on wages with that on employment, we see that
in Europe the impact seems to be slightly more positive in regression models that
focus on wages, but more negative in regressions that focus on employment, although
the coefficient is not statistically significant. This is a plausible result as it suggests
that in the European labour market, which is more regulated than the US one, the
response of the labour market to an immigration shock is to generate some
displacement of native born workers, but little change in the wages of the native born.
Hence employment adjustment in the European labour markets is stronger than wage
adjustment. However, the impact does not appear to depend on the geographical area
of the labour market in this meta-regression. Furthermore, estimating the impact of
immigration averaging different natives’ skill groups, or focusing on one skill group
only, seem to produce similar results.
5. Conclusions
The number of people living outside their country of birth has more than doubled
since 1960 (World Bank, 2006). The growth in international migration has fuelled an
extensive and ever-increasing volume of research during the last two decades. The
21
number of refereed journal articles on the topic of immigration recorded in EconLit is
now close to 1200. 9 To those concerned with formulating policies that aim at
increasing the wellbeing of both immigrants and the host country population such a
bewildering array of research findings warrants an effective research synthesis. While
narrative literature reviews may provide many relevant insights, they are likely to
generate only a partial, and a – deliberately or subconsciously – biased summary of
the literature. In this paper we adopted a meta-analytic approach to summarise this
literature. This has provided a quantitative and transparent means of assessing the
impact of immigration on the labour market.
The paper may be seen as the final part in a trilogy. In Longhi et al. (2005a)
we carried out a meta-analysis of the impact of immigration on the wages of the
native born population. This was followed by a study of the impact on employment
(Longhi et al. 2005b). In the present paper we extended the analysis to the combined
impact on wages, employment, unemployment and labour force participation.
The conclusion of this research synthesis is that the impact of immigration on
the labour market of the native born population is quantitatively very small and
estimated coefficients are more than half of the time statistically insignificant. This
reinforces a consensus that has emerged in the literature on the macro level labour
market impact. From the perspective of policy, however, this broad conclusion needs
to be supplemented with more refined statements that concern the outcomes in
specific labour markets for specific workers at specific times. It is fortunate that
highly detailed administrative and survey data bases, often longitudinal, are now
becoming available in host countries to carry out far more detailed analyses than have
been hitherto possible.
Of particular importance is the extent to which immigrant workers are
substitutes or complements to native-born workers in specific labour markets. While
the present paper confirmed the neoclassical partial equilibrium model that, when
migrants are substitutes for the native born and earlier immigrants, regressions of the
labour market impact on these groups often yield negative but statistically
insignificant coefficients, it was not possible to focus explicitly on specific types of
immigrants and native-born workers. However, a strong result of the meta-analysis is
9 Of course, these cover every aspect of the economics of immigration. The 45 studies that generated the data for our meta-analysis constitute most of the accessible papers that estimate the impact of immigration on the labour market by means of regression models.
22
a statistically significant downward effect of newcomers on the wages of earlier
migrants, suggesting that in many cases the substitution elasticity between new
arrivals and earlier immigrants will be relatively high.
By means of probit and regression analysis we found that the impact may be
greater on labour force participation and on employment than on wages. Another
robust conclusion is that the impact is greater the less locally born have the
opportunity to ‘escape’ a potentially harmful impact through other adjustments, such
as outward internal migration, capital inflows or additional local demand. Hence the
impact on the nation or large regions is much greater than on local labour markets.
It should be noted that the present paper has said nothing about the speed of
adjustment of the labour market. The long-run impact, that also involves a change in
the level of new investment, is likely to be quite different from the impact in the short
run. The effect of immigration on gross fixed capital formation is presently still an
under-researched topic, probably because micro level data on investment and capital
stock at industry and regional level are often hard to obtain. Furthermore, we have
also not considered the literature of the impact of immigration on prices. Saiz (2007)
finds that immigration can lead to higher rents or higher house prices, but Lach (2007)
finds that an influx of immigrants may lower prices of some goods and services.
Consequently, a general equilibrium approach is desirable to distinguish wage
impacts and impacts on real disposable incomes.
Finally we note that the indicators of the labour market impact that we
considered in this paper has been limited to the primary indicators of labour market
performance: employment, unemployment, wages and labour force participation. For
example, the possibility of migrants affecting hours worked was not considered. In
addition it would be particularly fruitful for future research to shift attention to
dynamic aspects of the labour market. When there is concern for migrants displacing
native born workers, this might be assessed by means of longitudinal data that
measure layoffs, unemployment spells, changes of residence and occupational and
industrial mobility. In addition, the impact of immigration on productivity-enhancing
innovation of firms in the local labour market is one channel through which the labour
market impact of immigration can be positive in the long-run. Such study of the ways
in which the ‘churning’ in the labour market and the productivity of firms are
influenced by changes in immigration levels offers much promise for new primary
research, and eventually for additional meta-analyses.
23
References Addison, T. and Worswick, C. (2002) The Impact of Immigration on the Earnings of
Natives: Evidence from Australian Micro Data. The Economic Record 78(1): 68-78.
Altonji, J.G. and Card, D. (1991) The Effect of Immigration on the Labor Market Outcomes of Less-Skilled Natives. Immigration, Trade and the Labor Market. Ed. by Abowd, J.M. and Freeman, R.B., NBER: 201-234.
Akbari, A.H. and Devoretz, D.J. (1992) The Substitutability of Foreign-Born Labour in Canadian-Production: Circa 1980. The Canadian Journal of Economics 25(3): 604-614
Angrist, J.D. and Kugler, A. (2003) Protective or Counter-Productive? Labor Market Institutions and the Effect of Immigration on EU Natives. The Economic Journal 113: F302-F331.
Aydemir, A. and Borjas, G.J. (2006) A Comparative Analysis of the Labor Market Impact of International Migration: Canada, Mexico, and the United States, NBER Working Paper No. 12327.
Bauer, T. (1998) Do Immigrants Reduce Natives’ Wages? Evidence from Germany, Dept. of Economics Rutgers University Working Paper No. 1998/02.
Begg, C.B. (1994) Publication Bias. The Handbook of Research Synthesis. Ed. by Cooper, H. and Hedges, L.V. New York, Russel Sage Foundation: 399-409.
Bonin, H. (2005) Wage and Employment Effects of Immigration to Germany: Evidence from a Skill Group Approach, IZA Discussion Paper No. 1875.
Borjas, G.J. (1987) Immigrants, Minorities, and Labor Market Competition. Industrial and Labor Relations Review 40(3): 382-392.
Borjas, G.J. (2003) The Labor Demand Curve Is Downward Sloping: Reexamining the Impact of Immigration on the Labor Market. Quarterly Journal of Economics 118(4): 1335-1374.
Borjas, G.J., Freeman, R.B. and Katz, L.F. (1996) Searching for the Effect of Immigration on the Labor Market. The American Economic Review 86(2): 246-251.
Borjas, G.J., Freeman, R.B. and Katz, L.F. (1997) How Much Do Immigration and Trade Affect Labor Market Outcomes? Brookings Papers on Economic Activity 1:1997: 1-90.
Borjas, G.J. (2006) Native Internal Migration and the Labor Market Impact of Immigration. The Journal of Human Resources 41(2): 221-258.
Card, D. (2001) Immigrant Inflows, Native Outflows, and the Local Market Impacts of Higher Immigration. Journal of Labor Economics 19(1): 22-64.
Card, D. and Krueger, A.B. (1995) Time-Series Minimum-Wage Studies: A Meta-Analysis. The American Economic Review 85(2): 238-243.
Carrasco, R., Jimeno, J.F. and Ortega, A.C. (2006) The Effect of Immigration on the Employment Opportunities of Native-Born Workers: Some Evidence for Spain, Paper Presented at the Conference on Immigration: Impacts, Integration and Intergenerational Issues, London, 29th to 31st March 2006.
Carrington, W.J. and de Lima, P.J.F. (1996) The Impact of 1970s Repatriates from Africa on the Portuguese Labor Market. Industrial and Labor Relations Review 49(2): 330-347.
Cohen-Goldner, S. and Paserman, D. (2004) The Dynamic Impact of Immigration on Natives' Labour Market Outcomes: Evidence from Israel, CEPR Discussion Paper No. 4640.
24
Cooper, Harris and Larry V Hedges, Eds. (1994), The Handbook of Research Synthesis. New York, Russel Sage Fundation.
De New, J.P. and Zimmermann, K.F. (1994) Native Wage Impacts of Foreign Labor: A Random Effects Panel Analysis. Journal of Population Economics 7: 177-192.
Dolado, J.J., Jimeno, J.F. and Duce, R. (1996) The Effects of Migration on the Relative Demand of Skilled Versus Unskilled Labour: Evidence from Spain. London, CEPR Discussion Paper No. 1476.
Dustmann, C., Fabbri, F. and Preston, I. (2005) The Impact of Immigration on the British Labour Market. The Economic Journal 115(507): F324-F341.
Enchautegui, M.E. (1995) Effects of Immigrants on the 1980-1990 U.S. Wage Experience. Contemporary Economic Policy XIII: 20-38.
Enchautegui, M.E. (1997) Immigration and County Employment Growth. Population Research and Policy Review 16: 493-511.
Florax, R.J.G.M. (2002) Methodological Pitfalls in Meta-Analysis: Publication Bias. Comparative Environmental Economic Assessment. Ed. by Florax, R.J.G.M., Nijkamp, P. and Willis, K.G. Cheltenham, Edward Elgar: 177-207.
Friedberg, R.M. (2001) The Impact of Mass Migration on the Israeli Labor Market. The Quarterly Journal of Economics 116(4): 1373-1408.
Friedberg, R.M. and Hunt, J. (1995) The Impact of Immigrants on Host Country Wages, Employment and Growth. The Journal of Economic Perspectives 9(2): 23-44.
Gilpin, N., Henty, M., Lemos, S., Portes, J. and Bullen, C. (2006) The Impact of Free Movement of Workers from Central and Eastern Europe on the UK Labour Market, Department for Work and Pensions Working Paper No. 29.
Glaeser, E.L. (2006) Research Incentives and Empirical Methods, NBER Technical Working Paper 329.
Greenwood, M.J., Hunt, G.L. and Kohli, U. (1997) The Factor-Market Consequences of Unskilled Immigration to the United States. Labour Economics 4(1): 1-28.
Gross, D. (2002) Three Million Foreigners, Three Million Unemployed? Immigration Flows and the Labour Market in France. Applied Economics 34(16): 1969-1983.
Gross, D. (2004) Impact of Immigrant Workers on a Regional Labour Market. Applied Economics Letters 11(7): 405-408
Grossman, J.B. (1982) The Substitutability of Natives and Immigrants in Production. The Review of Economics and Statistics 64(4): 596-603.
Hamermesh, D. (2007) Replication in Economics, NBER Working Paper No. 13026, National Bureau of Economic Research, Cambridge Mass.
Hofer, H. and Huber, P. (2003) Wage and Mobility Effects of Trade and Migration on the Austrian Labour Market. Empirica 30: 107-125.
Howell, D.R. and Mueller, E.J. (1997) The Effects of Immigrants on African-American Earnings: A Job-Level Analysis of the New York City Labor Market 1979-89. New York, R. J. Milano Graduate School, New School for Social Research Working Paper No. 210.
Hunt, J. (1992) The Impact of the 1962 Repatriates from Algeria on the French Labor Market. Industrial and Labor Relations Review 45(3): 556-572.
Jean, S. and M. Jimenez (2007), The Unemployment Impact of Immigration in OECD Countries, OECD Economics Department Working Papers, No. 563.
Johannsson, H. and Shulman, S. (2003) Immigration and the Employment of African American Workers. Review of Black Political Economy 31(1-2): 95-110.
25
Johannsson, H. and Weiler, S. (2004) Local Labor Market Adjustment to Immigration: The Roles of Participation and the Short Run. Growth and Change 35(1): 61-76.
Kugler, A. and Yuksel, M. (2006) Effects of Low-Skilled Immigration on U.S. Natives: Evidence from Hurricane Mitch, University of Huston.
Lach, S. (2007) Immigration and Prices. Journal of Political Economy, 115(4): 548-587.
Longhi, S., Nijkamp, P. and Poot, J. (2005a) A Meta-Analytic Assessment of the Effect of Immigration on Wages. Journal of Economic Surveys 19(3): 451-477.
Longhi, S., Nijkamp, P. and Poot, J. (2005b) The Fallacy of ‘Job Robbing’: A Meta-analysis of Estimates of the Effect of Immigration on Employment. Journal of Migration and Refugee Issues 1(4): 131-152.
Orrenius, P.M. and Zavodny, M. (2006) Does Immigration Affect Wages? A Look at Occupation-Level Evidence, IZA Discussion Paper No. 2481.
Ottaviano, G.I.P. and Peri, G. (2005) Rethinking the Gains from Immigration: Theory and Evidence from the U.S., NBER Working Paper 11672.
Ottaviano, G.I.P. and Peri, G. (2006) Rethinking the Effects of Immigration on Wages, NBER Working Paper 12497, National Bureau of Economic Research, Cambridge Mass.
Pedace, R. (1998) The Impact of Immigration on the Labor Market for Native-Born Workers: Incorporating the Dynamics of Internal Migration. Eastern Economic Journal 24(4): 449-462.
Pedace, R. (2000) Immigration, Labor Market Mobility, and the Earnings of Native-Born Workers: An Occupational Segmentation Approach, Claremont Colleges - Working Papers in Economics 46.
Peri, G. (2007) Immigrants’ Complementarities and Native Wages: Evidence from California, NBER Working Paper No. 12956.
Pischke, J.-S. and Velling, J. (1997) Employment Effects of Immigration to Germany: An Analysis Based on Local Labor Markets. The Review of Economics and Statistics 79: 594-604.
Pope, D. and Withers, G. (1993) Do Migrants Rob Jobs? Lessons of Australian History, 1861-1991. The Journal of Economic History 53(4): 719-742.
Saiz, A. (2007) Immigration and Housing Rents in American Cities. Journal of Urban Economics 61(2): 345-371.
Stanley, T.D. (2005) Beyond Publication Bias. Journal of Economic Surveys 19(3): 309-345.
Stanley, T.D., Florax, R.J.G.M. and de Groot, H.L.F. (2004) It's All About Power: Differentiating Genuine Empirical Significance from the Artefact of Publication Bias, Mimeo.
Winegarden, C.R. and Khor, L.B. (1991) Undocumented Immigration and Unemployment of U.S. Youth and Minority Workers: Econometric Evidence. The Review of Economics and Statistics 73(1): 105-112.
Winter-Ebmer, R. and Zimmermann, K.F. (1999) East-West Trade and Migration: The Austro-German Case. Migration, the Controversies and the Evidence. Ed. by Faini, R., De Melo, J. and Zimmermann, K.F. Cambridge (UK), Cambridge University Press: 296-327.
Winter-Ebmer, R. and Zweimuller, J. (1996) Immigration and the Earnings of Young Native Workers. Oxford Economic Papers 48(3): 473-491.
World Bank. (2006). Global Economic Prospects: Economic Implications of Remittances and Migration. Washington D.C.: World Bank.
26
Zorlu, A. and Hartog, J. (2005) The Effect of Immigration on Wages in Three European Countries. Journal of Population Economics 18: 113-151.
27
Tables and Figures
0.2
.40
.2.4
-10 0 10 20 -10 0 10 20
Wages Employment
Unemployment Labour Force
Den
sity
t-ValueGraphs by Dependent variable in the primary regressions
Figure 1: Distribution of t statistics by labour market variable of interest
28
050
010
0015
0020
00sq
rt(sa
mpl
e si
ze)
-1 -.5 0 .5 1Z
Figure 2a: Funnel plot on all Zr effect sizes
050
100
150
200
sqrt(
sam
ple
size
)
-1 -.5 0 .5 1Z
Figure 2b: Funnel plot of only those Zr effect sizes for which the square root of the sample size is smaller than 200
29
Table 1: The primary studies
Effect on (No. Observations): Study Country Wages Employment Unemployment Labour Force
Total
1 Grossman, 1982 US 3 3 2 Borjas, 1987 US 48 48 3 Altonji and Card, 1991 US 28 39 21 88 4 Winegarden and Khor, 1991 US 4 4 5 Akbari and Devoretz, 1992 Canada 6 6 6 Hunt, 1992 France 5 4 9 7 Pope and Withers, 1993 Australia 4 4 8 8 De New and Zimmermann, 1994 Germany 8 8 9 Enchautegui, 1995 US 16 16 10 Borjas et al., 1996 US 20 20 11 Carrington and de Lima, 1996 Portugal 5 5 5 15 12 Dolado et al., 1996 Spain 6 6 12 13 Winter-Ebmer and Zweimuller, 1996 Austria 23 23 14 Borjas et al., 1997 US 28 14 42 15 Enchautegui, 1997 US 8 8 16 Greenwood et al., 1997 US 32 32 64 17 Howell and Mueller, 1997 NY City 14 14 18 Pischke and Velling, 1997 Germany 12 18 30 19 Bauer, 1998 Germany 18 18 20 Pedace, 1998 US 12 12 24 21 Winter-Ebmer and Zimmermann, 1999 Austria
Germany 4 4
8 8
12 12
22 Pedace, 2000 US 24 24 23 Card, 2001 US 28 28 56 24 Friedberg, 2001 Israel 15 2 17 25 Addison and Worswick, 2002 Australia 23 23 26 Gross, 2002 France 5 5
30
27 Angrist and Kugler, 2003 Europe 48 48 28 Borjas, 2003 US 50 19 69 29 Hofer and Huber, 2003 Austria 8 8 30 Johannsson and Shulman, 2003 US 2 2 4 31 Cohen-Goldner and Paserman, 2004 Israel 58 40 98 32 Gross, 2004 British Columbia 1 1 2 33 Johannsson and Weiler, 2004 US 4 4 8 34 Bonin, 2005 Germany 52 31 83 35 Dustmann et al., 2005 UK 6 6 6 6 24 36 Ottaviano and Peri, 2005 US 12 12 37 Zorlu and Hartog, 2005 Norway
Netherlands 6
10 6
10 38 Aydemir and Borjas, 2006 Canada
US 22 22
1 1
23 23
39 Borjas, 2006 US 20 20 40 Carrasco et al., 2006 Spain 12 49 61 41 Gilpin et al., 2006 UK 86 86 42 Kugler and Yuksel, 2006 US 132 132 264 43 Orrenius and Zavodny, 2006 US 54 54 44 Jean and Jimenez, 2007 OECD 18 EU 2 45 Peri, 2007 California 16 24 40 Observations 854 500 185 33 1572 Average (absolute) t statistic 2.565 2.105 1.383 1.568
31
Table 2: Distribution of the effect sizes
Effect on (No. Observations):
t statistic Wages Employment Unemployment Labour Force
Participation
Total
t ≤ -2.576 174 102 17 4 297 -2.576 < t ≤ -1.960 55 28 6 5 94 -1.960 < t ≤ -1.645 34 17 4 1 56 Total negative and significant (10% level) 263 147 27 10 447 -1.645 < t ≤ -0.001 175 126 106 16 423 -0.001 < t ≤ 0.001 3 6 5 0 14 0.001 < t ≤ 1.645 203 136 35 4 378 Total insignificant 381 268 146 20 815 1.645 < t ≤ 1.960 24 16 1 1 42 1.960 < t ≤ 2.576 41 26 2 2 71 t > 2.576 145 43 9 0 197 Total positive and significant (10% level) 210 85 12 3 310 Total 854 500 185 33 1572 Of which statistically insignificant at 10% level (%) 44.6 53.6 78.9 60.6 Average t statistic of negative effect sizes -2.882 -2.316 -1.273 -1.684 Average t statistic of positive effect sizes 2.248 1.846 1.844 1.137 Note: signs of t statistics of immigration variables in unemployment regressions are reversed. A statistically significant positive t statistic in the unemployment column of this table refers to immigration conclusively reducing unemployment of the native born.
32
Table 3a: Number of observations by sub-group Labour Market Effect: Study Characteristic (1)
Percent t ≤ -1.96
(2) Percent
-1.96 < t < 1.96
(3) Percent t ≥ 1.96
Total
All 24.9 58.1 17.0 1572
Type of Publication Journal 29.6 52.6 17.8 652 Book 17.0 65.2 17.9 112 Working Paper 22.2 61.5 16.3 808
Year of Publication 1980s 33.3 47.1 19.6 51 1990s 18.7 59.1 22.2 433 2000s 26.9 58.2 14.9 1088
Labour Market Impact Wages 26.8 51.4 21.8 854 Employment 26.0 60.2 13.8 500 Unemployment 12.4 81.6 5.9 185 Labour Force
Participation 27.3 66.7 6.1 33
Country US 23.8 54.6 21.6 923 EU 20.8 67.8 11.4 490 Others 40.5 52.8 6.7 195
Size of the Area Big 26.8 59.2 14.0 893 Small 15.8 74.7 9.5 95 Very Small 23.5 53.6 22.9 584
Kind of Data Cross Section 768 -0.040 0.160 -0.818 1.136 Pooled 745 -0.004 0.143 -0.733 0.760 # Five meta-observations were dropped because the standard errors were zero up to the smallest reported digit after the decimal point, while another 54 observations were dropped because the number of observations of the primary study regression could not be found.
34
Table 4: Test for publication bias Dep. Variable: ln|t| (1)
All (2)
Only on Wages (3)
Only on Employment Ln √ sample size 0.066* 0.056 0.186** (0.037) (0.046) (0.074) Adjusted R2 0.105 0.128 0.115 Observations 1499 797 489 Robust standard errors in parenthesis; * Significant at 10%, ** Significant at 5%, *** Significant at 1% Other explanatory variables: type of publication, where it applies (book or working paper); year of publication (1990s or 2000s); labour market impact, where it applies (employment, unemployment or labour force); country (EU or others); size of the area (big or small); approach (economic or natural experiment); natives’ skills (everybody, high-skill natives, low-skill natives); impact on (everybody or immigrants); kind of data (pooled); data (1960s, 1970s, 1980s, 1990s, and 2000s).
35
Table 5: Ordered probit models for wages and employment Dep. Variable: -1 if t ≤ -2.576 0 if -2.576 < t < +2.576 +1 if t ≥ +2.576
(1) All
(2) Only on Wages
(3) Only on
EmploymentType of Publication Book -0.285* -0.473** -0.471 [Journal] (0.155) (0.230) (0.290) Working Paper 0.134 -0.108 0.721*** (0.090) (0.123) (0.175) Year of Publication 1990s 0.212 0.512** [1980s] (0.246) (0.260) 2000s 0.052 0.625** -1.176*** (0.274) (0.305) (0.226) Labour Market Impact Employment -0.250*** [Wages] (0.072) Unemployment 0.040 (0.117) Labour Force
Participation
-0.421**
(0.184) Country EU -0.117 0.137 -0.222 [US] (0.117) (0.171) (0.295) Others -0.391*** -0.556*** -0.162 (0.128) (0.163) (0.391) Size of the Area Big -0.206* -0.410*** 0.024 [Very Small] (0.108) (0.139) (0.287) Small -0.282** -0.665** -0.207 (0.130) (0.270) (0.477) Approach Economic 0.222* 0.431** 0.043 [Data Driven] (0.133) (0.205) (0.195) Natural Experiment 0.180* 0.255* 0.531** (0.099) (0.141) (0.240) Natives’ Skills Everybody -0.472*** -0.283** -0.704*** [Low-Skill Natives] (0.102) (0.128) (0.244) High-Skill Natives 0.101 0.052 0.188 (0.101) (0.124) (0.189) Impact on Everybody 0.402** 0.343 1.385*** [Natives] (0.179) (0.280) (0.372) Immigrants -0.213* -0.322** -0.065 (0.113) (0.145) (0.196) Kind of Data Pooled 0.331*** 0.351*** 0.430** [Cross Section] (0.072) (0.102) (0.187) Length of Data (years) -0.005 -0.008 0.003 (0.004) (0.005) (0.010) ln(Sample size) -0.018*** -0.000 -0.044*** (0.005) (0.007) (0.010) μ1 -1.266*** -0.791** -1.548*** (0.272) (0.324) (0.240) μ2 0.941*** 1.172*** 1.273*** (0.272) (0.324) (0.234) Observations 1518 800 500 Robust standard errors in parenthesis; * Significant at 10%, ** Significant at 5%, *** Significant at 1% Reference categories in brackets
Type of Publication Book 0.081* -0.037 -0.044** Working Paper -0.034 0.010 0.024 Year of Publication 1990s -0.052 0.011 0.041 2000s -0.013 0.004 0.009 Labour Market Impact Employment 0.066*** -0.023*** -0.043*** Unemployment -0.010 0.003 0.007 Labour Force
Participation 0.126** -0.068 -0.058*** Country EU 0.030 -0.010 -0.021 Others 0.113*** -0.054** -0.059*** Size of the Area Big 0.051* -0.013** -0.038* Small 0.080** -0.036 -0.043** Approach Economic -0.052* 0.007** 0.045 Natural Experiment -0.044* 0.010** 0.034* Natives’ Skills Everybody 0.115*** -0.024*** -0.091*** High-Skill Natives -0.025 0.006 0.019 Impact on Everybody -0.085*** -0.005 0.090* Immigrants 0.058* -0.023 -0.035** Kind of Data Pooled -0.084*** 0.024*** 0.060*** Length of Data (years) 0.001 0.000 -0.001 ln(Sample size) 0.004*** -0.001*** -0.003***
Marginal effects: (2) Wages
Type of Publication Book 0.149* -0.065 -0.084*** Working Paper 0.029 -0.005 -0.024 Year of Publication 1990s -0.123** -0.006 0.129* 2000s -0.180* 0.052 0.128** Country EU -0.035 0.003 0.032 Others 0.172*** -0.071** -0.101*** Size of the Area Big 0.105*** -0.008 -0.097*** Small 0.221** -0.117 -0.104*** Approach Economic -0.099** -0.014 0.113* Natural Experiment -0.064* 0.003 0.061* Natives’ Skills Everybody 0.074** -0.008 -0.066** High-Skill Natives -0.014 0.002 0.012 Impact on Everybody -0.078 -0.013 0.091 Immigrants 0.094** -0.029 -0.065** Kind of Data Pooled -0.091*** 0.009 0.082*** Length of Data (years) 0.002 0.000 -0.002 ln(Sample size) 0.000 0.000 0.000
Type of Publication Book 0.127 -0.098 -0.029** Working Paper -0.165*** 0.101*** 0.064*** Year of Publication 2000s 0.209*** -0.052* -0.158*** Country EU 0.053 -0.035 -0.017 Others 0.039 -0.027 -0.012 Size of the Area Big -0.006 0.003 0.002 Small 0.052 -0.037 -0.015 Approach Economic -0.010 0.006 0.004 Natural Experiment -0.117** 0.069** 0.048** Natives’ Skills Everybody 0.158*** -0.094*** -0.064** High-Skill Natives -0.040 0.023 0.017 Impact on Everybody -0.150*** -0.148 0.298** Immigrants 0.015 -0.010 -0.005 Kind of Data Pooled -0.100** 0.065** 0.036** Length of Data (years) -0.001 0.000 0.000 ln(Sample size) 0.010*** -0.006*** -0.004*** P(k = -1) is the probability that the effect size is negative and statistically significant at 1%; P(k = 0) is the probability that the effect size is not statistically significant at the 1% level; P(k = 1) is the probability that the effect size is positive and statistically significant at 1%. Reference categories. Type of Publication: Journal; Year of Publication: 1980s; Labour Market Impact: Wages; Country: US; Size of the Area: Very Small; Approach: Data Driven; Natives’ Skills: Low-Skill Natives; Impact on: Natives; Kind of Data: Cross Section