Metabolic Changes in Lung Tissue of Tuberculosis-Infected Mice Using GC/Q-TOF with Low Energy EI Application Brief Authors Mª Fernanda Rey-Stolle 1 , Vineel P. Reddy 2 , Santiago Angulo 1 , Adrie J.C. Steyn 2,3,4 , Sofia Nieto 5 , Nathan Eno 5 , and Coral Barbas 1 1 CEMBIO, Facultad de Farmacia, Universidad CEU San Pablo Madrid, Spain 2 Department of Microbiology, University of Alabama at Birmingham Birmingham, AL 3 KwaZulu-Natal Research Institute for TB and HIV (KRITH) Durban, South Africa 4 UAB Center for Free Radical Biology, University of Alabama at Birmingham Birmingham, AL 5 Agilent Technologies, Inc. Santa Clara, CA Introduction The global burden of tuberculosis (TB) is vast, with an estimated 9.6 million new TB cases and 1.5 million deaths due to the disease in 2014 alone [1]. Using metabolomics, TB biomarkers can be identified to make progress in our understanding of the disease. This study used a mouse model of Mycobacterium tuberculosis (Mtb) infection to determine the metabolic profile of uninfected and infected lung tissues. To identify new pathophysiological pathways involved in infection as well as biomarkers of TB, an untargeted metabolomics study was performed using uninfected and infected lung tissue at 9 weeks following infection. After initial compound annotation, low-energy EI data were used to confirm the molecular ions and identify molecular formulas of putatively identified compounds and unknowns, respectively.
Transcript
Metabolic Changes in Lung Tissue of Tuberculosis-Infected Mice Using GC/Q-TOF with Low Energy EI
Application Brief
Authors
Mª Fernanda Rey-Stolle1, Vineel P. Reddy2, Santiago Angulo1, Adrie J.C. Steyn2,3,4, Sofia Nieto5, Nathan Eno5, and Coral Barbas1
1 CEMBIO, Facultad de Farmacia, Universidad CEU San Pablo Madrid, Spain
2 Department of Microbiology, University of Alabama at Birmingham Birmingham, AL
3 KwaZulu-Natal Research Institute for TB and HIV (KRITH) Durban, South Africa
4 UAB Center for Free Radical Biology, University of Alabama at Birmingham Birmingham, AL
5 Agilent Technologies, Inc. Santa Clara, CA
IntroductionThe global burden of tuberculosis (TB) is vast, with an estimated 9.6 million new TB cases and 1.5 million deaths due to the disease in 2014 alone [1]. Using metabolomics, TB biomarkers can be identified to make progress in our understanding of the disease. This study used a mouse model of Mycobacterium tuberculosis (Mtb) infection to determine the metabolic profile of uninfected and infected lung tissues.
To identify new pathophysiological pathways involved in infection as well as biomarkers of TB, an untargeted metabolomics study was performed using uninfected and infected lung tissue at 9 weeks following infection. After initial compound annotation, low-energy EI data were used to confirm the molecular ions and identify molecular formulas of putatively identified compounds and unknowns, respectively.
2
ExperimentalMice were infected with 5 × 10⁴ CFU of Mycobacterium tuberculosis (Mtb) H37Rv through the intratracheal route. The dried extracts of lung tissue were derivatized by O-methoximation followed by trimethylsilylation. GC/MS analysis was performed using an Agilent 7890B GC system coupled to a novel high-resolution Agilent 7250 GC/Q-TOF equipped with an EI source, allowing low-energy ionization (Figure 1). In addition to the new low-energy EI source, the 7250 system is capable of high resolving power (25,000 at m/z 272), improved mass accuracy, and a wide dynamic range. Table 1 shows the instrument parameters.
A retention time locked (RTL) Fiehn method was used to facilitate compound identification when using Fiehn.L RI library for initial compound identification. In addition, the National Institute of Standards and Technology Library (NIST.L) as well as an accurate mass Metabolomics PCDL were used to identify additional hits. Feature detection was performed using SureMass signal processing in Agilent MassHunter Unknowns Analysis B.08.00. Statistical analysis was performed in Agilent Mass Profiler Professional (MPP) version 13.0. Pathway Architect, an extenstion tool for MPP, was used to identify biochemical pathways associated with TB infection. Figure 1. Agilent 7250 GC/Q-TOF.
Table 1. Agilent 7250 GC/Q-TOF Conditions
Parameter ValueColumn Agilent DB-5MS,
30 m × 0.25 mm, 0.25 µm, DuraGuard, 10 m
Injection volume 1 µLSplit ratio 10:1Split/Splitless inlet temperature 250 °COven temperature program 60 °C for 1 minute
10 °C/min to 325 °C 9.5 minutes hold
Carrier gas Helium at 1 mL/min constant flowTransfer line temperature 290 °CIonization mode Standard EI at 70 eV
Low electron energy EI at 17 eV, 15 eV, and 12 eV
Source temperature 200 °CQuadrupole temperature 150 °CMass range 50 to 950 m/zSpectral acquisition rate 5 Hz
3
Differential analysisIn MPP, principal component analysis (PCA) was used to evaluate clustering of the data. Distinct clusters that represent clear separation between the uninfected control and infected tissues were formed (Figure 3).
Results and Discussion
Experimental setup and feature detectionTo identify new pathophysiological pathways involved in infection as well as biomarkers of TB, an untargeted metabolomics study was performed using uninfected and infected lung tissue extracts at 9 weeks following infection.
Following feature detection and a library search performed in Unknowns Analysis (Figure 2), the results were exported as .CEF files for further processing in MPP.
Figure 2. Feature detection and library search performed in Agilent MassHunter Unknowns Analysis (using PCDL as an example).
Figure 3. PCA plot. Distinct clusters from uninfected control (UC, blue circles) and 9 weeks following the infection (9W, red circles) lung tissues were observed.
9W
UC
4
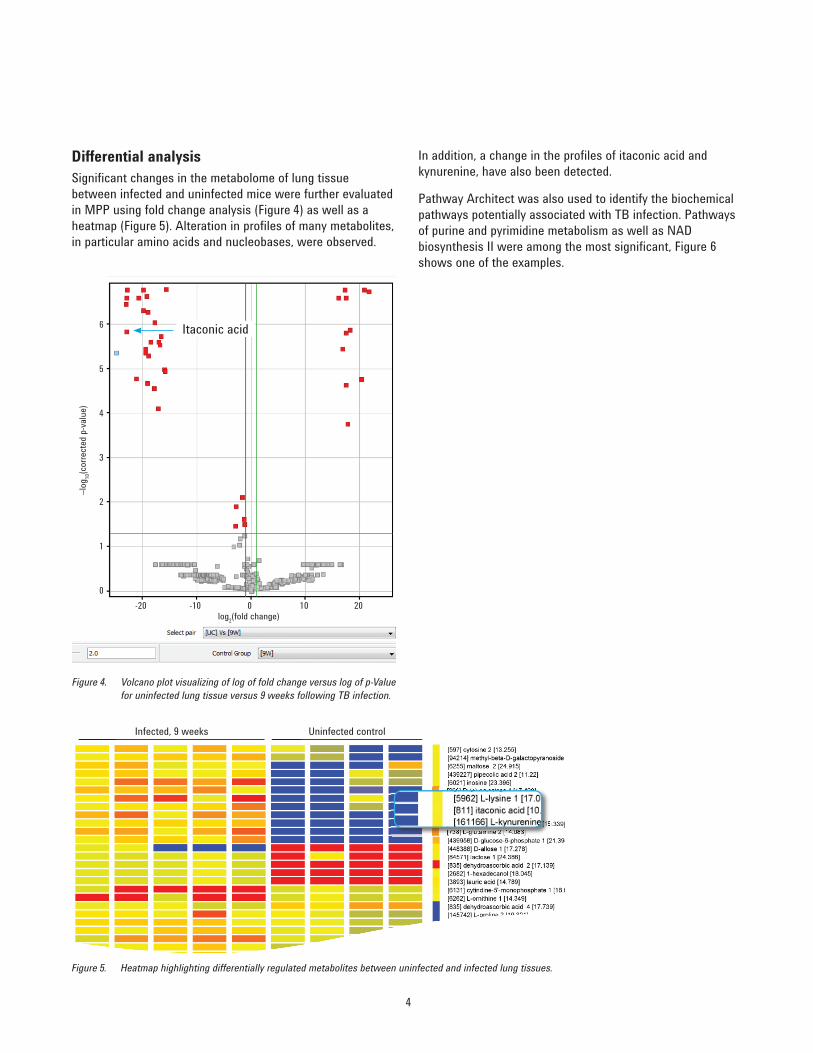
Differential analysisSignificant changes in the metabolome of lung tissue between infected and uninfected mice were further evaluated in MPP using fold change analysis (Figure 4) as well as a heatmap (Figure 5). Alteration in profiles of many metabolites, in particular amino acids and nucleobases, were observed.
log2(fold change)
–log
10(c
orre
cted
p-va
lue)
6
5
4
3
2
1
0-20 -10 0 10 20
Itaconic acid
Figure 4. Volcano plot visualizing of log of fold change versus log of p-Value for uninfected lung tissue versus 9 weeks following TB infection.
Figure 5. Heatmap highlighting differentially regulated metabolites between uninfected and infected lung tissues.
Infected, 9 weeks Uninfected control
In addition, a change in the profiles of itaconic acid and kynurenine, have also been detected.
Pathway Architect was also used to identify the biochemical pathways potentially associated with TB infection. Pathways of purine and pyrimidine metabolism as well as NAD biosynthesis II were among the most significant, Figure 6 shows one of the examples.
5
The first step in an attempt to elucidate the structures of unknowns was to use low electron energy to help identify molecular ions (M+). MS/MS was further obtained at optimal electron energy to maximize the absolute abundance of M+ use as a precursor. Unknown compound MS/MS spectra were then extracted using the Find by Targeted MS/MS algorithm in Qual. The results were evaluated in Molecular Structure Correlator (MSC) (Figure 8).
Unknowns identification and confirmation of tentative hitsAfter initial compound annotation and differential analysis in MPP, low-energy EI spectra were used to confirm the molecular ions and identify molecular formulas of putatively identified differential compounds and unknowns, respectively (Figure 7).
Figure 6. Example of Pathway Analysis results: NAD Biosynthesis II.
Figure 7. Confirmation of the molecular ion (M+) using low electron energy.
ConclusionsThe untargeted metabolomics study demonstrated an alteration in amino acids profile, as well as a change in kynurenine and itaconic acid profiles. Interestingly, itaconic acid is not generally classified as a mammalian metabolite, however, it has recently been shown to likely play a role in macrophage-based immune response [2].
References1. World Health Organization (http://www.who.int/
mediacentre/factsheets/fs104/en/)
2. Cheryl L. Strelko, et al. J. Am. Chem. Soc. 133(41), 16386–16389 (2011).
www.agilent.com/chemFor Research Use Only. Not for use in diagnostic procedures.
Agilent shall not be liable for errors contained herein or for incidental or consequential damages in connection with the furnishing, performance, or use of this material.
Information, descriptions, and specifications in this publication are subject to change without notice.
For More InformationThese data represent typical results. For more information on our products and services, visit our Web site at www.agilent.com/chem.
Figure 8. Structure elucidation of unknown compounds using low electron energy and MS/MS with Molecular Structure Correlator (MSC). Shown are possible structures of an unknown compound.