Page 1
doi.org/10.26434/chemrxiv.11312828.v2
Metabolomics Analysis Reveals Both Plant Variety and Choice ofHormone Treatment Modulate Vinca Alkaloid Production in CatharanthusRoseus.Valerie Fraser, Benjamin Philmus, Molly Megraw
Submitted date: 22/04/2020 • Posted date: 22/04/2020Licence: CC BY-NC-ND 4.0Citation information: Fraser, Valerie; Philmus, Benjamin; Megraw, Molly (2019): Metabolomics AnalysisReveals Both Plant Variety and Choice of Hormone Treatment Modulate Vinca Alkaloid Production inCatharanthus Roseus.. ChemRxiv. Preprint. https://doi.org/10.26434/chemrxiv.11312828.v2
The medicinal plant Catharanthus roseusproduces numerous secondary metabolites of interest for thetreatment of many diseases—most notably for the terpene indole alkaloid (TIA) vinblastine, which is used inthe treatment of leukemia and Hodgkin’s lymphoma. Historically, methyl jasmonate (MeJA) has been used toinduce TIA production, but in the past, this has only been investigated in either whole seedlings, cell culture, orhairy root culture. In this work, we investigate the induction capabilities of MeJA and ethylene, a differentphytohormone, in both the shoots and roots of two varieties of C. roseus. Using LCMS and RT-qPCR, wedemonstrate the importance of variety selection, as we observe markedly different induction patterns ofimportant TIA precursor compounds. Additionally, both phytohormone choice and concentration havesignificant effects on TIA biosynthesis. Finally, our study suggests that several early-induction pathway stepsas well as pathway-specific genes are likely to be transcriptionally regulated. Our findings highlight the needfor a complete set of ’omics resources in commonly used C. roseus varieties.
File list (4)
download fileview on ChemRxivCroseus_manuscript_final.pdf (813.46 KiB)
download fileview on ChemRxivCroseus_paper_ACS_SI_final.pdf (594.67 KiB)
download fileview on ChemRxivCroseus_paper_Plant_Direct_final.pdf (608.52 KiB)
download fileview on ChemRxivcroseus_eth_meja_supp_figs.pdf (906.65 KiB)
Page 2
1
Metabolomics analysis reveals both plant variety and
choice of hormone treatment modulate vinca
alkaloid production in Catharanthus roseus.
Valerie N. Fraser†‡, Benjamin Philmus§⊥*, Molly Megraw‡⊥*.
†Molecular and Cellular Biology Program, Oregon State University, Corvallis, Oregon 97331,
United States.
‡Department of Botany and Plant Pathology, Oregon State University, Corvallis, Oregon 97331,
United States.
§Department of Pharmaceutical Sciences, Oregon State University, Corvallis, Oregon 97331,
United States.
⊥Center for Genomics and Biocomputing, Oregon State University, Corvallis, Oregon 97331,
United States.
Page 3
2
ABSTRACT.
The medicinal plant Catharanthus roseus produces numerous secondary metabolites of interest
for the treatment of many diseases—most notably for the terpene indole alkaloid (TIA)
vinblastine, which is used in the treatment of leukemia and Hodgkin’s lymphoma. Historically,
methyl jasmonate (MeJA) has been used to induce TIA production, but in the past, this has only
been investigated in either whole seedlings, cell culture, or hairy root culture. In this work, we
investigate the induction capabilities of MeJA and ethylene, a different phytohormone, in both
the shoots and roots of two varieties of C. roseus. Using LCMS and RT-qPCR, we demonstrate
the importance of variety selection, as we observe markedly different induction patterns of
important TIA precursor compounds. Additionally, both phytohormone choice and concentration
have significant effects on TIA biosynthesis. Finally, our study suggests that several early-
induction pathway steps as well as pathway-specific genes are likely to be transcriptionally
regulated. Our findings highlight the need for a complete set of ’omics resources in commonly
used C. roseus varieties.
Page 4
3
Many plant-derived secondary metabolites have chemical properties that give them therapeutic
value for the treatment of cancers, hypertension, and other illnesses1. In the medicinal plant
Catharanthus roseus (L.) G. Don, the terpene indole alkaloid (TIA) family of natural products,
which include the clinically used antineoplastic agents vinblastine and vincristine, and the
antihypertensive agent ajmalicine. Vinblastine and vincristine, used in the treatment of
lymphoblastic leukemia2, 3 are naturally produced at low levels in the leaves of the plant, which
makes the chemical extraction of the two alkaloids difficult and time consuming4.
Pharmaceutical scientists generally extract the more abundant precursor compounds from the
leaf and perform an in vitro coupling to increase the yield of vinblastine and vincristine, which is
then isolated5, 6; this process, however, can be cost prohibitive. The plant signaling hormone
methyl jasmonate (MeJA) is typically used to induce higher levels of the alkaloid products in the
laboratory through gaseous or hydroponic application after being dissolved in DMSO7, 8, but
recent studies have found that ethylene also induces alkaloid production9, 10. While MeJA is too
expensive for practical use in a large-scale agricultural production, ethephon (a commercially
available ethylene derivative) is a viable and cost-effective option for increasing alkaloid yields
prior to chemical extraction.
Over the last 50 years, vinca alkaloid production has been induced in planta with MeJA via
root-uptake from growth medium or through exposure to vapor in an enclosed system7-9.
Ethylene has only recently been identified as an induction agent10, 11; when used, it is generally
applied via addition to growth medium or foliar application9, 10. Foliar application of ethephon
(ETPN), a compound that is quickly converted to ethylene upon uptake into the cell, does not
require any special equipment and is a method that can be straightforwardly transferred from a
laboratory setting into a greenhouse setting for agricultural-scale production of these desirable
Page 5
4
compounds. If large scale biopharmaceutical production is the ultimate goal, foliar ETPN
treatment is ideal since it is inexpensive and does not need to be reapplied to obtain the desired
result.
Hairy root culture is a commonly studied system with strong potential for C. roseus for
alkaloid production and extraction; however, it is a technically challenging system12. In
particular, this and similar culture systems require special equipment and impeccable sterile
technique to prevent contamination. Additionally, not all precursor alkaloids of interest in the
TIA pathway can be found in the roots at levels that would make extraction viable (e.g.
vindoline) in the absence of further genetic engineering developments in this system13-15, and
those that are present are regulated differently than in seedlings16. Alternatively, C. roseus seeds
are easy to germinate and are relatively fast-growing in soil. Gently uprooting seedlings from the
soil and thoroughly washing in deionized water allows collection of all parts of the plant in a
relatively short amount of time and with minimal concern regarding contamination. These
considerations make plants a good system not only for biological studies but also provides
potential for greenhouse-level scale-up of alkaloid precursor production.
Many different cultivars of C. roseus have been developed for ornamental uses and, of those,
some have also been evaluated for their utility in alkaloid production. Of this genetic diversity,
however, only a few have been selected for genomic resource development17-20. “Little Bright
Eye” (LBE) is a variety that was commonly used for plant pathology research and was used in
the initial efforts to identify the TIA biosynthetic genes. More recently other varieties have been
investigated as part of transcriptional and metabolomic studies17-20. “SunStorm Apricot” (SSA)
was developed for horticultural use and recently was subjected to genome sequencing18. Given
that different varieties of C. roseus have been used by different groups in transcriptomic,
Page 6
5
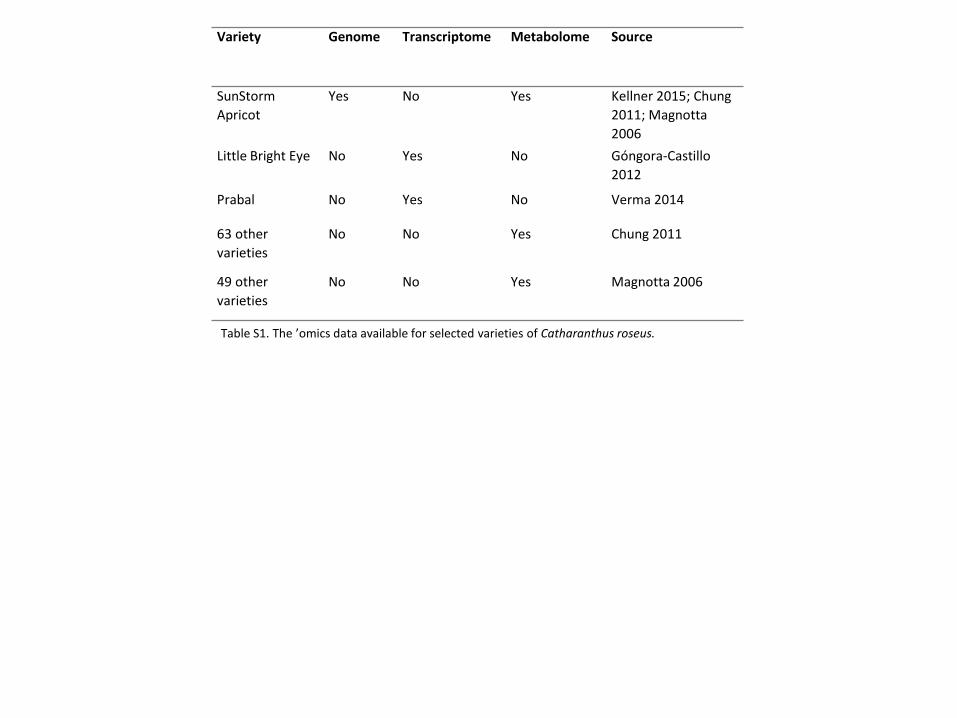
genomic, metabolomic studies of the TIA pathway (Table S1), we sought to investigate the inter-
varietal differences in alkaloid production and response to stimuli. With this in mind, we
designed a study of the alkaloid induction patterns of ethylene and MeJA in these two varieties
of C. roseus (LBE vs. SSA). As shoots and roots are very different from one another, we chose
to separate the plant into two parts, which has not been done in previous C. roseus work. Testing
hormonal induction in LBE has allowed us to compare to previous studies, while including SSA
provides an opportunity for future investigation into the regulation of induction on a genome-
wide scale.
In this work, the natural differences in alkaloid levels between the two varieties were
investigated. Additionally, the in planta effects of foliar MeJA or ETPN treatments on the
metabolomic profiles in both roots and shoots of both varieties were revealed. Finally, this work
examines the transcriptional effect of the phytohormones on the expression of genes involved in
the terpene indole alkaloid biosynthetic pathway and its relation to the metabolomics profile. We
show that unexpectedly, not only do varietal differences play a major role not only in hormonal
induction influence on alkaloid production, but also genetic variation between SSA and LBE is
substantial enough to affect wildtype levels of alkaloids in both roots and shoots.
RESULTS AND DISCUSSION
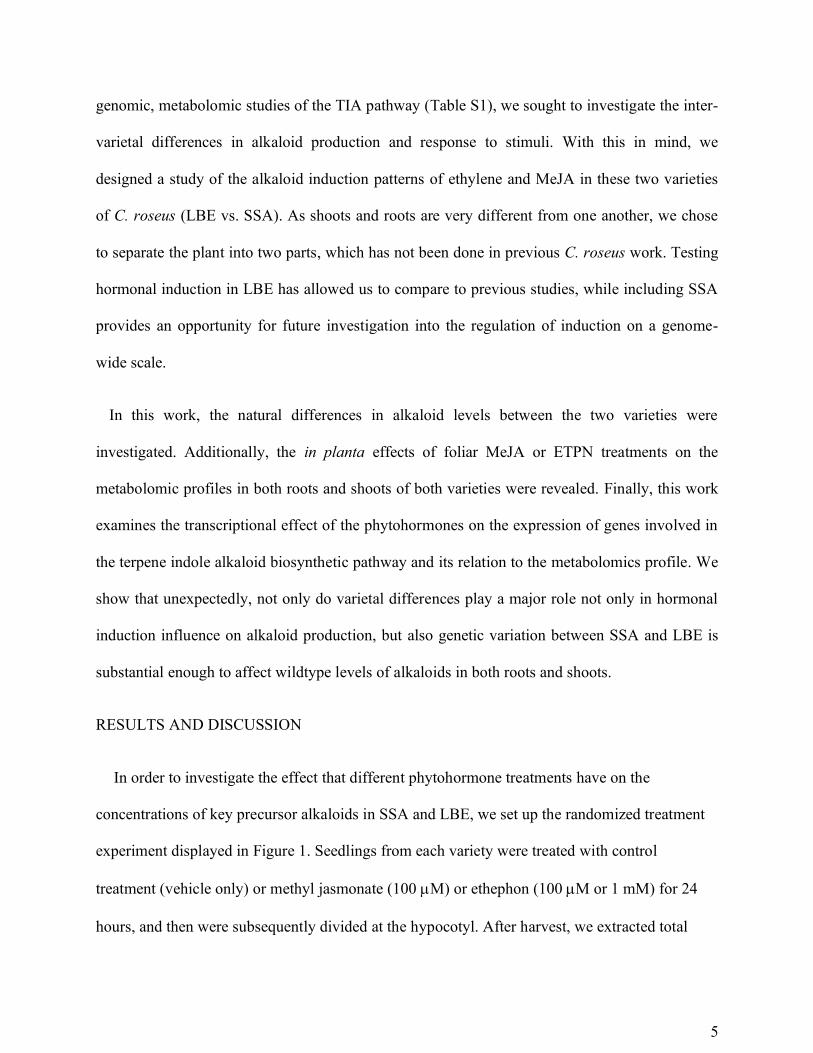
In order to investigate the effect that different phytohormone treatments have on the
concentrations of key precursor alkaloids in SSA and LBE, we set up the randomized treatment
experiment displayed in Figure 1. Seedlings from each variety were treated with control
treatment (vehicle only) or methyl jasmonate (100 M) or ethephon (100 M or 1 mM) for 24
hours, and then were subsequently divided at the hypocotyl. After harvest, we extracted total
Page 7
6
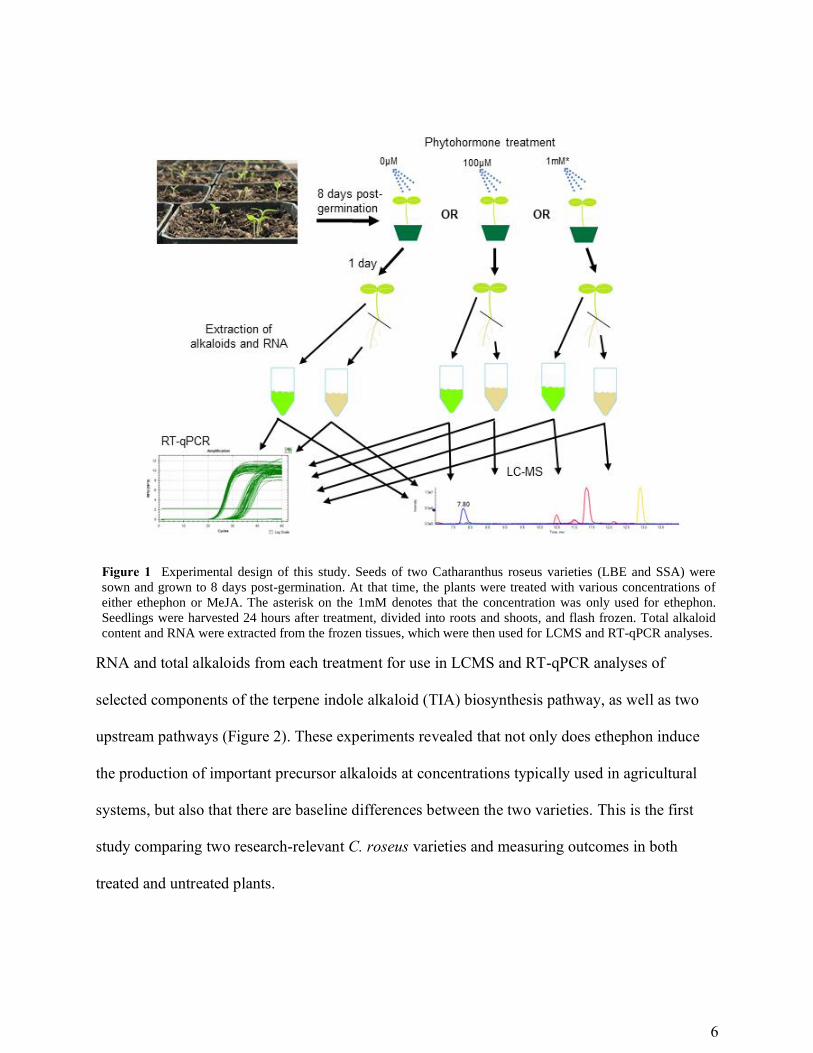
RNA and total alkaloids from each treatment for use in LCMS and RT-qPCR analyses of
selected components of the terpene indole alkaloid (TIA) biosynthesis pathway, as well as two
upstream pathways (Figure 2). These experiments revealed that not only does ethephon induce
the production of important precursor alkaloids at concentrations typically used in agricultural
systems, but also that there are baseline differences between the two varieties. This is the first
study comparing two research-relevant C. roseus varieties and measuring outcomes in both
treated and untreated plants.
Figure 1 Experimental design of this study. Seeds of two Catharanthus roseus varieties (LBE and SSA) were
sown and grown to 8 days post-germination. At that time, the plants were treated with various concentrations of
either ethephon or MeJA. The asterisk on the 1mM denotes that the concentration was only used for ethephon.
Seedlings were harvested 24 hours after treatment, divided into roots and shoots, and flash frozen. Total alkaloid
content and RNA were extracted from the frozen tissues, which were then used for LCMS and RT-qPCR analyses.
Page 8
7
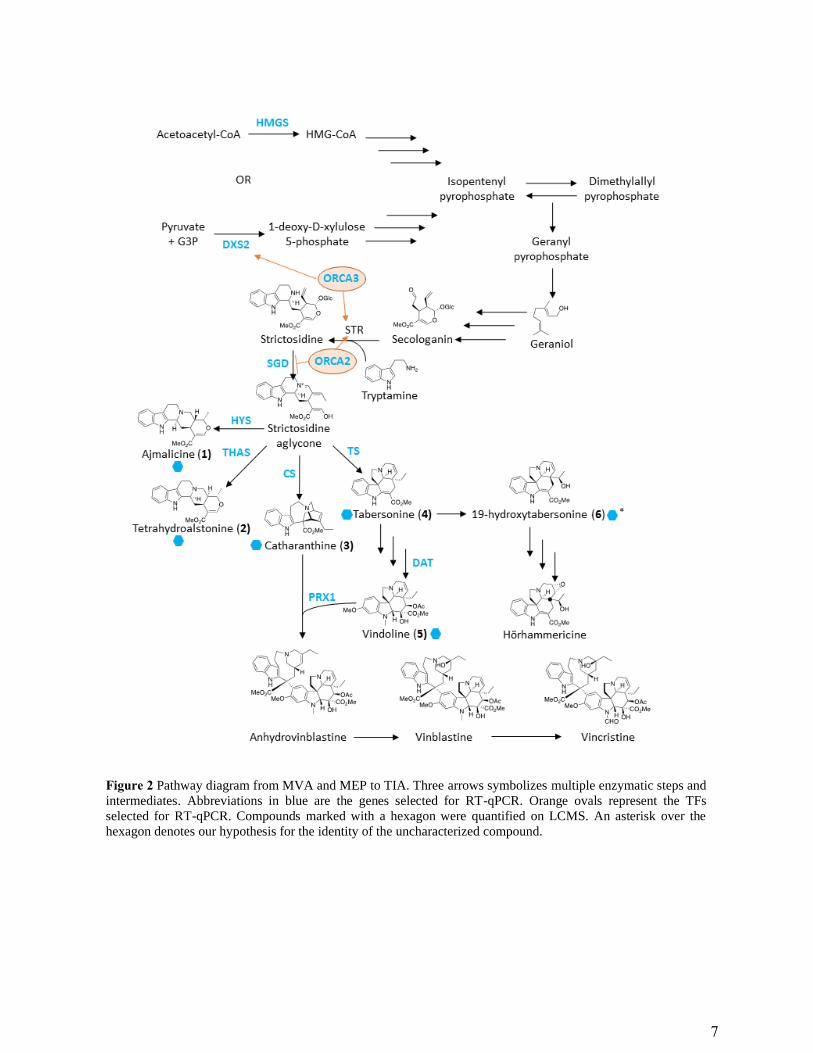
Figure 2 Pathway diagram from MVA and MEP to TIA. Three arrows symbolizes multiple enzymatic steps and
intermediates. Abbreviations in blue are the genes selected for RT-qPCR. Orange ovals represent the TFs
selected for RT-qPCR. Compounds marked with a hexagon were quantified on LCMS. An asterisk over the
hexagon denotes our hypothesis for the identity of the uncharacterized compound.
Page 9
8
Alkaloid levels substantially differ between varieties. Previous studies have investigated the
genetic and metabolomics between many different C. roseus varieties21, 22. While many of the
compared varieties are used mainly for ornamental purposes, others are historically used
medicinally. None of the studies, however, included LBE and SSA which would allow for the
utilization of available genomic and transcriptomic resources to inform future bioengineering
efforts. We selected these two varieties for this exact reason. Prior to beginning these studies, we
validated our extraction techniques to ensure that technical and biotic influences were minimized
using C. roseus SSA. To test our technical reproducibility, we pulverized up 10-20 shoots in
liquid nitrogen and then, after thorough mixing of the resulting powder, the powder was divided
into three approximately equal portions of plant material. The replicate plant material was
extracted and analyzed via LCMS (in technical duplicate) as described in the Experimental
section. The vindoline concentration was determined to be 12.2 + 2.7 g/mg wet weight. To test
for biological variability, 20 plants were grown under identical conditions and randomly
allocated to three samples. The samples were pulverized in liquid nitrogen, extracted with
methanol and analyzed by LCMS (in technical duplicate) as described in the Experimental
section. In these samples the vindoline concentration was determined to be 10.92 + 3.0 g/mg
wet weight. This demonstrated that our extraction protocol was reproducible and accurate.
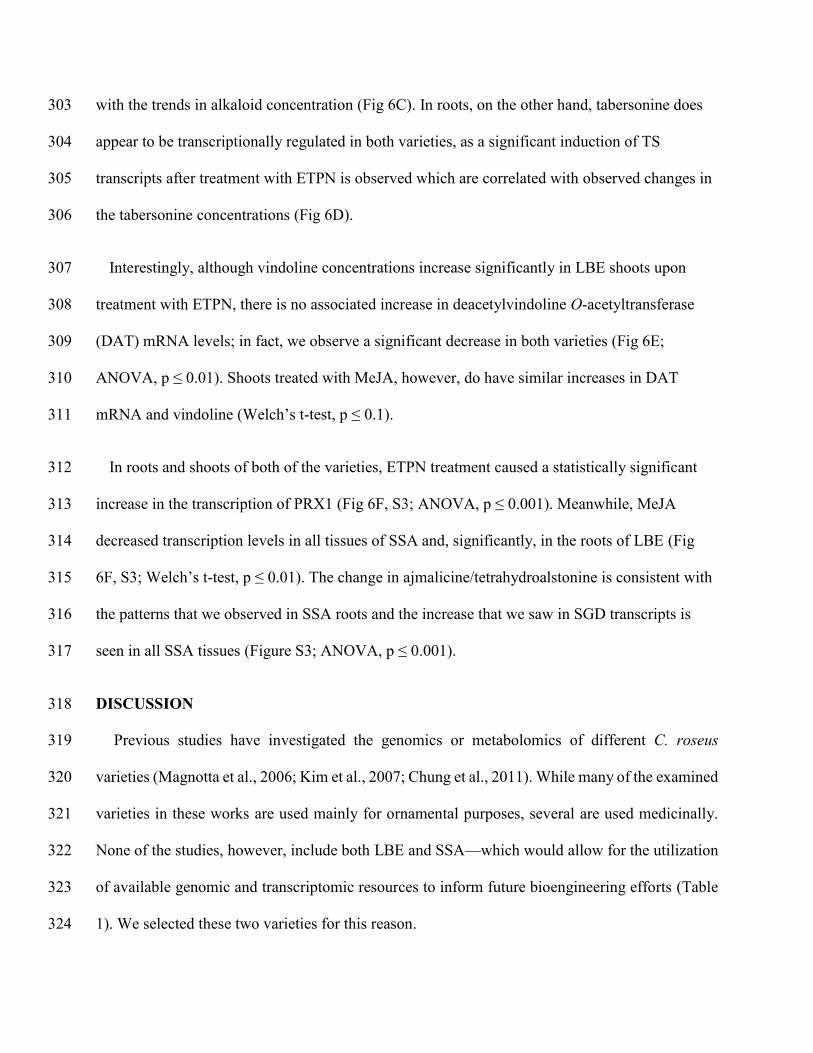
A comparison of the spectrometric results of the untreated control plants highlights notable
differences between the plant varieties themselves. As these control plants were only sprayed
with deionized water and the pots were arranged randomly to avoid positional effects, changes
observed are attributable to variety. Because some of the precursor alkaloids are restricted to
certain plant parts14, 15, we opted to divide our plants at the base of the hypocotyl (see Figure 1
above). In the shoots, untreated SSA plants have markedly higher levels catharanthine and
Page 10
9
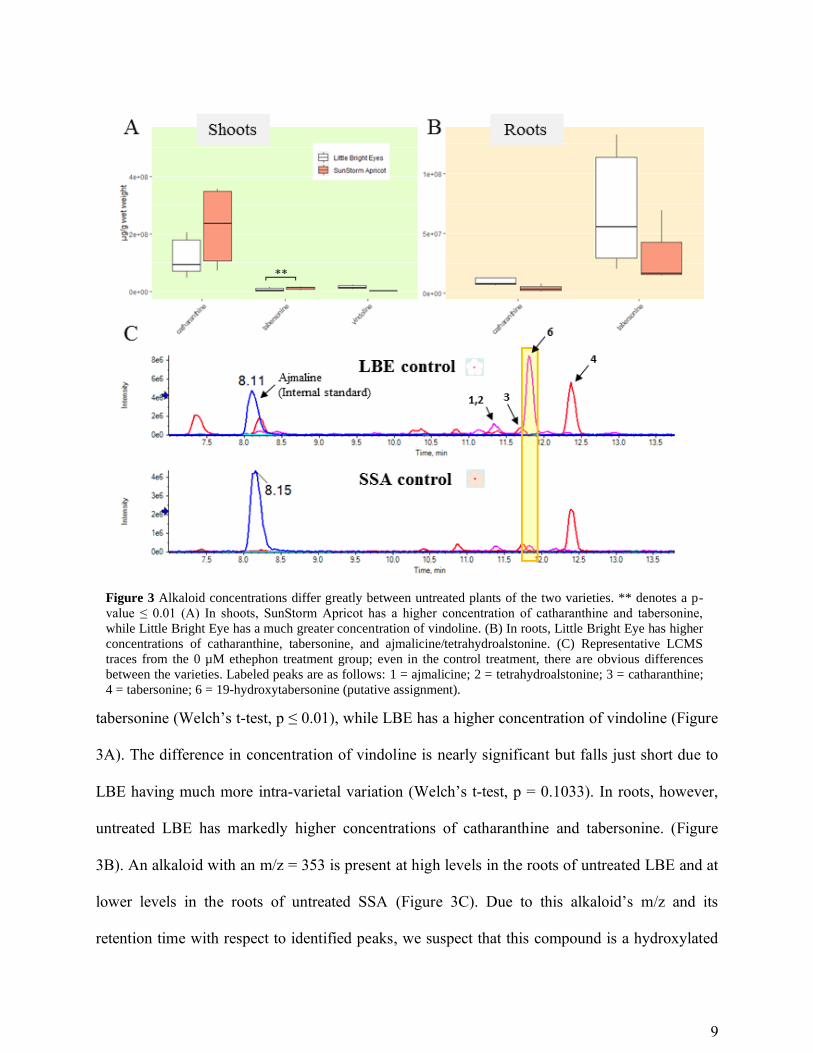
tabersonine (Welch’s t-test, p ≤ 0.01), while LBE has a higher concentration of vindoline (Figure
3A). The difference in concentration of vindoline is nearly significant but falls just short due to
LBE having much more intra-varietal variation (Welch’s t-test, p = 0.1033). In roots, however,
untreated LBE has markedly higher concentrations of catharanthine and tabersonine. (Figure
3B). An alkaloid with an m/z = 353 is present at high levels in the roots of untreated LBE and at
lower levels in the roots of untreated SSA (Figure 3C). Due to this alkaloid’s m/z and its
retention time with respect to identified peaks, we suspect that this compound is a hydroxylated
Figure 3 Alkaloid concentrations differ greatly between untreated plants of the two varieties. ** denotes a p-
value ≤ 0.01 (A) In shoots, SunStorm Apricot has a higher concentration of catharanthine and tabersonine,
while Little Bright Eye has a much greater concentration of vindoline. (B) In roots, Little Bright Eye has higher
concentrations of catharanthine, tabersonine, and ajmalicine/tetrahydroalstonine. (C) Representative LCMS
traces from the 0 µM ethephon treatment group; even in the control treatment, there are obvious differences
between the varieties. Labeled peaks are as follows: 1 = ajmalicine; 2 = tetrahydroalstonine; 3 = catharanthine;
4 = tabersonine; 6 = 19-hydroxytabersonine (putative assignment).
Page 11
10
tabersonine. We endeavored to confirm our hypothesis about our uncharacterized alkaloid’s
identity using commercially available standards for alkaloids with the appropriate molecular
weight (including 11-hydroxytabersonine, yohimbine, and lochnericine), however none of the
commercially available standards had an identical retention time as this unknown peak. We
therefore posit that this compound is 19-hydroxytabersonine for which we were unable to
identify a commercial supplier. If this is 19-hydroxytabersonine, a significant increase is not
necessarily a desirable result as it channels tabersonine to hörhammericine, echitovenine, or
minovincine—none of which are clinically used23. Overall, we observe that important
differences arise in alkaloid concentration between varieties and between the tissues of these
varieties, even without the application of an induction agent.
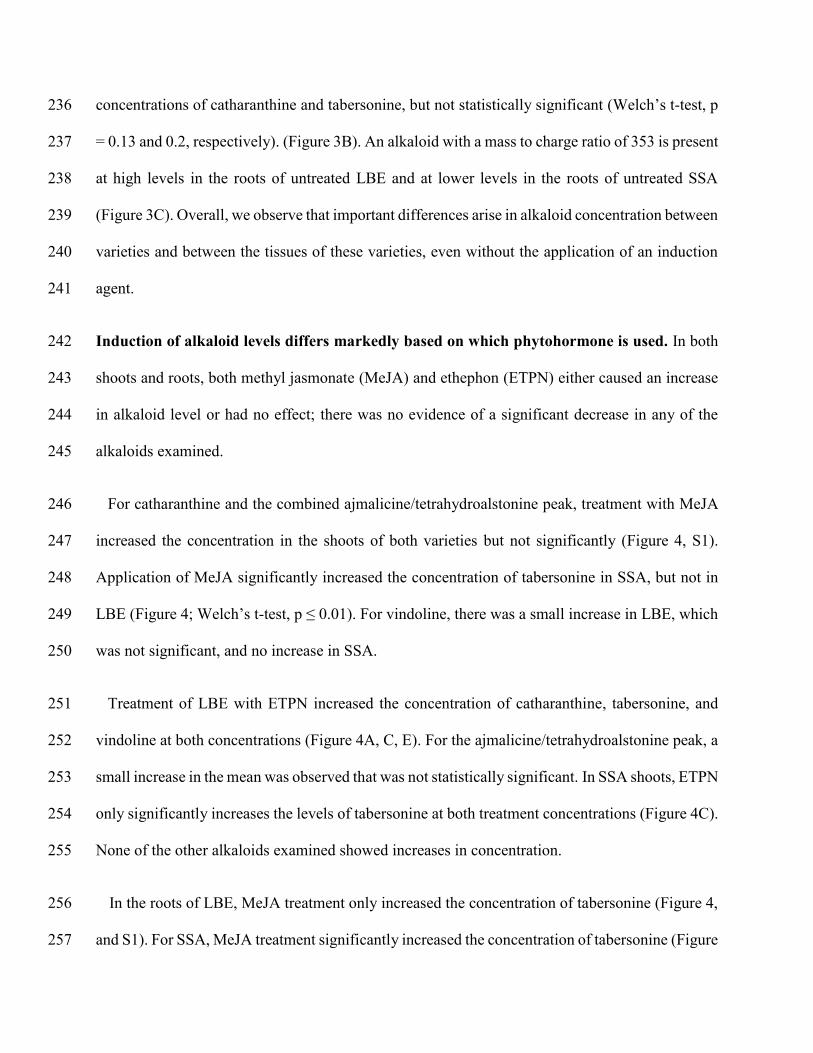
Induction of alkaloid levels differs markedly based on which phytohormone is used. As
seen in other studies, treatment with these phytohormones induced alkaloid production7, 9-11, 24. In
both shoots and roots, both methyl jasmonate (MeJA) and ethephon (ETPN) either caused an
increase in alkaloid level or had no effect—there was no evidence of a significant decrease in
any of the alkaloids examined.
For three of the alkaloids we investigated (catharanthine and ajmalicine/tetrahydroalstonine),
treatment with MeJA increased the concentration in the shoots of both varieties but not
significantly (Figure 4, S1). For the other two alkaloids, MeJA only increased the concentration
in one of the varieties—in LBE for vindoline and significantly in SSA for tabersonine (Figure 4;
Welch’s t-test, p ≤ 0.01). In LBE shoots, at least one ETPN treatment significantly increases the
concentration of all five alkaloids investigated (Welch’s t-test, p ≤ 0.01). In SSA shoots, ETPN
only significantly increases the levels of tabersonine (Welch’s t-test, p ≤ 0.01; it less significantly
Page 12
11
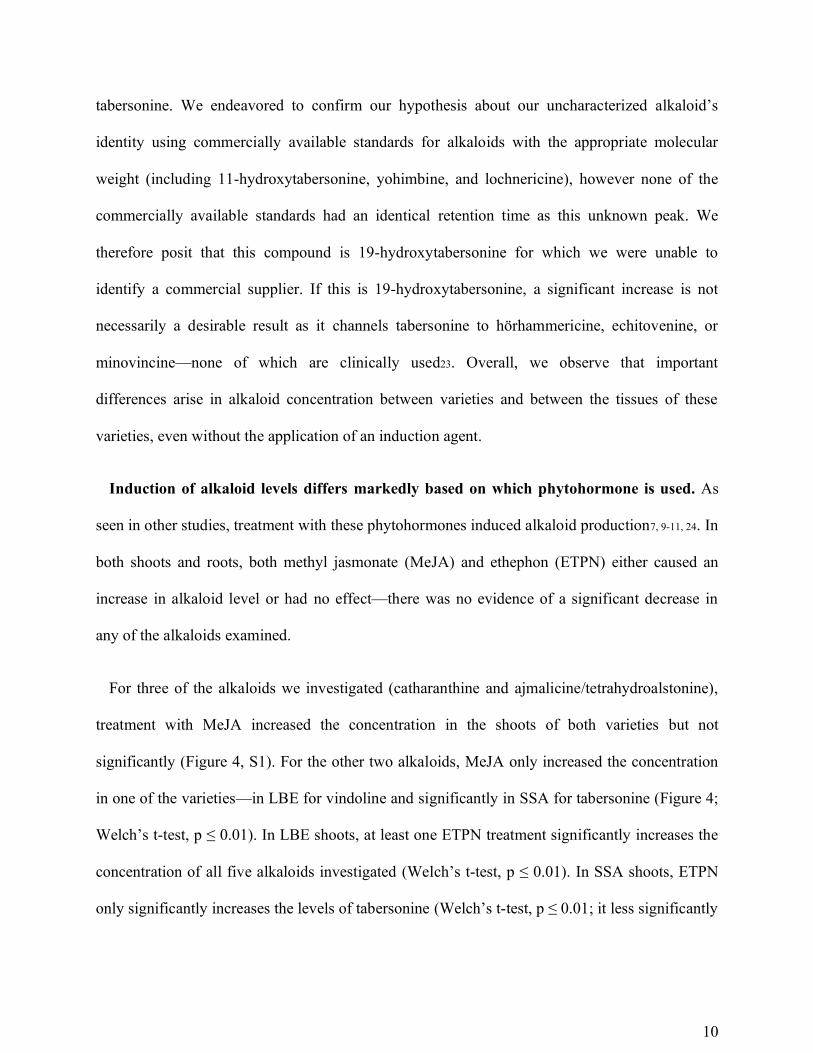
Figure 4 Alkaloid concentrations differ between varieties and treatment. * denotes a p-value ≤ 0.05; **
denotes a p-value ≤ 0.01; *** denotes a p-value ≤ 0.001; all represented statistics are from Welch’s t-test
post-hoc analyses. Significance markers with a white flower represent treatment differences in LBE, while
those with a peach flower represent treatment differences in SSA. (A) Catharanthine concentrations
increased in LBE shoots after treatment with both hormones, but only with methyl jasmonate in SSA shoots.
(B) In roots, catharanthine increased markedly in SSA after treatment with ethephon. (C) In shoots,
tabersonine levels increase greatly in SSA upon treatment with either phytohormone, but only after treatment
with ethephon in LBE. (D) Tabersonine levels increase significantly in the roots of both varieties after
treatment with either phytohormone. (E) Vindoline concentration increases significantly in LBE shoots after
treatment with ethephon. (F) The amount of the unidentified alkaloid present relative to the internal standard
increased significantly in the roots of SSA after treatment with ethephon.
Page 13
12
increases vindoline and ajmalicine/tetrahydroalstonine. Despite multiple attempts, we were
unable to separate ajmalicine and tetrahydroalstonine as they have the same mass, the same
fragmentation pattern, and identical retention times. Therefore, we report
ajmalicine/tetrahydroalstonine here as a single combined value relative to the internal standard.
In the roots, MeJA increases levels of three alkaloids (tabersonine in both varieties;
ajmalicine/tetrahydroalstonine in SSA only), but not significantly (Figure 4, S1; Welch’s t-test, p
≥ 0.05). ETPN significantly increased all five of the alkaloids investigated in SSA (Welch’s t-
test, p ≤ 0.05). In the roots of LBE, only tabersonine and ajmalicine/tetrahydroalstonine are
increased by treatment with ETPN, but neither increase is particularly significant.
Overall, ethephon significantly increased the levels of a larger number of alkaloids than MeJA.
All of the alkaloids mentioned in this study are valuable precursors in the TIA pathway.
Additionally, the interaction between treatment and variety was significant for some of the
alkaloids. In shoots, catharanthine and vindoline were significantly increased by the interaction
of ETPN and variety while the interaction of MeJA and variety significantly affected
tabersonine. In the roots, however, none of the alkaloids had significant interaction effects.
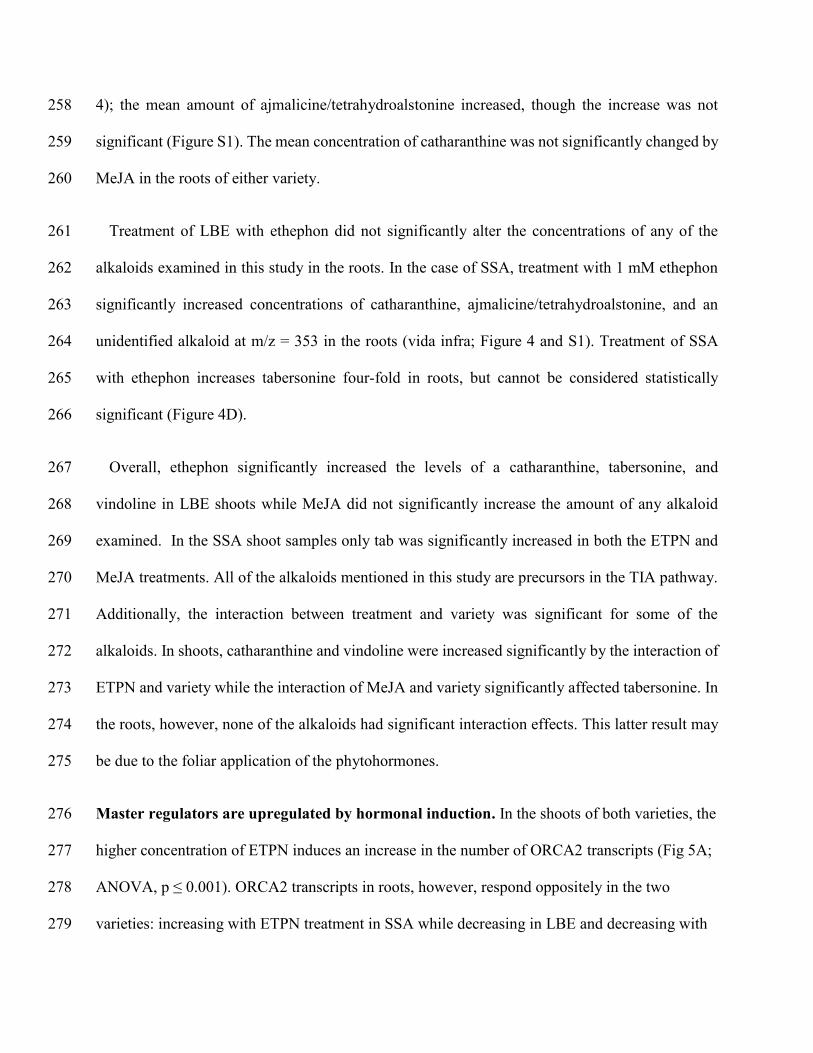
Master regulators are upregulated by hormonal induction. The ORCA family of
transcription factors have been documented as central regulators of early stage TIA intermediate
production in C. roseus. In the shoots of both varieties, the higher concentration of ETPN
induces an increase in the number of ORCA2 transcripts (Fig 5A; ANOVA, p ≤ 0.001). ORCA2
transcripts in roots, however, respond oppositely in the two varieties: increasing with ETPN
treatment in SSA while decreasing in LBE and decreasing with MeJA treatment in SSA
Page 14
13
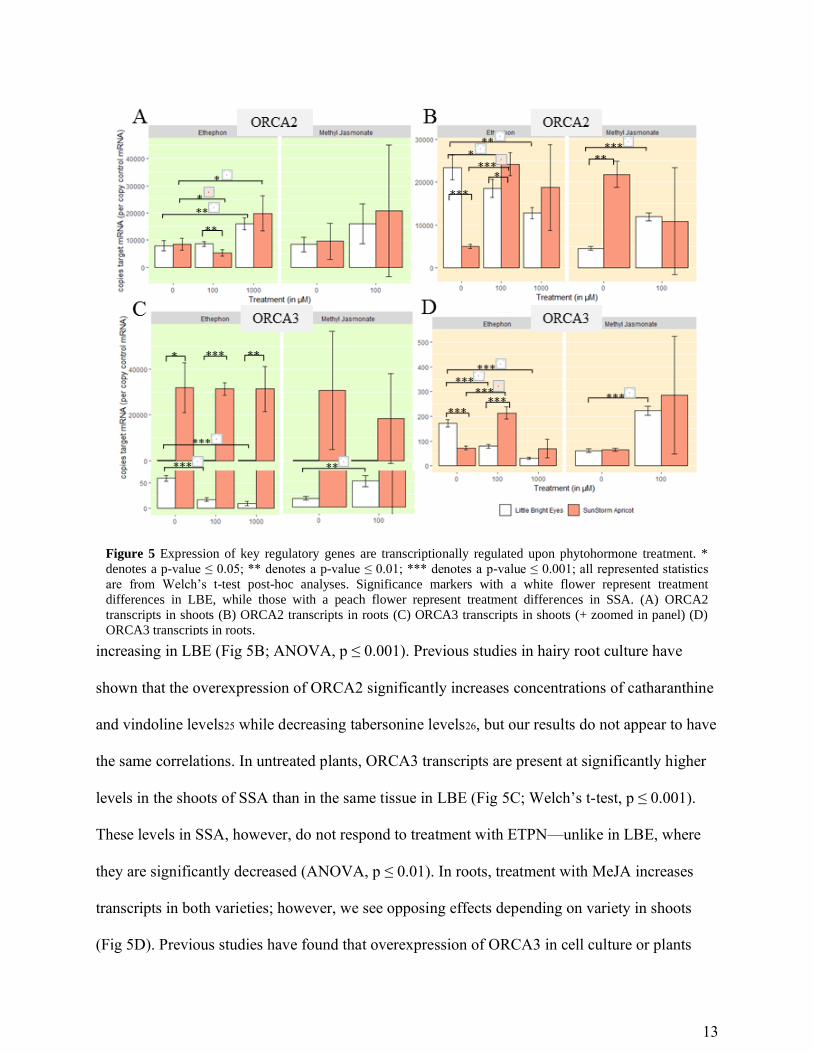
increasing in LBE (Fig 5B; ANOVA, p ≤ 0.001). Previous studies in hairy root culture have
shown that the overexpression of ORCA2 significantly increases concentrations of catharanthine
and vindoline levels25 while decreasing tabersonine levels26, but our results do not appear to have
the same correlations. In untreated plants, ORCA3 transcripts are present at significantly higher
levels in the shoots of SSA than in the same tissue in LBE (Fig 5C; Welch’s t-test, p ≤ 0.001).
These levels in SSA, however, do not respond to treatment with ETPN—unlike in LBE, where
they are significantly decreased (ANOVA, p ≤ 0.01). In roots, treatment with MeJA increases
transcripts in both varieties; however, we see opposing effects depending on variety in shoots
(Fig 5D). Previous studies have found that overexpression of ORCA3 in cell culture or plants
Figure 5 Expression of key regulatory genes are transcriptionally regulated upon phytohormone treatment. *
denotes a p-value ≤ 0.05; ** denotes a p-value ≤ 0.01; *** denotes a p-value ≤ 0.001; all represented statistics
are from Welch’s t-test post-hoc analyses. Significance markers with a white flower represent treatment
differences in LBE, while those with a peach flower represent treatment differences in SSA. (A) ORCA2
transcripts in shoots (B) ORCA2 transcripts in roots (C) ORCA3 transcripts in shoots (+ zoomed in panel) (D)
ORCA3 transcripts in roots.
Page 15
14
significantly altered the levels of vindoline, catharanthine, ajmalicine, and tabersonine27, 28. The
changes in ORCA3 in SSA do mirror the changes seen in catharanthine and ajmalicine in roots,
though this is not true of ORCA3 in LBE. These results underscore the need for broader testing
in different varieties and the care needed prior to extrapolating results from one variety of C.
roseus to inform results or pathway engineering of another variety.
As ORCA3 positively regulates two key genes in the TIA pathway27, the significant difference
between its expression in SSA and LBE makes its promoter an interesting target for further
investigation and future bioengineering efforts. ORCA2 would also make a good candidate for
engineering, as its transcript levels increased upon treatment. As with any master regulator,
though, there is the possibility of activation of potential repressors, so a careful investigation in
to genes controlled by these two TFs regulate would be advisable.
Early-induction pathway steps are likely transcriptionally regulated. We first wanted to
investigate whether genes that are fundamental to TIA biosynthesis early on in the process show
major transcriptional changes on hormone induction in our experimental system. We selected
two biosynthetic genes that play roles upstream of the TIA pathway which have also been the
focus of other studies19, 29: hydroxymethylglutaryl-CoA synthase (HMGS) in the mevalonate
(MVA) pathway and 1-deoxy-D-xylulose-5-phosphate synthase (DXS2) in the pathway
methylerythritol phosphate (MEP). We found that DXS2 transcript level increased in the roots of
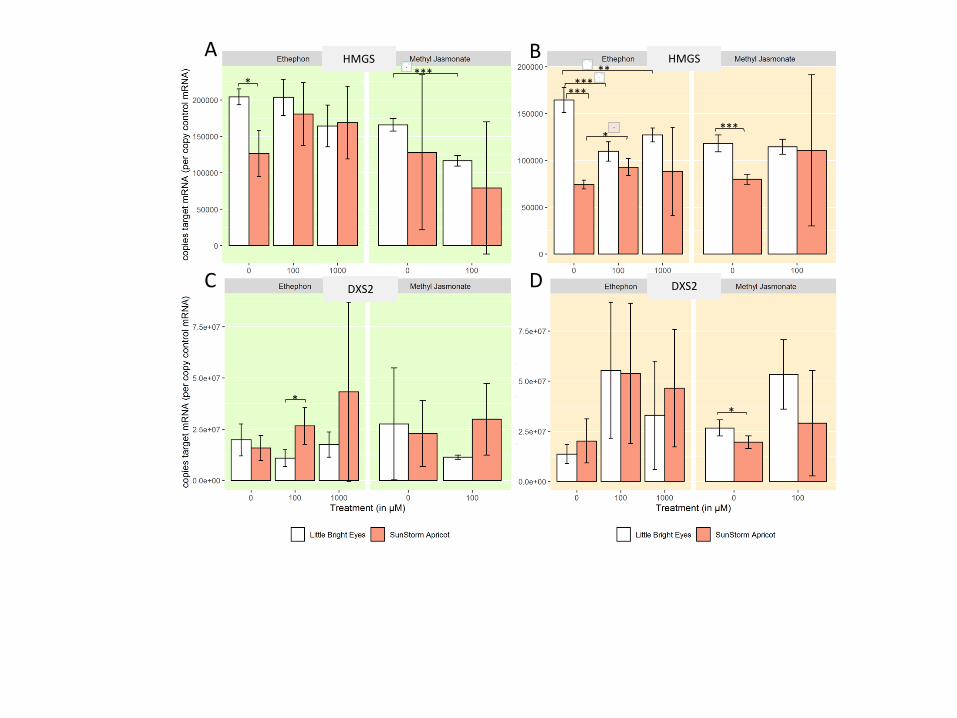
our young plants treated with MeJA (Figure S2C); meanwhile, HMGS transcript abundance
decreased in the shoots of the MeJA-treated plants (Fig S2A). Previous work has demonstrated
that ethylene induces the MVA pathway while jasmonate induces the MEP pathway in older
seedlings19, 29. It is interesting to note that our results in roots and shoots treated through foliar
application of the phytohormones show different induction patterns than were observed in those
Page 16
15
previous studies, where treatments were applied to entire seedlings via hydroponic
supplementation. A different physiological outcome in roots and shoots may be expected given
that the immediate uptake happens through a different tissue; in some ways, however, our results
are not directly comparable to that of past work since outcome specific to the individual plant
parts has not been investigated. Regardless, both of these genes encode key enzymes in the
formation of the indole component of terpene indole alkaloids, so a change in transcript
abundance due to phytohormone treatment could have downstream effects on concentration of
each alkaloid.
TIA-pathway specific genes are transcriptionally regulated. We selected seven
biosynthetic genes that encode key enzymes directly related to the biosynthesis of terpene indole
alkaloids. Of these enzymatic genes, five perform important reactions in the path toward
vinblastine; the remaining two genes are involved in reactions that branch off from the
vinblastine biosynthesis pathway but catalyze the formation of other medicinally relevant
alkaloids. We felt it was necessary to investigate the expression of these genes in separate plant
parts, as this information will be useful for engineering alkaloid production in biopharmaceutical
settings.
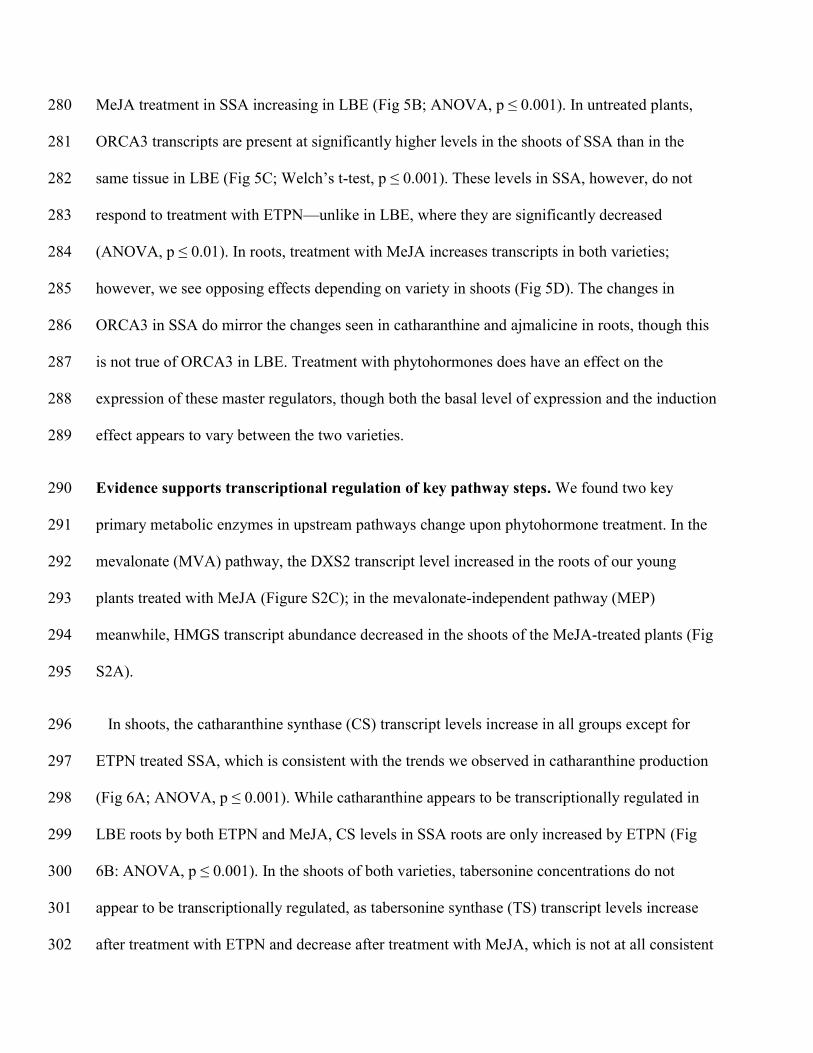
Catharanthine synthase (CS) and tabersonine synthase (TS) produce catharanthine and
tabersonine, respectively, and were recently determined to be two of the four missing enzymes in
the TIA pathway30. We were particularly interested in discovering how the various
phytohormone treatments effected their transcription, since relatively little research has been
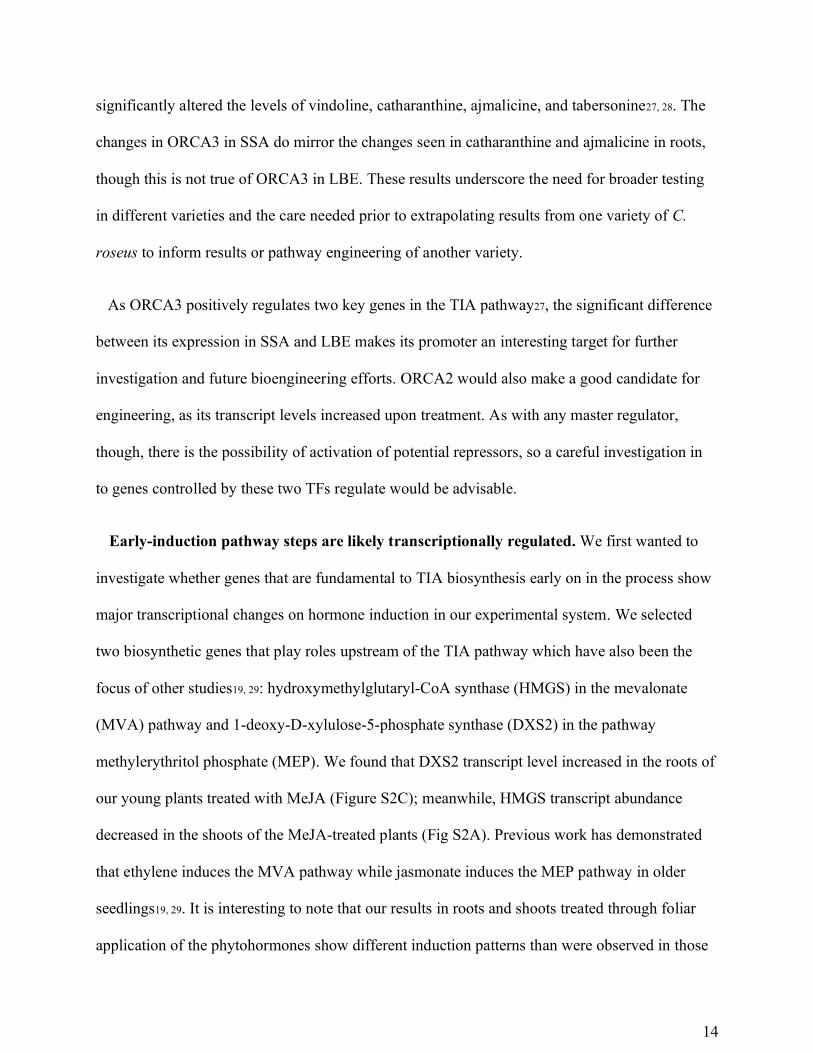
done with the genes since their discovery. In shoots, the CS transcript levels increase in all
groups except for ETPN treated SSA, which is consistent with the trends in catharanthine
production (Fig 6A; ANOVA, p ≤ 0.001). While catharanthine appears to be transcriptionally
Page 17
16
regulated in LBE roots by both ETPN and MeJA, CS levels in SSA roots are only increased by
ETPN (Fig 6B: ANOVA, p ≤ 0.001). In the shoots of both varieties, tabersonine concentrations
do not appear to be transcriptionally regulated, as TS transcript levels increase after treatment
Figure 6 Expression of some key enzymes in the TIA pathway are transcriptionally regulated upon
phytohormone treatment. * denotes a p-value ≤ 0.05; ** denotes a p-value ≤ 0.01; *** denotes a p-value ≤
0.001; all represented statistics are from Welch’s t-test post-hoc analyses. Significance markers with a white
flower represent treatment differences in LBE, while those with a peach flower represent treatment differences
in SSA. (A) CS shoots (B) CS roots. (C) TS shoots (D) TS roots (E) DAT (F) PRX1 transcript levels in roots
increase after treatment with ethephon in both varieties and decrease after treatment with MeJA, but only in
LBE.
Page 18
17
with ETPN and decrease after treatment with MeJA, which is not at all consistent with the trends
in alkaloid concentration (Fig 6C). This could be the due to an enzyme directly upstream acting
as a bottleneck in the pathway, while the amount of TS present remains consistent because it is
expressed at a level that is sufficient to handle an increased amount of substrate. In roots, on the
other hand, tabersonine does appear to be transcriptionally regulated in both varieties, as a
significant induction of TS transcripts after treatment with ETPN is observed which are
correlated with observed changes in the tabersonine concentrations (Fig 6D).
Interestingly, although vindoline concentrations increase significantly in LBE shoots upon
treatment with ETPN, there is no associated increase in deacetylvindoline O-acetyltransferase
(DAT) mRNA levels; in fact, we observe a significant decrease in both varieties (Fig 6E;
ANOVA, p ≤ 0.01). Shoots treated with MeJA, however, do have similar increases in DAT
mRNA and vindoline (Welch’s t-test, p ≤ 0.1), which is consistent with the changes in vindoline
concentration observed in previous studies of C. roseus plants over-expressing DAT31.
In roots and shoots of both of the varieties, ETPN treatment caused a statistically significant
increase in the transcription of PRX1 (Fig 6F, S2; ANOVA, p ≤ 0.001). Meanwhile, MeJA
decreased transcription levels in all tissues of SSA and, significantly, in the roots of LBE (Fig
6F, S2; Welch’s t-test, p ≤ 0.01). Although α-3’,4’-anhydrovinblastine and vinblastine levels
were below the detection limit of our mass spectrometer, they are still key alkaloids, which is
why we chose to examine this gene. Previous work in cell culture demonstrated a correlation
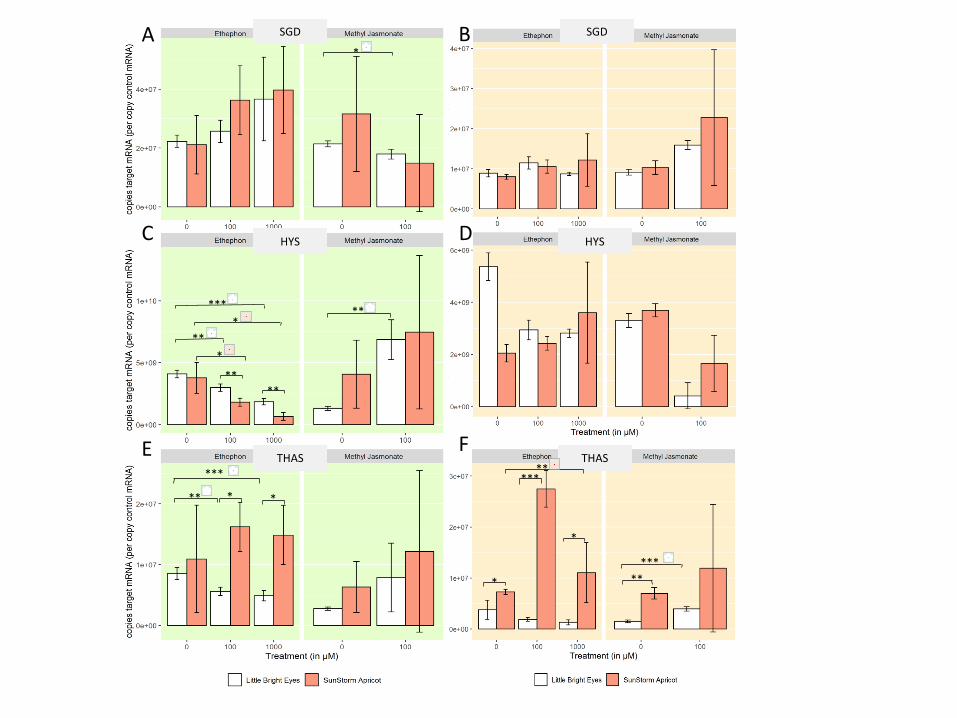
between the over-expression of PRX1, an increase in the number of SGD transcripts, and an
increase in ajmalicine accumulation32. The change in ajmalicine/tetrahydroalstonine is consistent
with the patterns that we observed in SSA roots and the increase that we saw in SGD transcripts
is seen in all SSA tissues (Figure S3; ANOVA, p ≤ 0.001).
Page 19
18
Overall, production of many key TIAs appear to be transcriptionally regulated in at least one
tissue. ETPN and MeJA induce approximately equal numbers of the biosynthetic genes that code
for key enzymes in the TIA pathway. They also induce genes upstream of the TIA pathway,
which may be useful information for future bioengineering attempts. When taken in conjunction
with the changes observed in alkaloid concentrations and with consideration of the cost of large-
scale application, ETPN is a great option for alkaloid production in a biopharmaceutical setting.
Summary. In summary, our work demonstrates that choice of variety of C. roseus,
phytohormone type, and concentration of treatment all have an impact on the levels of key
alkaloids in each plant part. Either a genomic or transcriptomic resource is available for the two
varieties investigated here, but neither variety has both. The differing baseline metabolic profile
as well as the differing responses to phytohormone treatment emphasize the importance of
choosing an appropriate variety for one’s desired outcomes. Additionally, optimization of
treatments is crucial; timing of phytohormone application and harvest, as well as the
concentration applied, can have significant effects on both the health of the plants and the
induced changes in alkaloid concentrations. Finally, this study shows that ethephon is a viable
and agriculturally-relevant induction agent for key alkaloids in a large-scale biopharmaceutical
production setting.
EXPERIMENTAL SECTION
General Experimental Procedures. Quantitation of metabolites was obtained using a Shimadzu
Prominence HPLC (consisting of a degasser, two LC-10AD HPLC pumps, an autosampler, a
photodiode array, and system controller) upstream of a 3200 QTrap mass spectrometer
(AbSciex) operated using the Analyst software package. Data was analyzed offline using
Page 20
19
Peakview version 2.2 software. Quantitation and purity analysis of total extracted RNA was
obtained using a Thermo-Fisher Nanodrop and Agilent BioAnalyzer 2100 in the Center for
Genomics and Biocomputing Core Facilities at Oregon State University. Quantitation of selected
transcripts was obtained on a BioRad C1000 Touch thermocycler with a BioRad CFX96
detection unit. Transcript data was extracted using BioRad CFX Manager software. Primer
efficiencies were calculated using LinRegPCR33.
LCMS grade H2O, acetonitrile, methanol and were purchased from MilliporeSigma. RNEasy
Mini Kit, RNase-free DNase Set, and QIAgen SYBR PCR kit were purchased from QIAgen and
were used according to the manufacturer’s instructions. SuperScript RT kit was purchased from
Invitrogen for reverse transcription and used according to the manufacturer’s instructions. LCMS
grade formic acid was purchased from Fisher Chemicals. Vindoline, vinblastine sulfate,
vincristine sulfate, and catharanthine were obtained from Cayman Chemicals. Ajmaline and
tetrahydroalstonine were obtained from Extrasynthese, while ajmalicine was obtained from
Millipore-Sigma. Lochnericine and 16-hydroxytabersonine (aka 11-hydroxytabersonine) were
obtained from MuseChem. All other chemicals were purchased from Sigma-Aldrich and used
without further purification unless otherwise specified. Oligonucleotides were designed with the
PrimerQuest tool from Integrated DNA Technologies, purchased from Sigma-Aldrich with
standard desalting and used without further purification.
Plant Material and Growth. Two Catharanthus roseus varieties were selected for these
experiments: “SunStorm Apricot” (obtained from www.expressseed.com) and “Little Bright
Eyes” (obtained from www.neseeds.com). 10-12 seeds of a single variety were planted in 4-inch
plastic pots filled to 1 cm below the top with MetroMix potting mix (35%-45% Sphagnum moss,
bark, pumice, dolomite limestone). Pots were arranged on labeled trays, which were covered
Page 21
20
with plastic domes to increase humidity until seedlings emerged through the soil. The plants
were grown in an environmentally controlled growth room under a 12-hour light/12-hour dark
photo-cycle with a 22°C ambient temperature.
Phytohormone Treatments and Sample Collection. We optimized our ethephon
concentrations and treatment timing via a series of tests in a single variety (SSA). For the
treatment timing optimization experiment, only SunStorm Apricot seedlings were grown to
either 2 or 8 days post-germination and then were sprayed with 5mL of either water (control) or
100uM ethephon (treatment). After treatment, plants were sealed inside 2-gallon zip-top bags
and returned to the growth chamber for 24 hours. On the next day, the plants were carefully
uprooted, washed with DI water, separated at the hypocotyl into roots and shoots with a surgical
blade, and flash-frozen in liquid nitrogen. Samples were stored at -80 °C until they could be
processed, a minimum of 24 hours.
In the concentration optimization experiment, SSA seedlings were grown to 8 days post-
germination and were then sprayed with 5mL of a control or 100uM, 500uM, or 1mM ethephon.
Ethephon was mixed in DI water alone for the treatments, while the control treatment consisted
of DI water. The plants were then handled as described above. Each sample from both of these
experiments consisted of all the plants from a single pot; there were 12 pots for each variety. At
higher concentrations, the plants began showing signs of senescence, becoming yellow and
wilted.
For the larger comparison experiment, both SSA and LBE seedlings were grown to 8 days
after germination. 6 pots of each variety were selected at random from the trays, sprayed with a
combined volume of 5mL of DI water (ethephon control), DI water + 0.02% DMSO (methyl
Page 22
21
jasmonate control), 100uM ethephon, 1mM ethephon, or 100uM methyl jasmonate + 0.02%
DMSO. After treatment, the plants were handled as described above. We processed 6 replicates
for each treatment. Each sample contained all of the plants from a single pot (~8 plants).
Alkaloid Extraction and Mass Spectrometry. Shoots were ground in liquid nitrogen with a
mortar and pestle; roots were macerated by hand with a metal spatula directly in the methanol
solution to prevent sample loss during the grind and transfer process due to the small amount of
tissue. Shoot extractions were performed using 1 mL methanol containing 10 µM ajmaline
(internal standard) per 100 mg tissue. Root extractions were performed using 1 mL of methanol
containing 1 µM ajmaline (internal standard) per 10 mg tissue. The extracts were then allowed to
stand at room temperature (~22 C) for 20 minutes and then the cellular debris was pelleted by
centrifugation (3,220 x g, 22 C, 20 min). The cleared extracts were then filtered through a 0.22
µm nylon syringe filter to remove remaining particulate. The shoot alkaloid extracts were diluted
1:10 in methanol and 20 µl was transferred to HPLC vials containing glass sample inserts. The
root extracts were used undiluted. The filled HPLC vials were stored at -80°C until they could be
analyzed via LC-MS (described below). Unfortunately, some samples were lost during
processing. In the end, the final replications for each treatment were as follows: LBE E0-S = 6;
LBE E0-R = 5; LBE E1 = 6 and 6; LBE E4 = 6 and 6; LBE M0 = 6 and 6; LBE M1 = 6 and 6;
SSA E0-S = 6; SSA E0-R = 3; SSA E1-S = 6; SSA E1-R = 5; SSA E4 = 6 and 6; SSA M0-S = 6;
SSA M0-R = 5; SSA M1 = 6 and 6.
LCMS quantitation of C. roseus alkaloids. LCMS analysis was achieved using a Shimadzu
Prominence HPLC upstream of a 3200 QTrap AbSciex mass spectrometer. Separation was
achieved using Luna C18(2) column (150 x 2.00 mm, 3 m) at a flow rate of 0.2 ml/ min and the
Page 23
22
following gradient. Line A was water with 0.1% (v/v) formic acid and line B was acetonitrile
with 0.1% (v/v) formic acid. The column was pre-equilibrated with 85% A/15% B. Upon
injection (2 L of prepared HPLC sample) the mobile phase composition was maintained for 1
minutes followed by changing the mobile phase to 60% A/40% B over 14 minutes using a linear
gradient. The mobile phase was then changed to 0% A/100% B over the next 1 minute and held
at this ratio for 8 minutes. The mobile phase was changed to 85% A/15% B over 1 minute and
the column was equilibrated at 85% A/15% B for 7 minutes prior to the next injection. The mass
spectrometer settings were as follows: MS (EMS positive mode, 50-1500 m/z), Curtain gas,
40.0; Collision gas, Medium; IonSpray voltage, 4500.0; Temperature, 400.0; Ion Source Gas 1,
35.0; Ion Source Gas 2, 35.0; Interface heater, ON; Declustering potential, 45.0; Entrance
potential, 4.0; Collision energy, 5.0, number of scans to sum, 2; scan rate, 4000 Da/sec. MS/MS
(MRM mode) For catharanthine (Q1, 337.3; Q3, 144.2; time 40 msec, CE (volts) 20.0); for
tabersonine (Q1, 337.3; Q3, 305.3; time 40 msec, CE (volts) 20.0); for vinblastine (Q1, 406.2;
Q3, 271.9; time 40 msec, CE (volts) 30.0); for vincristine (Q1, 413.2; Q3, 353.4; time 40 msec,
CE (volts) 30.0). Curtain gas, 40.0; Collision gas, Medium; IonSpray voltage, 4500.0;
Temperature, 400.0; Ion Source Gas 1, 35.0; Ion Source Gas 2, 35.0; Interface heater, ON;
Declustering potential, 45.0; Entrance potential, 10.0; Collision cell exit potential, 3.0. Data was
acquired using the Analyst software package.
Standard curves were generated by analyzing commercial standards at known concentrations
using the identical LCMS settings.
RNA Extraction and qRT-PCR. Stored tissues were ground with mortars and pestles that had
been treated with RNase Zap to prevent sample degradation. The ground tissues were divided
into two 2mL microfuge tubes, which were used immediately to extract total RNA using the
Page 24
23
RNeasy Mini Kit (QIAgen) in conjunction with their RNase-Free DNase Set (QIAgen) as
directed. The total RNA for each sample was quantified on a Nanodrop (Thermo Scientific) and
integrity was confirmed on a Bioanalyzer 2100 (Agilent). Only samples with RINs ≥ 8.0 were
used for two-step qRT-PCR. Each biological replicate was used for two technical replicates,
bringing the total to four reps for each sample. 300ng of input RNA from each sample was
reverse transcribed using the SuperScript RT kit (Invitrogen). qPCR and melt curve analyses
were performed using the QIAgen SYBR PCR kit on a CFX96 detection system (BioRad). qPCR
data was extracted using CFX Manager software (BioRad). Primers not sourced from literature
were designed using PrimerQuest tool (Integrated DNA Technologies).
Data Analyses. Relative intensities for each were determined from LCMS data by calculating
the area under the peak (AUC) using Peakview version 2.2 (AbSciex) and then dividing that
value by the AUC of our internal standard, ajmaline. Absolute concentrations were calculated
from the AUC and a standard curve for each alkaloid; each quantity was then normalized using
the original wet weight of the sample. We performed Welch’s t-tests to determine the
significance of differences in alkaloid concentrations between varieties and two-way ANOVA
followed by Tukey pairwise comparison post-hoc analyses to determine the significance of
treatments. For qPCR data analysis, LinRegPCR 33 was used to determine primer for efficiencies.
Absolute copy numbers of transcripts were determined (�̅�0𝑠= ∆𝑇 ∗ �̂�𝑠
[�̅�𝑎∗log�̂�𝑠(�̅�𝑎)−𝐶�̅�𝑠]
) and
then normalized to the absolute copy number of 40S ribosomal protein S9 (RPS9), our control
gene, from the same sample. The resulting data was analyzed using ANOVA and Welch’s t-tests.
All statistical analyses were performed in R (version 3.4.3).
ASSOCIATED CONTENT
Page 25
24
Supporting Information.
The following files are available free of charge:
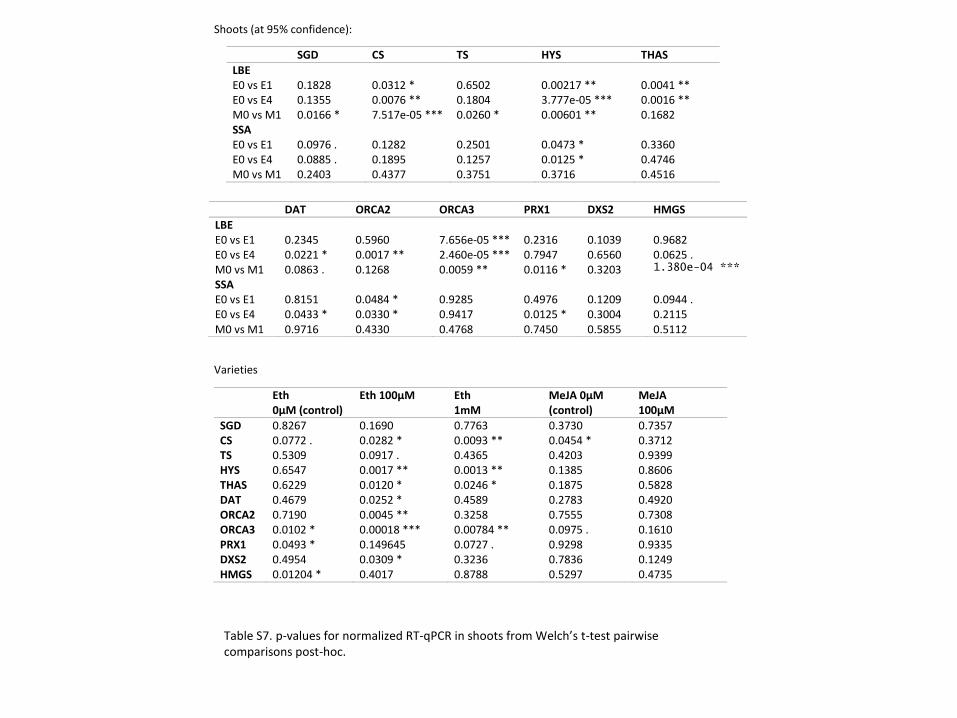
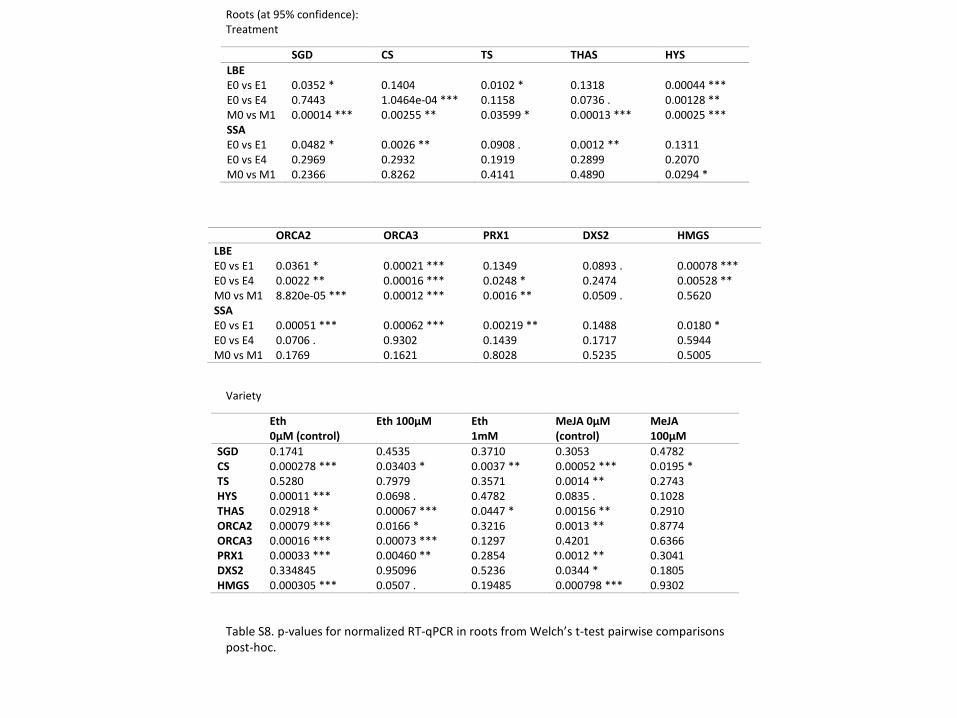
Supplementary Information.pdf contains supplementary figures (S1-S3) and tables (S1-S7)
referenced in the manuscript.
AUTHOR INFORMATION
Corresponding Author
*Email: [email protected]
*Email: [email protected]
Author Contributions
The manuscript was written through contributions of all authors. All authors have given approval
to the final version of the manuscript.
ACKNOWLEDGMENT
This work was supported by the Medical Research Foundation of Oregon Award #2018-1954 to
MM and Research Startup Funds from the College of Pharmacy to BP.
REFERENCES
1. Balunas, M. J.; Kinghorn, A. D., Drug discovery from medicinal plants. Life Sci 2005, 78,
(5), 431-41.
2. Noble, R. L.; Beer, C. T.; Cutts, J. H., Role of chance observations in chemotherapy: Vinca
rosea*. Ann N Y Acad Sci 1958, 76, (3), 882-894.
3. Johnson, I. S.; Armstrong, J. G.; Gorman, M.; Burnett, J. P., The vinca alkaloids: A new class
of oncolytic agents. Cancer Res 1963, 23, (8 Part 1), 1390-1427.
4. Tyler, V. E., Medicinal Plant Research: 1953-1987. Planta Med 1988, 54, (2), 95-100.
5. Potier, P., Synthesis of the antitumor dimeric indole alkaloids from Catharanthus species
(Vinblastine Group). J Nat Prod 1980, 43, (1), 72-86.
Page 26
25
6. Ishikawa, H.; Colby, D. A.; Boger, D. L., Direct coupling of catharanthine and vindoline to
provide vinblastine: total synthesis of (+)- and ent-(-)-vinblastine. J Am Chem Soc 2008, 130,
(2), 420-1.
7. Aerts, R. J.; Gisi, D.; Carolis, E.; Luca, V.; Baumann, T. W., Methyl jasmonate vapor
increases the developmentally controlled synthesis of alkaloids in Catharanthus and
Cinchona seedlings. Plant J 1994, 5, (5), 635-643.
8. Rijhwani, S. K.; Shanks, J. V., Effect of elicitor dosage and exposure time on biosynthesis of
indole alkaloids by Catharanthus roseus hairy root cultures. Biotechnol Prog 1998, 14, (3),
442-9.
9. El-Sayed, M.; Verpoorte, R., Growth, metabolic profiling and enzymes activities of
Catharanthus roseus seedlings treated with plant growth regulators. Plant Growth Regul
2004, 44, (1), 53-58.
10. Pan, Q.; Chen, Y.; Wang, Q.; Yuan, F.; Xing, S.; Tian, Y.; Zhao, J.; Sun, X.; Tang, K., Effect
of plant growth regulators on the biosynthesis of vinblastine, vindoline and catharanthine in
Catharanthus roseus. Plant Growth Regul 2010, 60, (2), 133-141.
11. Wang, X.; Pan, Y.-J.; Chang, B.-W.; Hu, Y.-B.; Guo, X.-R.; Tang, Z.-H., Ethylene-induced
vinblastine accumulation is related to activated expression of downstream TIA pathway
genes in Catharanthus roseus. Biomed Res Int 2016, 2016.
12. Williams, G. R.; Doran, P. M., Hairy root culture in a liquid-dispersed bioreactor:
characterization of spatial heterogeneity. Biotechnol Prog 2000, 16, (3), 391-401.
13. Laflamme, P.; St-Pierre, B.; De Luca, V., Molecular and biochemical analysis of a
Madagascar periwinkle root-specific minovincinine-19-hydroxy-O-acetyltransferase. Plant
Physiol. 2001, 125, (1), 189-98.
14. O'Keefe, B. R.; Mahady, G. B.; Gills, J. J.; Beecher, C. W. W.; Schilling, A. B., Stable
vindoline production in transformed cell cultures of Catharanthus roseus. J Nat Prod 1997,
60, (3), 261-264.
15. St-Pierre, B.; Vazquez-Flota, F. A.; De Luca, V., Multicellular compartmentation of
Catharanthus roseus alkaloid biosynthesis predicts intercellular translocation of a pathway
intermediate. Plant Cell 1999, 11, (5), 887-900.
16. Pan, Q.; Mustafa, N. R.; Tang, K.; Choi, Y. H.; Verpoorte, R., Monoterpenoid indole
alkaloids biosynthesis and its regulation in Catharanthus roseus: a literature review from
genes to metabolites. Phytochem Rev 2016, 15, (2), 221-250.
17. Góngora-Castillo, E.; Childs, K. L.; Fedewa, G.; Hamilton, J. P.; Liscombe, D. K.;
Magallanes-Lundback, M.; Mandadi, K. K.; Nims, E.; Runguphan, W.; Vaillancourt, B.;
Varbanova-Herde, M.; DellaPenna, D.; McKnight, T. D.; O’Connor, S.; Buell, C. R.,
Development of transcriptomic resources for interrogating the biosynthesis of monoterpene
indole alkaloids in medicinal plant species. PLOS ONE 2012, 7, (12), e52506.
18. Kellner, F.; Kim, J.; Clavijo, B. J.; Hamilton, J. P.; Childs, K. L.; Vaillancourt, B.; Cepela, J.;
Habermann, M.; Steuernagel, B.; Clissold, L.; McLay, K.; Buell, C. R.; O'Connor, S. E.,
Genome-guided investigation of plant natural product biosynthesis. Plant J 2015, 82, (4),
680-92.
19. Pan, Y.-j.; Lin, Y.-c.; Yu, B.-f.; Zu, Y.-g.; Yu, F.; Tang, Z.-H., Transcriptomics comparison
reveals the diversity of ethylene and methyl-jasmonate in roles of TIA metabolism in
Catharanthus roseus. BMC Genomics 2018, 19, (1), 508.
20. Verma, M.; Ghangal, R.; Sharma, R.; Sinha, A. K.; Jain, M., Transcriptome analysis of
Catharanthus roseus for gene discovery and expression profiling. PLOS ONE 2014, 9, (7).
Page 27
26
21. Chung, I. M.; Kim, E. H.; Li, M.; Peebles, C. A.; Jung, W. S.; Song, H. K.; Ahn, J. K.; San,
K. Y., Screening 64 cultivars Catharanthus roseus for the production of vindoline,
catharanthine, and serpentine. Biotechnol Prog 2011, 27, (4), 937-43.
22. Kim, S. W.; Ban, S. H.; Jeong, S.-C.; Chung, H.-J.; Ko, S. M.; Yoo, O. J.; Liu, J. R., Genetic
discrimination between Catharanthus roseus cultivars by metabolic fingerprinting using1H
NMR spectra of aromatic compounds. Biotechnol Bioprocess Eng 2007, 12, (6), 646.
23. Shanks, J. V.; Bhadra, R.; Morgan, J.; Rijhwani, S.; Vani, S., Quantification of metabolites in
the indole alkaloid pathways of Catharanthus roseus: Implications for metabolic
engineering. Biotechnol Bioeng 1998, 58, (2-3), 333-338.
24. Jaleel, C. A.; Gopi, R.; Gomathinayagam, M.; Panneerselvam, R., Traditional and non-
traditional plant growth regulators alters phytochemical constituents in Catharanthus roseus.
Process Biochem 2009, 44, (2), 205-209.
25. Dong Hui, L.; Wei Wei, R.; Li Jie, C.; Li Da, Z.; Xiao Fen, S.; Ke Xuan, T., Enhanced
accumulation of catharanthine and vindoline in Catharanthus roseus hairy roots by
overexpression of transcriptional factor ORCA2. Afr J Biotechnol 2011, 10, (17), 3260-3268.
26. Li, C.; Leopold, A. L.; Sander, G. W.; Shanks, J. V.; Zhao, L.; Gibson, S. I., The ORCA2
transcription factor plays a key role in regulation of the terpenoid indole alkaloid pathway.
BMC Plant Biol 2013, 13, (1), 155.
27. Pan, Q.; Wang, Q.; Yuan, F.; Xing, S.; Zhao, J.; Choi, Y. H.; Verpoorte, R.; Tian, Y.; Wang,
G.; Tang, K., Overexpression of ORCA3 and G10H in Catharanthus roseus plants regulated
alkaloid biosynthesis and metabolism revealed by NMR-metabolomics. PLOS ONE 2012, 7,
(8), e43038.
28. Peebles, C. A. M.; Hughes, E. H.; Shanks, J. V.; San, K.-Y., Transcriptional response of the
terpenoid indole alkaloid pathway to the overexpression of ORCA3 along with jasmonic acid
elicitation of Catharanthus roseus hairy roots over time. Metab Eng 2009, 11, (2), 76-86.
29. Zhang, X.-N.; Liu, J.; Liu, Y.; Wang, Y.; Abozeid, A.; Yu, Z.-G.; Tang, Z.-H., Metabolomics
analysis reveals that ethylene and methyl jasmonate regulate different branch pathways to
promote the accumulation of terpenoid indole alkaloids in Catharanthus roseus. J Nat Prod
2018, 81, (2), 335-342.
30. Caputi, L.; Franke, J.; Farrow, S. C.; Chung, K.; Payne, R. M. E.; Nguyen, T.-D.; Dang, T.-
T. T.; Carqueijeiro, I. S. T.; Koudounas, K.; Bernonville, T. D. d.; Ameyaw, B.; Jones, D.
M.; Vieira, I. J. C.; Courdavault, V.; O’Connor, S. E., Missing enzymes in the biosynthesis of
the anticancer drug vinblastine in Madagascar periwinkle. Science 2018, 360, (6394), 1235-
1239.
31. Wang, Q.; Xing, S.; Pan, Q.; Yuan, F.; Zhao, J.; Tian, Y.; Chen, Y.; Wang, G.; Tang, K.,
Development of efficient Catharanthus roseus regeneration and transformation system using
Agrobacterium tumefaciens and hypocotyls as explants. BMC Biotechnol 2012, 12, 34.
32. Jaggi, M.; Kumar, S.; Sinha, A. K., Overexpression of an apoplastic peroxidase gene CrPrx
in transgenic hairy root lines of Catharanthus roseus. Appl Microbiol Biotechnol 2011, 90,
(3), 1005-1016.
33. Ruijter, J. M.; Ramakers, C.; Hoogaars, W. M.; Karlen, Y.; Bakker, O.; van den Hoff, M. J.;
Moorman, A. F., Amplification efficiency: linking baseline and bias in the analysis of
quantitative PCR data. Nucleic Acids Res 2009, 37, (6), e45.
Page 28
download fileview on ChemRxivCroseus_manuscript_final.pdf (813.46 KiB)
Page 29
Supplemental data for:
Metabolomics analysis reveals both plant variety and choice of
hormone treatment modulate vinca alkaloid production in
Catharanthus roseus.
Valerie N. Fraser†‡, Benjamin Philmus§⊥*, Molly Megraw‡⊥*.
†Molecular and Cellular Biology Program, Oregon State University, Corvallis, Oregon 97331,
United States.
‡Department of Botany and Plant Pathology, Oregon State University, Corvallis, Oregon 97331,
United States.
§Department of Pharmaceutical Sciences, Oregon State University, Corvallis, Oregon 97331,
United States.
⊥Center for Genomics and Biocomputing, Oregon State University, Corvallis, Oregon 97331,
United States.
Page 30
2
Table of Contents
Supplemental Figures
Supplemental Figure S1: Relative intensities of ajmalicine/tetrahydroalstonine.....................3
Supplemental Figure S2: Expression of upstream genes HMGS & DXS2..…………………4
Supplemental Figure S3: Expression of more key enzymes in TIA pathway..………………5
Supplemental Tables
Supplemental Table S1: Available ’omics data available for selected varieties.…………….6
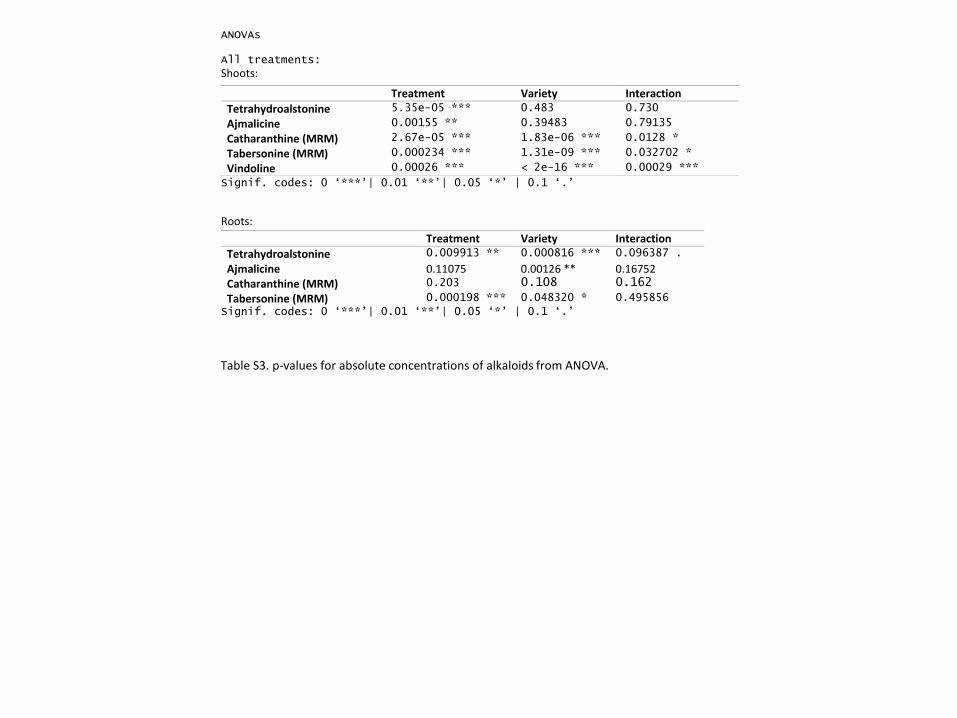
Supplemental Table S2: ANOVAs for absolute concentration of selected alkaloids………..7
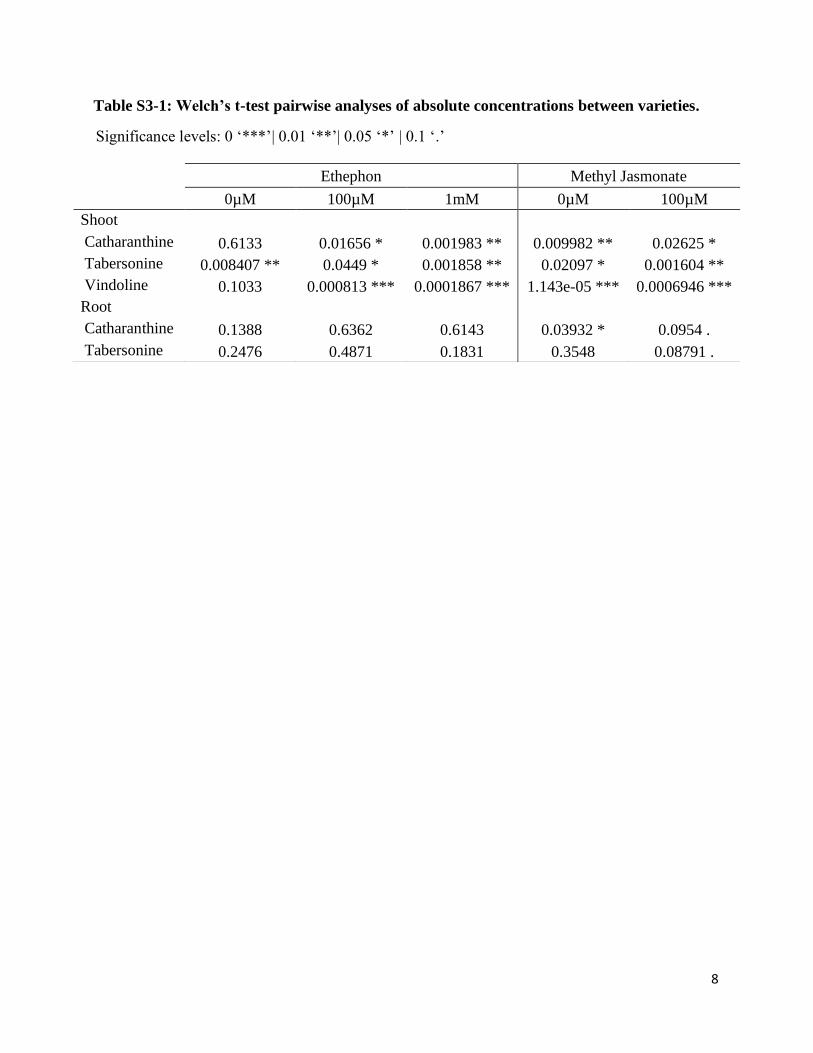
Supplemental Table S3-1: Welch’s t-test pairwise analyses of absolute concentrations
between varieties………………………………………………………………………….8
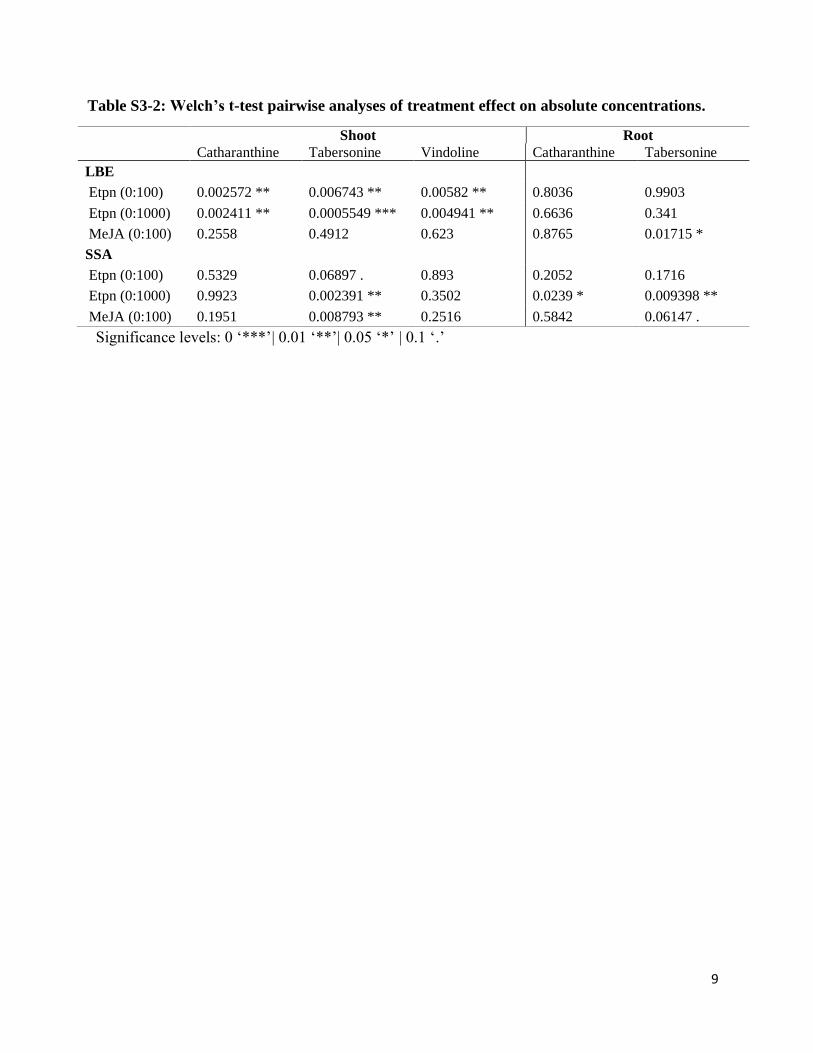
Supplemental Table 3-2: Welch’s t-test pairwise analyses of treatment effect on absolute
concentrations……………………………………………………………………………..9
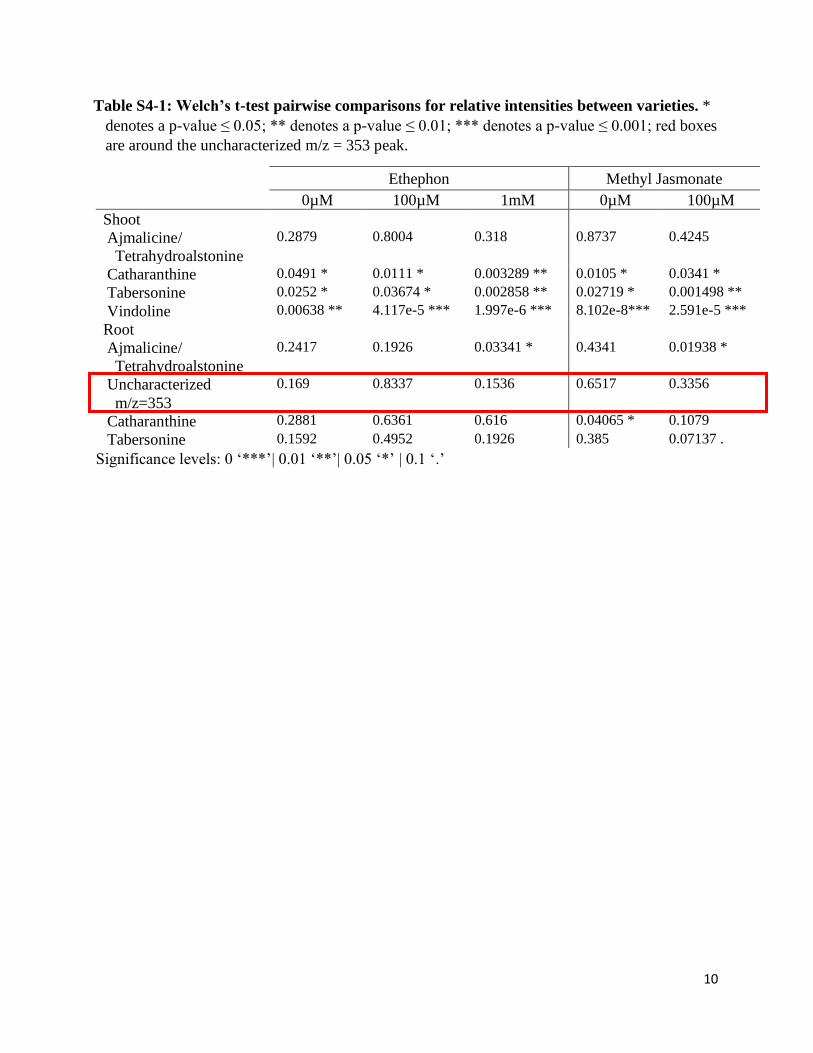
Supplementary Table S4-1: Welch’s t-test pairwise comparisons for relative intensities
between varieties…………………………………………………………………………10
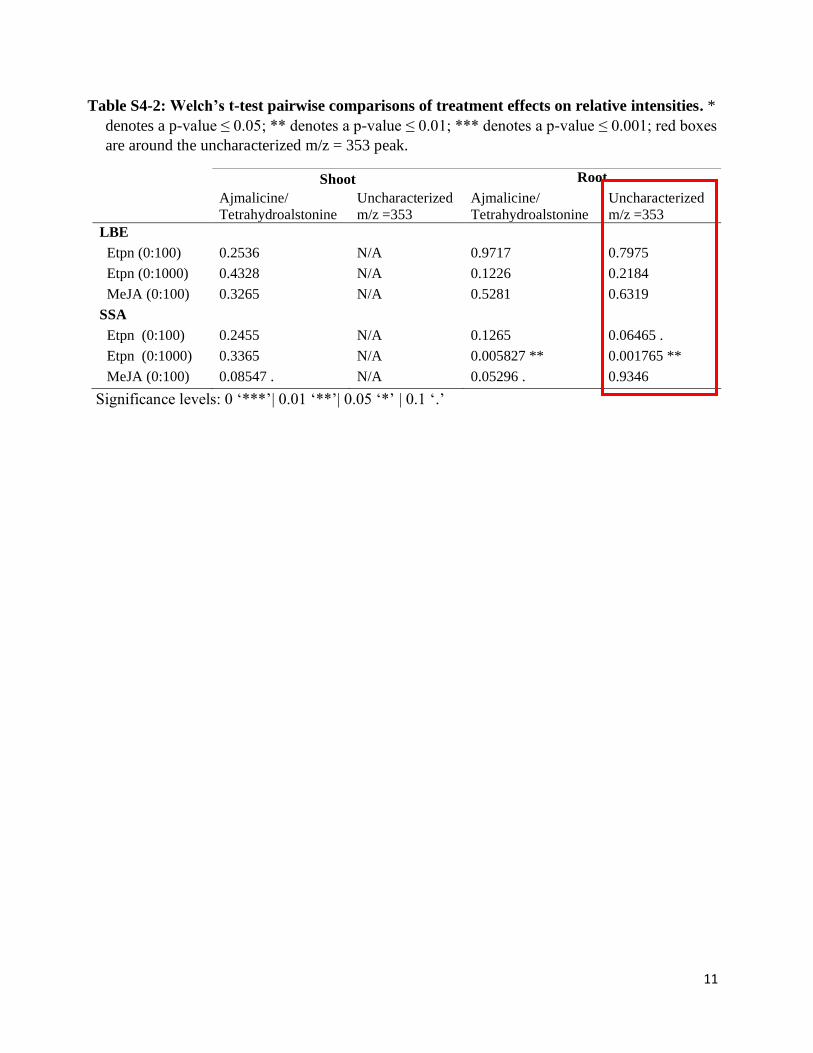
Supplemental Table 4-2: Welch’s t-test pairwise comparisons of treatment effects on relative
intensities………………………………………………………………………………...11
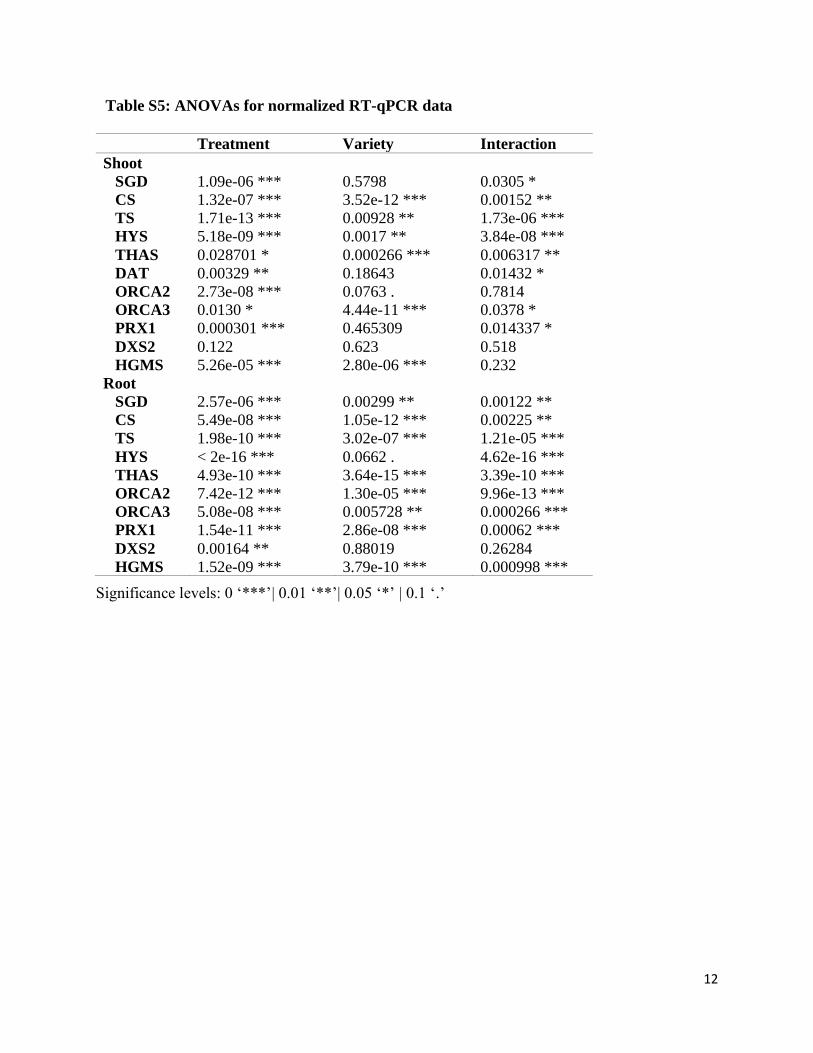
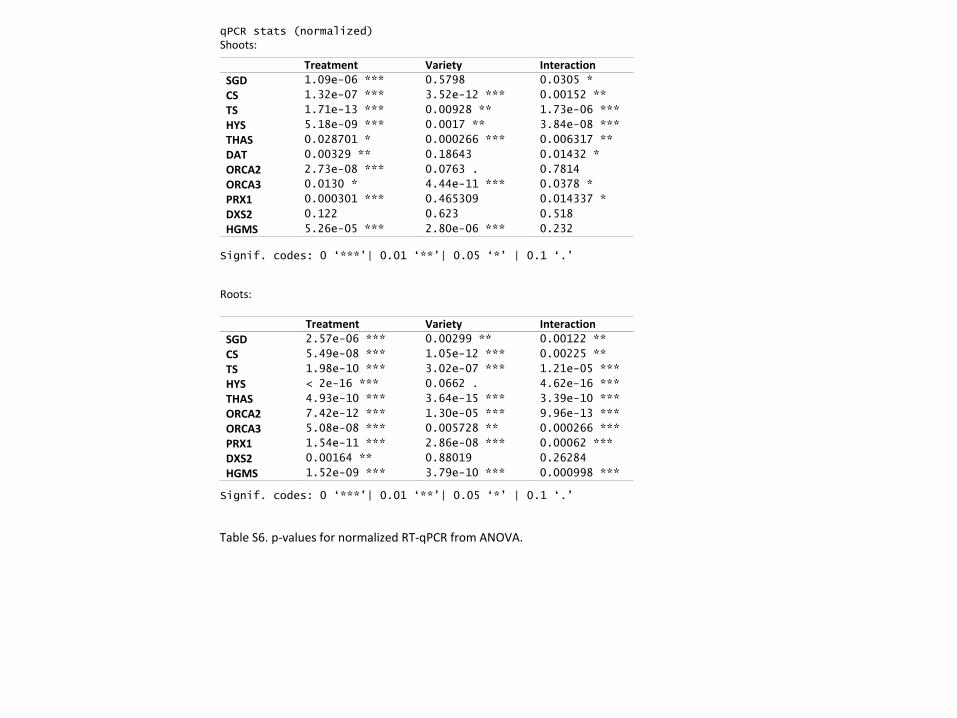
Supplementary Table S5: ANOVAs for normalized RT-qPCR data……………………….12
Supplementary Table S6-1: Welch’s t-test pairwise comparisons between varieties for
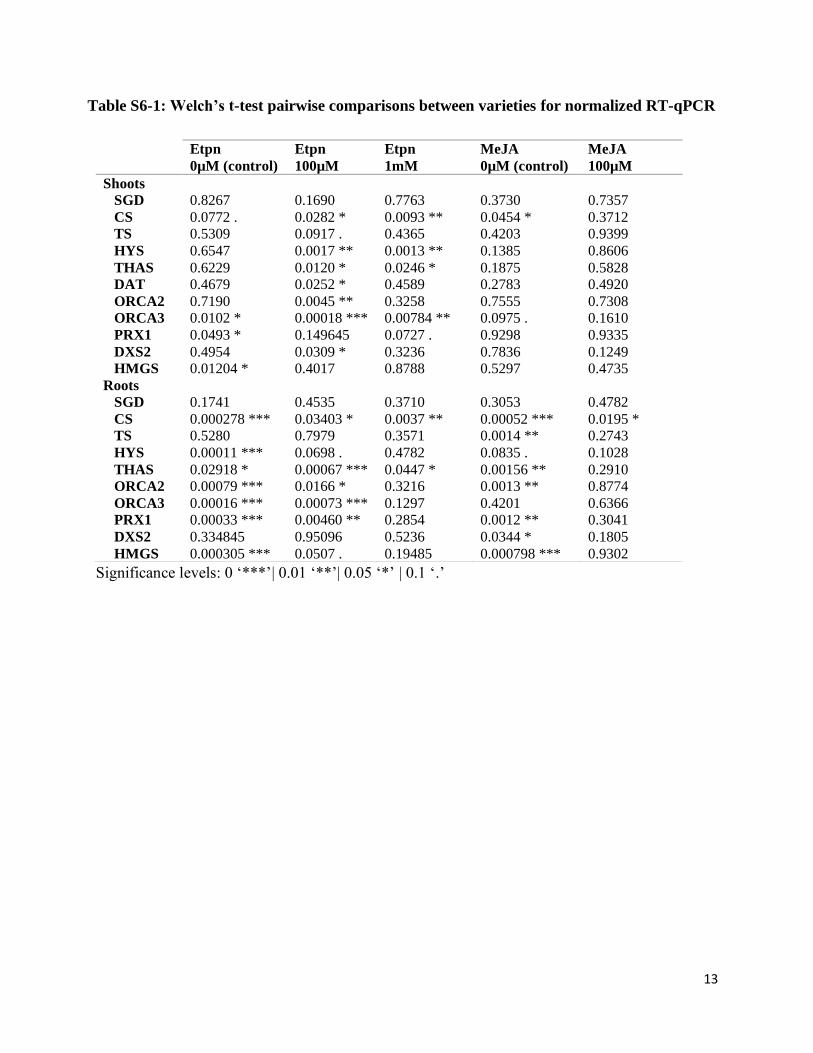
normalized RT-qPCR……………………………………………………………………13
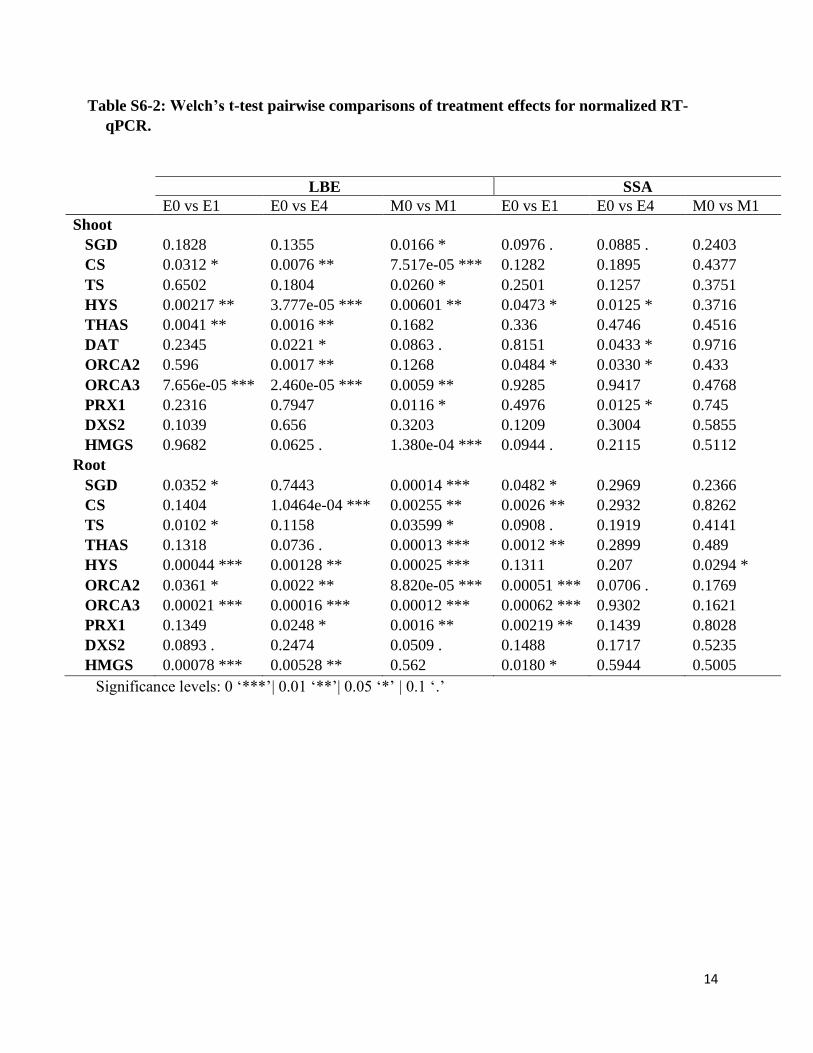
Supplemental Table 6-2: Welch’s t-test pairwise comparisons of treatment effects for
normalized RT-qPCR……………………………………………………………………14
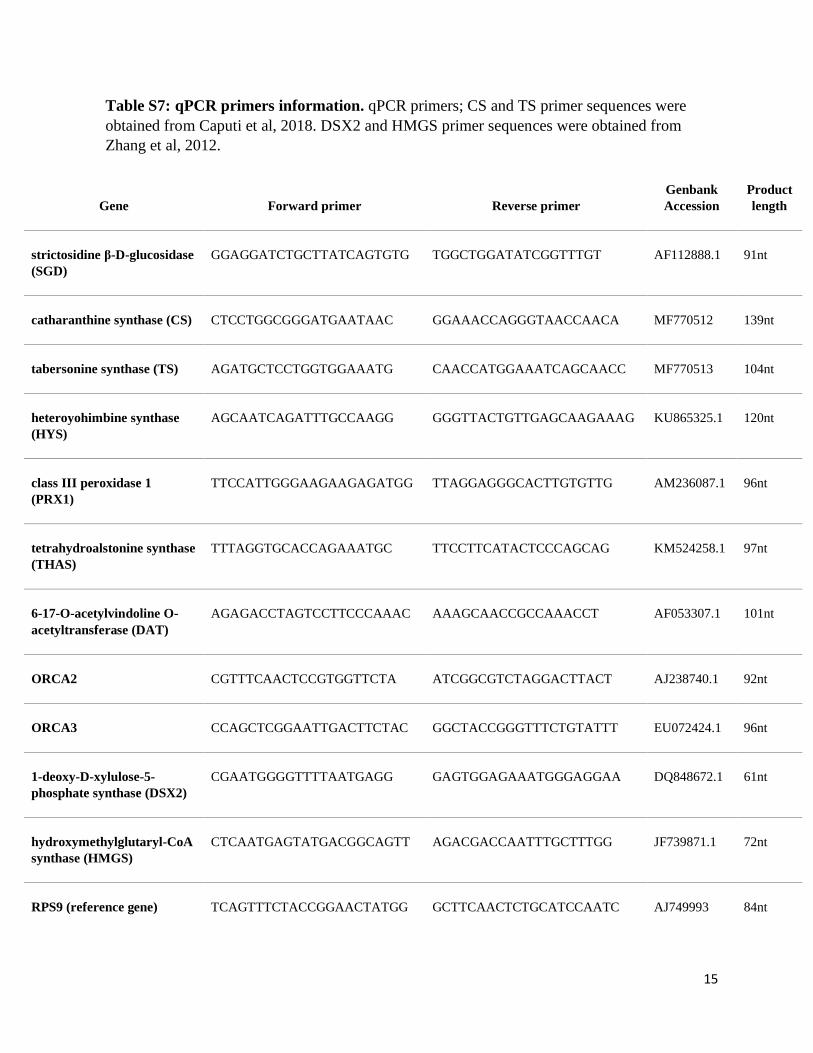
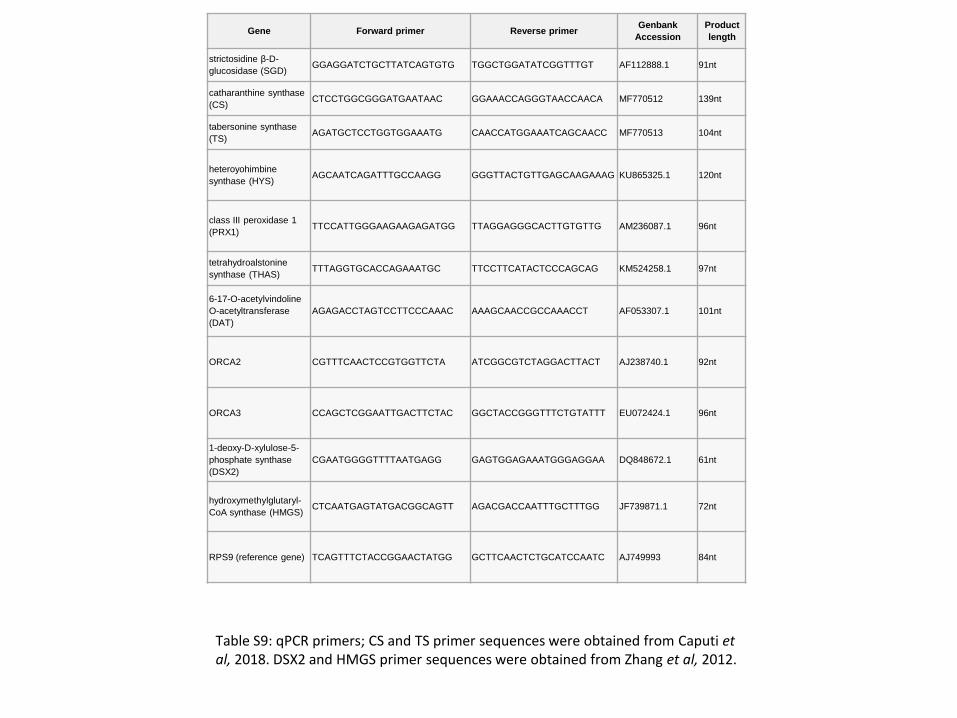
Supplemental Table S7: qPCR primers information………………………………………..15
Page 31
3
Supplemental Figures
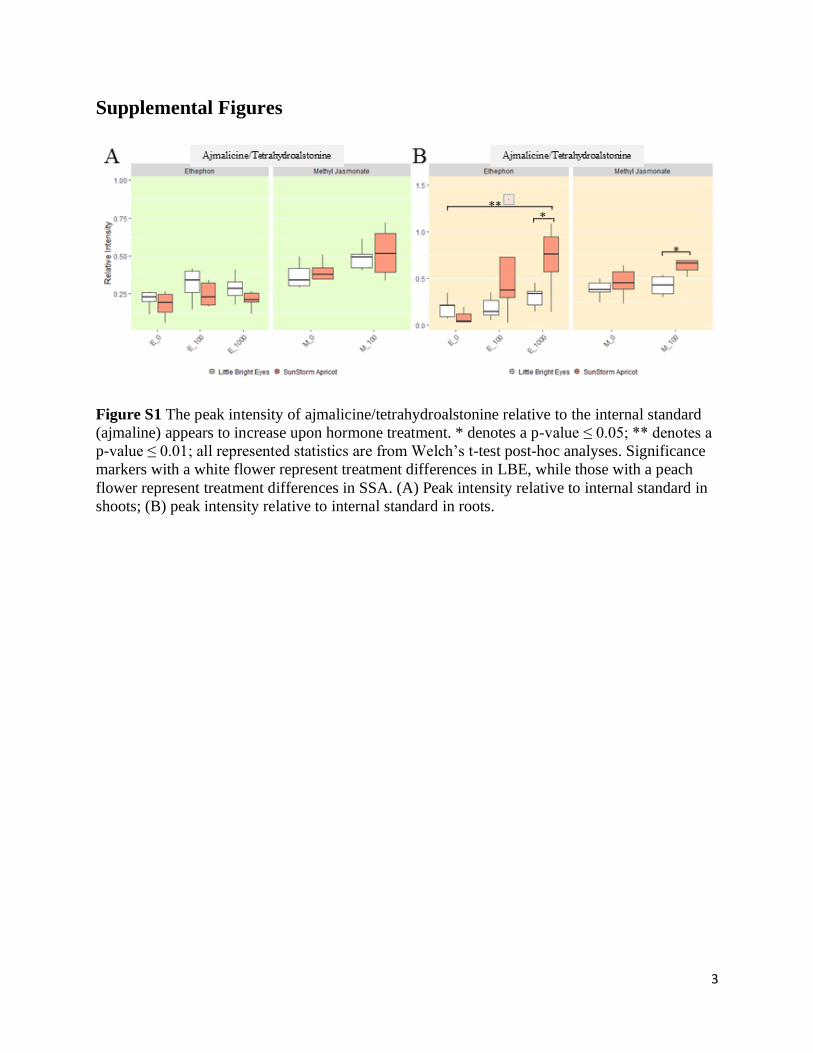
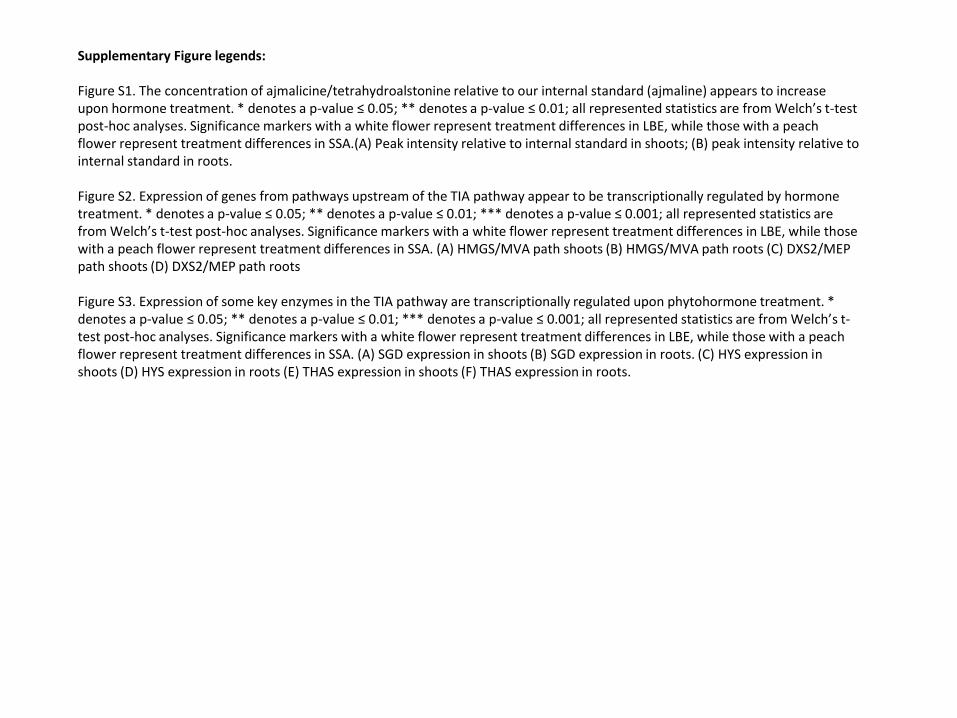
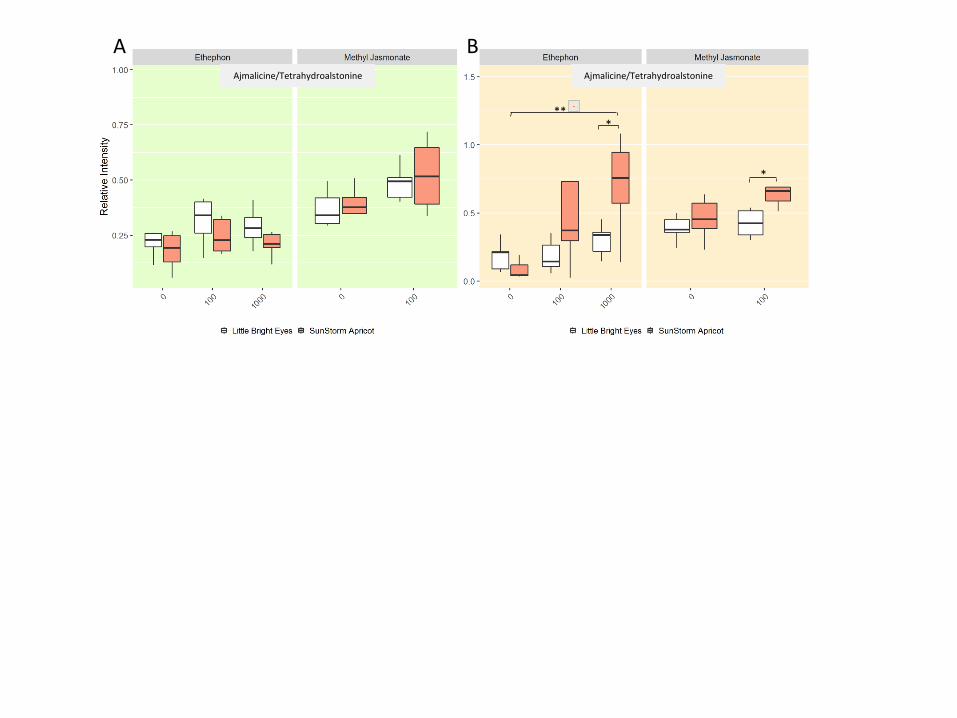
Figure S1 The peak intensity of ajmalicine/tetrahydroalstonine relative to the internal standard
(ajmaline) appears to increase upon hormone treatment. * denotes a p-value ≤ 0.05; ** denotes a
p-value ≤ 0.01; all represented statistics are from Welch’s t-test post-hoc analyses. Significance
markers with a white flower represent treatment differences in LBE, while those with a peach
flower represent treatment differences in SSA. (A) Peak intensity relative to internal standard in
shoots; (B) peak intensity relative to internal standard in roots.
Page 32
4
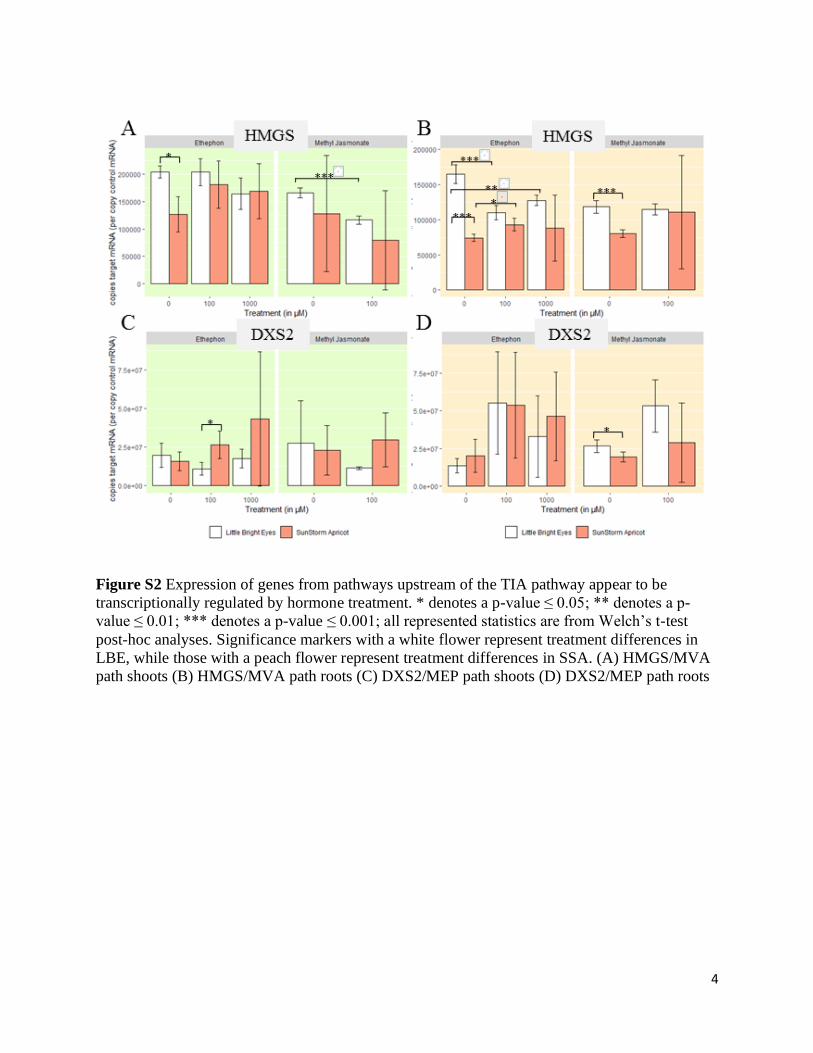
Figure S2 Expression of genes from pathways upstream of the TIA pathway appear to be
transcriptionally regulated by hormone treatment. * denotes a p-value ≤ 0.05; ** denotes a p-
value ≤ 0.01; *** denotes a p-value ≤ 0.001; all represented statistics are from Welch’s t-test
post-hoc analyses. Significance markers with a white flower represent treatment differences in
LBE, while those with a peach flower represent treatment differences in SSA. (A) HMGS/MVA
path shoots (B) HMGS/MVA path roots (C) DXS2/MEP path shoots (D) DXS2/MEP path roots
Page 33
5
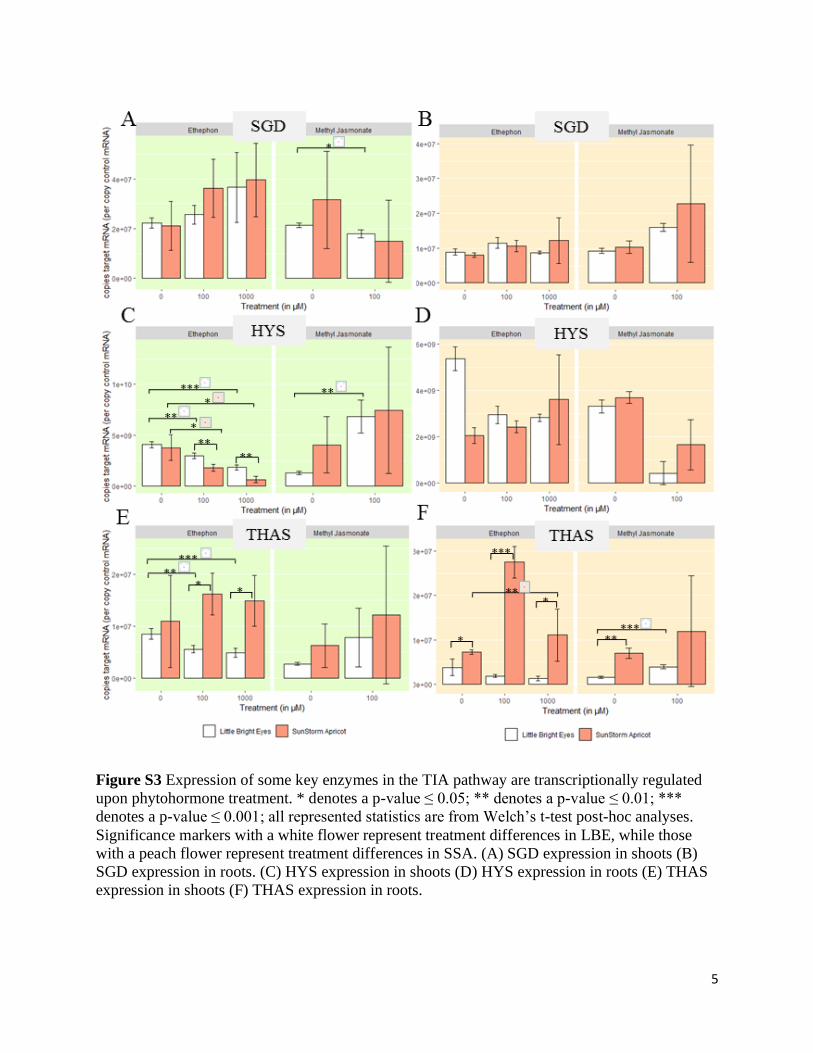
Figure S3 Expression of some key enzymes in the TIA pathway are transcriptionally regulated
upon phytohormone treatment. * denotes a p-value ≤ 0.05; ** denotes a p-value ≤ 0.01; ***
denotes a p-value ≤ 0.001; all represented statistics are from Welch’s t-test post-hoc analyses.
Significance markers with a white flower represent treatment differences in LBE, while those
with a peach flower represent treatment differences in SSA. (A) SGD expression in shoots (B)
SGD expression in roots. (C) HYS expression in shoots (D) HYS expression in roots (E) THAS
expression in shoots (F) THAS expression in roots.
Page 34
6
Supplemental Tables
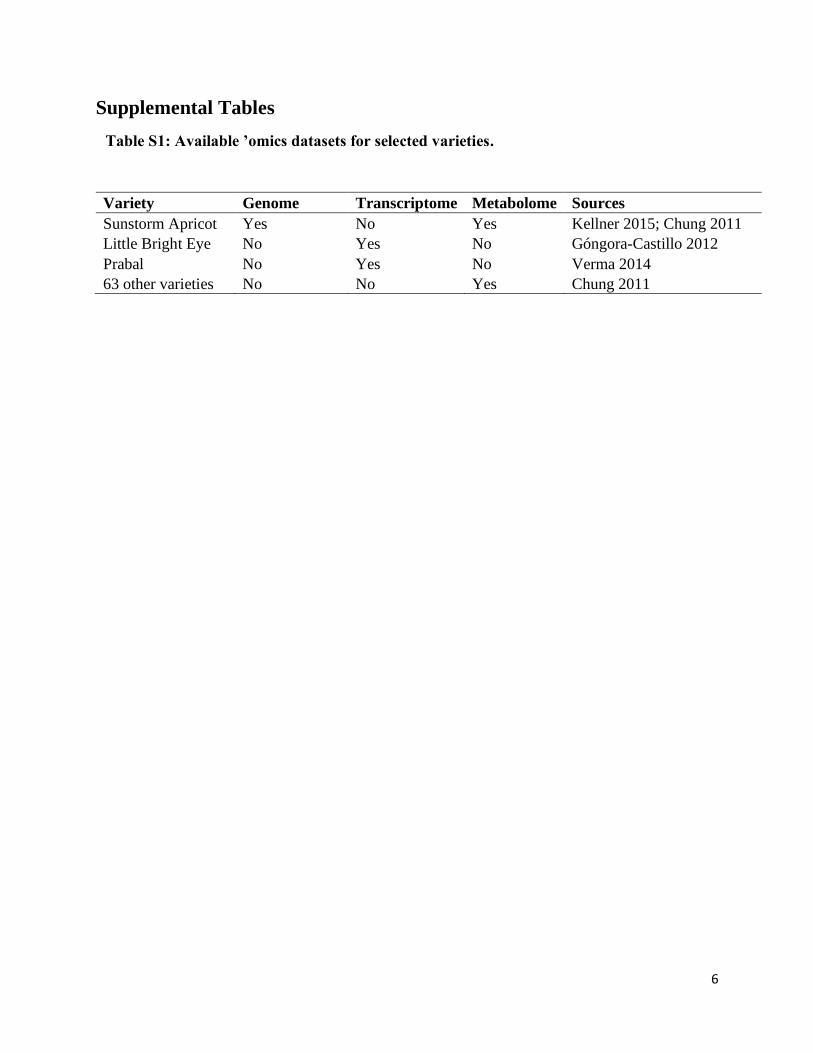
Table S1: Available ’omics datasets for selected varieties.
Variety Genome Transcriptome Metabolome Sources
Sunstorm Apricot Yes No Yes Kellner 2015; Chung 2011
Little Bright Eye No Yes No Góngora-Castillo 2012
Prabal No Yes No Verma 2014
63 other varieties No No Yes Chung 2011
Page 35
7
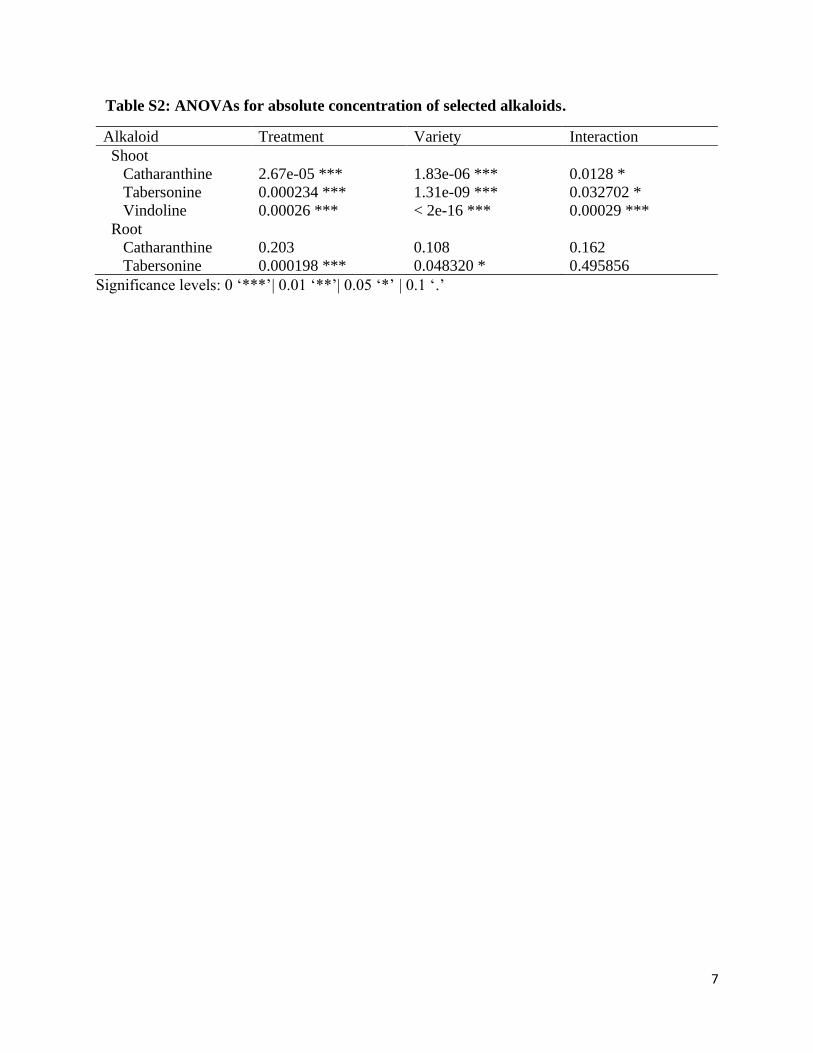
Table S2: ANOVAs for absolute concentration of selected alkaloids.
Alkaloid Treatment Variety Interaction
Shoot
Catharanthine 2.67e-05 *** 1.83e-06 *** 0.0128 *
Tabersonine 0.000234 *** 1.31e-09 *** 0.032702 *
Vindoline 0.00026 *** < 2e-16 *** 0.00029 ***
Root
Catharanthine 0.203 0.108 0.162
Tabersonine 0.000198 *** 0.048320 * 0.495856
Significance levels: 0 ‘***’| 0.01 ‘**’| 0.05 ‘*’ | 0.1 ‘.’
Page 36
8
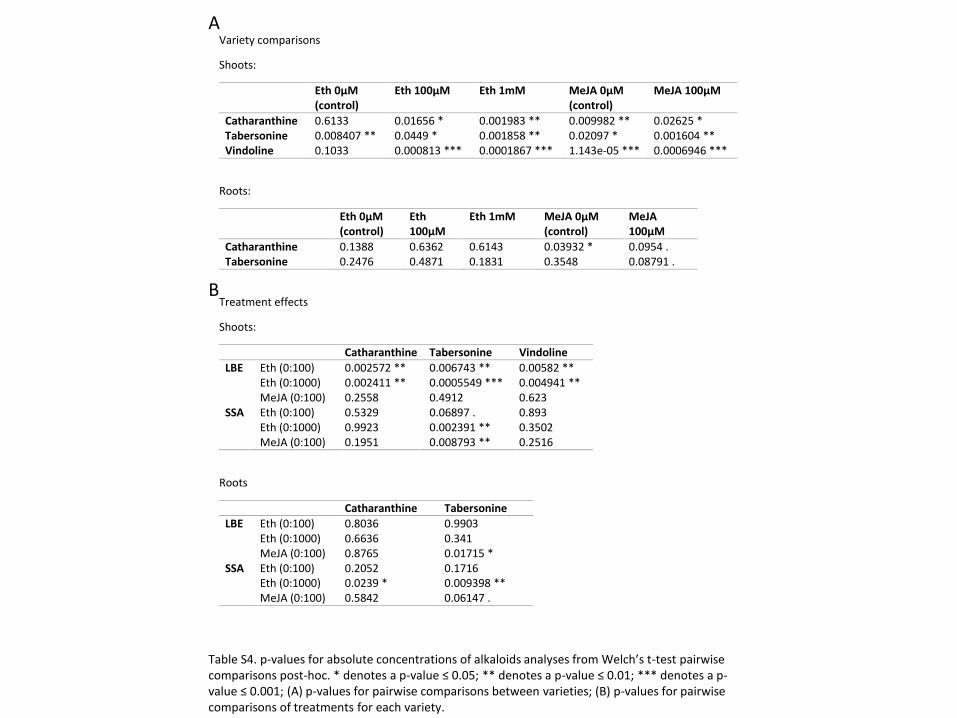
Table S3-1: Welch’s t-test pairwise analyses of absolute concentrations between varieties.
Significance levels: 0 ‘***’| 0.01 ‘**’| 0.05 ‘*’ | 0.1 ‘.’
Ethephon Methyl Jasmonate
0µM 100µM 1mM 0µM 100µM
Shoot
Catharanthine 0.6133 0.01656 * 0.001983 ** 0.009982 ** 0.02625 *
Tabersonine 0.008407 ** 0.0449 * 0.001858 ** 0.02097 * 0.001604 **
Vindoline 0.1033 0.000813 *** 0.0001867 *** 1.143e-05 *** 0.0006946 ***
Root
Catharanthine 0.1388 0.6362 0.6143 0.03932 * 0.0954 .
Tabersonine 0.2476 0.4871 0.1831 0.3548 0.08791 .
Page 37
9
Table S3-2: Welch’s t-test pairwise analyses of treatment effect on absolute concentrations.
Shoot Root
Catharanthine Tabersonine Vindoline Catharanthine Tabersonine
LBE
Etpn (0:100) 0.002572 ** 0.006743 ** 0.00582 ** 0.8036 0.9903
Etpn (0:1000) 0.002411 ** 0.0005549 *** 0.004941 ** 0.6636 0.341
MeJA (0:100) 0.2558 0.4912 0.623 0.8765 0.01715 *
SSA
Etpn (0:100) 0.5329 0.06897 . 0.893 0.2052 0.1716
Etpn (0:1000) 0.9923 0.002391 ** 0.3502 0.0239 * 0.009398 **
MeJA (0:100) 0.1951 0.008793 ** 0.2516 0.5842 0.06147 .
Significance levels: 0 ‘***’| 0.01 ‘**’| 0.05 ‘*’ | 0.1 ‘.’
Page 38
10
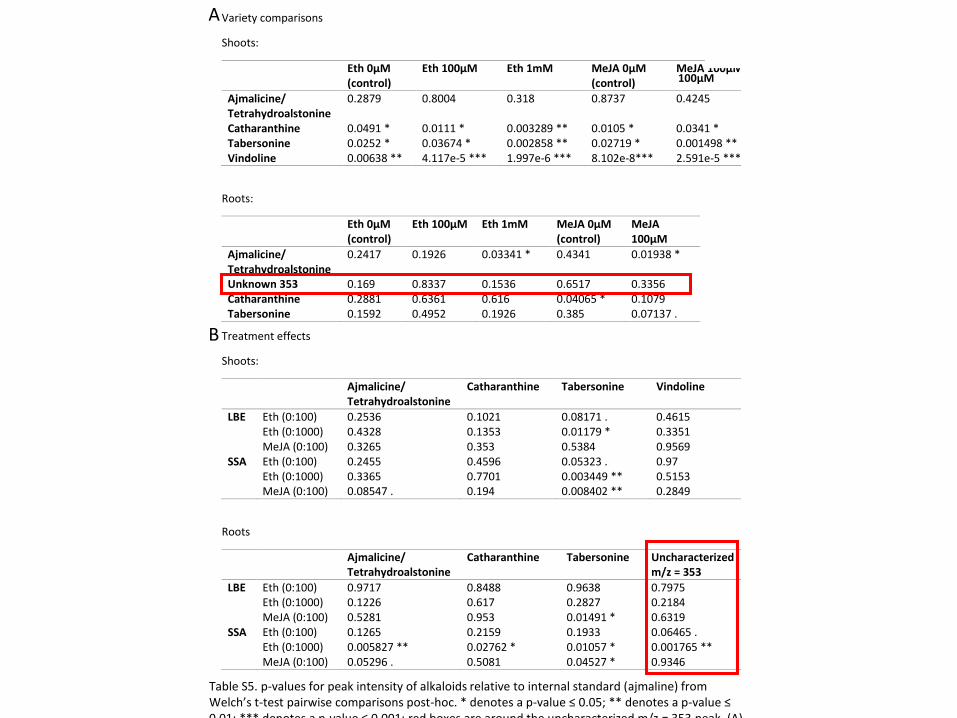
Table S4-1: Welch’s t-test pairwise comparisons for relative intensities between varieties. *
denotes a p-value ≤ 0.05; ** denotes a p-value ≤ 0.01; *** denotes a p-value ≤ 0.001; red boxes
are around the uncharacterized m/z = 353 peak.
Significance levels: 0 ‘***’| 0.01 ‘**’| 0.05 ‘*’ | 0.1 ‘.’
Ethephon Methyl Jasmonate
0µM 100µM 1mM 0µM 100µM
Shoot
Ajmalicine/
Tetrahydroalstonine
0.2879 0.8004 0.318 0.8737 0.4245
Catharanthine 0.0491 * 0.0111 * 0.003289 ** 0.0105 * 0.0341 *
Tabersonine 0.0252 * 0.03674 * 0.002858 ** 0.02719 * 0.001498 **
Vindoline 0.00638 ** 4.117e-5 *** 1.997e-6 *** 8.102e-8*** 2.591e-5 ***
Root
Ajmalicine/
Tetrahydroalstonine
0.2417 0.1926 0.03341 * 0.4341 0.01938 *
Uncharacterized
m/z=353
0.169 0.8337 0.1536 0.6517 0.3356
Catharanthine 0.2881 0.6361 0.616 0.04065 * 0.1079
Tabersonine 0.1592 0.4952 0.1926 0.385 0.07137 .
Page 39
11
Table S4-2: Welch’s t-test pairwise comparisons of treatment effects on relative intensities. *
denotes a p-value ≤ 0.05; ** denotes a p-value ≤ 0.01; *** denotes a p-value ≤ 0.001; red boxes
are around the uncharacterized m/z = 353 peak.
Significance levels: 0 ‘***’| 0.01 ‘**’| 0.05 ‘*’ | 0.1 ‘.’
Shoot Root
Ajmalicine/
Tetrahydroalstonine
Uncharacterized
m/z =353
Ajmalicine/
Tetrahydroalstonine
Uncharacterized
m/z =353
LBE
Etpn (0:100) 0.2536 N/A 0.9717 0.7975
Etpn (0:1000) 0.4328 N/A 0.1226 0.2184
MeJA (0:100) 0.3265 N/A 0.5281 0.6319
SSA
Etpn (0:100) 0.2455 N/A 0.1265 0.06465 .
Etpn (0:1000) 0.3365 N/A 0.005827 ** 0.001765 **
MeJA (0:100) 0.08547 . N/A 0.05296 . 0.9346
Page 40
12
Table S5: ANOVAs for normalized RT-qPCR data
Significance levels: 0 ‘***’| 0.01 ‘**’| 0.05 ‘*’ | 0.1 ‘.’
Treatment Variety Interaction
Shoot
SGD 1.09e-06 *** 0.5798 0.0305 *
CS 1.32e-07 *** 3.52e-12 *** 0.00152 **
TS 1.71e-13 *** 0.00928 ** 1.73e-06 ***
HYS 5.18e-09 *** 0.0017 ** 3.84e-08 ***
THAS 0.028701 * 0.000266 *** 0.006317 **
DAT 0.00329 ** 0.18643 0.01432 *
ORCA2 2.73e-08 *** 0.0763 . 0.7814
ORCA3 0.0130 * 4.44e-11 *** 0.0378 *
PRX1 0.000301 *** 0.465309 0.014337 *
DXS2 0.122 0.623 0.518
HGMS 5.26e-05 *** 2.80e-06 *** 0.232
Root
SGD 2.57e-06 *** 0.00299 ** 0.00122 **
CS 5.49e-08 *** 1.05e-12 *** 0.00225 **
TS 1.98e-10 *** 3.02e-07 *** 1.21e-05 ***
HYS < 2e-16 *** 0.0662 . 4.62e-16 ***
THAS 4.93e-10 *** 3.64e-15 *** 3.39e-10 ***
ORCA2 7.42e-12 *** 1.30e-05 *** 9.96e-13 ***
ORCA3 5.08e-08 *** 0.005728 ** 0.000266 ***
PRX1 1.54e-11 *** 2.86e-08 *** 0.00062 ***
DXS2 0.00164 ** 0.88019 0.26284
HGMS 1.52e-09 *** 3.79e-10 *** 0.000998 ***
Page 41
13
Table S6-1: Welch’s t-test pairwise comparisons between varieties for normalized RT-qPCR
Significance levels: 0 ‘***’| 0.01 ‘**’| 0.05 ‘*’ | 0.1 ‘.’
Etpn
0µM (control)
Etpn
100µM
Etpn
1mM
MeJA
0µM (control)
MeJA
100µM
Shoots
SGD 0.8267 0.1690 0.7763 0.3730 0.7357
CS 0.0772 . 0.0282 * 0.0093 ** 0.0454 * 0.3712
TS 0.5309 0.0917 . 0.4365 0.4203 0.9399
HYS 0.6547 0.0017 ** 0.0013 ** 0.1385 0.8606
THAS 0.6229 0.0120 * 0.0246 * 0.1875 0.5828
DAT 0.4679 0.0252 * 0.4589 0.2783 0.4920
ORCA2 0.7190 0.0045 ** 0.3258 0.7555 0.7308
ORCA3 0.0102 * 0.00018 *** 0.00784 ** 0.0975 . 0.1610
PRX1 0.0493 * 0.149645 0.0727 . 0.9298 0.9335
DXS2 0.4954 0.0309 * 0.3236 0.7836 0.1249
HMGS 0.01204 * 0.4017 0.8788 0.5297 0.4735
Roots
SGD 0.1741 0.4535 0.3710 0.3053 0.4782
CS 0.000278 *** 0.03403 * 0.0037 ** 0.00052 *** 0.0195 *
TS 0.5280 0.7979 0.3571 0.0014 ** 0.2743
HYS 0.00011 *** 0.0698 . 0.4782 0.0835 . 0.1028
THAS 0.02918 * 0.00067 *** 0.0447 * 0.00156 ** 0.2910
ORCA2 0.00079 *** 0.0166 * 0.3216 0.0013 ** 0.8774
ORCA3 0.00016 *** 0.00073 *** 0.1297 0.4201 0.6366
PRX1 0.00033 *** 0.00460 ** 0.2854 0.0012 ** 0.3041
DXS2 0.334845 0.95096 0.5236 0.0344 * 0.1805
HMGS 0.000305 *** 0.0507 . 0.19485 0.000798 *** 0.9302
Page 42
14
Table S6-2: Welch’s t-test pairwise comparisons of treatment effects for normalized RT-
qPCR.
LBE SSA E0 vs E1 E0 vs E4 M0 vs M1 E0 vs E1 E0 vs E4 M0 vs M1
Shoot
SGD 0.1828 0.1355 0.0166 * 0.0976 . 0.0885 . 0.2403
CS 0.0312 * 0.0076 ** 7.517e-05 *** 0.1282 0.1895 0.4377
TS 0.6502 0.1804 0.0260 * 0.2501 0.1257 0.3751
HYS 0.00217 ** 3.777e-05 *** 0.00601 ** 0.0473 * 0.0125 * 0.3716
THAS 0.0041 ** 0.0016 ** 0.1682 0.336 0.4746 0.4516
DAT 0.2345 0.0221 * 0.0863 . 0.8151 0.0433 * 0.9716
ORCA2 0.596 0.0017 ** 0.1268 0.0484 * 0.0330 * 0.433
ORCA3 7.656e-05 *** 2.460e-05 *** 0.0059 ** 0.9285 0.9417 0.4768
PRX1 0.2316 0.7947 0.0116 * 0.4976 0.0125 * 0.745
DXS2 0.1039 0.656 0.3203 0.1209 0.3004 0.5855
HMGS 0.9682 0.0625 . 1.380e-04 *** 0.0944 . 0.2115 0.5112
Root
SGD 0.0352 * 0.7443 0.00014 *** 0.0482 * 0.2969 0.2366
CS 0.1404 1.0464e-04 *** 0.00255 ** 0.0026 ** 0.2932 0.8262
TS 0.0102 * 0.1158 0.03599 * 0.0908 . 0.1919 0.4141
THAS 0.1318 0.0736 . 0.00013 *** 0.0012 ** 0.2899 0.489
HYS 0.00044 *** 0.00128 ** 0.00025 *** 0.1311 0.207 0.0294 *
ORCA2 0.0361 * 0.0022 ** 8.820e-05 *** 0.00051 *** 0.0706 . 0.1769
ORCA3 0.00021 *** 0.00016 *** 0.00012 *** 0.00062 *** 0.9302 0.1621
PRX1 0.1349 0.0248 * 0.0016 ** 0.00219 ** 0.1439 0.8028
DXS2 0.0893 . 0.2474 0.0509 . 0.1488 0.1717 0.5235
HMGS 0.00078 *** 0.00528 ** 0.562 0.0180 * 0.5944 0.5005
Significance levels: 0 ‘***’| 0.01 ‘**’| 0.05 ‘*’ | 0.1 ‘.’
Page 43
15
Table S7: qPCR primers information. qPCR primers; CS and TS primer sequences were
obtained from Caputi et al, 2018. DSX2 and HMGS primer sequences were obtained from
Zhang et al, 2012.
Gene Forward primer Reverse primer
Genbank
Accession
Product
length
strictosidine β-D-glucosidase
(SGD)
GGAGGATCTGCTTATCAGTGTG TGGCTGGATATCGGTTTGT AF112888.1 91nt
catharanthine synthase (CS) CTCCTGGCGGGATGAATAAC GGAAACCAGGGTAACCAACA MF770512 139nt
tabersonine synthase (TS) AGATGCTCCTGGTGGAAATG CAACCATGGAAATCAGCAACC MF770513 104nt
heteroyohimbine synthase
(HYS)
AGCAATCAGATTTGCCAAGG GGGTTACTGTTGAGCAAGAAAG KU865325.1 120nt
class III peroxidase 1
(PRX1)
TTCCATTGGGAAGAAGAGATGG TTAGGAGGGCACTTGTGTTG AM236087.1 96nt
tetrahydroalstonine synthase
(THAS)
TTTAGGTGCACCAGAAATGC TTCCTTCATACTCCCAGCAG KM524258.1 97nt
6-17-O-acetylvindoline O-
acetyltransferase (DAT)
AGAGACCTAGTCCTTCCCAAAC AAAGCAACCGCCAAACCT AF053307.1 101nt
ORCA2 CGTTTCAACTCCGTGGTTCTA ATCGGCGTCTAGGACTTACT AJ238740.1 92nt
ORCA3 CCAGCTCGGAATTGACTTCTAC GGCTACCGGGTTTCTGTATTT EU072424.1 96nt
1-deoxy-D-xylulose-5-
phosphate synthase (DSX2)
CGAATGGGGTTTTAATGAGG GAGTGGAGAAATGGGAGGAA DQ848672.1 61nt
hydroxymethylglutaryl-CoA
synthase (HMGS)
CTCAATGAGTATGACGGCAGTT AGACGACCAATTTGCTTTGG JF739871.1 72nt
RPS9 (reference gene) TCAGTTTCTACCGGAACTATGG GCTTCAACTCTGCATCCAATC AJ749993 84nt
Page 44
16
References
(1) Caputi, L.; Franke, J.; Farrow, S. C.; Chung, K.; Payne, R. M. E.; Nguyen, T.-D.; Dang, T.-T. T.;
Carqueijeiro, I. S. T.; Koudounas, K.; Bernonville, T. D. d.; Ameyaw, B.; Jones, D. M.; Vieira, I. J. C.;
Courdavault, V.; O’Connor, S. E., Missing enzymes in the biosynthesis of the anticancer drug vinblastine
in Madagascar periwinkle. Science 2018, 360, (6394), 1235-1239.
(2) Chung, I. M.; Hong, S. B.; Peebles, C. A.; Kim, J. A.; San, K. Y., Effect of the engineered indole
pathway on accumulation of phenolic compounds in Catharanthus roseus hairy roots. Biotechnol. Prog.
2007, 23, (2), 327-32.
(3) Góngora-Castillo, E.; Childs, K. L.; Fedewa, G.; Hamilton, J. P.; Liscombe, D. K.; Magallanes-
Lundback, M.; Mandadi, K. K.; Nims, E.; Runguphan, W.; Vaillancourt, B.; Varbanova-Herde, M.;
DellaPenna, D.; McKnight, T. D.; O’Connor, S.; Buell, C. R., Development of transcriptomic resources
for interrogating the biosynthesis of monoterpene indole alkaloids in medicinal plant species. PLOS ONE
2012, 7, (12), e52506.
(4) Kellner, F.; Kim, J.; Clavijo, B. J.; Hamilton, J. P.; Childs, K. L.; Vaillancourt, B.; Cepela, J.;
Habermann, M.; Steuernagel, B.; Clissold, L.; McLay, K.; Buell, C. R.; O'Connor, S. E., Genome-guided
investigation of plant natural product biosynthesis. Plant J. 2015, 82, (4), 680-92.
(5) Verma, M.; Ghangal, R.; Sharma, R.; Sinha, A. K.; Jain, M., Transcriptome analysis of
Catharanthus roseus for gene discovery and expression profiling. PLOS ONE 2014, 9, (7).
(6) Zhang, X.-N.; Liu, J.; Liu, Y.; Wang, Y.; Abozeid, A.; Yu, Z.-G.; Tang, Z.-H., Metabolomics
analysis reveals that ethylene and methyl jasmonate regulate different branch pathways to promote the
accumulation of terpenoid indole alkaloids in Catharanthus roseus. J. Nat. Prod. 2018, 81, (2), 335-342.
Page 45
download fileview on ChemRxivCroseus_paper_ACS_SI_final.pdf (594.67 KiB)
Page 46
Metabolomics analysis reveals both plant variety and choice of 1
hormone treatment modulate vinca alkaloid production in 2
Catharanthus roseus 3
Valerie N. Fraser1,2, Benjamin Philmus3,4*, Molly Megraw2,4* 4
5
1Molecular and Cellular Biology Program 6
2Department of Botany and Plant Pathology 7
3Department of Pharmaceutical Sciences 8
4Center for Genome Research and Biocomputing 9
Oregon State University, Corvallis, Oregon 97331, United States. 10
11
*Correspondence: [email protected] ; [email protected] 12
13
Page 47
KEYWORDS: vinca alkaloid induction; methyl jasmonate; ethephon; Catharanthus roseus 14
15
ABSTRACT 16
The medicinal plant Catharanthus roseus produces numerous secondary metabolites of interest 17
for the treatment of many diseases—most notably for the terpene indole alkaloid (TIA) vinblastine, 18
which is used in the treatment of leukemia and Hodgkin’s lymphoma. Historically, methyl 19
jasmonate (MeJA) has been used to induce TIA production, but in the past, this has only been 20
investigated in either whole seedlings, cell culture, or hairy root culture. This study examines the 21
effects of the phytohormones MeJA and ethylene on the induction of TIA biosynthesis and 22
accumulation in the shoots and roots of 8-day old seedlings of two varieties of C. roseus. Using 23
LCMS and RT-qPCR, we demonstrate the importance of variety selection, as we observe markedly 24
different induction patterns of important TIA precursor compounds. Additionally, both 25
phytohormone choice and concentration have significant effects on TIA biosynthesis. Finally, our 26
study suggests that several early-induction pathway steps as well as pathway-specific genes are 27
likely to be transcriptionally regulated. Our findings highlight the need for a complete set of ’omics 28
resources in commonly used C. roseus varieties and the need for caution when extrapolating results 29
from one cultivar to another. 30
Page 48
INTRODUCTION 31
Many plant-derived secondary metabolites have chemical properties that give them therapeutic 32
value for the treatment of cancers, hypertension, and other illnesses (Balunas and Kinghorn, 33
2005). In the medicinal plant Catharanthus roseus (L.) G. Don, the terpene indole alkaloid (TIA) 34
family of natural products include many valuable medicinal compounds such as the clinically 35
used antineoplastic agents vinblastine and vincristine, as well as the antihypertensive agent 36
ajmalicine (Figure 1). Vinblastine and vincristine, used in the treatment of lymphoblastic 37
leukemia (Noble et al., 1958; Johnson et al., 1963), are naturally produced at low levels in the 38
leaves of the plant, which makes the chemical extraction of the two alkaloids difficult and time 39
consuming (Tyler, 1988). Pharmaceutical scientists generally extract the more abundant 40
precursor compounds from the leaf and perform an in vitro coupling to increase the yield of 41
vinblastine and vincristine, which is then isolated (Potier, 1980; Ishikawa et al., 2008); this 42
process, however, can be cost prohibitive. The plant signaling hormone methyl jasmonate 43
(MeJA) is typically used to induce higher levels of the alkaloid products in the laboratory 44
through gaseous or hydroponic application after being dissolved in DMSO (Aerts et al., 1994; 45
Rijhwani and Shanks, 1998), but more recent studies have found that ethylene also induces 46
alkaloid production (El-Sayed and Verpoorte, 2004; Pan et al., 2010). While MeJA is too 47
expensive for practical use in a large-scale agricultural production, ethephon (a commercially 48
available ethylene derivative) is a viable and cost-effective option for increasing alkaloid yields 49
prior to chemical extraction. 50
Over the last 50 years, laboratory studies of vinca alkaloid production has been induced in planta 51
with MeJA via root-uptake from growth medium or through exposure to vapor in an enclosed 52
system (Aerts et al., 1994; Rijhwani and Shanks, 1998; El-Sayed and Verpoorte, 2004). Ethylene 53
Page 49
and its derivative ethephon (EPTN) have more recently been identified as an induction agent for 54
the TIA pathways (Pan et al., 2010; Wang et al., 2016). Foliar application of ETPN, a compound 55
that is quickly converted to ethylene upon uptake into the cell, does not require any special 56
equipment and is a method that can be straightforwardly transferred from a laboratory setting into 57
a greenhouse setting for agricultural-scale production of these desirable compounds. If large scale 58
biopharmaceutical production is the ultimate goal, foliar ETPN treatment is ideal since it is 59
inexpensive and does not need to be reapplied to obtain the desired result. 60
Hairy root culture is a commonly studied system with strong potential for C. roseus for alkaloid 61
production and extraction; however, it is a technically challenging system (Williams and Doran, 62
2000). In particular, this and similar culture systems require special equipment and impeccable 63
sterile technique to prevent contamination. Additionally, not all precursor alkaloids of interest in 64
the TIA pathway can be found in the roots at levels that would make extraction viable (e.g. 65
vindoline) in the absence of further genetic engineering developments in this system (O'Keefe et 66
al., 1997; St-Pierre et al., 1999; Laflamme et al., 2001; Besseau et al., 2013), and those that are 67
present are regulated differently than in seedlings (Pan et al., 2016). Alternatively, C. roseus seeds 68
are easy to germinate and are relatively fast-growing in soil. Gently uprooting seedlings from the 69
soil and thoroughly washing in deionized water allows collection of all parts of the plant in a 70
relatively short amount of time and with minimal concern regarding contamination. These 71
considerations make plants a good system not only for biological studies but also provides 72
potential for greenhouse-level scale-up of alkaloid precursor production. 73
Many different cultivars of C. roseus have been developed for ornamental uses and, of these, 74
some have also been evaluated for their utility in alkaloid production. Among these genetically 75
diverse varieties, however, only a few have been selected for genomic and transcriptomic resource 76
Page 50
development (Góngora-Castillo et al., 2012; Verma et al., 2014; Kellner et al., 2015; Pan et al., 77
2018). “Little Bright Eye” (LBE) is a variety that has been commonly used for plant pathology 78
research and was used in the initial efforts to identify the TIA biosynthetic genes. More recently, 79
other varieties have been investigated in transcriptional and metabolomic studies (Góngora-80
Castillo et al., 2012; Verma et al., 2014; Kellner et al., 2015; Pan et al., 2018). “SunStorm Apricot” 81
(SSA) was developed for horticultural use and recently was selected for genome sequencing 82
(Kellner et al., 2015); it remains the only sequenced C. roseus variety to date. Given that no single 83
C. roseus variety currently has a complete set of genomic, transcriptomic, and metabolomic data 84
available (Table S1), we wanted to investigate how alkaloid production and response to stimuli 85
differ between the two varieties associated with the most widely used ’omics resources (LBE and 86
SSA). With this in mind, we designed a study of the alkaloid induction patterns of ethylene and 87
MeJA in these two varieties of C. roseus (LBE vs. SSA). Some precursor alkaloids are restricted 88
to certain tissues (O'Keefe et al., 1997; St-Pierre et al., 1999); thus, we chose to perform all assays 89
in both roots and shoots rather than in whole seedlings, which has not been addressed in previous 90
C. roseus work. Additionally, testing hormonal induction in LBE has allowed us to compare 91
observations with previous studies, while including SSA provides an opportunity for future 92
genomic investigation into the regulation of important induction pathways. 93
In this work, the in planta effects of foliar MeJA or ETPN treatments on the metabolomic 94
profiles in roots and shoots on alkaloid levels was investigated in both varieties. The natural 95
differences in alkaloid levels between these varieties in roots and shoots were also investigated. 96
Finally, this work examines the transcriptional effect of these phytohormones on the expression of 97
genes involved in the terpene indole alkaloid biosynthetic pathway, and examines the relationship 98
between transcriptional and metabolic profiles. We show that not only do varietal differences play 99
Page 51
a major role in alkaloid response to hormonal stimuli, but also that genetic variation between SSA 100
and LBE is substantial enough to affect wildtype levels of alkaloids in both roots and shoots. 101
MATERIALS & METHODS 102
Plant Material and Growth. Two Catharanthus roseus varieties were selected for these 103
experiments: “SunStorm Apricot” (obtained from www.expressseed.com) and “Little Bright 104
Eyes” (obtained from www.neseeds.com). 10-12 seeds of a single variety were planted in 4-inch 105
plastic pots filled to 1 cm below the top with MetroMix potting mix (35%-45% Sphagnum moss, 106
bark, pumice, dolomite limestone). Pots were arranged on labeled trays, which were covered with 107
plastic domes to increase humidity until seedlings emerged through the soil. The plants were grown 108
in an environmentally controlled growth room under a 12-hour light/12-hour dark photo-cycle with 109
a 22°C ambient temperature. 110
Extraction Protocol Validation. Prior to beginning the bulk of this study, we validated our 111
extraction techniques to ensure that technical and biotic influences were minimized using SSA. To 112
test our technical reproducibility, we pulverized up 10-20 shoots in liquid nitrogen and then, after 113
thorough mixing of the resulting powder, the powder was divided into three approximately equal 114
portions of plant material. The replicate plant material was extracted and analyzed via LCMS (in 115
technical duplicate) as described in the section “LCMS quantitation of C. roseus alkaloid”. The 116
vindoline concentration was determined to be 12.2 + 2.7 µg/mg wet weight. To test for biological 117
variability, 20 plants were grown under identical conditions and randomly allocated to three 118
samples. The samples were pulverized in liquid nitrogen, extracted with methanol and analyzed 119
by LCMS (in technical duplicate) as described in the section “LCMS quantitation of C. roseus 120
alkaloid”. In these samples the vindoline concentration was determined to be 10.9 + 3.0 µg/mg 121
wet weight. This demonstrated that our extraction protocol was reproducible and accurate. 122
Page 52
Phytohormone Treatments and Sample Collection. The “SunStorm Apricot” variety of C. 123
roseus seedlings were germinated in soil and grown to 8 days post-germination (Aerts et al., 1994; 124
El-Sayed and Verpoorte, 2004), at which time they were sprayed with 5 mL of DI water or 100 125
µM or 1 mM ethephon (dissolved in DI water). After treatment, plants were sealed inside 2-gallon 126
zip-top bags and returned to the growth chamber for 24 hours. On the next day, the plants were 127
carefully uprooted, washed with DI water, separated at the hypocotyl into roots and shoots with a 128
surgical blade, and flash-frozen in liquid nitrogen. Samples were stored at -80 °C until they could 129
be processed, a minimum of 24 hours. 130
These concentrations of ethephon were chosen as they are the manufacturer (Monterey Lawn & 131
Garden) recommended concentration for agricultural applications (1 mM) or identical to 132
concentration of MeJa applied (100 µM). Ethephon was mixed in DI water alone for the treatments, 133
while the control treatment consisted of DI water. The plants were then handled as described 134
above. Each sample from both of these experiments consisted of all the plants from a single pot; 135
there were 12 pots for each variety. At the 1 mM concentration, the plants began showing signs of 136
senescence, becoming yellow and wilted. 137
Using the data obtained from the optimization trials, we designed our larger experiment as shown 138
in Figure 2. For this experiment, both SSA and LBE seedlings were grown to 8 days after 139
germination. 6 pots of each variety were selected at random from the trays, sprayed with a 140
combined volume of 5 mL of DI water (ethephon control), DI water + 0.02% DMSO (methyl 141
jasmonate control), 100 µM ethephon, 1 mM ethephon, or 100 µM methyl jasmonate + 0.02% 142
DMSO. After treatment, the plants were handled as described above. We processed 6 replicates 143
for each treatment. Each sample contained all of the plants from a single pot (~8 plants). 144
Page 53
Alkaloid Extraction. Shoots were ground in liquid nitrogen with a mortar and pestle; roots were 145
macerated by hand with a metal spatula directly in the methanol solution to prevent sample loss 146
during the grind and transfer process due to the small amount of tissue. Shoot extractions were 147
performed using 1 mL methanol containing 10 µM ajmaline (internal standard) per 100 mg tissue. 148
Root extractions were performed using 1 mL of methanol containing 1 µM ajmaline (internal 149
standard) per 10 mg tissue. The extracts were then allowed to stand at room temperature (~22 C) 150
for 20 minutes and then the cellular debris was pelleted by centrifugation (3,220 x g, 22 C, 20 151
min). The cleared extracts were then filtered through a 0.22 µm nylon syringe filter to remove 152
remaining particulate. The shoot alkaloid extracts were diluted 1:10 in methanol and 20 µl was 153
transferred to HPLC vials containing glass sample inserts. The root extracts were used undiluted. 154
The filled HPLC vials were stored at -80°C until they could be analyzed via LC-MS (described 155
below). Unfortunately, some samples were lost during processing. In the end, the final replications 156
for each treatment were as follows: LBE E0-S = 6; LBE E0-R = 5; LBE E1 = 6 and 6; LBE E4 = 157
6 and 6; LBE M0 = 6 and 6; LBE M1 = 6 and 6; SSA E0-S = 6; SSA E0-R = 3; SSA E1-S = 6; 158
SSA E1-R = 5; SSA E4 = 6 and 6; SSA M0-S = 6; SSA M0-R = 5; SSA M1 = 6 and 6. 159
LCMS quantitation of C. roseus alkaloids. LCMS analysis was achieved using a Shimadzu 160
Prominence HPLC (consisting of a degasser, two LC-10AD HPLC pumps, an autosampler, and 161
system controller) upstream of a 3200 QTrap mass spectrometer (AbSciex). Separation was 162
achieved using Luna C18 (2) column (150 x 2.00 mm, 3 µm) at a flow rate of 0.2 ml/ min and the 163
following gradient, where line A was water with 0.1% (v/v) formic acid and line B was acetonitrile 164
with 0.1% (v/v) formic acid. The column was pre-equilibrated with 85% A/15% B. Upon injection 165
(2 L of prepared HPLC sample) the mobile phase composition was maintained for 1 minute 166
followed by changing the mobile phase to 60% A/40% B over 14 minutes using a linear gradient. 167
Page 54
The mobile phase was then changed to 0% A/100% B over the next 1 minute and held at this ratio 168
for 8 minutes. The mobile phase was changed to 85% A/15% B over 1 minute and the column was 169
equilibrated at 85% A/15% B for 7 minutes prior to the next injection. The mass spectrometer 170
settings were as follows: MS (EMS positive mode, 50-1500 m/z), Curtain gas, 40.0; Collision gas, 171
Medium; IonSpray voltage, 4500.0; Temperature, 400.0; Ion Source Gas 1, 35.0; Ion Source Gas 172
2, 35.0; Interface heater, ON; Declustering potential, 45.0; Entrance potential, 4.0; Collision 173
energy, 5.0, number of scans to sum, 2; scan rate, 4000 Da/sec. MS/MS (MRM mode) For 174
catharanthine (Q1, 337.3; Q3, 144.2; time 40 msec, CE (volts) 20.0); for tabersonine (Q1, 337.3; 175
Q3, 305.3; time 40 msec, CE (volts) 20.0); for vinblastine (Q1, 406.2; Q3, 271.9; time 40 msec, 176
CE (volts) 30.0); for vincristine (Q1, 413.2; Q3, 353.4; time 40 msec, CE (volts) 30.0). Curtain 177
gas, 40.0; Collision gas, Medium; IonSpray voltage, 4500.0; Temperature, 400.0; Ion Source Gas 178
1, 35.0; Ion Source Gas 2, 35.0; Interface heater, ON; Declustering potential, 45.0; Entrance 179
potential, 10.0; Collision cell exit potential, 3.0. Data was acquired using the Analyst software 180
package (AbSciex). LCMS grade H2O, acetonitrile, methanol and were purchased from 181
MilliporeSigma. LCMS grade formic acid was purchased from Fisher Chemicals. All other 182
chemicals were purchased from Sigma-Aldrich and used without further purification unless 183
otherwise specified. 184
Standard curves were generated by analyzing commercial standards at known concentrations 185
using the identical LCMS settings. Vindoline, vinblastine sulfate, vincristine sulfate, and 186
catharanthine were obtained from Cayman Chemicals. Ajmaline and tetrahydroalstonine were 187
obtained from Extrasynthese, while ajmalicine was obtained from Millipore-Sigma. Lochnericine 188
and 16-hydroxytabersonine (aka 11-hydroxytabersonine) were obtained from MuseChem. 189
Page 55
RNA Extraction and qRT-PCR. Stored tissues were ground with mortars and pestles that had 190
been treated with RNase Zap to prevent sample degradation. The ground tissues were divided into 191
two 2 mL microfuge tubes, which were used immediately to extract total RNA using the RNeasy 192
Mini Kit (Qiagen) in conjunction with their RNase-Free DNase Set (Qiagen) as directed. The total 193
RNA for each sample was quantified on a Nanodrop (Thermo Scientific) and integrity was 194
confirmed on a Bioanalyzer 2100 (Agilent) in the Center for Genome Research and Biocomputing 195
Core Facilities at Oregon State University. Only samples with RINs ≥ 8.0 were used for two-step 196
qRT-PCR. Each biological replicate was used for two technical replicates, bringing the total to 197
four replicates for each sample. 300 ng of input RNA from each sample was reverse transcribed 198
using the SuperScript RT kit (Invitrogen). qPCR and melt curve analyses were performed using 199
the SYBR PCR kit (Qiagen) on a BioRad C1000 Touch thermocycler with a BioRad CFX96 200
detection system (BioRad). Transcript data was extracted using CFX Manager software (BioRad). 201
Primers not sourced from literature were designed using PrimerQuest tool (Integrated DNA 202
Technologies); all primers were ordered from Sigma-Aldrich with standard desalting. 203
Data Analyses. Relative intensities for each were determined from LCMS data by calculating the 204
area under the peak (AUC) using Peakview version 2.2 (AbSciex) and then dividing that value by 205
the AUC of our internal standard, ajmaline. Absolute concentrations were calculated from the 206
AUC and a standard curve for each alkaloid; each quantity was then normalized using the original 207
wet weight of the sample. We performed Welch’s t-tests to determine the significance of 208
differences in alkaloid concentrations between varieties and two-way ANOVA followed by Tukey 209
pairwise comparison post-hoc analyses to determine the significance of treatments. For qPCR data 210
analysis, LinRegPCR (Ruijter et al., 2009) was used to determine primer efficiencies. Absolute 211
copy numbers of transcripts were determined (�̅�0𝑠= ∆𝑇 ∗ �̂�𝑠
[�̅�𝑎∗log�̂�𝑠(�̅�𝑎)−�̅�𝑞𝑠]
) and then 212
Page 56
normalized to the absolute copy number of 40S ribosomal protein S9 (RPS9), our control gene, 213
from the same sample. The resulting data was analyzed using ANOVA and Welch’s t-tests. All 214
statistical analyses were performed in R (version 3.4.3). Values are considered significant below 215
p = 0.1. 216
RESULTS 217
The terpene indole alkaloid biosynthetic pathway of Catharanthus roseus (TIA, Figure 1) is central 218
to the production of its medically relevant natural products. We have designed a large study to 219
examine the transcriptional regulation of vinca alkaloid production in the roots and shoots of 220
seedlings from two varieties that are of interest to medicinal chemistry and genomics researchers 221
(Figure 2). Here, we present our findings. 222
Alkaloid levels substantially differ between varieties. A comparison of the spectrometric results 223
of the untreated control plants highlights notable differences between the plant varieties 224
themselves. As these control plants were only sprayed with deionized water and the pots were 225
arranged randomly to avoid positional effects, changes observed are attributable to variety. 226
Unfortunately, vinblastine and vincristine were not detectable above background in our LCMS 227
analyses and thus are not discussed here. Additionally, we were unable to separate ajmalicine and 228
tetrahydroalstonine despite multiple attempts, as they have identical masses, fragmentation 229
patterns, and retention times. Therefore, we report these two compounds here as a single value 230
relative to the internal standard. 231
In shoots, untreated SSA plants have markedly higher levels of tabersonine (Welch’s t-test, p ≤ 232
0.01), while LBE has a higher concentration of vindoline (Figure 3A). The mean vindoline 233
concentration is greater in LBE than in SSA, but the difference is not significant due to LBE having 234
much more intra-varietal variation (Welch’s t-test, p = 0.1033). In roots, untreated LBE has higher 235
Page 57
concentrations of catharanthine and tabersonine, but not statistically significant (Welch’s t-test, p 236
= 0.13 and 0.2, respectively). (Figure 3B). An alkaloid with a mass to charge ratio of 353 is present 237
at high levels in the roots of untreated LBE and at lower levels in the roots of untreated SSA 238
(Figure 3C). Overall, we observe that important differences arise in alkaloid concentration between 239
varieties and between the tissues of these varieties, even without the application of an induction 240
agent. 241
Induction of alkaloid levels differs markedly based on which phytohormone is used. In both 242
shoots and roots, both methyl jasmonate (MeJA) and ethephon (ETPN) either caused an increase 243
in alkaloid level or had no effect; there was no evidence of a significant decrease in any of the 244
alkaloids examined. 245
For catharanthine and the combined ajmalicine/tetrahydroalstonine peak, treatment with MeJA 246
increased the concentration in the shoots of both varieties but not significantly (Figure 4, S1). 247
Application of MeJA significantly increased the concentration of tabersonine in SSA, but not in 248
LBE (Figure 4; Welch’s t-test, p ≤ 0.01). For vindoline, there was a small increase in LBE, which 249
was not significant, and no increase in SSA. 250
Treatment of LBE with ETPN increased the concentration of catharanthine, tabersonine, and 251
vindoline at both concentrations (Figure 4A, C, E). For the ajmalicine/tetrahydroalstonine peak, a 252
small increase in the mean was observed that was not statistically significant. In SSA shoots, ETPN 253
only significantly increases the levels of tabersonine at both treatment concentrations (Figure 4C). 254
None of the other alkaloids examined showed increases in concentration. 255
In the roots of LBE, MeJA treatment only increased the concentration of tabersonine (Figure 4, 256
and S1). For SSA, MeJA treatment significantly increased the concentration of tabersonine (Figure 257
Page 58
4); the mean amount of ajmalicine/tetrahydroalstonine increased, though the increase was not 258
significant (Figure S1). The mean concentration of catharanthine was not significantly changed by 259
MeJA in the roots of either variety. 260
Treatment of LBE with ethephon did not significantly alter the concentrations of any of the 261
alkaloids examined in this study in the roots. In the case of SSA, treatment with 1 mM ethephon 262
significantly increased concentrations of catharanthine, ajmalicine/tetrahydroalstonine, and an 263
unidentified alkaloid at m/z = 353 in the roots (vida infra; Figure 4 and S1). Treatment of SSA 264
with ethephon increases tabersonine four-fold in roots, but cannot be considered statistically 265
significant (Figure 4D). 266
Overall, ethephon significantly increased the levels of a catharanthine, tabersonine, and 267
vindoline in LBE shoots while MeJA did not significantly increase the amount of any alkaloid 268
examined. In the SSA shoot samples only tab was significantly increased in both the ETPN and 269
MeJA treatments. All of the alkaloids mentioned in this study are precursors in the TIA pathway. 270
Additionally, the interaction between treatment and variety was significant for some of the 271
alkaloids. In shoots, catharanthine and vindoline were increased significantly by the interaction of 272
ETPN and variety while the interaction of MeJA and variety significantly affected tabersonine. In 273
the roots, however, none of the alkaloids had significant interaction effects. This latter result may 274
be due to the foliar application of the phytohormones. 275
Master regulators are upregulated by hormonal induction. In the shoots of both varieties, the 276
higher concentration of ETPN induces an increase in the number of ORCA2 transcripts (Fig 5A; 277
ANOVA, p ≤ 0.001). ORCA2 transcripts in roots, however, respond oppositely in the two 278
varieties: increasing with ETPN treatment in SSA while decreasing in LBE and decreasing with 279
Page 59
MeJA treatment in SSA increasing in LBE (Fig 5B; ANOVA, p ≤ 0.001). In untreated plants, 280
ORCA3 transcripts are present at significantly higher levels in the shoots of SSA than in the 281
same tissue in LBE (Fig 5C; Welch’s t-test, p ≤ 0.001). These levels in SSA, however, do not 282
respond to treatment with ETPN—unlike in LBE, where they are significantly decreased 283
(ANOVA, p ≤ 0.01). In roots, treatment with MeJA increases transcripts in both varieties; 284
however, we see opposing effects depending on variety in shoots (Fig 5D). The changes in 285
ORCA3 in SSA do mirror the changes seen in catharanthine and ajmalicine in roots, though this 286
is not true of ORCA3 in LBE. Treatment with phytohormones does have an effect on the 287
expression of these master regulators, though both the basal level of expression and the induction 288
effect appears to vary between the two varieties. 289
Evidence supports transcriptional regulation of key pathway steps. We found two key 290
primary metabolic enzymes in upstream pathways change upon phytohormone treatment. In the 291
mevalonate (MVA) pathway, the DXS2 transcript level increased in the roots of our young 292
plants treated with MeJA (Figure S2C); in the mevalonate-independent pathway (MEP) 293
meanwhile, HMGS transcript abundance decreased in the shoots of the MeJA-treated plants (Fig 294
S2A). 295
In shoots, the catharanthine synthase (CS) transcript levels increase in all groups except for 296
ETPN treated SSA, which is consistent with the trends we observed in catharanthine production 297
(Fig 6A; ANOVA, p ≤ 0.001). While catharanthine appears to be transcriptionally regulated in 298
LBE roots by both ETPN and MeJA, CS levels in SSA roots are only increased by ETPN (Fig 299
6B: ANOVA, p ≤ 0.001). In the shoots of both varieties, tabersonine concentrations do not 300
appear to be transcriptionally regulated, as tabersonine synthase (TS) transcript levels increase 301
after treatment with ETPN and decrease after treatment with MeJA, which is not at all consistent 302
Page 60
with the trends in alkaloid concentration (Fig 6C). In roots, on the other hand, tabersonine does 303
appear to be transcriptionally regulated in both varieties, as a significant induction of TS 304
transcripts after treatment with ETPN is observed which are correlated with observed changes in 305
the tabersonine concentrations (Fig 6D). 306
Interestingly, although vindoline concentrations increase significantly in LBE shoots upon 307
treatment with ETPN, there is no associated increase in deacetylvindoline O-acetyltransferase 308
(DAT) mRNA levels; in fact, we observe a significant decrease in both varieties (Fig 6E; 309
ANOVA, p ≤ 0.01). Shoots treated with MeJA, however, do have similar increases in DAT 310
mRNA and vindoline (Welch’s t-test, p ≤ 0.1). 311
In roots and shoots of both of the varieties, ETPN treatment caused a statistically significant 312
increase in the transcription of PRX1 (Fig 6F, S3; ANOVA, p ≤ 0.001). Meanwhile, MeJA 313
decreased transcription levels in all tissues of SSA and, significantly, in the roots of LBE (Fig 314
6F, S3; Welch’s t-test, p ≤ 0.01). The change in ajmalicine/tetrahydroalstonine is consistent with 315
the patterns that we observed in SSA roots and the increase that we saw in SGD transcripts is 316
seen in all SSA tissues (Figure S3; ANOVA, p ≤ 0.001). 317
DISCUSSION 318
Previous studies have investigated the genomics or metabolomics of different C. roseus 319
varieties (Magnotta et al., 2006; Kim et al., 2007; Chung et al., 2011). While many of the examined 320
varieties in these works are used mainly for ornamental purposes, several are used medicinally. 321
None of the studies, however, include both LBE and SSA—which would allow for the utilization 322
of available genomic and transcriptomic resources to inform future bioengineering efforts (Table 323
1). We selected these two varieties for this reason. 324
Page 61
Questions generated by our study. One of the compounds that exhibited a clear concentration 325
difference between LBE and SSA was the uncharacterized alkaloid (compound 6). Due to this 326
alkaloid’s mass-to-charge ratio (m/z=353) and its retention time with respect to the other identified 327
peaks, we suspect that this compound is a hydroxylated tabersonine. We endeavored to confirm 328
our hypothesis about our uncharacterized alkaloid’s identity using commercially available 329
standards for alkaloids with the appropriate molecular weight (including 11-hydroxytabersonine, 330
yohimbine, and lochnericine); however, none of the commercially available standards exhibited 331
the same retention time as this peak. We therefore posit that this compound is 19-332
hydroxytabersonine, which is only present in C. roseus roots (Shanks et al., 1998) and for which 333
we were unable to identify a commercial supplier or create our own standard. If this is, in fact, 19-334
hydroxytabersonine, a significant increase is interesting, though not necessarily a desirable, result 335
as it channels tabersonine to hörhammericine, echitovenine, or minovincine—none of which are 336
clinically used (Shanks et al., 1998). 337
Similarly to observations in previous studies (Aerts et al., 1994; El-Sayed and Verpoorte, 2004; 338
Jaleel et al., 2009; Pan et al., 2010; Wang et al., 2016; Zhang et al., 2018), treatment of both LBE 339
and SSA seedlings with either methyl jasmonate or ethephon induced the production of various 340
precursor alkaloids. These hormones also affected the expression levels of several key 341
biosynthetic enzymes and transcription factors. Previous studies concluded that ethylene induces 342
the MVA pathway while jasmonate induces the MEP in older seedlings (Pan et al., 2018; Zhang 343
et al., 2018). It is interesting to note that our results for key enzymes from these pathways (DXS2 344
in MVA and HMGS in MEP) in roots and shoots treated through foliar application of the 345
phytohormones show different induction patterns than were observed in (Pan et al., 2018; Zhang 346
et al., 2018), where treatments were applied to entire seedlings via hydroponic supplementation. 347
Page 62
A different physiological outcome in roots and shoots may be expected given that the immediate 348
uptake happens through a different tissue; in some aspects, however, our results are not directly 349
comparable, as outcome specific to the individual plant parts was not investigated in these past 350
studies. Regardless, both DXS2 and HMGS are key enzymes in the formation of the indole 351
component of terpene indole alkaloids, so a change in transcript abundance due to phytohormone 352
treatment could have downstream effects on concentration of each alkaloid. 353
Examining varietal differences in the roles of master regulators. The ORCA family of 354
transcription factors have been documented as central regulators of early stage TIA intermediate 355
production in C. roseus (Liu et al., 2011; Pan et al., 2012; Li et al., 2013). Previous studies in 356
hairy root culture have shown that the overexpression of ORCA2 significantly increases 357
concentrations of catharanthine and vindoline levels while decreasing tabersonine levels (Liu et 358
al., 2011; Li et al., 2013), but our results do not appear to have the same correlations. These 359
results underscore the need for broader investigation in different varieties and the care that must 360
be taken when extrapolating results from one variety of C. roseus to inform results or pathway 361
engineering of another variety. As ORCA3 positively regulates two key genes in the TIA 362
pathway (Pan et al., 2012), the significant difference between its expression in SSA and LBE 363
makes its promoter an interesting target for further investigation and future bioengineering 364
efforts. Our study also supports ORCA2 as a candidate for engineering, as its transcript levels 365
increased upon treatment. As with any master regulator, however, there is the possibility of the 366
generation of off-target effects such as activation of potential repressors, so a careful 367
investigation into genes controlled by these two TFs would be necessary. 368
Linking transcriptional changes to metabolite production. Additionally, we selected seven 369
biosynthetic genes that encode key enzymes directly related to the biosynthesis of terpene indole 370
Page 63
alkaloids. Of these genes, five perform important reactions in the path toward vinblastine; the 371
remaining two genes are involved in reactions that branch off from the vinblastine biosynthesis 372
pathway but catalyze the formation of other medicinally relevant alkaloids (e.g. reserpine, etc.). 373
Given the evidence from past studies that there are important pathway differences between roots 374
and shoots, we felt that it was necessary to investigate the expression of these genes in these 375
separate plant organs, as this information will be useful for engineering alkaloid production in 376
biopharmaceutical settings. The observed results are intriguing. 377
Catharanthine synthase (CS) and tabersonine synthase (TS) produce catharanthine and 378
tabersonine, respectively, and were recently determined to be two of the four missing enzymes in 379
the TIA pathway (Caputi et al., 2018; Qu et al., 2018). We were particularly interested in 380
discovering how the various phytohormone treatments affected their transcription, since 381
relatively little research has been published on these genes since their discovery in the last two 382
years. In shoots, the changes in the concentration of catharanthine are consistent with the 383
observed changes in CS transcript number, suggesting that this particular step in the TIA 384
pathway is transcriptionally regulated; this does not, however, appear to be the case in roots. 385
Tabersonine production, meanwhile, does not appear to be transcriptionally regulated, as 386
observed changes in TS transcript levels do not correspond with the changes in the alkaloid 387
concentrations. One explanation for this behavior could be that an enzyme directly upstream acts 388
as a bottleneck in the pathway, while the amount of TS present remains consistent because it is 389
expressed at a level that is sufficient to handle an increased amount of substrate. Alternatively, 390
post-transcriptional or translational changes caused by the hormone treatments could be 391
responsible for the observed increases in tabersonine concentration. 392
Page 64
The changes in vindoline and the associated biosynthetic enzyme DAT are puzzling. SSA 393
shoots treated with MeJA have similar increases in DAT mRNA and vindoline (Welch’s t-test, p 394
≤ 0.1), which is consistent with the changes in vindoline concentration observed in previous 395
studies of C. roseus plants over-expressing DAT (Wang et al., 2012). In SSA, shoots treated with 396
ethephon, however, the concentration of the alkaloid increased dramatically upon induction even 397
though the number of DAT transcripts decrease. Perhaps the ethephon caused a post-translational 398
modification that increased the efficiency of the enzyme (Chen and Bleecker, 1995). Further 399
investigation into this response is needed. Although α-3’,4’-anhydrovinblastine and vinblastine 400
levels were below the detection limit of our mass spectrometer, they are still key alkaloids, 401
which is why we chose to examine PRX1. Previous work in cell culture demonstrated a 402
correlation between the over-expression of PRX1, an increase in the number of SGD transcripts, 403
and an increase in ajmalicine accumulation (Jaggi et al., 2011). The results observed for these 404
genes and for the ajmalicine/tetrahydroalstonine peak in SSA are consistent with these patterns. 405
Re-examination of the alkaloid extracts with a higher-sensitivity mass spectrometer would allow 406
us to examine the changes in α-3’,4’-anhydrovinblastine, vinblastine, and vincristine 407
concentrations caused by the hormone treatments and how they relate to the increases observed 408
in PRX1. 409
Overall, production of many key TIAs appear to be transcriptionally regulated in at least one 410
tissue. ETPN and MeJA induce approximately equal numbers of the biosynthetic genes that code 411
for key enzymes in the TIA pathway. They also induce genes upstream of the TIA pathway, 412
which may be useful information for future bioengineering attempts. When taken in conjunction 413
with the changes observed in alkaloid concentrations and with consideration of the cost of large-414
Page 65
scale application, ETPN appears to be a viable option with considerable potential for alkaloid 415
production in a biopharmaceutical setting. 416
CONCLUSIONS 417
In summary, our work demonstrates that choice of C. roseus variety, phytohormone type, and 418
treatment concentration all have an impact on the levels of key alkaloids in each plant organ. Either 419
a genomic or transcriptomic resource is available for the two varieties investigated here, but neither 420
variety has both. The differing baseline metabolic profile as well as the differing responses to 421
phytohormone treatment emphasize the importance of choosing an appropriate variety for one’s 422
desired outcomes. Additionally, optimization of treatments is crucial; timing of phytohormone 423
application and harvest, as well as the concentration applied, can have significant effects on both 424
the health of the plants and the induced changes in alkaloid concentrations. Finally, this study 425
suggests that ethephon is a viable and agriculturally relevant induction agent for key alkaloids in 426
a large-scale biopharmaceutical production setting. 427
428
ACKNOWLEDGEMENTS 429
This work was supported by the Medical Research Foundation of Oregon Award #2018-1954 to 430
MM and Research Startup Funds from the College of Pharmacy to BP. We also wish to thank the 431
Oregon State University Mass Spectrometry Facility (OSUMSC) for assistance. 432
433
CONFLICT OF INTEREST 434
The authors declare no conflict of interest associated with the work described in this manuscript. 435
436
AUTHOR CONTRIBUTIONS 437
Page 66
BP and MM conceived the project and secured funding for the work. VF, BP, and MM designed 438
the experiments. VF and BP conducted the experiments and analyzed the data. VF, BP, and MM 439
wrote the manuscript. All authors have given approval to the final version of the manuscript. 440
441
SUPPORTING INFORMATION 442
Supplementary_Information.pdf contains supplementary figures (S1-S3) and tables (S1-S9) 443
referenced in the manuscript. 444
445
FIGURE LEGENDS 446
Figure 1 Pathway diagram from MVA and MEP to TIA. Three arrows symbolize multiple 447
enzymatic steps and intermediates. Abbreviations in blue are the genes selected for RT-qPCR. 448
Orange ovals represent the TFs selected for RT-qPCR. Compounds marked with a hexagon were 449
quantified on LCMS. An asterisk over the hexagon denotes our hypothesis for the identity of the 450
uncharacterized compound. 451
452
Figure 2 Experimental design of this study. Seeds of two Catharanthus roseus varieties (LBE and 453
SSA) were sown and grown to 8 days post-germination. At that time, the plants were treated with 454
various concentrations of either ethephon or MeJA. The asterisk on the 1mM denotes that the 455
concentration was only used for ethephon. Seedlings were harvested 24 hours after treatment, 456
divided into roots and shoots, and flash frozen. Total alkaloid content and RNA were extracted 457
from the frozen tissues, which were then used for LCMS and RT-qPCR analyses. 458
459
Page 67
Figure 3 Alkaloid concentrations differ greatly between untreated plants of the two varieties. ** 460
denotes a p-value ≤ 0.01 (A) In shoots, SunStorm Apricot has a higher concentration of 461
catharanthine and tabersonine, while Little Bright Eye has a much greater concentration of 462
vindoline. (B) In roots, Little Bright Eye has higher concentrations of catharanthine, tabersonine, 463
and ajmalicine/tetrahydroalstonine. (C) Representative LCMS traces from the 0 µM ethephon 464
treatment group; even in the control treatment, there are obvious differences between the varieties. 465
The white flower represents LBE, and the peach flower represents SSA. Labeled peaks are as 466
follows: 1 = ajmalicine; 2 = tetrahydroalstonine; 3 = catharanthine; 4 = tabersonine; 6 = 19-467
hydroxytabersonine (putative assignment). 468
469
Figure 4 Alkaloid concentrations differ between varieties and treatment. * denotes a p-value ≤ 470
0.05; ** denotes a p-value ≤ 0.01; *** denotes a p-value ≤ 0.001; all represented statistics are from 471
Welch’s t-test post-hoc analyses. Significance markers with a white flower represent treatment 472
differences in LBE, while those with a peach flower represent treatment differences in SSA. (A) 473
Catharanthine concentrations increased in LBE shoots after treatment with both hormones, but 474
only with methyl jasmonate in SSA shoots. (B) In roots, catharanthine increased markedly in SSA 475
after treatment with ethephon. (C) In shoots, tabersonine levels increase greatly in SSA upon 476
treatment with either phytohormone, but only after treatment with ethephon in LBE. (D) 477
Tabersonine levels increase significantly in the roots of both varieties after treatment with either 478
phytohormone. (E) Vindoline concentration increases significantly in LBE shoots after treatment 479
with ethephon. (F) The amount of the unidentified alkaloid present relative to the internal standard 480
increased significantly in the roots of SSA after treatment with ethephon. 481
482
Page 68
Figure 5 Expression of key regulatory genes are transcriptionally regulated upon phytohormone 483
treatment. * denotes a p-value ≤ 0.05; ** denotes a p-value ≤ 0.01; *** denotes a p-value ≤ 0.001; 484
all represented statistics are from Welch’s t-test post-hoc analyses. Significance markers with a 485
white flower represent treatment differences in LBE, while those with a peach flower represent 486
treatment differences in SSA. (A) ORCA2 transcripts in shoots (B) ORCA2 transcripts in roots 487
(C) ORCA3 transcripts in shoots (+ zoomed in panel) (D) ORCA3 transcripts in roots. 488
489
Figure 6 Expression of some key enzymes in the TIA pathway are transcriptionally regulated upon 490
phytohormone treatment. * denotes a p-value ≤ 0.05; ** denotes a p-value ≤ 0.01; *** denotes a 491
p-value ≤ 0.001; all represented statistics are from Welch’s t-test post-hoc analyses. Significance 492
markers with a white flower represent treatment differences in LBE, while those with a peach 493
flower represent treatment differences in SSA. (A) CS shoots (B) CS roots. (C) TS shoots (D) TS 494
roots (E) DAT (F) PRX1 transcript levels in roots increase after treatment with ethephon in both 495
varieties and decrease after treatment with MeJA, but only in LBE. 496
497
REFERENCES 498
Aerts, R.J., Gisi, D., Carolis, E., De Luca, V., and Baumann, T.W. (1994). Methyl jasmonate 499
vapor increases the developmentally controlled synthesis of alkaloids in Catharanthus and 500
Cinchona seedlings. Plant J 5, 635-643. 501
Balunas, M.J., and Kinghorn, A.D. (2005). Drug discovery from medicinal plants. Life Sci 78, 502
431-441. 503
Besseau, S., Kellner, F., Lanoue, A., Thamm, A.M., Salim, V., Schneider, B., Geu-Flores, F., 504
Hofer, R., Guirimand, G., Guihur, A., Oudin, A., Glevarec, G., Foureau, E., Papon, 505
N., Clastre, M., Giglioli-Guivarc'h, N., St-Pierre, B., Werck-Reichhart, D., Burlat, V., 506 De Luca, V., O'Connor, S.E., and Courdavault, V. (2013). A pair of tabersonine 16-507
hydroxylases initiates the synthesis of vindoline in an organ-dependent manner in 508
Catharanthus roseus. Plant Physiol 163, 1792-1803. 509
Caputi, L., Franke, J., Farrow, S.C., Chung, K., Payne, R.M.E., Nguyen, T.-D., Dang, T.-510
T.T., Carqueijeiro, I.S.T., Koudounas, K., Bernonville, T.D.d., Ameyaw, B., Jones, 511 D.M., Vieira, I.J.C., Courdavault, V., and O’Connor, S.E. (2018). Missing enzymes in 512
Page 69
the biosynthesis of the anticancer drug vinblastine in Madagascar periwinkle. Science 360, 513
1235-1239. 514
Chen, Q.H.G., and Bleecker, A.B. (1995). Analysis of Ethylene Signal-Transduction Kinetics 515
Associated with Seedling-Growth Response and Chitinase Induction in Wild-Type and 516
Mutant Arabidopsis. Plant Physiol. 108, 597-607. 517
Chung, I.M., Kim, E.H., Li, M., Peebles, C.A., Jung, W.S., Song, H.K., Ahn, J.K., and San, 518 K.Y. (2011). Screening 64 cultivars Catharanthus roseus for the production of vindoline, 519
catharanthine, and serpentine. Biotechnol Prog 27, 937-943. 520
El-Sayed, M., and Verpoorte, R. (2004). Growth, metabolic profiling and enzymes activities of 521
Catharanthus roseus seedlings treated with plant growth regulators. Plant Growth Regul 522
44, 53-58. 523
Góngora-Castillo, E., Childs, K.L., Fedewa, G., Hamilton, J.P., Liscombe, D.K., Magallanes-524
Lundback, M., Mandadi, K.K., Nims, E., Runguphan, W., Vaillancourt, B., 525
Varbanova-Herde, M., DellaPenna, D., McKnight, T.D., O’Connor, S., and Buell, 526 C.R. (2012). Development of transcriptomic resources for interrogating the biosynthesis 527
of monoterpene indole alkaloids in medicinal plant species. PLOS ONE 7, e52506. 528
Ishikawa, H., Colby, D.A., and Boger, D.L. (2008). Direct coupling of catharanthine and 529
vindoline to provide vinblastine: total synthesis of (+)- and ent-(-)-vinblastine. J Am Chem 530
Soc 130, 420-421. 531
Jaggi, M., Kumar, S., and Sinha, A.K. (2011). Overexpression of an apoplastic peroxidase gene 532
CrPrx in transgenic hairy root lines of Catharanthus roseus. Appl Microbiol Biotechnol 533
90, 1005-1016. 534
Jaleel, C.A., Gopi, R., Gomathinayagam, M., and Panneerselvam, R. (2009). Traditional and 535
non-traditional plant growth regulators alters phytochemical constituents in Catharanthus 536
roseus. Process Biochem 44, 205-209. 537
Johnson, I.S., Armstrong, J.G., Gorman, M., and Burnett, J.P. (1963). The vinca alkaloids: A 538
new class of oncolytic agents. Cancer Res 23, 1390-1427. 539
Kellner, F., Kim, J., Clavijo, B.J., Hamilton, J.P., Childs, K.L., Vaillancourt, B., Cepela, J., 540
Habermann, M., Steuernagel, B., Clissold, L., McLay, K., Buell, C.R., and O'Connor, 541 S.E. (2015). Genome-guided investigation of plant natural product biosynthesis. Plant J 542
82, 680-692. 543
Kim, S.W., Ban, S.H., Jeong, S.-C., Chung, H.-J., Ko, S.M., Yoo, O.J., and Liu, J.R. (2007). 544
Genetic discrimination between Catharanthus roseus cultivars by metabolic fingerprinting 545
using1H NMR spectra of aromatic compounds. Biotechnol Bioprocess Eng 12, 646. 546
Laflamme, P., St-Pierre, B., and De Luca, V. (2001). Molecular and biochemical analysis of a 547
Madagascar periwinkle root-specific minovincinine-19-hydroxy-O-acetyltransferase. 548
Plant Physiol. 125, 189-198. 549
Li, C., Leopold, A.L., Sander, G.W., Shanks, J.V., Zhao, L., and Gibson, S.I. (2013). The 550
ORCA2 transcription factor plays a key role in regulation of the terpenoid indole alkaloid 551
pathway. BMC Plant Biol 13, 155. 552
Liu, D.H., Ren, W.W., Cui, L.J., Zhang, L.D., Sun, X.F., and Tang, K.X. (2011). Enhanced 553
accumulation of catharanthine and vindoline in Catharanthus roseus hairy roots by 554
overexpression of transcriptional factor ORCA2. Afr J Biotechnol 10, 3260-3268. 555
Magnotta, M., Murata, J., Chen, J., and De Luca, V. (2006). Identification of a low vindoline 556
accumulating cultivar of Catharanthus roseus (L.) G. Don by alkaloid and enzymatic 557
profiling. Phytochemistry 67, 1758-1764. 558
Page 70
Noble, R.L., Beer, C.T., and Cutts, J.H. (1958). Role of chance observations in chemotherapy: 559
Vinca rosea*. Ann N Y Acad Sci 76, 882-894. 560
O'Keefe, B.R., Mahady, G.B., Gills, J.J., Beecher, C.W.W., and Schilling, A.B. (1997). Stable 561
vindoline production in transformed cell cultures of Catharanthus roseus. J Nat Prod 60, 562
261-264. 563
Pan, Q., Mustafa, N.R., Tang, K., Choi, Y.H., and Verpoorte, R. (2016). Monoterpenoid indole 564
alkaloids biosynthesis and its regulation in Catharanthus roseus: a literature review from 565
genes to metabolites. Phytochem Rev 15, 221-250. 566
Pan, Q., Chen, Y., Wang, Q., Yuan, F., Xing, S., Tian, Y., Zhao, J., Sun, X., and Tang, K. 567 (2010). Effect of plant growth regulators on the biosynthesis of vinblastine, vindoline and 568
catharanthine in Catharanthus roseus. Plant Growth Regul 60, 133-141. 569
Pan, Q., Wang, Q., Yuan, F., Xing, S., Zhao, J., Choi, Y.H., Verpoorte, R., Tian, Y., Wang, 570 G., and Tang, K. (2012). Overexpression of ORCA3 and G10H in Catharanthus roseus 571
plants regulated alkaloid biosynthesis and metabolism revealed by NMR-metabolomics. 572
PLOS ONE 7, e43038. 573
Pan, Y.-j., Lin, Y.-c., Yu, B.-f., Zu, Y.-g., Yu, F., and Tang, Z.-H. (2018). Transcriptomics 574
comparison reveals the diversity of ethylene and methyl-jasmonate in roles of TIA 575
metabolism in Catharanthus roseus. BMC Genomics 19, 508. 576
Potier, P. (1980). Synthesis of the antitumor dimeric indole alkaloids from Catharanthus species 577
(Vinblastine Group). J Nat Prod 43, 72-86. 578
Qu, Y., Safonova, O., and De Luca, V. (2018). Completion of the canonical pathway for 579
assembly of anticancer drugs vincristine/vinblastine in Catharanthus roseus. Plant J 97, 580
257-266. 581
Rijhwani, S.K., and Shanks, J.V. (1998). Effect of elicitor dosage and exposure time on 582
biosynthesis of indole alkaloids by Catharanthus roseus hairy root cultures. Biotechnol 583
Prog 14, 442-449. 584
Ruijter, J.M., Ramakers, C., Hoogaars, W.M., Karlen, Y., Bakker, O., van den Hoff, M.J., 585 and Moorman, A.F. (2009). Amplification efficiency: linking baseline and bias in the 586
analysis of quantitative PCR data. Nucleic Acids Res 37, e45. 587
Shanks, J.V., Bhadra, R., Morgan, J., Rijhwani, S., and Vani, S. (1998). Quantification of 588
metabolites in the indole alkaloid pathways of Catharanthus roseus: Implications for 589
metabolic engineering. Biotechnol Bioeng 58, 333-338. 590
St-Pierre, B., Vazquez-Flota, F.A., and De Luca, V. (1999). Multicellular compartmentation of 591
Catharanthus roseus alkaloid biosynthesis predicts intercellular translocation of a pathway 592
intermediate. Plant Cell 11, 887-900. 593
Tyler, V.E. (1988). Medicinal Plant Research: 1953-1987. Planta Med 54, 95-100. 594
Verma, M., Ghangal, R., Sharma, R., Sinha, A.K., and Jain, M. (2014). Transcriptome analysis 595
of Catharanthus roseus for gene discovery and expression profiling. PLOS ONE 9. 596
Wang, Q., Xing, S., Pan, Q., Yuan, F., Zhao, J., Tian, Y., Chen, Y., Wang, G., and Tang, K. 597 (2012). Development of efficient Catharanthus roseus regeneration and transformation 598
system using Agrobacterium tumefaciens and hypocotyls as explants. BMC Biotechnol 12, 599
34. 600
Wang, X., Pan, Y.-J., Chang, B.-W., Hu, Y.-B., Guo, X.-R., and Tang, Z.-H. (2016). Ethylene-601
induced vinblastine accumulation is related to activated expression of downstream TIA 602
pathway genes in Catharanthus roseus. Biomed Res Int 2016. 603
Page 71
Williams, G.R., and Doran, P.M. (2000). Hairy root culture in a liquid-dispersed bioreactor: 604
characterization of spatial heterogeneity. Biotechnol Prog 16, 391-401. 605
Zhang, X.-N., Liu, J., Liu, Y., Wang, Y., Abozeid, A., Yu, Z.-G., and Tang, Z.-H. (2018). 606
Metabolomics analysis reveals that ethylene and methyl jasmonate regulate different 607
branch pathways to promote the accumulation of terpenoid indole alkaloids in 608
Catharanthus roseus. J Nat Prod 81, 335-342. 609
610
Page 72
download fileview on ChemRxivCroseus_paper_Plant_Direct_final.pdf (608.52 KiB)
Page 73
Supplementary Figure legends:
Figure S1. The concentration of ajmalicine/tetrahydroalstonine relative to our internal standard (ajmaline) appears to increase upon hormone treatment. * denotes a p-value ≤ 0.05; ** denotes a p-value ≤ 0.01; all represented statistics are from Welch’s t-test post-hoc analyses. Significance markers with a white flower represent treatment differences in LBE, while those with a peach flower represent treatment differences in SSA.(A) Peak intensity relative to internal standard in shoots; (B) peak intensity relative to internal standard in roots.
Figure S2. Expression of genes from pathways upstream of the TIA pathway appear to be transcriptionally regulated by hormone treatment. * denotes a p-value ≤ 0.05; ** denotes a p-value ≤ 0.01; *** denotes a p-value ≤ 0.001; all represented statistics are from Welch’s t-test post-hoc analyses. Significance markers with a white flower represent treatment differences in LBE, while those with a peach flower represent treatment differences in SSA. (A) HMGS/MVA path shoots (B) HMGS/MVA path roots (C) DXS2/MEP path shoots (D) DXS2/MEP path roots
Figure S3. Expression of some key enzymes in the TIA pathway are transcriptionally regulated upon phytohormone treatment. * denotes a p-value ≤ 0.05; ** denotes a p-value ≤ 0.01; *** denotes a p-value ≤ 0.001; all represented statistics are from Welch’s t-test post-hoc analyses. Significance markers with a white flower represent treatment differences in LBE, while those with a peach flower represent treatment differences in SSA. (A) SGD expression in shoots (B) SGD expression in roots. (C) HYS expression in shoots (D) HYS expression in roots (E) THAS expression in shoots (F) THAS expression in roots.
Page 74
Ajmalicine/Tetrahydroalstonine
BAAjmalicine/Tetrahydroalstonine
*
*
**
Page 75
BAHMGS HMGS
****
***
***
**
*
***
DC DXS2 DXS2
**
Page 76
SGD
HYS
THAS
SGD
HYS
THAS
*
**
*
**
*****
**
*
*
***
**
*
***
*
**
**
***
*
A
C
E
B
D
F
Page 77
Variety Genome Transcriptome Metabolome Source
SunStorm
Apricot
Yes No Yes Kellner 2015; Chung
2011; Magnotta
2006
Little Bright Eye No Yes No Góngora-Castillo
2012
Prabal No Yes No Verma 2014
63 other
varieties
No No Yes Chung 2011
49 other
varieties
No No Yes Magnotta 2006
Table S1. The ’omics data available for selected varieties of Catharanthus roseus.
Page 78
Little Bright Eye SunStorm Apricot
(µg/g wet wt) 0 µM ETPN 100 µM ETPN 1 mM ETPN 0 µM MeJA 100 µM MeJA 0 µM ETPN 100 µM ETPN 1 mM ETPN 0 µM MeJA 100 µM MeJA
Tabersonine
Shoots 3.64 ± 3.77 18.22 ± 8.55 21.35 ± 6.77 29.73 ± 7.91 35.65 ± 18.29 30.03 ± 15.77 108.66 ± 83.40 94.38 ± 31.16 63.02 ± 25.02 133.40 ± 43.37
Roots 70.40 ± 53.35 69.93 ± 72.42 100.07 ± 46.39 105.26 ± 28.84 156.99 ± 33.52 33.59 ± 26.85 108.57 ± 98.05 147.04 ± 64.93 135.07 ± 77.26 217.91 ± 67.9
Catharanthine
Shoots 174.45 ± 189.09 601.37 ± 181.58 595.06 ± 171.18 545.68 ± 75.48 637.64 ± 165.61 224.03 ± 134.52 287.11 ± 196.48 224.77 ± 125.45 352.43 ± 121.26 429.60 ± 50.29
Roots 13.28 ± 10.93 11.57 ± 11.48 17.26 ± 18.26 30.38 ± 15.88 28.91 ± 13.69 4.30 ± 3.19 16.02 ± 16.68 22.13 ± 13.78 11.85 ± 8.96 15.33 ± 11.84
Vindoline
Shoots 25.03 ± 28.64 81.39 ± 27.24 77.51 ± 19.08 75.66 ± 10.55 81.60 ± 26.18 1.76 ± 0.99 1.68 ± 1.15 1.26 ± 0.76 2.82 ± 1.08 2.21 ± 0.53
Table S2. Mean alkaloid concentations detected (shown ± standard deviation) in each tissue under each treatment condition.
Page 79
ANOVAs All treatments:
Shoots:
Signif. codes: 0 ‘***’| 0.01 ‘**’| 0.05 ‘*’ | 0.1 ‘.’
Roots:
Signif. codes: 0 ‘***’| 0.01 ‘**’| 0.05 ‘*’ | 0.1 ‘.’
Treatment Variety Interaction
Tetrahydroalstonine 5.35e-05 *** 0.483 0.730
Ajmalicine 0.00155 ** 0.39483 0.79135
Catharanthine (MRM) 2.67e-05 *** 1.83e-06 *** 0.0128 *
Tabersonine (MRM) 0.000234 *** 1.31e-09 *** 0.032702 *
Vindoline 0.00026 *** < 2e-16 *** 0.00029 ***
Treatment Variety Interaction
Tetrahydroalstonine 0.009913 ** 0.000816 *** 0.096387 .
Ajmalicine 0.11075 0.00126 ** 0.16752 Catharanthine (MRM) 0.203 0.108 0.162
Tabersonine (MRM) 0.000198 *** 0.048320 * 0.495856
Table S3. p-values for absolute concentrations of alkaloids from ANOVA.
Page 80
Table S4. p-values for absolute concentrations of alkaloids analyses from Welch’s t-test pairwise comparisons post-hoc. * denotes a p-value ≤ 0.05; ** denotes a p-value ≤ 0.01; *** denotes a p-value ≤ 0.001; (A) p-values for pairwise comparisons between varieties; (B) p-values for pairwise comparisons of treatments for each variety.
A
B
Variety comparisons
Shoots:
Eth 0µM (control)
Eth 100µM Eth 1mM MeJA 0µM (control)
MeJA 100µM
Catharanthine 0.6133 0.01656 * 0.001983 ** 0.009982 ** 0.02625 * Tabersonine 0.008407 ** 0.0449 * 0.001858 ** 0.02097 * 0.001604 ** Vindoline 0.1033 0.000813 *** 0.0001867 *** 1.143e-05 *** 0.0006946 ***
Roots:
Eth 0µM (control)
Eth 100µM
Eth 1mM MeJA 0µM (control)
MeJA 100µM
Catharanthine 0.1388 0.6362 0.6143 0.03932 * 0.0954 . Tabersonine 0.2476 0.4871 0.1831 0.3548 0.08791 .
Treatment effects
Shoots:
Catharanthine Tabersonine Vindoline
LBE Eth (0:100) 0.002572 ** 0.006743 ** 0.00582 ** Eth (0:1000) 0.002411 ** 0.0005549 *** 0.004941 ** MeJA (0:100) 0.2558 0.4912 0.623 SSA Eth (0:100) 0.5329 0.06897 . 0.893 Eth (0:1000) 0.9923 0.002391 ** 0.3502 MeJA (0:100) 0.1951 0.008793 ** 0.2516
Roots
Catharanthine Tabersonine
LBE Eth (0:100) 0.8036 0.9903 Eth (0:1000) 0.6636 0.341 MeJA (0:100) 0.8765 0.01715 * SSA Eth (0:100) 0.2052 0.1716 Eth (0:1000) 0.0239 * 0.009398 ** MeJA (0:100) 0.5842 0.06147 .
Page 81
Treatment effects
Shoots:
Ajmalicine/ Tetrahydroalstonine
Catharanthine Tabersonine Vindoline
LBE Eth (0:100) 0.2536 0.1021 0.08171 . 0.4615 Eth (0:1000) 0.4328 0.1353 0.01179 * 0.3351 MeJA (0:100) 0.3265 0.353 0.5384 0.9569 SSA Eth (0:100) 0.2455 0.4596 0.05323 . 0.97 Eth (0:1000) 0.3365 0.7701 0.003449 ** 0.5153 MeJA (0:100) 0.08547 . 0.194 0.008402 ** 0.2849
Roots
Ajmalicine/ Tetrahydroalstonine
Catharanthine Tabersonine Uncharacterized m/z = 353
LBE Eth (0:100) 0.9717 0.8488 0.9638 0.7975 Eth (0:1000) 0.1226 0.617 0.2827 0.2184 MeJA (0:100) 0.5281 0.953 0.01491 * 0.6319 SSA Eth (0:100) 0.1265 0.2159 0.1933 0.06465 . Eth (0:1000) 0.005827 ** 0.02762 * 0.01057 * 0.001765 ** MeJA (0:100) 0.05296 . 0.5081 0.04527 * 0.9346
Variety comparisons
Shoots:
Eth 0µM (control)
Eth 100µM Eth 1mM MeJA 0µM (control)
MeJA 100µM
Ajmalicine/ Tetrahydroalstonine
0.2879 0.8004 0.318 0.8737 0.4245
Catharanthine 0.0491 * 0.0111 * 0.003289 ** 0.0105 * 0.0341 * Tabersonine 0.0252 * 0.03674 * 0.002858 ** 0.02719 * 0.001498 ** Vindoline 0.00638 ** 4.117e-5 *** 1.997e-6 *** 8.102e-8*** 2.591e-5 ***
Roots:
Eth 0µM (control)
Eth 100µM Eth 1mM MeJA 0µM (control)
MeJA 100µM
Ajmalicine/ Tetrahydroalstonine
0.2417 0.1926 0.03341 * 0.4341 0.01938 *
Unknown 353 0.169 0.8337 0.1536 0.6517 0.3356 Catharanthine 0.2881 0.6361 0.616 0.04065 * 0.1079 Tabersonine 0.1592 0.4952 0.1926 0.385 0.07137 .
Table S5. p-values for peak intensity of alkaloids relative to internal standard (ajmaline) from Welch’s t-test pairwise comparisons post-hoc. * denotes a p-value ≤ 0.05; ** denotes a p-value ≤ 0.01; *** denotes a p-value ≤ 0.001; red boxes are around the uncharacterized m/z = 353 peak. (A)
100µM
A
B
Page 82
qPCR stats (normalized)
Shoots:
Signif. codes: 0 ‘***’| 0.01 ‘**’| 0.05 ‘*’ | 0.1 ‘.’
Roots:
Signif. codes: 0 ‘***’| 0.01 ‘**’| 0.05 ‘*’ | 0.1 ‘.’
Treatment Variety Interaction
SGD 1.09e-06 *** 0.5798 0.0305 *
CS 1.32e-07 *** 3.52e-12 *** 0.00152 **
TS 1.71e-13 *** 0.00928 ** 1.73e-06 ***
HYS 5.18e-09 *** 0.0017 ** 3.84e-08 ***
THAS 0.028701 * 0.000266 *** 0.006317 **
DAT 0.00329 ** 0.18643 0.01432 *
ORCA2 2.73e-08 *** 0.0763 . 0.7814
ORCA3 0.0130 * 4.44e-11 *** 0.0378 *
PRX1 0.000301 *** 0.465309 0.014337 *
DXS2 0.122 0.623 0.518
HGMS 5.26e-05 *** 2.80e-06 *** 0.232
Treatment Variety Interaction
SGD 2.57e-06 *** 0.00299 ** 0.00122 **
CS 5.49e-08 *** 1.05e-12 *** 0.00225 **
TS 1.98e-10 *** 3.02e-07 *** 1.21e-05 ***
HYS < 2e-16 *** 0.0662 . 4.62e-16 ***
THAS 4.93e-10 *** 3.64e-15 *** 3.39e-10 ***
ORCA2 7.42e-12 *** 1.30e-05 *** 9.96e-13 ***
ORCA3 5.08e-08 *** 0.005728 ** 0.000266 ***
PRX1 1.54e-11 *** 2.86e-08 *** 0.00062 ***
DXS2 0.00164 ** 0.88019 0.26284
HGMS 1.52e-09 *** 3.79e-10 *** 0.000998 ***
Table S6. p-values for normalized RT-qPCR from ANOVA.
Page 83
Shoots (at 95% confidence):
SGD CS TS HYS THAS
LBE E0 vs E1 0.1828 0.0312 * 0.6502 0.00217 ** 0.0041 ** E0 vs E4 0.1355 0.0076 ** 0.1804 3.777e-05 *** 0.0016 ** M0 vs M1 0.0166 * 7.517e-05 *** 0.0260 * 0.00601 ** 0.1682 SSA E0 vs E1 0.0976 . 0.1282 0.2501 0.0473 * 0.3360 E0 vs E4 0.0885 . 0.1895 0.1257 0.0125 * 0.4746 M0 vs M1 0.2403 0.4377 0.3751 0.3716 0.4516
Varieties
Eth 0µM (control)
Eth 100µM Eth 1mM
MeJA 0µM (control)
MeJA 100µM
SGD 0.8267 0.1690 0.7763 0.3730 0.7357 CS 0.0772 . 0.0282 * 0.0093 ** 0.0454 * 0.3712 TS 0.5309 0.0917 . 0.4365 0.4203 0.9399 HYS 0.6547 0.0017 ** 0.0013 ** 0.1385 0.8606 THAS 0.6229 0.0120 * 0.0246 * 0.1875 0.5828 DAT 0.4679 0.0252 * 0.4589 0.2783 0.4920 ORCA2 0.7190 0.0045 ** 0.3258 0.7555 0.7308 ORCA3 0.0102 * 0.00018 *** 0.00784 ** 0.0975 . 0.1610 PRX1 0.0493 * 0.149645 0.0727 . 0.9298 0.9335 DXS2 0.4954 0.0309 * 0.3236 0.7836 0.1249 HMGS 0.01204 * 0.4017 0.8788 0.5297 0.4735
DAT ORCA2 ORCA3 PRX1 DXS2 HMGS
LBE E0 vs E1 0.2345 0.5960 7.656e-05 *** 0.2316 0.1039 0.9682 E0 vs E4 0.0221 * 0.0017 ** 2.460e-05 *** 0.7947 0.6560 0.0625 . M0 vs M1 0.0863 . 0.1268 0.0059 ** 0.0116 * 0.3203 1.380e-04 ***
SSA E0 vs E1 0.8151 0.0484 * 0.9285 0.4976 0.1209 0.0944 . E0 vs E4 0.0433 * 0.0330 * 0.9417 0.0125 * 0.3004 0.2115 M0 vs M1 0.9716 0.4330 0.4768 0.7450 0.5855 0.5112
Table S7. p-values for normalized RT-qPCR in shoots from Welch’s t-test pairwise comparisons post-hoc.
Page 84
Table S8. p-values for normalized RT-qPCR in roots from Welch’s t-test pairwise comparisons post-hoc.
Roots (at 95% confidence): Treatment
SGD CS TS THAS HYS
LBE E0 vs E1 0.0352 * 0.1404 0.0102 * 0.1318 0.00044 *** E0 vs E4 0.7443 1.0464e-04 *** 0.1158 0.0736 . 0.00128 ** M0 vs M1 0.00014 *** 0.00255 ** 0.03599 * 0.00013 *** 0.00025 *** SSA E0 vs E1 0.0482 * 0.0026 ** 0.0908 . 0.0012 ** 0.1311 E0 vs E4 0.2969 0.2932 0.1919 0.2899 0.2070 M0 vs M1 0.2366 0.8262 0.4141 0.4890 0.0294 *
Variety
Eth 0µM (control)
Eth 100µM Eth 1mM
MeJA 0µM (control)
MeJA 100µM
SGD 0.1741 0.4535 0.3710 0.3053 0.4782 CS 0.000278 *** 0.03403 * 0.0037 ** 0.00052 *** 0.0195 * TS 0.5280 0.7979 0.3571 0.0014 ** 0.2743 HYS 0.00011 *** 0.0698 . 0.4782 0.0835 . 0.1028 THAS 0.02918 * 0.00067 *** 0.0447 * 0.00156 ** 0.2910 ORCA2 0.00079 *** 0.0166 * 0.3216 0.0013 ** 0.8774 ORCA3 0.00016 *** 0.00073 *** 0.1297 0.4201 0.6366 PRX1 0.00033 *** 0.00460 ** 0.2854 0.0012 ** 0.3041 DXS2 0.334845 0.95096 0.5236 0.0344 * 0.1805 HMGS 0.000305 *** 0.0507 . 0.19485 0.000798 *** 0.9302
ORCA2 ORCA3 PRX1 DXS2 HMGS
LBE E0 vs E1 0.0361 * 0.00021 *** 0.1349 0.0893 . 0.00078 *** E0 vs E4 0.0022 ** 0.00016 *** 0.0248 * 0.2474 0.00528 ** M0 vs M1 8.820e-05 *** 0.00012 *** 0.0016 ** 0.0509 . 0.5620 SSA E0 vs E1 0.00051 *** 0.00062 *** 0.00219 ** 0.1488 0.0180 * E0 vs E4 0.0706 . 0.9302 0.1439 0.1717 0.5944 M0 vs M1 0.1769 0.1621 0.8028 0.5235 0.5005
Page 85
Gene Forward primer Reverse primerGenbank
Accession
Product
length
strictosidine β-D-
glucosidase (SGD)GGAGGATCTGCTTATCAGTGTG TGGCTGGATATCGGTTTGT AF112888.1 91nt
catharanthine synthase
(CS)CTCCTGGCGGGATGAATAAC GGAAACCAGGGTAACCAACA MF770512 139nt
tabersonine synthase
(TS)AGATGCTCCTGGTGGAAATG CAACCATGGAAATCAGCAACC MF770513 104nt
heteroyohimbine
synthase (HYS)AGCAATCAGATTTGCCAAGG GGGTTACTGTTGAGCAAGAAAG KU865325.1 120nt
class III peroxidase 1
(PRX1)TTCCATTGGGAAGAAGAGATGG TTAGGAGGGCACTTGTGTTG AM236087.1 96nt
tetrahydroalstonine
synthase (THAS)TTTAGGTGCACCAGAAATGC TTCCTTCATACTCCCAGCAG KM524258.1 97nt
6-17-O-acetylvindoline
O-acetyltransferase
(DAT)
AGAGACCTAGTCCTTCCCAAAC AAAGCAACCGCCAAACCT AF053307.1 101nt
ORCA2 CGTTTCAACTCCGTGGTTCTA ATCGGCGTCTAGGACTTACT AJ238740.1 92nt
ORCA3 CCAGCTCGGAATTGACTTCTAC GGCTACCGGGTTTCTGTATTT EU072424.1 96nt
1-deoxy-D-xylulose-5-
phosphate synthase
(DSX2)
CGAATGGGGTTTTAATGAGG GAGTGGAGAAATGGGAGGAA DQ848672.1 61nt
hydroxymethylglutaryl-
CoA synthase (HMGS)CTCAATGAGTATGACGGCAGTT AGACGACCAATTTGCTTTGG JF739871.1 72nt
RPS9 (reference gene) TCAGTTTCTACCGGAACTATGG GCTTCAACTCTGCATCCAATC AJ749993 84nt
Table S9: qPCR primers; CS and TS primer sequences were obtained from Caputi et al, 2018. DSX2 and HMGS primer sequences were obtained from Zhang et al, 2012.
Page 86
download fileview on ChemRxivcroseus_eth_meja_supp_figs.pdf (906.65 KiB)