M a y , 2 0 1 8 G A N N I D N N A A D L M P I N L I A S N T R O I A T T A I O C N U D E F N O A E T T I O U N T I A T L S N I k U k k F L a j l k " V u h ª ; l k k ' ' z k i f S { a k d o , ; k u t s k * M e t a d a t a f o r U - D I S E B a s e d K e y P e r f o r m a n c e I n d i c a t o r s o f S c h o o l E d u c a t i o n i n I n d i a
Transcript
i
May, 2018
G A
N
N
I
D
N
N
A
A
D
L
M
P
IN
L
I
A
S
N
TR
OI
A
T
T
A
IO
C
N
UD
E
F
N
O
A
E
T
T
IO
U
N
TI
A
T
L
SNI
kUkkF
La
j
l
k"
V
u
hª ;
lk
k
'
'z
k
i
fS { a
kdo,
; kutsk
*
Metadata for U-DISE Based Key Performance Indicators of School Education in India
May, 2018
G A
N
N
I
D
N
N
A
A
D
L
M
P
IN
L
I
A
S
N
TR
OI
A
T
T
A
IO
C
N
UD
E
F
N
O
A
E
T
T
IO
U
N
TI
A
T
L
SNI
kUkkF
La
j
l
k"
V
u
hª ;
lk
k
'
'z
k
i
fS { a
kdo,
; kutsk
*
Metadata for U-DISE Based Key Performance Indicators of School Education in India
Published in 2018 byNational Institute of Educational Planning and Administration17-B, Sri Aurobindo MargNew Delhi – 110016, INDIA
Supported by UNICEF, India country office, New Delhi
Design and Lyout Department of EMIS, NIEPA, New Delhi
Acknowledgements
Metadata is data about data and it provides information about selected indicators. A total of 97 Key Performance Indicators (KPIs) of Elementary Education and 78 Key Performance Indicators of Secondary Education have been provided in the Data Visualization App based on the Unified District Information System for Education (U-DISE). The unit, purpose and definition, calculation method, if unit is in percentage or ratio, interpretation, disaggregation and limitations and comments have been provided for each of the indicators. The Metadata have been developed following the framework used in the UNSECO Institutes of Statistics (UIS) publication entitled, “Education Indicators: Technical Guidelines”, and the variable descriptions and guidelines of the U-DISE DCF 2016-17 developed by NIEPA.
I appreciate the efforts made by Dr. Ganesh Kumar Nigam, Consultant, UNICEF to prepare this document and Prof. K. Biswal, In-charge, U-DISE Project, Department of EMIS, NIEPA to review and provide valuable inputs.
(N. V. Varghese)Vice-chancellor,
NIEPA
vii
INDEX
Management and Level xii
Elementary level
S. No. Area Indicator No.
1 School and facilities Number of schools 32 School and facilities Proportion of Government schools to total schools 33 School and facilities Ratio of Primary schools/section to Upper primary schools/section 34 School and facilities Schools with Building 45 School and facilities Schools with Head Master room 46 School and facilities Schools with One classroom for every teacher 47 School and facilities Schools with Ramp 58 School and facilities Schools with Separate toilet for boys 59 School and facilities Schools with Separate toilet for girls 510 School and facilities Schools with Drinking Water 611 School and facilities Schools with three WASH facilities (Toilet, Drinking Water and Handwashing
facilities)6
12 School and facilities Schools with functional separate toilet for girls 613 School and facilities Schools with functional drinking water 714 School and facilities Schools with Children With Special Needs (CWSN) friendly toilet 715 School and facilities Schools with functional separate toilet for boys 716 School and facilities Schools with Kitchen Shed 817 School and facilities Schools with Boundary Wall 818 School and facilities Schools with Playground 819 School and facilities Schools with 4 or more urinals 920 School and facilities Number of classrooms 921 School and facilities Percentage of classrooms in good condition 922 School and facilities Schools with single classroom 1023 School and facilities Student Classroom Ratio (SCR) 1024 School and facilities Schools with library 1025 School and facilities Schools with Electricity connection 1126 School and facilities Schools with handwashing facility near toilet/urinals 1127 School and facilities Schools with functional computer 1128 School and facilities Schools conducted medical check-up of students last year 1229 School and facilities Schools with furniture (table/desk) for all students in elementary section 1230 School and facilities Primary schools with working days more than 200 during last academic year 1231 School and facilities Upper Primary schools/section with working days more than 220 during last
academic year13
32 School and facilities Schools constituted School Management Committee (SMC) 1333 School and facilities Schools constituted SMC and have more than nine meetings during last academic
year13
34 School and facilities Schools received school development grant during last financial year 1435 School and facilities Schools received school maintainace grant during last financial year 1436 School and facilities Schools received teacher grant during last financial year 1437 School and facilities Schools visited by Cluster Resource Centre Coordinator(CRC ) 1538 School and facilities Schools visited by Block level Officer (BRC/BEO) 1539 Enrolment Enrolment Primary classes (Grade 1-5) 15
viii
40 Enrolment Enrolment Upper primary classes (Grade 6-8) 1641 Enrolment Enrolment Elementary classes (Grade 1-8) 1642 Enrolment Proportion of enrolment to total enrolment in Govt. schools at Elementary level 1643 Enrolment Ratio of girls' to boys' in enrolment in Primary classes (Grade 1-5) 1744 Enrolment Enrolment of CWSN in Elementary classes (Grade 1-8) 1745 Enrolment Proportion of CWSN to total enrolment in Elementary classes 1746 Enrolment Proportion of underage and overage students to total enrolment at Elementary
level18
47 Enrolment Proportion of enrolment of girls to total enrolment at Primary level 1848 Enrolment Proportion of enrolment of SC children to total enrolment at Primary level 1849 Enrolment Proportion of enrolment of ST children to total enrolment at Primary level 1950 Enrolment Proportion of enrolment of OBC children to total enrolment at Primary level 1951 Enrolment Proportion of enrolment of Muslim children to total enrolment at Primary level 1952 Teacher Number of teachers 2053 Teacher Proportion of female teachers to total teachers 2054 Teacher Proportion of SC teachers to total teachers 2055 Teacher Proportion of ST teachers to total teachers 2156 Teacher Proportion of OBC teachers to total teachers 2157 Teacher Schools without female teacher 2158 Teacher Schools with single teacher 2259 Teacher Teachers do not have professional qualification 2260 Teacher Contractual teachers 2261 Teacher Pupil Teacher Ratio (PTR) 2362 Teacher Schools without requisite number of teachers as per RTE norms 2363 Teacher Primary only schools having enrolment 150 and above and have Head Teacher 2364 Teacher Upper Primary schools/section having Enrolment 100 and above and have Head
Teacher24
65 Teacher Upper Primary schools/section with teacher who is graduate or more qualification in Mathematics
24
66 Teacher Upper Primary schools/section with teacher who is graduate or more qualification in English/Language
24
67 Teacher Upper Primary schools/section with teacher who is graduate or more qualification in Social studies
25
68 School and facilities Schools with approachable road 2569 Enrolment Ratio of girls' to boys' in enrolment at in Upper primary classes (Grade 6-8) 2570 Enrolment Ratio of girls' to boys' in enrolment in Elementary classes (Grade 1-8) 2671 Enrolment Proportion of enrolment of girls to total enrolment at Upper primary level 2672 Enrolment Proportion of enrolment of SC children to total enrolment at Upper primary level 2673 Enrolment Proportion of enrolment of ST children to total enrolment at Upper primary level 2774 Enrolment Proportion of enrolment of OBC children to total enrolment at Upper primary
level27
75 Enrolment Proportion of enrolment of Muslim children to total enrolment at Upper primary level
27
76 Enrolment Proportion of enrolment of girls to total enrolment at Elementary level 2877 Enrolment Proportion of enrolment of SC children to total enrolment at Elementary level 2878 Enrolment Proportion of enrolment of ST children to total enrolment at Elementary level 2879 Enrolment Proportion of enrolment of OBC children to total enrolment at Elementary level 2980 Enrolment Proportion of enrolment of Muslim children to total enrolment at Elementary
level29
81 Outcome Schools comply with 10 RTE parameters 2982 Outcome Gross Enrolment Ratio at Primary level 3083 Outcome Gross Enrolment Ratio at Upper primary level 30
ix
84 Outcome Gross Enrolment Ratio at Elementary level 3185 Outcome Net Enrolment Ratio at Primary level 3186 Outcome Net Enrolment Ratio at Upper primary level 3287 Outcome Net Enrolment Ratio at Elementary level 3288 Outcome Age Specific Enrolment Ratio for the age group of 6-10 years 3389 Outcome Age Specific Enrolment Ratio for the age group of 11-13 years 3390 Outcome Age Specific Enrolment Ratio for the age group of 6-13 years 3491 Outcome Annual Average Dropout rate at Primary level 3492 Outcome Annual Average Dropout rate at Upper primary level 3593 Outcome Transition rate, Primary to Upper primary level 3594 Outcome Transition rate, Elementary to Secondary level 3695 Outcome Retention rate at Primary level 3696 Outcome Retention rate at Elementary level 3697 Outcome Gender Parity Index in GER at Elementary level 37
Secondary level
S. No. Area Indicator No.
1 School and facilities Number of schools 412 School and facilities Proportion of Government schools to total schools 413 School and facilities Ratio of upper Higher Secondary schools/section to secondary schools/section 414 School and facilities Schools with Building 425 School and facilities Schools with Head Master room 426 School and facilities Schools with Ramp 427 School and facilities Schools with Separate toilet for boys 438 School and facilities Schools with Separate toilet for girls 439 School and facilities Schools with Drinking Water 4310 School and facilities Schools with three WASH facilities (Toilet, Drinking Water and Handwashing
facilities)44
11 School and facilities Schools with functional separate toilet for girls 4412 School and facilities Schools with functional drinking water 4413 School and facilities Schools with Children With Special Needs (CWSN) friendly toilet 4514 School and facilities Schools with functional separate toilet for boys 4515 School and facilities Schools with Boundary Wall 4516 School and facilities Schools with Playground 4617 School and facilities Schools with 4 or more urinals 4618 School and facilities Number of classrooms 4619 School and facilities Student Classroom Ratio (SCR) 4720 School and facilities Schools with library 4721 School and facilities Schools with cocurricular and activity room 4722 School and facilities Schools with Arts and craft activity room 4823 School and facilities Schools with library room 4824 School and facilities Schools with integrated science lab (Only for Secondary) 4825 School and facilities Schools with ICT lab 4926 School and facilities Schools with computer and internet facility 4927 School and facilities Schools with Electricity connection 4928 School and facilities Schools with handwashing facility near toilet/urinals 5029 School and facilities Schools with functional computer 50
x
30 School and facilities Schools conducted medical check-up of students previous year 5031 School and facilities Schools with furniture (table/desk) for all students in Secondary section 5132 School and facilities Schools with furniture (table/desk) for all students in Higher Secondary section 5133 School and facilities Schools constituted School Development Management Committee (SDMC) 5134 School and facilities Schools constituted SDMC and have more than nine meetings during last aca-
demic year52
35 Enrolment Enrolment Secondary classes (Grade 9-10) 5236 Enrolment Enrolment Higher Secondary classes (Grade 11-12) 5237 Enrolment Proportion of enrolment to total enrolment in Govt. schools at Secondary level 5338 Enrolment Proportion of enrolment to total enrolment in Govt. schools at Higher Secondary
level53
39 Enrolment Ratio of girls' to boys' in enrolment in Secondary classes (Grade 9-10) 5340 Enrolment Ratio of girls' to boys' in enrolment in Higher Secondary classes (Grade 11-12) 5441 Enrolment Enrolment of Children with Special Needs (CWSN) in Secondary classes (Grade
9-10)54
42 Enrolment Proportion of CWSN to total enrolment in Secondary classes (Grade 9-10) 5443 Enrolment Enrolment of Children with Special Needs (CWSN) in Higher Secondary classes
(Grade 11-12)55
44 Enrolment Proportion of CWSN to total enrolment in Higher Secondary classes (Grade 11-12)
55
45 Enrolment Proportion of enrolment of girls to total enrolment at Secondary level 5546 Enrolment Proportion of enrolment of SC children to total enrolment at Secondary level 5647 Enrolment Proportion of enrolment of ST children to total enrolment at Secondary level 5648 Enrolment Proportion of enrolment of OBC children to total enrolment at Secondary level 5649 Enrolment Proportion of enrolment of Muslim children to total enrolment at Secondary level 5750 Enrolment Proportion of enrolment of girls to total enrolment at Higher Secondary level 5751 Enrolment Proportion of enrolment of SC children to total enrolment at Higher Secondary
level57
52 Enrolment Proportion of enrolment of ST children to total enrolment at Higher Secondary level
58
53 Enrolment Proportion of enrolment of OBC children to total enrolment at Higher Secondary level
58
54 Enrolment Proportion of enrolment of Muslim children to total enrolment at Higher Second-ary level
58
55 Teacher Number of teachers 5956 Teacher Proportion of female teachers to total teachers 5957 Teacher Proportion of SC teachers to total teachers 5958 Teacher Proportion of ST teachers to total teachers 6059 Teacher Proportion of OBC teachers to total teachers 6060 School and facilities Schools without female teacher 6061 Teacher Teachers do not have professional qualification 6162 School and facilities Contractual teachers 6163 Teacher Pupil Teacher Ratio (PTR) at Secondary level 6164 Teacher Pupil Teacher Ratio (PTR) at Higher Secondary level 6265 School and facilities Secondary schools/section with teacher who is graduate or more qualification in
Mathematics62
66 School and facilities Secondary schools/section with teacher who is graduate or more qualification in English/Language
62
67 School and facilities Secondary schools/section with teacher who is graduate or more qualification in Social studies
63
68 School and facilities Schools with approachable road 6369 Outcome Gross Enrolment Ratio at Secondary level 64
xi
70 Outcome Gross Enrolment Ratio at Higher Secondary level 6471 Outcome Net Enrolment Ratio at Secondary level 6572 Outcome Net Enrolment Ratio at Higher Secondary level 6573 Outcome Age Specific Enrolment Ratio for the age group of 14-15 years 6674 Outcome Age Specific Enrolment Ratio for the age group of 16-17 years 6675 Outcome Transition rate, Elementary to Secondary level 6776 Outcome Gender Parity Index in GER at Secondary level 6777 Outcome Gender Parity Index in GER at Higher Secondary level 6878 Outcome Retention rate at Secondary level 68
xii
Management Level
Level:
Elementary level : Schools having any grades between 1 to 8.
Secondary level : Schools having any grades between 9 to 12.
Management:
Government : Schools managed by Education department, Tribal/Social Welfare Department, Local body, others, Central Govt. management of schools.
Government aided : Schools managed by Government aided and Madarsa recognized management of schools.
Private unaided : Schools managed by Private unaided management of schools.
Unrecognized : Schools managed by unrecognized and Madarsa unrecognized management of schools.
1
Elementary level
2
3
S.No. 1Area School and facilitiesIndicator Number of schoolsUnit NumberPurpose and Definition Number of schools having any grades between 1 to 8
Calculation method, if unit is in percentage or ratio
-
Interpretation -Disaggregation By management and locationLimitation and com-ments
Despite significant increase in number of schools in U-DISE, a few schools (mostly unrecog-nized) are yet be covered. Although this number is very small, but it varies from state to state. It may be also noted that all information is based on information filled by the head teacher or teacher in the prescribed data capturing format.
S.No. 2Area School and facilitiesIndicator Proportion of Government schools to total schoolsUnit PercentagePurpose and Definition The indicator measures share of government schools to total schools
Calculation method, if unit is in percentage or ratio
Number of schools managed by Government / Number of schools *100
Interpretation A high value indicates that students have good access of government schools.Disaggregation By locationLimitation and com-ments
A few schools (mostly unrecognized) are yet be covered and it varies from administrative area to administrative area hence interpretation should be made very carefully.
S.No. 3Area School and facilitiesIndicator Ratio of Primary schools/section to Upper primary schools/sectionUnit RatioPurpose and Definition The indicator measures availability of Upper primary schooling facility as compared to Pri-
mary schooling facility.Calculation method, if unit is in percentage or ratio
Number of Upper primary schools/sections/Number of Primary schools/sections
Interpretation A low value (less than 2) indicates that particular administrative area have good access of Up-per primary schooling facility and More than 2 value indicates that particular administrative area required Upper primary schooling facility as compared to Primary schooling facility.
Disaggregation By locationLimitation and com-ments
-
4
S.No. 4Area School and facilitiesIndicator Schools with BuildingUnit Number, PercentagePurpose and Definition The indicator measures access to building facility in schools, which is necessary to ensure a
safe and effective learning environment for all students. Schools having either Government, rented, private rent free, dilapidated or under construction building are defined as schools with building
Calculation method, if unit is in percentage or ratio
Number of schools with building / Number of schools *100
Interpretation A high value indicates that schools have good access to the building facility. Ideally each school should have access to building facility as per the RTE act.
Disaggregation By management and locationLimitation and com-ments
The indicator measures the existence of the availability of building in schools but not its qual-ity or operational state.
S.No. 5Area School and facilitiesIndicator Schools with Head Master roomUnit Number, PercentagePurpose and Definition The indicator measures access to Head Master room facility in schools, which is necessary to
ensure a safe and effective learning environment for all students.Calculation method, if unit is in percentage or ratio
Number of schools with Head Master room / Number of schools *100
Interpretation A high value indicates that schools have good access to the Head Master room facility. Ideally each school should have access to Head Master room facility as per the RTE act, which can be also used for office and store purpose.
Disaggregation By management and locationLimitation and com-ments
The indicator measures the existence of the availability of Head Master room in schools but not its quality or operational state and it may be used for other purposes such as office or store.
S.No. 6Area School and facilitiesIndicator Schools with One classroom for every teacherUnit Number, PercentagePurpose and Definition The indicator measures access to one classroom for every teacher facility in schools, which is
necessary to ensure a safe and effective learning environment for all students.Calculation method, if unit is in percentage or ratio
Number of schools with one classroom for every teacher / Number of schools *100
Interpretation A high value indicates that schools have good access to the one classroom for every teacher facility. Ideally each school should have access to one classroom for every teacher facility as per the RTE act.
Disaggregation By management and locationLimitation and com-ments
The indicator measures the existence of the availability of one classroom for every teacher in schools but not its quality or operational state.
5
S.No. 7Area School and facilitiesIndicator Schools with RampUnit Number, PercentagePurpose and Definition The indicator measures access to ramp facility in schools, which is necessary to ensure a safe
and effective learning environment for all students.Calculation method, if unit is in percentage or ratio
Number of schools with ramp / Number of schools *100
Interpretation A high value indicates that schools have good access to the ramp facility. Ideally each school should have access to ramp facility as per the RTE act.
Disaggregation By management and location
Limitation and com-ments
The indicator measures the existence of the availability of ramp in schools but not its quality or operational state.
S.No. 8Area School and facilitiesIndicator Schools with Separate toilet for boysUnit Number, PercentagePurpose and Definition The indicator measures access to separate toilet for boys facility in schools (Coeducation and
only for boys), which is necessary to ensure a safe and effective learning environment for all students.
Calculation method, if unit is in percentage or ratio
Number of schools (Coeducation and only for boys) with separate toilet for boys / Number of schools (Coeducation and only for boys) *100
Interpretation A high value indicates that schools have good access to the separate toilet for boys facility. Ideally each school should have access to separate toilet for boys as per the RTE act.
Disaggregation By management and location
Limitation and com-ments
The indicator measures the existence of separate toilet for boys in schools but not its quality or operational state.
S.No. 9Area School and facilitiesIndicator Schools with Separate toilet for girlsUnit Number, PercentagePurpose and Definition The indicator measures access to separate toilet for girls facility in schools (Coeducation and
only for girls), which is necessary to ensure a safe and effective learning environment for all students.
Calculation method, if unit is in percentage or ratio
Number of schools (Coeducation and only for girls) with separate toilet for girls / Number of schools (Coeducation and only for girls) *100
Interpretation A high value indicates that schools have good access to the separate toilet for girls facility. Ideally each school should have access to separate toilet for girls facility as per the RTE act.
Disaggregation By management and location
Limitation and com-ments
The indicator measures the existence of the availability of separate toilet for girls in schools but not its quality or operational state.
6
S.No. 10Area School and facilitiesIndicator Schools with Drinking WaterUnit Number, PercentagePurpose and Definition The indicator measures access to drinking water facility in schools, which is necessary to en-
sure a safe and effective learning environment for all students. Schools having drinking water facility through handpump or tap or well or other source are defined as schools with drinking water.
Calculation method, if unit is in percentage or ratio
Number of schools with drinking water / Number of schools *100
Interpretation A high value indicates that schools have good access to the drinking water facility. Ideally each school should have access to drinking water facility as per the RTE act.
Disaggregation By management and location
Limitation and com-ments
The indicator measures the existence of the availability of drinking water in schools but not its quality or operational state or availability throughout the academic year.
S.No. 11Area School and facilitiesIndicator Schools with three WASH facilities (Toilet, Drinking Water and Handwashing facilities)Unit Number, PercentagePurpose and Definition The indicator measures access to combination of three WASH facilities (Separate toilet for
boys , Separate toilet for girls and drinking water facility) in schools, which is necessary to ensure a safe and effective learning environment for all students. Facilities are defined in ear-lier indicators
Calculation method, if unit is in percentage or ratio
Number of schools with Separate toilet for boys and Separate toilet for girls and drinking water / Number of schools *100
Interpretation A high value indicates that schools have good access to the drinking water facility.
Disaggregation By management and location
Limitation and com-ments
The indicator measures the existence of the availability of all three facilities in schools but not its quality or operational state
S.No. 12Area School and facilitiesIndicator Schools with functional separate toilet for girlsUnit Number, PercentagePurpose and Definition The indicator measures access to functional separate toilet for girls facility in schools (Coedu-
cation and only for girls), which is necessary to ensure a safe and effective learning environ-ment for all students. Functional Toilet can be defined as the one with minimal odour, unbroken seat, regularly cleaned and dry, working drainage system, accessible to users, closable door.
Calculation method, if unit is in percentage or ratio
Number of schools (Coeducation and only for girls) with functional separate toilet for girls / Number of schools (Coeducation and only for girls) *100
Interpretation A high value indicates that schools have good access to the functional separate toilet for girls facility.
Disaggregation By management and location
Limitation and com-ments
The indicator measures the existence of the availability of functional separate toilet for girls in schools as reported by the head teacher but not its quality .
7
S.No. 13Area School and facilitiesIndicator Schools with functional drinking waterUnit Number, PercentagePurpose and Definition The indicator measures access to functional drinking water facility in schools, which is nec-
essary to ensure a safe and effective learning environment for all students. Schools having drinking water facility through handpump or tap or well or other source are defined as schools with drinking water. The functionality of the drinking water can be derived if the source is ac-cessible to the school and also provision has been made to bring and store water in the school without involving the children.
Calculation method, if unit is in percentage or ratio
Number of schools with functional drinking water / Number of schools *100
Interpretation A high value indicates that schools have good access to the functional drinking water facility.
Disaggregation By management and location
Limitation and com-ments
The indicator measures the existence of the availability of drinking water in schools but not its quality or operational state or availability throughout the academic year.
S.No. 14Area School and facilitiesIndicator Schools with Children With Special Needs (CWSN) friendly toiletUnit Number, PercentagePurpose and Definition The indicator measures access to Children With Special Needs (CWSN) friendly toilet in
schools, which is necessary to ensure a safe and effective learning environment for all students.Calculation method, if unit is in percentage or ratio
Number of schools with Children With Special Needs (CWSN) friendly toilet / Number of schools *100
Interpretation A high value indicates that schools have good access to the Children With Special Needs (CWSN) friendly toilet . Ideally each school should have access to Children With Special Needs (CWSN) friendly toilet.
Disaggregation By management and location
Limitation and com-ments
The indicator measures the existence of the availability of Children With Special Needs (CWSN) friendly toilet in schools but not its quality or operational state or availability throughout the academic year.
S.No. 15Area School and facilitiesIndicator Schools with functional separate toilet for boysUnit Number, PercentagePurpose and Definition The indicator measures access to functional separate toilet for boys facility in schools (Coedu-
cation and only for boys), which is necessary to ensure a safe and effective learning environ-ment for all students. Functional Toilet can be defined as the one with minimal odour, unbroken seat, regularly cleaned and dry, working drainage system, accessible to users, closable door.
Calculation method, if unit is in percentage or ratio
Number of schools (Coeducation and only for boys) with functional separate toilet for boys / Number of schools (Coeducation and only for boys) *100
Interpretation A high value indicates that schools have good access to the functional separate toilet for boys facility.
Disaggregation By management and location
Limitation and com-ments
The indicator measures the existence of functional separate toilet for boys in schools as re-ported by the head teacher but not its quality.
8
S.No. 16Area School and facilitiesIndicator Schools with Kitchen ShedUnit Number, PercentagePurpose and Definition The indicator measures access to kitchen shed facility in Govt and Govt. aided schools, which
is necessary to ensure a safe and effective learning environment for all students. It is required only in Govt and Govt. aided schools where mid-day meal provided & prepared in school premises.
Calculation method, if unit is in percentage or ratio
Number of Govt and Govt. aided schools where mid-day meal provided & prepared in school premises and have kitchen shed / Number of Govt and Govt. aided schools where mid-day meal provided & prepared in school premises *100
Interpretation A high value indicates that schools have good access to the kitchen shed facility. Ideally each school should have access to kitchen shed facility as per RTE act.
Disaggregation By management (Only Govt. And Govt. aided) and location
Limitation and com-ments
The indicator measures the existence of the availability of kitchen shed in schools but not its quality or operational state.
S.No. 17Area School and facilitiesIndicator Schools with Boundary WallUnit Number, PercentagePurpose and Definition The indicator measures access to boundary wall facility in schools , which is necessary to ensure a safe
and effective learning environment for all students. Schools having Pucca, Pucca but broken, barbed wire fencing, Hedges , others and Partial are defined as schools with boundary wall.
Interpretation A high value indicates that schools have good access to the Children With Special Needs (CWSN) friendly toilet . Ideally each school should have access to Children With Special Needs (CWSN) friendly toilet.
Calculation method, if unit is in percentage or ratio
Number of schools with boundary wall / Number of schools *100
Interpretation A high value indicates that schools have good access to the boundary wall facility. Ideally each school should have access to boundary wall facility as per the RTE act.
Disaggregation By management and location
Limitation and com-ments
The indicator measures the existence of the availability of boundary wall in schools but not its quality or operational state.
S.No. 18Area School and facilitiesIndicator Schools with PlaygroundUnit Number, PercentagePurpose and Definition The indicator measures access to playground facility in schools, which is necessary to ensure
a safe and effective learning environment for all students.Calculation method, if unit is in percentage or ratio
Number of schools with playground / Number of schools *100
Interpretation A high value indicates that schools have good access to the playground facility. Ideally each school should have access to playground facility as per the RTE act.
Disaggregation By management and location
Limitation and com-ments
The indicator measures the existence of the availability of playground in schools but not its quality or operational state.
9
S.No. 19Area School and facilitiesIndicator Schools with 4 or more urinalsUnit Number, PercentagePurpose and Definition The indicator measures access to 4 or more urinals facility in schools, which is necessary to
ensure a safe and effective learning environment for all students.Calculation method, if unit is in percentage or ratio
Number of schools with 4 or more urinals / Number of schools *100
Interpretation A high value indicates that schools have good access to the 4 or more urinals facility.
Disaggregation By management and location
Limitation and com-ments
The indicator measures the existence of the availability of 4 or more urinals in schools but not its quality or operational state.
S.No. 20Area School and facilitiesIndicator Number of classroomsUnit NumberPurpose and Definition The indicator measures access to classroom used for instructional purposes in schools , which
is necessary to ensure a safe and effective learning environment for all students. Classrooms are defined either they are pucca, partially pucca , kuchha classrooms or tent.
Calculation method, if unit is in percentage or ratio
-
Interpretation -
Disaggregation By management and location
Limitation and com-ments
The indicator measures the existence of classrooms in schools but not its quality or opera-tional state.
S.No. 21Area School and facilitiesIndicator Percentage of classrooms in good conditionUnit PercentagePurpose and Definition The indicator measures access to classrooms in good condition in schools , which is necessary
to ensure a safe and effective learning environment for all students. Good condition means not required major or minor repairing either it is pucca, partially pucca or kuchha classrooms or tent.
Calculation method, if unit is in percentage or ratio
Number of good condition classrooms / Number of classrooms *100
Interpretation A high value indicates that schools have good access to the good condition of classrooms.
Disaggregation By management and location
Limitation and com-ments
The indicator measures condition of classrooms for instructional purpose but not its opera-tional state. There may be more classrooms in schools which are not used for instructional purpose.
10
S.No. 22Area School and facilitiesIndicator Schools with single classroomUnit Number, PercentagePurpose and Definition The indicator measures schools having only one classroom. Ideally there should be no school
with single classroom. As per the RTE act at least two classrooms are required in primary schools if enrolment is less than 60
Calculation method, if unit is in percentage or ratio
Number of schools with single classroom/Number of schools *100
Interpretation A low value indicates that schools have good access to the classroom. Ideally no school should have single classroom.
Disaggregation By management and location
Limitation and com-ments
The indicator measures condition of classrooms for instructional purpose but not its opera-tional state. There may be more classrooms in schools which are not used for instructional purpose.
S.No. 23Area School and facilitiesIndicator Student Classroom Ratio (SCR)Unit RatioPurpose and Definition The indicator measures access to classroom in schools, which is necessary to ensure a safe
and effective learning environment for all students. Average number of students per classroom in schools in a given school year.
Calculation method, if unit is in percentage or ratio
Number of students/Number of classrooms
Interpretation A low value indicates that schools have good access to the good status of classrooms. Ideally there should be one classroom for every teacher as per the RTE act and this indicator should be analysed with schools with one classroom for every teacher.
Disaggregation By management and locationLimitation and com-ments
The indicator is based on number of classrooms for instructional purpose and enrolment but not its operational state. There may be more classrooms in schools which are not used for instructional purpose.
Limitation and com-ments
The indicator measures the existence of the availability of boundary wall in schools but not its quality or operational state.
S.No. 24Area School and facilitiesIndicator Schools with libraryUnit Number, PercentagePurpose and Definition The indicator measures access to library facility in schools , which is necessary to ensure a
safe and effective learning environment for all students. Library facility defined as availability of books.
Calculation method, if unit is in percentage or ratio
Number of schools with library / Number of schools *100
Interpretation A high value indicates that schools have good access to the library facility. Ideally each
school should have access to library facility as per the RTE act.
By management and location
Disaggregation By management and locationLimitation and com-ments
The indicator measures the existence of the availability of library in schools but not its quality or operational state.
11
S.No. 25Area School and facilitiesIndicator Schools with Electricity connectionUnit Number, PercentagePurpose and Definition The indicator measures access to electricity connection facility in schools, which is necessary
to ensure a safe and effective learning environment for all students.Calculation method, if unit is in percentage or ratio
Number of schools with electricity connection / Number of schools *100
Interpretation A high value indicates that schools have good access to the electricity connection facility. Ide-ally each school should have access to electricity connection facility.
Disaggregation By management and location
Limitation and com-ments
The indicator measures the existence of the availability of electricity connection in schools but not its operational state.
S.No. 26Area School and facilitiesIndicator Schools with handwashing facility near toilet/urinalsUnit Number, PercentagePurpose and Definition The indicator measures access to handwashing facility near toilet/urinals facility in schools ,
which is necessary to ensure a safe and effective learning environment for all students.Calculation method, if unit is in percentage or ratio
Number of schools with handwashing facility near toilet/urinals / Number of schools *100
Interpretation A high value indicates that schools have good access to the handwashing facility near toilet/urinals facility. Ideally each school should have access to handwashing facility near toilet/urinals facility .
Disaggregation By management and location
Limitation and com-ments
The indicator measures the existence of the availability of handwashing facility near toilet/urinals in schools but not its quality or operational state.
S.No. 27Area School and facilitiesIndicator Schools with functional computerUnit Number, PercentagePurpose and Definition The indicator measures access to functional computer in schools for teaching and learning
purposes, which is necessary to ensure a safe and effective learning environment for all stu-dents. Functional computer defined as computers are in working condition.
Calculation method, if unit is in percentage or ratio
Number of schools with functional computer / Number of schools *100
Interpretation A high value indicates that schools have good access to the functional computer.Disaggregation By management and location
Limitation and com-ments
The indicator measures the existence of the availability of functional computer in schools but not its quality.
12
S.No. 28Area School and facilitiesIndicator Schools conducted medical check-up of students last yearUnit Number, PercentagePurpose and Definition To ensure good health of school children the Health department conducts medical check-up
under School Health Programme every year, which includes primary health check-up to pro-viding super specialty treatment if necessary. The indicator measures whether medical check-up conducted in schools or not in previous academic year.
Calculation method, if unit is in percentage or ratio
Number of schools conducted medical check-up / Number of schools *100
Interpretation A high value indicates that schools have good access of medical check-up.
Disaggregation By management and location
Limitation and com-ments
The indicator measures the existence of the status of medical check-up in schools but not its quality nor number of students benefitted.
S.No. 29Area School and facilitiesIndicator Schools with furniture (table/desk) for all students in elementary sectionUnit Number, PercentagePurpose and Definition The indicator measures access to furniture facility in schools, which is necessary to ensure a
safe and effective learning environment for all students.
Calculation method, if unit is in percentage or ratio
Number of schools with furniture / Number of schools *100
Interpretation A high value indicates that schools have good access to the furniture facility.
Disaggregation By management and locationLimitation and com-ments
The indicator measures the existence of the availability of furniture in schools but not its type of furniture, quality or operational state.
Limitation and com-ments
The indicator measures the existence of the availability of boundary wall in schools but not its quality or operational state.
S.No. 30Area School and facilitiesIndicator Primary schools with working days more than 200 during last academic yearUnit Number, PercentagePurpose and Definition The indicator measures Primary schools working more than 200 days, which is necessary to
ensure effective learning environment for all students.Calculation method, if unit is in percentage or ratio
Number of Primary schools/sections with more than 200 working days / Number of Primary schools/sections *100
Interpretation A high value indicates that Primary schools have working days more than 200 as prescribed in the RTE act.
Disaggregation By management and locationLimitation and com-ments
The indicator measures whether Primary schools have more than 200 working days or not, however it does not show about status of actual teaching learning process.
Limitation and com-ments
The indicator measures the existence of the availability of library in schools but not its quality or operational state.
13
S.No. 31Area School and facilitiesIndicator Upper Primary schools/section with working days more than 220 during last academic
yearUnit Number, PercentagePurpose and Definition The indicator measures Upper primary schools working more than 220 days, which is neces-
sary to ensure effective learning environment for all students.Calculation method, if unit is in percentage or ratio
Number of Upper primary schools/sections with more than 220 working days / Number of Upper primary schools/sections *100
Interpretation A high value indicates that Upper primary schools have working days more than 220 as pre-scribed in the RTE act.
Disaggregation By management and location
Limitation and com-ments
The indicator measures whether Upper primary schools have more than 220 working days or not , it does not show about status of actual teaching learning process.
S.No. 32Area School and facilitiesIndicator Schools constituted School Management Committee (SMC)Unit Number, PercentagePurpose and Definition The indicator measures constitution of School Management Committee (SMC) in Govt and
Govt aided schools during last academic year, which is necessary to ensure a safe and effective learning environment for all students as per the RTE act.
Calculation method, if unit is in percentage or ratio
Number of Govt and Govt aided schools constituted SMC / Number of Govt and Govt aided schools *100
Interpretation A high value indicates that Govt and Govt aided schools have good constitution of SMCs. RTE act mandate to constitution of SMCs in all Govt and Govt aided schools.
Disaggregation By management and location
Limitation and com-ments
The indicator measures the constitution of SMCs in Govt and Govt aided schools but not its functionality
S.No. 33Area School and facilitiesIndicator Schools constituted SMC and have more than nine meetings during last academic yearUnit Number, PercentagePurpose and Definition The indicator measures functionality of School Management Committee (SMC) in Govt and
Govt aided schools during last academic year.Calculation method, if unit is in percentage or ratio
Number of Govt and Govt aided schools constituted SMC and have more than nine meetings during last academic year / Number of Govt and Govt aided schools constituted SMC *100
Interpretation A high value indicates that Govt and Govt aided schools have good functioning of SMCs.Disaggregation By management and location
Limitation and com-ments
The indicator measures the functioning of SMCs in Govt and Govt aided schools but not its quality of deliberations.
14
S.No. 34Area School and facilitiesIndicator Schools received school development grant during last financial yearUnit Number, PercentagePurpose and Definition The indicator measures availability of school development grant during last financial year in
Govt and Govt aided schools, which is necessary to ensure effective learning environment for all students.
Calculation method, if unit is in percentage or ratio
Number of Govt and Govt aided schools received school development grant during last finan-cial year / Number of Govt and Govt aided schools *100
Interpretation A high value indicates that Govt and Govt aided schools have more availability of school development grant during last financial year
Disaggregation By management (Govt and Govt aided) and location
Limitation and com-ments
The indicator measures whether Govt and Govt aided schools received school development grant during last financial year or not , it does not show about how grant was used.
S.No. 35Area School and facilitiesIndicator Schools received school maintainace grant during last financial yearUnit Number, PercentagePurpose and Definition The indicator measures availability of school maintenance grant during last financial year in
Govt and Govt aided schools , which is necessary to ensure effective learning environment for all students.
Calculation method, if unit is in percentage or ratio
Number of Govt and Govt aided schools received school maintenance grant during last finan-cial year / Number of Govt and Govt aided schools *100
Interpretation A high value indicates that Govt and Govt aided schools have more availability of school maintenance grant during last financial year
Disaggregation By management (Govt and Govt aided) and locationLimitation and com-ments
The indicator measures whether Govt and Govt aided schools received school maintenance grant during last financial year or not , it does not show about how grant was used.
Limitation and com-ments
The indicator measures the existence of the availability of boundary wall in schools but not its quality or operational state.
S.No. 36Area School and facilitiesIndicator Schools received teacher grant during last financial yearUnit Number, PercentagePurpose and Definition The indicator measures availability of teacher grant during last financial year in Govt and Govt
aided schools , which is necessary to ensure effective learning environment for all students.Calculation method, if unit is in percentage or ratio
Number of Govt and Govt aided schools received teacher grant during last financial year / Number of Govt and Govt aided schools *100
Interpretation A high value indicates that Govt and Govt aided schools have more availability of teacher grant during last financial year
Disaggregation By management (Govt and Govt aided) and locationLimitation and com-ments
The indicator measures whether Govt and Govt aided schools received teacher grant during last financial year or not , it do not show about how grant was used.
Limitation and com-ments
The indicator measures the existence of the availability of library in schools but not its quality or operational state.
15
S.No. 37Area School and facilitiesIndicator Schools visited by Cluster Resource Centre Coordinator(CRC )Unit Number, PercentagePurpose and Definition The indicator measures schools visited by CRC coordinator during the previous academic
year in Govt and Govt aided schools , which is necessary to ensure effective learning environ-ment for all students.
Calculation method, if unit is in percentage or ratio
Number of Govt and Govt aided schools visited by CRC coordinator during the previous academic year / Number of Govt and Govt aided schools *100
Interpretation A high value indicates that Govt and Govt aided schools have received more academic support during previous academic year.
Disaggregation By management (Govt and Govt aided) and location
Limitation and com-ments
The indicator measures whether Govt and Govt aided schools visited by CRC coordinator during the previous academic year or not, it does not show quality of visit.
S.No. 38Area School and facilitiesIndicator Schools visited by Block level Officer (BRC/BEO)Unit Number, PercentagePurpose and Definition The indicator measures schools visited by Block level Officer (BRC/BEO) during the previ-
ous academic year in Govt and Govt aided schools, which is necessary to ensure effective learning environment for all students.
Calculation method, if unit is in percentage or ratio
Number of Govt and Govt aided schools visited by Block level Officer (BRC/BEO) during the previous academic year / Number of Govt and Govt aided schools *100
Interpretation A high value indicates that Govt and Govt aided schools have received more academic support during previous academic year.
Disaggregation By management (Govt and Govt aided) and location
Limitation and com-ments
The indicator measures whether Govt and Govt aided schools visited by Block level Officer (BRC/BEO) during the previous academic year or not , it does not show quality of visit.
S.No. 39Area EnrolmentIndicator Enrolment Primary classes (Grade 1-5)Unit NumberPurpose and Definition Number of students studying any grades between 1 to 5Calculation method, if unit is in percentage or ratio
-
Interpretation -Disaggregation By management, Gender, Social group and location
Limitation and com-ments
Enrolment from schools reported in the U-DISE system. Despite significant increase in num-ber of schools in U-DISE , a few schools (mostly unrecognized) are yet be covered. Although this number is very small but it varies from state to state.
16
S.No. 40Area EnrolmentIndicator Enrolment Upper primary classes (Grade 6-8)Unit NumberPurpose and Definition Number of students studying any grades between 6 to 8Calculation method, if unit is in percentage or ratio
-
Interpretation -Disaggregation By management, Gender, Social group and locationLimitation and com-ments
Enrolment from schools reported in the U-DISE system. Despite significant increase in num-ber of schools in U-DISE , a few schools (mostly unrecognized) are yet be covered. Although this number is very small but it varies from state to state.
S.No. 41Area EnrolmentIndicator Enrolment Elementary classes (Grade 1-8)Unit NumberPurpose and Definition Number of students studying any grades between 1 to 8Calculation method, if unit is in percentage or ratio
-
Interpretation -Disaggregation By management, Gender, Social group and locationLimitation and com-ments
Enrolment from schools reported in the U-DISE system. Despite significant increase in num-ber of schools in U-DISE , a few schools (mostly unrecognized) are yet be covered. Although this number is very small but it varies from state to state.
Limitation and com-ments
The indicator measures the existence of the availability of boundary wall in schools but not its quality or operational state.
S.No. 42Area EnrolmentIndicator Proportion of enrolment to total enrolment in Govt. schools at Elementary levelUnit PercentagePurpose and Definition The indicator measures enrolment share in government schools to total enrolment at Elemen-
tary levelCalculation method, if unit is in percentage or ratio
Enrolment in schools managed by Government at Elementary level/ Total enrolment at El-ementary level *100
Interpretation A high value indicates that students have good access of government schools.
Disaggregation By locationLimitation and com-ments
A few schools (mostly unrecognized) are yet be covered and it varies from administrative area to administrative area hence interpretation should be made very carefully.
Limitation and com-ments
The indicator measures the existence of the availability of library in schools but not its quality or operational state.
17
S.No. 43Area EnrolmentIndicator Ratio of girls' to boys' in enrolment in Primary classes (Grade 1-5)Unit RatioPurpose and Definition The indicator measures ratio of girls to boys enrolment in Primary classes.Calculation method, if unit is in percentage or ratio
Enrolment of girls in Primary classes/Enrolment of boys in Primary classes
Interpretation A high value indicates less disparity in enrolment between boys and girls. Ideally value depend on sex ratio of the particular area.
Disaggregation By location and social groupsLimitation and com-ments
The ratio does not show whether improvement is due to the performance of one of the gender groups. Interpretation requires trend analysis of the underlying indicators
S.No. 44Area EnrolmentIndicator Enrolment of CWSN in Elementary classes (Grade 1-8)Unit NumberPurpose and Definition Number of Children with Special Need (CSWN) studying any grades between 1 to 8. Children
with Special Need are defined in 10 categories till 2015-16 and afterwards in 21 categories.Calculation method, if unit is in percentage or ratio
-
Interpretation -Disaggregation By management and locationLimitation and com-ments
CWSN are identified and reported by head teacher based on school records. Categories of CWSN are also reported by head teachers based on the available school records.
S.No. 45Area EnrolmentIndicator Proportion of CWSN to total enrolment in Elementary classesUnit PercentagePurpose and Definition The indicator measures share of CSWN enrolment to total enrolment in Elementary classes.Calculation method, if unit is in percentage or ratio
Enrolment of CWSN in Elementary classes / Total enrolment in Elementary classes *100
Interpretation A high value indicates about more share of CWSN in enrolment and required special focus. If value is very low (Less than 1%) which means CWSN not identified properly or they are not enrolled in the education system.
Disaggregation By management and locationLimitation and com-ments
-
18
S.No. 46Area EnrolmentIndicator Proportion of underage and overage students to total enrolment at Elementary levelUnit PercentagePurpose and Definition The enrolment of Elementary level (grade 1-8) not belonging to the 6-13 years age group that
officially corresponds to Elementary level expressed as a percentage of total enrolment of El-ementary level (grade 1-8), which means enrolment less then 6 years and more than 13 years comes under overage and underage.
Calculation method, if unit is in percentage or ratio
Enrolment of children less than 6 years and more than 13 years at Elementary level (grade 1-8) /Total enrolment at Elementary level (grade-1-8) *100
Interpretation A high value indicates higher share of under age and overage children in enrolment due to early or late entrants, and grade repetition and lack of age appropriate admission.
Disaggregation Social groups (SC and ST only)Limitation and com-ments
Age of children recorded by schools is based on information provided by parents.
S.No. 47Area EnrolmentIndicator Proportion of enrolment of girls to total enrolment at Primary levelUnit PercentagePurpose and Definition The indicator measures share of girls to total enrolment in Primary classes.Calculation method, if unit is in percentage or ratio
Enrolment of girls in Primary classes/Total enrolment in Primary classes *100
Interpretation A high value indicates higher share of girls in enrolment. Ideally value depend on sex ratio of the particular area.
Disaggregation By location , school management and social groupsLimitation and com-ments
The proportion does not show whether improvement is due to the performance of one of the gender groups. Interpretation requires trend analysis of the underlying indicators and sex ratio of the particular area.
Limitation and com-ments
The indicator measures the existence of the availability of boundary wall in schools but not its quality or operational state.
S.No. 48Area EnrolmentIndicator Proportion of enrolment of SC children to total enrolment at Primary levelUnit PercentagePurpose and Definition The indicator measures share of enrolment of SC children to total enrolment in Primary
classes.Calculation method, if unit is in percentage or ratio
Enrolment of SC children in Primary classes/Total enrolment in Primary classes *100
Interpretation A high value indicates higher share of SC in enrolment. Ideally value depend on share of SC population to the total population of the particular area.
Disaggregation By location and school managementLimitation and com-ments
Interpretation requires trend analysis of the underlying indicators and share of SC population of the particular area.
Limitation and com-ments
The indicator measures the existence of the availability of library in schools but not its quality or operational state.
19
S.No. 49Area EnrolmentIndicator Proportion of enrolment of ST children to total enrolment at Primary levelUnit PercentagePurpose and Definition The indicator measures share of enrolment of ST children to total enrolment in Primary
classes.Calculation method, if unit is in percentage or ratio
Enrolment of ST children in Primary classes/Total enrolment in Primary classes *100
Interpretation A high value indicates higher share of ST in enrolment. Ideally value depend on share of ST population to the total population of the particular area.
Disaggregation By location and school managementLimitation and com-ments
Interpretation requires trend analysis of the underlying indicators and share of ST population of the particular area.
S.No. 50Area EnrolmentIndicator Proportion of enrolment of OBC children to total enrolment at Primary levelUnit PercentagePurpose and Definition The indicator measures share of enrolment of OBC children to total enrolment in Primary
classes.Calculation method, if unit is in percentage or ratio
Enrolment of OBC children in Primary classes/Total enrolment in Primary classes *100
Interpretation A high value indicates higher share of OBC in enrolment. Ideally value depend on share of OBC population to the total population of the particular area.
Disaggregation By location and school managementLimitation and com-ments
Interpretation requires trend analysis of the underlying indicators and share of OBC popula-tion of the particular area.
S.No. 51Area EnrolmentIndicator Proportion of enrolment of Muslim children to total enrolment at Primary levelUnit PercentagePurpose and Definition The indicator measures share of enrolment of Muslim children to total enrolment in Primary
classes.Calculation method, if unit is in percentage or ratio
Enrolment of Muslim children in Primary classes/Total enrolment in Primary classes *100
Interpretation A high value indicates higher share of Muslim in enrolment. Ideally value depend on share of Muslim population to the total population of the particular area.
Disaggregation By location and school managementLimitation and com-ments
Interpretation requires trend analysis of the underlying indicators and share of Muslim popula-tion of the particular area.
20
S.No. 52Area TeacherIndicator Number of teachersUnit NumberPurpose and Definition Number of teachers in schools which have any grades between 1 to 8. To show the strength of
the teaching force and involved in teachingCalculation method, if unit is in percentage or ratio
-
Interpretation -Disaggregation By management, gender, social groups and locationLimitation and com-ments
All type of teachers are included, however some states have not reported teachers who are on temporary basis. This indicator measures strength of teaching force rather than the effective-ness and quality of teaching.
S.No. 53Area TeacherIndicator Proportion of female teachers to total teachersUnit PercentagePurpose and Definition Purpose of this indicator is to show the gender composition of the teaching force. It defined as
proportion of female teachers expressed as a percentage of the total number of teachers (male and female).
Calculation method, if unit is in percentage or ratio
Number of female teachers/Number of total teachers (Male and female) *100
Interpretation Proportion of female teachers approaching 50% indicates gender parity in the composition of the teaching force. A value of greater than 50% reveals more opportunities and/or preference for women to participate in teaching activities .
Disaggregation By management and locationLimitation and com-ments
All type of teachers are included, however some states have not reported teachers who are on temporary basis. This indicator measures the level of gender representation in the teaching profession rather than the effectiveness and quality of teaching.
Limitation and com-ments
The indicator measures the existence of the availability of boundary wall in schools but not its quality or operational state.
S.No. 54Area TeacherIndicator Proportion of SC teachers to total teachersUnit PercentagePurpose and Definition Purpose of this indicator is to show the social group composition of the teaching force. It de-
fined as proportion of SC teachers expressed as a percentage of the total number of teachers (male and female).
Calculation method, if unit is in percentage or ratio
Number of teachers from SC social group/Number of total teachers (Male and female) *100
Interpretation Proportion of SC teachers approaching equal to share of SC population to total population indicates social parity in the composition of the teaching force. A value of greater value reveals more opportunities and/or preference for SC to participate in teaching activities .
Disaggregation By management and locationLimitation and com-ments
This indicator measures the level of social representation in the teaching profession rather than the effectiveness and quality of teaching.The indicator measures the existence of the availability of library in schools but not its quality or operational state.
21
S.No. 55Area TeacherIndicator Proportion of ST teachers to total teachersUnit PercentagePurpose and Definition Purpose of this indicator is to show the social group composition of the teaching force. It de-
fined as proportion of ST teachers expressed as a percentage of the total number of teachers (male and female).
Calculation method, if unit is in percentage or ratio
Number of teachers from ST social group/Number of total teachers (Male and female) *100
Interpretation Proportion of ST teachers approaching equal to share of ST population to total population indicates social parity in the composition of the teaching force. A value of greater value reveals more opportunities and/or preference for ST to participate in teaching activities .
Disaggregation By management and locationLimitation and com-ments
This indicator measures the level of social representation in the teaching profession rather than the effectiveness and quality of teaching.
S.No. 56Area TeacherIndicator Proportion of OBC teachers to total teachersUnit PercentagePurpose and Definition Purpose of this indicator is to show the social group composition of the teaching force. It de-
fined as proportion of OBC teachers expressed as a percentage of the total number of teachers (male and female).
Calculation method, if unit is in percentage or ratio
Number of teachers from OBC social group/Number of total teachers (Male and female) *100
Interpretation Proportion of OBC teachers approaching equal to share of OBC population to total population indicates social parity in the composition of the teaching force. A value of greater value reveals more opportunities and/or preference for OBC to participate in teaching activities .
Disaggregation By management and locationLimitation and com-ments
This indicator measures the level of social representation in the teaching profession rather than the effectiveness and quality of teaching.
S.No. 57Area TeacherIndicator Schools without female teacherUnit NumberPercentage The indicator measures share of enrolment of Muslim children to total enrolment in Primary
classes.Purpose and Definition Purpose of this indicator is to show the non availability of any female teacher. Schools do not
have any female teacher out of total teaching force.Calculation method, if unit is in percentage or ratio
Number of schools not having any female teacher/Number of schools *100
Interpretation A low value indicates that schools have female teachers in teaching force. Although there is no norms for availability of female teacher, however each school should have at least one female teacher specially in Upper primary level schools .
Disaggregation By management and location
Limitation and com-ments
All type of teachers are included, however some states have not reported teachers who are on temporary basis. This indicator measures the level of gender representation in the teaching profession rather than the effectiveness and quality of teaching.
22
S.No. 58Area TeacherIndicator Schools with single teacherUnit Number, PercentagePurpose and Definition Schools have only one teacher and purpose of this indicator is to show the non availability of
teachers in schools. As per RTE act Primary schools should have at least two teachers, if they have enrolment less than 60.
Calculation method, if unit is in percentage or ratio
Number of schools having single teacher/Number of schools *100
Interpretation Ideally value should be zero and a low value indicates that schools have good availability of teachers.
Disaggregation By management and locationLimitation and com-ments
All type of teachers are included, however some states have not reported teachers who are on temporary basis.
S.No. 59Area TeacherIndicator Teachers do not have professional qualificationUnit Number, PercentagePurpose and Definition Teachers who have not received the minimum organized pre-service teacher training required
for teaching as per the RTE act. To measure the proportion of teachers not trained in pedagogi-cal skills according to national standards and can not effectively teach and use the available instructional materials.
Calculation method, if unit is in percentage or ratio
Number of teachers who have not received the minimum organized pre-service teacher train-ing /Number of teachers *100
Interpretation Ideally value should zero and near to zero indicate that majority of the teaching force is trained and has the necessary pedagogical skills to teach and use the available instructional materials in an effective manner.
Disaggregation By management and locationLimitation and com-ments
This indicator does not take into account differences in teachers’ experiences and status, teach-ing methods, teaching materials and variations in classroom conditions -- all factors that also affect the quality of teaching/learning. It should be noted that some teachers without this for-mal training may have acquired equivalent pedagogical skills through professional experience.
S.No. 60Area TeacherIndicator Contractual teachersUnit Number, PercentagePurpose and Definition Teachers who are engaged by management on contractual services, which means they are not
regular / permanent.Calculation method, if unit is in percentage or ratio
Number of teachers on contract/Number of total teachers *100
Interpretation Ideally value should zero and near to zero indicate that majority of the teaching force is work-ing on regular service and high value shows that majority are on contract services.
Disaggregation By management and locationLimitation and com-ments
All type of teachers are included, however some states have not reported teachers who are on temporary basis.
23
S.No. 61Area TeacherIndicator Pupil Teacher Ratio (PTR)Unit RatioPurpose and Definition To measure the level of human resources input in terms of the number of teachers in relation
to the size of the pupil population. It defined as average number of pupils /students per teacher.Calculation method, if unit is in percentage or ratio
Total enrolment in Grade 1-8/ Total number of teachers in schools which have any grades between 1 to 8
Interpretation A high teacher pupil-ratio suggests that each teacher has to be responsible for a large number of pupils. In other words, the higher the pupil/teacher ratio, the lower the relative access of pu-pils to teachers. It is generally assumed that a low pupil-teacher ratio signifies smaller classes, which enables the teacher to pay more attention to individual students, which may in the long run result in a better performance of the pupils.
Disaggregation By management and locationLimitation and com-ments
All type of teachers are included, however some states have not reported teachers who are on temporary basis. This indicator does not take into account factors which could affect the quality of teaching/learning, such as differences in teachers’ qualifications, pedagogical train-ing, experiences and status, teaching methods, teaching materials and variations in classroom conditions.
S.No. 62Area TeacherIndicator Schools without requisite number of teachers as per RTE normsUnit Number, PercentagePurpose and Definition This indicator shows about non availability of teachers in schools as per the RTE act
Calculation method, if unit is in percentage or ratio
Number of schools without requisite number of teachers as per RTE norms/Number of schools*100
Interpretation Ideally value should be zero. A high value indicates that schools do not have number of teach-ers as the norms and standard mentioned in the schedule under sections 19 and 25 of the RTE act
Disaggregation By management and locationLimitation and com-ments
Number of schools without requisite number of teachers as per RTE norms has been calculated based on enrolment and number of teachers in each school.
S.No. 63Area TeacherIndicator Primary only schools having enrolment 150 and above and have Head TeacherUnit Number, PercentagePurpose and Definition This indicator shows about availability of the head teacher in Primary only schools, if enrol-
ment is 150 and aboveCalculation method, if unit is in percentage or ratio
Number of Primary only schools having enrolment 150 and above and have head teacher/Number of Primary only schools having enrolment 150 and above *100
Interpretation A high value indicates that schools have good access of availability of head teacher. Ideally each school should have head teacher as per the RTE act, if enrolment is 150 and above.
Disaggregation By management and locationLimitation and com-ments
This indicator does not take into account factors which could affect the quality of teaching/learning, such as differences in teachers’ qualifications, pedagogical training, experiences and status, teaching methods, teaching materials and variations in classroom conditions.
Limitation and com-ments
All type of teachers are included, however some states have not reported teachers who are on temporary basis. This indicator measures the level of gender representation in the teaching profession rather than the effectiveness and quality of teaching.
24
S.No. 64Area TeacherIndicator Upper Primary schools/section having Enrolment 100 and above and have Head TeacherUnit Number, PercentagePurpose and Definition This indicator shows about availability of the head teacher in Upper primary schools/section,
if enrolment is 100 and aboveCalculation method, if unit is in percentage or ratio
Number of Upper primary schools/section only schools having enrolment 100 and above and have head teacher/Number of Upper primary schools/section only schools having enrolment 100 and above *100
Interpretation A high value indicates that schools have good access of availability of head teacher. Ideally each school should have head teacher as per the RTE act, if enrolment is 150 and above.
Disaggregation By management and locationLimitation and com-ments
This indicator does not take into account factors which could affect the quality of teaching/learning, such as differences in teachers’ qualifications, pedagogical training, experiences and status, teaching methods, teaching materials and variations in classroom conditions.
S.No. 65Area TeacherIndicator Upper Primary schools/section with teacher who is graduate or more qualification in
MathematicsUnit Number, PercentagePurpose and Definition This indicator shows about availability of the teacher in Upper primary schools/section, who
is graduate or more qualification in MathematicsCalculation method, if unit is in percentage or ratio
Number of Upper primary schools/section with teacher who is graduate or more qualification in Mathematics /Number of Upper primary schools/section *100
Interpretation A high value indicates that schools have good access of availability of Mathematics teacher. Ideally each school should have Mathematics teacher as per the RTE act.
Disaggregation By management and locationLimitation and com-ments
This indicator does not take into account factors which could affect the quality of teaching/learning, such as differences in teachers’ qualifications, pedagogical training, experiences and status, teaching methods, teaching materials and variations in classroom conditions.
S.No. 66Area TeacherIndicator Upper Primary schools/section with teacher who is graduate or more qualification in
English/LanguageUnit Number, PercentagePurpose and Definition This indicator shows about availability of the teacher in Upper primary schools/section, who
is graduate or more qualification in English/LanguageCalculation method, if unit is in percentage or ratio
Number of Upper primary schools/section with teacher who is graduate or more qualification in English/Language/Number of Upper primary schools/section *100
Interpretation A high value indicates that schools have good access of availability of English/Language. Ide-ally each school should have English/Language teacher as per the RTE act.
Disaggregation By management and locationLimitation and com-ments
This indicator does not take into account factors which could affect the quality of teaching/learning, such as differences in teachers’ qualifications, pedagogical training, experiences and status, teaching methods, teaching materials and variations in classroom conditions.
25
S.No. 67Area TeacherIndicator Upper Primary schools/section with teacher who is graduate or more qualification in
Social studiesUnit Number, PercentagePurpose and Definition This indicator shows about availability of the teacher in Upper primary schools/section, who
is graduate or more qualification in Social studiesCalculation method, if unit is in percentage or ratio
Number of Upper primary schools/section with teacher who is graduate or more qualification in Social studies/Number of Upper primary schools/section *100
Interpretation A high value indicates that schools have good access of availability of Social studies teacher. Ideally each school should have Social studies teacher as per the RTE act.
Disaggregation By management and locationLimitation and com-ments
This indicator does not take into account factors which could affect the quality of teaching/learning, such as differences in teachers’ qualifications, pedagogical training, experiences and status, teaching methods, teaching materials and variations in classroom conditions.
S.No. 68Area School and facilitiesIndicator Schools with approachable roadUnit Number, PercentagePurpose and Definition The indicator measures accessibility of schools in all weather. All weather road means a mo-
torable pucca road reaching upto the locality in which the school is situated.Calculation method, if unit is in percentage or ratio
Number of schools with approachable road/Number of schools *100
Interpretation A high value indicates high degree of accessibility of schools from all weather road which is required for easy access of students.
Disaggregation By management and locationLimitation and com-ments
This indicator does not take into account quality of road and it is as reported by the head teacher.
S.No. 69Area EnrolmentIndicator Ratio of girls' to boys' in enrolment at in Upper primary classes (Grade 6-8)Unit RatioPurpose and Definition The indicator measures ratio of girls to boys enrolment in Upper primary classes.
Calculation method, if unit is in percentage or ratio
Enrolment of girls in Primary classes/Enrolment of boys in Upper primary classes
Interpretation A high value indicates less disparity in enrolment between boys and girls. Ideally value depend on sex ratio of the particular area.
Disaggregation By location and social groupsLimitation and com-ments
The ratio does not show whether improvement is due to the performance of one of the gender groups. Interpretation requires trend analysis of the underlying indicators.
26
S.No. 70Area EnrolmentIndicator Ratio of girls' to boys' in enrolment in Elementary classes (Grade 1-8)Unit RatioPurpose and Definition The indicator measures ratio of girls to boys enrolment in Elementary classes.Calculation method, if unit is in percentage or ratio
Enrolment of girls in Elementary classes/Enrolment of boys in Elementary classes
Interpretation A high value indicates less disparity in enrolment between boys and girls. Ideally value depend on sex ratio of the particular area.
Disaggregation By location and social groupsLimitation and com-ments
The ratio does not show whether improvement is due to the performance of one of the gender groups. Interpretation requires trend analysis of the underlying indicators
Limitation and com-ments
All type of teachers are included, however some states have not reported teachers who are on temporary basis. This indicator measures the level of gender representation in the teaching profession rather than the effectiveness and quality of teaching.
S.No. 71Area EnrolmentIndicator Proportion of enrolment of girls to total enrolment at Upper primary levelUnit PercentagePurpose and Definition The indicator measures share of girls to total enrolment in Upper primary classes.Calculation method, if unit is in percentage or ratio
Enrolment of girls in Upper primary classes/Total enrolment in Upper primary classes *100
Interpretation A high value indicates higher share of girls in enrolment. Ideally value depend on sex ratio of the particular area.
Disaggregation By location , school management and social groupsLimitation and com-ments
The proportion does not show whether improvement is due to the performance of one of the gender groups. Interpretation requires trend analysis of the underlying indicators and sex ratio of the particular area.
S.No. 72Area EnrolmentIndicator Proportion of enrolment of SC children to total enrolment at Upper primary levelUnit PercentagePurpose and Definition The indicator measures share of enrolment of SC children to total enrolment in Upper pri-
mary classes.Calculation method, if unit is in percentage or ratio
Enrolment of SC children in Upper primary classes/Total enrolment in Upper primary classes *100
Interpretation A high value indicates higher share of SC in enrolment. Ideally value depend on share of SC population to the total population of the particular area.
Disaggregation By location and school managementLimitation and com-ments
Interpretation requires trend analysis of the underlying indicators and share of SC population of the particular area.
27
S.No. 73Area EnrolmentIndicator Proportion of enrolment of ST children to total enrolment at Upper primary levelUnit PercentagePurpose and Definition The indicator measures share of enrolment of ST children to total enrolment in Upper primary
classes.Calculation method, if unit is in percentage or ratio
Enrolment of ST children in Upper primary classes/Total enrolment in Upper primary classes *100
Interpretation A high value indicates higher share of ST in enrolment. Ideally value depend on share of ST population to the total population of the particular area.
Disaggregation By location and school managementLimitation and com-ments
Interpretation requires trend analysis of the underlying indicators and share of ST population of the particular area.
S.No. 74Area EnrolmentIndicator Proportion of enrolment of OBC children to total enrolment at Upper primary levelUnit PercentagePurpose and Definition The indicator measures share of enrolment of OBC children to total enrolment in Upper
primary classes.Calculation method, if unit is in percentage or ratio
Enrolment of OBC children in Upper primary classes/Total enrolment in Upper primary class-es *100
Interpretation A high value indicates higher share of OBC in enrolment. Ideally value depend on share of OBC population to the total population of the particular area.
Disaggregation By location and school managementLimitation and com-ments
Interpretation requires trend analysis of the underlying indicators and share of OBC popula-tion of the particular area.
S.No. 75Area EnrolmentIndicator Proportion of enrolment of Muslim children to total enrolment at Upper primary levelUnit PercentagePurpose and Definition The indicator measures share of enrolment of Muslim children to total enrolment in Upper
primary classes.Calculation method, if unit is in percentage or ratio
Enrolment of Muslim children in Upper primary classes/Total enrolment in Upper primary classes *100
Interpretation A high value indicates higher share of Muslim in enrolment. Ideally value depend on share of Muslim population to the total population of the particular area.
Disaggregation By location and school managementLimitation and com-ments
Interpretation requires trend analysis of the underlying indicators and share of Muslim popula-tion of the particular area.
28
S.No. 76Area EnrolmentIndicator Proportion of enrolment of girls to total enrolment at Elementary levelUnit PercentagePurpose and Definition The indicator measures share of girls to total enrolment in Elementary classes.Calculation method, if unit is in percentage or ratio
Enrolment of girls in Elementary classes/Total enrolment in Elementary classes *100
Interpretation A high value indicates higher share of girls in enrolment. Ideally value depend on sex ratio of the particular area.
Disaggregation By location , school management and social groupsLimitation and com-ments
The proportion does not show whether improvement is due to the performance of one of the gender groups. Interpretation requires trend analysis of the underlying indicators and sex ratio of the particular area.
Limitation and com-ments
All type of teachers are included, however some states have not reported teachers who are on temporary basis. This indicator measures the level of gender representation in the teaching profession rather than the effectiveness and quality of teaching.
S.No. 77Area EnrolmentIndicator Proportion of enrolment of SC children to total enrolment at Elementary levelUnit PercentagePurpose and Definition The indicator measures share of enrolment of SC children to total enrolment in Elementary
classes.Calculation method, if unit is in percentage or ratio
Enrolment of SC children in Elementary classes/Total enrolment in Elementary classes *100
Interpretation A high value indicates higher share of SC in enrolment. Ideally value depend on share of SC population to the total population of the particular area.
Disaggregation By location and school managementLimitation and com-ments
Interpretation requires trend analysis of the underlying indicators and share of SC population of the particular area.
S.No. 78Area EnrolmentIndicator Proportion of enrolment of ST children to total enrolment at Elementary levelUnit PercentagePurpose and Definition The indicator measures share of enrolment of ST children to total enrolment in Elementary
classes.Calculation method, if unit is in percentage or ratio
Enrolment of ST children in Elementary classes/Total enrolment in Elementary classes *100
Interpretation A high value indicates higher share of ST in enrolment. Ideally value depend on share of ST population to the total population of the particular area.
Disaggregation By location and school managementLimitation and com-ments
Interpretation requires trend analysis of the underlying indicators and share of ST population of the particular area.
29
S.No. 79Area EnrolmentIndicator Proportion of enrolment of OBC children to total enrolment at Elementary levelUnit PercentagePurpose and Definition The indicator measures share of enrolment of OBC children to total enrolment in Elementary
classes.Calculation method, if unit is in percentage or ratio
Enrolment of OBC children in Elementary classes/Total enrolment in Elementary classes *100
Interpretation A high value indicates higher share of OBC in enrolment. Ideally value depend on share of OBC population to the total population of the particular area.
Disaggregation By location and school managementLimitation and com-ments
Interpretation requires trend analysis of the underlying indicators and share of OBC popula-tion of the particular area.
S.No. 80Area EnrolmentIndicator Proportion of enrolment of Muslim children to total enrolment at Elementary levelUnit PercentagePurpose and Definition The indicator measures share of enrolment of Muslim children to total enrolment in Elemen-
tary classes.Calculation method, if unit is in percentage or ratio
Enrolment of Muslim children in Elementary classes/Total enrolment in Elementary classes *100
Interpretation A high value indicates higher share of Muslim in enrolment. Ideally value depend on share of Muslim population to the total population of the particular area.
Disaggregation By location and school managementLimitation and com-ments
Interpretation requires trend analysis of the underlying indicators and share of Muslim popula-tion of the particular area.
S.No. 81Area OutcomeIndicator Schools comply with 10 RTE parametersUnit Number, PercentagePurpose and Definition The indicator measures compliance of RTE norms which are related to inputs (infrastructure
and teachers) as mentioned in the RTE act. This indicator is based on availability of 10 selected RTE Indicators. Availability of Ramp, Playground, Boundary Wall, Drinking Water, Boys Toi-let, Girls Toilet, SCR≤30 at Primary level, SCR ≤35 at Upper Primary level, one classroom for every teacher, Library, PTR≤30 at Primary level, PTR ≤35 at Upper Primary Level.
Calculation method, if unit is in percentage or ratio
Number of schools with Ramp, Playground, Boundary Wall, Drinking Water, Boys Toilet, Girls Toilet, SCR≤30 at Primary level, SCR ≤35 at Upper Primary level, one classroom for every teacher, Library, PTR≤30 at Primary level, PTR ≤35 at Upper Primary Level
Interpretation Ideally value should be 100%. A high value (near to 100%) indicates that schools are comply-ing RTE norms and low value (far from 100%) indicates that schools are not complying RTE norms.
Disaggregation By location and school managementLimitation and com-ments
The indicator measures the existence of the compliance of RTE norms in terms of infrastruc-ture but not its quality or operational state and in terms of teacher but not in terms of quality of teaching. School would be RTE compliant if schools have all 10 parameters, if it is missing any parameters then schools would not treated RTE compliance.
30
S.No. 82Area OutcomeIndicator Gross Enrolment Ratio at Primary levelUnit RatioPurpose and Definition The indicator measures participation of students at Primary level of education and defined as
the percentage of student enrolment at Primary level.Calculation method, if unit is in percentage or ratio
Enrolment at Primary level (Grade 1-5) of education/Total population in 6-10 years age group *100
Interpretation A high GER generally indicates a high degree of participation, whether the pupils belong to the official age group or not. A GER value approaching or exceeding 100% indicates that particu-lar administrative area is, in principle, able to accommodate all of its school-age population, but it does not indicate the proportion already enrolled. The achievement of a GER of 100% is therefore a necessary but not sufficient condition for enrolling all eligible children in school. When the GER exceeds 90% for a particular level of education, the aggregate number of plac-es for pupils is approaching the number required for universal access of the official age group. However, this is a meaningful interpretation only if one can expect the under-aged and over-aged enrolments to decline in the future to free places for pupils from the expected age group.
Disaggregation Gender and Social group (SC and ST only)Limitation and com-ments
Issue of age recording and availability of actual /projected population in particular age group. GER can exceed 100% due to the inclusion of over-aged and under-aged pupils/students be-cause of early or late entrants, and grade repetition. In this case, a rigorous interpretation of GER needs additional information to assess the extent of repetition, late entrants, etc.
S.No. 83Area OutcomeIndicator Gross Enrolment Ratio at Upper primary levelUnit RatioPurpose and Definition The indicator measures participation of students at Upper primary level of education and de-
fined as the percentage of student enrolment at Upper primary level.Calculation method, if unit is in percentage or ratio
Enrolment at Upper primary level (Grade 6-8) of education/Total population in 11-13 years age group *100
Interpretation A high GER generally indicates a high degree of participation, whether the pupils belong to the official age group or not. A GER value approaching or exceeding 100% indicates that particu-lar administrative area is, in principle, able to accommodate all of its school-age population, but it does not indicate the proportion already enrolled. The achievement of a GER of 100% is therefore a necessary but not sufficient condition for enrolling all eligible children in school. When the GER exceeds 90% for a particular level of education, the aggregate number of plac-es for pupils is approaching the number required for universal access of the official age group. However, this is a meaningful interpretation only if one can expect the under-aged and over-aged enrolments to decline in the future to free places for pupils from the expected age group.
Disaggregation Gender and Social group (SC and ST only)Limitation and com-ments
Issue of age recording and availability of actual /projected population in particular age group. GER can exceed 100% due to the inclusion of over-aged and under-aged pupils/students be-cause of early or late entrants, and grade repetition. In this case, a rigorous interpretation of GER needs additional information to assess the extent of repetition, late entrants, etc.
31
S.No. 84Area OutcomeIndicator Gross Enrolment Ratio at Elementary levelUnit RatioPurpose and Definition The indicator measures participation of students at Elementary level of education and defined
as the percentage of student enrolment at Elementary level.Calculation method, if unit is in percentage or ratio
Enrolment at Elementary level (Grade 1-8) of education/Total population in 6-13 years age group *100
Interpretation A high GER generally indicates a high degree of participation, whether the pupils belong to the official age group or not. A GER value approaching or exceeding 100% indicates that particu-lar administrative area is, in principle, able to accommodate all of its school-age population, but it does not indicate the proportion already enrolled. The achievement of a GER of 100% is therefore a necessary but not sufficient condition for enrolling all eligible children in school. When the GER exceeds 90% for a particular level of education, the aggregate number of plac-es for pupils is approaching the number required for universal access of the official age group. However, this is a meaningful interpretation only if one can expect the under-aged and over-aged enrolments to decline in the future to free places for pupils from the expected age group.
Disaggregation Gender and Social group (SC and ST only)Limitation and com-ments
Issue of age recording and availability of actual /projected population in particular age group. GER can exceed 100% due to the inclusion of over-aged and under-aged pupils/students be-cause of early or late entrants, and grade repetition. In this case, a rigorous interpretation of GER needs additional information to assess the extent of repetition, late entrants, etc.
S.No. 85Area OutcomeIndicator Net Enrolment Ratio at Primary levelUnit RatioPurpose and Definition To show the extent of coverage in Primary level of education of 6-10 years children . Enrol-
ment of the 6-10 years children for Primary level of education expressed as a percentage of the population.
Calculation method, if unit is in percentage or ratio
Enrolment of 6-10 years children at Primary level (Grade 1-5) of education/Total population in 6-10 years age group *100
Interpretation A high NER denotes a high degree of coverage in the age of 6-10 years population. The theo-retical maximum value is 100%. Increasing trends can be considered as reflecting improving coverage at the Primary level of education. If the NER is below 100%, then the complement, i.e. the difference with 100%, provides a measure of the proportion of children not enrolled at the Primary level of education. However, since some of these children could be enrolled at other levels of education, this difference should in no way be considered as indicating the percentage of students not enrolled.
Disaggregation GenderLimitation and com-ments
NER depend on age wise enrolment and population. Age of children has been taken is as per school records, which is submitted by parents and there may be issue of correct reporting. Actual /projected population age group is also major issue. Although the NER cannot exceed 100%, if values up to 100% have been obtained reflecting inconsistencies in the enrolment and/or population data due to the reference date for entry to Primary education does not co-incide with the birth dates of all of the cohort eligible to enrol at this level of education, a significant portion of the population starts Primary school earlier than the prescribed age and consequently finishes earlier as well. Value of more than 100% not shown in the data.
32
S.No. 86Area OutcomeIndicator Net Enrolment Ratio at Upper primary levelUnit RatioPurpose and Definition To show the extent of coverage in Upper primary level of education of 11-13 years children
. Enrolment of the 11-13 years children for Upper primary level of education expressed as a percentage of the population.
Calculation method, if unit is in percentage or ratio
Enrolment of 11-13 years children at Upper primary level (Grade 6-8) of education/Total population in 11-13 years age group *100
Interpretation A high NER denotes a high degree of coverage in the age of 11-13 years population. The theoretical maximum value is 100%. Increasing trends can be considered as reflecting improv-ing coverage at the Upper primary level of education. If the NER is below 100%, then the complement, i.e. the difference with 100%, provides a measure of the proportion of children not enrolled at the Upper primary level of education. However, since some of these children could be enrolled at other levels of education, this difference should in no way be considered as indicating the percentage of students not enrolled.
Disaggregation GenderLimitation and com-ments
NER depend on age wise enrolment and population. Age of children has been taken is as per school records, which is submitted by parents and there may be issue of correct reporting. Actual /projected population age group is also major issue. Although the NER cannot exceed 100%, if values up to 100% have been obtained reflecting inconsistencies in the enrolment and/or population data due to the reference date for entry to Upper primary education does not coincide with the birth dates of all of the cohort eligible to enrol at this level of education, a significant portion of the population starts Upper primary school earlier than the prescribed age and consequently finishes earlier as well. Value of more than 100% not shown in the data.
S.No. 87Area OutcomeIndicator Net Enrolment Ratio at Elementary levelUnit RatioPurpose and Definition To show the extent of coverage in Elementary level of education of 6-13 years children . Enrol-
ment of the 6-13 years children for Elementary level of education expressed as a percentage of the population.
Calculation method, if unit is in percentage or ratio
Enrolment of 6-13 years children at Elementary level (Grade 1-8) of education/Total popula-tion in 6-13 years age group *100
Interpretation A high NER denotes a high degree of coverage in the age of 6-13 years population. The theo-retical maximum value is 100%. Increasing trends can be considered as reflecting improving coverage at the Elementary level of education. If the NER is below 100%, then the comple-ment, i.e. the difference with 100%, provides a measure of the proportion of children not enrolled at the Elementary level of education. However, since some of these children could be enrolled at other levels of education, this difference should in no way be considered as indicat-ing the percentage of students not enrolled.
Disaggregation GenderLimitation and com-ments
NER depend on age wise enrolment and population. Age of children has been taken is as per school records, which is submitted by parents and there may be issue of correct reporting. Actual /projected population age group is also major issue. Although the NER cannot exceed 100%, if values up to 100% have been obtained reflecting inconsistencies in the enrolment and/or population data due to the reference date for entry to Elementary education does not coincide with the birth dates of all of the cohort eligible to enrol at this level of education, a significant portion of the population starts Elementary school earlier than the prescribed age and consequently finishes earlier as well. Value of more than 100% not shown in the data.
33
S.No. 88Area OutcomeIndicator Age Specific Enrolment Ratio for the age group of 6-10 yearsUnit RatioPurpose and Definition To show the extent of the educational participation of 6-10 years age cohort. Enrolment of
6-10 years children irrespective of the level of education, as a percentage of the 6-10 years population.
Calculation method, if unit is in percentage or ratio
Enrolment of 6-10 years children irrespective of the level of education/Total population in 6-10 years age group*100
Interpretation A high ASER denotes a high degree of educational participation of the 6-10 years age group. The theoretical maximum value is 100%. Increasing trends can be considered as reflecting improving participation of the 6-10 years age group. If the ASER is below 100%, then the complement, i.e. the difference with 100% provides a measure of the proportion of the popula-tion of the 6-10 years who are not enrolled.
Disaggregation GenderLimitation and com-ments
ASER depend on age wise enrolment and population. Age of children has been taken is as per school records, which is submitted by parents and there may be issue of correct reporting. Actual /projected population age group is also major issue. Although the ASER cannot exceed 100%, if values up to 100% have been obtained reflecting inconsistencies in the enrolment and/or population data due to the reference date for entry to Elementary education does not coincide with the birth dates of all of the cohort eligible to enrol at this level of education, a significant portion of the population starts Elementary school earlier than the prescribed age and consequently finishes earlier as well. Value of more than 100% not shown in the data.
S.No. 89Area OutcomeIndicator Age Specific Enrolment Ratio for the age group of 11-13 yearsUnit RatioPurpose and Definition To show the extent of the educational participation of 11-13 years age cohort. Enrolment of
11-13 years children irrespective of the level of education, as a percentage of the 11-13 years population.
Calculation method, if unit is in percentage or ratio
Enrolment of 11-13 years children irrespective of the level of education/Total population in 11-13 years age group*100
Interpretation A high ASER denotes a high degree of educational participation of the 11-13 years age group. The theoretical maximum value is 100%. Increasing trends can be considered as reflecting improving participation of the 11-13 years age group. If the ASER is below 100%, then the complement, i.e. the difference with 100% provides a measure of the proportion of the popula-tion of the 11-13 years who are not enrolled.
Disaggregation GenderLimitation and com-ments
ASER depend on age wise enrolment and population. Age of children has been taken is as per school records, which is submitted by parents and there may be issue of correct reporting. Actual /projected population age group is also major issue. Although the ASER cannot exceed 100%, if values up to 100% have been obtained reflecting inconsistencies in the enrolment and/or population data due to the reference date for entry to Elementary education does not coincide with the birth dates of all of the cohort eligible to enrol at this level of education, a significant portion of the population starts Elementary school earlier than the prescribed age and consequently finishes earlier as well. Value of more than 100% not shown in the data.
34
S.No. 90Area OutcomeIndicator Age Specific Enrolment Ratio for the age group of 6-13 yearsUnit RatioPurpose and Definition To show the extent of the educational participation of 6-13 years age cohort. Enrolment of
6-13 years children irrespective of the level of education, as a percentage of the 6-13 years population.
Calculation method, if unit is in percentage or ratio
Enrolment of 6-13 years children irrespective of the level of education/Total population in 6-13 years age group*100
Interpretation A high ASER denotes a high degree of educational participation of the 6-13 years age group. The theoretical maximum value is 100%. Increasing trends can be considered as reflecting improving participation of the 6-13 years age group. If the ASER is below 100%, then the complement, i.e. the difference with 100% provides a measure of the proportion of the popula-tion of the 6-13 years who are not enrolled.
Disaggregation GenderLimitation and com-ments
ASER depend on age wise enrolment and population. Age of children has been taken is as per school records, which is submitted by parents and there may be issue of correct reporting. Actual /projected population age group is also major issue. Although the ASER cannot exceed 100%, if values up to 100% have been obtained reflecting inconsistencies in the enrolment and/or population data due to the reference date for entry to Elementary education does not coincide with the birth dates of all of the cohort eligible to enrol at this level of education, a significant portion of the population starts Elementary school earlier than the prescribed age and consequently finishes earlier as well. Value of more than 100% not shown in the data.
S.No. 91Area OutcomeIndicator Annual Average Dropout rate at Primary levelUnit PercentagePurpose and Definition Proportion of pupils from a cohort enrolled in Primary level (grade 1 -5) at a given school year
who are no longer enrolled in the grade 2-6 in the following school year. The number of pupils (or students) admitted in the grade-2 to 6 in a given year, expressed as a percentage of the number of pupils (or students) enrolled in the Primary level (grade1 to5) in the previous year. Purpose of this indicator is to measure the phenomenon of pupils from a cohort leaving school without completion and its effect on the internal efficiency of educational systems
Calculation method, if unit is in percentage or ratio
((Number of pupils enrolled in the grade-2 to 6 year t+1)-(Number of pupils enrolled in the grade-1 to 5 year t)-((Number of pupils repeating in the grade 1 year t+1)-(Number of pupils repeating in the grade 6 year t+1)) )/(Number of pupils enrolled in th
Interpretation High dropout rates indicate a high level of phenomenon of pupils from a cohort leaving school without completion of grades.
Disaggregation By Gender and Social groupLimitation and com-ments
This indicator can be distorted by incorrect distinction between new entrants and repeaters. Students who interrupted their studies for one or more years after having completed the pri-mary, together with the migrant students, or change in number of schools from one level to another level, could also affect the quality of this indicator and value may go less than zero, which is not possible theoretically.
35
S.No. 92Area OutcomeIndicator Annual Average Dropout rate at Upper primary levelUnit PercentagePurpose and Definition Proportion of pupils from a cohort enrolled in Upper primary level (grade 6 -8) at a given
school year who are no longer enrolled in the grade 7-9 in the following school year. The number of pupils (or students) admitted in the grade-7 to 9 in a given year, expressed as a percentage of the number of pupils (or students) enrolled in the Upper primary level (grade 6 to 8) in the previous year. Purpose of this indicator is to measure the phenomenon of pupils from a cohort leaving school without completion and its effect on the internal efficiency of educational systems
Calculation method, if unit is in percentage or ratio
((Number of pupils enrolled in the grade-7 to 9 year t+1)-(Number of pupils enrolled in the grade-6 to 8 year t)-((Number of pupils repeating in the grade 6 year t+1)-(Number of pupils repeating in the grade 9 year t+1)) )/(Number of pupils enrolled in th
Interpretation High dropout rates indicate a high level of phenomenon of pupils from a cohort leaving school without completion of grades.
Disaggregation By Gender and Social groupLimitation and com-ments
This indicator can be distorted by incorrect distinction between new entrants and repeaters. Students who interrupted their studies for one or more years after having completed the pri-mary, together with the migrant students, or change in number of schools from one level to another level, could also affect the quality of this indicator and value may go less than zero, which is not possible theoretically.
S.No. 93Area OutcomeIndicator Transition rate, Primary to Upper primary levelUnit PercentagePurpose and Definition The number of pupils (or students) admitted in the grade-6 in a given year, expressed as a
percentage of the number of pupils (or students) enrolled in the grade-5 in the previous year. Purpose of this indicator is to convey information on the degree of access or transition from Primary level to Upper primary level. Viewed from the Primary level , it is considered as an output indicator, viewed from the Upper primary level, it constitutes an indicator of access.
Calculation method, if unit is in percentage or ratio
((Number of pupils enrolled in the grade-6 in year t+1)-(Number of pupils repeating in the grade-6 in year t+1)) /(Number of pupils enrolled in the grade-5 in year t)*100
Interpretation High transition rates indicate a high level of access or transition from Primary level to the Up-per primary level. They also reflect the intake capacity of the Upper primary level. Inversely, low transition rates can signal problems in the bridging between Primary and Upper primary level, due to either deficiencies in the examination system, or inadequate admission capacity in the Upper primary level, or both.
Disaggregation By Gender and Social groupLimitation and com-ments
This indicator can be distorted by incorrect distinction between new entrants and repeaters, especially in the grade-6. Students who interrupted their studies for one or more years after having completed the Primary level, together with the migrant students, could also affect the quality of this indicator. Quality of indicator also depends on the consistency of data on enrol-ment and repeaters in term of coverage over time and across grades. and value may go more than 100, which is not possible theoretically
36
S.No. 94Area OutcomeIndicator Transition rate, Elementary to Secondary levelUnit PercentagePurpose and Definition The number of pupils (or students) admitted in the grade-9 in a given year, expressed as a
percentage of the number of pupils (or students) enrolled in the grade-8 in the previous year. Purpose of this indicator is to convey information on the degree of access or transition from Upper primary level to secondary level. Viewed from the Upper primary level , it is considered as an output indicator, viewed from the secondary level, it constitutes an indicator of access.
Calculation method, if unit is in percentage or ratio
((Number of pupils enrolled in the grade-9 in year t+1)-(Number of pupils repeating in the grade-9 in year t+1)) /(Number of pupils enrolled in the grade-8 in year t)*100
Interpretation High transition rates indicate a high level of access or transition from Upper primary level to the secondary level. They also reflect the intake capacity of the secondary level. Inversely, low transition rates can signal problems in the bridging between Upper primary and secondary level, due to either deficiencies in the examination system, or inadequate admission capacity in the Upper primary level, or both.
Disaggregation By Gender and Social groupLimitation and com-ments
This indicator can be distorted by incorrect distinction between new entrants and repeaters, especially in the grade-9. Students who interrupted their studies for one or more years after having completed the Primary level, together with the migrant students, could also affect the quality of this indicator. Quality of indicator also depends on the consistency of data on enrol-ment and repeaters in term of coverage over time and across grades. and value may go more than 100, which is not possible theoretically
S.No. 95Area OutcomeIndicator Retention rate at Primary levelUnit PercentagePurpose and Definition To measure the retention capacity of an education system and It illustrates the situation regard-
ing retention of pupils (or students) at primary level, and conversely the magnitude of dropout Percentage of a cohort of pupils (or students) enrolled in the grade-1 in given school year t, who are expected to reach successive grades.
Calculation method, if unit is in percentage or ratio
((Number of pupils enrolled in the grade-5 in year t)-(Number of pupils repeating in the grade-5 in year t)) /(Number of pupils enrolled in the grade-1 in year t-4)*100
Interpretation Rates approaching 100% indicate a high level of retention and low incidence of dropoutDisaggregation By Gender and Social groupLimitation and com-ments
Since the calculation of this indicator is based on enrolment data hence depends on consis-tency of data on enrolment and repeaters in term of coverage over time and across grades.
S.No. 96Area OutcomeIndicator Retention rate at Elementary levelUnit PercentagePurpose and Definition To measure the retention capacity of an education system and It illustrates the situation re-
garding retention of pupils (or students) at Elementary level, and conversely the magnitude of dropout. Enrolment in Grade VIII (minus repeaters) in a year as a proportion to enrolment in Grade I seven years back is termed as retention rate at the Elementary level.
Calculation method, if unit is in percentage or ratio
((Number of pupils enrolled in the grade-8 in year t)-(Number of pupils repeating in the grade-8 in year t)) /(Number of pupils enrolled in the grade-1 in year t-7)*100
Interpretation Rates approaching 100% indicate a high level of retention and low incidence of dropoutDisaggregation By Gender and Social groupLimitation and com-ments
Since the calculation of this indicator is based on enrolment data hence depends on consis-tency of data on enrolment and repeaters in term of coverage over time and across grades.
37
S.No. 97Area OutcomeIndicator Gender Parity Index in GER at Elementary levelUnit RatioPurpose and Definition The GPI measures progress towards gender parity in education participation available for
women in relation to those available to men. It also reflects the level of women’s empower-ment in society.
Calculation method, if unit is in percentage or ratio
GER for female at Elementary level/GER for male at Elementary level
Interpretation A GPI equal to 1 indicates parity between females and males. In general, a value less than 1 indicates disparity in favour of boys and a value greater than 1 indicates disparity in favour of girls.
Disaggregation Social groups (SC and ST only)Limitation and com-ments
The index does not show whether improvement or regression is due to the performance of one of the gender groups. Interpretation requires trend analysis of the underlying indicators.
39
Secondary level
40
41
S.No. 1Area School and facilitiesIndicator Number of schoolsUnit NumberPurpose and Definition Number of schools having any grades between 9 to 12Calculation method, if unit is in percentage or ratio
-
Interpretation -Disaggregation By management and locationLimitation and com-ments
Schools reported in the U-DISE system. Despite significant increase in number of schools in U-DISE , a few schools (mostly unrecognized) are yet be covered. Although this number is very small but it vary from state to state.
S.No. 2Area School and facilitiesIndicator Proportion of Government schools to total schoolsUnit PercentagePurpose and Definition The indicator measures share of government schools to total schools
Calculation method, if unit is in percentage or ratio
Number of schools managed by Government / Number of schools *100
Interpretation A high value indicates that students have good access of government schools.Disaggregation By locationLimitation and com-ments
A few schools (mostly unrecognized) are yet be covered and it vary from administrative area to administrative area hence interpretation should be made very carefully.
S.No. 3Area School and facilitiesIndicator Ratio of upper Higher Secondary schools/section to secondary schools/sectionUnit RatioPurpose and Definition The indicator measures availability of Secondary schooling facility as compared to Upper
Higher Secondary schooling facility.Calculation method, if unit is in percentage or ratio
Number of Secondary schools/sections/Number of Upper Higher Secondary schools/sections
Interpretation A low value (Less than 3) indicates that particular administrative area have good access of Secondary schooling facility and More than 3 value indicates that particular administrative area required Secondary schooling facility as compared to Upper Higher Secondary schooling facility.
Disaggregation By locationLimitation and com-ments
-
42
S.No. 4Area School and facilitiesIndicator Schools with BuildingUnit NumberPercentage Number of schools having any grades between 9 to 12Purpose and Definition The indicator measures access to building facility in schools, which is necessary to ensure a
safe and effective learning environment for all students. Schools having either Government, rented, private rent free, dilapidated or under construction building are defined as schools with building
Calculation method, if unit is in percentage or ratio
Number of schools with building / Number of schools *100
Interpretation A high value indicates that schools have good access to the building facility. Ideally each school should have access to building facility .
Disaggregation By management and location
Limitation and comments
The indicator measures the existence of the availability of building in schools but not its quality or operational state.
S.No. 5Area School and facilitiesIndicator Schools with Head Master roomUnit Number, PercentagePurpose and Definition The indicator measures access to Head Master room facility in schools, which is necessary to
ensure a safe and effective learning environment for all students.Calculation method, if unit is in percentage or ratio
Number of schools with Head Master room / Number of schools *100
Interpretation A high value indicates that schools have good access to the Head Master room facility. Ideally each school should have access to Head Master room facility , which can be also used for of-fice and store purpose.
Disaggregation By management and locationLimitation and com-ments
The indicator measures the existence of the availability of Head Master room in schools but not its quality or operational state and it may be used for other purposes such as office or store.
S.No. 6Area School and facilitiesIndicator Schools with RampUnit Number, PercentagePurpose and Definition Number of schools with ramp / Number of schools *100
Calculation method, if unit is in percentage or ratio
A high value indicates that schools have good access to the ramp facility. Ideally each school should have access to ramp facility as per the RTE act.
Interpretation By management and locationDisaggregation The indicator measures the existence of the availability of ramp in schools but not its quality
or operational state.Limitation and com-ments
The indicator measures the existence of the availability of ramp in schools but not its quality or operational state.
43
S.No. 7Area School and facilitiesIndicator Schools with Separate toilet for boysUnit NumberPercentage Number of schools having any grades between 9 to 12Purpose and Definition Number of schools (Coeducation and only for boys) with separate toilet for boys / Number of
schools (Coeducation and only for boys) *100
Calculation method, if unit is in percentage or ratio
A high value indicates that schools have good access to the separate toilet for boys facility. Ideally each school should have access to one classroom for every teacher as per the RTE act.
Interpretation By management and locationDisaggregation The indicator measures the existence of separate toilet for boys in schools but not its quality
or operational state.Limitation and com-ments
The indicator measures the existence of separate toilet for boys in schools but not its quality or operational state.
S.No. 8Area School and facilitiesIndicator Schools with Separate toilet for girlsUnit Number, PercentagePurpose and Definition Number of schools (Coeducation and only for girls) with separate toilet for girls / Number of
schools (Coeducation and only for girls) *100Calculation method, if unit is in percentage or ratio
A high value indicates that schools have good access to the separate toilet for girls facility. Ideally each school should have access to separate toilet for girls facility as per the RTE act.
Interpretation By management and locationDisaggregation The indicator measures the existence of the availability of separate toilet for girls in schools
but not its quality or operational state.Limitation and com-ments
The indicator measures the existence of separate toilet for girls in schools but not its quality or operational state.
S.No. 9Area School and facilitiesIndicator Schools with Drinking WaterUnit Number, PercentagePurpose and Definition Number of schools with drinking water / Number of schools *100
Calculation method, if unit is in percentage or ratio
A high value indicates that schools have good access to the drinking water facility. Ideally each school should have access to drinking water facility as per the RTE act.
Interpretation By management and locationDisaggregation The indicator measures the existence of the availability of drinking water in schools but not
its quality or operational state or availability throughout the academic year.Limitation and com-ments
The indicator measures the existence of the availability of drinking water in schools but not its quality or operational state or availability throughout the academic year.
44
S.No. 10Area School and facilitiesIndicator Schools with three WASH facilities (Toilet, Drinking Water and Handwashing facilities)Unit Number, PercentagePurpose and Definition The indicator measures access to combination of three WASH facilities (Separate toilet for
boys , Separate toilet for girls and drinking water facility) in schools, which is necessary to ensure a safe and effective learning environment for all students. Facilities are defined in ear-lier indicators
Calculation method, if unit is in percentage or ratio
Number of schools with Separate toilet for boys and Separate toilet for girls and drinking water / Number of schools *100
Interpretation A high value indicates that schools have good access to the drinking water facility.Disaggregation By management and locationLimitation and com-ments
The indicator measures the existence of the availability of all three facilities in schools but not its quality or operational state.
Limitation and com-ments
The indicator measures the existence of the availability of building in schools but not its qual-ity or operational state.
S.No. 11Area School and facilitiesIndicator Schools with functional separate toilet for girlsUnit Number, PercentagePurpose and Definition The indicator measures access to functional separate toilet for girls facility in schools (Coedu-
cation and only for girls), which is necessary to ensure a safe and effective learning environ-ment for all students. Functional Toilet can be defined as the one with minimal odour, unbroken seat, regularly cleaned and dry, working drainage system, accessible to users, closable door.
Calculation method, if unit is in percentage or ratio
Number of schools (Coeducation and only for girls) with functional separate toilet for girls / Number of schools (Coeducation and only for girls) *100
Interpretation A high value indicates that schools have good access to the functional separate toilet for girls facility.
Disaggregation By management and locationLimitation and com-ments
The indicator measures the existence of the availability of functional separate toilet for girls in schools as reported by the head teacher but not its quality .
S.No. 12Area School and facilitiesIndicator Schools with functional drinking waterUnit Number, PercentagePurpose and Definition The indicator measures access to functional drinking water facility in schools, which is nec-
essary to ensure a safe and effective learning environment for all students. Schools having drinking water facility through handpump or tap or well or other source are defined as schools with drinking water. The functionality of the drinking water can be derived if the source is ac-cessible to the school and also provision has been made to bring and store water in the school without involving the children.
Calculation method, if unit is in percentage or ratio
Number of schools with functional drinking water / Number of schools *100
Interpretation A high value indicates that schools have good access to the functional drinking water facility.Disaggregation By management and locationLimitation and com-ments
The indicator measures the existence of the availability of drinking water in schools but not its quality or operational state or availability throughout the academic year.
45
S.No. 13Area School and facilitiesIndicator Schools with Children With Special Needs (CWSN) friendly toiletUnit Number, PercentagePurpose and Definition The indicator measures access to Children With Special Needs (CWSN) friendly toilet in
schools, which is necessary to ensure a safe and effective learning environment for all students.Calculation method, if unit is in percentage or ratio
Number of schools with Children With Special Needs (CWSN) friendly toilet / Number of schools *100
Interpretation A high value indicates that schools have good access to the Children With Special Needs (CWSN) friendly toilet . Ideally each school should have access to Children With Special Needs (CWSN) friendly toilet.
Disaggregation By management and locationLimitation and com-ments
The indicator measures the existence of the availability of Children With Special Needs (CWSN) friendly toilet in schools but not its quality or operational state or availability throughout the academic year.
Limitation and com-ments
The indicator measures the existence of separate toilet for boys in schools but not its quality or operational state.
S.No. 14Area School and facilitiesIndicator Schools with functional separate toilet for boysUnit Number, PercentagePurpose and Definition The indicator measures access to functional separate toilet for boys facility in schools (Coedu-
cation and only for boys), which is necessary to ensure a safe and effective learning environ-ment for all students. Functional Toilet can be defined as the one with minimal odour, unbroken seat, regularly cleaned and dry, working drainage system, accessible to users, closable door.
Calculation method, if unit is in percentage or ratio
Number of schools (Coeducation and only for boys) with functional separate toilet for boys / Number of schools (Coeducation and only for boys) *100
Interpretation A high value indicates that schools have good access to the functional separate toilet for boys facility.
Disaggregation By management and locationLimitation and com-ments
The indicator measures the existence of functional separate toilet for boys in schools as re-ported by the head teacher but not its quality .
S.No. 15Area School and facilitiesIndicator Schools with Boundary WallUnit Number, PercentagePurpose and Definition The indicator measures access to boundary wall facility in schools , which is necessary to
ensure a safe and effective learning environment for all students. Schools having Pucca, Puc-ca but broken, barbed wire fencing, Hedges , others and Partial are defined as schools with boundary wall.
Calculation method, if unit is in percentage or ratio
Number of schools with boundary wall / Number of schools *100
Interpretation A high value indicates that schools have good access to the boundary wall facility. Ideally each school should have access to boundary wall facility .
Disaggregation By management and locationLimitation and com-ments
The indicator measures the existence of the availability of boundary wall in schools but not its quality or operational state.
46
S.No. 16Area School and facilitiesIndicator Schools with PlaygroundUnit Number, PercentagePurpose and Definition The indicator measures access to playground facility in schools, which is necessary to ensure
a safe and effective learning environment for all students.Calculation method, if unit is in percentage or ratio
Number of schools with playground / Number of schools *100
Interpretation A high value indicates that schools have good access to the playground facility. Ideally each school should have access to playground facility.
Disaggregation By management and locationLimitation and com-ments
The indicator measures the existence of the availability of playground in schools but not its quality or operational state.
Limitation and com-ments
The indicator measures the existence of the availability of building in schools but not its qual-ity or operational state.
S.No. 17Area School and facilitiesIndicator Schools with 4 or more urinalsUnit Number, PercentagePurpose and Definition The indicator measures access to 4 or more urinals facility in schools, which is necessary to
ensure a safe and effective learning environment for all students.Calculation method, if unit is in percentage or ratio
Number of schools with 4 or more urinals / Number of schools *100
Interpretation A high value indicates that schools have good access to the 4 or more urinals facility.Disaggregation By management and locationLimitation and com-ments
The indicator measures the existence of the availability of 4 or more urinals in schools but not its quality or operational state.
S.No. 18Area School and facilitiesIndicator Number of classroomsUnit NumberPurpose and Definition The indicator measures access to classroom used for instructional purposes in schools , which
is necessary to ensure a safe and effective learning environment for all students. Classrooms are defined either they are pucca, partially pucca , kuccha classrooms or tent.
Calculation method, if unit is in percentage or ratio
-
Interpretation -Disaggregation By management and locationLimitation and com-ments
The indicator measures the existence of classrooms in schools but not its quality or opera-tional state.
47
S.No. 19Area School and facilitiesIndicator Student Classroom Ratio (SCR)Unit RatioPurpose and Definition The indicator measures access to classroom in schools, which is necessary to ensure a safe
and effective learning environment for all students. Average number of students per classroom in schools in a given school year.
Calculation method, if unit is in percentage or ratio
Number of students/Number of classrooms
Interpretation A low value indicates that schools have good access to the good status of classrooms. Ideally there should be one classroom for every teacher and this indicator should be analysed with schools with one classroom for every teacher.
Disaggregation By management and locationLimitation and com-ments
The indicator is based on number of classrooms for instructional purpose and enrolment but not its operational state. There may be more classrooms in schools which are not used for instructional purpose.
Limitation and com-ments
The indicator measures the existence of separate toilet for boys in schools but not its quality or operational state.
S.No. 20Area School and facilitiesIndicator Schools with libraryUnit Number, PercentagePurpose and Definition The indicator measures access to library facility in schools , which is necessary to ensure a
safe and effective learning environment for all students. Library facility defined as availability of books.
Calculation method, if unit is in percentage or ratio
Number of schools with library / Number of schools *100
Interpretation A high value indicates that schools have good access to the library facility. Ideally each school should have access to library facility .
Disaggregation By management and locationLimitation and com-ments
The indicator measures the existence of the availability of library in schools but not its quality or operational state.
S.No. 21Area School and facilitiesIndicator Schools with cocurricular and activity roomUnit Number, PercentagePurpose and Definition The indicator measures access to cocurricular and activity room facility in schools , which is
necessary to ensure a safe and effective learning environment for all students. cocurricular and activity room facility defined as availability of books.
Calculation method, if unit is in percentage or ratio
Number of schools with cocurricular and activity room / Number of schools *100
Interpretation A high value indicates that schools have good access to the cocurricular and activity room facility. Ideally each school should have access to cocurricular and activity room facility .
Disaggregation By management and locationLimitation and com-ments
The indicator measures the existence of the availability of cocurricular and activity room in schools but not its quality or operational state.
48
S.No. 22Area School and facilitiesIndicator Schools with Arts and craft activity roomUnit Number, PercentagePurpose and Definition The indicator measures access to Arts and craft activity room facility in schools , which is
necessary to ensure a safe and effective learning environment for all students. Arts and craft activity room facility defined as availability of books.
Calculation method, if unit is in percentage or ratio
Number of schools with Arts and craft activity room / Number of schools *100
Interpretation A high value indicates that schools have good access to the Arts and craft activity room facil-ity. Ideally each school should have access to Arts and craft activity room facility .
Disaggregation By management and locationLimitation and com-ments
The indicator measures the existence of the availability of Arts and craft activity room in schools but not its quality or operational state.
Limitation and com-ments
The indicator measures the existence of the availability of building in schools but not its qual-ity or operational state.
S.No. 23Area School and facilitiesIndicator Schools with library roomUnit Number, PercentagePurpose and Definition The indicator measures access to library room facility in schools , which is necessary to en-
sure a safe and effective learning environment for all students. library room facility defined as availability of books.
Calculation method, if unit is in percentage or ratio
Number of schools with library room / Number of schools *100
Interpretation A high value indicates that schools have good access to the library room facility. Ideally each school should have access to library room facility .
Disaggregation By management and locationLimitation and com-ments
The indicator measures the existence of the availability of library room in schools but not its quality or operational state.
S.No. 24Area School and facilitiesIndicator Schools with integrated science lab (Only for Secondary)Unit Number, PercentagePurpose and Definition The indicator measures access to integrated science lab facility in schools , which is neces-
sary to ensure a safe and effective learning environment for all students. integrated science lab facility defined as availability of books.
Calculation method, if unit is in percentage or ratio
Number of schools with integrated science lab (Only Secondary) / Number of schools (Only Secondary)*100
Interpretation A high value indicates that schools have good access to the integrated science lab facility. Ide-ally each school should have access to integrated science lab facility .
Disaggregation By management and locationLimitation and com-ments
The indicator measures the existence of the availability of integrated science lab in schools but not its quality or operational state.
49
S.No. 25Area School and facilitiesIndicator Schools with ICT labUnit Number, PercentagePurpose and Definition The indicator measures access to ICT lab facility in schools , which is necessary to ensure a
safe and effective learning environment for all students. ICT lab facility defined as availability of books.
Calculation method, if unit is in percentage or ratio
Number of schools with ICT lab / Number of schools *100
Interpretation A high value indicates that schools have good access to the ICT lab facility. Ideally each school should have access to ICT lab facility .
Disaggregation By management and locationLimitation and com-ments
The indicator measures the existence of the availability of ICT lab in schools but not its qual-ity or operational state.
Limitation and com-ments
The indicator measures the existence of separate toilet for boys in schools but not its quality or operational state.
S.No. 26Area School and facilitiesIndicator Schools with computer and internet facilityUnit Number, PercentagePurpose and Definition The indicator measures access to computer and internet facility in schools , which is neces-
sary to ensure a safe and effective learning environment for all students. Calculation method, if unit is in percentage or ratio
Number of schools with computer and internet / Number of schools *100
Interpretation A high value indicates that schools have good access to the computer and internet facility. Ideally each school should have access to computer and internet facility .
Disaggregation By management and locationLimitation and com-ments
The indicator measures the existence of the availability of computer and internet in schools but not its quality or operational state.
S.No. 27Area School and facilitiesIndicator Schools with Electricity connectionUnit Number, PercentagePurpose and Definition The indicator measures access to electricity connection facility in schools, which is necessary
to ensure a safe and effective learning environment for all students.Calculation method, if unit is in percentage or ratio
Number of schools with electricity connection / Number of schools *100
Interpretation A high value indicates that schools have good access to the electricity connection facility. Ide-ally each school should have access to electricity connection facility.
Disaggregation By management and locationLimitation and com-ments
The indicator measures the existence of the availability of electricity connection in schools but not its operational state.
50
S.No. 28Area School and facilitiesIndicator Schools with handwashing facility near toilet/urinalsUnit Number, PercentagePurpose and Definition The indicator measures access to handwashing facility near toilet/urinals facility in schools ,
which is necessary to ensure a safe and effective learning environment for all students. Calculation method, if unit is in percentage or ratio
Number of schools with handwashing facility near toilet/urinals / Number of schools *100
Interpretation A high value indicates that schools have good access to the handwashing facility near toilet/urinals facility. Ideally each school should have access to handwashing facility near toilet/urinals facility .
Disaggregation By management and locationLimitation and com-ments
The indicator measures the existence of the availability of handwashing facility near toilet/urinals in schools but not its quality or operational state.
Limitation and com-ments
The indicator measures the existence of the availability of building in schools but not its qual-ity or operational state.
S.No. 29Area School and facilitiesIndicator Schools with functional computerUnit Number, PercentagePurpose and Definition The indicator measures access to functional computer in schools for teaching and learning
purposes, which is necessary to ensure a safe and effective learning environment for all stu-dents. Functional computer defined as computers are in working condition.
Calculation method, if unit is in percentage or ratio
Number of schools with functional computer / Number of schools *100
Interpretation A high value indicates that schools have good access to the functional computer.Disaggregation By management and locationLimitation and com-ments
The indicator measures the existence of the availability of functional computer in schools but not its quality.
S.No. 30Area School and facilitiesIndicator Schools conducted medical check-up of students previous yearUnit Number, PercentagePurpose and Definition To ensure good health of school children the Health department conducts medical check-up
under School Health Programme every year, which includes Higher Secondary health check-up to providing super specialty treatment if necessary. The indicator measures whether medi-cal check-up conducted in schools or not in previous academic year.
Calculation method, if unit is in percentage or ratio
Number of schools conducted medical check-up / Number of schools *100
Interpretation A high value indicates that schools have good access of medical check-up.Disaggregation By management and locationLimitation and com-ments
The indicator measures the existence of the status of medical check-up in schools but not its quality nor number of students benefitted.
51
S.No. 31Area School and facilitiesIndicator Schools with furniture (table/desk) for all students in Secondary sectionUnit Number PercentagePurpose and Definition The indicator measures access to furniture facility for students in Secondary section, which is
necessary to ensure a safe and effective learning environment for all students.Calculation method, if unit is in percentage or ratio
Number of Secondary schools/section with furniture / Number of Secondary schools/section *100
Interpretation A high value indicates that schools have good access to the furniture facility.Disaggregation By management and locationLimitation and com-ments
The indicator measures the existence of the availability of furniture in schools but not its type of furniture, quality or operational state.
Limitation and com-ments
The indicator measures the existence of separate toilet for boys in schools but not its quality or operational state.
S.No. 32Area School and facilitiesIndicator Schools with furniture (table/desk) for all students in Higher Secondary sectionUnit Number, PercentagePurpose and Definition The indicator measures access to furniture facility for students in Higher secondary section,
which is necessary to ensure a safe and effective learning environment for all students.Calculation method, if unit is in percentage or ratio
Number of Higher Secondary schools/section with furniture / Number of Higher Secondary schools/section *100
Interpretation A high value indicates that schools have good access to the furniture facility.Disaggregation By management and locationLimitation and com-ments
The indicator measures the existence of the availability of furniture in schools but not its type of furniture, quality or operational state.
S.No. 33Area School and facilitiesIndicator Schools constituted School Development Management Committee (SDMC)Unit Number, PercentagePurpose and Definition The indicator measures constitution of School Development Management Committee (SDMC)
in Govt and Govt aided schools during last academic year, which is necessary to ensure a safe and effective learning environment for all students as per the RTE act.
Calculation method, if unit is in percentage or ratio
Number of Govt and Govt aided schools constituted SDMC / Number of Govt and Govt aided schools *100
Interpretation A high value indicates that Govt and Govt aided schools have good constitution of SDMCs. RTE act mandate to constitution of SDMCs in all Govt and Govt aided schools.
Disaggregation By management and locationLimitation and com-ments
The indicator measures the constitution of SDMCs in Govt and Govt aided schools but not its functionality.
52
S.No. 34Area School and facilitiesIndicator Schools constituted SDMC and have more than nine meetings during last academic yearUnit Number, PercentagePurpose and Definition The indicator measures functionality of School Development Management Committee
(SDMC) in Govt and Govt aided schools during last academic year.Calculation method, if unit is in percentage or ratio
Number of Govt and Govt aided schools constituted SDMC and have more than nine meetings during last academic year / Number of Govt and Govt aided schools constituted SDMC *100
Interpretation A high value indicates that Govt and Govt aided schools have good functioning of SDMCs.Disaggregation By management and locationLimitation and com-ments
The indicator measures the functioning of SDMCs in Govt and Govt aided schools but not its quality of deliberations.
Limitation and com-ments
The indicator measures the existence of the availability of building in schools but not its qual-ity or operational state.
S.No. 35Area EnrolmentIndicator Enrolment Secondary classes (Grade 9-10)Unit NumberPurpose and Definition Number of students studying any grades between 9 to 10
Calculation method, if unit is in percentage or ratio
-
Interpretation -Disaggregation By management, Gender, Social group and locationLimitation and com-ments
Enrolment from schools reported in the U-DISE system. Despite significant increase in num-ber of schools in U-DISE , a few schools (mostly unrecognized) are yet be covered. Although this number is very small but it varies from state to state.
S.No. 36Area EnrolmentIndicator Enrolment Higher Secondary classes (Grade 11-12)Unit NumberPurpose and Definition Number of students studying any grades between 11 to 12
Calculation method, if unit is in percentage or ratio
-
Interpretation -Disaggregation By management, Gender, Social group and locationLimitation and com-ments
Enrolment from schools reported in the U-DISE system. Despite significant increase in num-ber of schools in U-DISE , a few schools (mostly unrecognized) are yet be covered. Although this number is very small but it varies from state to state.
53
S.No. 37Area EnrolmentIndicator Proportion of enrolment to total enrolment in Govt. schools at Secondary levelUnit PercentagePurpose and Definition The indicator measures enrolment share in government schools to total enrolment at Second-
ary levelCalculation method, if unit is in percentage or ratio
Enrolment in schools managed by Government at Secondary level / Total enrolment at Sec-ondary level*100
Interpretation A high value indicates that students have good access of government schools.Disaggregation By locationLimitation and com-ments
A few schools (mostly unrecognized) are yet be covered and it varies from administrative area to administrative area hence interpretation should be made very carefully.
Limitation and com-ments
The indicator measures the existence of separate toilet for boys in schools but not its quality or operational state.
S.No. 38Area EnrolmentIndicator Proportion of enrolment to total enrolment in Govt. schools at Higher Secondary levelUnit PercentagePurpose and Definition The indicator measures enrolment share in government schools to total enrolment at Higher
Secondary levelCalculation method, if unit is in percentage or ratio
Enrolment in schools managed by Government at Higher Secondary level / Total enrolment at Higher Secondary level *100
Interpretation A high value indicates that students have good access of government schools.Disaggregation By locationLimitation and com-ments
A few schools (mostly unrecognized) are yet be covered and it varies from administrative area to administrative area hence interpretation should be made very carefully.
S.No. 39Area EnrolmentIndicator Ratio of girls' to boys' in enrolment in Secondary classes (Grade 9-10)Unit RatioPurpose and Definition The indicator measures ratio of girls to boys enrolment in Secondary classes.
Calculation method, if unit is in percentage or ratio
Enrolment of girls in Secondary classes/Enrolment of boys in Secondary classes
Interpretation A high value indicates less disparity in enrolment between boys and girls. Ideally value depend on sex ratio of the particular area.
Disaggregation By location and social groupsLimitation and com-ments
The ratio does not show whether improvement is due to the performance of one of the gender groups. Interpretation requires trend analysis of the underlying indicators
54
S.No. 40Area EnrolmentIndicator Ratio of girls' to boys' in enrolment in Higher Secondary classes (Grade 11-12)Unit RatioPurpose and Definition The indicator measures ratio of girls to boys enrolment in Higher Secondary classes.Calculation method, if unit is in percentage or ratio
Enrolment of girls in Higher Secondary classes/Enrolment of boys in Higher Secondary classes
Interpretation A high value indicates less disparity in enrolment between boys and girls. Ideally value depend on sex ratio of the particular area.
Disaggregation By location and social groupsLimitation and com-ments
The ratio does not show whether improvement is due to the performance of one of the gender groups. Interpretation requires trend analysis of the underlying indicators
Limitation and com-ments
The indicator measures the existence of the availability of building in schools but not its qual-ity or operational state.
S.No. 41Area EnrolmentIndicator Enrolment of Children with Special Needs (CWSN) in Secondary classes (Grade 9-10)Unit NumberPurpose and Definition Number of Children with Special Need (CSWN) studying any grades between 9 to 10. Chil-
dren with Special Need are defined in 10 categories till 2015-16 and afterwards in 21 catego-ries.
Calculation method, if unit is in percentage or ratio
-
Interpretation -Disaggregation By management and locationLimitation and com-ments
CWSN are identified and reported by head teacher based on school records. Categories of CWSN are also reported by head teachers based on the available school records.
S.No. 42Area EnrolmentIndicator Proportion of CWSN to total enrolment in Secondary classes (Grade 9-10)Unit PercentagePurpose and Definition The indicator measures share of CSWN enrolment to total enrolment in Secondary classes.
Calculation method, if unit is in percentage or ratio
Enrolment of CWSN in Secondary classes / Total enrolment in Secondary classes *100
Interpretation A high value indicates about more share of CWSN in enrolment and required special focus. If value is very low (Less than 1%) which means CWSN not identified properly or they are not enrolled in the education system.
Disaggregation By management and locationLimitation and com-ments
-
55
S.No. 43Area EnrolmentIndicator Enrolment of Children with Special Needs (CWSN) in Higher Secondary classes (Grade
11-12)Unit NumberPurpose and Definition Number of Children with Special Need (CSWN) studying any grades between 11 to 12. Chil-
dren with Special Need are defined in 10 categories till 2015-16 and afterwards in 21 catego-ries.
Calculation method, if unit is in percentage or ratio
-
Interpretation -Disaggregation By management and locationLimitation and com-ments
CWSN are identified and reported by head teacher based on school records. Categories of CWSN are also reported by head teachers based on the available school records.
Limitation and com-ments
The indicator measures the existence of separate toilet for boys in schools but not its quality or operational state.
S.No. 44Area EnrolmentIndicator Proportion of CWSN to total enrolment in Higher Secondary classes (Grade 11-12)Unit PercentagePurpose and Definition The indicator measures share of CSWN enrolment to total enrolment in Higher Secondary
classes.Calculation method, if unit is in percentage or ratio
Enrolment of CWSN in Higher Secondary classes / Total enrolment in Higher Secondary classes *100
Interpretation A high value indicates about more share of CWSN in enrolment and required special focus. If value is very low (Less than 1%) which means CWSN not identified properly or they are not enrolled in the education system.
Disaggregation By management and locationLimitation and com-ments
-
S.No. 45Area EnrolmentIndicator Proportion of enrolment of girls to total enrolment at Secondary levelUnit PercentagePurpose and Definition The indicator measures share of girls to total enrolment in Secondary classes.
Calculation method, if unit is in percentage or ratio
Enrolment of girls in Secondary classes/Total enrolment in Secondary classes *100
Interpretation A high value indicates higher share of girls in enrolment. Ideally value depend on sex ratio of the particular area.
Disaggregation By location , school management and social groupsLimitation and com-ments
The proportion does not show whether improvement is due to the performance of one of the gender groups. Interpretation requires trend analysis of the underlying indicators and sex ratio of the particular area.
56
S.No. 46Area EnrolmentIndicator Proportion of enrolment of SC children to total enrolment at Secondary levelUnit PercentagePurpose and Definition The indicator measures share of enrolment of SC children to total enrolment in Secondary
classes.Calculation method, if unit is in percentage or ratio
Enrolment of SC children in Secondary classes/Total enrolment in Secondary classes *100
Interpretation A high value indicates higher share of SC in enrolment. Ideally value depend on share of SC population to the total population of the particular area.
Disaggregation By location and school managementLimitation and com-ments
Interpretation requires trend analysis of the underlying indicators and share of SC population of the particular area.
Limitation and com-ments
The indicator measures the existence of the availability of building in schools but not its qual-ity or operational state.
S.No. 47Area EnrolmentIndicator Proportion of enrolment of ST children to total enrolment at Secondary levelUnit PercentagePurpose and Definition The indicator measures share of enrolment of ST children to total enrolment in Secondary
classes.Calculation method, if unit is in percentage or ratio
Enrolment of ST children in Secondary classes/Total enrolment in Secondary classes *100
Interpretation A high value indicates higher share of ST in enrolment. Ideally value depend on share of ST population to the total population of the particular area.
Disaggregation By location and school managementLimitation and com-ments
Interpretation requires trend analysis of the underlying indicators and share of ST population of the particular area.
S.No. 48Area EnrolmentIndicator Proportion of enrolment of OBC children to total enrolment at Secondary levelUnit PercentagePurpose and Definition The indicator measures share of enrolment of OBC children to total enrolment in Secondary
classes.Calculation method, if unit is in percentage or ratio
Enrolment of OBC children in Secondary classes/Total enrolment in Secondary classes *100
Interpretation A high value indicates higher share of OBC in enrolment. Ideally value depend on share of OBC population to the total population of the particular area.
Disaggregation By location and school managementLimitation and com-ments
Interpretation requires trend analysis of the underlying indicators and share of OBC popula-tion of the particular area.
57
S.No. 49Area EnrolmentIndicator Proportion of enrolment of Muslim children to total enrolment at Secondary levelUnit PercentagePurpose and Definition The indicator measures share of enrolment of Muslim children to total enrolment in Second-
ary classes.Calculation method, if unit is in percentage or ratio
Enrolment of Muslim children in Secondary classes/Total enrolment in Secondary classes *100
Interpretation A high value indicates higher share of Muslim in enrolment. Ideally value depend on share of Muslim population to the total population of the particular area.
Disaggregation By location and school managementLimitation and com-ments
Interpretation requires trend analysis of the underlying indicators and share of Muslim popula-tion of the particular area.
Limitation and com-ments
The indicator measures the existence of separate toilet for boys in schools but not its quality or operational state.
S.No. 50Area EnrolmentIndicator Proportion of enrolment of girls to total enrolment at Higher Secondary levelUnit PercentagePurpose and Definition The indicator measures share of girls to total enrolment in Higher Secondary classes.
Calculation method, if unit is in percentage or ratio
Enrolment of girls in Higher Secondary classes/Total enrolment in Higher Secondary classes *100
Interpretation A high value indicates higher share of girls in enrolment. Ideally value depend on sex ratio of the particular area.
Disaggregation By location , school management and social groupsLimitation and com-ments
The proportion does not show whether improvement is due to the performance of one of the gender groups. Interpretation requires trend analysis of the underlying indicators and sex ratio of the particular area.
S.No. 51Area EnrolmentIndicator Proportion of enrolment of SC children to total enrolment at Higher Secondary levelUnit PercentagePurpose and Definition The indicator measures share of enrolment of SC children to total enrolment in Higher Sec-
ondary classes.Calculation method, if unit is in percentage or ratio
Enrolment of SC children in Higher Secondary classes/Total enrolment in Higher Secondary classes *100
Interpretation A high value indicates higher share of SC in enrolment. Ideally value depend on share of SC population to the total population of the particular area.
Disaggregation By location and school managementLimitation and com-ments
Interpretation requires trend analysis of the underlying indicators and share of SC population of the particular area.
58
S.No. 52Area EnrolmentIndicator Proportion of enrolment of ST children to total enrolment at Higher Secondary levelUnit PercentagePurpose and Definition The indicator measures share of enrolment of ST children to total enrolment in Higher Sec-
ondary classes.Calculation method, if unit is in percentage or ratio
Enrolment of ST children in Higher Secondary classes/Total enrolment in Higher Secondary classes *100
Interpretation A high value indicates higher share of ST in enrolment. Ideally value depend on share of ST population to the total population of the particular area.
Disaggregation By location and school managementLimitation and com-ments
Interpretation requires trend analysis of the underlying indicators and share of ST population of the particular area.
Limitation and com-ments
The indicator measures the existence of the availability of building in schools but not its qual-ity or operational state.
S.No. 53Area EnrolmentIndicator Proportion of enrolment of OBC children to total enrolment at Higher Secondary levelUnit PercentagePurpose and Definition The indicator measures share of enrolment of OBC children to total enrolment in Higher
Secondary classes.Calculation method, if unit is in percentage or ratio
Enrolment of OBC children in Higher Secondary classes/Total enrolment in Higher Second-ary classes *100
Interpretation A high value indicates higher share of OBC in enrolment. Ideally value depend on share of OBC population to the total population of the particular area.
Disaggregation By location and school managementLimitation and com-ments
Interpretation requires trend analysis of the underlying indicators and share of OBC popula-tion of the particular area.
S.No. 54Area EnrolmentIndicator Proportion of enrolment of Muslim children to total enrolment at Higher Secondary
levelUnit PercentagePurpose and Definition The indicator measures share of enrolment of Muslim children to total enrolment in Higher
Secondary classes.Calculation method, if unit is in percentage or ratio
Enrolment of Muslim children in Higher Secondary classes/Total enrolment in Higher Sec-ondary classes *100
Interpretation A high value indicates higher share of Muslim in enrolment. Ideally value depend on share of Muslim population to the total population of the particular area.
Disaggregation By location and school managementLimitation and com-ments
Interpretation requires trend analysis of the underlying indicators and share of Muslim popula-tion of the particular area.
59
S.No. 55Area TeacherIndicator Number of teachersUnit NumberPurpose and Definition Number of teachers who are teaching Secondary and Higher Secondary classes. To show the
strength of the teaching force and involved in teaching.Calculation method, if unit is in percentage or ratio
-
Interpretation -Disaggregation By management, gender, social groups and locationLimitation and com-ments
All type of teachers are included, however some states have not reported teachers who are on temporary basis. This indicator measures strength of teaching force rather than the effective-ness and quality of teaching.
Limitation and com-ments
The indicator measures the existence of separate toilet for boys in schools but not its quality or operational state.
S.No. 56Area TeacherIndicator Proportion of female teachers to total teachersUnit PercentagePurpose and Definition Purpose of this indicator is to show the gender composition of the teaching force. It defined as
proportion of female teachers expressed as a percentage of the total number of teachers (male and female).
Calculation method, if unit is in percentage or ratio
Number of female teachers/Number of total teachers (Male and female) *100
Interpretation Proportion of female teachers approaching 50% indicates gender parity in the composition of the teaching force. A value of greater than 50% reveals more opportunities and/or preference for women to participate in teaching activities .
Disaggregation By management and locationLimitation and com-ments
All type of teachers are included, however some states have not reported teachers who are on temporary basis. This indicator measures the level of gender representation in the teaching profession rather than the effectiveness and quality of teaching.
S.No. 57Area TeacherIndicator Proportion of SC teachers to total teachersUnit PercentagePurpose and Definition Purpose of this indicator is to show the social group composition of the teaching force. It de-
fined as proportion of SC teachers expressed as a percentage of the total number of teachers (male and female).
Calculation method, if unit is in percentage or ratio
Number of teachers from SC social group/Number of total teachers (Male and female) *100
Interpretation Proportion of SC teachers approaching equal to share of SC population to total population indicates social parity in the composition of the teaching force. A value of greater value reveals more opportunities and/or preference for SC to participate in teaching activities .
Disaggregation By management and locationLimitation and com-ments
This indicator measures the level of social representation in the teaching profession rather than the effectiveness and quality of teaching.
60
S.No. 58Area TeacherIndicator Proportion of ST teachers to total teachersUnit PercentagePurpose and Definition Purpose of this indicator is to show the social group composition of the teaching force. It de-
fined as proportion of ST teachers expressed as a percentage of the total number of teachers (male and female).
Calculation method, if unit is in percentage or ratio
Number of teachers from ST social group/Number of total teachers (Male and female) *100
Interpretation Proportion of ST teachers approaching equal to share of ST population to total population indicates social parity in the composition of the teaching force. A value of greater value reveals more opportunities and/or preference for ST to participate in teaching activities .
Disaggregation By management and locationLimitation and com-ments
This indicator measures the level of social representation in the teaching profession rather than the effectiveness and quality of teaching.The indicator measures the existence of the availability of building in schools but not its qual-ity or operational state.
S.No. 59Area TeacherIndicator Proportion of OBC teachers to total teachersUnit PercentagePurpose and Definition Purpose of this indicator is to show the social group composition of the teaching force. It de-
fined as proportion of OBC teachers expressed as a percentage of the total number of teachers (male and female).
Calculation method, if unit is in percentage or ratio
Number of teachers from OBC social group/Number of total teachers (Male and female) *100
Interpretation Proportion of OBC teachers approaching equal to share of OBC population to total population indicates social parity in the composition of the teaching force. A value of greater value reveals more opportunities and/or preference for OBC to participate in teaching activities .
Disaggregation By management and locationLimitation and com-ments
This indicator measures the level of social representation in the teaching profession rather than the effectiveness and quality of teaching.
S.No. 60Area School and facilitiesIndicator Schools without female teacherUnit Number, PercentagePurpose and Definition Purpose of this indicator is to show the non availability of any female teacher. Schools do not
have any female teacher out of total teaching force.Calculation method, if unit is in percentage or ratio
Number of schools not having any female teacher/Number of schools *100
Interpretation A low value indicates that schools have female teachers in teaching force. Although there is no norms for availability of female teacher, however each school should have at least one female teacher specially in Upper primary level schools .
Disaggregation By management and locationLimitation and com-ments
All type of teachers are included, however some states have not reported teachers who are on temporary basis. This indicator measures the level of gender representation in the teaching profession rather than the effectiveness and quality of teaching.
61
S.No. 61Area TeacherIndicator Teachers do not have professional qualificationUnit Number, PercentagePurpose and Definition Teachers who have not received the minimum organized pre-service teacher training required
for teaching. To measure the proportion of teachers not trained in pedagogical skills according to national standards and can not effectively teach and use the available instructional materials.
Calculation method, if unit is in percentage or ratio
Number of teachers who have not received the minimum organized pre-service teacher train-ing /Number of teachers *100
Interpretation Ideally value should zero and near to zero indicate that majority of the teaching force is trained and has the necessary pedagogical skills to teach and use the available instructional materials in an effective manner.
Disaggregation By management and locationLimitation and com-ments
This indicator does not take into account differences in teachers’ experiences and status, teach-ing methods, teaching materials and variations in classroom conditions -- all factors that also affect the quality of teaching/learning. It should be noted tha
Limitation and com-ments
The indicator measures the existence of separate toilet for boys in schools but not its quality or operational state.
S.No. 62Area School and facilitiesIndicator Contractual teachersUnit Number, PercentagePurpose and Definition Teachers who are engaged by management on contractual services, which means they are not
regular / permanent.Calculation method, if unit is in percentage or ratio
Number of teachers on contract/Number of total teachers *100
Interpretation Ideally value should zero and near to zero indicate that majority of the teaching force is work-ing on regular service and high value shows that majority are on contract services.
Disaggregation By management and locationLimitation and com-ments
All type of teachers are included, however some states have not reported teachers who are on temporary basis.
S.No. 63Area TeacherIndicator Pupil Teacher Ratio (PTR) at Secondary levelUnit RatioPurpose and Definition To measure the level of human resources input in terms of the number of teachers in relation
to the size of the pupil population. It defined as average number of pupils /students per teacher.Calculation method, if unit is in percentage or ratio
Total enrolment in Grade 9-10/ Total number of teachers in schools who are teaching second-ary classes
Interpretation A high teacher pupil-ratio suggests that each teacher has to be responsible for a large number of pupils. In other words, the higher the pupil/teacher ratio, the lower the relative access of pu-pils to teachers. It is generally assumed that a low pupil-teacher ratio signifies smaller classes, which enables the teacher to pay more attention to individual students, which may in the long run result in a better performance of the pupils.
Disaggregation By management and locationLimitation and com-ments
All type of teachers are included, however some states have not reported teachers who are on temporary basis. This indicator does not take into account factors which could affect the quality of teaching/learning, such as differences in teachers’ qualifications, pedagogical train-ing, experiences and status, teaching methods, teaching materials and variations in classroom conditions.
62
S.No. 64Area TeacherIndicator Pupil Teacher Ratio (PTR) at Higher Secondary levelUnit RatioPurpose and Definition To measure the level of human resources input in terms of the number of teachers in relation
to the size of the pupil population. It defined as average number of pupils /students per teacher.Calculation method, if unit is in percentage or ratio
Total enrolment in Grade 11-12/ Total number of teachers in schools who are teaching higher secondary classes
Interpretation A high teacher pupil-ratio suggests that each teacher has to be responsible for a large number of pupils. In other words, the higher the pupil/teacher ratio, the lower the relative access of pu-pils to teachers. It is generally assumed that a low pupil-teacher ratio signifies smaller classes, which enables the teacher to pay more attention to individual students, which may in the long run result in a better performance of the pupils.
Disaggregation By management and locationLimitation and com-ments
All type of teachers are included, however some states have not reported teachers who are on temporary basis. This indicator does not take into account factors which could affect the quality of teaching/learning, such as differences in teachers’ qualifications, pedagogical train-ing, experiences and status, teaching methods, teaching materials and variations in classroom conditions.The indicator measures the existence of the availability of building in schools but not its qual-ity or operational state.
S.No. 65Area School and facilitiesIndicator Secondary schools/section with teacher who is graduate or more qualification in Math-
ematicsUnit Number, PercentagePurpose and Definition This indicator shows about availability of the teacher in Secondary schools/section, who is
graduate or more qualification in Mathematics. Calculation method, if unit is in percentage or ratio
Number of Secondary schools/section with teacher who is graduate or more qualification in Mathematics /Number of Secondary schools/section *100
Interpretation A high value indicates that schools have good access of availability of Mathematics teacher. Ideally each school should have Mathematics teacher.
Disaggregation By management and locationLimitation and com-ments
This indicator does not take into account factors which could affect the quality of teaching/learning, such as differences in teachers’ qualifications, pedagogical training, experiences and status, teaching methods, teaching materials and variations in classroom conditions.
S.No. 66Area School and facilitiesIndicator Secondary schools/section with teacher who is graduate or more qualification in English/
LanguageUnit Number, PercentagePurpose and Definition This indicator shows about availability of the teacher in Secondary schools/section, who is
graduate or more qualification in English/LanguageCalculation method, if unit is in percentage or ratio
Number of Secondary schools/section with teacher who is graduate or more qualification in English/Language/Number of Secondary schools/section *100
Interpretation A high value indicates that schools have good access of availability of English/Language. Ide-ally each school should have English/Language teacher.
Disaggregation By management and locationLimitation and com-ments
This indicator does not take into account factors which could affect the quality of teaching/learning, such as differences in teachers’ qualifications, pedagogical training, experiences and status, teaching methods, teaching materials and variations in classroom conditions.
63
S.No. 67Area School and facilitiesIndicator Secondary schools/section with teacher who is graduate or more qualification in Social
studiesUnit Number, PercentagePurpose and Definition This indicator shows about availability of the teacher in Secondary schools/section, who is
graduate or more qualification in Social studiesCalculation method, if unit is in percentage or ratio
Number of Secondary schools/section with teacher who is graduate or more qualification in Social studies/Number of Secondary schools/section *100
Interpretation A high value indicates that schools have good access of availability of Social studies teacher. Ideally each school should have Social studies teacher.
Disaggregation By management and locationLimitation and com-ments
This indicator does not take into account factors which could affect the quality of teaching/learning, such as differences in teachers’ qualifications, pedagogical training, experiences and status, teaching methods, teaching materials and variations in classroom conditions.
Limitation and com-ments
The indicator measures the existence of separate toilet for boys in schools but not its quality or operational state.
S.No. 68Area School and facilitiesIndicator Schools with approachable roadUnit Number, PercentagePurpose and Definition The indicator measures accessibility of schools in all weather. All weather road means a mo-
torable pucca road reaching up to the locality in which the school is situated.Calculation method, if unit is in percentage or ratio
Number of schools with approachable road/Number of schools *100
Ideally value should zero and near to zero indicate that majority of the teaching force is work-ing on regular service and high value shows that majority are on contract services.
Interpretation A high value indicates high degree of accessibility of schools from all weather road which is required for easy access of students.
Disaggregation By management and location
Limitation and com-ments
This indicator does not take into account quality of road and it is as reported by the head teacher.
64
S.No. 69Area OutcomeIndicator Gross Enrolment Ratio at Secondary levelUnit RatioPurpose and Definition The indicator measures participation of students at Secondary level of education and defined
as the percentage of student enrolment at Secondary level.Calculation method, if unit is in percentage or ratio
Enrolment at Secondary level (Grade 9-10) of education/Total population in 14-15 years age group *100
Interpretation A high GER generally indicates a high degree of participation, whether the pupils belong to the official age group or not. A GER value approaching or exceeding 100% indicates that particular administrative area is, in principle, able to accommodate all of its school-age popu-lation, but it does not indicate the proportion already enrolled. The achievement of a GER of 100% is therefore a necessary but not sufficient condition for enrolling all eligible children in school. When the GER exceeds 90% for a particular level of education, the aggregate number of places for pupils is approaching the number required for universal access of the official age group. However, this is a meaningful interpretation only if one can expect the under-aged and over-aged enrolments to decline in the future to free places
for pupils from the expected age group.
By management and location
Disaggregation Gender and Social group (SC and ST only)
Limitation and com-ments
Issue of age recording and availability of actual /projected population in particular age group. GER can exceed 100% due to the inclusion of over-aged and under-aged pupils/students be-cause of early or late entrants, and grade repetition. In this case, a rigorous interpretation of GER needs additional information to assess the extent of repetition, late entrants, etc.
S.No. 70Area OutcomeIndicator Gross Enrolment Ratio at Higher Secondary levelUnit RatioPurpose and Definition The indicator measures participation of students at Higher Secondary level of education and
defined as the percentage of student enrolment at Higher Secondary level.Calculation method, if unit is in percentage or ratio
Enrolment at Higher Secondary level (Grade 11-12) of education/Total population in 16-17 years age group *100
Interpretation A high GER generally indicates a high degree of participation, whether the pupils belong to the official age group or not. A GER value approaching or exceeding 100% indicates that particu-lar administrative area is, in principle, able to accommodate all of its school-age population, but it does not indicate the proportion already enrolled. The achievement of a GER of 100% is therefore a necessary but not sufficient condition for enrolling all eligible children in school. When the GER exceeds 90% for a particular level of education, the aggregate number of plac-es for pupils is approaching the number required for universal access of the official age group. However, this is a meaningful interpretation only if one can expect the under-aged and over-aged enrolments to decline in the future to free places for pupils from the expected age group.
Disaggregation Gender and Social group (SC and ST only)Limitation and com-ments
Issue of age recording and availability of actual /projected population in particular age group. GER can exceed 100% due to the inclusion of over-aged and under-aged pupils/students be-cause of early or late entrants, and grade repetition. In this case, a rigorous interpretation of GER needs additional information to assess the extent of repetition, late entrants, etc.
65
S.No. 71Area OutcomeIndicator Net Enrolment Ratio at Secondary levelUnit RatioPurpose and Definition To show the extent of coverage in Secondary level of education of 14-15 years children . En-
rolment of the 14-15 years children for Secondary level of education expressed as a percentage of the population.
Calculation method, if unit is in percentage or ratio
Enrolment of 14-15 years children at Secondary level (Grade 9-10) of education/Total popula-tion in 14-15 years age group *100
Interpretation A high NER denotes a high degree of coverage in the age of 14-15 years population. The theo-retical maximum value is 100%. Increasing trends can be considered as reflecting improving coverage at the Secondary level of education. If the NER is below 100%, then the comple-ment, i.e. the difference with 100%, provides a measure of the proportion of children not enrolled at the Secondary level of education. However, since some of these children could be enrolled at other levels of education, this difference should in no way be considered as indicat-ing the percentage of students not enrolled.
Disaggregation GenderLimitation and com-ments
NER depend on age wise enrolment and population. Age of children has been taken is as per school records, which is submitted by parents and there may be issue of correct reporting. Actual /projected population age group is also major issue. Although the NER cannot exceed 100%, if values up to 100% have been obtained reflecting inconsistencies in the enrolment and/or population data due to the reference date for entry to Secondary education does not coincide with the birth dates of all of the cohort eligible to enrol at this level of education, a significant portion of the population starts Secondary school earlier than the prescribed age and consequently finishes earlier as well. Value of more than 100% not shown in the data.
Limitation and com-ments
The indicator measures the existence of separate toilet for boys in schools but not its quality or operational state.
S.No. 72Area OutcomeIndicator Net Enrolment Ratio at Higher Secondary levelUnit RatioPurpose and Definition To show the extent of coverage in Higher Secondary level of education of 16-17 years children
. Enrolment of the 16-17 years children for Higher Secondary level of education expressed as a percentage of the population.
Calculation method, if unit is in percentage or ratio
Enrolment of 16-17 years children at Higher Secondary level (Grade 11-12) of education/Total population in 16-17 years age group *100
Interpretation A high NER denotes a high degree of coverage in the age of 16-17 years population. The theo-retical maximum value is 100%. Increasing trends can be considered as reflecting improving coverage at the Higher Secondary level of education. If the NER is below 100%, then the com-plement, i.e. the difference with 100%, provides a measure of the proportion of children not enrolled at the Higher Secondary level of education. However, since some of these children could be enrolled at other levels of education, this difference should in no way be considered as indicating the percentage of students not enrolled.
Disaggregation GenderLimitation and com-ments
NER depend on age wise enrolment and population. Age of children has been taken is as per school records, which is submitted by parents and there may be issue of correct reporting. Actual /projected population age group is also major issue. Although the NER cannot exceed 100%, if values up to 100% have been obtained reflecting inconsistencies in the enrolment and/or population data due to the reference date for entry to Secondary education does not coincide with the birth dates of all of the cohort eligible to enrol at this level of education, a significant portion of the population starts Secondary school earlier than the prescribed age and consequently finishes earlier as well. Value of more than 100% not shown in the data.
Limitation and com-ments
This indicator does not take into account quality of road and it is as reported by the head teacher.
66
S.No. 73Area OutcomeIndicator Age Specific Enrolment Ratio for the age group of 14-15 yearsUnit RatioPurpose and Definition To show the extent of the educational participation of 14-15 years age cohort. Enrolment of
14-15 years children irrespective of the level of education, as a percentage of the 14-15 years population.
Calculation method, if unit is in percentage or ratio
Enrolment of 14-15 years children irrespective of the level of education/Total population in 14-15 years age group*100
Interpretation A high ASER denotes a high degree of educational participation of the 14-15 years age group. The theoretical maximum value is 100%. Increasing trends can be considered as reflecting improving participation of the 14-15 years age group. If the ASER is below 100%, then the complement, i.e. the difference with 100% provides a measure of the proportion of the popula-tion of the 14-15 years who are not enrolled.
Disaggregation GenderLimitation and com-ments
ASER depend on age wise enrolment and population. Age of children has been taken is as per school records, which is submitted by parents and there may be issue of correct reporting. Actual /projected population age group is also major issue. Although the ASER cannot exceed 100%, if values up to 100% have been obtained reflecting inconsistencies in the enrolment and/or population data due to the reference date for entry to Elementary education does not coincide with the birth dates of all of the cohort eligible to enrol at this level of education, a significant portion of the population starts Elementary school earlier than the prescribed age and consequently finishes earlier as well. Value of more than 100% not shown in the data.
Limitation and com-ments
Issue of age recording and availability of actual /projected population in particular age group. GER can exceed 100% due to the inclusion of over-aged and under-aged pupils/students be-cause of early or late entrants, and grade repetition. In this case, a rigorous interpretation of GER needs additional information to assess the extent of repetition, late entrants, etc.
S.No. 74Area OutcomeIndicator Age Specific Enrolment Ratio for the age group of 16-17 yearsUnit RatioPurpose and Definition To show the extent of the educational participation of 16-17 years age cohort. Enrolment of
16-17 years children irrespective of the level of education, as a percentage of the 16-17 years population.
Calculation method, if unit is in percentage or ratio
Enrolment of 16-17 years children irrespective of the level of education/Total population in 16-17 years age group*100
Interpretation A high ASER denotes a high degree of educational participation of the 16-17 years age group. The theoretical maximum value is 100%. Increasing trends can be considered as reflecting improving participation of the 16-17 years age group. If the ASER is below 100%, then the complement, i.e. the difference with 100% provides a measure of the proportion of the popula-tion of the 16-17 years who are not enrolled.
Disaggregation GenderLimitation and com-ments
ASER depend on age wise enrolment and population. Age of children has been taken is as per school records, which is submitted by parents and there may be issue of correct reporting. Actual /projected population age group is also major issue. Although the ASER cannot exceed 100%, if values up to 100% have been obtained reflecting inconsistencies in the enrolment and/or population data due to the reference date for entry to Elementary education does not coincide with the birth dates of all of the cohort eligible to enrol at this level of education, a significant portion of the population starts Elementary school earlier than the prescribed age and consequently finishes earlier as well. Value of more than 100% not shown in the data.
67
S.No. 75Area OutcomeIndicator Transition rate, Elementary to Secondary levelUnit PercentagePurpose and Definition The number of pupils (or students) admitted in the grade-9 in a given year, expressed as a
percentage of the number of pupils (or students) enrolled in the grade-8 in the previous year. Purpose of this indicator is to convey information on the degree of access or transition from Upper primary level to secondary level. Viewed from the Upper primary level , it is considered as an output indicator, viewed from the secondary level, it constitutes an indicator of access.
Calculation method, if unit is in percentage or ratio
((Number of pupils enrolled in the grade-9 in year t+1)-(Number of pupils repeating in the grade-9 in year t+1)) /(Number of pupils enrolled in the grade-8 in year t)*100
Interpretation High transition rates indicate a high level of access or transition from Upper primary level to the secondary level. They also reflect the intake capacity of the secondary level. Inversely, low transition rates can signal problems in the bridging between Upper primary and secondary level, due to either deficiencies in the examination system, or inadequate admission capacity in the Upper primary level, or both.
Disaggregation By Gender and Social groupLimitation and com-ments
This indicator can be distorted by incorrect distinction between new entrants and repeaters, especially in the grade-9. Students who interrupted their studies for one or more years after having completed the Primary level, together with the migrant students, could also affect the quality of this indicator. Quality of indicator also depends on the consistency of data on enrol-ment and repeaters in term of coverage over time and across grades. and value may go more than 100, which is not possible theoretically.
Limitation and com-ments
The indicator measures the existence of separate toilet for boys in schools but not its quality or operational state.
S.No. 76Area OutcomeIndicator Gender Parity Index in GER at Secondary levelUnit RatioPurpose and Definition The GPI measures progress towards gender parity in education participation available for
women in relation to those available to men. It also reflects the level of women’s empower-ment in society.
Calculation method, if unit is in percentage or ratio
GER for female at Secondary level/GER for male at Secondary level
Interpretation A GPI equal to 1 indicates parity between females and males. In general, a value less than 1 indicates disparity in favour of boys and a value greater than 1 indicates disparity in favour of girls.
Disaggregation Social groups (SC and ST only)Limitation and com-ments
The index does not show whether improvement or regression is due to the performance of one of the gender groups. Interpretation requires trend analysis of the underlying indicators.
Limitation and com-ments
This indicator does not take into account quality of road and it is as reported by the head teacher.
68
S.No. 77Area OutcomeIndicator Gender Parity Index in GER at Higher Secondary levelUnit RatioPurpose and Definition The GPI measures progress towards gender parity in education participation available for
women in relation to those available to men. It also reflects the level of women’s empower-ment in society.
Calculation method, if unit is in percentage or ratio
GER for female at Higher Secondary level/GER for male at Higher Secondary level
Interpretation A GPI equal to 1 indicates parity between females and males. In general, a value less than 1 indicates disparity in favour of boys and a value greater than 1 indicates disparity in favour of girls.
Disaggregation Social groups (SC and ST only)Limitation and com-ments
The index does not show whether improvement or regression is due to the performance of one of the gender groups. Interpretation requires trend analysis of the underlying indicators.
Limitation and com-ments
Issue of age recording and availability of actual /projected population in particular age group. GER can exceed 100% due to the inclusion of over-aged and under-aged pupils/students be-cause of early or late entrants, and grade repetition. In this case, a rigorous interpretation of GER needs additional information to assess the extent of repetition, late entrants, etc.
S.No. 78Area OutcomeIndicator Retention rate at Secondary levelUnit PercentagePurpose and Definition To measure the retention capacity of an education system and It illustrates the situation regard-
ing retention of pupils (or students) at Secondary level, and conversely the magnitude of drop-out. Enrolment in Grade X (minus repeaters) in a year as a proportion to enrolment in Grade I nine years back is termed as retention rate at the Secondary level.
Calculation method, if unit is in percentage or ratio
((Number of pupils enrolled in the grade-10 in year t)-(Number of pupils repeating in the grade-10 in year t)) /(Number of pupils enrolled in the grade-1 in year t-9)*100
Interpretation Rates approaching 100% indicate a high level of retention and low incidence of dropoutDisaggregation By Gender and Social groupLimitation and com-ments
Since the calculation of this indicator is based on enrolment data hence depends on consis-tency of data on enrolment and repeaters in term of coverage over time and across grades.
69
G A
N
N
I
D
N
N
A
A
D
L
M
P
IN
L
I
A
S
N
TR
OI
A
TT
AIO
CN
UD
E
F
N
O
A
E
T
T
IO
U
N
TI
A
T
L
SNI
kUkkF
Laj
lk"
V
u
hª ;
lk
k
'
'z
k
i
fS { a
kdo,
; kutsk
*
NAT IONAL INST ITUTE OF EDUCAT IONAL PLANN ING AND ADM IN I STRAT ION


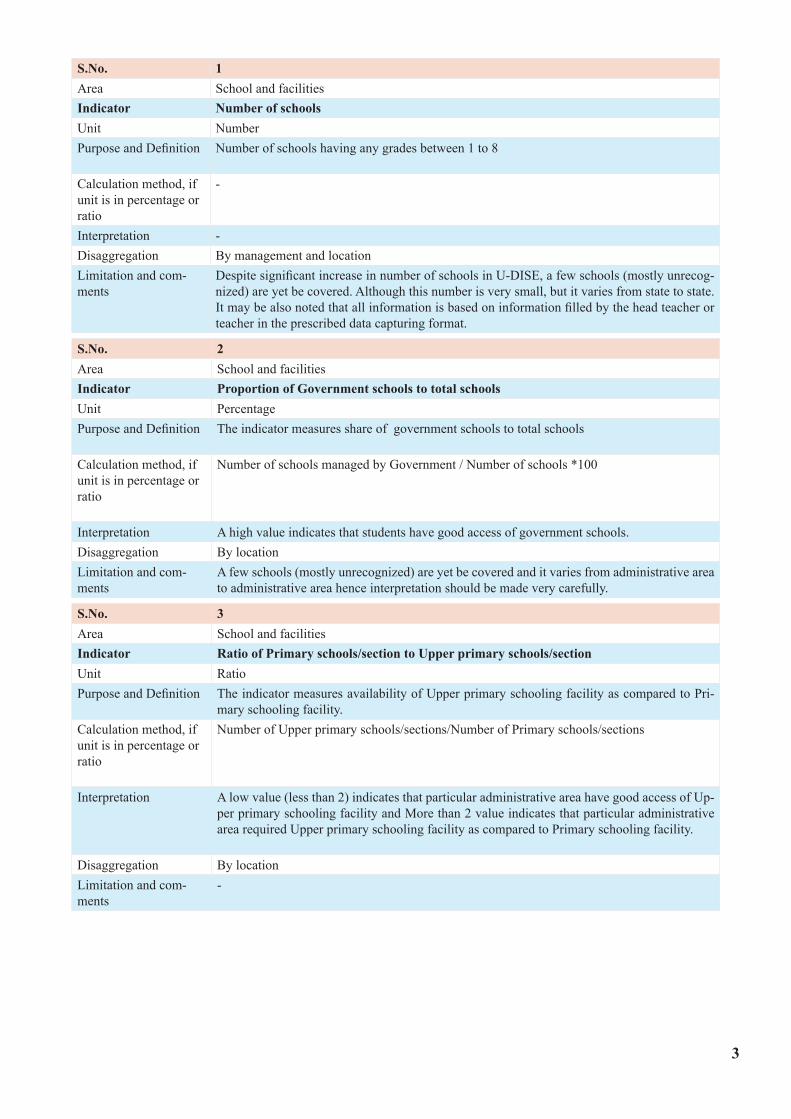

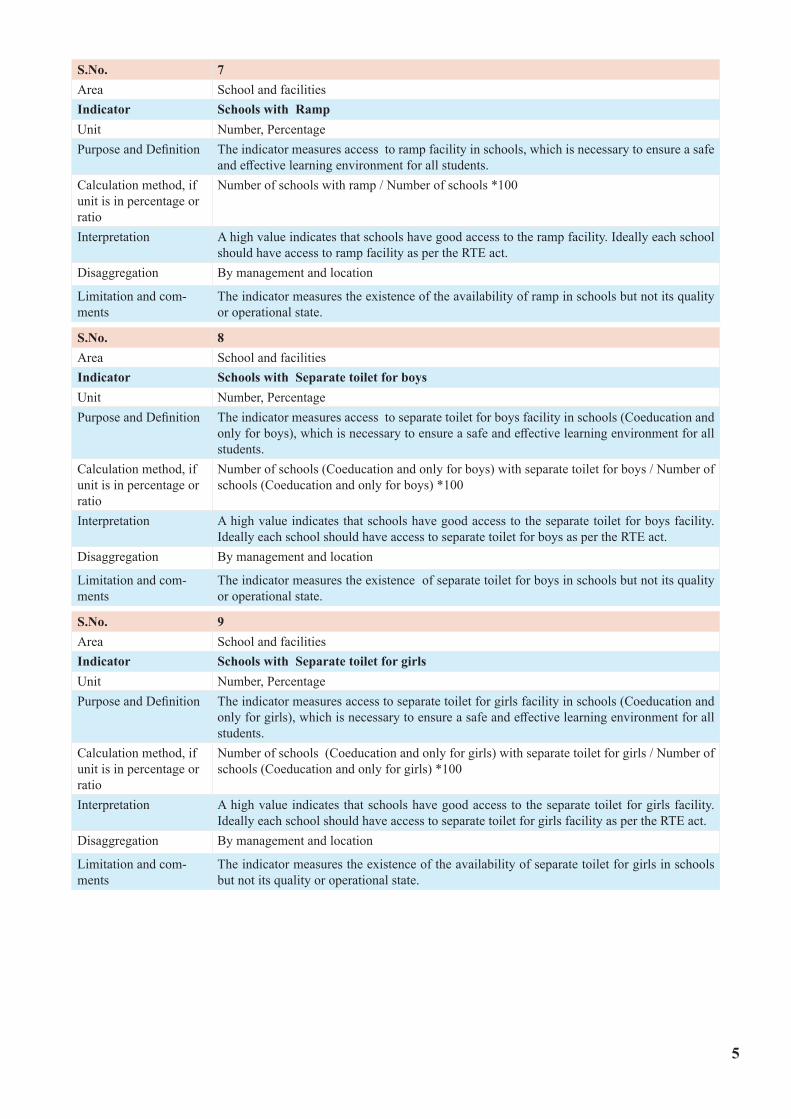
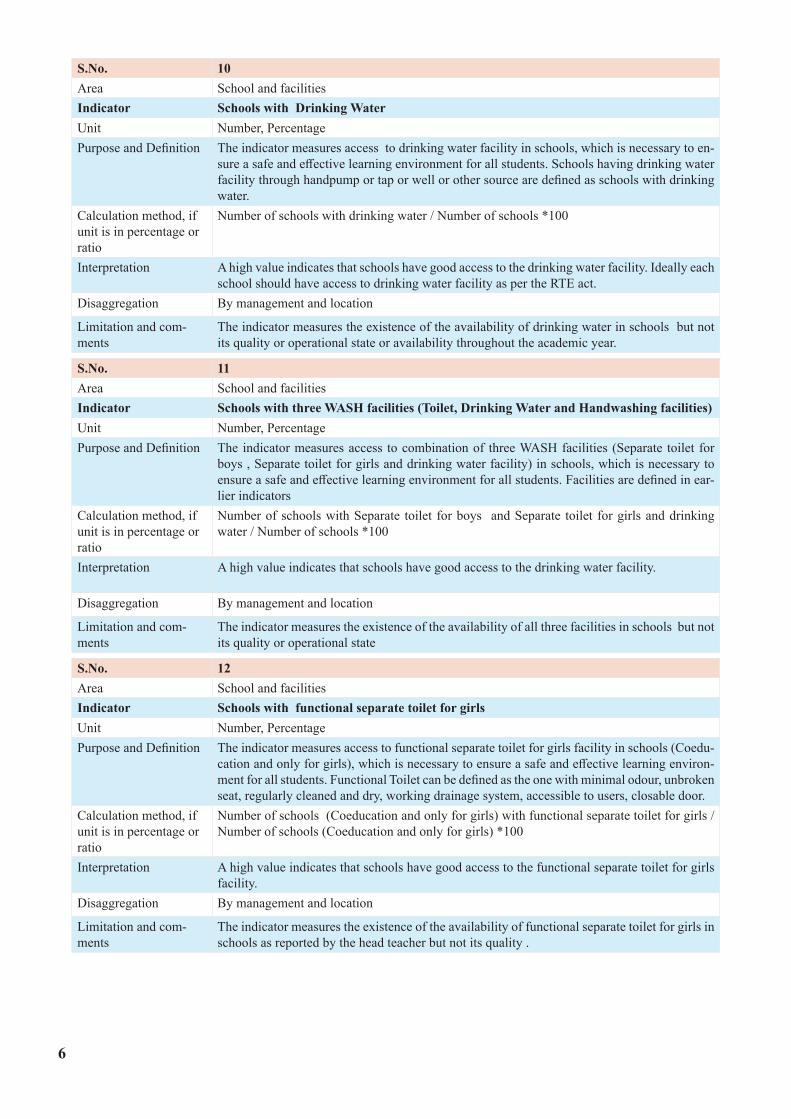

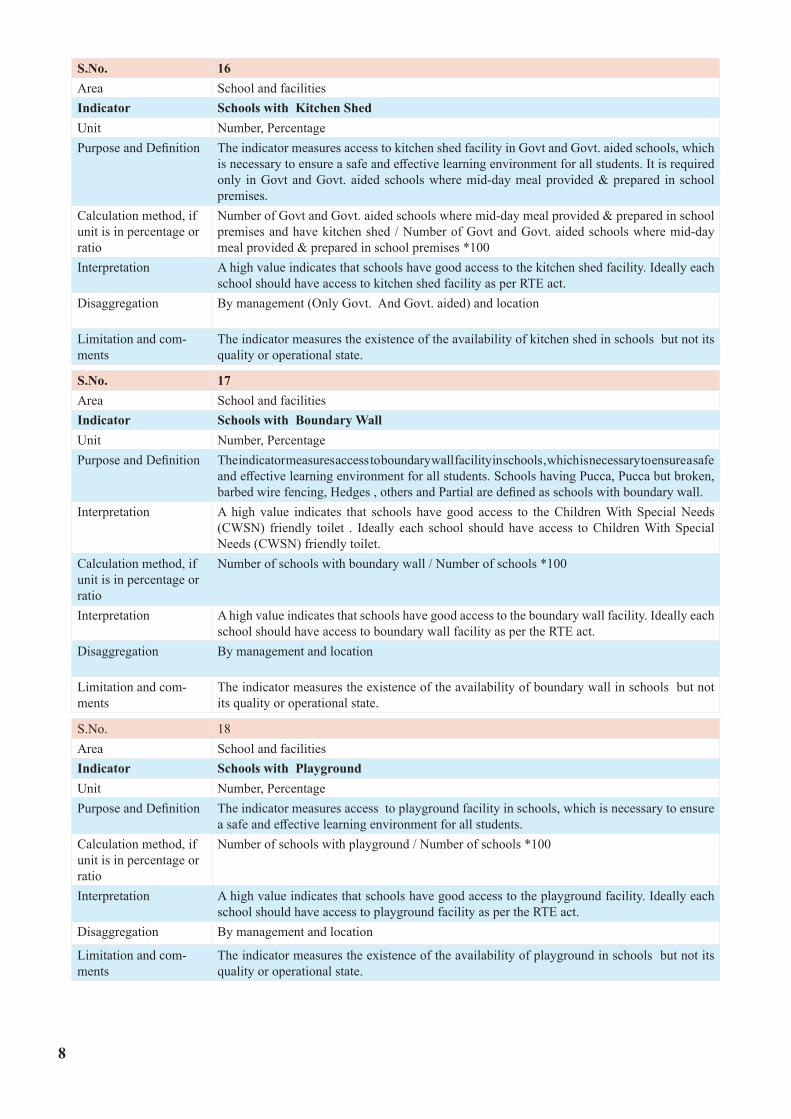


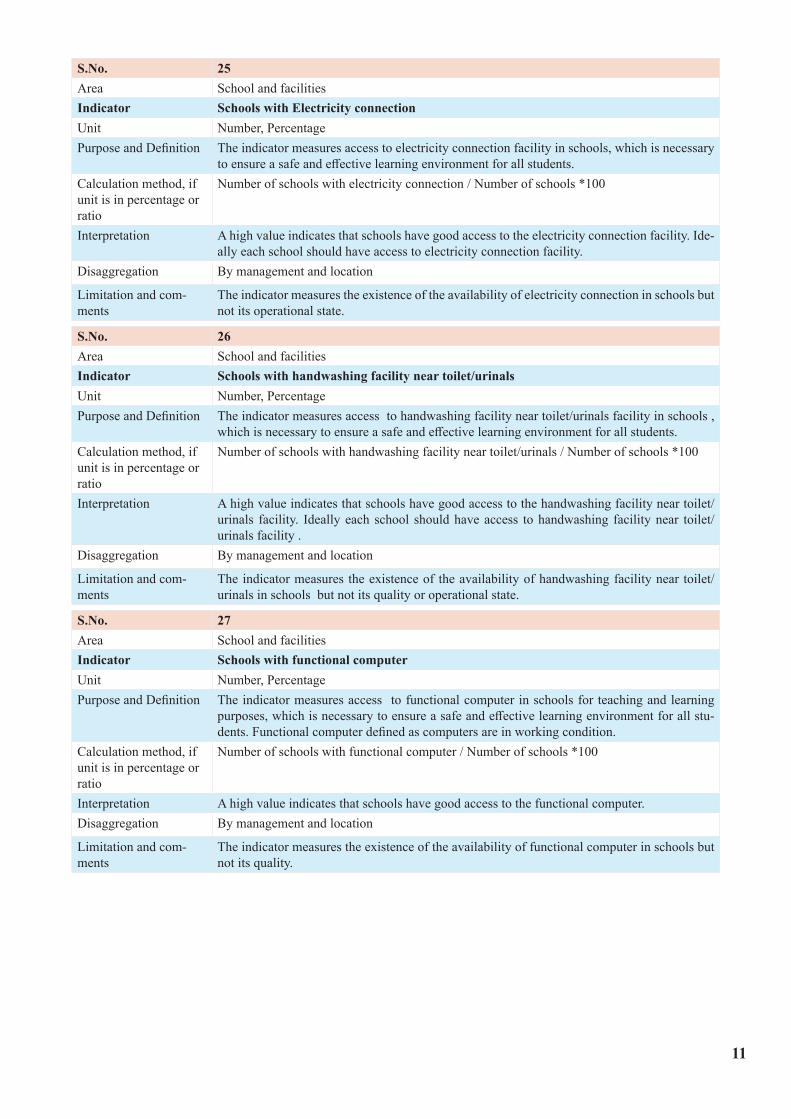

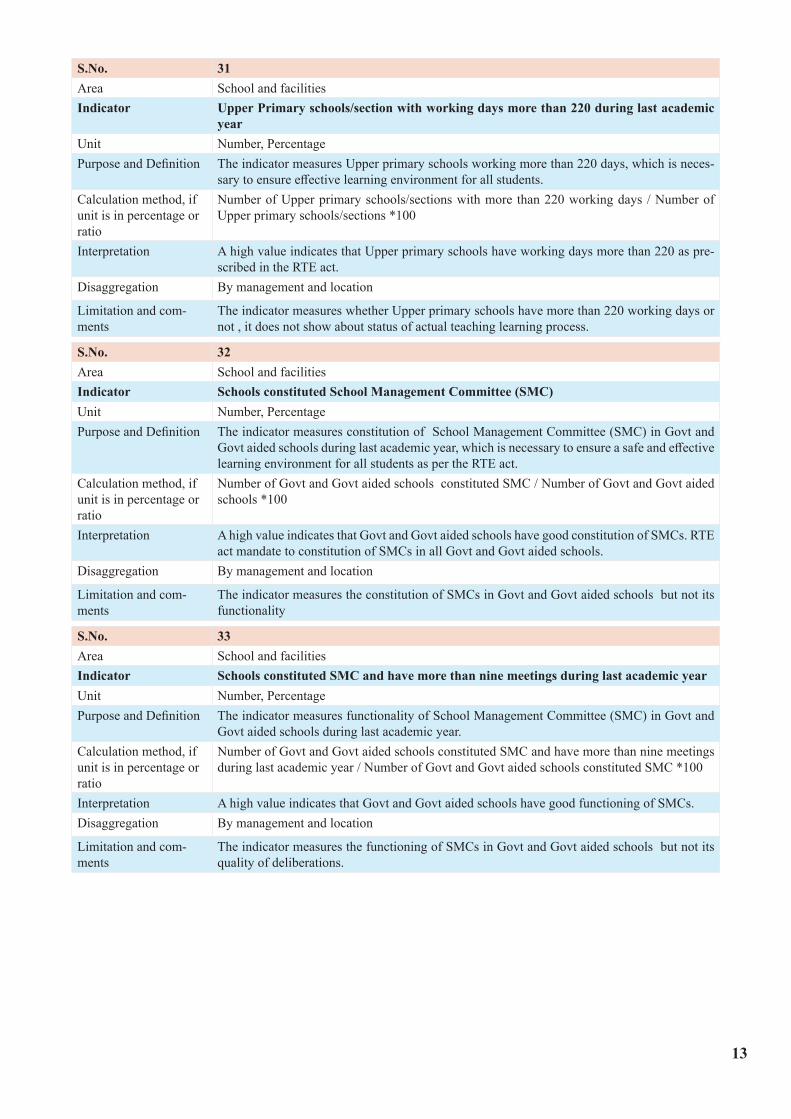


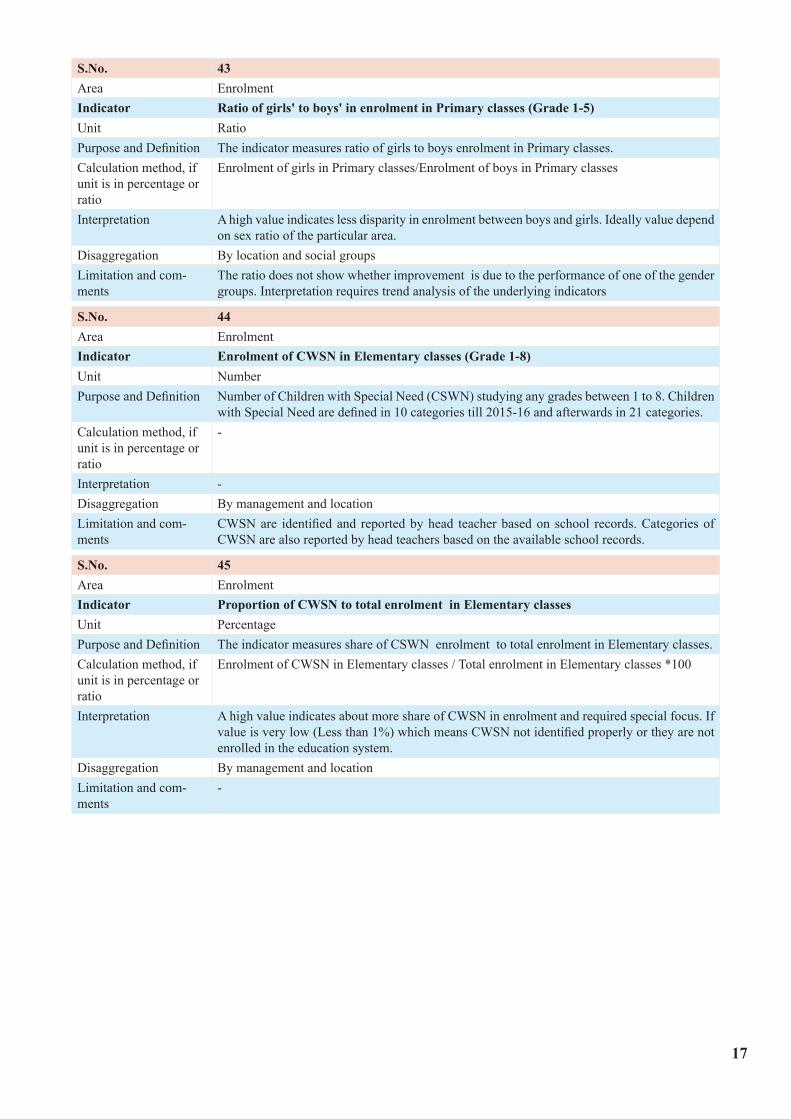


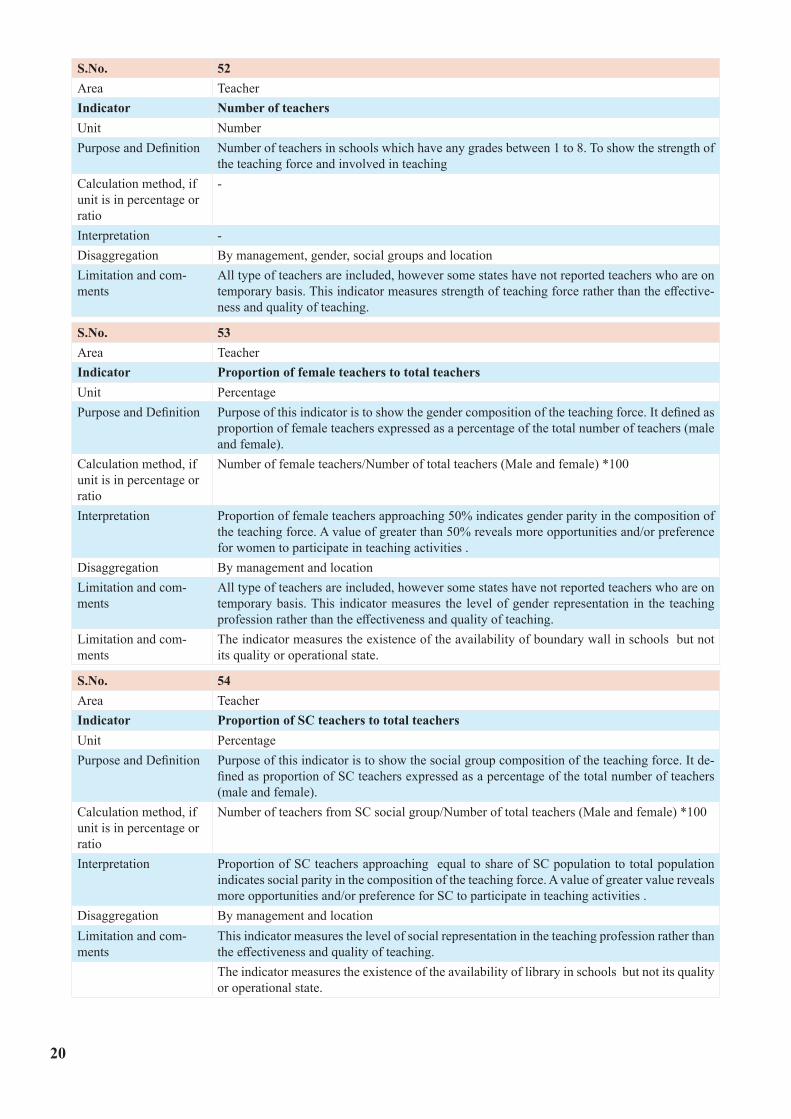


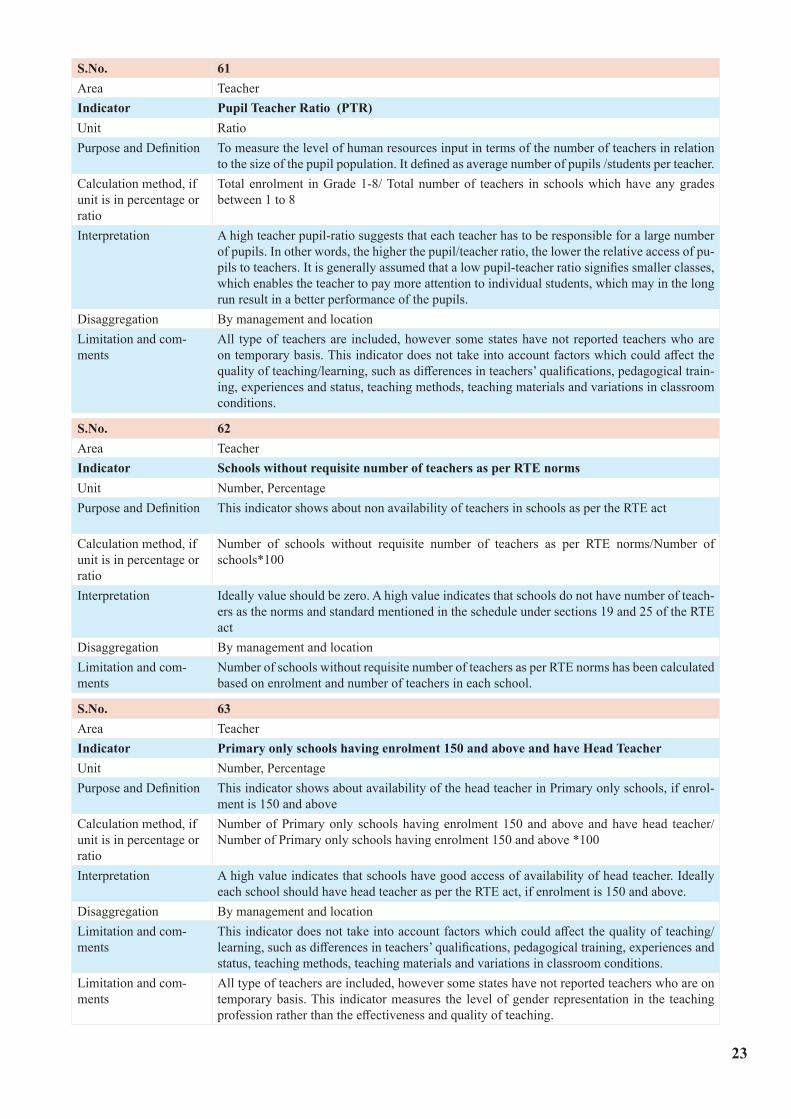

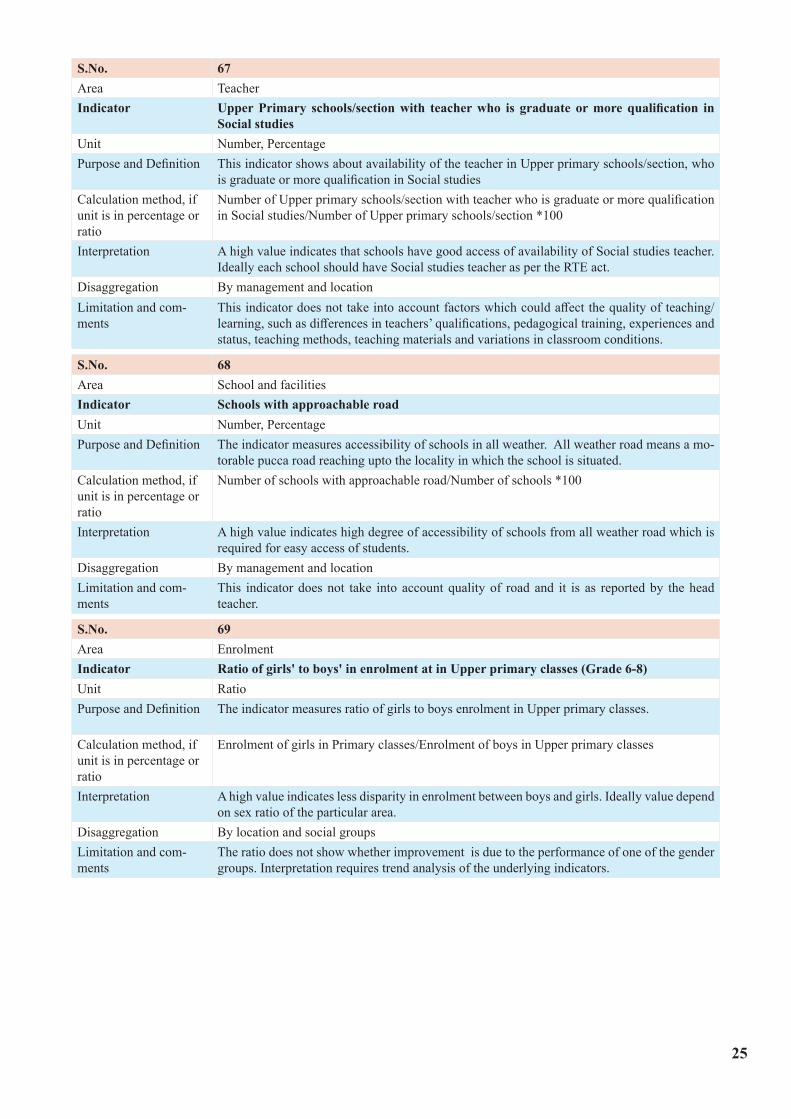
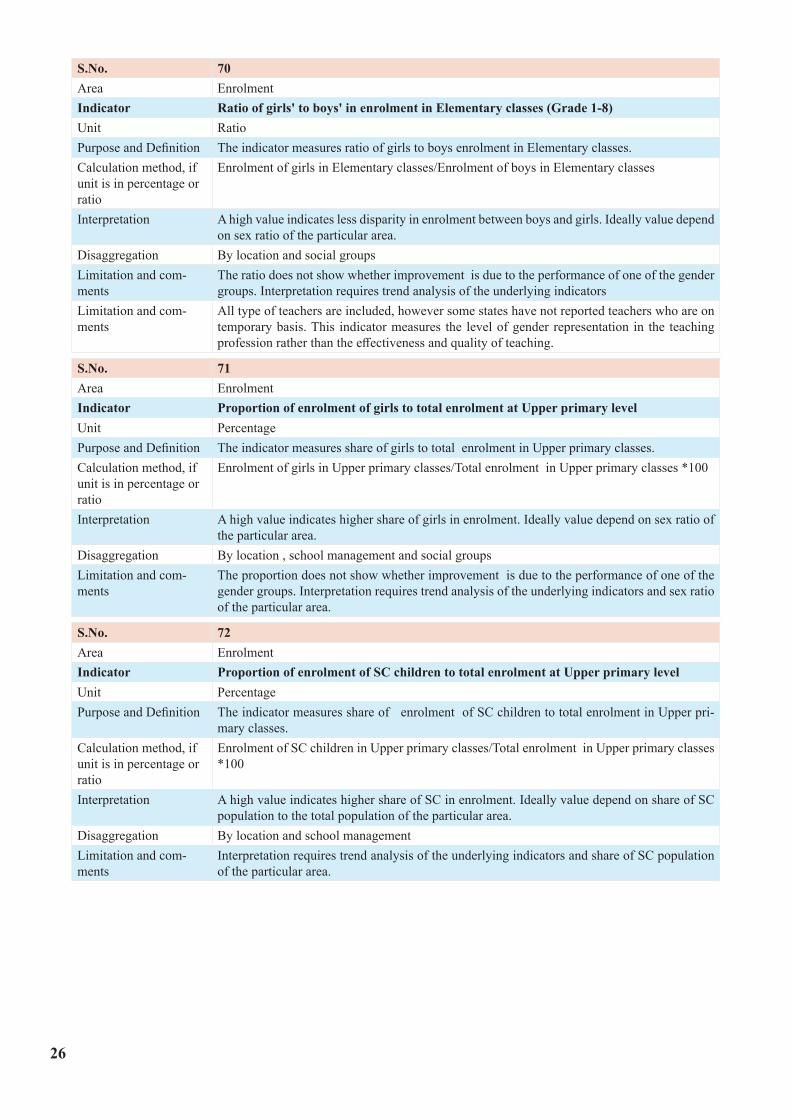
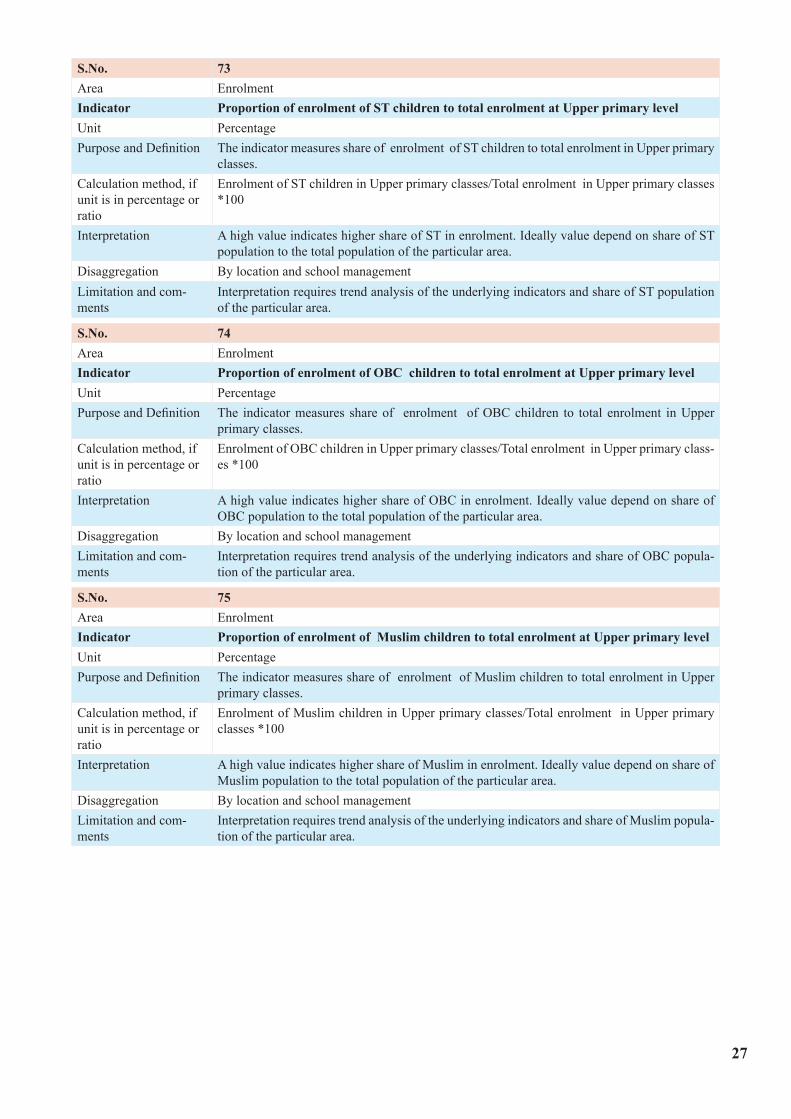
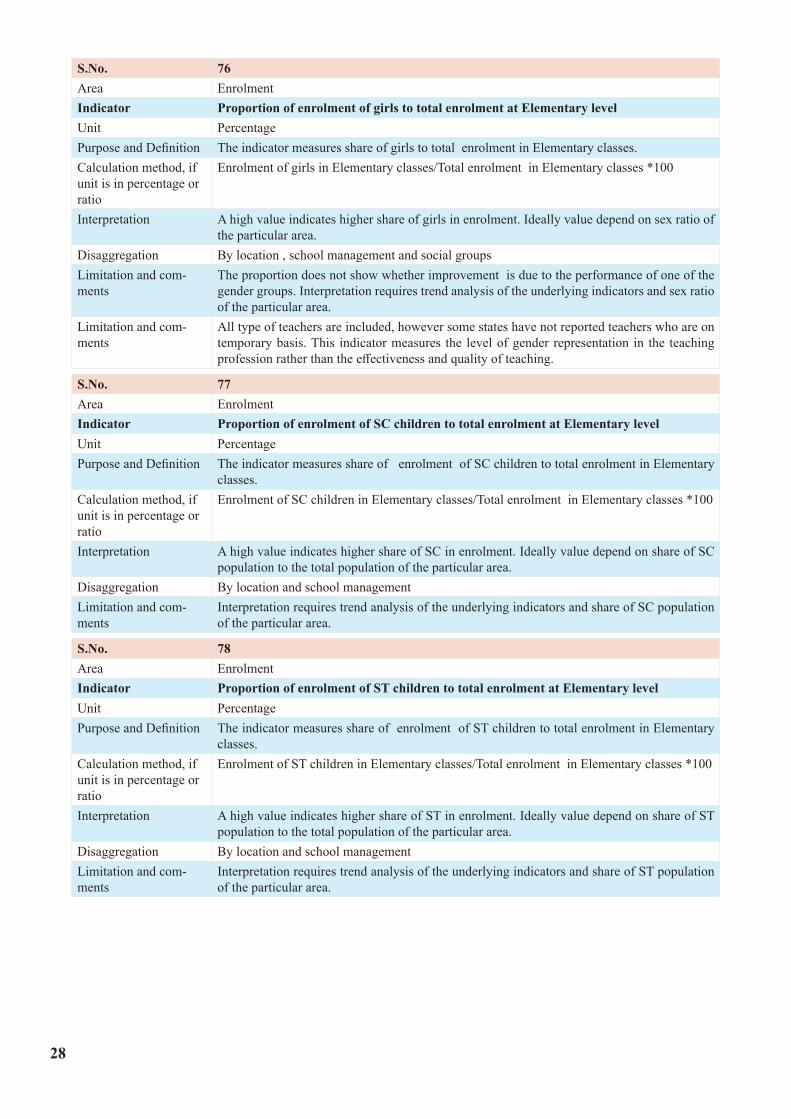


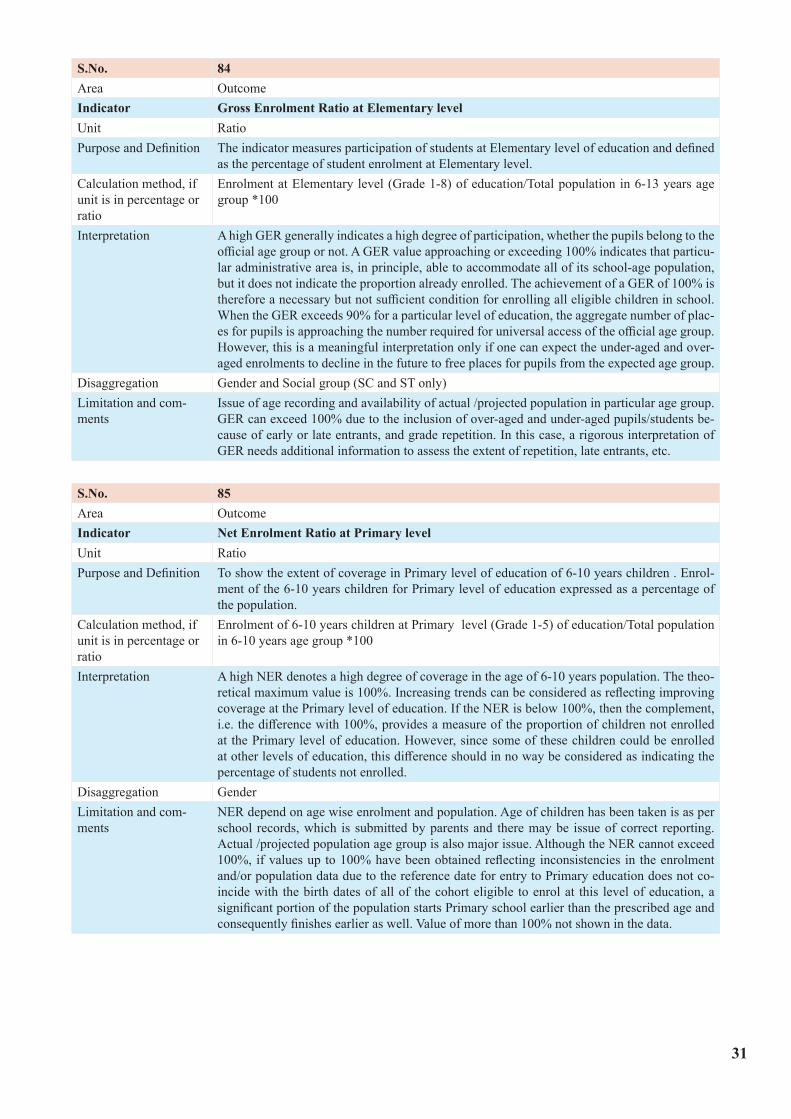


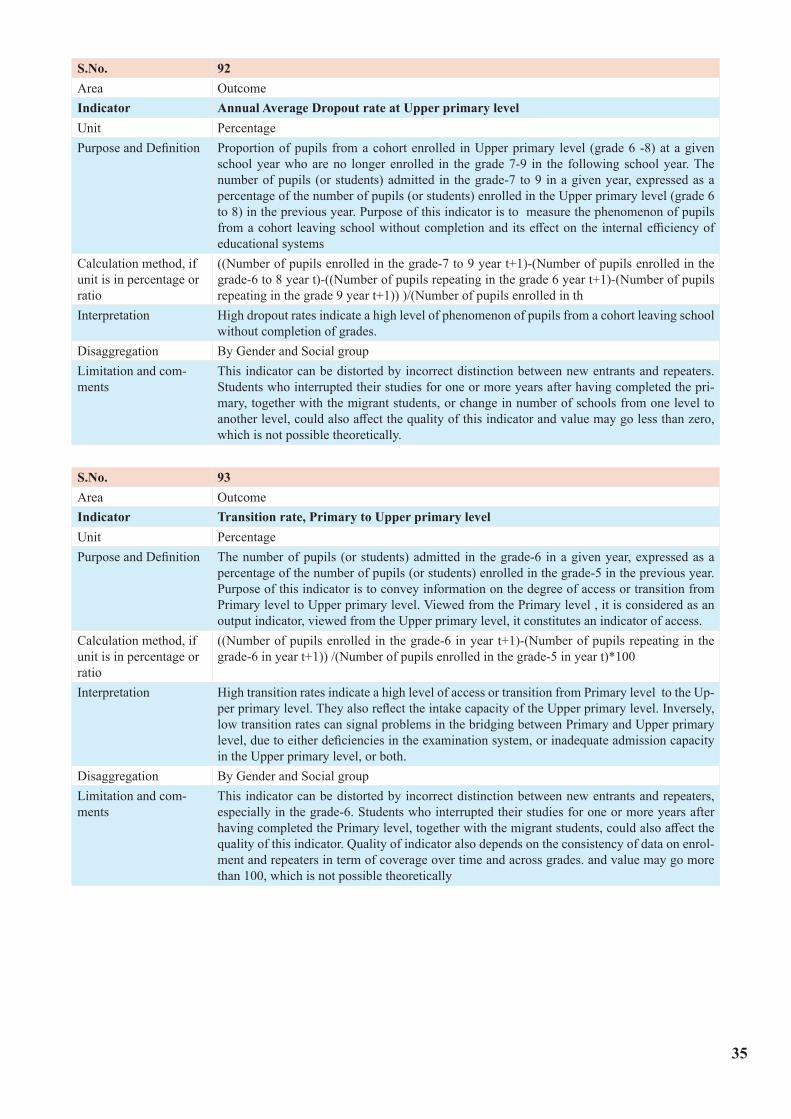

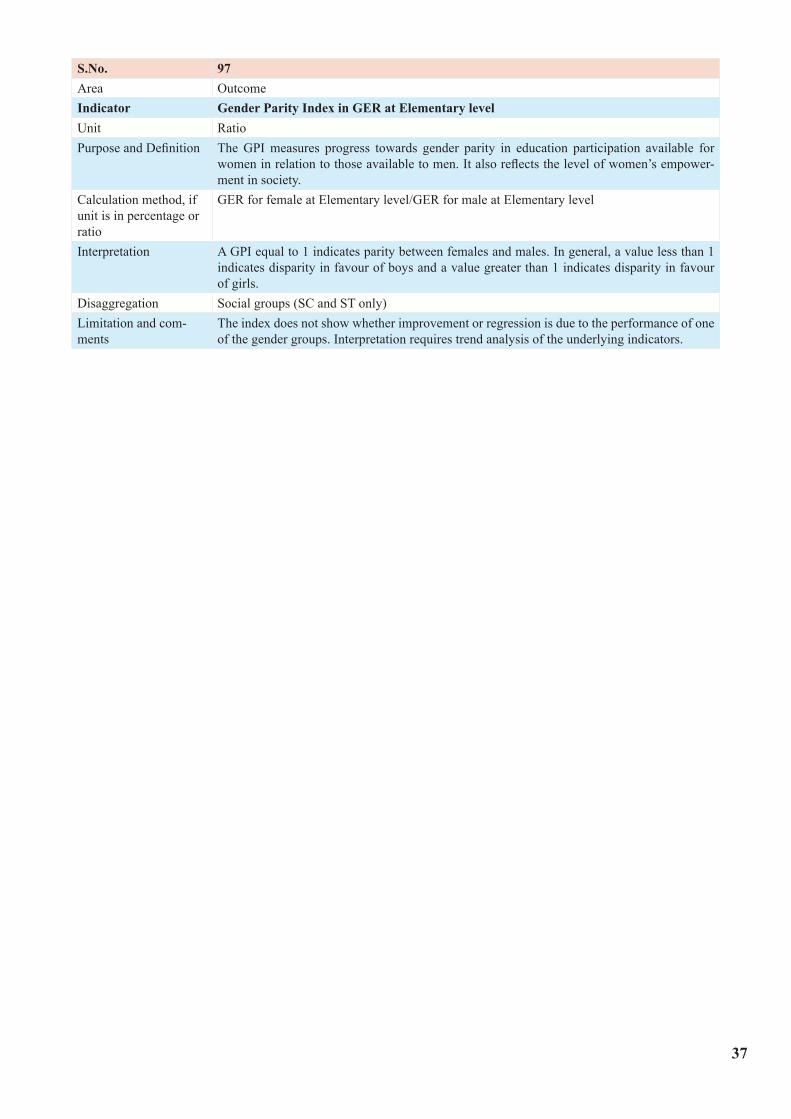


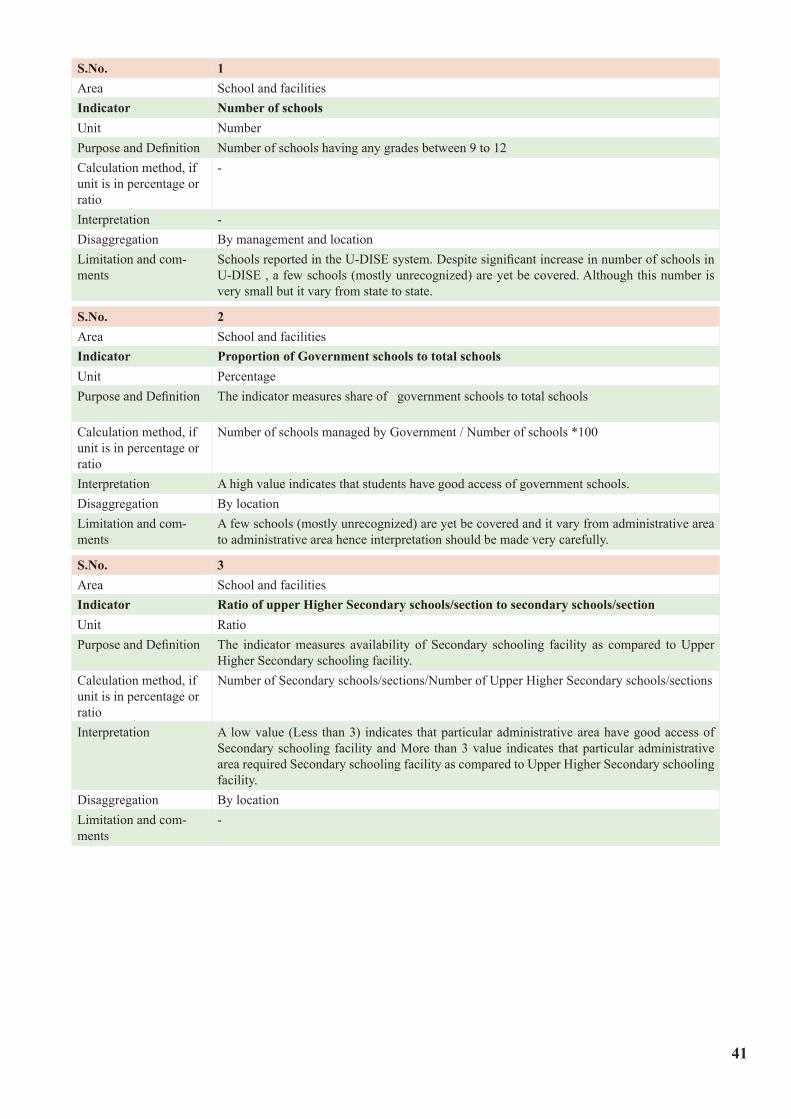

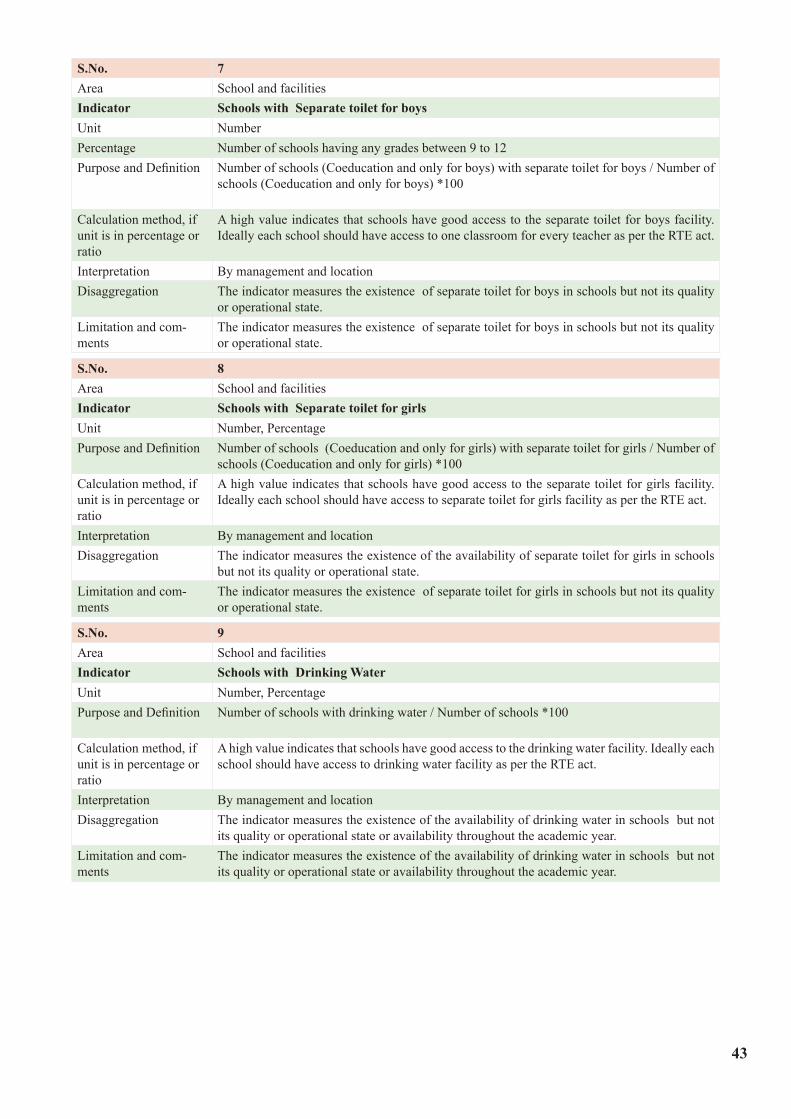
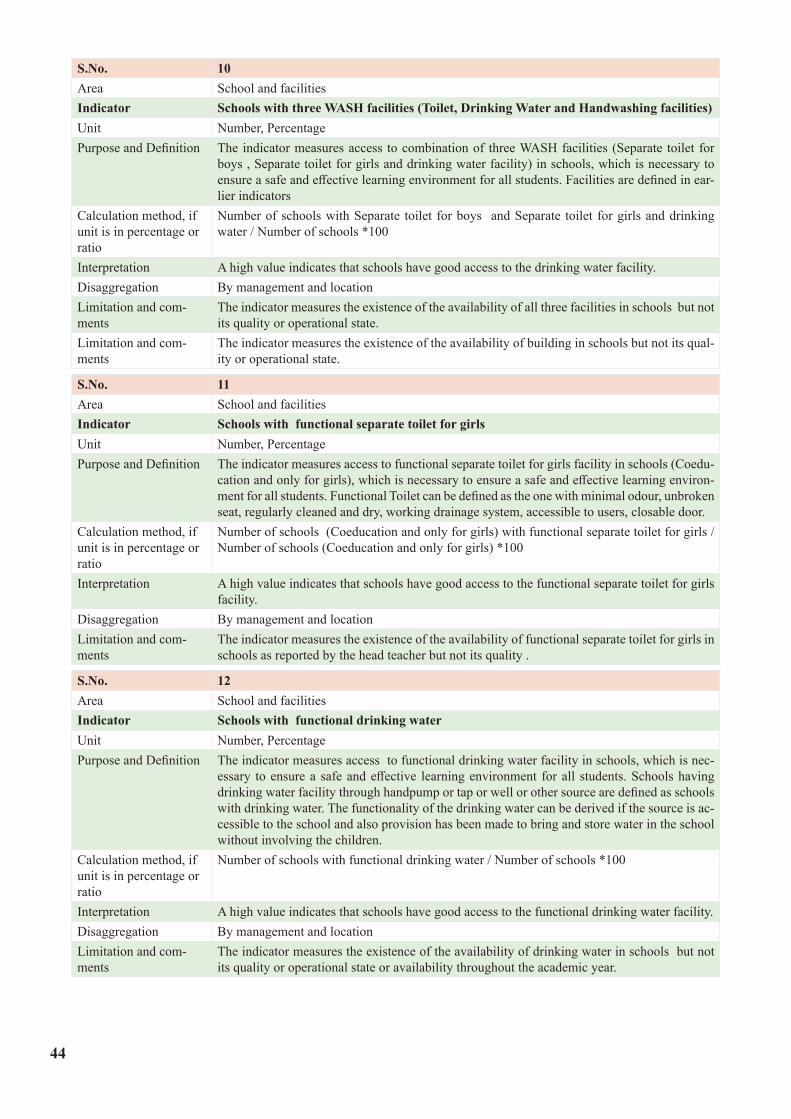

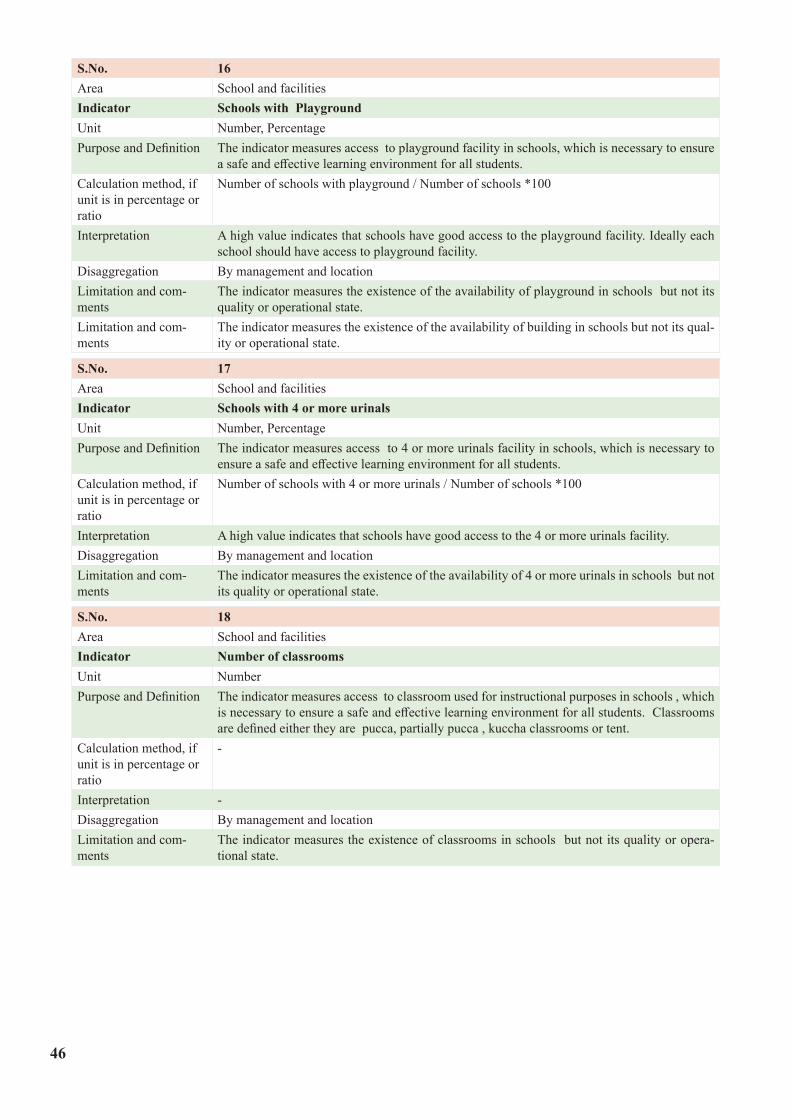


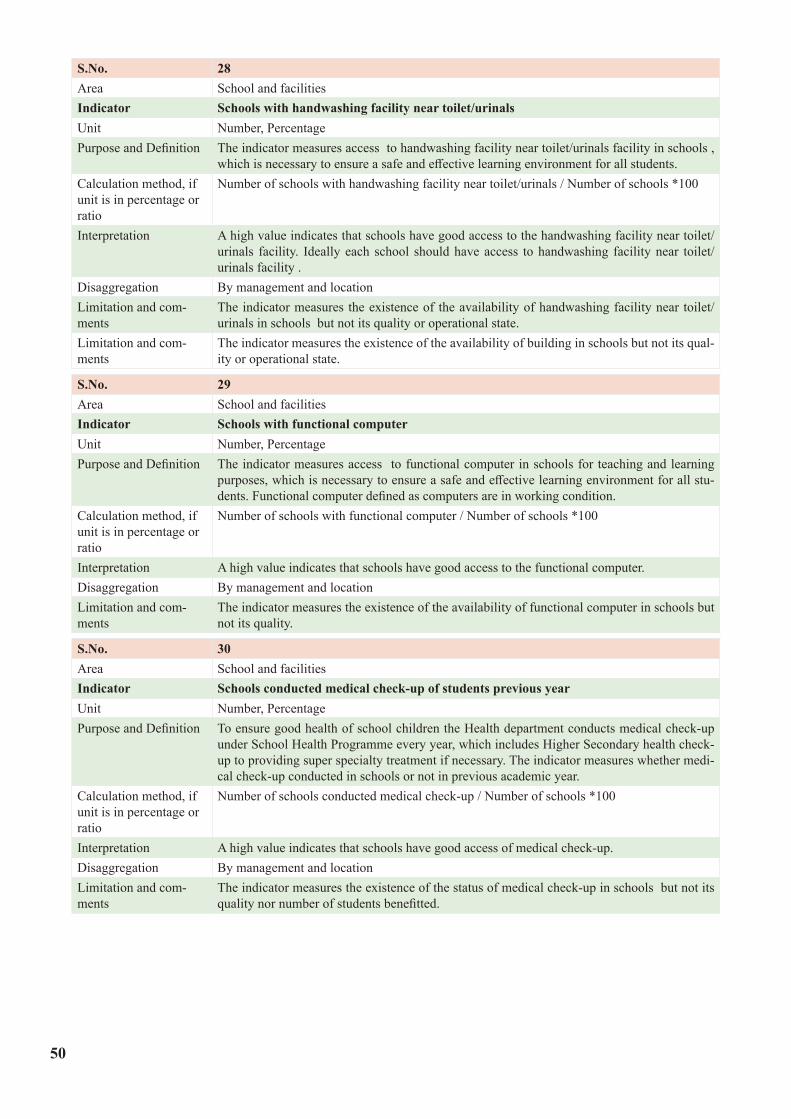
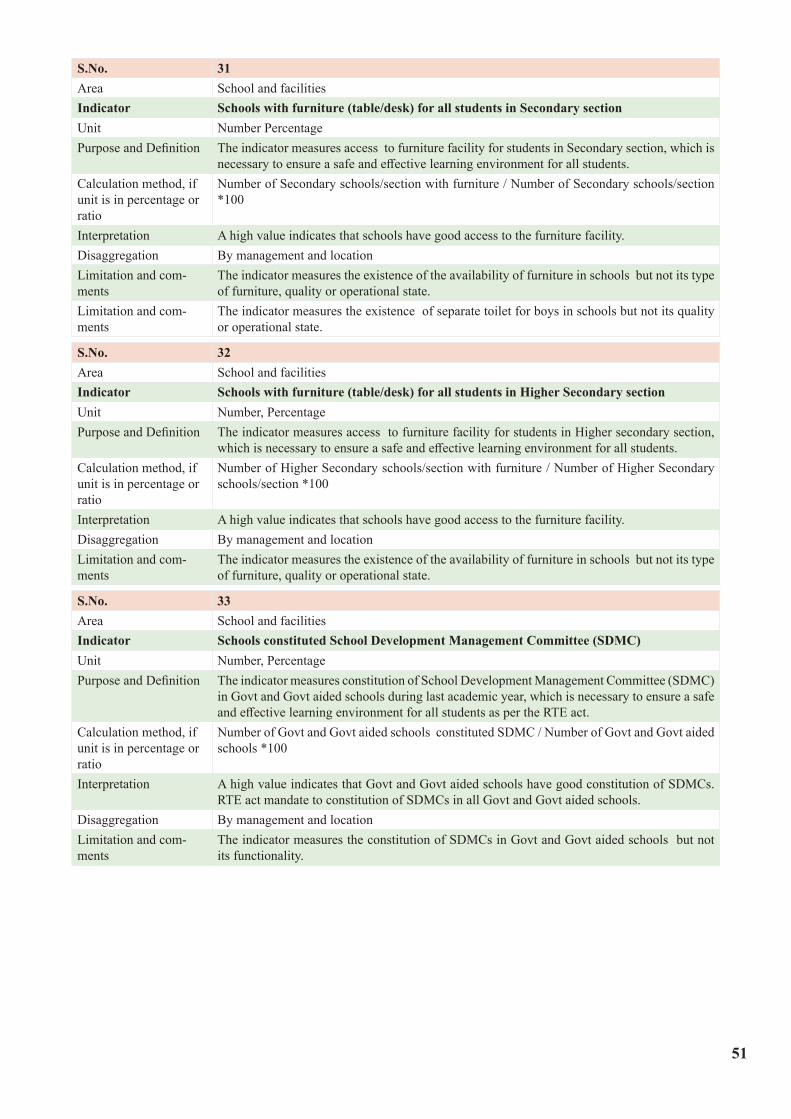
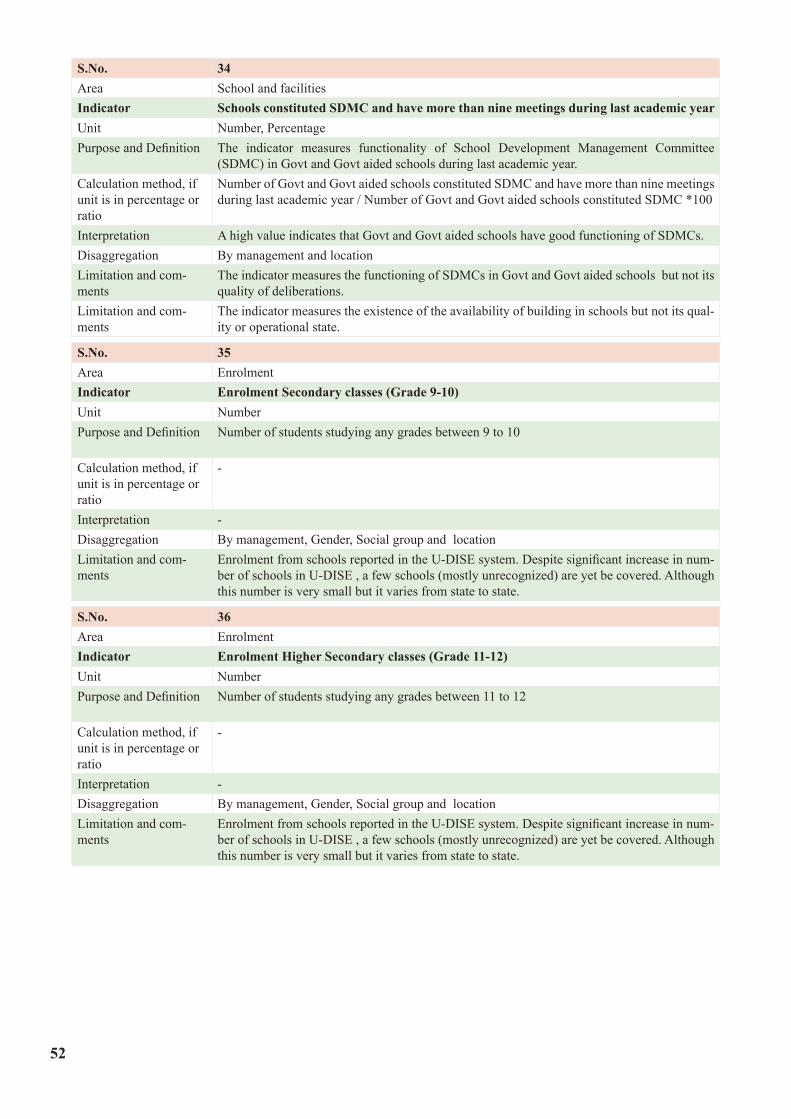

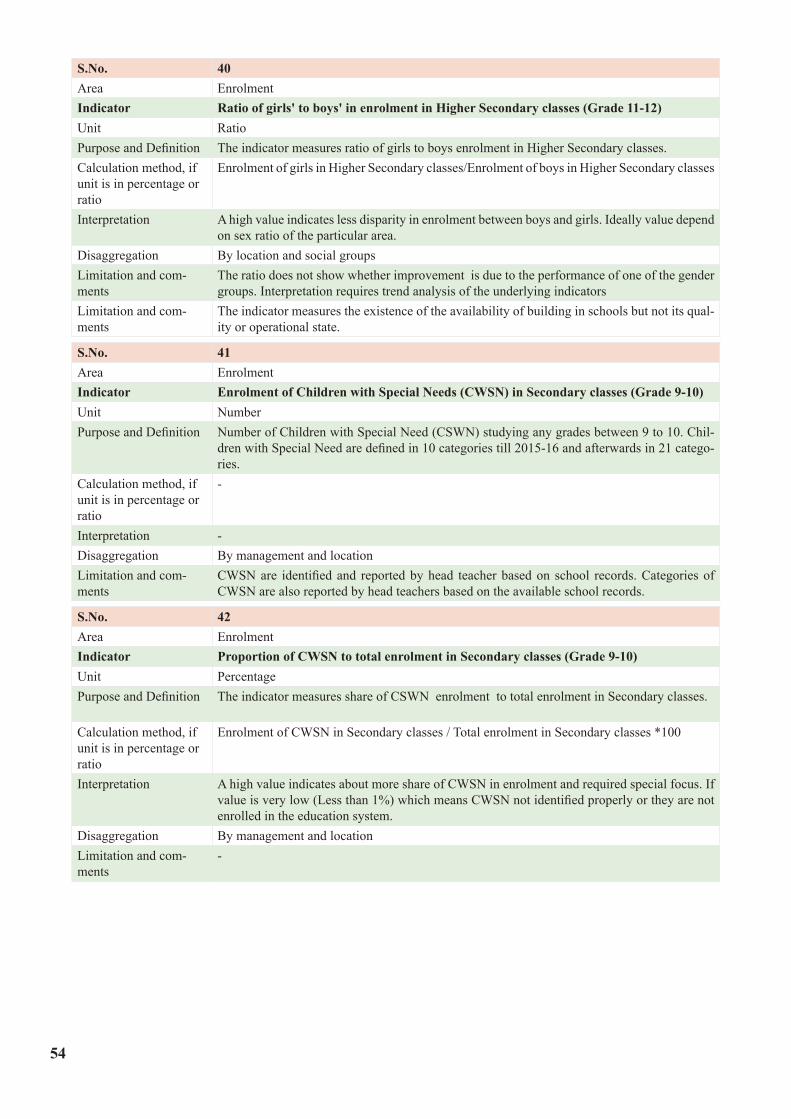


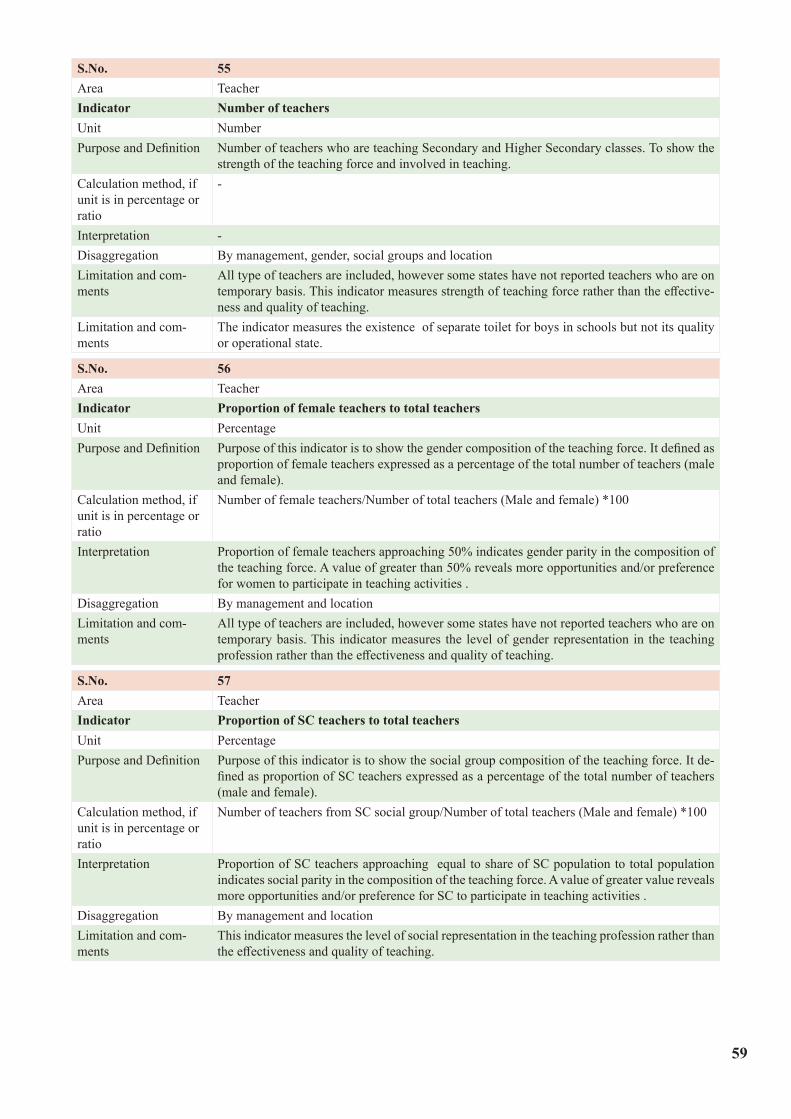

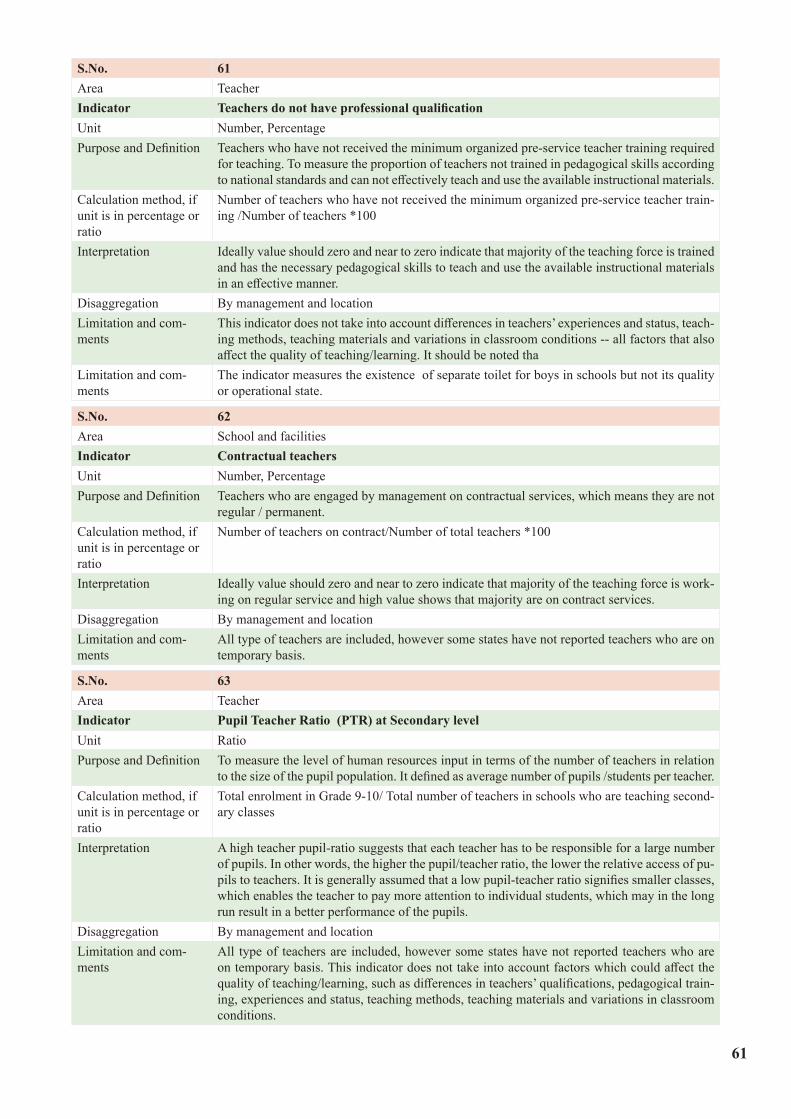
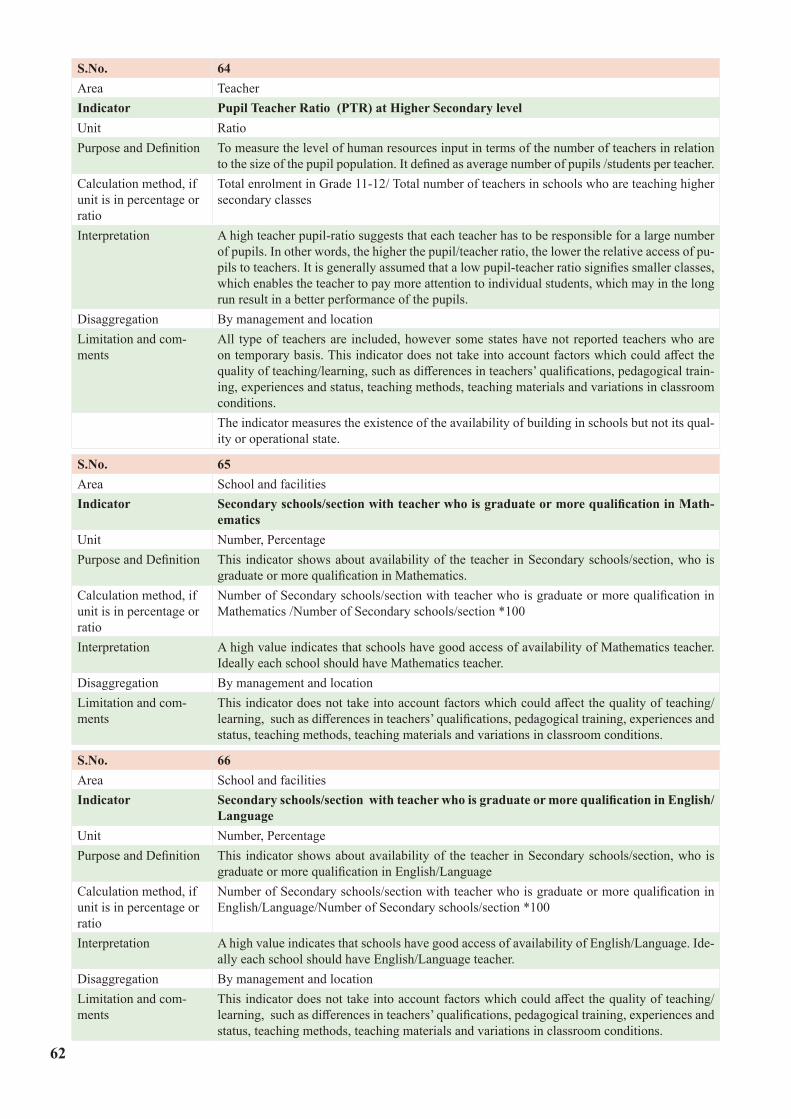


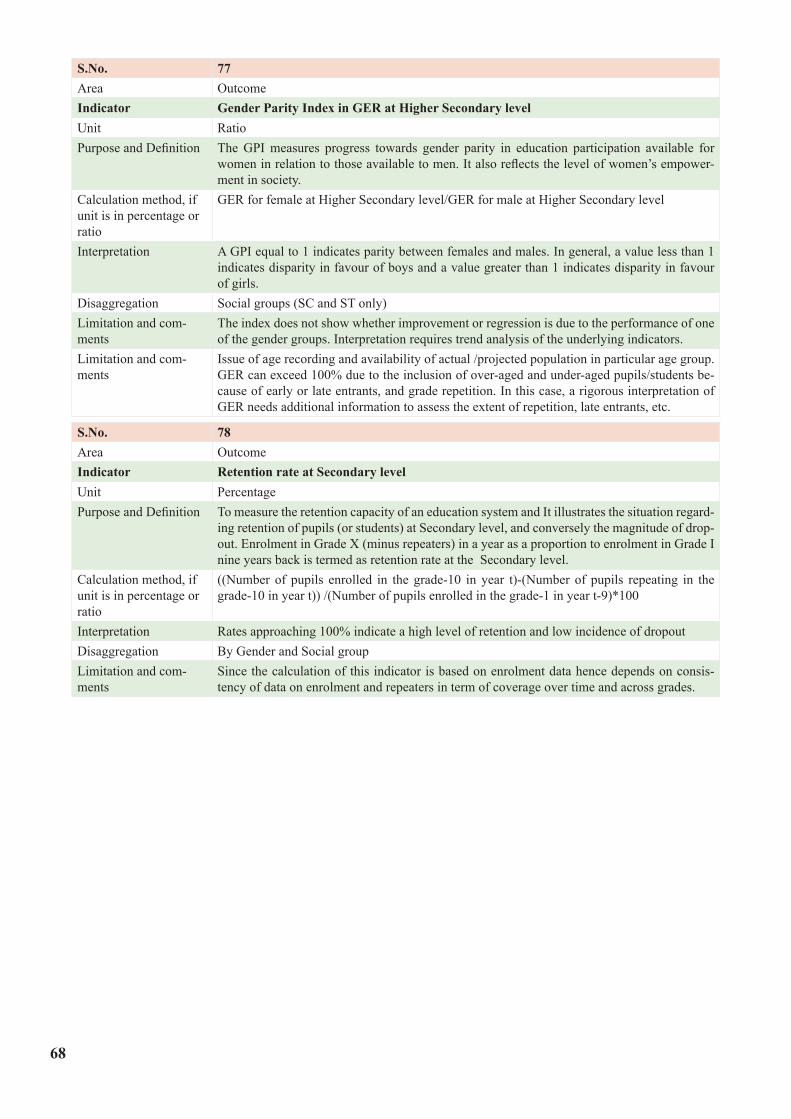


![Key Performance Indicators[1]](https://static.documents.pub/doc/80x56/55cf99af550346d0339ea5e6/key-performance-indicators1.jpg)


