41
Methanex Investor Presentation February 2020

Methanex Investor PresentationFebruary 2020
2
Forward-looking statements & non-GAAP measures
Information contained in these materials or presented orally on the earnings conference call, either in prepared remarks or in response to questions, contains forward-looking statements. Actual results could differ materially from those contemplated by the forward-looking statements. For more information, we direct you to our 2018 Annual MD&A and our fourth quarter 2019 MD&A, as well as slide 31 of this presentation.
This presentation also contains certain non-GAAP financial measures that do not have any standardized meaning and therefore are unlikely to be comparable to similar measures presented by other companies. For more information regarding these non-GAAP measures, please see our 2018 Annual MD&A and our fourth quarter 2019 MD&A.
All amounts are shown in US dollars except where otherwise stated.
3
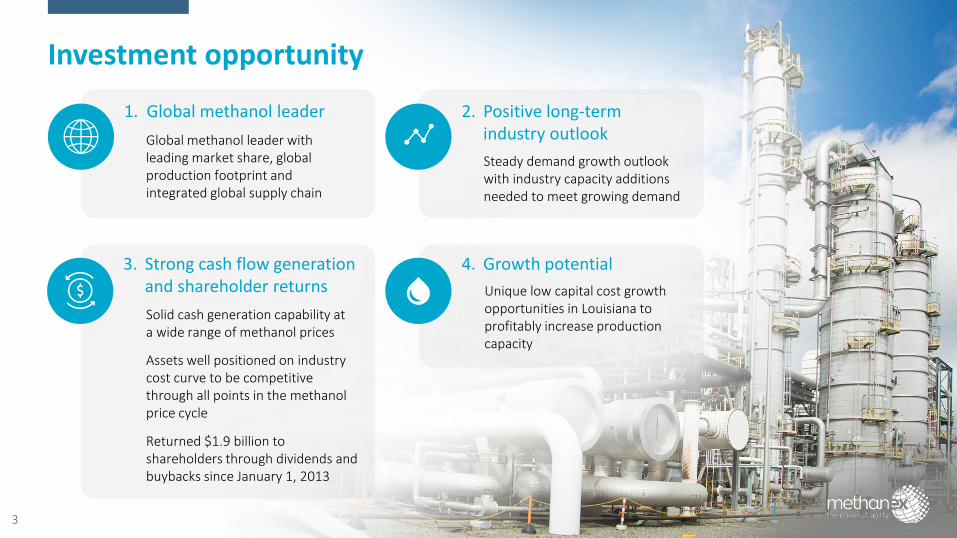
Investment opportunity
Steady demand growth outlook with industry capacity additions needed to meet growing demand
2. Positive long-term industry outlook
Solid cash generation capability ata wide range of methanol prices
Assets well positioned on industry cost curve to be competitive through all points in the methanol price cycle
Returned $1.9 billion to shareholders through dividends and buybacks since January 1, 2013
3. Strong cash flow generation and shareholder returns Unique low capital cost growth
opportunities in Louisiana to profitably increase production capacity
4. Growth potential
Global methanol leader with leading market share, global production footprint and integrated global supply chain
1. Global methanol leader

Growing production with a clear focus on shareholders
4.1 4.3 4.9 5.27.0 7.2 7.2
7.6
2012 2013 2014 2015 2016 2017 2018 2019
Production(M tonnes)
85%
43 45 53 5878 86 93 100
2012 2013 2014 2015 2016 2017 2018 2019
Production per thousand shares(tonnes)
133%
0.73 0.790.95 1.08 1.10 1.18
1.32 1.41
2012 2013 2014 2015 2016 2017 2018 2019
Annual dividend($/share) 93%
94.3 96.1 92.3 89.7 89.8 83.8 77.3 76.2
2012 2013 2014 2015 2016 2017 2018 2019
Shares outstanding(M) 19%
4
Committed to Responsible
Care®
5
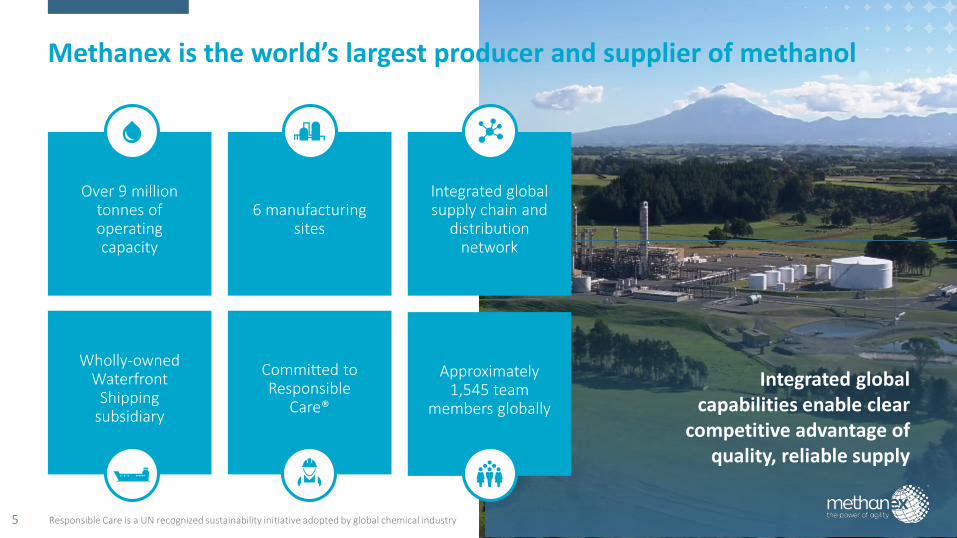
Methanex is the world’s largest producer and supplier of methanol
Integrated global capabilities enable clear
competitive advantage of quality, reliable supply
Over 9 million tonnes of operating capacity
6 manufacturing sites
Integrated global supply chain and
distribution network
Wholly-owned Waterfront
Shipping subsidiary
Approximately 1,545 team
members globally
Created by tulpahn
Responsible Care is a UN recognized sustainability initiative adopted by global chemical industry
Clean and Economic Alternative FuelTraditional Chemical Market
6
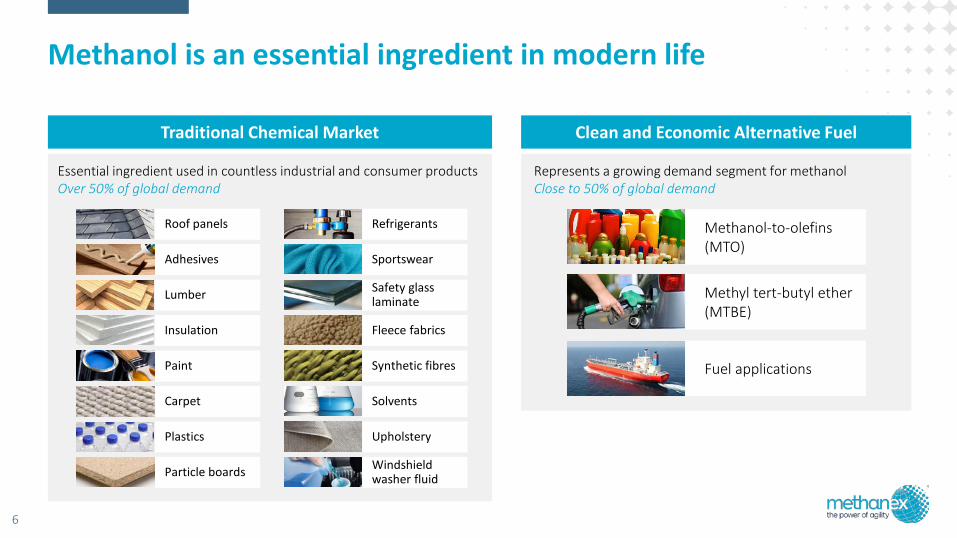
Methanol is an essential ingredient in modern life
Essential ingredient used in countless industrial and consumer products Over 50% of global demand
Roof panels
Adhesives
Lumber
Insulation
Paint
Carpet
Plastics
Particle boards
Refrigerants
Sportswear
Safety glass laminate
Fleece fabrics
Synthetic fibres
Solvents
Upholstery
Windshield washer fluid
Represents a growing demand segment for methanolClose to 50% of global demand
Fuel applications
Methyl tert-butyl ether (MTBE)
Methanol-to-olefins (MTO)
Global methanol leader,positive long-term industry outlook
7
8
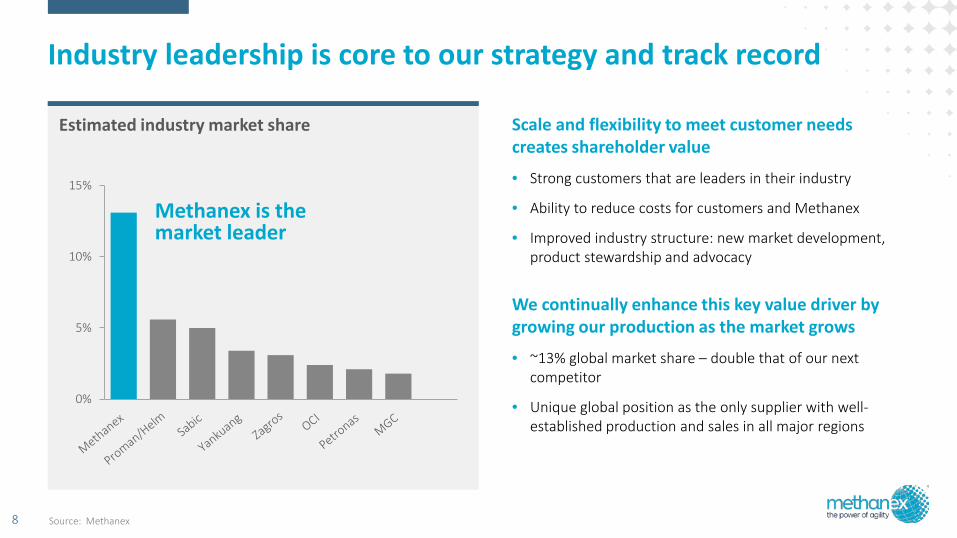
Industry leadership is core to our strategy and track record
Scale and flexibility to meet customer needs creates shareholder value
• Strong customers that are leaders in their industry
• Ability to reduce costs for customers and Methanex
• Improved industry structure: new market development, product stewardship and advocacy
We continually enhance this key value driver by growing our production as the market grows
• ~13% global market share – double that of our next competitor
• Unique global position as the only supplier with well-established production and sales in all major regions
Estimated industry market share
Source: Methanex
0%
5%
10%
15%
Methanex is the market leader
9
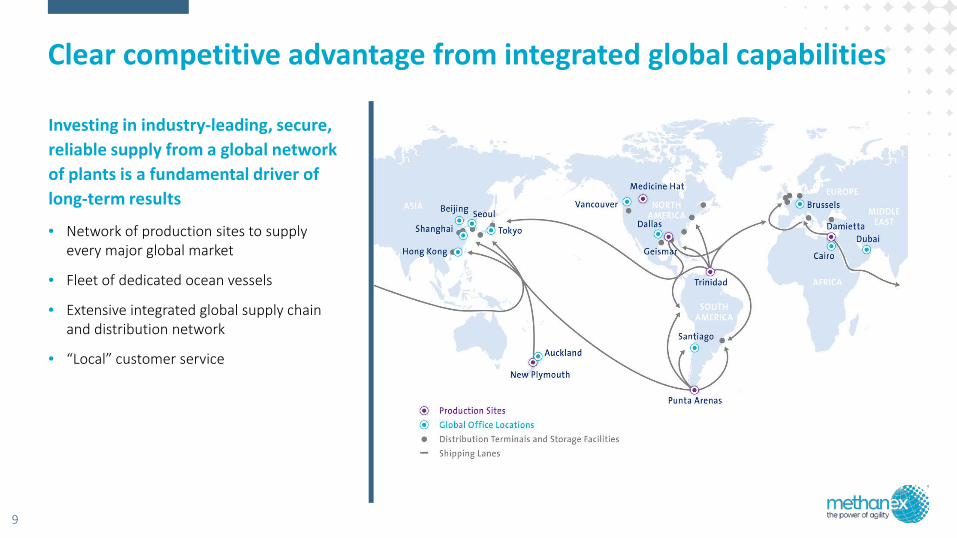
Clear competitive advantage from integrated global capabilities
Investing in industry-leading, secure, reliable supply from a global network of plants is a fundamental driver of long-term results
• Network of production sites to supply every major global market
• Fleet of dedicated ocean vessels
• Extensive integrated global supply chain and distribution network
• “Local” customer service
0123456789
10
Est. Demand Growth2020-2023
Est. Supply Growth2020-2023
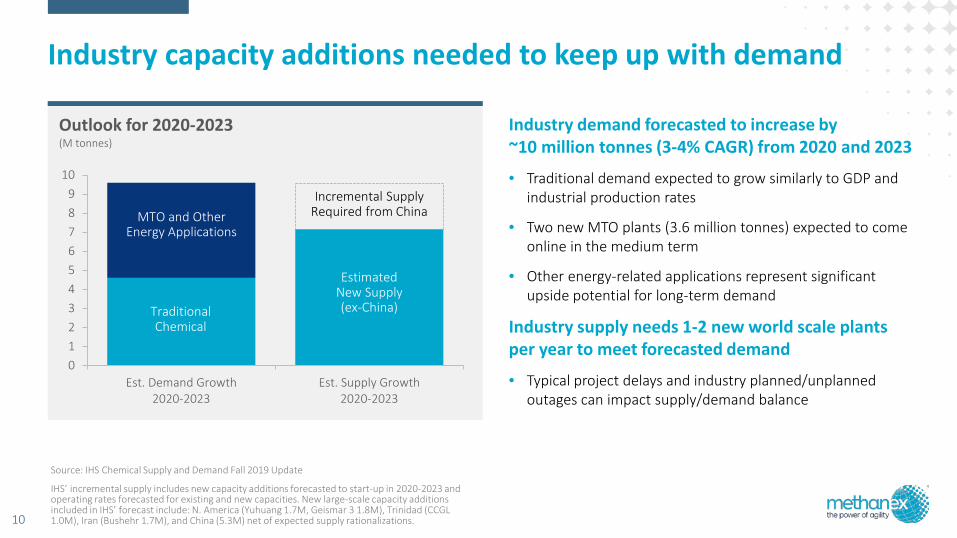
Industry capacity additions needed to keep up with demand
Industry demand forecasted to increase by~10 million tonnes (3-4% CAGR) from 2020 and 2023
• Traditional demand expected to grow similarly to GDP and industrial production rates
• Two new MTO plants (3.6 million tonnes) expected to come online in the medium term
• Other energy-related applications represent significant upside potential for long-term demand
Industry supply needs 1-2 new world scale plants per year to meet forecasted demand
• Typical project delays and industry planned/unplanned outages can impact supply/demand balance
Outlook for 2020-2023(M tonnes)
Source: IHS Chemical Supply and Demand Fall 2019 Update
IHS’ incremental supply includes new capacity additions forecasted to start-up in 2020-2023 and operating rates forecasted for existing and new capacities. New large-scale capacity additions included in IHS’ forecast include: N. America (Yuhuang 1.7M, Geismar 3 1.8M), Trinidad (CCGL 1.0M), Iran (Bushehr 1.7M), and China (5.3M) net of expected supply rationalizations.
TraditionalChemical
MTO and Other Energy Applications
Incremental Supply Required from China
EstimatedNew Supply (ex-China)
10

11
Methanol-to-olefin (MTO) producers typically have an integrated value chain
Synthesis gas MethanolNatural gas or coal feedstock
Polyethylene EDC EO Ethyl benzene Polypropylene ACN PO Cumene
Ethylene Propylene
Packaging Construction Bottles Containers Consumer goods Household & consumer goods
Building insulation, bedding
Eyeglasses, computers
PVC MEG Styrene Synthetic rubbers Polyether polyols Phenol
PET Polystyrene Polycarbonates/Phenolic resinsPolyurethane

12
Methanol is a clean-burning alternative fuel
Represents significant upside potential for long-term demand
• Regulations (IMO 2020) lead towards cleaner-burning fuels
• Methanol is a clean-burning fuel that meets regulations and is cost competitive over the cycle
• Approximately 40% of Waterfront Shipping’s fleet is able to run on methanol
Marine Fuel
VehicleFuel
Power Source
• Methanol is an affordable gasoline substitute in China
• Reduces emissions when blended with or substituted for gasoline
• Several other countries are at the assessment or near-commercial stage for low-level methanol fuel blending
• Methanol is used as an alternative to coal for industrial boilers and kilns to reduce emissions
• Currently represents approximately two million tons of demand

Challenges to growth in the methanol industry
Building a methanol plant has a significantcapital cost
• US Gulf Coast stand-alone greenfield project (~$1,100/tonne) requires a long-term methanol price of $400/tonne to meet Methanex’s return target
Industry often sees project delays/cancellations
• Inability to secure necessary financing and permits
• Inability to access credit worthy customers and secure sales contracts across global markets
• Lack of marketing and logistics capabilities to get product to market
• Lack of market knowledge and expertise in industry
Estimated internal rate of return
Key assumptions: replacement cost of $1,100/tonne based on other announced projects. Maintenance capital $10M/year, freight $80/tonne (US to Asia), 25% tax rate, 2% inflation.
Realized methanol price$/tonneNatural gas
$/mmbtu $300 $350 $400
$5.00 --- 2% 8%
$4.00 0% 6% 11%
$3.00 5% 9% 13%
$2.00 8% 12% 16%
13

Methanex is well positioned on the global industry cost curve
• Methanex plants are competitive across a wide range of methanol prices – we estimate that our assets are positioned on the low-to-mid portion of the industry cost curve
• Flat portion of cost curve provides price support in a low energy price environment
• Industry has high cost operators and responds quickly to periods of excess supply or demand
• Steep high end of cost curve reflects high cost coal and natural gas-based production in China
• Other higher cost regions are Russia, Europe, India, and South America
Illustrative methanol industry cost curve ($/tonne)
45 55 65 75 85
Global Production (million tonnes)
Global methanol demand
14
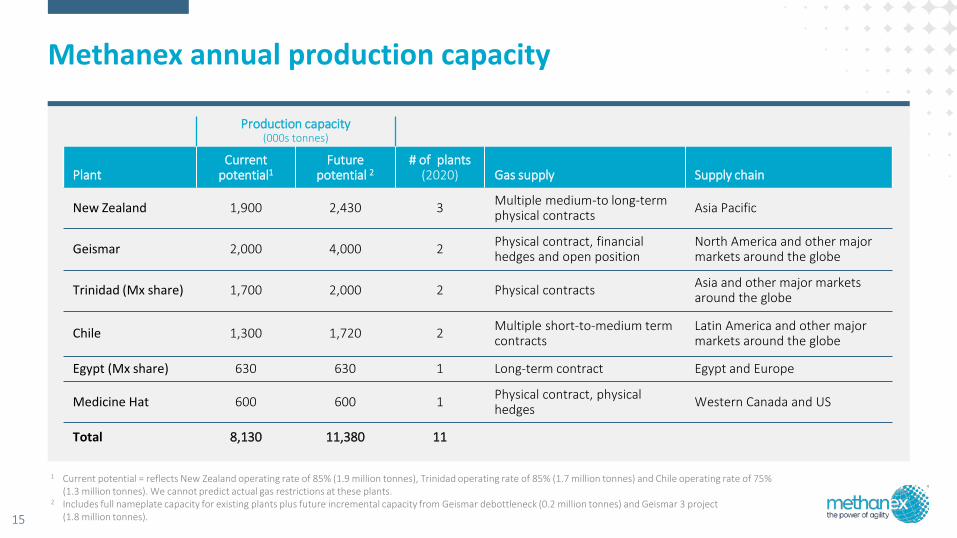
Methanex annual production capacity
1 Current potential = reflects New Zealand operating rate of 85% (1.9 million tonnes), Trinidad operating rate of 85% (1.7 million tonnes) and Chile operating rate of 75% (1.3 million tonnes). We cannot predict actual gas restrictions at these plants.
2 Includes full nameplate capacity for existing plants plus future incremental capacity from Geismar debottleneck (0.2 million tonnes) and Geismar 3 project(1.8 million tonnes).
Production capacity (000s tonnes)
PlantCurrent
potential1Future
potential 2# of plants
(2020) Gas supply Supply chain
New Zealand 1,900 2,430 3 Multiple medium-to long-term physical contracts Asia Pacific
Geismar 2,000 4,000 2 Physical contract, financial hedges and open position
North America and other major markets around the globe
Trinidad (Mx share) 1,700 2,000 2 Physical contracts Asia and other major markets around the globe
Chile 1,300 1,720 2 Multiple short-to-medium term contracts
Latin America and other major markets around the globe
Egypt (Mx share) 630 630 1 Long-term contract Egypt and Europe
Medicine Hat 600 600 1 Physical contract, physical hedges Western Canada and US
Total 8,130 11,380 11
15

Strong cash flow generation at a wide range of methanol prices
16
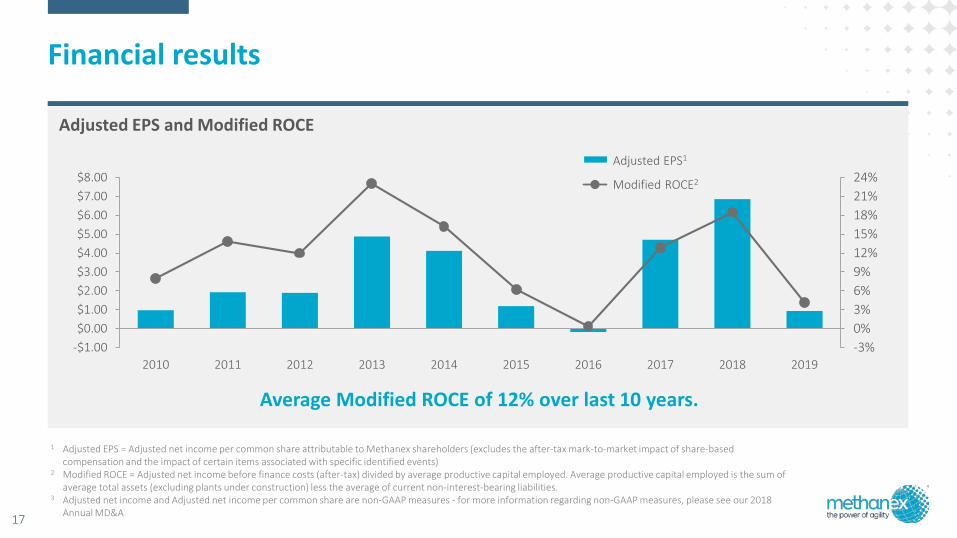
Financial results
Adjusted EPS and Modified ROCE
1 Adjusted EPS = Adjusted net income per common share attributable to Methanex shareholders (excludes the after-tax mark-to-market impact of share-based compensation and the impact of certain items associated with specific identified events)
2 Modified ROCE = Adjusted net income before finance costs (after-tax) divided by average productive capital employed. Average productive capital employed is the sum of average total assets (excluding plants under construction) less the average of current non-interest-bearing liabilities.
3 Adjusted net income and Adjusted net income per common share are non-GAAP measures - for more information regarding non-GAAP measures, please see our 2018 Annual MD&A
-3%0%3%6%9%12%15%18%21%24%
-$1.00$0.00$1.00$2.00$3.00$4.00$5.00$6.00$7.00$8.00
2010 2011 2012 2013 2014 2015 2016 2017 2018 2019
Average Modified ROCE of 12% over last 10 years.
Adjusted EPS1
Modified ROCE2
17
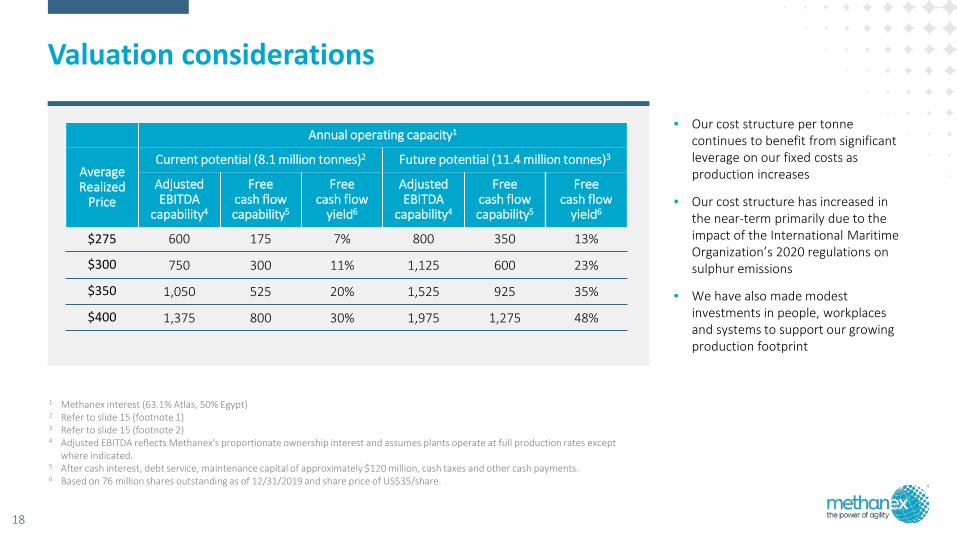
Valuation considerations
1 Methanex interest (63.1% Atlas, 50% Egypt)2 Refer to slide 15 (footnote 1)3 Refer to slide 15 (footnote 2)4 Adjusted EBITDA reflects Methanex's proportionate ownership interest and assumes plants operate at full production rates except
where indicated. 5 After cash interest, debt service, maintenance capital of approximately $120 million, cash taxes and other cash payments.6 Based on 76 million shares outstanding as of 12/31/2019 and share price of US$35/share.
Annual operating capacity1
Average Realized
Price
Current potential (8.1 million tonnes)2 Future potential (11.4 million tonnes)3
Adjusted EBITDA
capability4
Free cash flow capability5
Free cash flow
yield6
Adjusted EBITDA
capability4
Free cash flow capability5
Free cash flow
yield6
$275 600 175 7% 800 350 13%
$300 750 300 11% 1,125 600 23%
$350 1,050 525 20% 1,525 925 35%
$400 1,375 800 30% 1,975 1,275 48%
• Our cost structure per tonne continues to benefit from significant leverage on our fixed costs as production increases
• Our cost structure has increased in the near-term primarily due to the impact of the International Maritime Organization’s 2020 regulations on sulphur emissions
• We have also made modest investments in people, workplaces and systems to support our growing production footprint
18

19
Valuation considerations (continued)
Sensitivities versus run-rate of:
• Average realized price: $350/tonne
• Volume: 8.1 million tonnes
• Adjusted EBITDA capability: $1.1 billion
• Free cash flow capability: $525 million
Estimated sensitivities ($Millions)
-80 -60 -40 -20 0 20 40 60 80
FCF +/- 100,000 tonnes volume
EBITDA +/- 100,000 tonnes volume
FCF +/- $10/tonne ARP
EBITDA +/- $10/tonne ARP

20
Short-term earnings can be impacted by various factors
Different factors can impact our earnings on a quarter-on-quarter basis but are less impactful over the long-term
• Difference between posted and realized prices can vary:
• Higher prices can reduce/narrow our discount rate
• Lower prices can increase/widen our discount rate
• FIFO inventory accounting can impact cost of sales:
• Cost of sales can decrease in a rising price environment
• Cost of sales can increase in a falling price environment
• Shipment timing can result in a short-term inventory build or draw position
• Planned/unplanned outages can impact logistics costs as we move product globally to serve our customers
Stable priceenvironnent
Rising priceenvironment
Declining priceenvironment
Illustrative impact on earnings($/tonne)
Margins at a given price are generally higher in a rising
price environment
Margins are generally lower in a declining price
environment
Highly disciplined approach to capital allocation
21
22
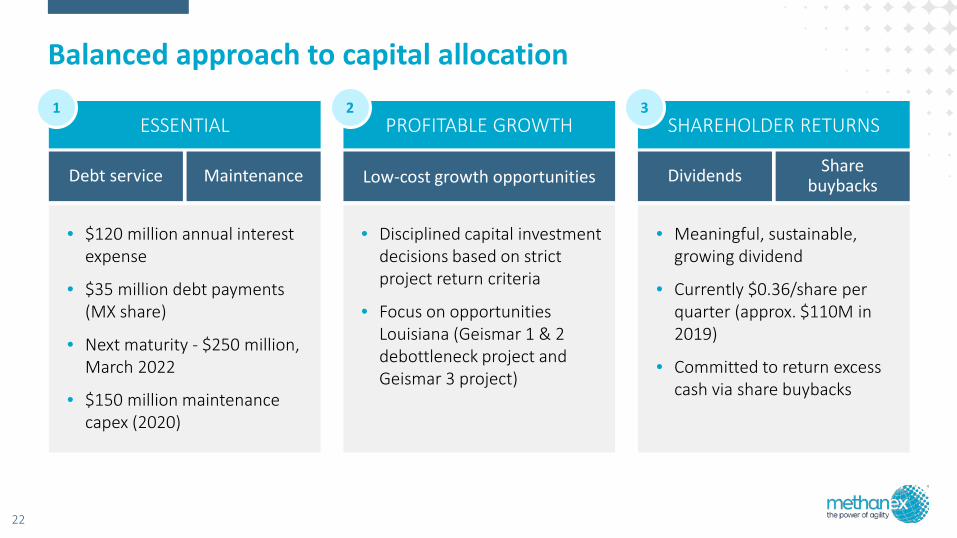
Balanced approach to capital allocation
• $120 million annual interest expense
• $35 million debt payments (MX share)
• Next maturity - $250 million, March 2022
• $150 million maintenance capex (2020)
• Meaningful, sustainable, growing dividend
• Currently $0.36/share per quarter (approx. $110M in 2019)
• Committed to return excess cash via share buybacks
• Disciplined capital investment decisions based on strict project return criteria
• Focus on opportunities Louisiana (Geismar 1 & 2 debottleneck project and Geismar 3 project)
ESSENTIAL PROFITABLE GROWTH SHAREHOLDER RETURNS
Debt service Maintenance Dividends Share buybacksLow-cost growth opportunities
1 2 3
23
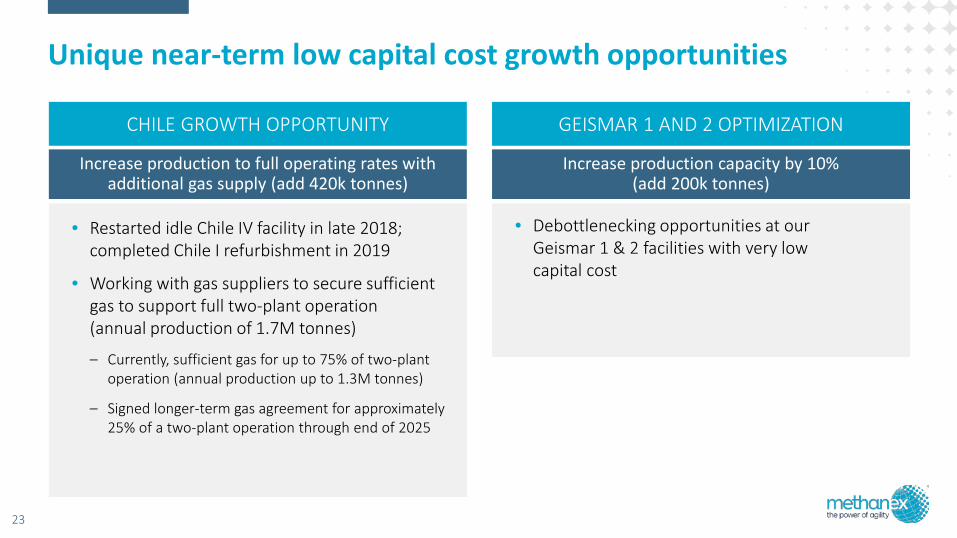
Unique near-term low capital cost growth opportunities
• Restarted idle Chile IV facility in late 2018; completed Chile I refurbishment in 2019
• Working with gas suppliers to secure sufficient gas to support full two-plant operation(annual production of 1.7M tonnes)
– Currently, sufficient gas for up to 75% of two-plant operation (annual production up to 1.3M tonnes)
– Signed longer-term gas agreement for approximately 25% of a two-plant operation through end of 2025
CHILE GROWTH OPPORTUNITY
Increase production to full operating rates with additional gas supply (add 420k tonnes)
• Debottlenecking opportunities at our Geismar 1 & 2 facilities with very low capital cost
GEISMAR 1 AND 2 OPTIMIZATION
Increase production capacity by 10%(add 200k tonnes)
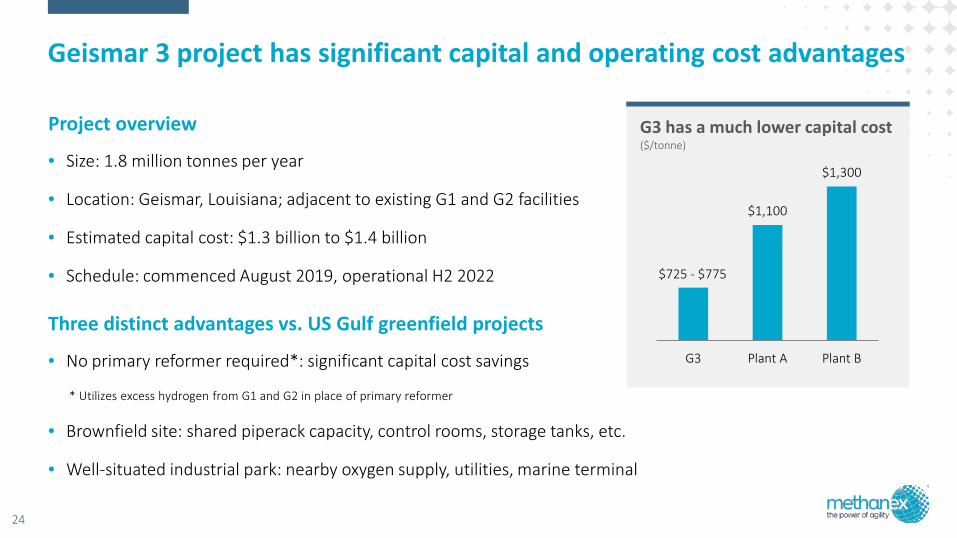
Project overview
• Size: 1.8 million tonnes per year
• Location: Geismar, Louisiana; adjacent to existing G1 and G2 facilities
• Estimated capital cost: $1.3 billion to $1.4 billion
• Schedule: commenced August 2019, operational H2 2022
Three distinct advantages vs. US Gulf greenfield projects
• No primary reformer required*: significant capital cost savings
* Utilizes excess hydrogen from G1 and G2 in place of primary reformer
• Brownfield site: shared piperack capacity, control rooms, storage tanks, etc.
• Well-situated industrial park: nearby oxygen supply, utilities, marine terminal
24
Geismar 3 project has significant capital and operating cost advantages
G3 has a much lower capital cost($/tonne)
$1,100
$1,300
G3 Plant A Plant B
$725 - $775
25
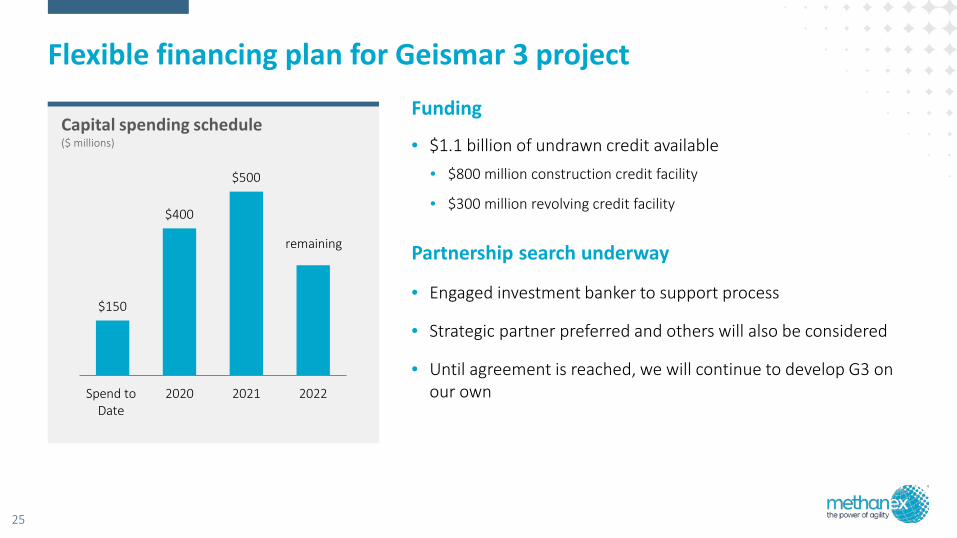
Flexible financing plan for Geismar 3 project
35Acres
Funding
• $1.1 billion of undrawn credit available• $800 million construction credit facility
• $300 million revolving credit facility
Partnership search underway
• Engaged investment banker to support process
• Strategic partner preferred and others will also be considered
• Until agreement is reached, we will continue to develop G3 on our own
35Acres
Capital spending schedule ($ millions)
$150
$400
$500
Spend toDate
2020 2021 2022
remaining
26
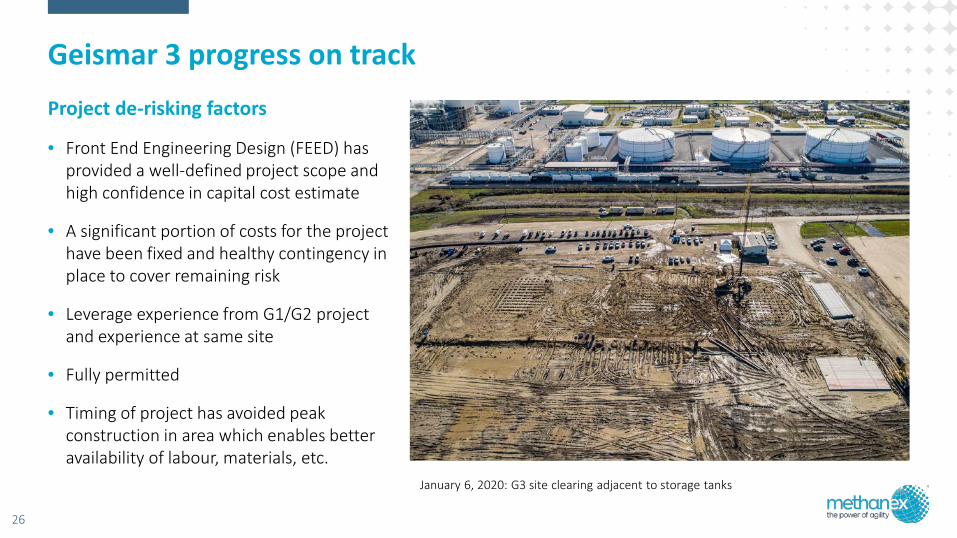
Geismar 3 progress on track
Project de-risking factors
• Front End Engineering Design (FEED) has provided a well-defined project scope and high confidence in capital cost estimate
• A significant portion of costs for the project have been fixed and healthy contingency in place to cover remaining risk
• Leverage experience from G1/G2 project and experience at same site
• Fully permitted
• Timing of project has avoided peak construction in area which enables better availability of labour, materials, etc.
January 6, 2020: G3 site clearing adjacent to storage tanks
27
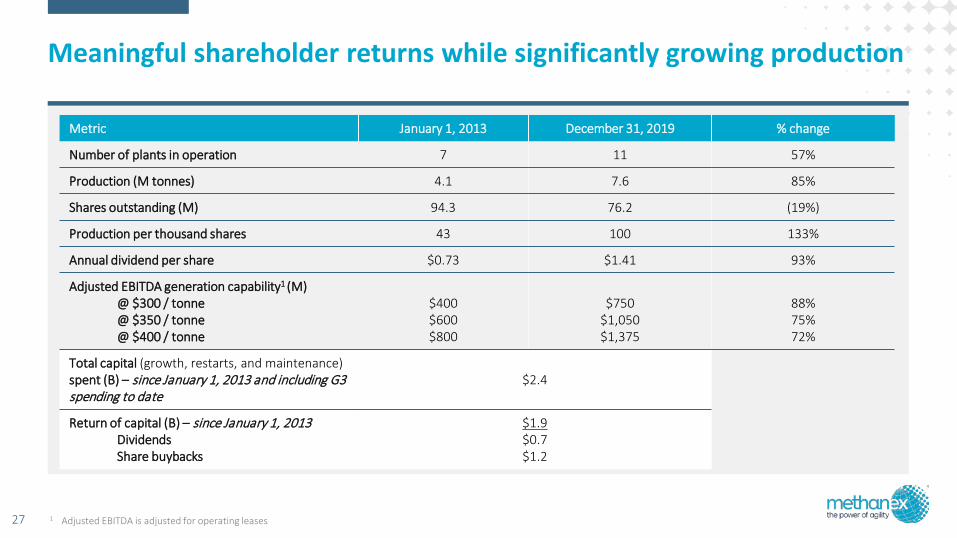
Meaningful shareholder returns while significantly growing production
Metric January 1, 2013 December 31, 2019 % change
Number of plants in operation 7 11 57%
Production (M tonnes) 4.1 7.6 85%
Shares outstanding (M) 94.3 76.2 (19%)
Production per thousand shares 43 100 133%
Annual dividend per share $0.73 $1.41 93%
Adjusted EBITDA generation capability1 (M)@ $300 / tonne@ $350 / tonne@ $400 / tonne
$400 $600 $800
$750$1,050$1,375
88%75%72%
Total capital (growth, restarts, and maintenance) spent (B) – since January 1, 2013 and including G3 spending to date
$2.4
Return of capital (B) – since January 1, 2013 DividendsShare buybacks
$1.9$0.7$1.2
1 Adjusted EBITDA is adjusted for operating leases

28
Consistent track record of returning excess cash to shareholders• During the development
of G1 and G2, we continued to return significant capital to shareholders
• Since January 1, 2013, we have invested over $2.4 billion in capital expenditures and grew from 7 to 11 plants in operation, with production increasing from 4.1 to 7.6 million tonnes
• Increased dividend by 9% in 2019
G1 & G2 builds
$660 million of capital returned
75 90 97 99 101 106 108
253146
286
444
5375
343
243
99
387
550
161
2013 2014 2015 2016 2017 2018 2019
Dividends Share buybacks
~$1.9 billion of capital returned to shareholders (Jan 1, 2013 to Dec 31, 2019)
Dividends and share buybacks ($ millions)

29
Strong financial position and liquidity
Liquidity as at Q4-19
1 Includes Methanex proportionate share of cash and debt2 Based on share price of US$35/share
Cash (MX share) 1 $428
Revolving credit facility $300
Construction credit facility $800
Total shareholders’ equity $1,332
Net debt 1 $1,224
Net debt/capitalization 48%
Net debt/enterprise value2 31%
Capital structure as at Q4-19
250 300
700
300
2022 … 2024 … … 2029 … … 2044
Balanced debt maturity schedule ($millions)
Rating agency perspective
• Target investment grade metrics over cycle
• ~3.0x debt/EBITDA is long-term measure
• Ratio typically calculated over a cycle
• Moody’s Baa3 | S&P BB+ | Fitch BBB-

30
Summary
• Global industry leader with competitive assets
• Solid franchise value that is difficult to replicate
• Global marketing, supply chain and shipping network
• Strong financial position
• Strong cash generation at a wide range of methanol prices
• Low capital cost growth potential in Louisiana
• Dividends / share buybacks
Committed to return excess cash to shareholders
31
Forward-looking information This presentation, our Fourth Quarter 2019 Management’s Discussion and Analysis (“MD&”A) as well as comments made during the Fourth Quarter 2019 Investor Conference call contain forward-looking statements with respectto us and our industry. These statements relate to future events or our future performance. All statements other than statements of historical fact are forward-looking statements. Statements that include the words "believes,""expects," "may," "will," "should," "potential," "estimates," "anticipates," "aim," "goal", "targets" or other comparable terminology and similar statements of a future or forward-looking nature identify forward-looking statements.
More particularly and without limitation, any statements regarding the following are forward-looking statements: expected demand for methanol and its derivatives; expected new methanol supply or restart of idled capacity andtiming for start-up of the same; expected shutdowns (either temporary or permanent) or restarts of existing methanol supply (including our own facilities), including, without limitation, the timing and length of plannedmaintenance outages; expected methanol and energy prices; expected levels of methanol purchases from traders or other third parties; expected levels, timing and availability of economically priced natural gas supply to each ofour plants; capital committed by third parties towards future natural gas exploration and development in the vicinity of our plants; our expected capital expenditures; anticipated operating rates of our plants; expected operatingcosts, including natural gas feedstock costs and logistics costs; expected tax rates or resolutions to tax disputes; expected cash flows, earnings capability and share price; availability of committed credit facilities and other financing;our ability to meet covenants or obtain or continue to obtain waivers associated with our long-term debt obligations, including, without limitation, the Egypt limited recourse debt facilities that have conditions associated with thepayment of cash or other distributions and the finalization of certain land title registrations and related mortgages which require actions by Egyptian governmental entities; expected impact on our results of operations in Egypt orour financial condition as a consequence of actions taken or inaction by Egyptian governmental entities; our shareholder distribution strategy and anticipated distributions to shareholders; commercial viability and timing of, or ourability to execute future projects, plant restarts, capacity expansions, plant relocations or other business initiatives or opportunities, including our Geismar 3 Project; our financial strength and ability to meet future financialcommitments; expected global or regional economic activity (including industrial production levels); expected outcomes of litigation or other disputes, claims and assessments; and expected actions of governments, governmentalagencies, gas suppliers, courts, tribunals or other third parties.
We believe that we have a reasonable basis for making such forward-looking statements. The forward-looking statements in this document are based on our experience, our perception of trends, current conditions and expectedfuture developments as well as other factors. Certain material factors or assumptions were applied in drawing the conclusions or making the forecasts or projections that are included in these forward-looking statements, including,without limitation, future expectations and assumptions concerning the following: the supply of, demand for and price of methanol, methanol derivatives, natural gas, coal, oil and oil derivatives; our ability to procure natural gasfeedstock on commercially acceptable terms; operating rates of our facilities; receipt or issuance of third-party consents or approvals, including, without limitation, governmental registrations of land title and related mortgages inEgypt and governmental approvals related to rights to purchase natural gas; the establishment of new fuel standards; operating costs, including natural gas feedstock and logistics costs, capital costs, tax rates, cash flows, foreignexchange rates and interest rates; the availability of committed credit facilities and other financing; timing of completion and cost of our Geismar 3 Project; global and regional economic activity (including industrial productionlevels); absence of a material negative impact from major natural disasters; absence of a material negative impact from changes in laws or regulations; absence of a material negative impact from political instability in the countriesin which we operate; and enforcement of contractual arrangements and ability to perform contractual obligations by customers, natural gas and other suppliers and other third parties.
However, forward-looking statements, by their nature, involve risks and uncertainties that could cause actual results to differ materially from those contemplated by the forward-looking statements. The risks and uncertaintiesprimarily include those attendant with producing and marketing methanol and successfully carrying out major capital expenditure projects in various jurisdictions, including, without limitation: conditions in the methanol and otherindustries including fluctuations in the supply, demand and price for methanol and its derivatives, including demand for methanol for energy uses; the price of natural gas, coal, oil and oil derivatives; our ability to obtain natural gasfeedstock on commercially acceptable terms to underpin current operations and future production growth opportunities; the ability to carry out corporate initiatives and strategies; actions of competitors, suppliers and financialinstitutions; conditions within the natural gas delivery systems that may prevent delivery of our natural gas supply requirements; our ability to meet timeline and budget targets for our Geismar 3 Project, including cost pressuresarising from labour costs; competing demand for natural gas, especially with respect to domestic needs for gas and electricity in Chile and Egypt; actions of governments and governmental authorities, including, without limitation,implementation of policies or other measures that could impact the supply of or demand for methanol or its derivatives; changes in laws or regulations; import or export restrictions, anti-dumping measures, increases in duties,taxes and government royalties and other actions by governments that may adversely affect our operations or existing contractual arrangements; world-wide economic conditions; and other risks described in our 2018 AnnualManagement’s Discussion and Analysis and our Fourth Quarter 2019 Management’s Discussion and Analysis.
Having in mind these and other factors, investors and other readers are cautioned not to place undue reliance on forward-looking statements. They are not a substitute for the exercise of one’s owndue diligence and judgment. The outcomes implied by forward-looking statements may not occur and we do not undertake to update forward-looking statements except as required by applicablesecurities laws.

Appendix
32

33
Methanol production process
DistillationMethanol synthesisReformingDesulphurization of natural gas
1 2 3 4
APPENDIX
Natural gas Compressor
Desulphurization
SteamReformer
AutothermalReformer
Air SeparatorUnit
Waste HeatRecovery
Make-up GasCompressor
Recycle GasCompressor
Purge
RawMethanol
Water
RefinedMethanolMethanol
Reactors

By application By region
34
Global methanol industry demand
Formaldehyde28%
Acetic Acid9%
Other Traditional
20%
MTO14%
Other Energy Applications
29%
Source: IHS Chemical Supply and Demand Fall 2019 Update.
APPENDIX
Europe14%
Latin America2%
North America10%
China58%
AP (ex. China)16%
35
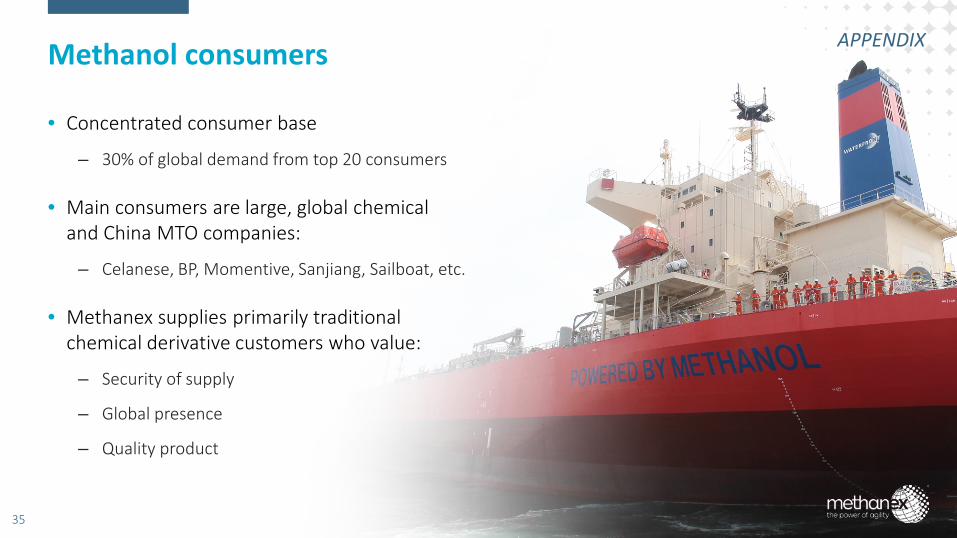
Methanol consumers
• Concentrated consumer base
– 30% of global demand from top 20 consumers
• Main consumers are large, global chemicaland China MTO companies:
– Celanese, BP, Momentive, Sanjiang, Sailboat, etc.
• Methanex supplies primarily traditional chemical derivative customers who value:
– Security of supply
– Global presence
– Quality product
APPENDIX
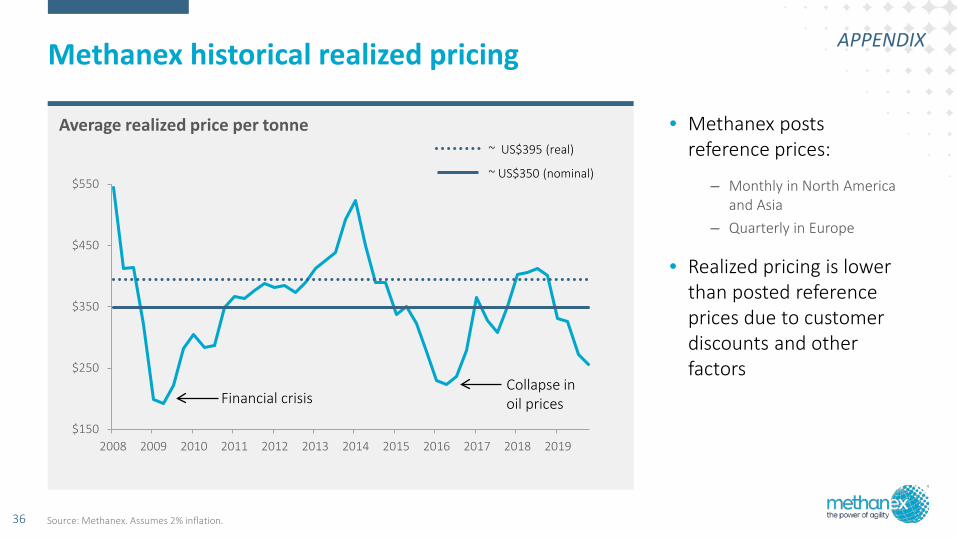
Average realized price per tonne
$150
$250
$350
$450
$550
2008 2009 2010 2011 2012 2013 2014 2015 2016 2017 2018 2019
~ US$395 (real)
~ US$350 (nominal)
36
Methanex historical realized pricing
• Methanex posts reference prices:
– Monthly in North America and Asia
– Quarterly in Europe
• Realized pricing is lower than posted reference prices due to customer discounts and other factors
Financial crisisCollapse in oil prices
APPENDIX
Source: Methanex. Assumes 2% inflation.
37
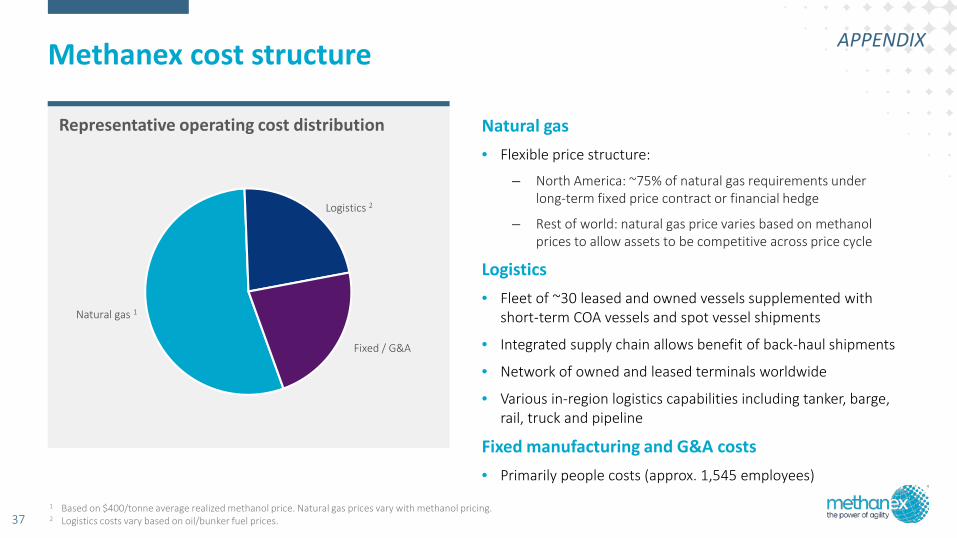
Methanex cost structure
1 Based on $400/tonne average realized methanol price. Natural gas prices vary with methanol pricing.2 Logistics costs vary based on oil/bunker fuel prices.
APPENDIX
Representative operating cost distribution
Natural gas 1
Logistics 2
Fixed / G&A
Natural gas• Flexible price structure:
– North America: ~75% of natural gas requirements under long-term fixed price contract or financial hedge
– Rest of world: natural gas price varies based on methanol prices to allow assets to be competitive across price cycle
Logistics• Fleet of ~30 leased and owned vessels supplemented with
short-term COA vessels and spot vessel shipments
• Integrated supply chain allows benefit of back-haul shipments
• Network of owned and leased terminals worldwide
• Various in-region logistics capabilities including tanker, barge, rail, truck and pipeline
Fixed manufacturing and G&A costs• Primarily people costs (approx. 1,545 employees)
https://www.methanex.com/responsible-care/responsible-care-sustainability-reports38
Methanex is committed to Responsible Care® • The Responsible Care® Ethic and Principles for Sustainability is a
United Nations recognized sustainability initiative adopted by the global chemical industry
• At Methanex, Responsible Care® is the foundation of everything we do and a key element of our global culture:
Employee health and safety
Environmental protection
Product stewardship
Social responsibility
Community safety
APPENDIX
Best-in-class corporate governance
• 11 of 12 Independent directors (92%)
• Separate chair and CEO
• All Committee members are independent
• Diversity policy and 33% of directors are female
• Active Board renewal process, average tenure is seven years and average age is 62 years old
• Diverse skills matrix
• Annual election of directors
• Individual director elections
• Director majority voting policy
• Annual “Say-on-Pay”
• Required director equity ownership of 3x total annual retainer
• Prohibition on hedging
• Not eligible for stock options
39
BOARD COMPOSITION • DIRECTOR COMPENSATION
SHAREHOLDER RIGHTS
• Strong risk and strategy oversight
• Annual Board, Committee and director evaluations
• Board orientation and education
• Code of business conduct
• In camera sessions at every Board andCommittee meeting
CORPORATE GOVERNANCE
APPENDIX
40
Management alignment APPENDIX
• Executive shareholding requirements:– CEO - 5 times salary in Methanex shares or share units
– Senior executives (5 members) – 3x salary
– Other senior management (~60 employees) – 1x salary guideline
• Short-term incentive linked to ROCE(return on capital employed)
• Long-term incentive targets:
– Stock options and share appreciation rights
– Performance share units• Payout linked to relative total shareholder return
and 3-year average ROCE
– “…Management does well when shareholders do well!”

Investor RelationsT: 604 661 [email protected]
Thank you
www.methanex.com
linkedin.com/company/methanex-corporation
@Methanex


