53
Methanex Investor Presentation March‐April 2017
| Date post: | 18-Aug-2018 |
| Category: |
Documents |
| Upload: | nguyenlien |
| View: | 213 times |
| Download: | 0 times |
Methanex Investor PresentationMarch‐April 2017
Information contained in these materials or presented orally on the earnings conference call, either in prepared remarks or in response to questions, contains forward‐looking statements. Actual results could differ materially from those contemplated by the forward‐looking statements. For more information, we direct you to our 2016 Annual MD&A and our fourth quarter 2016 MD&A, as well as slide 32 of this presentation.
This presentation also contains certain non‐GAAP financial measures that do not have any standardized meaning and therefore are unlikely to be comparable to similar measures presented by other companies. For more information regarding these non‐GAAP measures, please see our 2016 Annual MD&A and our fourth quarter 2016 MD&A.
Forward‐looking Statements & Non‐GAAP Measures
2
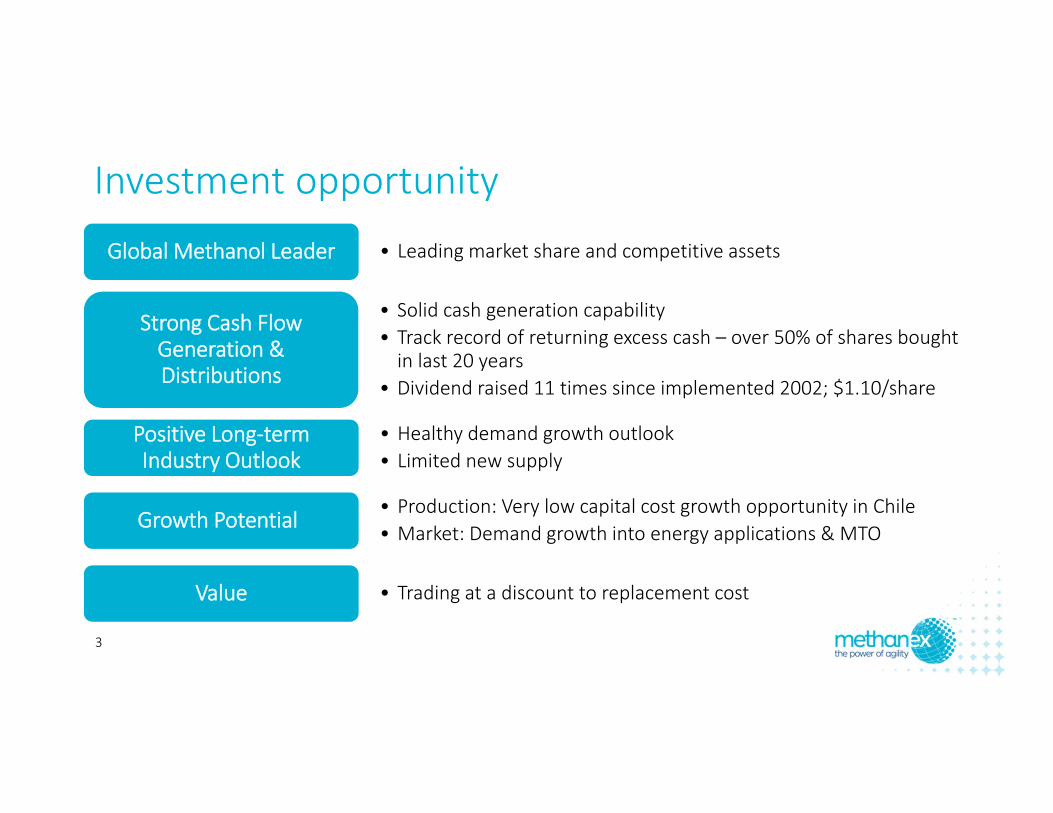
Investment opportunity• Leading market share and competitive assetsGlobal Methanol Leader
• Solid cash generation capability• Track record of returning excess cash – over 50% of shares bought in last 20 years
• Dividend raised 11 times since implemented 2002; $1.10/share
Strong Cash Flow Generation & Distributions
• Healthy demand growth outlook • Limited new supply
Positive Long‐term Industry Outlook
• Production: Very low capital cost growth opportunity in Chile • Market: Demand growth into energy applications & MTO Growth Potential
• Trading at a discount to replacement costValue
3
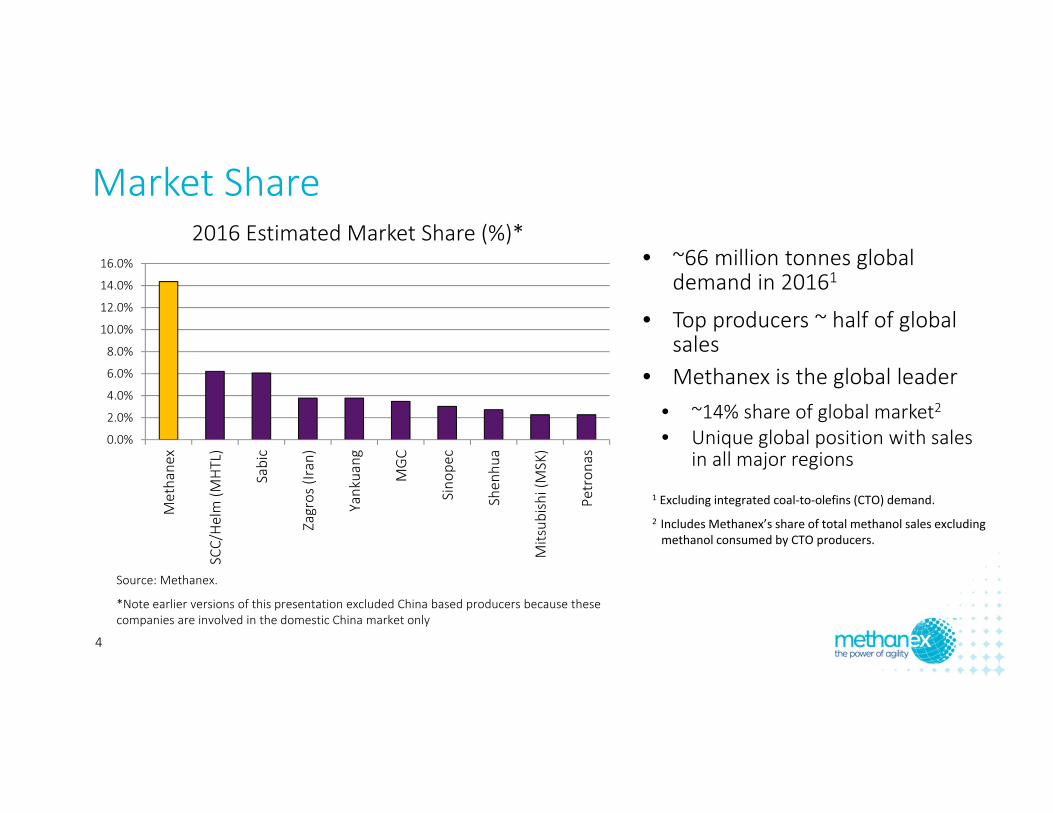
• ~66 million tonnes global demand in 20161
• Top producers ~ half of global sales
• Methanex is the global leader• ~14% share of global market2• Unique global position with sales
in all major regions
Source: Methanex.
*Note earlier versions of this presentation excluded China based producers because these companies are involved in the domestic China market only
1 Excluding integrated coal‐to‐olefins (CTO) demand. 2 Includes Methanex’s share of total methanol sales excludingmethanol consumed by CTO producers.
Market Share
0.0%
2.0%
4.0%
6.0%
8.0%
10.0%
12.0%
14.0%
16.0%
Methanex
SCC/Helm (M
HTL)
Sabic
Zagros (Iran)
Yankuang
MGC
Sino
pec
Shen
hua
Mitsub
ishi (MSK)
Petron
as
2016 Estimated Market Share (%)*
4
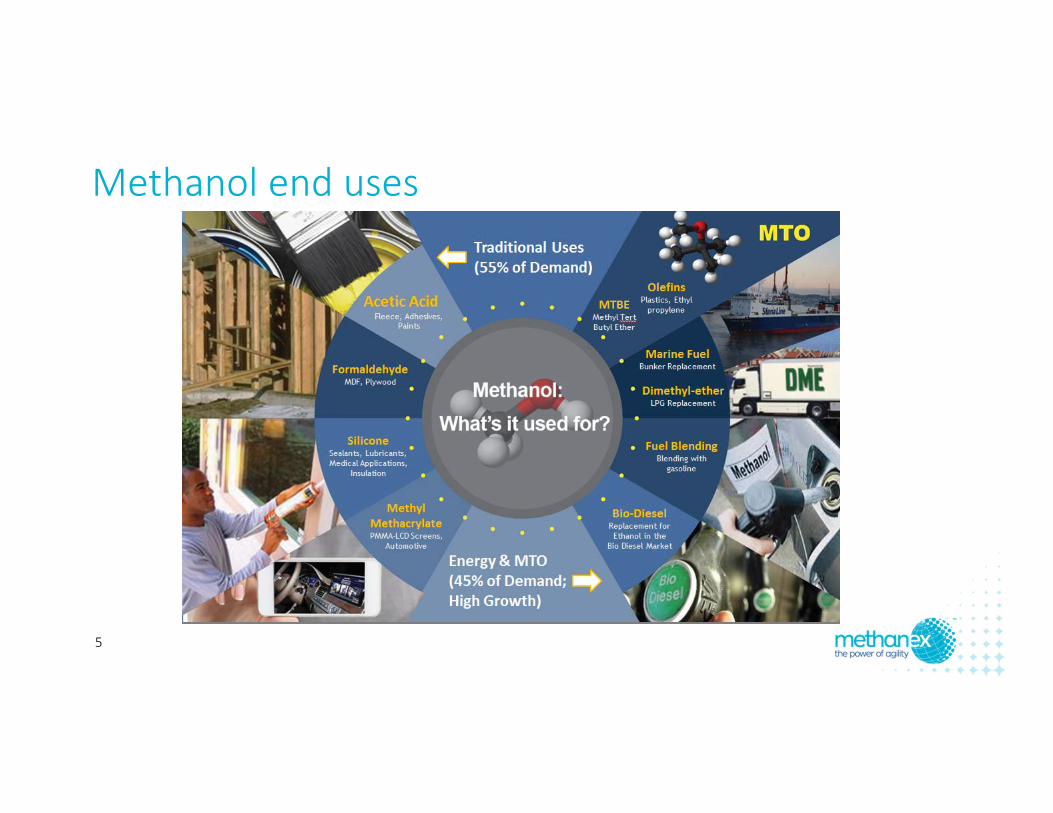
Methanol end uses
5
0
10,000
20,000
30,000
40,000
50,000
60,000
70,000
80,000
90,000
100,000
2011 2012 2013 2014 2015 2016E 2017E 2018E 2019E 2020E
MTO/MTP (Merchant)DMEFuelMTBE/TAMEChemical
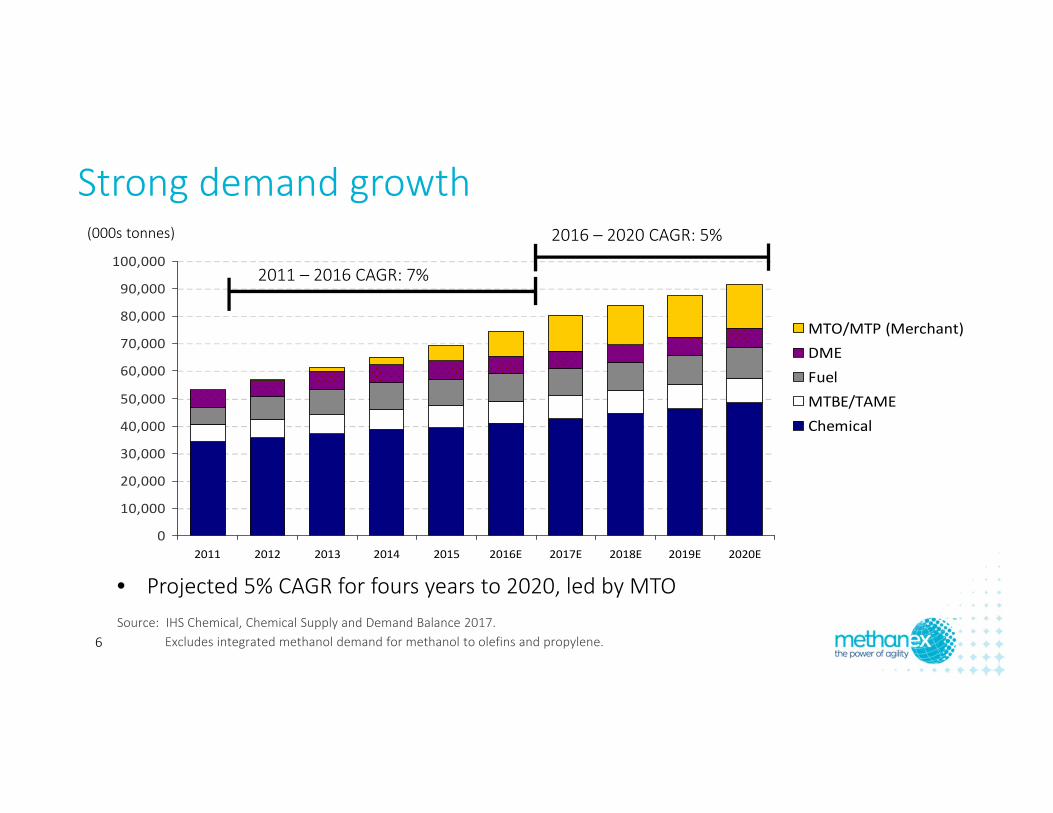
• Projected 5% CAGR for fours years to 2020, led by MTO
(000s tonnes)
2011 – 2016 CAGR: 7%
2016 – 2020 CAGR: 5%
Source: IHS Chemical, Chemical Supply and Demand Balance 2017. Excludes integrated methanol demand for methanol to olefins and propylene.
Strong demand growth
6
Traditional
MTO
‐
5.00
10.00
15.00
20.00
Estimated Demand Growth2017 ‐ 2020
Expected New Capacity2017‐2020*
Millions of Ton
nes
China Additions (merchant)Other Energy
Other Industry
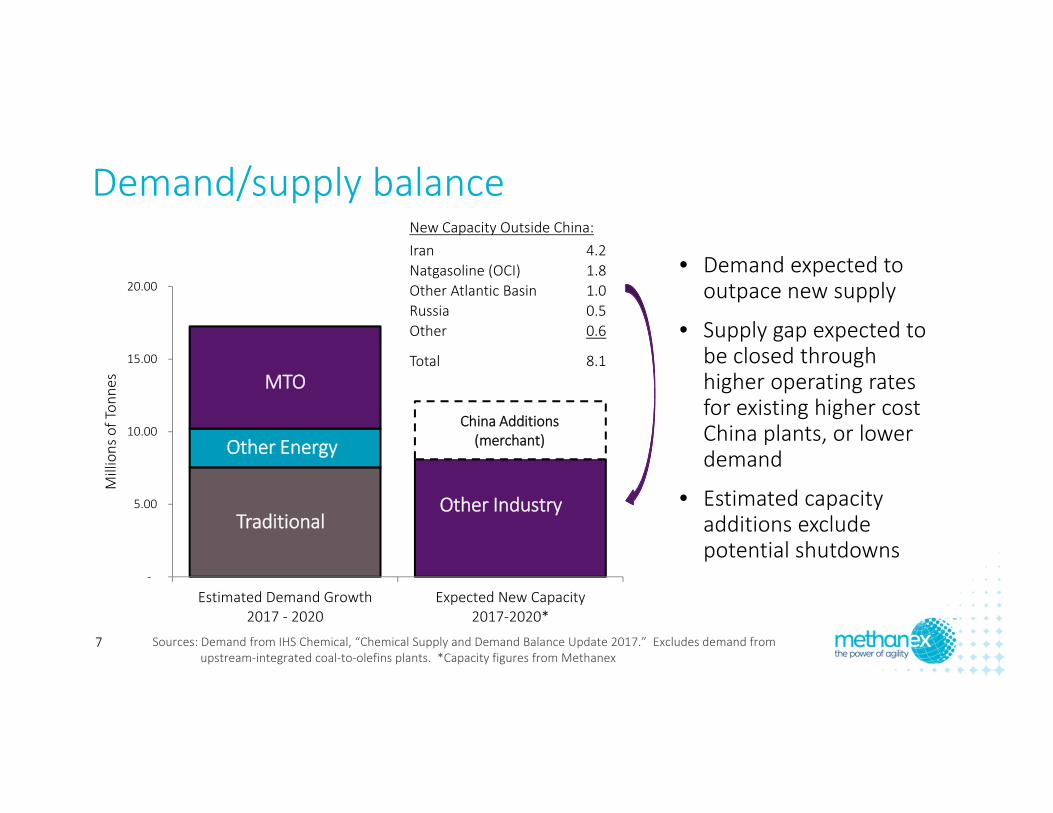
• Demand expected to outpace new supply
• Supply gap expected to be closed through higher operating rates for existing higher cost China plants, or lower demand
• Estimated capacity additions exclude potential shutdowns
Sources: Demand from IHS Chemical, “Chemical Supply and Demand Balance Update 2017.” Excludes demand from upstream‐integrated coal‐to‐olefins plants. *Capacity figures from Methanex
Demand/supply balanceNew Capacity Outside China:Iran 4.2Natgasoline (OCI) 1.8Other Atlantic Basin 1.0Russia 0.5Other 0.6
Total 8.1
7
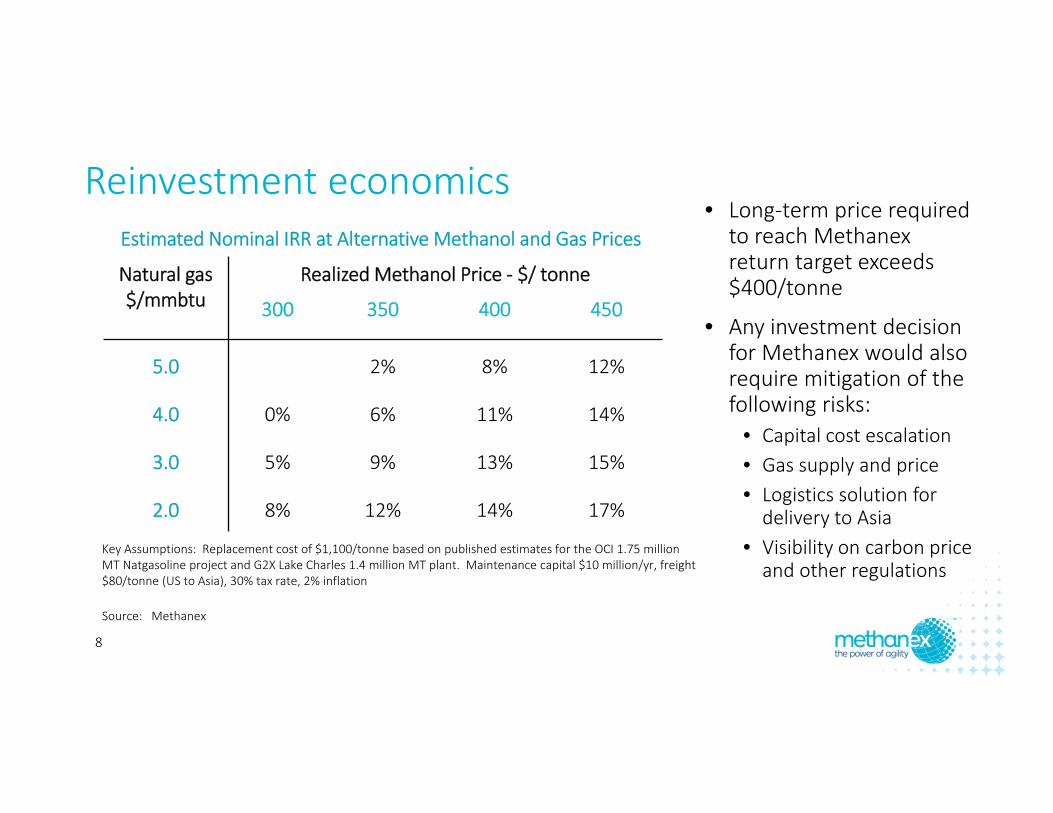
• Long‐term price required to reach Methanexreturn target exceeds $400/tonne
• Any investment decision for Methanex would also require mitigation of the following risks:
• Capital cost escalation• Gas supply and price• Logistics solution for delivery to Asia
• Visibility on carbon price and other regulations
Reinvestment economics
Natural gas$/mmbtu
Realized Methanol Price ‐ $/ tonne
300 350 400 450
5.0 2% 8% 12%
4.0 0% 6% 11% 14%
3.0 5% 9% 13% 15%
2.0 8% 12% 14% 17%
Key Assumptions: Replacement cost of $1,100/tonne based on published estimates for the OCI 1.75 million MT Natgasoline project and G2X Lake Charles 1.4 million MT plant. Maintenance capital $10 million/yr, freight $80/tonne (US to Asia), 30% tax rate, 2% inflation
Source: Methanex
Estimated Nominal IRR at Alternative Methanol and Gas Prices
8
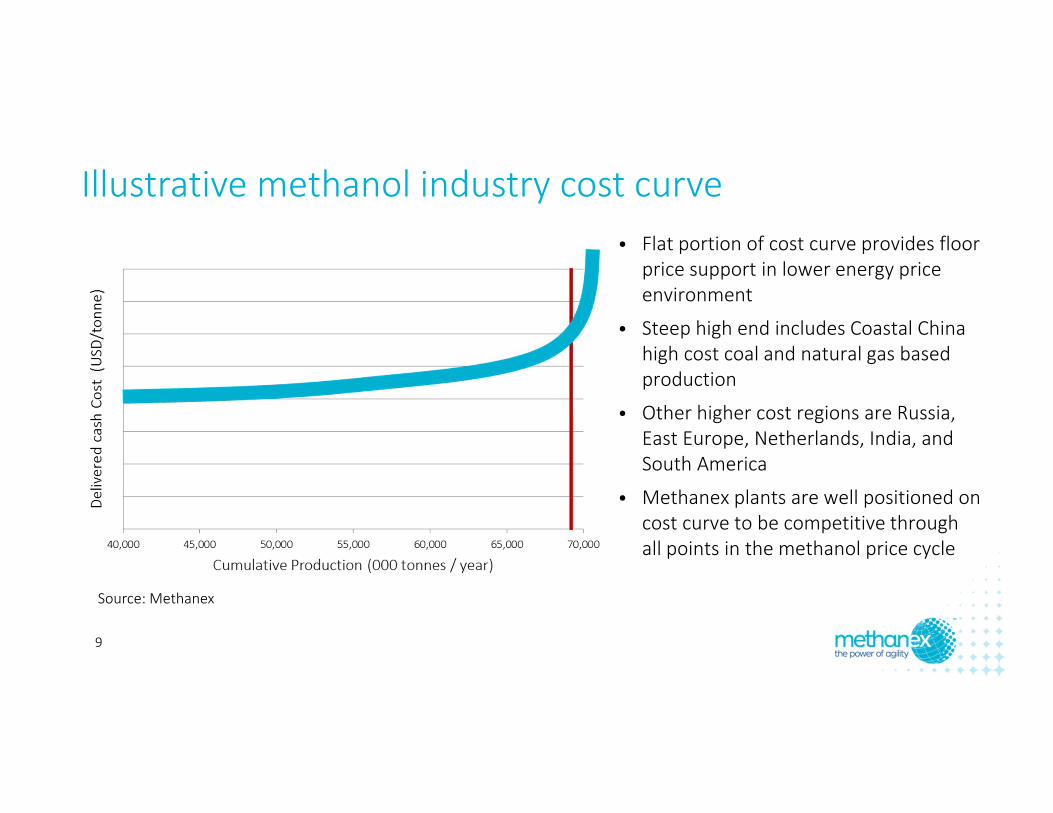
• Flat portion of cost curve provides floor price support in lower energy price environment
• Steep high end includes Coastal China high cost coal and natural gas based production
• Other higher cost regions are Russia, East Europe, Netherlands, India, and South America
• Methanex plants are well positioned on cost curve to be competitive through all points in the methanol price cycle
Source: Methanex
Illustrative methanol industry cost curve
9
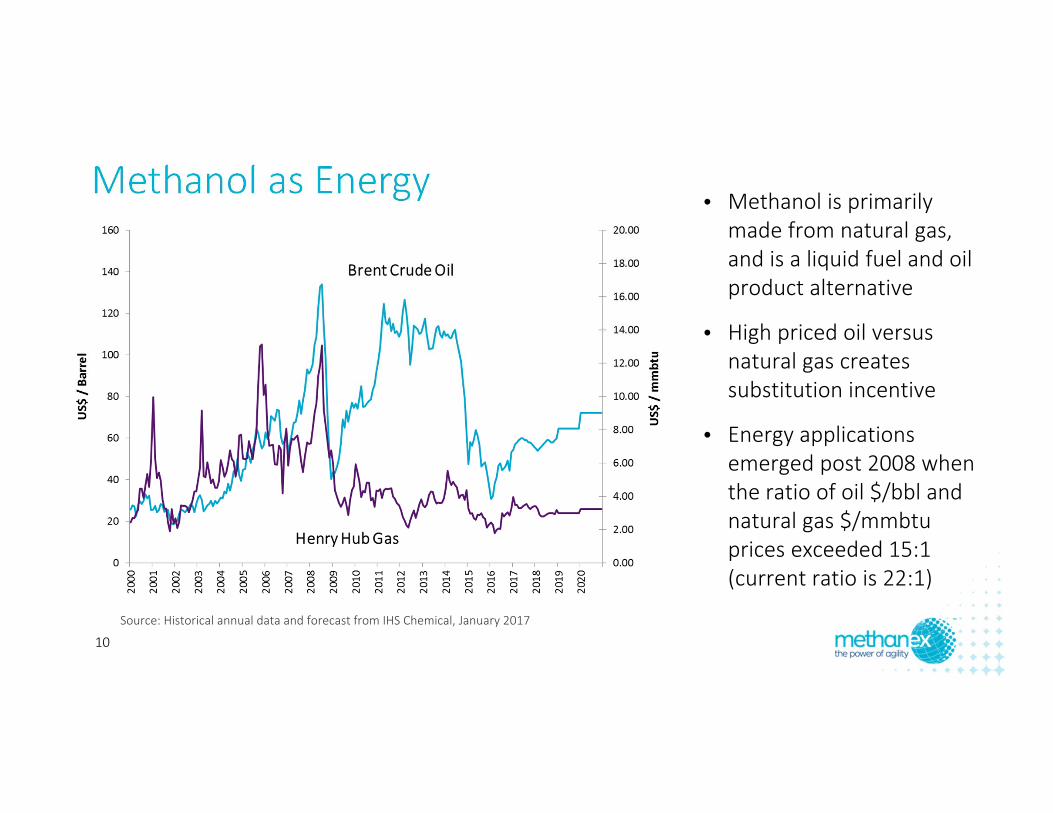
Source: Historical annual data and forecast from IHS Chemical, January 2017
• Methanol is primarily made from natural gas, and is a liquid fuel and oil product alternative
• High priced oil versus natural gas creates substitution incentive
• Energy applications emerged post 2008 when the ratio of oil $/bbl and natural gas $/mmbtuprices exceeded 15:1 (current ratio is 22:1)
Methanol as Energy
10
Ethylene
Polyethylene Food packaging, plastic bags
EDC PVCPipes, window frames
Textile, bottles
Insulation cups, models
EO MEG
Ethyl benzene Styrene
PET
Polystyrene
Propylene
Polypropylene Food container, bottles
ACN Synthetic rubbers Household & consumer goods
Building isolation, bedding
Insulation cups, models
PO Polyether polyols
Cumene Phenol
Polyurethane
Polycarbonates/Phenolic resins
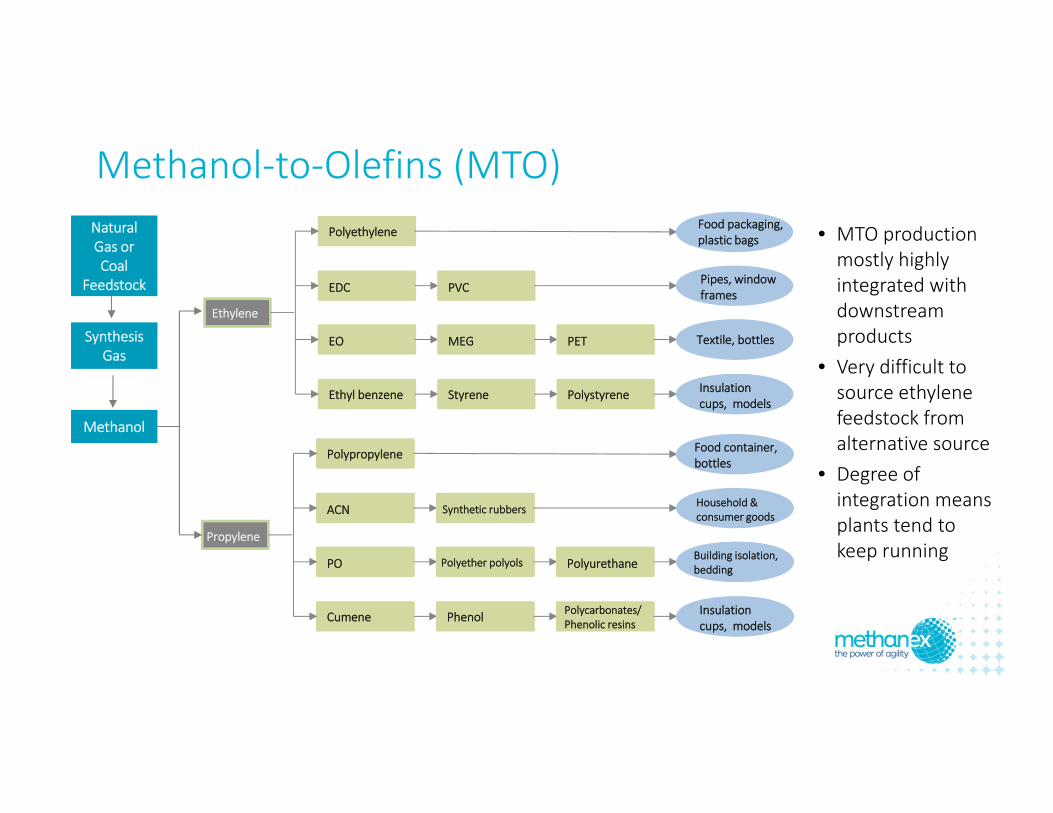
Methanol‐to‐Olefins (MTO)• MTO production mostly highly integrated with downstream products
• Very difficult to source ethylene feedstock from alternative source
• Degree of integration means plants tend to keep running
SynthesisGas
Methanol
Natural Gas or Coal
Feedstock
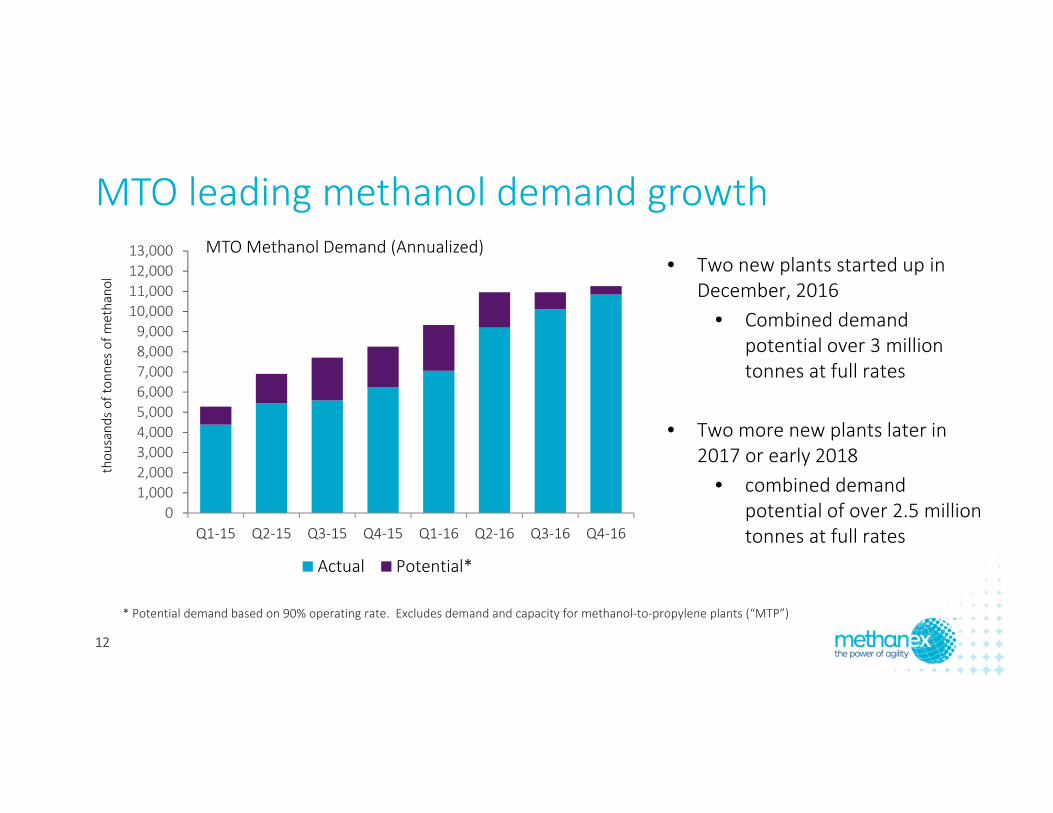
MTO leading methanol demand growth
• Two new plants started up in December, 2016
• Combined demand potential over 3 million tonnes at full rates
• Two more new plants later in 2017 or early 2018
• combined demand potential of over 2.5 million tonnes at full rates
* Potential demand based on 90% operating rate. Excludes demand and capacity for methanol‐to‐propylene plants (“MTP”)
01,0002,0003,0004,0005,0006,0007,0008,0009,00010,00011,00012,00013,000
Q1‐15 Q2‐15 Q3‐15 Q4‐15 Q1‐16 Q2‐16 Q3‐16 Q4‐16
Actual Potential*
thou
sand
s of to
nnes of m
ethano
l
MTO Methanol Demand (Annualized)
12
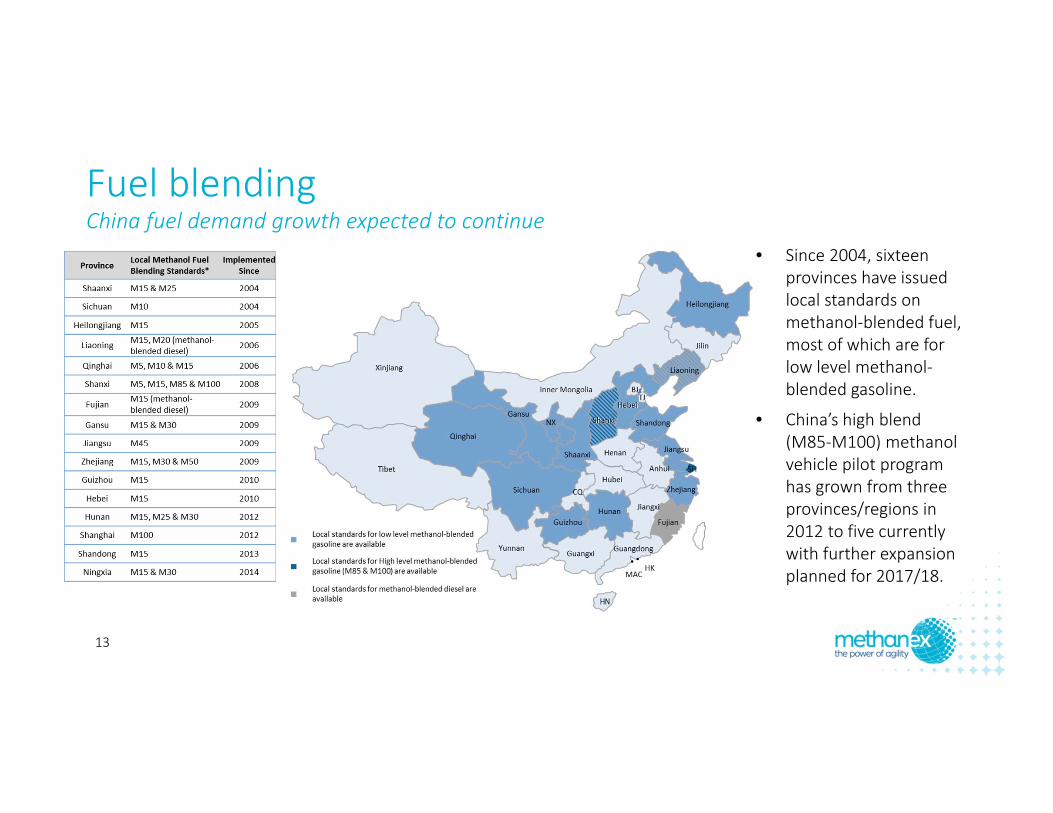
Fuel blendingChina fuel demand growth expected to continue
• Since 2004, sixteen provinces have issued local standards on methanol‐blended fuel, most of which are for low level methanol‐blended gasoline.
• China’s high blend (M85‐M100) methanol vehicle pilot program has grown from three provinces/regions in 2012 to five currently with further expansion planned for 2017/18.
13
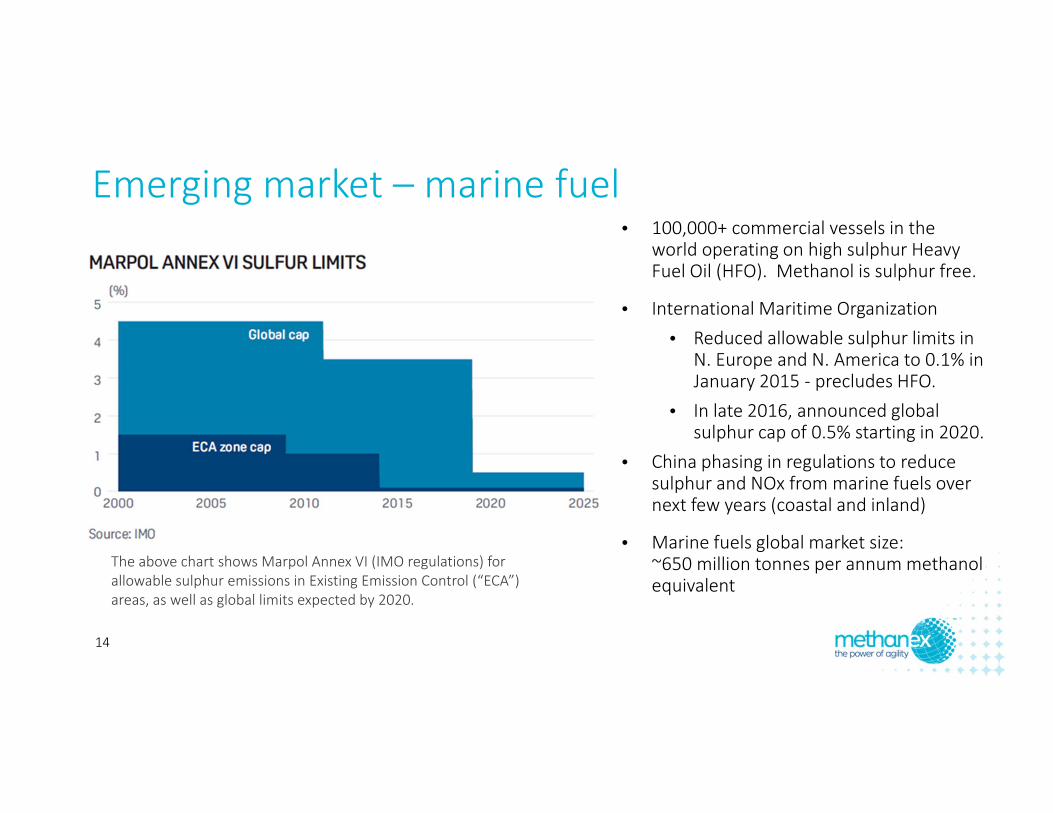
• 100,000+ commercial vessels in the world operating on high sulphur Heavy Fuel Oil (HFO). Methanol is sulphur free.
• International Maritime Organization• Reduced allowable sulphur limits in
N. Europe and N. America to 0.1% in January 2015 ‐ precludes HFO.
• In late 2016, announced global sulphur cap of 0.5% starting in 2020.
• China phasing in regulations to reduce sulphur and NOx from marine fuels over next few years (coastal and inland)
• Marine fuels global market size: ~650 million tonnes per annum methanol equivalent
The above chart shows Marpol Annex VI (IMO regulations) for allowable sulphur emissions in Existing Emission Control (“ECA”) areas, as well as global limits expected by 2020.
Emerging market – marine fuel
14
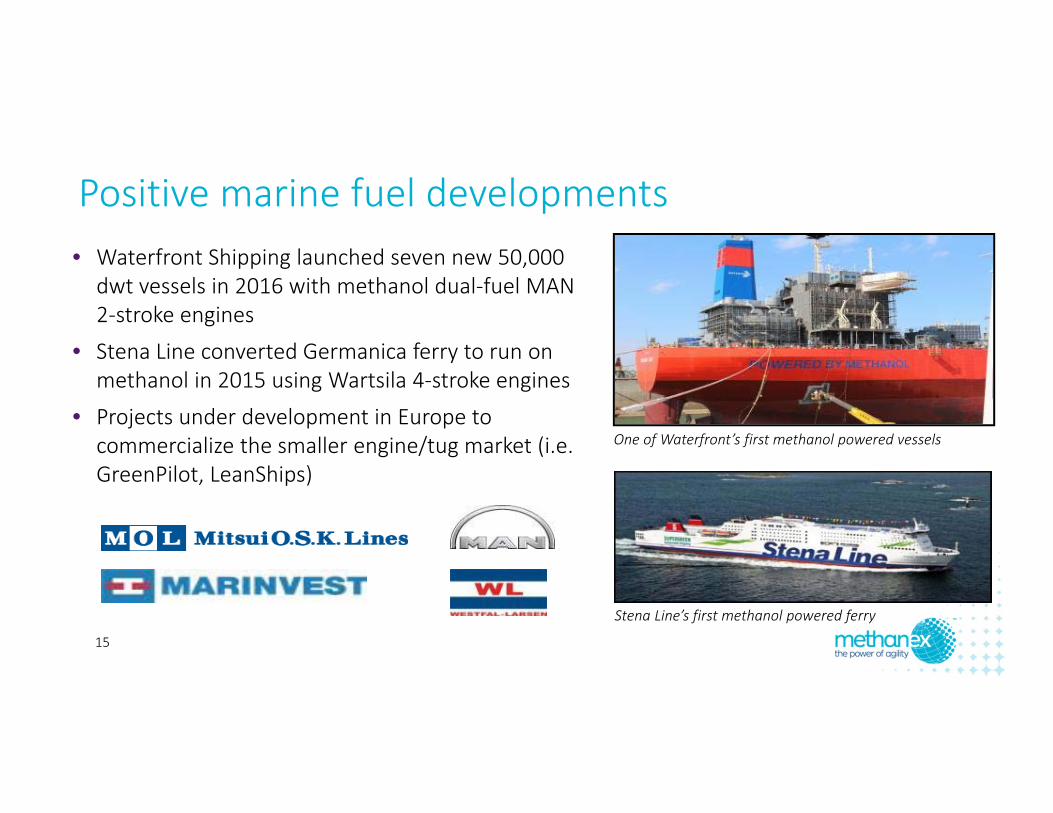
• Waterfront Shipping launched seven new 50,000 dwt vessels in 2016 with methanol dual‐fuel MAN 2‐stroke engines
• Stena Line converted Germanica ferry to run on methanol in 2015 using Wartsila 4‐stroke engines
• Projects under development in Europe to commercialize the smaller engine/tug market (i.e. GreenPilot, LeanShips)
Stena Line’s first methanol powered ferry
One of Waterfront’s first methanol powered vessels
Positive marine fuel developments
15
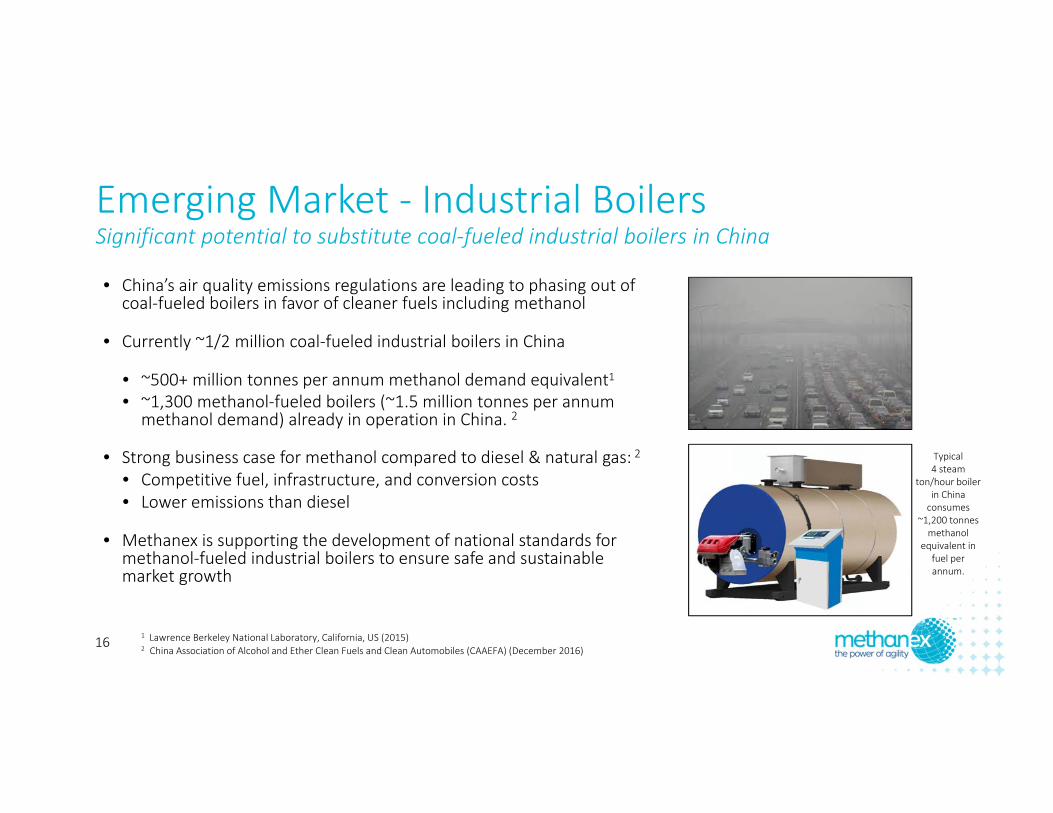
Emerging Market ‐ Industrial Boilers
• China’s air quality emissions regulations are leading to phasing out of coal‐fueled boilers in favor of cleaner fuels including methanol
• Currently ~1/2 million coal‐fueled industrial boilers in China
• ~500+ million tonnes per annum methanol demand equivalent1• ~1,300 methanol‐fueled boilers (~1.5 million tonnes per annum methanol demand) already in operation in China. 2
• Strong business case for methanol compared to diesel & natural gas: 2• Competitive fuel, infrastructure, and conversion costs• Lower emissions than diesel
• Methanex is supporting the development of national standards for methanol‐fueled industrial boilers to ensure safe and sustainable market growth
Significant potential to substitute coal‐fueled industrial boilers in China
Typical 4 steam
ton/hour boiler in China consumes
~1,200 tonnes methanol
equivalent in fuel per annum.
1 Lawrence Berkeley National Laboratory, California, US (2015) 2 China Association of Alcohol and Ether Clean Fuels and Clean Automobiles (CAAEFA) (December 2016)
16
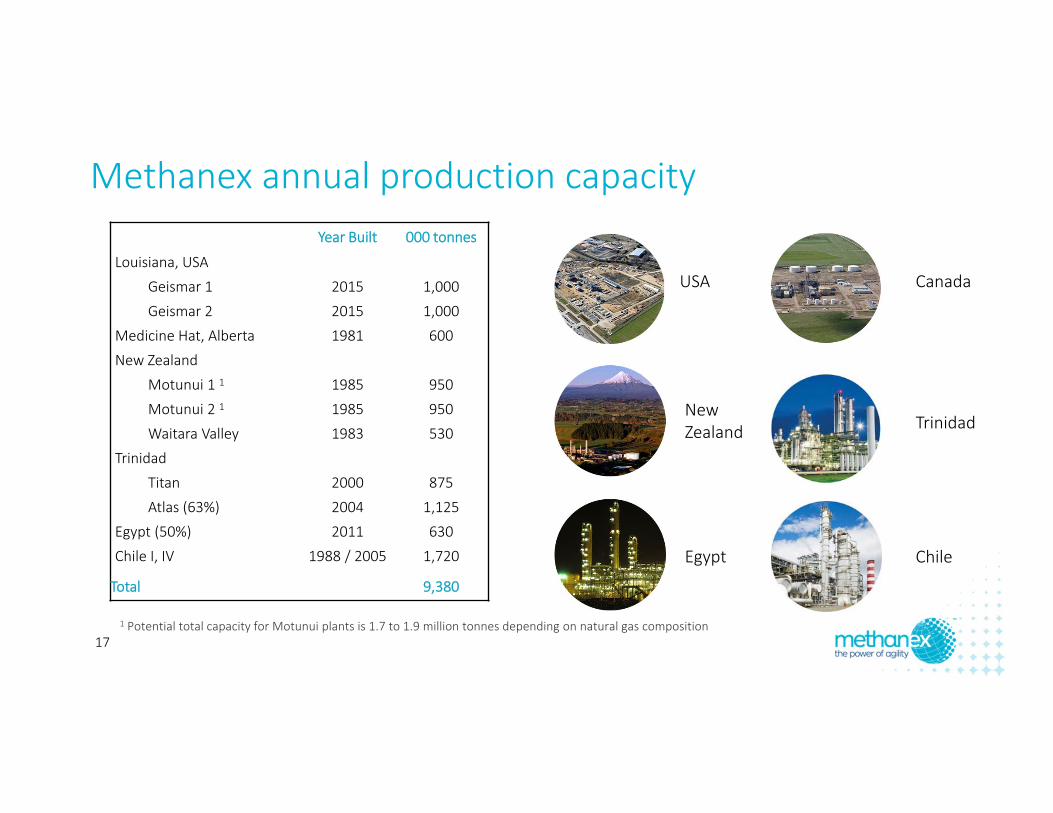
Methanex annual production capacity
Chile
USA
Egypt
Canada
New Zealand Trinidad
1 Potential total capacity for Motunui plants is 1.7 to 1.9 million tonnes depending on natural gas composition
Year Built 000 tonnes
Louisiana, USA
Geismar 1 2015 1,000
Geismar 2 2015 1,000
Medicine Hat, Alberta 1981 600
New Zealand
Motunui 1 1 1985 950
Motunui 2 1 1985 950
Waitara Valley 1983 530
Trinidad
Titan 2000 875
Atlas (63%) 2004 1,125
Egypt (50%) 2011 630
Chile I, IV 1988 / 2005 1,720
Total 9,380
17
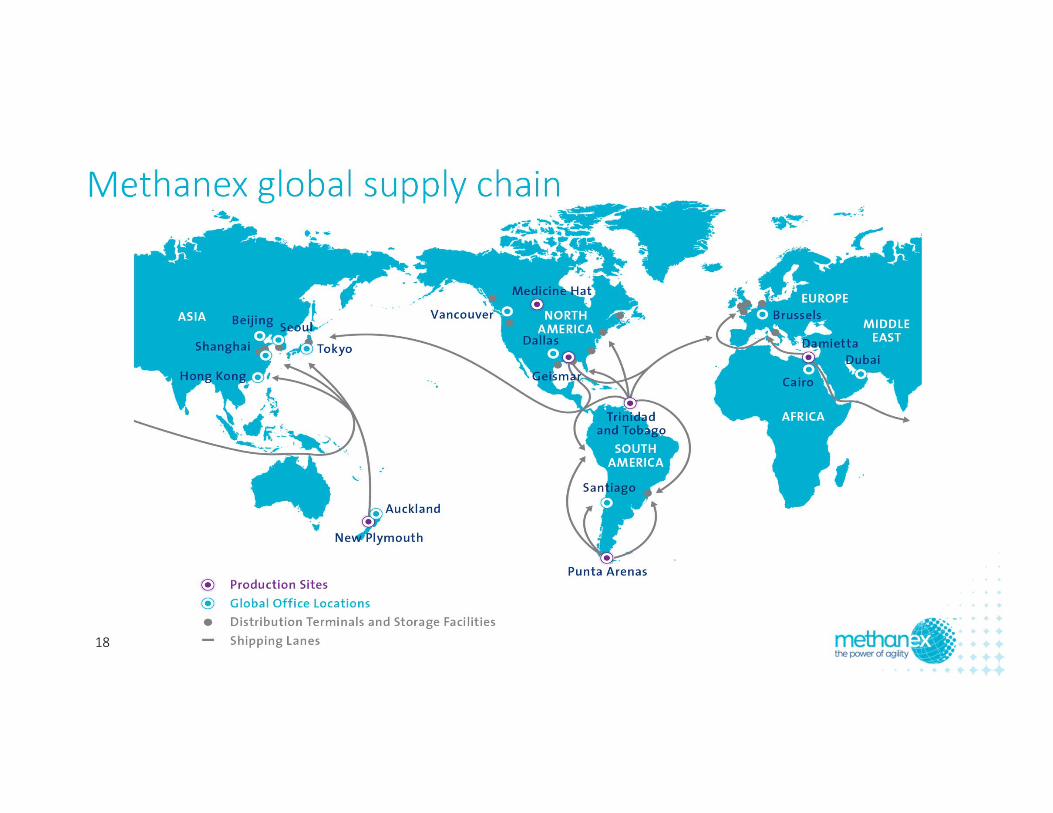
Methanex global supply chain
18
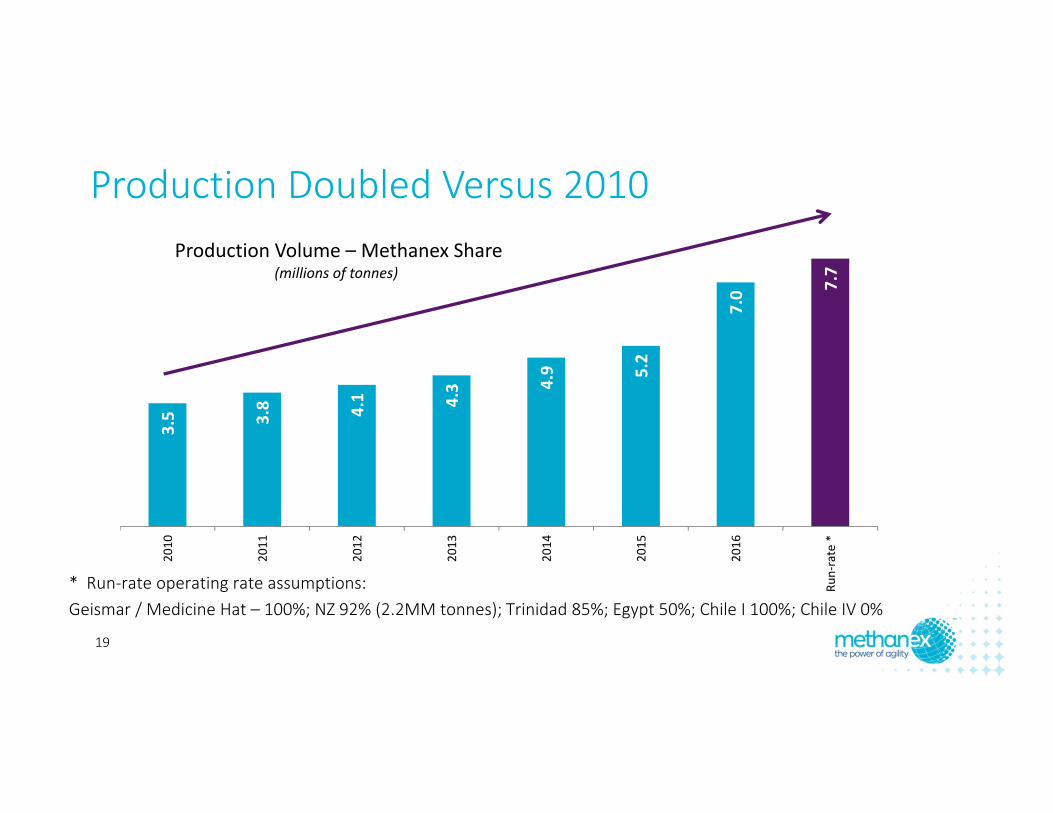
3.5 3.8 4.1 4.3 4.9 5.2
7.0 7.
7
2010
2011
2012
2013
2014
2015
2016
Run‐rate *
Production Volume – Methanex Share(millions of tonnes)
Production Doubled Versus 2010
* Run‐rate operating rate assumptions: Geismar / Medicine Hat – 100%; NZ 92% (2.2MM tonnes); Trinidad 85%; Egypt 50%; Chile I 100%; Chile IV 0%
19
Chile Growth Opportunity• Highly value accretive investment opportunity to restore Chile to a two‐plant operation (1.7 million tonnes) at a very low capital cost• Expect sufficient gas available to run a minimum of one plant for medium term• Decision by mid 2017 on restart of Chile IV• Preliminary cost estimate to restart idle Chile IV facility of $50 million over 12 months (starting in mid‐2017)
• Additional approximately $50 million in mid‐2018 to refurbish Chile I• Subject to securing additional economic gas sufficient for a two‐plant operation
20
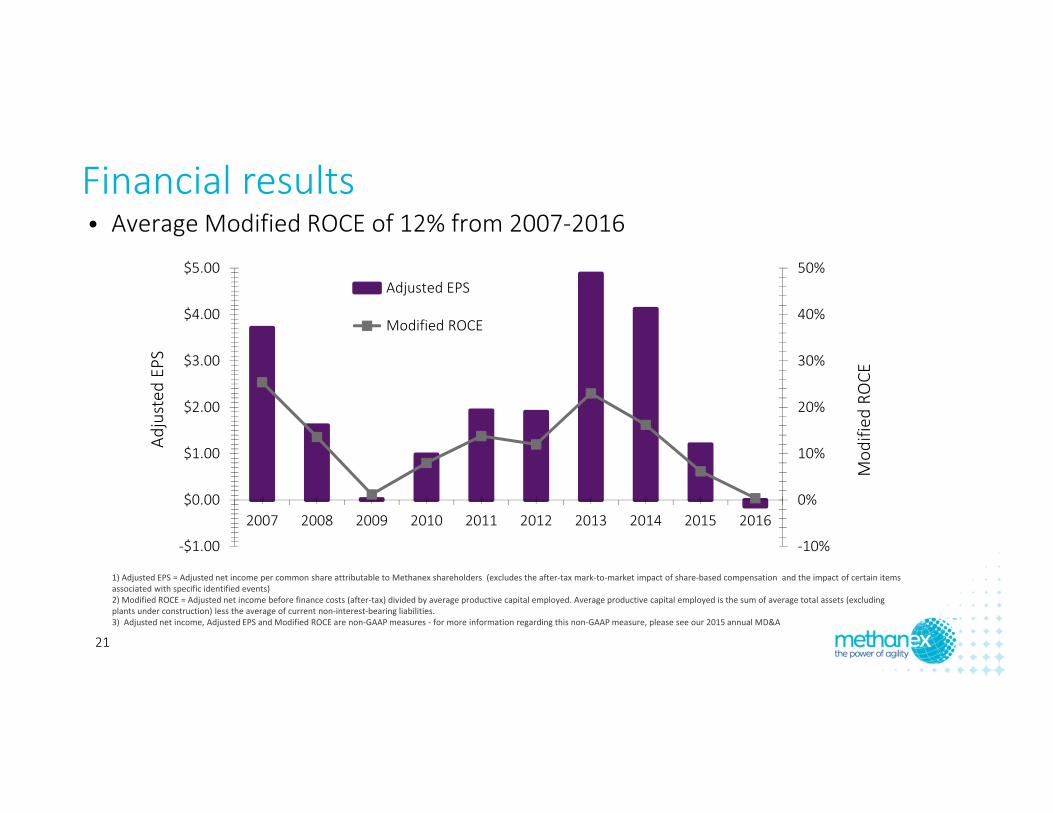
1) Adjusted EPS = Adjusted net income per common share attributable to Methanex shareholders (excludes the after‐tax mark‐to‐market impact of share‐based compensation and the impact of certain items associated with specific identified events)2) Modified ROCE = Adjusted net income before finance costs (after‐tax) divided by average productive capital employed. Average productive capital employed is the sum of average total assets (excluding plants under construction) less the average of current non‐interest‐bearing liabilities. 3) Adjusted net income, Adjusted EPS and Modified ROCE are non‐GAAP measures ‐ for more information regarding this non‐GAAP measure, please see our 2015 annual MD&A
• Average Modified ROCE of 12% from 2007‐2016Financial results
‐10%
0%
10%
20%
30%
40%
50%
‐$1.00
$0.00
$1.00
$2.00
$3.00
$4.00
$5.00
2007 2008 2009 2010 2011 2012 2013 2014 2015 2016
Mod
ified
ROCE
Adjusted
EPS
Adjusted EPS
Modified ROCE
21
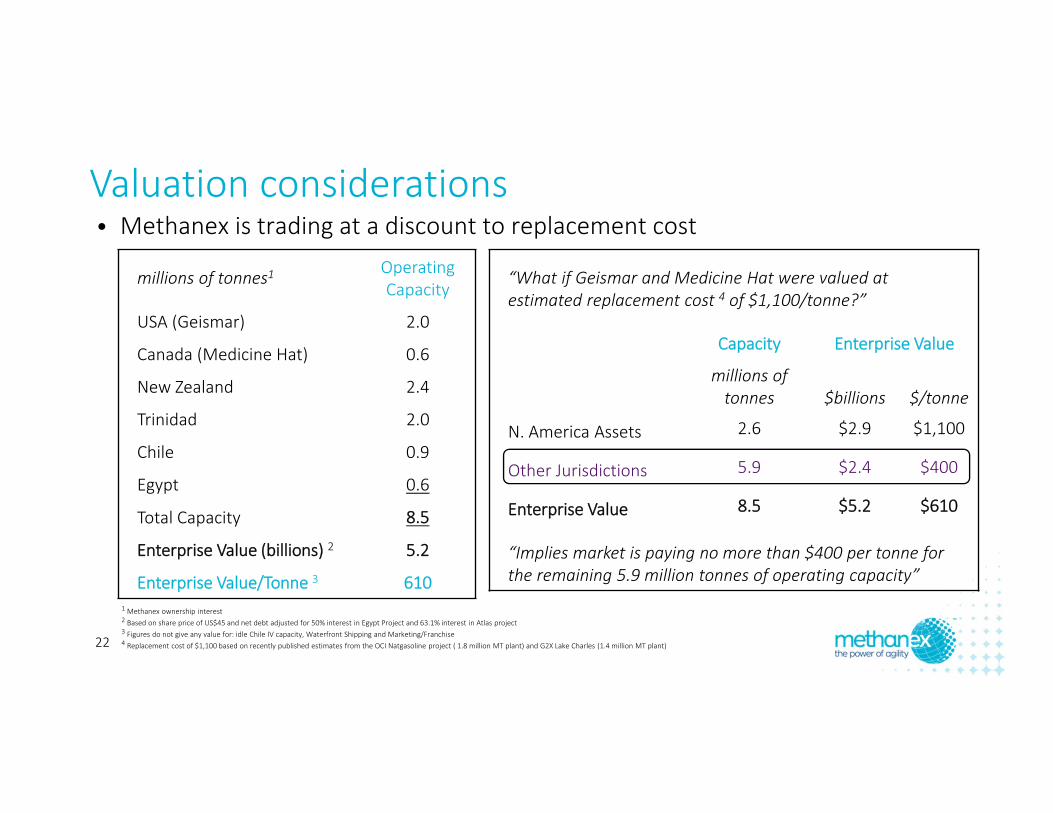
• Methanex is trading at a discount to replacement costValuation considerations
“What if Geismar and Medicine Hat were valued at estimated replacement cost 4 of $1,100/tonne?”
Capacity Enterprise Value
millions of tonnes $billions $/tonne
N. America Assets 2.6 $2.9 $1,100
Other Jurisdictions 5.9 $2.4 $400
Enterprise Value 8.5 $5.2 $610
“Implies market is paying no more than $400 per tonne for the remaining 5.9 million tonnes of operating capacity”
1 Methanex ownership interest2 Based on share price of US$45 and net debt adjusted for 50% interest in Egypt Project and 63.1% interest in Atlas project3 Figures do not give any value for: idle Chile IV capacity, Waterfront Shipping and Marketing/Franchise4 Replacement cost of $1,100 based on recently published estimates from the OCI Natgasoline project ( 1.8 million MT plant) and G2X Lake Charles (1.4 million MT plant)
millions of tonnes1 OperatingCapacity
USA (Geismar) 2.0
Canada (Medicine Hat) 0.6
New Zealand 2.4
Trinidad 2.0
Chile 0.9
Egypt 0.6
Total Capacity 8.5
Enterprise Value (billions) 2 5.2
Enterprise Value/Tonne 3 610
22
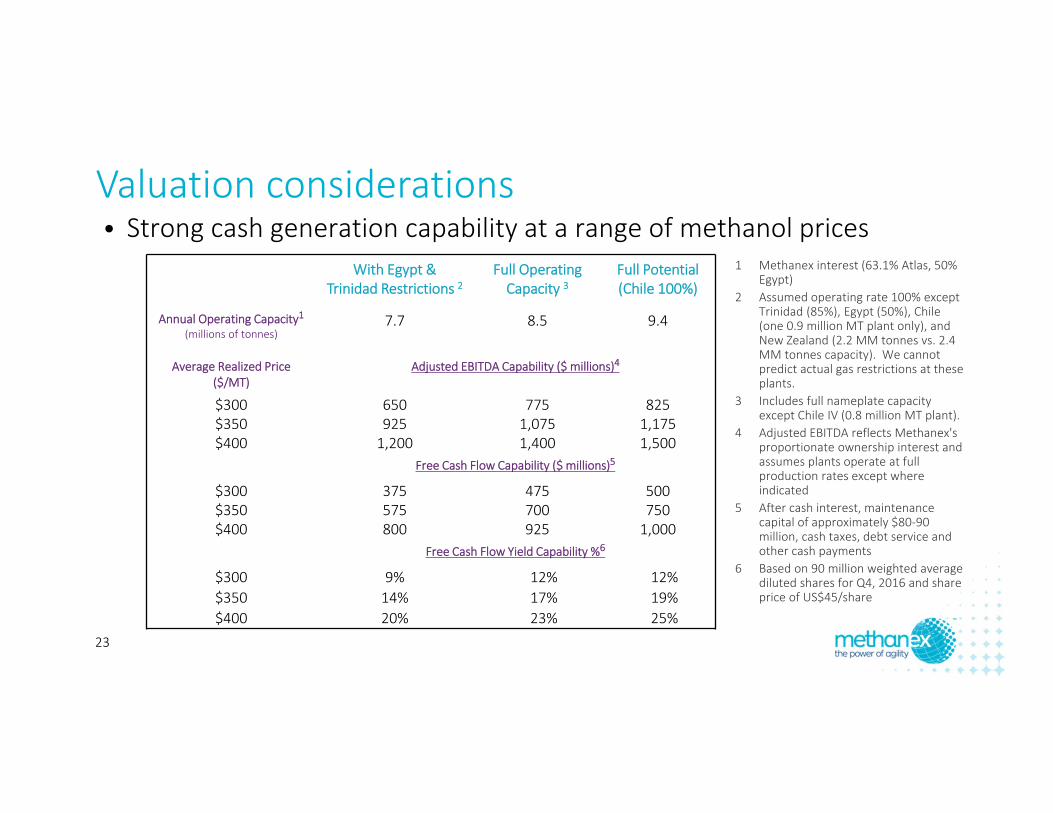
• Strong cash generation capability at a range of methanol pricesValuation considerations
With Egypt &Trinidad Restrictions 2
Full Operating Capacity 3
Full Potential (Chile 100%)
Annual Operating Capacity1(millions of tonnes)
7.7 8.5 9.4
Average Realized Price ($/MT)
Adjusted EBITDA Capability ($ millions)4
$300 650 775 825$350 925 1,075 1,175$400 1,200 1,400 1,500
Free Cash Flow Capability ($ millions)5
$300 375 475 500$350 575 700 750$400 800 925 1,000
Free Cash Flow Yield Capability %6
$300 9% 12% 12%$350 14% 17% 19%$400 20% 23% 25%
1 Methanex interest (63.1% Atlas, 50% Egypt)
2 Assumed operating rate 100% except Trinidad (85%), Egypt (50%), Chile (one 0.9 million MT plant only), and New Zealand (2.2 MM tonnes vs. 2.4 MM tonnes capacity). We cannot predict actual gas restrictions at these plants.
3 Includes full nameplate capacity except Chile IV (0.8 million MT plant).
4 Adjusted EBITDA reflects Methanex'sproportionate ownership interest and assumes plants operate at full production rates except where indicated
5 After cash interest, maintenance capital of approximately $80‐90 million, cash taxes, debt service and other cash payments
6 Based on 90 million weighted average diluted shares for Q4, 2016 and share price of US$45/share
23
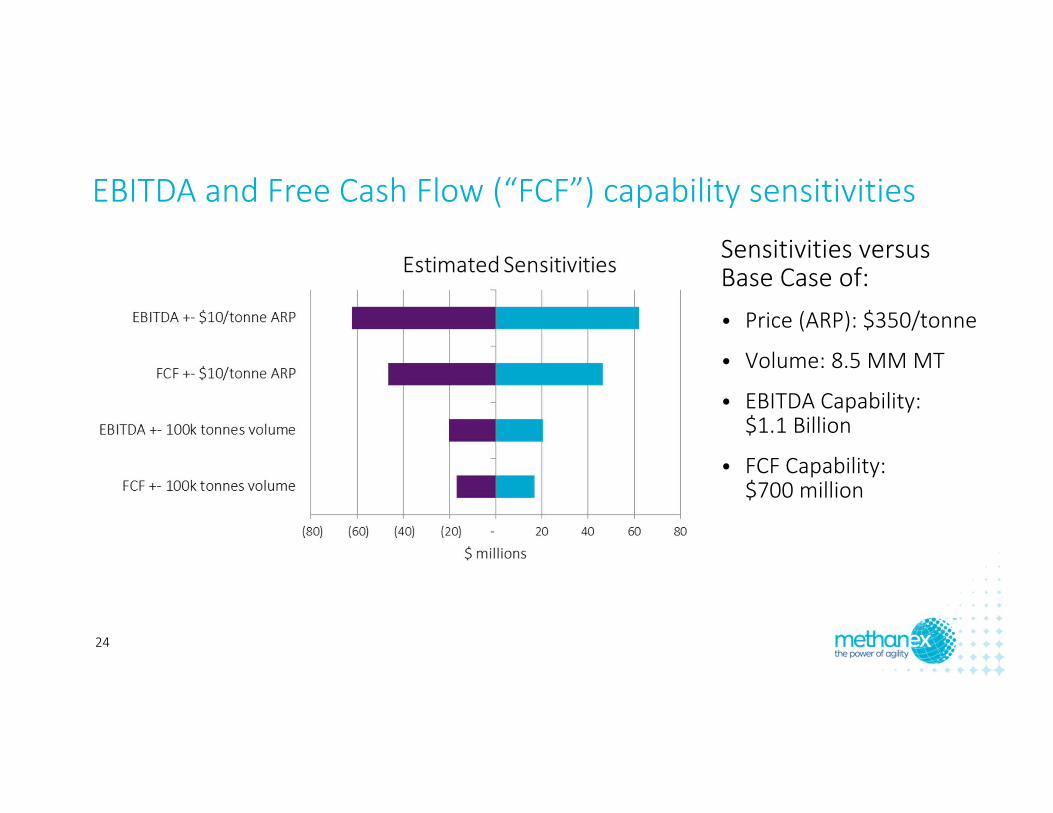
Sensitivities versus Base Case of:• Price (ARP): $350/tonne
• Volume: 8.5 MM MT
• EBITDA Capability:$1.1 Billion
• FCF Capability: $700 million
EBITDA and Free Cash Flow (“FCF”) capability sensitivities
24
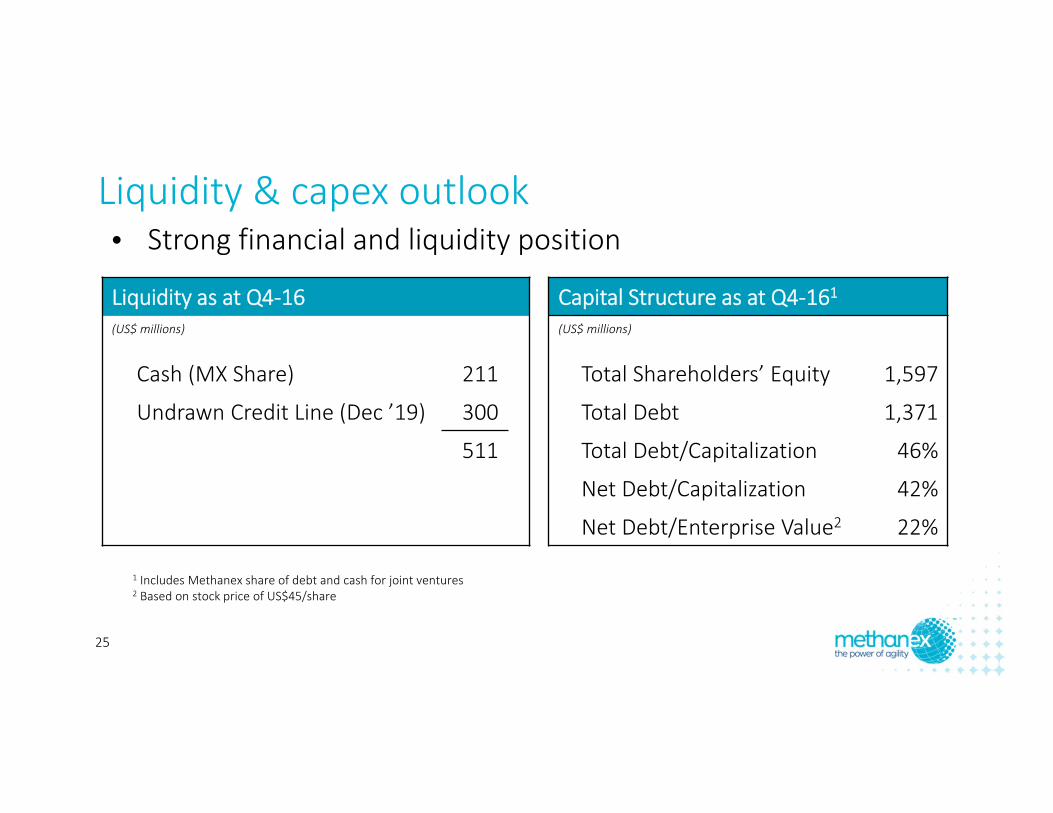
• Strong financial and liquidity positionLiquidity & capex outlook
Liquidity as at Q4‐16(US$ millions)
Cash (MX Share) 211
Undrawn Credit Line (Dec ’19) 300
511
Capital Structure as at Q4‐161(US$ millions)
Total Shareholders’ Equity 1,597
Total Debt 1,371
Total Debt/Capitalization 46%
Net Debt/Capitalization 42%
Net Debt/Enterprise Value2 22%
1 Includes Methanex share of debt and cash for joint ventures2 Based on stock price of US$45/share
25
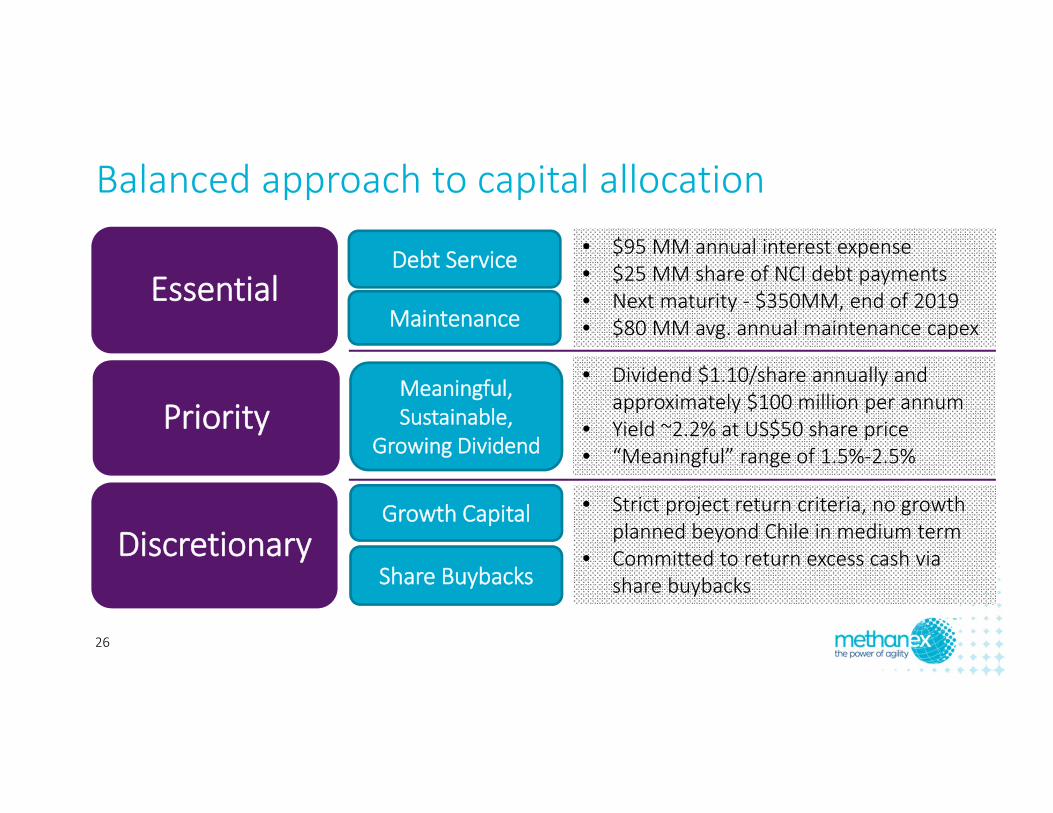
Essential
Priority
Discretionary
Debt Service
Maintenance
• $95 MM annual interest expense• $25 MM share of NCI debt payments• Next maturity ‐ $350MM, end of 2019 • $80 MM avg. annual maintenance capex
Meaningful, Sustainable,
Growing Dividend
Share Buybacks
Growth Capital
• Dividend $1.10/share annually and approximately $100 million per annum
• Yield ~2.2% at US$50 share price• “Meaningful” range of 1.5%‐2.5%
Balanced approach to capital allocation
• Strict project return criteria, no growth planned beyond Chile in medium term
• Committed to return excess cash via share buybacks
26
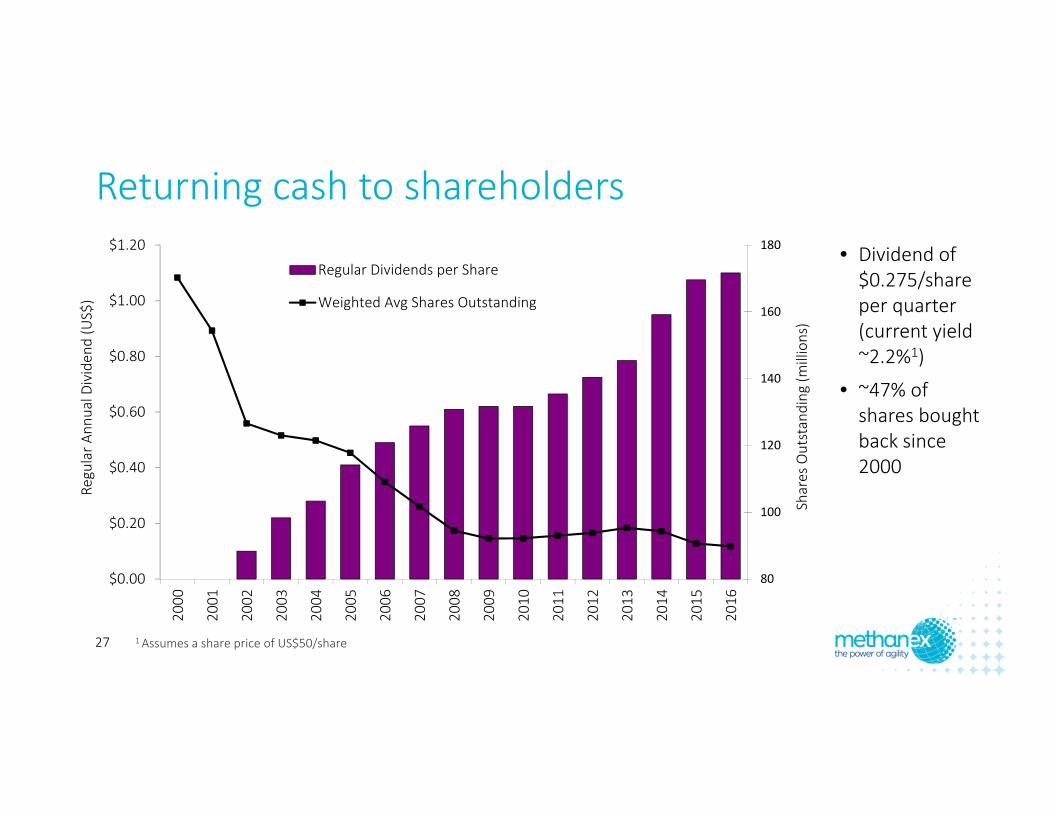
Returning cash to shareholders
80
100
120
140
160
180
$0.00
$0.20
$0.40
$0.60
$0.80
$1.00
$1.20
2000
2001
2002
2003
2004
2005
2006
2007
2008
2009
2010
2011
2012
2013
2014
2015
2016
Shares Outstanding
(millions)
Regular A
nnual D
ividen
d (US$)
Regular Dividends per Share
Weighted Avg Shares Outstanding
1 Assumes a share price of US$50/share
• Dividend of $0.275/share per quarter (current yield ~2.2%1)
• ~47% of shares bought back since 2000
27
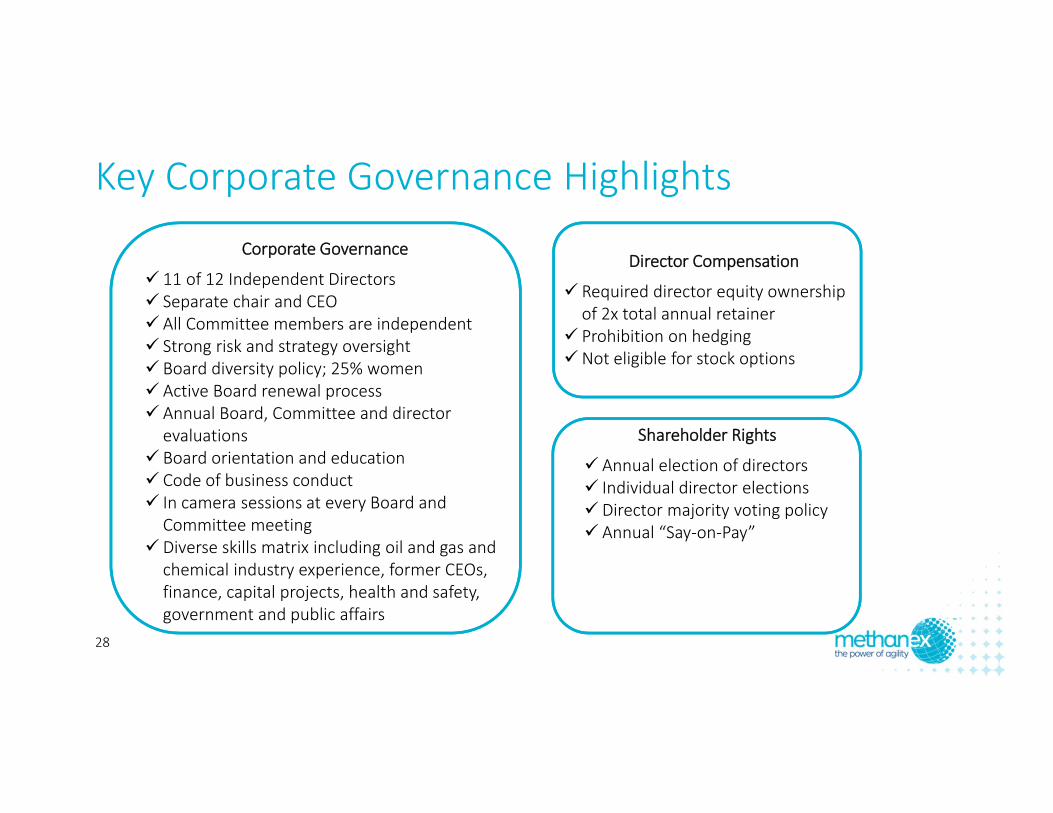
Key Corporate Governance Highlights
Corporate Governance
11 of 12 Independent Directors Separate chair and CEO All Committee members are independent Strong risk and strategy oversight Board diversity policy; 25% women Active Board renewal process Annual Board, Committee and director evaluations
Board orientation and education Code of business conduct In camera sessions at every Board and Committee meeting
Diverse skills matrix including oil and gas and chemical industry experience, former CEOs, finance, capital projects, health and safety, government and public affairs
Shareholder Rights
Annual election of directors Individual director electionsDirector majority voting policy Annual “Say‐on‐Pay”
Director Compensation
Required director equity ownership of 2x total annual retainer
Prohibition on hedgingNot eligible for stock options
28
Methanex is Committed to Responsible Care®
• At Methanex, Responsible Care® is the foundation of everything we do and a key element of our global culture:
» community safety» employee health and safety» environmental protection» product stewardship» social responsibility
• As an industry, we must continue to embrace and promote Responsible Care®
https://www.methanex.com/responsible‐care/responsible‐care‐social‐responsibility‐reports
29
• Executive shareholding requirements:• CEO ‐ 5 times salary in Methanex shares or share units• Senior executives (5 members) – 3 times salary• Other senior management (~50 employees) – 1 times salary
• Short‐term incentive linked to ROCE (return on capital employed)
• Long‐term incentive targets:• Stock options and share appreciation rights• Performance share units
• Payout ratio linked to total shareholder return
“…..Management does well when shareholders do well!”
Management alignment
30
• Global leader with competitive assets
• Solid franchise value that is difficult to replicate
• Global marketing, supply chain and shipping network
• Strong financial position
• Expect strong cash generation
• Low capital cost growth potential in Chile
• Dividends / share buybacks
Summary
Committed to Return to Excess Cash to Shareholders31
Forward‐looking information warningThis Presentation, our Fourth Quarter 2016 Management’s Discussion and Analysis (“MD&A”) and comments made during the Fourth Quarter 2016 investor conference call contain forward‐looking statements with respectto us and our industry. These statements relate to future events or our future performance. All statements other than statements of historical fact are forward‐looking statements. Statements that include the words“believes,” “expects,” “may,” “will,” “should,” “potential,” “estimates,” “anticipates,” “aim,” “goal” or other comparable terminology and similar statements of a future or forward‐looking nature identify forward‐lookingstatements. More particularly and without limitation, any statements regarding the following are forward‐looking statements: expected demand for methanol and its derivatives; expected new methanol supply or restart ofidled capacity and timing for start‐up of the same; expected shutdowns (either temporary or permanent) or restarts of existing methanol supply (including our own facilities), including, without limitation, the timing andlength of planned maintenance outages; expected methanol and energy prices; expected levels of methanol purchases from traders or other third parties; expected levels, timing and availability of economically pricednatural gas supply to each of our plants; capital committed by third parties towards future natural gas exploration and development in the vicinity of our plants; our expected capital expenditures, anticipated operating ratesof our plants, expected operating costs, including natural gas feedstock costs and logistics costs; expected tax rates or resolutions to tax disputes; expected cash flows, earnings capability and share price; availability ofcommitted credit facilities and other financing; our ability to meet covenants or obtain or continue to obtain waivers associated with our long‐term debt obligations, including, without limitation, the Egypt limited recoursedebt facilities that have conditions associated with the payment of cash or other distributions and the finalization of certain land title registrations and related mortgages which require actions by Egyptian governmentalentities; expected impact on our results of operations in Egypt or our financial condition as a consequence of civil unrest or actions taken or inaction by the Government of Egypt and its agencies; our shareholder distributionstrategy and anticipated distributions to shareholders; commercial viability and timing of, or our ability to execute, future projects, plant restarts, capacity expansions, plant relocations, or other business initiatives oropportunities; our financial strength and ability to meet future financial commitments; expected global or regional economic activity (including industrial production levels); expected outcomes of litigation or other disputes,claims and assessments; and expected actions of governments, government agencies, gas suppliers, courts, tribunals or other third parties.
We believe that we have a reasonable basis for making such forward‐looking statements. The forward‐looking statements in this document are based on our experience, our perception of trends, current conditions andexpected future developments as well as other factors. Certain material factors or assumptions were applied in drawing the conclusions or making the forecasts or projections that are included in these forward‐lookingstatements, including, without limitation, future expectations and assumptions concerning the following: the supply of, demand for and price of methanol, methanol derivatives, natural gas, coal, oil and oil derivatives; ourability to procure natural gas feedstock on commercially acceptable terms; operating rates of our facilities; receipt or issuance of third‐party consents or approvals, including, without limitation, governmental registrations ofland title and related mortgages in Egypt and governmental approvals related to rights to purchase natural gas; the establishment of new fuel standards; operating costs, including natural gas feedstock and logistics costs,capital costs, tax rates, cash flows, foreign exchange rates and interest rates; the availability of committed credit facilities and other financing; global and regional economic activity (including industrial production levels);absence of a material negative impact from major natural disasters; absence of a material negative impact from changes in laws or regulations; absence of a material negative impact from political instability in the countriesin which we operate; and enforcement of contractual arrangements and ability to perform contractual obligations by customers, natural gas and other suppliers and other third parties.
However, forward‐looking statements, by their nature, involve risks and uncertainties that could cause actual results to differ materially from those contemplated by the forward‐looking statements. The risks anduncertainties primarily include those attendant with producing and marketing methanol and successfully carrying out major capital expenditure projects in various jurisdictions, including, without limitation: conditions in themethanol and other industries including fluctuations in the supply, demand and price for methanol and its derivatives, including demand for methanol for energy uses, the price of natural gas, coal, oil and oil derivatives; ourability to obtain natural gas feedstock on commercially acceptable terms to underpin current operations and future production growth opportunities; the ability to carry out corporate initiatives and strategies; actions ofcompetitors, suppliers and financial institutions; conditions within the natural gas delivery systems that may prevent delivery of our natural gas supply requirements; competing demand for natural gas, especially with respectto domestic needs for gas and electricity in Chile and Egypt; actions of governments and governmental authorities, including, without limitation, the implementation of policies or other measures that could impact the supplyof or demand for methanol or its derivatives; changes in laws or regulations, import or export restrictions, anti‐dumping measures, increases in duties, taxes and government royalties, and other actions by governments thatmay adversely affect our operations or existing contractual arrangements; world‐wide economic conditions; and other risks described in our annual 2016 Management’s Discussion and Analysis and our Fourth Quarter 2016Management’s Discussion and Analysis.
Having in mind these and other factors, investors and other readers are cautioned not to place undue reliance on forward‐looking statements. They are not a substitute for the exercise of one’s own due diligence andjudgment. The outcomes implied by forward‐looking statements may not occur and we do not undertake to update forward‐looking statements except as required by applicable securities laws.

Q & A
33
Appendix
34
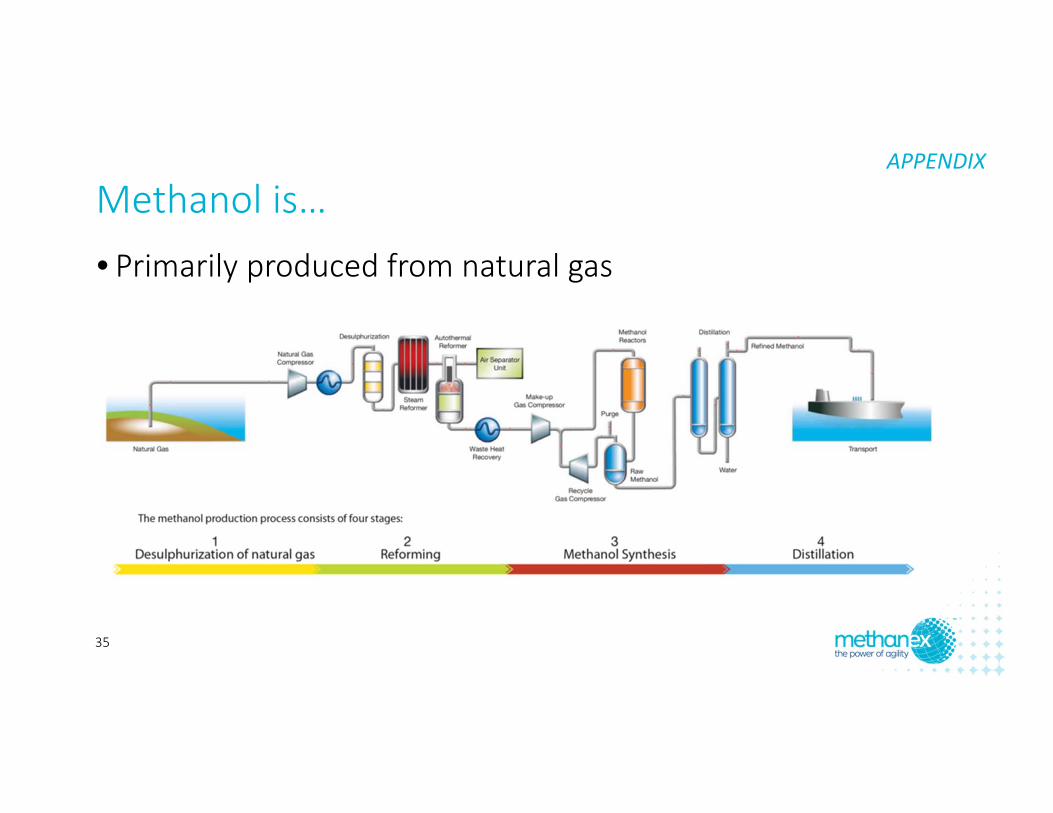
Methanol is…• Primarily produced from natural gas
APPENDIX
35
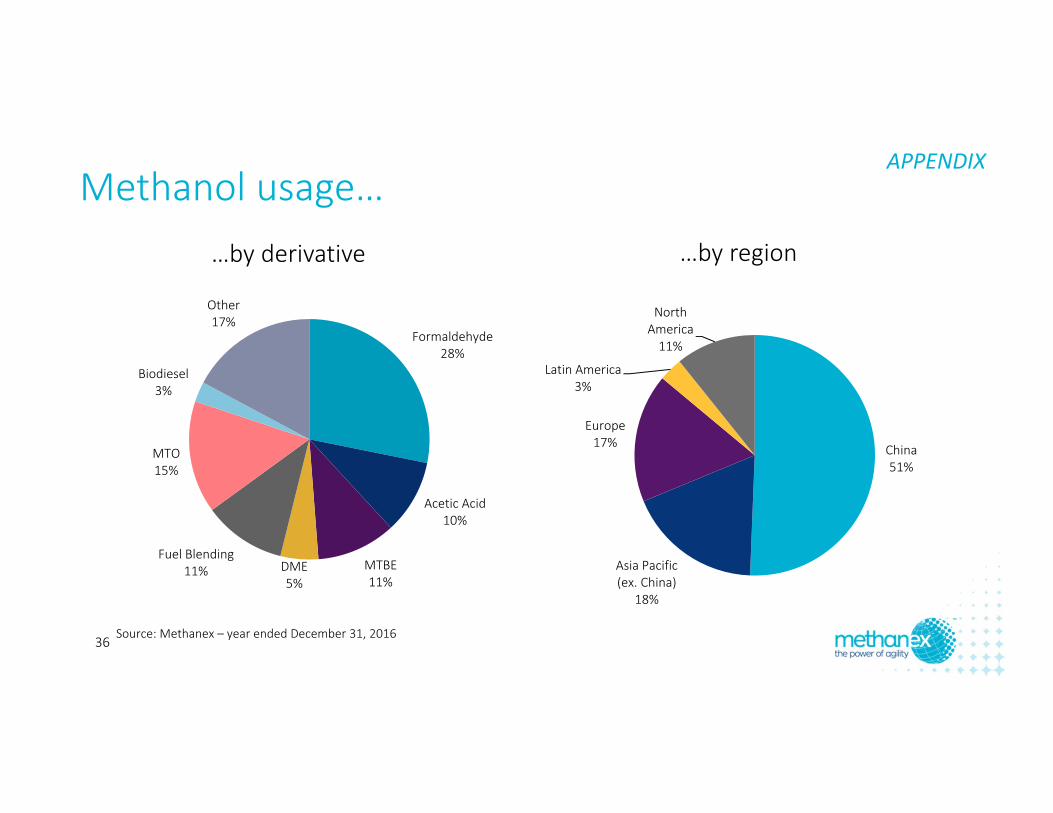
…by derivative …by region
Source: Methanex – year ended December 31, 2016
Methanol usage…APPENDIX
Formaldehyde28%
Acetic Acid10%
MTBE11%
DME5%
Fuel Blending11%
MTO15%
Biodiesel3%
Other17%
China51%
Asia Pacific (ex. China)
18%
Europe17%
Latin America3%
North America11%
36
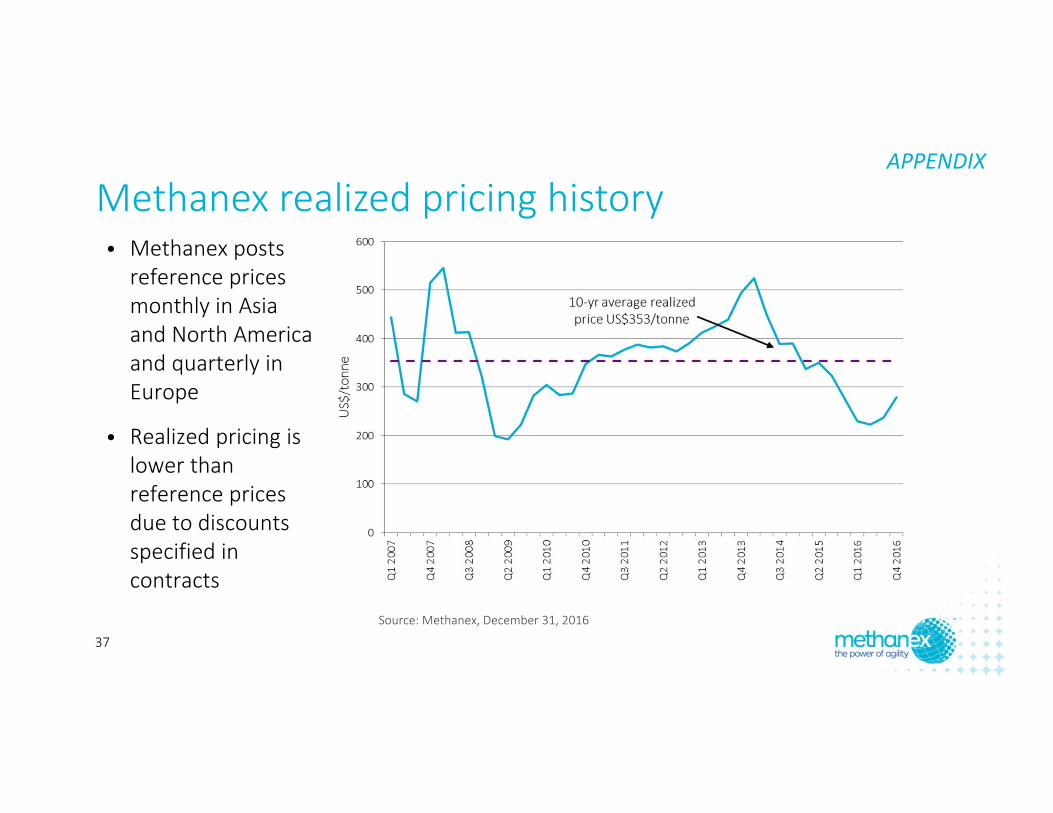
• Methanex posts reference prices monthly in Asia and North America and quarterly in Europe
• Realized pricing is lower than reference prices due to discounts specified in contracts
Source: Methanex, December 31, 2016
Methanex realized pricing historyAPPENDIX
37
Methanol consumers
• Concentrated consumer base–30% of global demand from top 20 consumers
• Main consumers are large, global chemical and China MTO companies:–Celanese, BP, Momentive, Skyford, Sabic, BASF, etc.
• Methanex supplies primarily traditional chemical derivative customers who value:– Security of supply–Global presence–Quality product
APPENDIX
38
• Liquid fuel – can be blended with gasoline and ethanol in today’s vehicles at minimal incremental costs.
• Clean burning fuel that produces fewer smog causing emissions when blended with (or substituted for) gasoline.
• High octane fuel which improves vehicle power and efficiency.
• A safe fuel which biodegrades quickly (compared to petroleum fuels) in case of a spill. The toxicity is similar to gasoline.
• No material technical hurdles either in terms of vehicle application or of distribution infrastructure to introduce methanol significantly into a marketplace.
• Can be produced from renewable feedstock.
For further information, see June 6, 2011 MIT study “The Future of Natural Gas” (section on Conversion to Liquid Fuels beginning page 125 of the report) at http://mitei.mit.edu/publications/reports‐studies
Benefits of methanol as a vehicle fuelAPPENDIX
39
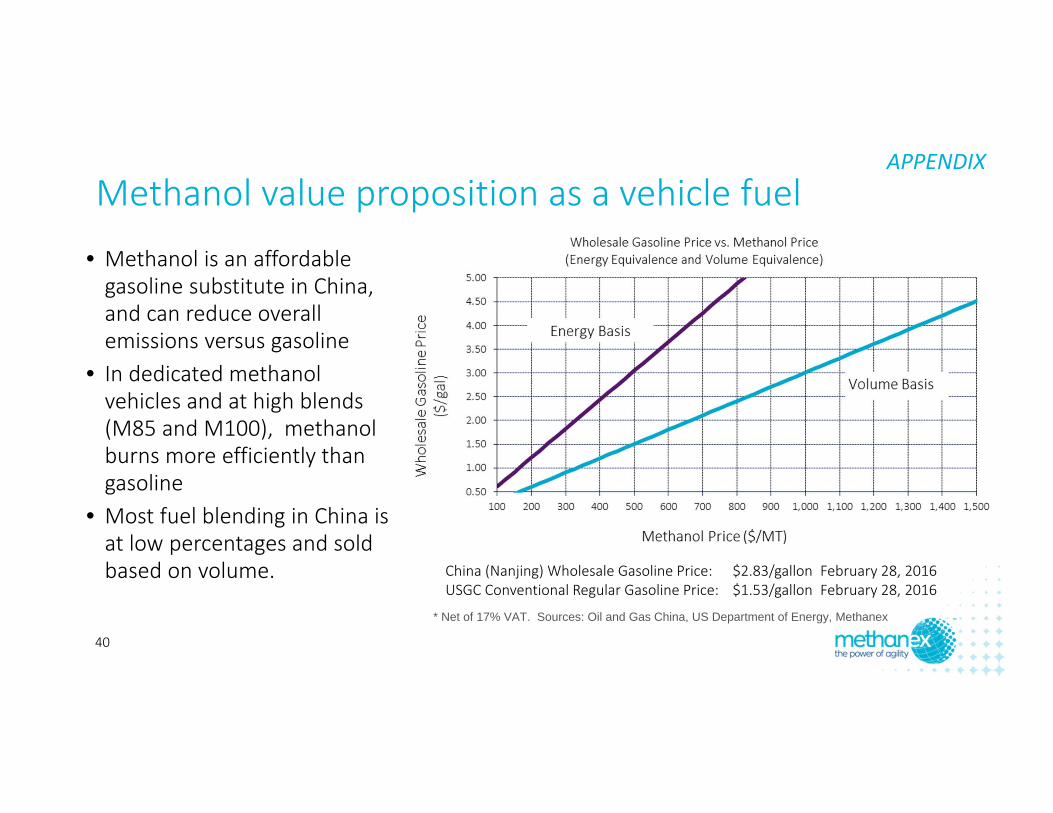
China (Nanjing) Wholesale Gasoline Price: $2.83/gallon February 28, 2016USGC Conventional Regular Gasoline Price: $1.53/gallon February 28, 2016
* Net of 17% VAT. Sources: Oil and Gas China, US Department of Energy, Methanex
APPENDIXMethanol value proposition as a vehicle fuel
• Methanol is an affordable gasoline substitute in China, and can reduce overall emissions versus gasoline
• In dedicated methanol vehicles and at high blends (M85 and M100), methanol burns more efficiently than gasoline
• Most fuel blending in China is at low percentages and sold based on volume.
40
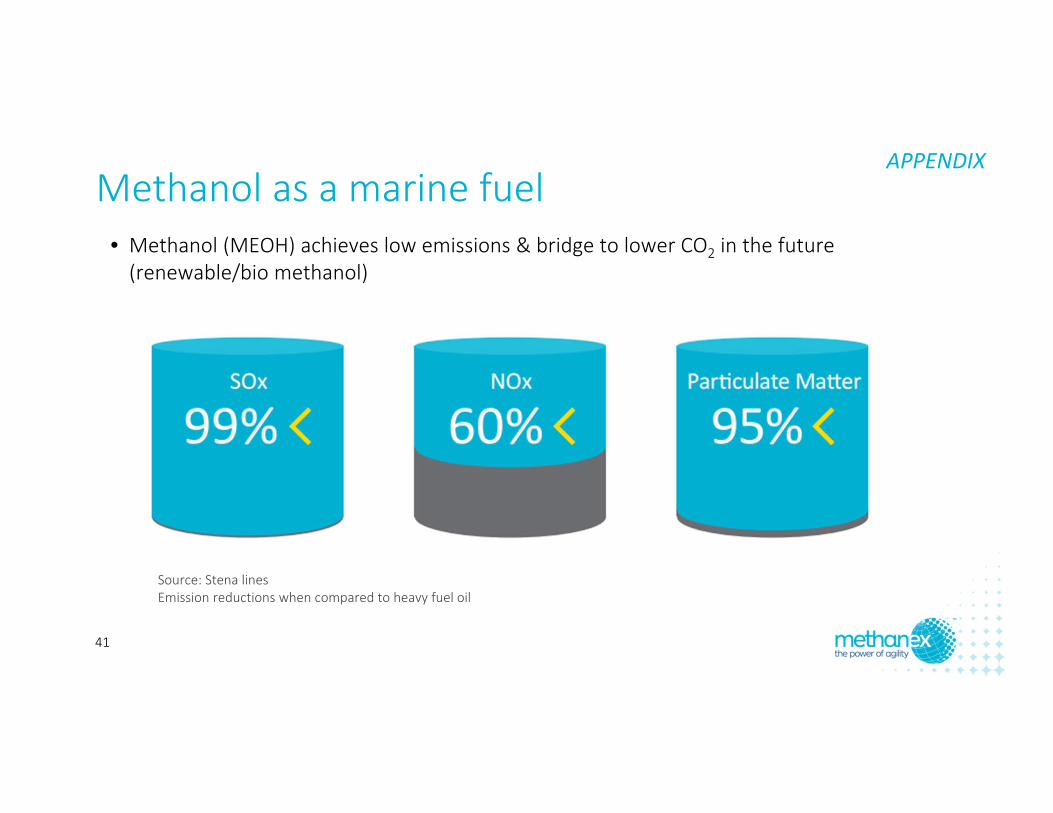
Source: Stena linesEmission reductions when compared to heavy fuel oil
APPENDIXMethanol as a marine fuel
• Methanol (MEOH) achieves low emissions & bridge to lower CO2 in the future (renewable/bio methanol)
41

Costs are low to convert and operate methanol‐fueled vesselsVessel Operating and Conversion Costs
Source: Effship Project Summary Report, 2013 * Costs do not include infrastructure development. Fuel cost based on market price 2012. Conversion based on 5 year pay‐back and 6% interest
0
0.02
0.04
0.06
0.08
0.1
0.12
0.14
0.16
0.18
HFO HFO + Scrubber(closed loop)
MGO Methanol LNG
€/kW
h –mechanical pow
er
Incremental Operating Costs
Conversion Costs
Fuel Costs
APPENDIX
42
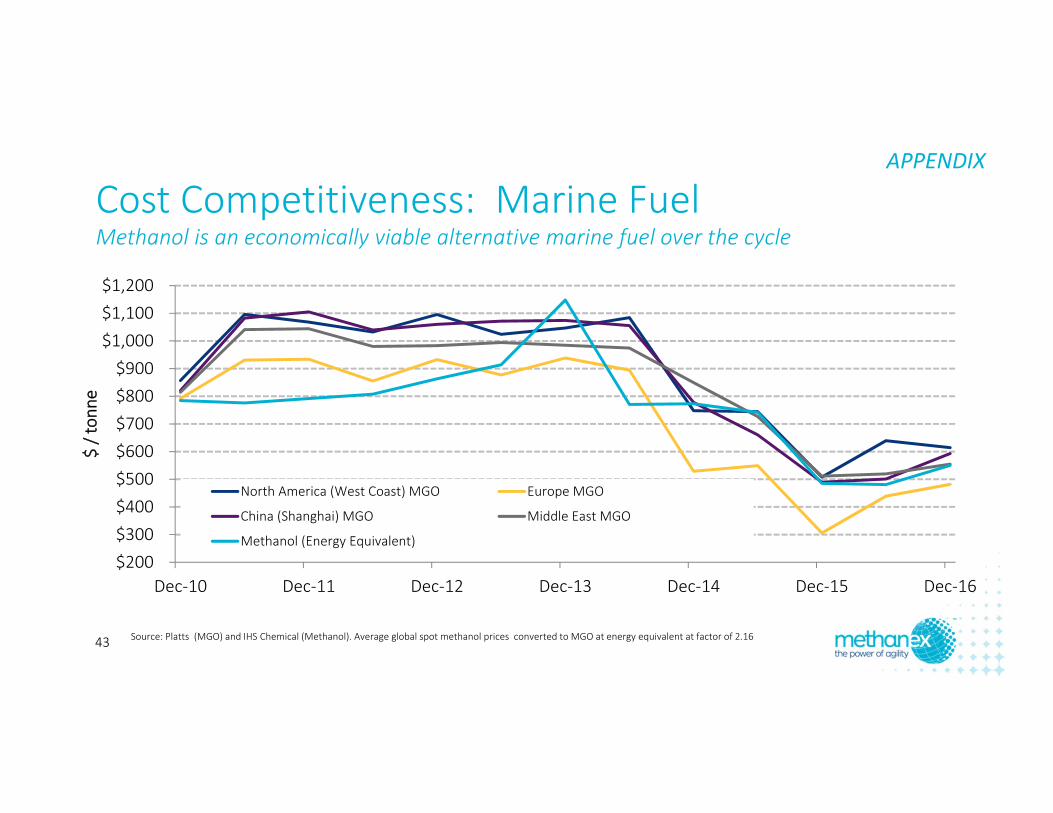
Methanol is an economically viable alternative marine fuel over the cycleCost Competitiveness: Marine Fuel
Source: Platts (MGO) and IHS Chemical (Methanol). Average global spot methanol prices converted to MGO at energy equivalent at factor of 2.16
$200$300$400$500$600$700$800$900
$1,000$1,100$1,200
Dec‐10 Dec‐11 Dec‐12 Dec‐13 Dec‐14 Dec‐15 Dec‐16
$ / ton
ne
North America (West Coast) MGO Europe MGO
China (Shanghai) MGO Middle East MGO
Methanol (Energy Equivalent)
APPENDIX
43
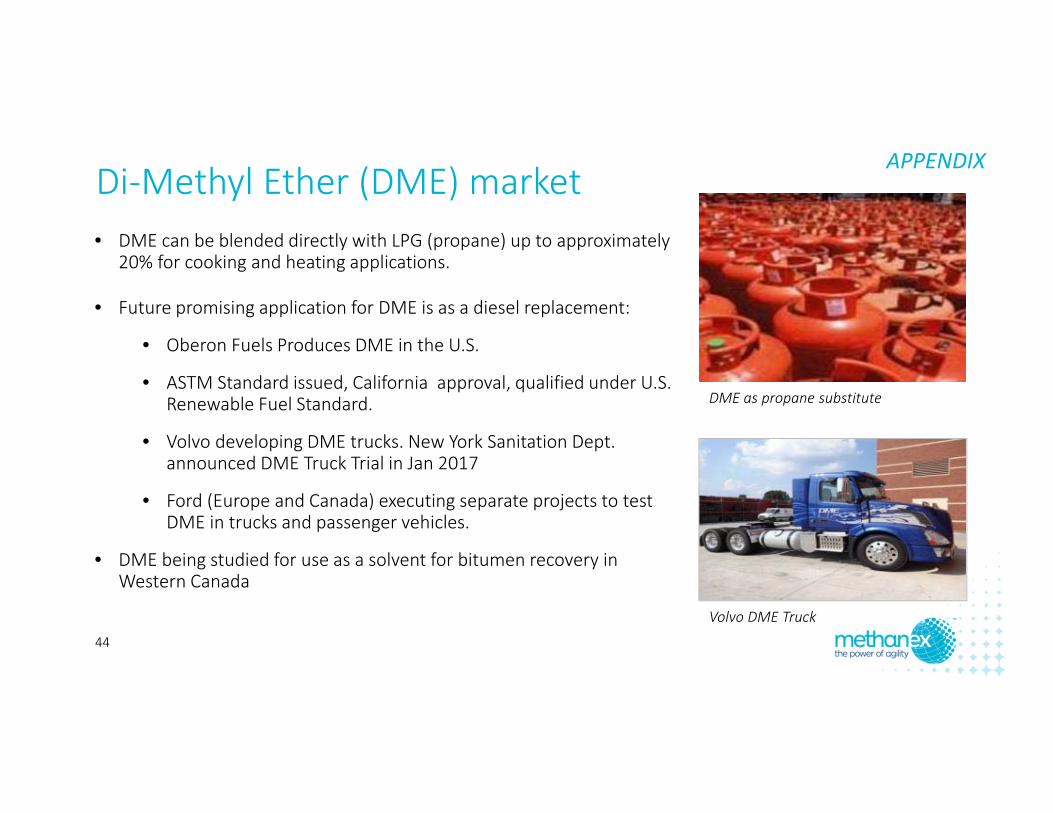
• DME can be blended directly with LPG (propane) up to approximately 20% for cooking and heating applications.
• Future promising application for DME is as a diesel replacement:
• Oberon Fuels Produces DME in the U.S.
• ASTM Standard issued, California approval, qualified under U.S. Renewable Fuel Standard.
• Volvo developing DME trucks. New York Sanitation Dept. announced DME Truck Trial in Jan 2017
• Ford (Europe and Canada) executing separate projects to test DME in trucks and passenger vehicles.
• DME being studied for use as a solvent for bitumen recovery in Western Canada
Volvo DME Truck
DME as propane substitute
Di‐Methyl Ether (DME) marketAPPENDIX
44
Egypt
China
Commercial / near‐commercialAssessment stage
Australia
Israel
New Zealand
Trinidad & Tobago
U.K.
Netherlands
Denmark
IranUzbekistan
Turkmenistan
Iceland
Switzerland
Azerbaijan
Alaska
Russia
U.S.
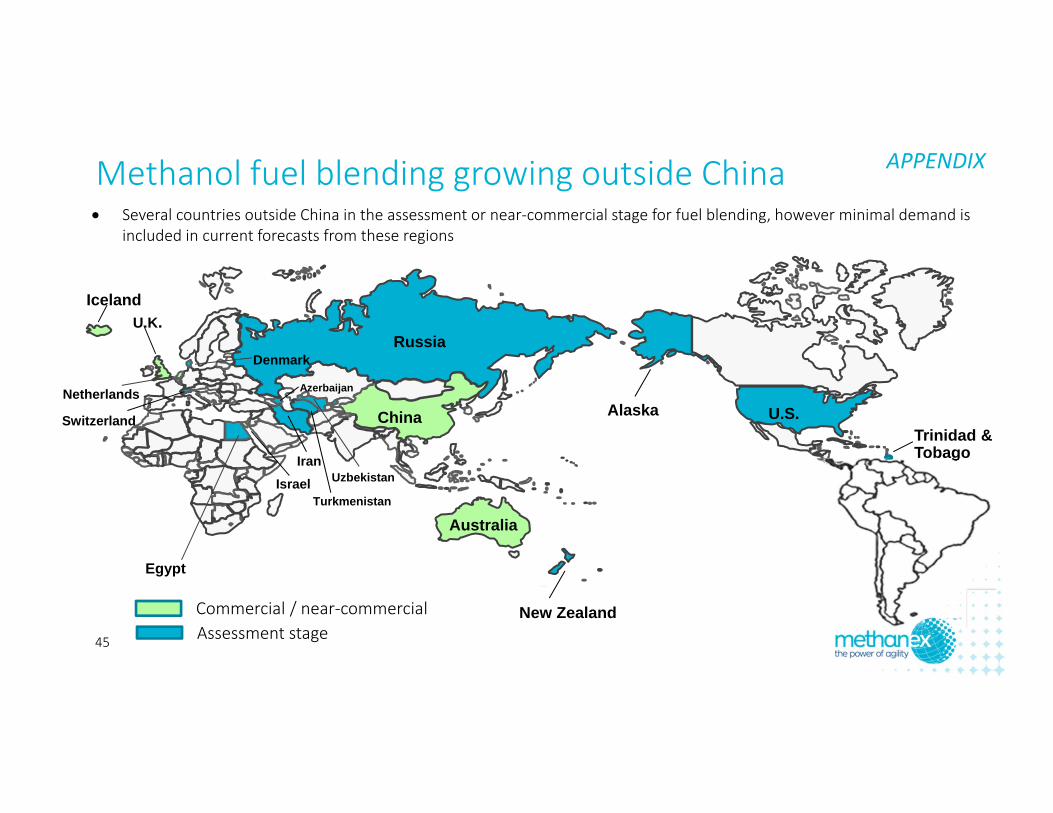
Several countries outside China in the assessment or near‐commercial stage for fuel blending, however minimal demand is included in current forecasts from these regions
Methanol fuel blending growing outside China APPENDIX
45
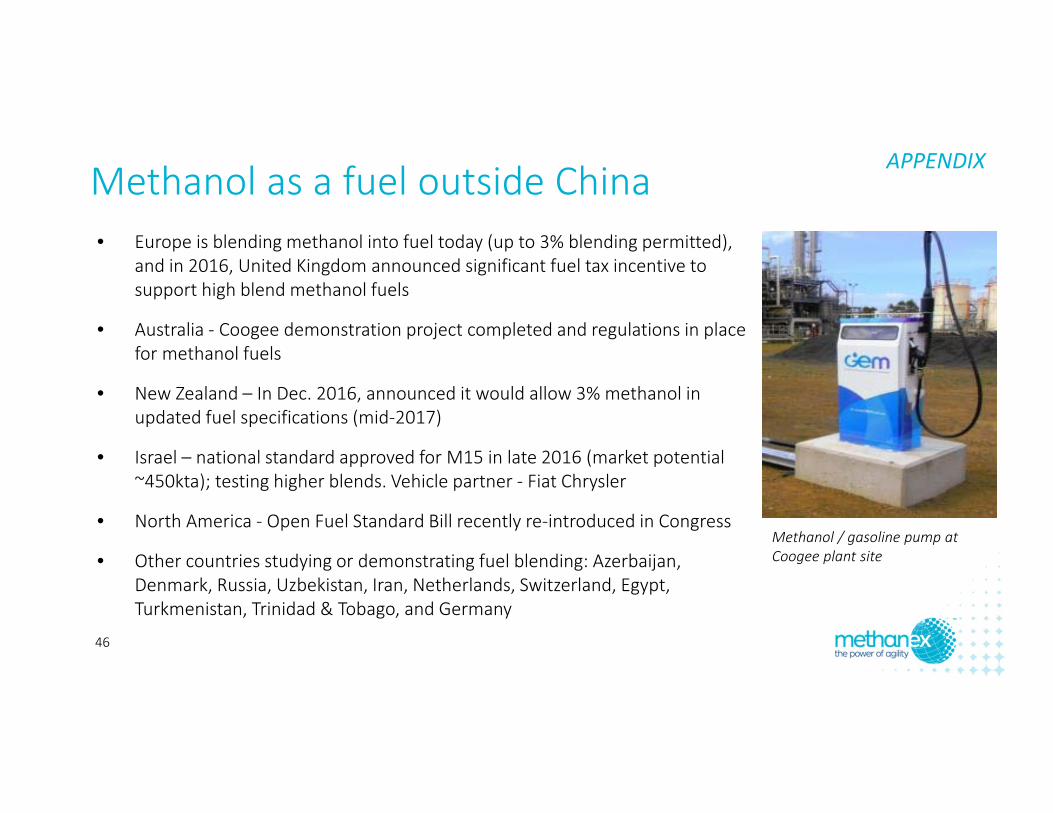
• Europe is blending methanol into fuel today (up to 3% blending permitted), and in 2016, United Kingdom announced significant fuel tax incentive to support high blend methanol fuels
• Australia ‐ Coogee demonstration project completed and regulations in place for methanol fuels
• New Zealand – In Dec. 2016, announced it would allow 3% methanol in updated fuel specifications (mid‐2017)
• Israel – national standard approved for M15 in late 2016 (market potential ~450kta); testing higher blends. Vehicle partner ‐ Fiat Chrysler
• North America ‐ Open Fuel Standard Bill recently re‐introduced in Congress
• Other countries studying or demonstrating fuel blending: Azerbaijan, Denmark, Russia, Uzbekistan, Iran, Netherlands, Switzerland, Egypt, Turkmenistan, Trinidad & Tobago, and Germany
Methanol / gasoline pump at Coogee plant site
Methanol as a fuel outside ChinaAPPENDIX
46
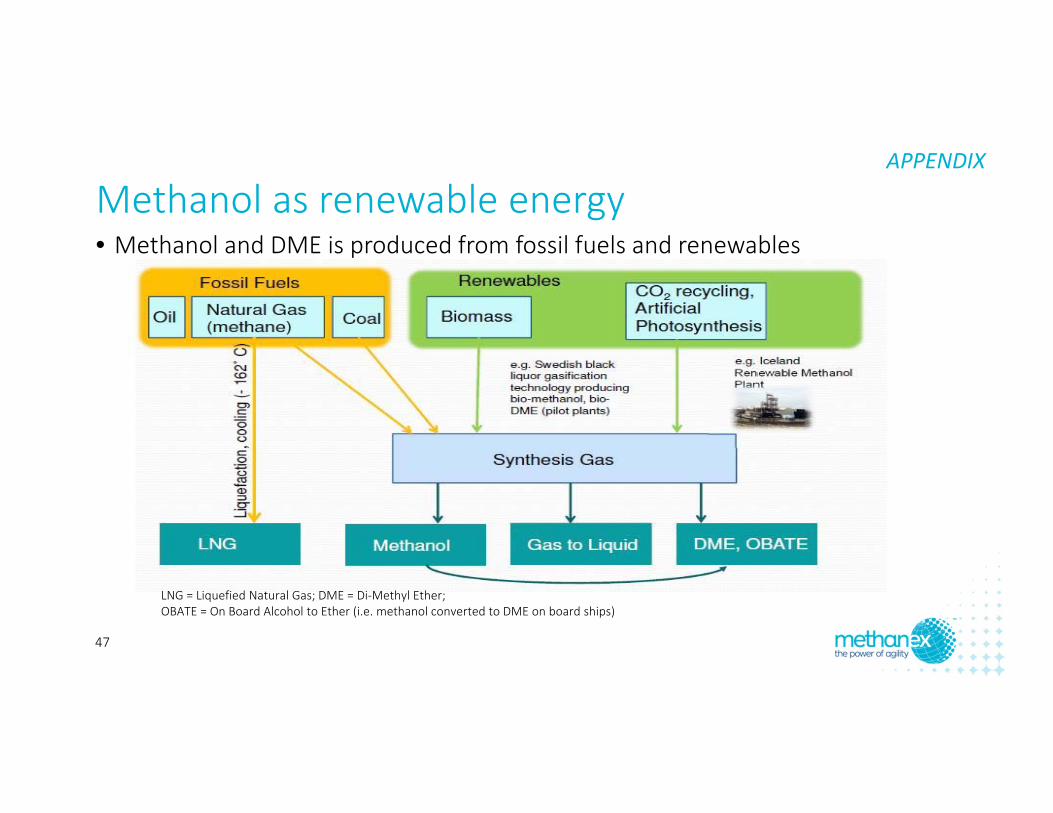
Methanol as renewable energy• Methanol and DME is produced from fossil fuels and renewables
LNG = Liquefied Natural Gas; DME = Di‐Methyl Ether; OBATE = On Board Alcohol to Ether (i.e. methanol converted to DME on board ships)
APPENDIX
47
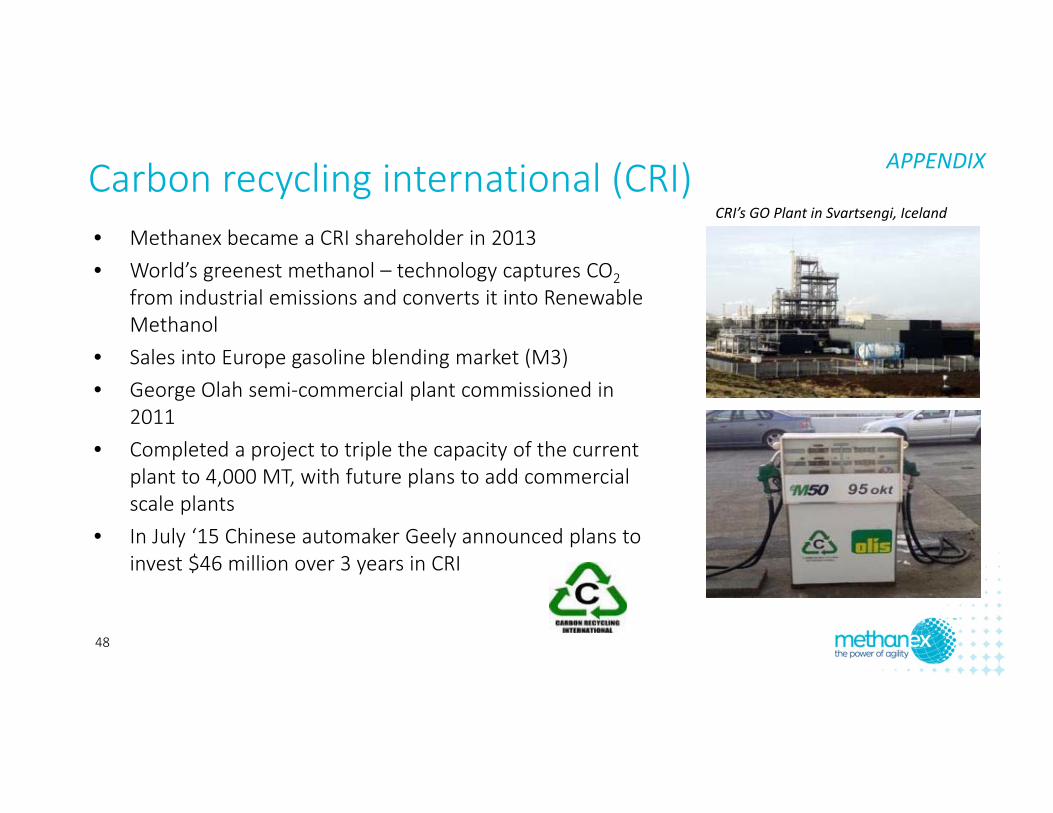
Carbon recycling international (CRI)• Methanex became a CRI shareholder in 2013• World’s greenest methanol – technology captures CO2
from industrial emissions and converts it into Renewable Methanol
• Sales into Europe gasoline blending market (M3)• George Olah semi‐commercial plant commissioned in
2011• Completed a project to triple the capacity of the current
plant to 4,000 MT, with future plans to add commercial scale plants
• In July ‘15 Chinese automaker Geely announced plans to invest $46 million over 3 years in CRI
CRI’s GO Plant in Svartsengi, Iceland
APPENDIX
48
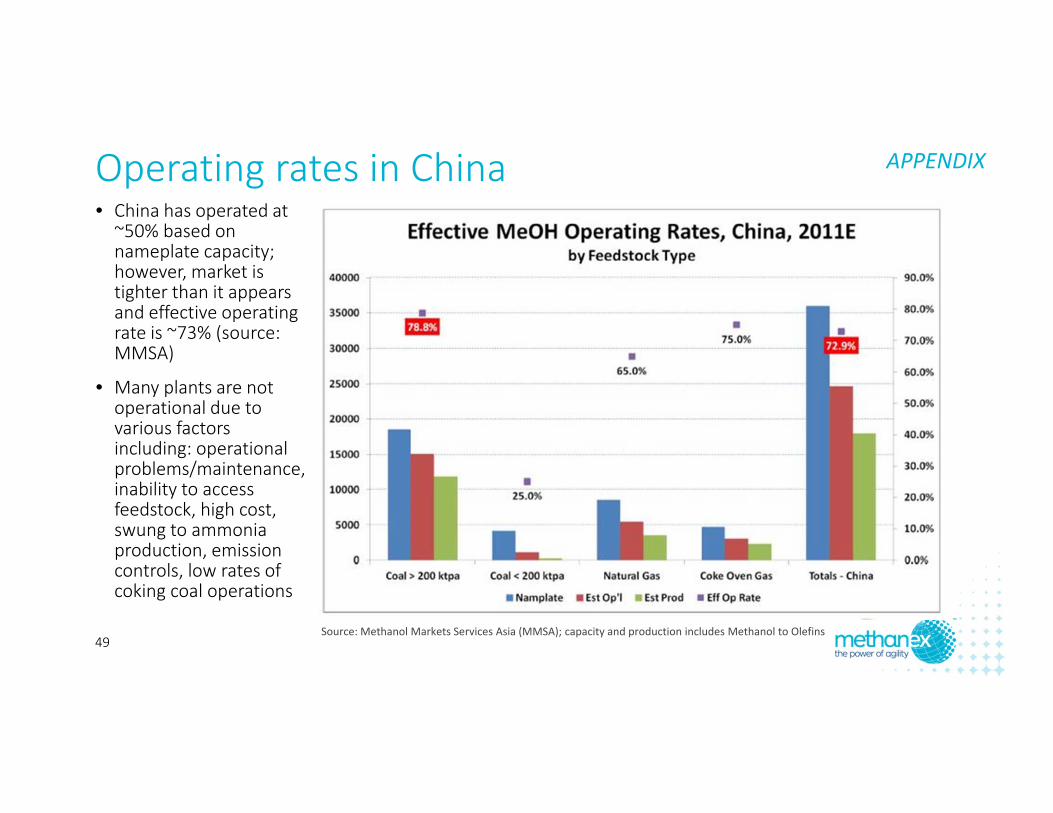
Operating rates in China• China has operated at ~50% based on nameplate capacity; however, market is tighter than it appears and effective operating rate is ~73% (source: MMSA)
• Many plants are not operational due to various factors including: operational problems/maintenance, inability to access feedstock, high cost, swung to ammonia production, emission controls, low rates of coking coal operations
Source: Methanol Markets Services Asia (MMSA); capacity and production includes Methanol to Olefins
APPENDIX
49
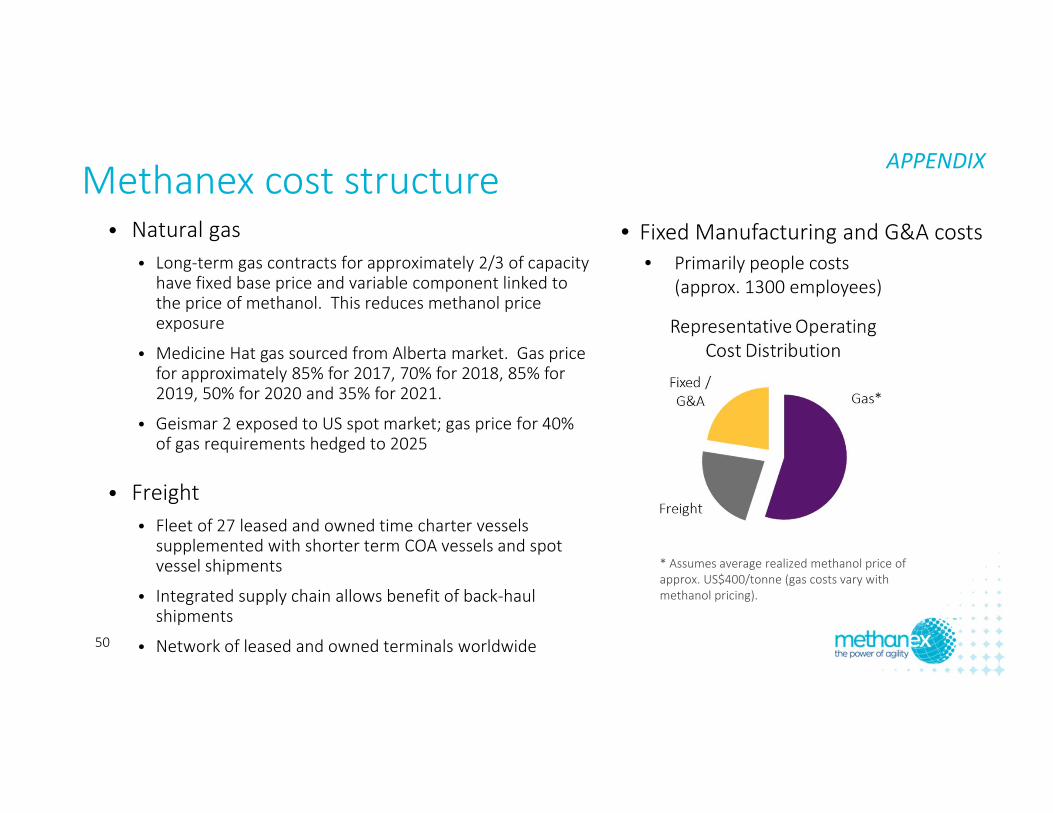
Methanex cost structure• Fixed Manufacturing and G&A costs
• Primarily people costs (approx. 1300 employees)
* Assumes average realized methanol price of approx. US$400/tonne (gas costs vary with methanol pricing).
• Natural gas• Long‐term gas contracts for approximately 2/3 of capacity have fixed base price and variable component linked to the price of methanol. This reduces methanol price exposure
• Medicine Hat gas sourced from Alberta market. Gas price for approximately 85% for 2017, 70% for 2018, 85% for 2019, 50% for 2020 and 35% for 2021.
• Geismar 2 exposed to US spot market; gas price for 40% of gas requirements hedged to 2025
• Freight• Fleet of 27 leased and owned time charter vessels supplemented with shorter term COA vessels and spot vessel shipments
• Integrated supply chain allows benefit of back‐haul shipments
• Network of leased and owned terminals worldwide
APPENDIX
50

Leverage – rating agency perspectivePro Forma Rating Agency Credit Rations
(US$ billions unless indicated)
Total Debt 1
Debt (Q4‐16) 1.4
Capital and Operating Leases 2 0.7
Adjusted Debt (including leases) 2.1
Adjusted Debt/EBITDA
ARP ($/tonne) EBITDA ($millions) 3
Debt/EBITDA
300 725 2.9
350 1,000 2.1
400 1,275 1.6
• Leverage target = Investment Grade• Preserves financial flexibility• Lowers cost of debt• Access to longer‐term bond market, shipping market, etc.
• Higher credit capacity to hedge gas exposures, etc.
• Moody’s Baa3, S&P BB+, Fitch BBB‐• ~3.0x Debt/EBITDA is long‐term measure• Ratio typically calculated over a cycle
• $300 million undrawn credit facility• Backstop liquidity
APPENDIX
1 Includes Methanex proportionate share of debt & cash2 Approx. adjustment for capital and operating leases3 "With Trinidad and Egypt Gas Restrictions" EBITDA scenario from earlier slide, plus $75 million adjustment reflecting approximate lease portion of COG
51
Foreign exchange sensitivity• US dollar based business• Majority of revenues in US dollars (EU net exposure hedged)• Natural gas and freight costs in US dollars• Approximately $150 million in local currency costs (not actively hedged)• Approximately $100 million in non‐US dollar working capital assets
“A strong US dollar benefits Methanex”
APPENDIX
52
Thank you
www.methanex.com
linkedin.com/company/methanex‐corporation
@Methanex


