Method Statement for Nitrate Vulnerable Zone review – Eutrophic Environment Agency report to Defra and Welsh Government – supporting paper for the Implementation of the Nitrates Directive 2013 – 2016 April 2012
Transcript
Method Statement for Nitrate Vulnerable Zone review – Eutrophic
Environment Agency report to Defra and Welsh Government – supporting paper for the Implementation of the Nitrates Directive 2013 – 2016
April 2012
Executive summary The Nitrates Directive (91/676/EEC) is designed to protect waters against nitrate pollution from agricultural sources. It requires Member States to identify waters which are or could become polluted by nitrates and to designate as Nitrate Vulnerable Zones (NVZs) all land draining to those waters and contributing to the pollution.
This report describes the process, methods and evidence used for identifying waters which are eutrophic or in the near future may become eutrophic if preventative action is not taken. The main focus is on surface standing waters, principally natural freshwater lakes and other freshwater bodies. However, the report also covers the consideration given to rivers, coastal and transitional waters which are eutrophic or in the near future may become eutrophic if preventative action is not taken.
Chapter I provides a summary of the relevant provisions of the Nitrates Directive and the evolution the methodology for identifying Eutrophic waters. The methodology has been developed by a Methodology Review Group chaired by Defra and implemented by the Environment Agency on behalf of Defra and Welsh Government.
Chapters 2 to 4 describe the evidence and process leading to the proposed identification of eutrophic standing fresh waters, while Chapter 5 describes the review in relation to rivers, transitional and coastal waters.
Chapter 2 reviews the evidence for the role of nitrogen in lake eutrophication, with a focus on the evidence relevant to UK waters. This is based on a more detailed review of the main, relevant literature provided in Appendix B. Chapter 2 also describes the principal metrics used to identify lakes at risk from eutrophication. Many of these have been developed as part of the implementation of the Water Framework Directive. Chapter 3 describes the overall structure of the risk assessment and the principal lines of evidence available to support judgements regarding the status of individual standing fresh waters considered as part of this review.
Chapter 4 describes the identification of candidate lakes for possible designation and their ranking and classification based on the strength of the available evidence. It also describes the process by which additional information was collected, evaluated and reviewed by an expert National Panel and through a process of local review, prior to final recommendations.
Over 250 lakes and reservoirs across England and Wales have been considered for designation. Based on the available evidence, 38 lakes or reservoirs and 13 transitional and coastal waters are recommended for designation (see Appendix A). Of these 25 lakes and 13 transitional waters were previously designated. It is recommended that three lakes previously designated by Defra on a precautionary basis should have their designations removed. Four lakes in Wales are recommended for designation, of which two were previously designated.
CONTENTS Error! Bookmark not defined.
Executive summary
Abbreviations
1 Introduction
1.1 Structure and focus of the report
1.2 Background
1.3 Evolution of the assessment methodology
1.3.1 Interpreting and expanding upon the requirements of the directive
1.3.2 National suite of criteria
1.3.3 Assessing individual waters against the criteria
1.3.4 Overview of the steps in the process for identifying candidate waters
1.3.5 Oversight by the Methodology Review Group
1.4 Outcome of applying the methodology
2 Nitrogen and lake eutrophication – the evidence base
2.1 Introduction
2.2 What is an appropriate measure of the nutrient nitrogen status of a lake?
2.3 What are appropriate criteria to determine significantly elevated nutrient nitrogen?
2.4 Evidence of nutrient nitrogen limitation
2.5 Principal additional metrics of eutrophication and associated criteria
2.5.1 Total Phosphorus
2.5.2 Dissolved Oxygen
2.5.3 Phytoplankton abundance and composition
2.5.4 Macrophytes and Phytobenthos
2.5.5 Chironomid Pupal Exuviae (CPET)
2.6 Additional Indicators of Eutrophication Impact
2.6.1 Number of reports of cyanobacteria blooms
2.6.2 Palaeolimnological Data
3 Overall structure and organisation of the evidence of lake eutrophication
3.1 Introduction
3.2 Overall structure of the evidence
3.2.1 Characteristics of the water body
3.2.2 Uses
3.2.3 Potential causes of eutrophication
3.2.4 Responses and Impacts
3.3 Local review and the elicitation of additional evidence
4 Assessment of eutrophic risk to standing fresh waters
4.1 Introduction
4.2 Role and composition of National Expert Panels
4.3 Identification of candidate lakes (step 1)
4.3.1 Screening of lakes with WFD monitoring
4.3.2 WFD confidence of eutrophication
4.3.3 Number of candidate lakes initially identified as at risk
4.4 Ranking and screening by First National panel (step 2)
4.5 Ranking and screening by second National panel (step 3)
4.6 Artificial lakes and reservoirs
4.7 Local review and collation of additional evidence (step 4)
4.8 Final National Panel and recommendations (step 5)
5 Rivers, transitional waters (estuaries) and coastal waters
5.1 Focusing in on water bodies of concern
5.1.1 Rivers
5.1.2 Transitional and coastal waters
6 References
Appendices
Appendix A. List of lakes and coastal waters identified for designation as N-eutrophic waters
Appendix B. Review of the scientific evidence for nutrient nitrate thresholds relevant to UK standing waters
Appendix C. Example of a draft eutrophic water proforma report provided as part of local elicitation exercise.
Appendix D. Criteria for nominating groups of lakes as candidates for designation as Nitrate eutrophic waters
Appendix E. Criteria used to identify eutrophication in estuaries and coastal waters
Abbreviations
BQE Biological Quality Element. Several BQE‘s provide the basis for determining whether a WFD water body is determined as being at good status.
CCW Countryside Council for Wales
CoEA Confidence of Eutrophication Assessment. A screening approach to identify candidate lakes for the purposes of the Eutrophic Waters review.
CPET Chironomid Pupal Exuviae Technique. A method for assessing the impact of nutrient enrichment and acidification based on larval midge species composition.
DALES/DARLEQ WFD tools for assessing and classifying the status of the phytobenthos (diatoms) in freshwaters.
Defra Department for Environment Food and Rural Affairs
EA Environment Agency
EQR Ecological or Environmental Quality Ratio. Used by WFD classification tools to set class boundaries.
LEAFPACS WFD tools for assessing and classifying the status of lake macrophytes.
MRG Methodology review group established by Defra, WAG and Environment Agency
NE Natural England
NVZ Nitrate Vulnerable Zone
OECD Organisation of Economic Development and Cooperation
RAMSAR An international treaty for the conservation of wetlands of International importance, particularly for migratory waterfowl.
SAC Special Area of Conservation. A conservation designation under the EC Habitats Directive.
SPA Special Protection Area. A conservation designation under the EC Habitats and Birds Directives.
SSSI Site of Special Scientific Interest. A UK conservation designation.
TDI Trophic Diatom Index
TiN Total inorganic nitrogen. A chemical determination of nutrient nitrogen concentration that includes, in principle, both nitrate (NO3), nitrite (NO2) and ammonium (NH4
+).
TN Total nitrogen. A chemical determination that includes both organic and inorganic forms of nitrogen
TON Total oxidised nitrogen. A chemical determination of nutrient nitrogen concentration that includes, in principle, both nitrate (NO3) and nitrite (NO2)
TP Total phosphorus concentration. A chemical determination of nutrient phosphorus that includes, in principle, both dissolved and particulate forms of phosphorus
TraC Transitional and Coastal water. A term used to describe estuaries, saline lagoons and other coastal, usually tidal waters.
WG Welsh Government
WFD Water Framework Directive (2000/60/EC).
WFD-UKTAG Water Framework Directive Technical Advisory Group.
1 Introduction
1.1 Structure and focus of the report
This document describes the methodology for waters affected by eutrophication in the context of the most recent NVZ review, hereafter referred to as the 2012 review. The resulting designations are due to come into force in 2013. The methodologies used for identifying surface water rivers and groundwaters which contain or could contain more than 50 mg/l nitrate are different and have their own method statements.
The report is divided into five chapters. Chapter I is an introduction, summarising the relevant provisions of the Nitrates Directive and the evolution of the methodology for identifying Eutrophic waters. The methodology has been developed by a Methodology Review Group chaired by Defra and implemented by the Environment Agency on behalf of Defra and Welsh Government.
Chapters 2 to 4 describe the evidence and process leading to the proposed identification of nitrate polluted standing fresh waters, while Chapter 5 describes the review in relation to rivers, transitional and coastal waters. The main focus of this report is on standing freshwaters where a number of additional candidate waters are proposed for identification under the directive.
Chapter 2 reviews the evidence for the role of nitrogen in lake eutrophication, with a focus on the evidence relevant to UK waters. This is based on a more detailed review of the main, relevant literature provided in Appendix B. Chapter 2 also describes the principal metrics used to identify lakes at risk from eutrophication. Many of these have been developed as part of the implementation of the Water Framework Directive. Chapter 3 describes the overall structure of the risk assessment and the principal lines of evidence available to support judgements regarding the status of individual standing fresh waters considered as part of this review.
Chapter 4 describes the identification of candidate lakes for designation, the ranking and classification of candidate waters based on the strength of the available evidence, and the process by which the information is evaluated and reviewed by the expert National panel and through local review, prior to final recommendations.
Further technical material is presented in Appendices C-E.
1.2 Background
The Nitrates Directive (91/676/EEC) is intended to protect waters against nitrate pollution from agricultural sources. Member States are required to identify waters that are or could become polluted by nitrates and to designate all land draining to them and contributing to the pollution as Nitrate Vulnerable Zones (NVZs)1. Farmers in designated areas must follow an Action Programme to reduce pollution from agricultural sources of nitrate. The criteria for identifying waters as polluted are established in the Directive, which also sets out monitoring requirements. NVZ designations must be reviewed at least every four years.
1 Member States may, as an alternative to identifying specific vulnerable zones, establish and
apply action programme throughout their national territory.
Waters that are or could be affected by pollution are to be identified using, inter alia, the following criteria, the third of which is relevant in the context of this method statement:
surface freshwaters which contain or could contain, if preventative action is not taken (i.e. Action Programme measures), more than 50 mg/litre nitrate;
groundwaters which contain or could contain, if preventative action is not taken, more than 50 mg/litre nitrate;
natural freshwater lakes, other freshwater bodies, estuaries, coastal waters and marine waters which are eutrophic or in the near future may become eutrophic if preventative action is not taken.
The Directive also specifies that the following considerations must be taken into account when applying these criteria:
the physical and environmental characteristics of the water and land;
current (scientific) understanding of the behaviour of nitrogen compounds in the environment (water and soil); and,
current understanding of the impact of preventative action.
Under Article 6 for the purpose of designating and revising the designation of vulnerable zones, Member States shall: ―review the eutrophic state of their fresh surface waters, estuarial and coastal waters every four years‖.
The Directive requires that at each NVZ review, changes and factors unforeseen at the previous review must be taken into account. The periodic nature of reviewing NVZs means that each review necessarily presents a ‗snapshot‘ assessment of nitrate pollution up to the time of the review. This latest review was undertaken using data up to and including 2009.
1.3 Evolution of the assessment methodology
1.3.1 Interpreting and expanding upon the requirements of the directive
The Defra methodology for designating nitrate vulnerable zones on the basis of eutrophication was originally published in 1993. In the absence of any detailed approach or criteria in the directive for assessing eutrophication, these were developed based on (a) the definition of eutrophication in the Nitrates Directive, (b) the requirement to identify waters which are ―found to be eutrophic or which in the near future may become eutrophic if protective action is not taken‖ and (c) an understanding of the relevant science.
The starting point is the requirement to identify waters which are eutrophic or may become so in the near future. The meaning of the term ―eutrophic‖ must be inferred from the definition of eutrophication set out in the directive.
Eutrophication is defined as “the enrichment of water by nitrogen compounds, causing an accelerated growth of algae and higher forms of plant life to produce an undesirable disturbance to the balance of organisms present in the water and to the quality of the water concerned‖.
In this report a ―eutrophic‖ lake is one that may show or be expected to show symptoms of eutrophication (undesirable ecological change) as defined above. Hence
it may include lakes which are, in limnological classification terms, naturally oligotrophic, mesotrophic or eutrophic (see Box 1.1 for descriptions of these) but whose trophic status has been altered by nutrient enrichment. Eutrophication is recognised as one of the foremost problems for protection of water resources and dependent ecology (see Smith et al. (2006) for a review).
Box 1.1. The natural trophic status of UK lakes
Oligotrophic and Dystrophic Lakes
Oligotrophic and dystrophic lakes are mainly more than 2 ha in size and occur throughout the UK, mostly in upland areas of the north and west. They which are characterised by low nutrient levels and low productivity. Oligotrophic lakes usually have very clear water, whilst some examples with dystrophic characteristics have peat-stained waters. Their catchments usually occur on hard, acid rocks, most often in the uplands. This habitat type encompasses a wide range of size and depth, and includes the largest and deepest water bodies in the UK. The water column typically contains less total phosphorus and total inorganic nitrogen than Mesotrophic lakes (see below).
Good examples may support some of the least disturbed aquatic assemblages in the UK. Characteristic plankton, zoobenthos, macrophyte and fish communities occur, including several UK BAP species and species of economic importance. Fish communities, generally dominated by salmonids, may include charr Salvelinus alpinus and Coregonus spp. A number of benthic and planktonic invertebrates, found only in oligotrophic lakes, are possibly glacial relicts. Macrophytes are typically sparse, with species such as shoreweed Littorella uniflora and quillwort Isoetes spp.
Mesotrophic lakes
Mesotrophic lakes (i.e. those in the middle of the trophic range) are relatively infrequent in the UK and largely confined to the margins of upland areas in the north and west. They are characterised by having a narrow range of nutrients, the main indicative ones being inorganic nitrogen (N) and total phosphorus (P). Typically, mesotrophic lakes have nutrient levels of 0.3-0.65 mgN.l-1 and 0.01-0.03 mgP.l-1. Whilst such levels simplify the complex interaction between plant nutrients and the hydrological and physical characteristics of individual lakes (for instance, virtually all available nutrients are `locked up` in algae during the growing season), they serve to show the sensitivity of the trophic state to artificially increased levels of nitrogen and phosphorus. Thus, this is an increasingly rare type of lake.
Mesotrophic lakes potentially have the highest macrophyte diversity of any lake type. Furthermore, relative to other lake types, they contain a higher proportion of nationally scarce and rare aquatic plants. Macroinvertebrates are well represented, with particularly important groups being dragonflies, water beetles, stoneflies and mayflies. In general, fish communities in mesotrophic lakes are a mix of coarse and salmonid species, but today there are few truly natural assemblages due to introduced species.
In order to identify waters that are eutrophic, or in the near future may become eutrophic if preventative action is not taken, it is necessary to consider:
the current condition of the water body (ideally compared to a reference condition);
whether undesirable effects, such as deoxygenation, algal blooms, growth of particular plants, or other changes in species composition, have occurred;
whether nitrogen is involved in causing such eutrophication, and
whether such effects may occur if preventative action is not taken.
Box 1.1. (Cont.)
Eutrophic lakes Eutrophic lakes are highly productive because plant nutrients are plentiful, either naturally or as a result of artificial enrichment. These water bodies are characterised by having dense, long-term populations of algae in mid-summer, often making the water green. Their beds are covered by dark anaerobic mud, rich in organic matter. The water column typically contains at least 0.035 mg.L-1 total phosphorus (which includes phosphorus bound up in plankton and 0.5 mg.L -1 or more total inorganic nitrogen (mainly in the form of dissolved nitrates). Eutrophic waters are most typical of hard water areas of the lowlands of southern and eastern Britain, but they also occur in the north and west, especially near the coast.
In their natural state eutrophic waters have high biodiversity. Planktonic algae and zooplankton are abundant in the water column, submerged vegetation is diverse and numerous species of invertebrate and fish are present. Plant assemblages differ according to geographical area and nutrient concentration but fennel-leaved pondweed Potamogeton pectinatus and spiked water-milfoil Myriophyllum spicatum are characteristic throughout the UK. Common floating-leaved plants include yellow water lily Nuphar lutea and there is often a marginal fringe of reedswamp, which is an important component of the aquatic ecosystems. Bottom-dwelling invertebrates such as snails, dragonflies and water beetles are abundant and calcareous sites may support large populations of the native freshwater crayfish Austropotamobius pallipes. Coarse fish such as roach Rutilus rutilus, tench Tinca tinca and pike Esox lucius are typical, but salmonids also occur naturally in some of eutrophic lakes.
Based on Maddock (2008). See http://jncc.defra.gov.uk/page-5706
The approach adopted in England and Wales since 1993 has been to collate and assess evidence for individual water bodies against a national suite of criteria for eutrophication in the different categories/types of water for review. The criteria are both quantitative and qualitative and reflect scientific understanding of the process and effects of eutrophication. They are broken down in the same way for each water category as follows:-
Category I – Nutrients. Nitrogen and phosphorus are termed causative parameters. Both can contribute to eutrophication, but for the Nitrates Directive we only identify polluted waters if sufficient nitrate is present to promote eutrophication in addition to any phosphorus enrichment. Indicative thresholds for nutrients have been established for the relevant water types based on published scientific evidence/literature and with reference to WFD-UKTAG guidance2 to decide whether waters are enriched by nutrients.
Data on nitrogen loadings to the water body from different sources, derived by modelling and other methods, are also collated to confirm whether agriculture is making more than an insignificant contribution.
Category II – Plants / algae. Elevated nutrient concentrations can have a range of impacts on the plant life in waters. These are termed response parameters. The changes assessed include:
increased abundance and biomass of algae (phytoplankton, macroalgae, benthic diatoms) and/or higher plants;
Changes to species composition;
exceptional algal blooms.
Category III – Secondary and other effects. Water quality and adverse ecological impacts resulting from excessive plant/algal growth are considered, including changes to dissolved oxygen, occurrence of toxic/harmful algal blooms and the effects on other flora and fauna. Information on any impacts of eutrophication on water use (e.g. recreation, conservation value, drinking water supply) is also considered.
The methodology has been updated over time to refine the assessment criteria, reflecting our improving understanding of the science and the processes involved in eutrophication. The criteria used have been summarised in the documents issued by Defra / WAG at each NVZ review. Further detail on the latest criteria used for standing freshwaters is provided in Section 2.
1.3.3 Assessing individual waters against the criteria
Eutrophication describes a process of change rather than a state and is controlled by a number of factors. These include nutrients, flow rate of waters, residence time, shading and turbidity, depth, temperature, stratification, and turbulence. The precise influence of many of these factors in the process is not easily quantified and eutrophication can express itself in different ways depending on the type of water (e.g. estuary or lake) involved. The assessment of whether a water is eutrophic or may become eutrophic is
2 Detailed references are given in the relevant sections of this report.
not possible simply by reference to absolute numeric criteria. A number of symptoms are considered in order using a structured framework to come to a rounded judgement, taking into account the weight of evidence, as to whether an individual water is suffering an ―undesirable disturbance‖ or may do so without preventative action.
A case for identification is considered to exist where it is found (i) that the Category I criteria are exceeded and (ii) some (or all) of the Category II and III criteria are exceeded, or may be exceeded, taking into account the influence of relevant environmental factors and considering the overall weight of evidence.
1.3.4 Overview of the steps in the process for identifying candidate waters
Water bodies are assessed for eutrophication using the following three steps:
Step 1 – Focusing in on water bodies of concern
The Environment Agency has adopted a risk-based approach to monitoring and assessment for eutrophication. Information from national monitoring programmes, operational investigations, risk assessments and local knowledge is used to identify specific water bodies which warrant a more detailed investigation. Information is considered for different water categories – standing freshwaters, rivers, transitional (estuarine) and coastal waters. Monitoring data supplied from the Broads Authority and Conservation Agencies monitoring programmes has also been considered.
For the 2011 review, over 80 standing freshwater bodies and a small number of transitional waters were identified for more detailed assessment.
Step 2 – Detailed investigation of individual water bodies
For the waters identified under Step 1, detailed evidence is collated from various sources and compared against the suites of criteria for the different types of water under investigation.
The evidence for individual water bodies is entered into a database or, in the case of transitional waters, on standardised proforma reports. Standardised proforma reports are produced summarising the data and the condition of water body, in comparison to the relevant chemical, biological and other criteria. Supporting information is also provided.
Step 3 - Quality assurance and submission of data to a national panel
A National Panel ensures consistency in the assessment procedure. The panel includes Environment Agency and external experts and observers from stakeholder groups. For lakes, since much of the data is held nationally, there is a process of local quality assurance prior to the final national panel to ensure that the proposed candidate waters are based on best available evidence.
Step 4 – Identification of land
The land draining to the polluted waters (eutrophic) is defined as:
land draining directly to the eutrophic water, for which specific hydrological boundaries were drawn within the WFD catchment boundaries, plus
the WFD catchments of all those surface waters which are upstream of (and therefore drain into) the eutrophic water.
1.3.5 Oversight by the Methodology Review Group
For the 2012 review, revisions to the previous methodology were discussed and agreed with a Methodology Review Group (MRG) chaired by Defra. The MRG comprised farming industry representatives, Welsh Government, Environment Agency, Conservation Agency and independent academic experts. The final methodology has been reviewed and accepted by these academic experts, who are leaders in the field of surface water management.
The final methodology was applied by the Environment Agency and in close consultation with Defra. It represents a robust and practical approach to the identification of polluted waters and NVZ‘s, and is consistent with assessment approaches adopted for the Water Framework Directive (2000/60/EC).
1.4 Outcome of applying the methodology
Thirty eight lakes and 7 coastal estuarine waters are identified for designation as N-eutrophic waters. The catchments draining to these eutrophic waters will be recommended for designation as Nitrate Vulnerable Zones (see Figure 1.1, Appendix A).
Of the lakes, 34 are in England and 4 in Wales Twenty five of these had been designated previously and 13 are proposed as new designations. Three lakes in England, previously designated on a precautionary basis, are recommended to have their designations removed based on improved evidence of their status.
The land draining to these lakes has been identified based on a digital elevation model of surface topography and has been subject to review by local Environment Agency operational staff.
In England, a total 1140 km2 of land is identified for designation as nitrate vulnerable zones (NVZ‘s) to protect lakes, of which 324 km2 is associated with the 11 proposed new lake designations in England.
In Wales, 63 km2 of land is identified for designation as nitrate vulnerable zones (NVZ‘s) to protect lakes, of which 23.5 km2 is associated with the 2 proposed new lake designations in Wales.
No new coastal waters are identified as N-eutrophic waters. The land area recommended for designation as NVZ‘s to protect these coastal waters is 5211 km2. None of this land is in Wales.
The total area of land designated as NVZ‘s to protect these waters is approx 6351 km2 in England and 62 km2 in Wales.
Figure 1.1 Location of proposed 2012 eutrophic water NVZ areas. Note that some new lake designations occur within the catchment area of existing lake NVZ designation (e.g. broads in E. Anglia).
2 Nitrogen and lake eutrophication – the evidence base
2.1 Introduction
A range of factors influences the growth of plants in fresh waters. In accordance with the legal definition, an essential precursor to eutrophication is the presence of nutrients in sufficient quantity to support sustained algal and/or plant growth. Scientific studies by limnologists in the 1920s and large-scale comparative analyses from the 1970s onwards (Vollenweider, 1968 and others) have provided a strong body of evidence that phosphorus is the key nutrient controlling production and excess algal biomass in most freshwater systems. The potential for imposing nutrient limitation through control of external nutrient inputs (from both agricultural and human effluent sources) is also generally greatest for phosphorus. Threshold criteria for phosphorus in different types of freshwaters have been used by the UK for Nitrates and UWWT Directives purposes since the criteria were first developed in 1993.
In recent years it has been recognised that nutrient nitrogen can play an important role in eutrophication of lakes in some situations. UK Eutrophication Steering Group commissioned a literature review of the role of nutrient N in freshwater eutrophication to assist UK regulatory agencies in formulating recommendations to Government as to which waters warrant identification under Nitrate and/or UWWT Directives. The report (CEH, 2004) indicated that lowland rivers are unlikely to be N-limited but that N may be important in upland lakes and rivers. Regulators should also consider lowland lakes with high phosphorus concentrations, those with long residence times and few inflows, those dominated by submerged macrophytes and those where the inflow passes through a wetland. Site-specific assessment was recommended and the report summarised the tools and techniques available, whilst recognising the difficulties in applying the methods and interpreting the data in what is a developing area of science.
A review of the relevant, recent scientific literature pertaining to the role of nitrogen in promoting changes to the ecology of UK lakes is provided in Appendix B. This review provides evidence for the role of nutrient nitrogen in the eutrophication of lakes within the UK. In particular, it provides evidence that an average winter nitrogen concentration of 1-2 mgN.L-1 in lake waters represents, in general, a level at which the adverse effects of elevated nutrient nitrogen on the ecology of lakes may be expected. The use of these levels, allows us to identify lakes at higher risk of eutrophication. However, for reasons of cost and scientific uncertainty it is rarely possible to provide explicit evidence that nutrient N is driving the observed changes at each individual lake.
This chapter explains how the 1-2 mg.L-1 criterion for nutrient N is used, based on both total oxidised nitrogen (TON) and total nitrogen (TN). The 1-2 mg.L-1 threshold for nitrogen was used as part of the suite of criteria for standing freshwaters in the 2008 NVZ review and is also being used for the 2013 review. The criteria are important as they are used to identify lakes that may be risk of eutrophic disturbance from elevated concentrations of nutrient nitrogen. The criterion is applied to all lakes. For naturally oligotrophic or mesotrophic lakes, lower levels of elevated nutrient nitrogen may indicate evidence of eutrophication, compared to naturally eutrophic lakes (see Box 1.1). The threshold is above the levels expected of the majority of natural lakes in the UK.
Individual lakes may show no, or more-or-less strong evidence of eutrophic disturbance. The chapter describes the core suite of variables, both biological and chemical, that provide the principle evidence of eutrophication. It also describes the associated criteria used to provide evidence regarding the significance of the measurements as indicative of eutrophic disturbance. Many of these metrics have been developed for the purposes of implementation of the WFD. Some are subject to ongoing review and development. The metrics and their associated criteria form part of the overall suite evidence used in the assessment of a nitrate-polluted water.
2.2 What is an appropriate measure of the nutrient nitrogen status of a lake?
When assessing lake eutrophication the approach most often used to assess the level of nutrient enrichment is to consider the annual or growing season average total phosphorus and total nitrogen content3 of the water e.g. as per the well established OECD methodology (Vollenweider, 1968). The total concentration is considered a good surrogate of the annual loading. It includes the fraction of nutrient contained in phytoplankton, which often dominate larger eutrophic lakes, as well as nutrient recycled from sediments but ultimately derived from the catchment. It assumes that the lake, in response to nutrient loading, is close to some long-term equilibrium.
For the previous (2008) designation most of the available data was of total oxidised nitrogen (TON). This excludes the organic component and hence may underestimate the amount of nutrient nitrogen available to promote plant growth. In winter, a lake is likely to be well mixed, concentrations may be elevated resulting from seasonal run-off, remineralisation of organic nitrogen within the lake and reduced rates of biological uptake and denitrification. Hence a mean winter TON concentration should provide a good estimate of the nitrogen available to support primary production in the lake at the start of the growing season.
For the 2008 NVZ review insufficient total nitrogen (TN) data were available for use in the assessment. An estimate of the winter TON concentration was derived based on the 75%ile value of the TON data collected between 2005-2008. The 75%ile provides a straightforward statistic that represents the elevated concentrations found in winter. It allowed best use of the available, limited data. The 75%ile can be shown to be closely equivalent to the winter mean.
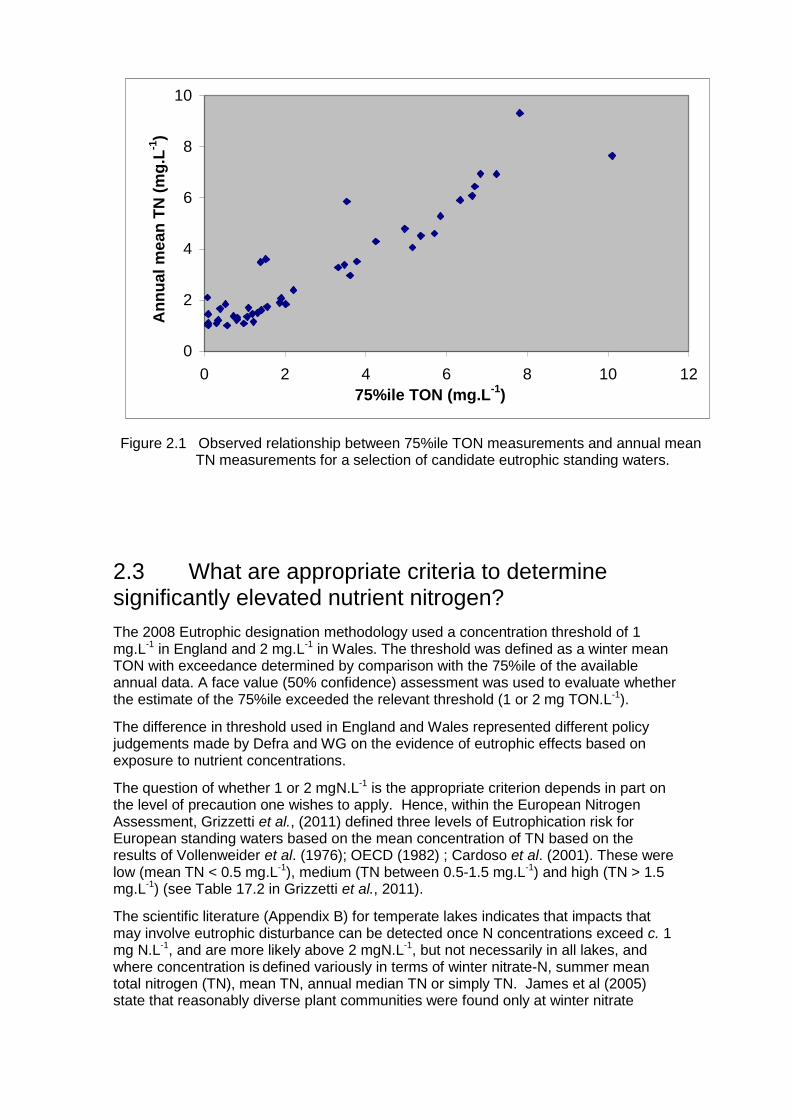
Due to the increased monitoring put in place for many candidate lakes since the 2008 review, we now have measurements of both TON and TN. Estimates of annual mean TN are used to complement the 75%ile soluble total oxidised nitrogen (TON) component. Generally annual mean TN and 75%ile TON are closely related (see Figure 2.1), but there are a few cases where TON is low but TN is elevated and it seems appropriate to give such cases further consideration.
3 Total nitrogen may include dissolved nitrate, nitrite, ammonium as well as organic nitrogen.
0
2
4
6
8
10
0 2 4 6 8 10 12
75%ile TON (mg.L-1
)
An
nu
al
me
an
TN
(m
g.L
-1)
Figure 2.1 Observed relationship between 75%ile TON measurements and annual mean TN measurements for a selection of candidate eutrophic standing waters.
2.3 What are appropriate criteria to determine significantly elevated nutrient nitrogen?
The 2008 Eutrophic designation methodology used a concentration threshold of 1 mg.L-1 in England and 2 mg.L-1 in Wales. The threshold was defined as a winter mean TON with exceedance determined by comparison with the 75%ile of the available annual data. A face value (50% confidence) assessment was used to evaluate whether the estimate of the 75%ile exceeded the relevant threshold (1 or 2 mg TON.L-1).
The difference in threshold used in England and Wales represented different policy judgements made by Defra and WG on the evidence of eutrophic effects based on exposure to nutrient concentrations.
The question of whether 1 or 2 mgN.L-1 is the appropriate criterion depends in part on the level of precaution one wishes to apply. Hence, within the European Nitrogen Assessment, Grizzetti et al., (2011) defined three levels of Eutrophication risk for European standing waters based on the mean concentration of TN based on the results of Vollenweider et al. (1976); OECD (1982) ; Cardoso et al. (2001). These were low (mean TN < 0.5 mg.L-1), medium (TN between 0.5-1.5 mg.L-1) and high (TN > 1.5 mg.L-1) (see Table 17.2 in Grizzetti et al., 2011).
The scientific literature (Appendix B) for temperate lakes indicates that impacts that may involve eutrophic disturbance can be detected once N concentrations exceed c. 1 mg N.L-1, and are more likely above 2 mgN.L-1, but not necessarily in all lakes, and where concentration is defined variously in terms of winter nitrate-N, summer mean total nitrogen (TN), mean TN, annual median TN or simply TN. James et al (2005) state that reasonably diverse plant communities were found only at winter nitrate
concentrations of ―below about 1-2 mg N03-N.L-1”, reflecting the scientific uncertainty in the interpretation of the evidence.
Based on the current scientific evidence (see Appendix B) the Environment Agency recommended that the 1-2 mg.L-1 N criterion remained appropriate for standing freshwaters for the purposes of the 2013 review. It proposed the continued of use of the 75%ile to estimate the mean winter TON, together with the use of an annual mean TN criterion also based on 1-2 mg.N-1.
Taking into account the above and pending the development of a more sophisticated lake type or site-specific approach, the MRG recommended that where concentrations in standing waters exceed
2 mg.L-1 (at face value, >= 50% confidence) there should be a presumption to designate subject to evidence of eutrophic disturbance.
1 mg.L-1 but do not exceed 2mg.L-1 that interpretation of the data should be at the discretion of a national expert panel. The panel would consider the evidence for the different forms of nitrogen, together with that of eutrophic disturbance, the physical characteristics of the lake, the conservation and other amenity value of the site and the concentration of nutrient phosphorus. They would also consider the seasonal pattern of nutrient nitrogen concentrations and whether this might indicate seasonal nitrate limitation of primary production.
Not all lakes reviewed as potential candidates for designation have measurements of both TON and TN. Some have either TN or TON, and some lack any measurements of nutrient-N concentration. Following an Environment Agency recommendation, the Defra MRG agreed that the criteria of 1-2 mg.L-1 could be evaluated by reference to either 75%ile TON and/or annual mean TN values. Where sites had one but not both metrics they would be considered further in terms of overall weight of evidence.
2.4 Evidence of nutrient nitrogen limitation
In non-turbid estuarine and coastal waters it is generally accepted that primary production is limited by available nutrient N (see Smith et al., 2006 for a review). In contrast, production in standing freshwaters is generally regarded as P-limited. However, more recently it is recognised that periodic periods of N and P co-limitation, and N limitation, are not rare and may occur in many European standing water bodies (Moss et al., 1996; Maberly et al., 2002; James et al., 2003; Durand et al., 2011). In cases of N and P enrichment, silica may be also limit diatom growth, possibly giving way to undesirable blooms of cyanobacteria (Schelske and Stoermer, 1971).
North American eutrophic, P- enriched lakes, phytoplankton communities show signs of extreme N limitation (Schindler, 1974, 1977) based on bioassays such as N debt (Healey and Hendzel, 1980; Henzel et al., 1994) or nutrient N addition (Schindler, 1971). Schindler et al. (2008) showed, as a result of a 20 years experimental enrichment with nutrient P and N, a small Canadian lake remained N-limited, with peak concentrations of TIN considerably less than 1 mg.L-1. Schindler et al. (2008) concluded that controlling nutrient P would be most effective at controlling lake eutrophication However, their findings (Healey and Hendzel, 1980; Henzel et al., 1994; Schindler, 2008) also provide direct evidence of N limitation of lake phytoplankton growth under conditions of P enrichment.
In many European lakes there is evidence of enrichment of lakes with both nutrient N and nutrient P. There is a body of evidence that suggests a role for nitrate in eutrophic disturbance at concentrations between 1-2 mg-N.L-1 (see Section 2.3 and Appendix B). In many lakes, nutrient N concentrations show marked seasonal variation. Hence, in order to help understand the role of N in the eutrophication of candidate lakes, the
Environment Agency has sought to interpret the available monitoring data for each lake in order to establish whether they show evidence of seasonal N-limuitation of primary production and to interpret whether concentrations between 1-2 mg/L provide sufficient evidence for designation (see Box 2.1).
It is important to understand that evidence of nutrient-N limitation is not evidence that elevated concentrations of nutrient N are not contributing to eutrophic disturbance. Where a lake is enriched with nutrient-P, additional nutrient-N helps support increased production and may directly suppress the growth of certain species (eg James et al., 2003). Under circumstances of seasonal nutrient-N limitation within a P-enriched eutrophic lake, increased loadings of nutrient N are expected to increase total primary production and hence lead to increased risk of eutrophic disturbance. Likewise, reductions in N loading are expected to help reduce primary production and possibly increase the period of seasonal nutrient N limitation, leading to a reduced risk of eutrophic disturbance.
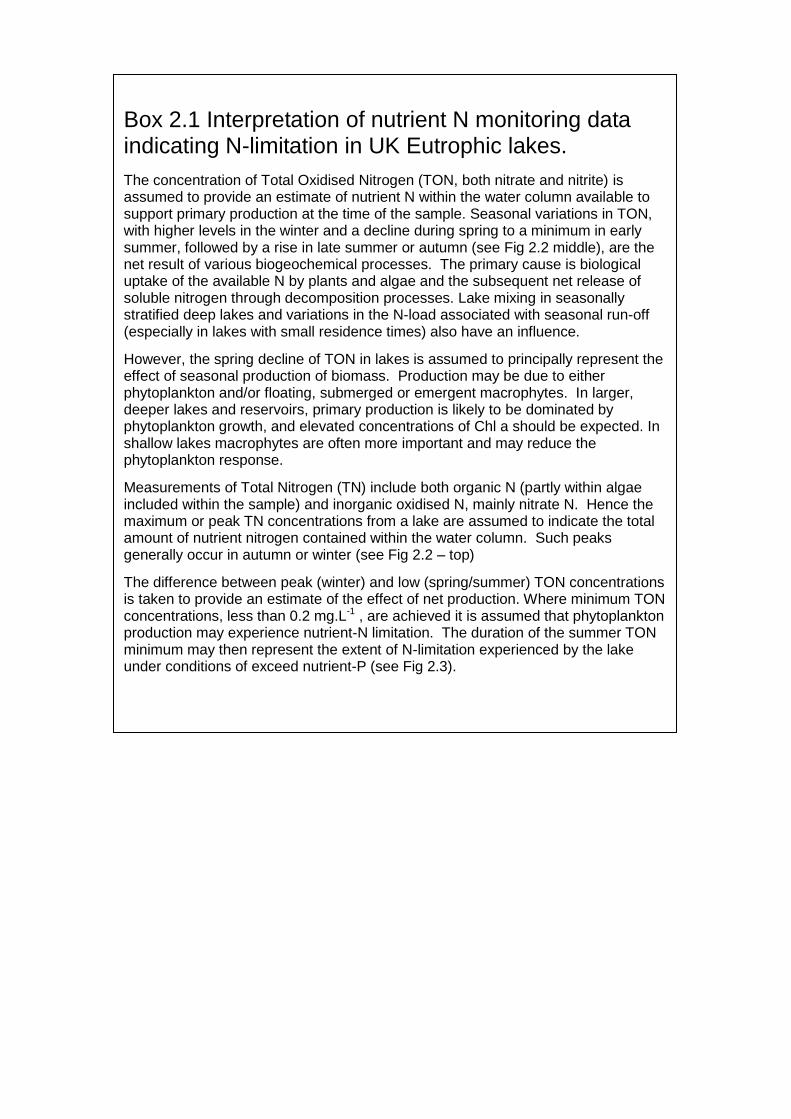
Box 2.1 Interpretation of nutrient N monitoring data indicating N-limitation in UK Eutrophic lakes.
The concentration of Total Oxidised Nitrogen (TON, both nitrate and nitrite) is assumed to provide an estimate of nutrient N within the water column available to support primary production at the time of the sample. Seasonal variations in TON, with higher levels in the winter and a decline during spring to a minimum in early summer, followed by a rise in late summer or autumn (see Fig 2.2 middle), are the net result of various biogeochemical processes. The primary cause is biological uptake of the available N by plants and algae and the subsequent net release of soluble nitrogen through decomposition processes. Lake mixing in seasonally stratified deep lakes and variations in the N-load associated with seasonal run-off (especially in lakes with small residence times) also have an influence.
However, the spring decline of TON in lakes is assumed to principally represent the effect of seasonal production of biomass. Production may be due to either phytoplankton and/or floating, submerged or emergent macrophytes. In larger, deeper lakes and reservoirs, primary production is likely to be dominated by phytoplankton growth, and elevated concentrations of Chl a should be expected. In shallow lakes macrophytes are often more important and may reduce the phytoplankton response.
Measurements of Total Nitrogen (TN) include both organic N (partly within algae included within the sample) and inorganic oxidised N, mainly nitrate N. Hence the maximum or peak TN concentrations from a lake are assumed to indicate the total amount of nutrient nitrogen contained within the water column. Such peaks generally occur in autumn or winter (see Fig 2.2 – top)
The difference between peak (winter) and low (spring/summer) TON concentrations is taken to provide an estimate of the effect of net production. Where minimum TON concentrations, less than 0.2 mg.L-1 , are achieved it is assumed that phytoplankton production may experience nutrient-N limitation. The duration of the summer TON minimum may then represent the extent of N-limitation experienced by the lake under conditions of exceed nutrient-P (see Fig 2.3).
Figure 2.2 Time series monitoring data for Total Oxidised Nitrogen (TON, top), Total Nitrogen (TN, middle) and Chlorophyll a (Chl a, bottom) concentrations for a shallow eutrophic lake (Llyn Coron). The level of nutrient N in the lake is indicated by peak TN concentrations between 3.5-5.0 mg-N.L-1. TON time series provides evidence of seasonal uptake of nutrient-N due to primary production within the lake, reducing TON concentration from 3-3.5 mg.L-1 in winter to < 0.2 mg.L-1 in summer. Minimum TON concentrations of c. 0.1 mg.L-1 indicate summer nutrient N limitation for a short period in July. Chl a data indicate peak concentrations of 40-70 mg.L-1 during the summer.
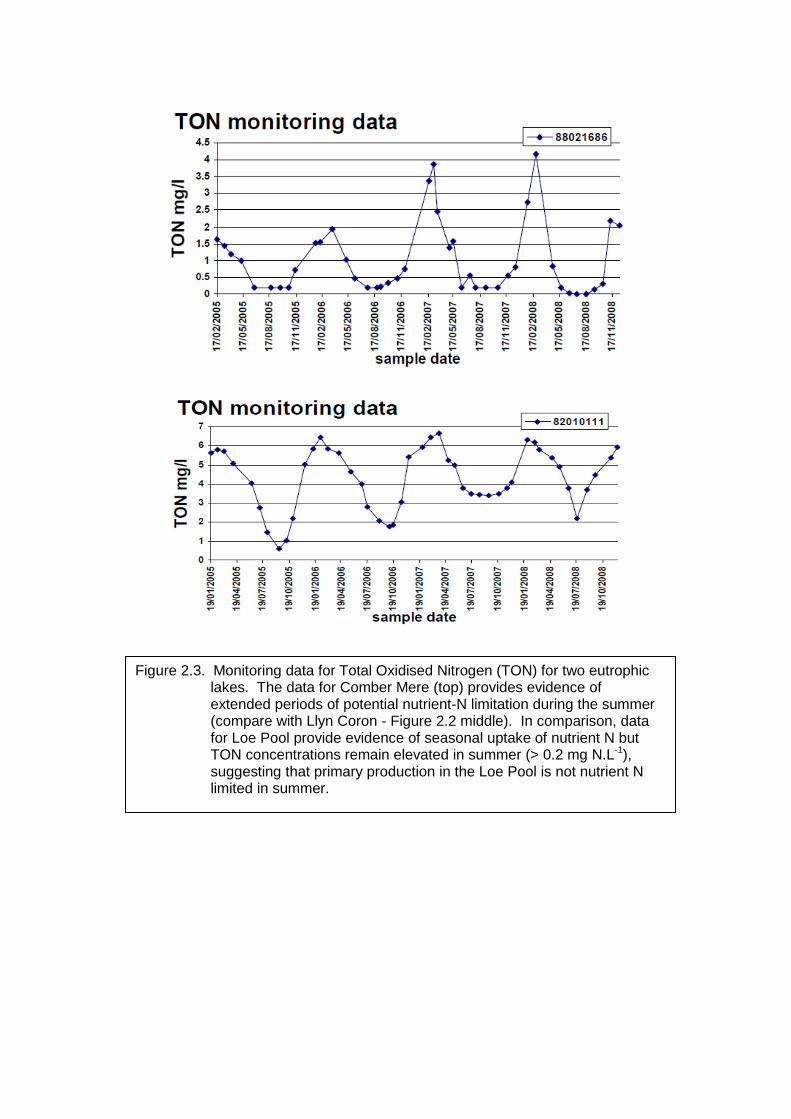
Figure 2.3. Monitoring data for Total Oxidised Nitrogen (TON) for two eutrophic lakes. The data for Comber Mere (top) provides evidence of extended periods of potential nutrient-N limitation during the summer (compare with Llyn Coron - Figure 2.2 middle). In comparison, data for Loe Pool provide evidence of seasonal uptake of nutrient N but TON concentrations remain elevated in summer (> 0.2 mg N.L-1), suggesting that primary production in the Loe Pool is not nutrient N limited in summer.
2.5 Principal additional metrics of eutrophication and associated criteria
The requirements of the Nitrates Directive in respect of eutrophication have not changed since the last review. However, formal EU guidance on assessing eutrophication under EU water policies was published under the WFD Common Implementation Strategy in May 2009 (EC, 2009). This promotes a harmonised approach to eutrophication assessment across the policies, particularly WFD, UWWT and Nitrates Directives. The proposed approach is rooted in the reference-based classification tools and risk-based monitoring requirements of the WFD.
The UK supported and participated actively in the EU activity and UK consultation on moving to a harmonised approach is anticipated in 2012. UK methods for UWWT and Nitrates Directive eutrophication assessment have been updated over time and in the last NVZ review began to move to developing WFD standards and criteria as far as possible. This is in recognition that the reference-based ecological approach under WFD is potentially well suited to the assessment of eutrophication as a process of ecological change.
The WFD approach to classification, standards and criteria were laid out in a consultation that preceded the WFD Ministerial Directions on these matters (Defra, 2009). WFD-UKTAG (2007a, 2008a, 2008b) describe the background to the development of WFD environmental standards and the classification methods/criteria. They set out the process for (a) assigning water bodies to a type (b) the standards and other criteria that apply to each type including Good/Moderate boundary values for biological quality elements and (c) the rules for WFD classification.
For this 2013 Eutrophic Waters review we have adopted many elements of a WFD based approach. But we are still in a transition period between our former methods and a fully harmonised approach. The data period used for this review is, generally, 2005-2008 and WFD monitoring and tools came in part way through this period. For some tools there is not yet sufficient data for high confidence in classification results and in some water bodies monitoring plans and locations for the different Directives have yet to be rationalised.
The Conservation Agency‘s have established their own systematic approach to monitoring the condition of SSSI‘s and SAC/SPA designated sites in England and Wales (see JNCC (2005) and http://jncc.defra.gov.uk/page-2217 ). Some results from the Common Standards Monitoring (CSM) programme undertaken by CCW for certain Welsh lakes have been used to help identify candidate lakes (see also Burgess et al., 2006, 2009).
The component WFD metrics are briefly described below. Further detail can be found in the relevant method documents, which are available on the WFD-UKTAG web site at: http://www.wfduk.org/UKCLASSPUB/bio_assessment/.
More detail is available in technical reports on the individual classification tools, for which the summaries provide references. Brief synopses of each method are also available at: http://www.wfduk.org/UKCLASSPUB/class_summaries/UKCLASSPUB/class_summaries/
In line with the EU Eutrophication Guidance, the relevant boundary values in considering eutrophication based on WFD methods are the good/moderate boundaries for each of the relevant nutrient, biological and chemical indicators.
Total phosphorus is a key indicator of freshwater eutrophication; it represents the available soluble phosphorus and the phosphorus contained in particulate matter suspended in the water column, including the phytoplankton. For WFD classification site-specific boundary values (standards) for total phosphorus have been established. These depend on the alkalinity and mean depth of the lake and the procedure for determining them is given in Defra (2009). The Nature Conservation Agencies use a similar approach with thresholds reflecting the different lake types protected under the Habitats Directive and Wildlife & Countryside Act (as amended) (JNCC, 2005). See also WFD-UKTAG (2007a, 2008b).
2.5.2 Dissolved Oxygen
In thermally stratified lakes the concentration of oxygen can become depleted in the deeper cold waters of the hypolimnion. This can have detrimental impacts on fish and invertebrates and is an indicator of eutrophication. An oxygen concentration depth profile is measured at the deepest point in selected lakes on at least one occasion in the late summer (July-September). In mixed lakes the mean oxygen concentration of the whole water column is determined and in stratified lakes the mean oxygen concentration of the hypolimnion is determined. These values are compared with standards given in Defra (2009) and shown in Table 2.1.
Table 2.1. Class boundaries for dissolved oxygen in lakes
Lake Type High/Good
mg/l
Good/Mod
mg/l
Mod/Poor
mg/l
Poor/Bad
mg/l
Salmonid lakes 9.0 7.0 4.0 1.0
Cyprinid lakes 8.0 6.0 4.0 1.0
2.5.3 Phytoplankton abundance and composition
Classification of lake phytoplankton is based on two metrics. Phytoplankton biomass is represented by chlorophyll and phytoplankton taxonomic composition and abundance is represented by the percentage of nuisance cyanobacteria (blue-green algae) as measured by biovolume. Details are provided in WFD-UKTAG (2008d).
Chlorophyll is measured monthly and an annual average is used for classification. The percentage of nuisance cyanobacteria is determined from late summer samples (July – September).
Environmental quality ratios (EQRs) for both chlorophyll and % cyanobacteria are calculated as a ratio of the observed values to the values expected at reference condition. Boundary EQR values are given in Defra (2009) and are shown below in Tables 2.2 and 2.3. Reference conditions for chlorophyll are predicted on a site-specific basis using a relationship between total phosphorus and chlorophyll. Reference total phosphorus is predicted from the alkalinity and mean depth of the lake. For % cyanobacteria, reference conditions are based on lake type only and determined using data from lakes from across Europe which are considered as being in reference condition.
The nature conservation agencies also use chlorophyll as part of condition assessments where data are available. % cyanobacteria have not been routinely used as this is generally not sensitive enough to detect deterioration in high quality sites.
Table 2.2. Class boundaries for the metric chlorophyll a
Lake Type High/Good EQR
Good/Mod EQR
Mod/Poor EQR
Poor/Bad EQR
High alkalinity, shallow 0.55 0.32 0.16 0.05
High alkalinity, very shallow 0.63 0.30 0.15 0.05
Moderate alkalinity, deep 0.50 0.33 0.17 0.05
Moderate alkalinity, shallow 0.50 0.33 0.17 0.05
Moderate alkalinity, very shallow 0.63 0.34 0.17 0.06
Chlorophyll and % nuisance cyanobacteria classifications are combined using a one-out, all-out approach. Details of the method are given in Defra (2009).
2.5.4 Macrophytes and Phytobenthos
Classification of lake macrophytes and phytobenthos is carried out using a method to assess macrophytes and macro algal growth (LEAFPACS) and an assessment of littoral attached diatoms (DALES/DARLEQ). Further details are provided in WFD-UKTAG (2008c) and WFD-UKTAG (2009).
LEAFPACS uses metrics characteristic of the aquatic plant community to assess the ecological status of lakes – species composition, diversity and abundance (Table 2.4).
Table 2.4: LEAFPACS component metrics
Species composition and diversity indicators
Abundance indicators
Lake Macrophyte Nutrient Index (LMNI)
Number of functional groups, number of taxa
Relative cover of invasive alien species
% cover of macrophytes
Relative cover macroalgae.
The method is designed to distinguish the anthropogenic effects of nutrient enrichment from a natural nutrient gradient. The value observed for each indicator is compared with its reference value and expressed as an EQR. Reference values specific to each lake are determined from a set of environmental predictors. The predictors have been derived from a model based on a population of lakes considered to represent reference conditions. EQRs for each of the metrics are adjusted to a common scale and combined using weighted averaging to give an overall status class. Boundary values for EQRs are given in Defra (2009) and are shown in Table 2.5.
Some lakes are designated as SSSIs or SAC in order to protect particular plant species associated with particular lakes. LEAFPACS does not provide a specific indication of the condition of such species. Hence, where relevant, information from Conservation Agency‘s condition assessments based on plant community structure and composition are separately considered where designated aquatic interest features may include plant species who may be sensitive to the effects of eutrophication and whose unfavourable condition may indicate eutrophic disturbance.
Table 2.5: Class boundary values in relation to the LEAFPACS method
Lake Type High/Good EQR
Good/Mod EQR
Mod/Poor EQR
Poor/Bad EQR
All types 0.80 0.60 0.40 0.20
Benthic diatoms can grow on the streambed and macrophytes, where present. DALES is based on changes in the species composition and abundance of the benthic diatom flora (the bio-film) in response to nutrient enrichment. The dynamic nature of bio-films means their composition and abundance can change over relatively short time scales.
The method derives from the Trophic Diatom Index (TDI) currently used by the Environment Agency for the assessment of eutrophication in rivers. DALES estimates
reference TDI values by making a site-specific prediction. This is compared with the observed values to produce an EQR. The high/good status boundary is defined as the 25th percentile of the EQRs for all the sites in the network of sites identified as being at reference condition and used in the development of the method. The good/moderate boundary represents the point at which the relative proportions of diatoms present belonging to nutrient-sensitive taxa and those belonging to nutrient-tolerant taxa are approximately equal. DALES also provides an estimate of the uncertainty associated with each EQR estimate. Boundary values for EQRs are given in Defra (2009) and are shown in Table 2.6.
Table 2.6: Class boundaries for the DALES method
Lake Type High/Good EQR
Good/Mod EQR
Mod/Poor or worse EQR
High and moderate alkalinity 0.90 0.66 0.44
Low alkalinity 0.90 0.63 0.44
2.5.5 Chironomid Pupal Exuviae (CPET)
Chironomid pupal exuviae technique (CPET) is a method for assessing the impact of nutrient enrichment and acidification on lake invertebrates (Ruse 2010). Chironomids are a very diverse group of insects that include a wide range of feeding modes and thus represent a broad range of functional groups. They are sensitive to the secondary effects of eutrophication, such as reduced oxygen concentration and changes to physical habitat caused by impact on lake vegetation, which is an important physical habitat. These insects are thus used to assess the indirect effects of eutrophication.
Reference conditions were derived from a combination of pressure threshold limits and ratio of pressure-sensitive to tolerant species presence. Class boundaries are defined by relative frequencies of sensitive to tolerant species. Boundary values for EQRs are given in Defra (2009) and are shown in Table 2.7. Further details are provided in WFD-UKTAG (2008e).
Table 2.7: Class boundaries for the CPET method in relation to nutrient enrichment
Lake Type High/Good EQR
Good/Mod EQR
Mod/Poor EQR
Poor/Bad EQR
All types genus tool 0.78 0.65 0.50 0.35
2.6 Additional Indicators of Eutrophication Impact
2.6.1 Number of reports of cyanobacteria blooms
The Environment Agency investigates reports it receives of algal blooms. The number of confirmed reports of cyanobacteria blooms between 1990 and 2010 which were above the WHO warning threshold has been used to indicate the incidence cyanobacteria blooms. Note that this is a reactive monitoring approach and the absence of reported blooms cannot be used to infer evidence of no impact.
2.6.2 Palaeolimnological Data
In lakes sediment is gradually laid down in layers and the sedimentary diatom record provides a long-term record of changes in the lake (Bennion and Simpson 2010). Diatoms are sensitive to water quality and the degree of floristic change of diatom species between samples taken from the bottom of sediment cores (reference conditions) and the surface sediment can be used to assess the extent of change. This is quantified using a dissimilarity coefficient (squared chord distance) which can take values between 0 and 2.0, where a value of 0 represents perfectly similar and 2 perfectly dissimilar samples. Based on an analysis of 106 UK lakes Bennion and Simpson (2010) propose that squared chord distance of >0.48 as a boundary representing significant change. For the lakes subject to review that were included in the Bennion and Simpson study the squared chord distance is considered.
3 Overall structure and organisation of the evidence of lake eutrophication
3.1 Introduction
This chapter sets out in more detail the overall structure and organisation of the evidence on which the eutrophic assessment of standing waters is made. The principal lines of evidence have already been described in Chapter 2. This Chapter then describes the process by which local knowledge of individual lakes is used to quality assure nationally derived data and elicit additional information regarding the trophic status of lakes.
3.2 Overall structure of the evidence
The evidence used in the assessment of eutrophication of each lake is structured into four parts. These are
(i) information on the physical and chemical characteristics of the lake and hydrological catchment;
(ii) evidence regarding the ecosystem service benefits provided by the lake which might be impacted by eutrophication;
(iii) quantitative and qualitative evidence regarding the level of exposure of the lake and it‘s flora and fauna to nutrient nitrogen and phosphorus, and evidence of the relative importance of nitrate sources (category I from Section 1.3.2); and
(iv) evidence of chemical and biological responses of the lake and impacts on the flora and fauna that may indicate eutrophic disturbance (category II and III from Section 1.3.2).
The four lines of evidence are organised in such a way to meet the requirements of the Nitrates Directive (see Section 1.2). The evidence is collated from a variety of national and local sources. It includes chemical and biological monitoring data collected and analysed according to established and quality assured protocols (e.g. those metrics described in Chapter 2). It draws upon a variety of other national datasets, data assembled from the peer reviewed scientific literature, local investigations and reports, local knowledge and expert judgement.
3.2.1 Characteristics of the water body
The principal physical and chemical characteristics of the lake and its catchment are identified. It includes some or all of the following information:
Lake physical attributes include latitude and longitude; height; surface area; mean depth; whether the lake is known or believed to undergo seasonal, thermal stratification; whether classified as heavily modified under WFD and whether it is a man-made or artificial lake. This latter includes lakes derived from historical or more
recent gravel, clay or peat extraction. It may also include damned river valleys and other forms of storage reservoir and their associated characteristics.
Lake chemical attributes. Mean alkalinity (alkalinity and depth are used as part of the WFD typology and these are used to determine appropriate criteria – see Chapter 2).
Catchment physical attributes include lake catchment area. The hydrology of a lake is important to understanding the source of water and hence source of nutrient loading to lakes. Significant seasonal draw down, perhaps due to the use of the lake for water supply or flow regulation, can impact on lake ecology and marginal flora. Unfortunately, hydrological models are not readily available for every candidate lake. A ―natural‖ catchment boundary for the lake is determined using GIS methods, based on digital land-surface elevation model. Local EA operational staff provide additional information on lake hydrology, including engineered abstractions providing water to the lake. They also help identify whether the lake is primarily dependent on surface water run-off, groundwater or, in some cases, direct rainfall.
3.2.2 Uses
This information describes the main uses of the standing water and includes those that may be impacted as a consequence of eutrophication. Uses include
Water supply. Lakes are identified if used for public water supply, whether they are designated as a drinking water protected area (under WFD), and whether the lake is within an area designated as a Waster Water Treatment Directive. Storage reservoirs and reservoirs used for other purposes (e.g. hydroelectric power, flow regulation) are also identified.
Conservation. It is particularly important to protect standing waters with significant conservation value. Information is collated on statutory and non-statutory designations (European, National and local) and the conservation features (communities, populations and species) for which the site is protected, with an emphasis on aquatic interest features that are believed to be directly sensitive to eutrophic disturbance.
Other amenity. Information is collated on a range of amenity uses that might be affected by eutrophication and access to the lake by the public. Amenity uses include recreational angling, contact water sports, tourist visits (bird-watching, walking, etc).
3.2.3 Potential causes of eutrophication
This information describes the level of exposure of the lake to elevated levels of nitrate as a potential causative agent of eutrophication.
Water chemistry. For the majority of lakes this comprises the monthly water quality monitoring information and associated statistics on the concentration of total phosphorus, TON and TN for the period 2005 until December 2008.
Nitrate sources. Annual total nitrate loadings within the natural catchment of the lake are determined from the NEAP-N model. The model provides estimates of N loading from both urban/human population and agricultural sources, based on data on the land-uses within the catchment of each lake. The data used is based on the Defra 2000 farm census, as updated based on the 2009 farm survey. From this we determine whether a lake has a particularly high or low loading hazard from agriculture per unit of rainfall to the area of its catchment. Lakes are then ranked in terms of the relative load per unit are of catchment posed by agricultural or non-agricultural nitrate sources. Further details of the NEAP-N model and land-use data are given in EA (2012).
3.2.4 Responses and Impacts
This information provides evidence of the direct and indirect chemical and biological responses of the lake, responses that might be expected to result from eutrophication. It is recognised that such responses may not always represent symptoms of eutrophication as changes in the component metrics can sometimes result from other causes. For example, the macrophyte metrics are sensitive to changes in lake level.
Dissolved oxygen. See section 2.5.2
Biological metrics. See sections 2.5.3-2.5.5 and 2.6
Aquatic interest features. Information on any aquatic interest features and conservation objectives is collated for each lake. Local EA operational staff have the opportunity to provide additional evidence regarding the condition of the aquatic interest features and whether they are affected by eutrophication or other causes. In doing so they may consult other relevant parties that may include the conservation agencies (Countryside Council for Wales, Natural England, Broads Authority), Water Companies and other landowners.
3.3 Local review and the elicitation of additional evidence
Available evidence was analysed and collated by a National project team on each of the candidate eutrophic standing waters (see Chapter 4 for details of how these candidate sites were identified). This information was collated in a database and made available in the form of draft proforma reports for each candidate lake. Following the second National Panel meeting (see Section 4.5) these reports were provided to local expert staff to review and, if necessary, provide corrections and amendments. These draft eutrophic water reports included a summary of the interim view of the National expert group on the strength of evidence supporting the case for designating the lake as eutrophic water under the Nitrates Directive. An example draft report is provided in Appendix C.
At the same time, a questionnaire was designed to elicit from local expert staff additional information on the characteristics of each lake, on its ecosystem service benefits, causes of eutrophication and evidence of responses and impacts (see Section 4.6). In addition, they were asked to make a recommendation regarding the potential designation, or continued designation, of each lake as a nitrate eutrophic water, based on the evidence provided. The questionnaire was provided as an Excel workbook.
4 Assessment of eutrophic risk to standing fresh waters
4.1 Introduction
This chapter explains the identification of standing and other waters with relatively long residence times that may be at risk of eutrophic disturbance (i.e. potentially eutrophic standing waters). These are referred to as candidate lakes. Additional data and other information are collated and analysed for these candidate lakes. Through an iterative risk assessment process involving internal (EA) and external national experts in environmental risk assessment and lake ecology, the candidate lakes are divided into four main groups based on the evidence of eutrophic disturbance due to elevated nutrient nitrogen.
Firstly a group of lakes where there is sufficient evidence that the concentration of nutrient nitrogen is elevated to levels where eutrophic disturbance can be expected and/or that show evidence of eutrophic disturbance or might be expected do so in the future. Secondly a group where the evidence suggests the lakes do not show evidence of eutrophic disturbance. Inevitably there are cases (group 3) where the evidence is ambiguous and where precautionary designations may be appropriate, or (group 4) where the collection of more data may be required in order to provide confidence that a lake is not suffering eutrophic disturbance.
4.2 Role and composition of National Expert Panels
Candidate lakes may include a variety of rather different freshwater systems. These include large, deep and long lived upland lakes, small, shallow lowland lakes, dammed river valley lakes/reservoirs, artificially constructed storage and public water supply reservoirs, man made lakes arising from recent or historical industrial activities (e.g gravel, clay and peat extraction, scenic lakes). They vary in terms of their hydrology. Some depend on surface water run-off; others principally depend on direct rainfall. Some may be an expression of a substantial body of groundwater, or depend on groundwater flows. Some are connected to a river but experience limited exchange. For others freshwater exchange between the lake and river can be driven by tidal forcing upstream of an estuary.
The overall role of the National panels is to guide and review the risk assessment approach. In particular to consider the principal metrics of eutrophication described in Chapter 2 and interpret the significance of this information in the light of the additional contextual information described in Chapter 3. The National Panel ensures appropriate information is assembled and analyses undertaken. They are responsible for consistent interpretation of information for each site, based on their knowledge and understanding lake systems in general and the variety of lakes in England and Wales. The national suite of criteria for eutrophication provide the basis for a consistent approach although there is no formal weighting attached to different metrics of eutrophication. The National Panel, by considering all the information on an individual, case-by-case basis, against the criteria, can form a view on the weight to be attached to different metrics and lines of evidence by comparing the available evidence between the candidate lakes. They can ensure a consistent approach taking account of the variety of lake systems and characteristics of the data.
The National Panel consisted primarily of Environment Agency staff (England and Wales) with experience in environmental risk assessment applied to surface waters in general and lakes in particular. The National Panel represented expertise in hydrology, limnology and ecology, lake monitoring and the associated the WFD classification metrics, and statistics. The Panel took advice from external experts as required, and this included representatives from the Conservation Agencies as well as three external academic experts with considerable experience of lake ecology and management. These leading scientific academics provided advice on (a) the current state of the scientific evidence linking elevated levels of nutrient nitrogen to evidence of eutrophic disturbance and (b) the interpretation of that evidence in the context of the information available on the set of candidate sites for designation as polluted waters under the directive.
The National Panel welcomed external observers representing the farming industry at two of its three meetings.
4.3 Identification of candidate lakes (step 1)
Candidate lakes were identified by three different routes.
Firstly, all lakes previously designated as eutrophic waters were included.
Secondly, the conservation agencies for England (Natural England) and Wales (Countryside Council for Wales) were asked to nominate any lakes they considered might qualify for designation under the Nitrates Directive. This could include coherent, localised groups of lakes with similar physical, chemical attributes and with similar ecologies but where direct monitoring evidence might be confined to only one or more lake(s) within the group (see Appendix D for details).
However, the majority of lakes were identified from a set of 247 lake water bodies across England and Wales that had been identified by the Environment Agency, under the Water Framework Directive, as at risk and hence qualified for enhanced monitoring. These lakes are predominantly large water bodies >50ha in area, or of conservation importance.
4.3.1 Screening of lakes with WFD monitoring
Monitoring data 2005-2008 was analysed for the 247 lakes with Water framework Directive monitoring. The criteria for inclusion were based on meeting either of two criteria. Firstly, based on nitrate concentration (see Sections 2.2-2.3) and secondly based on a Confidence of Eutrophication Assessment (CoEA) undertaken for WFD purposes. The assessment (see Section 4.3.2 for details) is based on the metrics of eutrophication described in Section 2.5 and results in a classification that can take three values: low, medium and high.
Hence, to be included as a candidate lake, either
Annual mean TN > 1 mg.L-1 (as nitrogen) or 75%ile TON > 1 mg.L-1 (as nitrogen)
or
Confidence of Eutrophication > Low
4.3.2 WFD confidence of eutrophication
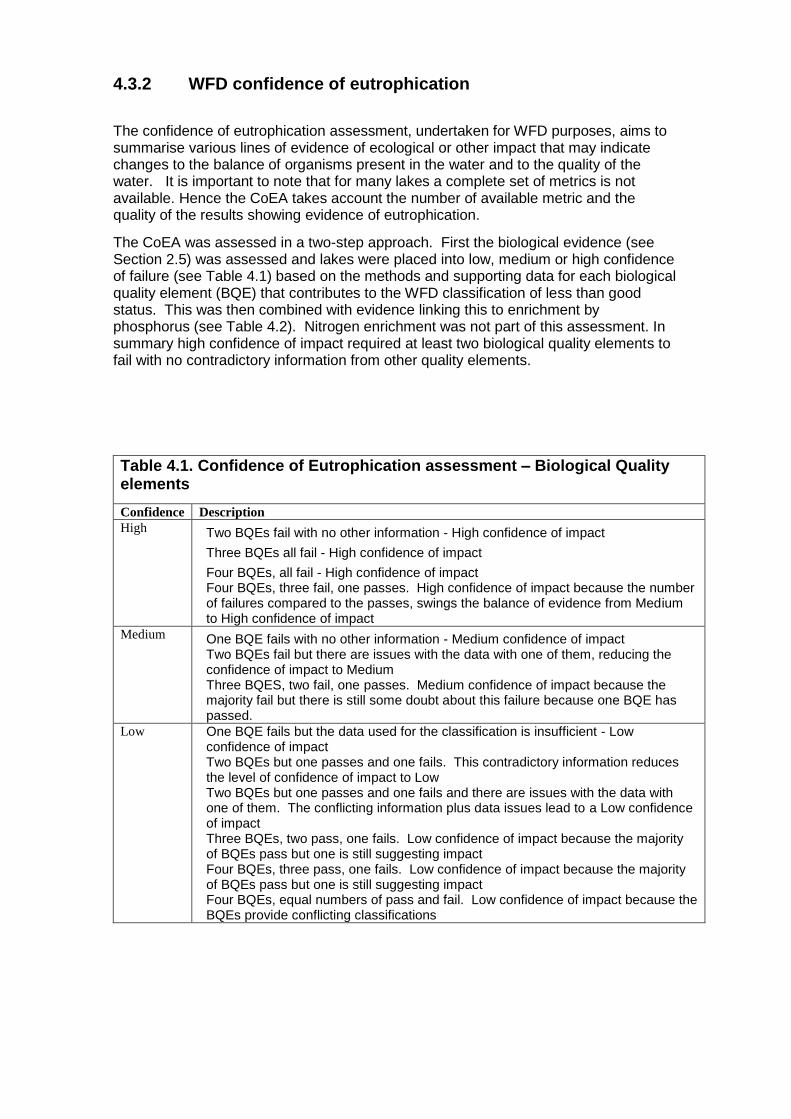
The confidence of eutrophication assessment, undertaken for WFD purposes, aims to summarise various lines of evidence of ecological or other impact that may indicate changes to the balance of organisms present in the water and to the quality of the water. It is important to note that for many lakes a complete set of metrics is not available. Hence the CoEA takes account the number of available metric and the quality of the results showing evidence of eutrophication.
The CoEA was assessed in a two-step approach. First the biological evidence (see Section 2.5) was assessed and lakes were placed into low, medium or high confidence of failure (see Table 4.1) based on the methods and supporting data for each biological quality element (BQE) that contributes to the WFD classification of less than good status. This was then combined with evidence linking this to enrichment by phosphorus (see Table 4.2). Nitrogen enrichment was not part of this assessment. In summary high confidence of impact required at least two biological quality elements to fail with no contradictory information from other quality elements.
Table 4.1. Confidence of Eutrophication assessment – Biological Quality elements
Confidence Description
High Two BQEs fail with no other information - High confidence of impact
Three BQEs all fail - High confidence of impact
Four BQEs, all fail - High confidence of impact Four BQEs, three fail, one passes. High confidence of impact because the number of failures compared to the passes, swings the balance of evidence from Medium to High confidence of impact
Medium One BQE fails with no other information - Medium confidence of impact Two BQEs fail but there are issues with the data with one of them, reducing the confidence of impact to Medium Three BQES, two fail, one passes. Medium confidence of impact because the majority fail but there is still some doubt about this failure because one BQE has passed.
Low One BQE fails but the data used for the classification is insufficient - Low confidence of impact Two BQEs but one passes and one fails. This contradictory information reduces the level of confidence of impact to Low Two BQEs but one passes and one fails and there are issues with the data with one of them. The conflicting information plus data issues lead to a Low confidence of impact Three BQEs, two pass, one fails. Low confidence of impact because the majority of BQEs pass but one is still suggesting impact Four BQEs, three pass, one fails. Low confidence of impact because the majority of BQEs pass but one is still suggesting impact Four BQEs, equal numbers of pass and fail. Low confidence of impact because the BQEs provide conflicting classifications
Table 4.2. Confidence of Eutrophication assessment – addition of evidence on phosphorus
Confidence Description
High TP Bad, Medium confidence BQE failure - High confidence overall of impact
TP Bad, High confidence BQE failure - High confidence overall of impact
TP Poor, High confidence BQE failure - High confidence overall of impact
TP Moderate, High confidence BQE failure - High confidence overall of impact
Medium No TP data, Medium confidence BQE failure - Medium confidence overall of impact No TP data, High confidence BQE failure - Medium confidence overall of impact TP Bad, no BQE data - Medium confidence, according to Table 13 TAG guidance
TP Bad, Low confidence BQE failure - Medium confidence overall of impact
TP Bad, Low confidence BQE Pass - Medium confidence overall of impact TP Poor, no BQE data - Medium confidence, according to Table 13 TAG guidance TP Poor, Medium confidence BQE failure - Medium confidence overall of impact
TP Poor, Low confidence of BQE Pass - Medium confidence overall of impact TP Moderate, no BQE data - Medium confidence, according to Table 13 TAG guidance TP Moderate, Medium confidence BQE failure - Medium confidence overall of impact TP Moderate, Low confidence BQE Pass - Medium confidence overall of impact TP Good, Medium confidence BQE failure - Medium confidence overall of impact
TP Good, High confidence BQE failure - Medium confidence overall of impact TP High, Medium confidence BQE failure - Medium confidence overall of impact
TP High, High confidence BQE failure - Medium confidence overall of impact
Low No TP data, Low confidence BQE failure - low confidence overall of impact
TP Bad, Medium confidence BQE Pass - Low confidence overall of impact
TP Bad, Medium confidence BQE Pass - Low confidence overall of impact
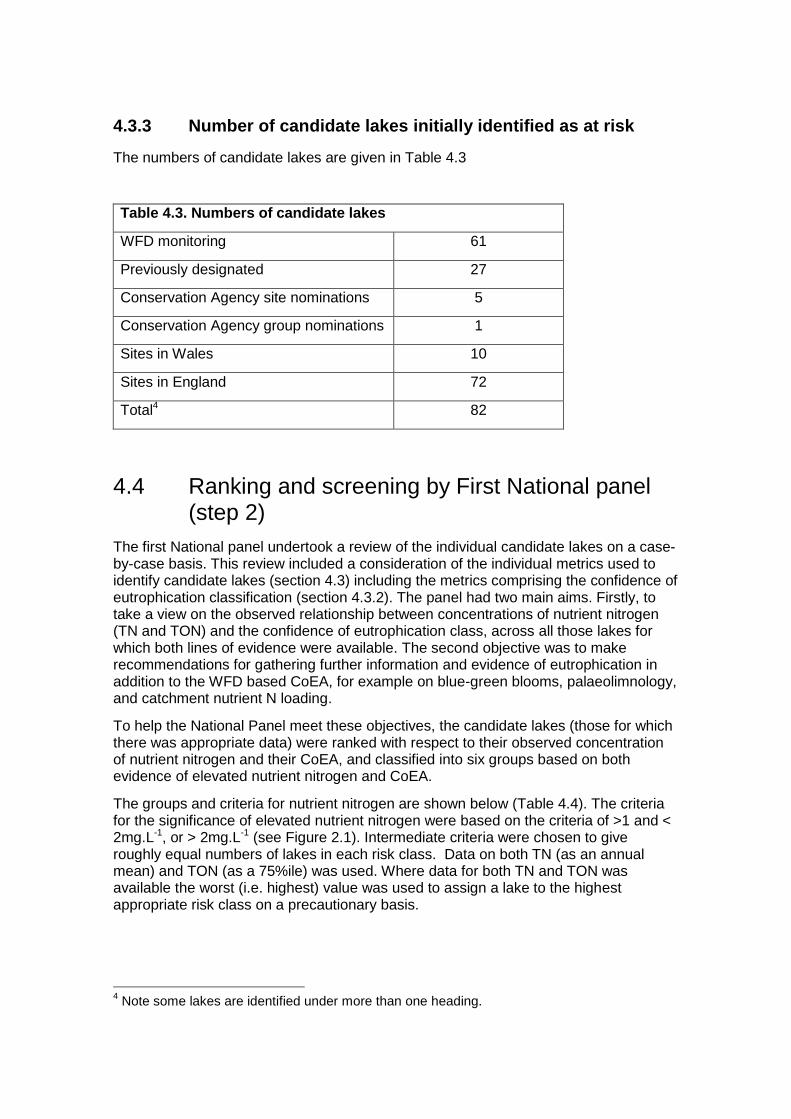
4.3.3 Number of candidate lakes initially identified as at risk
The numbers of candidate lakes are given in Table 4.3
Table 4.3. Numbers of candidate lakes
WFD monitoring 61
Previously designated 27
Conservation Agency site nominations 5
Conservation Agency group nominations 1
Sites in Wales 10
Sites in England 72
Total4 82
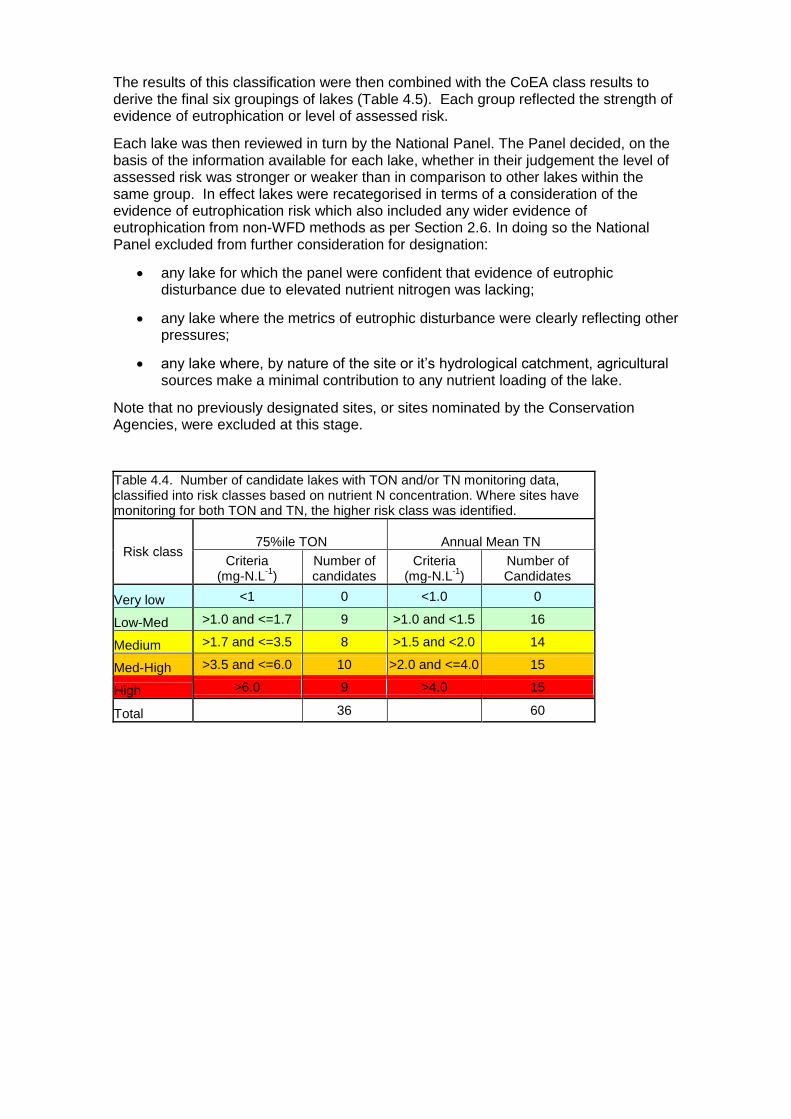
4.4 Ranking and screening by First National panel (step 2)
The first National panel undertook a review of the individual candidate lakes on a case-by-case basis. This review included a consideration of the individual metrics used to identify candidate lakes (section 4.3) including the metrics comprising the confidence of eutrophication classification (section 4.3.2). The panel had two main aims. Firstly, to take a view on the observed relationship between concentrations of nutrient nitrogen (TN and TON) and the confidence of eutrophication class, across all those lakes for which both lines of evidence were available. The second objective was to make recommendations for gathering further information and evidence of eutrophication in addition to the WFD based CoEA, for example on blue-green blooms, palaeolimnology, and catchment nutrient N loading.
To help the National Panel meet these objectives, the candidate lakes (those for which there was appropriate data) were ranked with respect to their observed concentration of nutrient nitrogen and their CoEA, and classified into six groups based on both evidence of elevated nutrient nitrogen and CoEA.
The groups and criteria for nutrient nitrogen are shown below (Table 4.4). The criteria for the significance of elevated nutrient nitrogen were based on the criteria of >1 and < 2mg.L-1, or > 2mg.L-1 (see Figure 2.1). Intermediate criteria were chosen to give roughly equal numbers of lakes in each risk class. Data on both TN (as an annual mean) and TON (as a 75%ile) was used. Where data for both TN and TON was available the worst (i.e. highest) value was used to assign a lake to the highest appropriate risk class on a precautionary basis.
4 Note some lakes are identified under more than one heading.
The results of this classification were then combined with the CoEA class results to derive the final six groupings of lakes (Table 4.5). Each group reflected the strength of evidence of eutrophication or level of assessed risk.
Each lake was then reviewed in turn by the National Panel. The Panel decided, on the basis of the information available for each lake, whether in their judgement the level of assessed risk was stronger or weaker than in comparison to other lakes within the same group. In effect lakes were recategorised in terms of a consideration of the evidence of eutrophication risk which also included any wider evidence of eutrophication from non-WFD methods as per Section 2.6. In doing so the National Panel excluded from further consideration for designation:
any lake for which the panel were confident that evidence of eutrophic disturbance due to elevated nutrient nitrogen was lacking;
any lake where the metrics of eutrophic disturbance were clearly reflecting other pressures;
any lake where, by nature of the site or it‘s hydrological catchment, agricultural sources make a minimal contribution to any nutrient loading of the lake.
Note that no previously designated sites, or sites nominated by the Conservation Agencies, were excluded at this stage.
Table 4.4. Number of candidate lakes with TON and/or TN monitoring data, classified into risk classes based on nutrient N concentration. Where sites have monitoring for both TON and TN, the higher risk class was identified.
Risk class 75%ile TON Annual Mean TN
Criteria (mg-N.L
-1)
Number of candidates
Criteria (mg-N.L
-1)
Number of Candidates
Very low <1 0 <1.0 0
Low-Med >1.0 and <=1.7 9 >1.0 and <1.5 16
Medium >1.7 and <=3.5 8 >1.5 and <2.0 14
Med-High >3.5 and <=6.0 10 >2.0 and <=4.0 15
High >6.0 9 >4.0 15
Total 36 60
Table 4.5. Classification of candidate lakes based on Confidence of eutrophication (High, Medium) and elevated TN or TON risk class from Table 4.4.
Strength of evidence group Previous test
Confidence of Eutrophication
class Worst of TON or TN
Risk class
Very High High AND > Medium
High V. High group =FALSE High AND > Low-medium
Medium-High High AND < Medium
Medium-Low Medium AND > Medium
Low Low group = FALSE Medium AND > Low-Medium
Marginal Medium AND < Medium
4.5 Ranking and screening by second National panel (step 3)
The second National Panel had similar aims to the first National panel. It considered the same information as available from the First National Panel but had access to additional information. This included
time-series information on concentrations of nutrient nitrogen and phosphorus for some lakes;
information on nutrient concentrations classified by statistical confidence as greater than > 1 mg-N.L-1 or > 2 mg-N.L-1;
information on catchment boundaries, land areas and associated nutrient loadings to each lake;
a report from the CCW proposing the designation of a group of lakes on Anglesey (CCW, 2011)
Figure 4.1 Location of candidate lakes classified by strength of evidence, as considered by the second National panel.
The classification of lakes was simplified into four groups, based on the strength of evidence, taking account of the judgements regarding the strength of evidence made by the first National Panel (see Figure 4.1)
On a similar basis to the first National Panel (see Section 4.4), the second National panel excluded a small number of candidate lakes from further consideration. In addition the panel rejected a case presented by CCW for the designation of the group
of Anglesey lakes. This decision was based on the evidence not meeting the minimum requirements established by the Defra/WAG MRG (see Appendix D). In particular the National panel concluded that, although within the same geographical area, there was evidence that the lakes were too heterogeneous to form a single natural grouping, such that monitoring evidence from one lake could be considered representative of other lakes in the group. However, the National Panel recommended that certain Anglesey lakes should be retained for further consideration on an individual basis. These had been identified as candidates through other routes.
The panel also considered the case for designation of two candidate transitional tidal waters (See Chapter 5). One of these was subsequently withdrawn as a candidate by the relevant Environment Agency Region and the other was considered by the panel to require additional evidence gathering for consideration at the next NVZ review.
Supported by the external experts, the panel recommended the Environment Agency undertake
a review of the evidence for each lake by local Agency staff with knowledge of each site (see Section 3.3) and
elicit additional information from all lakes, in particular, on man-made supply reservoirs used for public water supply; this is described in Section 4.6.
The National panel also recommended that the Environment Agency seek guidance from Defra regarding the designation such waters which, in some cases, have artificial (i.e. engineered) sources of water (see Section 4.6).
4.6 Artificial lakes and reservoirs
Following the second National Expert panel Defra provided guidance regarding the exclusion of artificial water bodies, in particular purpose built storage reservoirs and those where a majority of the water comes from engineered abstractions and transfers. Defra were clear that the Environment Agency should continue to include for designation as eutrophic waters naturalised reservoirs, particularly where they have significant value to society for their ecological function, for direct conservation value, or for recreation. The natural catchments of these waters should be designated if the waters themselves were eutrophic, but the source of any pumped water should not because the pumping or other engineering breaks the ecological link between catchment and water body.
4.7 Local review and collation of additional evidence (step 4)
The local review had two principal objectives. Firstly to provide local staff with the opportunity to review the nationally held data and provide amendments and corrections. The available information was presented to local staff in the form of a proforma report for each candidate waterbody (see Appendix C). The structure and presentation of information within the lake proforma reports is described in Chapter 3.
One key area for local review concerned the accuracy of the topographically defined catchments that identify the potential land area draining to each lake.
The review was undertaken by means of a questionnaire with supporting guidance.
The questionnaire was also used to fulfil the second aim of the local review, to elicit additional, local knowledge about each site for consideration at the final National Panel
meeting. The questionnaire was designed taking into account the guidance provided by Defra (Section 4.6). In particular, the questionnaire sought
information on the characteristics and management of man-made lakes with engineered water transfers and artificial catchments;
additional evidence regarding the ecology of the lake, it‘s conservation value and condition, other amenity values, and in particular local knowledge of eutrophic disturbance;
a local recommendation regarding potential designation as a eutrophic water based on a local evaluation of the available evidence.
The task was delegated via Environment Agency Regional Environmental Protection Managers to Agency staff with knowledge of the individual candidates sites within the Region. In particular, review was undertaken by Operational staff with knowledge of water resource management, ecology and conservation, water quality planning, local farming practice and catchment management, as appropriate. Environment Agency staff could liaise with staff from the Conservation Agencies, Broads Authority, Water Companies and other landowners, as appropriate.
A member of the National Expert Panel reviewed each of the questionnaires following the local review. Other outstanding issues resolved where possible with the local Agency contact. A small number of corrections were made to the National database. A number of inaccurate catchment maps were identified, particularly in relation to engineered transfers and man made lakes arising from gravel extraction and, in particular, in the Norfolk Broads.
All additional information from the questionnaires was added to the National database and revised proforma reports produced for consideration by the final National Panel. th
4.8 Final National Panel and recommendations (step 5)
The remaining xx candidates lakes were presented to the final National Panel in 5 groups
Principally natural lakes, or impounded valley reservoirs with natural hydrological catchments and with relatively strong evidence of eutrophic disturbance and elevated nutrient nitrogen;
Principally natural lakes, or impounded valley reservoirs, with less strong evidence of either eutrophic disturbance or evidence of elevated nutrient nitrogen;
Candidate lakes, including artificial lakes and reservoirs, with weak evidence of eutrophic disturbance and elevated nutrient nitrogen;
Artificial reservoirs that may show moderate or strong evidence of eutrophic disturbance and/or elevated nutrient N but may be excluded because they are principally engineered structures receiving pumped water or with otherwise engineered catchments.
The small number of candidate lakes in Wales were considered separately, although these sites were classified using the same four criteria above.
In considering each candidate lake the National Panel had available the information within the proforma report for each site. This included information and any recommendations resulting from the local review. They also had a draft summary of case for each lake prepared by a member of the National Panel.
The recommendations of the National Panel with respect to each candidate lake was recorded, together with any observations on the evidence presented.
10 reservoir sites were referred to Defra for their further consideration and advice.
Finally the draft statements of case for each site were revised based on the recommendations of the National Panel. Statement of case were prepared for
those 38 sites recommended for designation,
those sites not recommended for designation, and
3 sites where the removal of past designation was recommended.
5 Rivers, transitional waters (estuaries) and coastal waters
5.1 Focusing in on water bodies of concern
5.1.1 Rivers
For rivers, since 1993 the methodology has allowed for sites to put forward (by the Environment Agency) for potential designation on a case by case basis against the eutrophication criteria used for the Urban Waste Water Treatment Directive and an assessment of the involvement of nitrogen from agricultural sources. However, in contrast to the evolving science and our position for lakes (Section 2), it has not yet proved possible to develop a more detailed science-based approach. For example, criteria such as nitrogen thresholds developed for lakes, that facilitate the identification of situations in which nitrogen may play a causal role and where designation would thus be appropriate and beneficial.
WFD-UKTAG is considering the potential to develop freshwater nitrogen standards in support of good ecological status as part of the periodic reviews of WFD nutrient standards. It is suggested that any national development of nitrogen thresholds for particular river types for NVZ purposes should be dependent on the outcome of that evidence based review.
No candidate rivers were put forward to the national panel for potential designation in the context of eutrophication in the 2013 review.
5.1.2 Transitional and coastal waters
Estuarine waters are those waters where freshwater and saline waters mix and, as a result can present a greater challenge than either in terms of deriving a robust assessment of trophic state. Estuarine waters are of a more individual nature than coastal waters, being heavily influenced by local factors. However, assessments of eutrophication risk in both estuarine and coastal waters are undertaken for a variety of purposes. Sites that warrant further investigation can therefore be identified through monitoring and assessment regimes for OSPAR, Habitats Directive, Water Framework Directive risk assessments, as well as specific screening studies for the Urban Waste Water Treatment and Nitrates Directives.
The criteria used in assessing eutrophication in saline waters are set out in Appendix E. In addition to the 13 saline sites already designated as NVZ in England and Wales on grounds of eutrophication, two further candidate saline waters were put forward to the National Panel in this review. One was subsequently withdrawn by the relevant Region on grounds that further data gathering was required. For the second, the panel recommended that further monitoring was needed to determine whether there was a risk of ―undesirable disturbance‖, therefore this site was not put forward to Defra for potential designation in the current review.
The 13 previously designated sites comprise 8 designated in 2008 and 5 designated before that time. Improvements in the symptoms of eutrophication are expected to take many years to take effect following the introduction of nutrient control measures. For the 8 recent designations it is too soon to review whether the degree and extent of eutrophication has changed. The evidence on which they were designated in 2008 is considered to remain valid. The 5 longer standing designations were re-assessed as part of the 2013 review. The risks and impacts of eutrophication were considered by the Environment Agency national panel to remain sufficient to not remove the designations. Therefore the Agency recommended retaining the 13 existing designations. Continued and where necessary additional monitoring is planned to enable a further assessment at the next NVZ review. Any additional estuarine or coastal water sites found through WFD risk assessments and classifications to be at potential risk of eutrophication will also be subject to further monitoring and review.
6 References EA (2012). Method statement for Nitrate Vulnerable Zone Review – Surface Waters. Environment Agency Science report, number xxxxxxx.
Barker, Hatton, K., O'Connor, M., Connor, L., and Moss, B. (2008). Effects of nitrate load on submerged plant biomass and species richness: results of a mesocosm experiment. Fundamental and Applied Limnology, 173, pp. 89-100.
Bennion, H. and Simpson, G. (2011). The use of diatom records to establish reference conditions for UK lakes subject to eutrophication. J. Paleaolimnol., 45, 469-488.
Burgess A., Goldsmith B. and Hatton-Ellis T. (2006). Site Condition Assessments of Welsh SAC and SSSI Standing Water Features. CCW Contract Science Report 705. Bangor, CCW.
Burgess, A., Goldsmith, B., Hatton-Ellis, T., Hughes, M. and Shilland E. (2009). CCW Standing Waters SSSI Monitoring 2007-08. CCW Contract Science Report 855. Bangor, Countryside Council for Wales.
Cardoso, A.C., Duchemin, J., Magoarou, P. and Premazzi, G. (2001). Criteria for the identification of freshwaters subject to eutrophication: their use for the implementation of the Nitrates and Urban Waste Water treatment Directives. EUR Report 19810 EN, European Commission Joint Research Centre, Luxembourg.
CEH (2004). Deriving practical guidance on the importance of nitrogen in freshwater eutrophication. Report to the Scottish Executive by S. Maberly, L. Carvalho, J. Fisher, L. May, B. Reynolds, M. Theobald, M. Sutton and L. Defew. Centre for Ecology and Hydrology.
CCW (2011). Anglesey lakes: review of data pertaining to potential nitrate vulnerable zone designation. Unpublished report. pp. 104.
Defra (2008). Implementation of the Nitrates Directive (91/676/EEC): Description of the methodology applied in identifying waters and designating Nitrates Vulnerable Zones in England (2008). Defra, London. http://archive.Defra.gov.uk/environment/quality/water/wfd/classification.htm
Defra (2009). The River Basin District Typology, Standards and Groundwater threshold values (Water Framework Directive) (England and Wales) Directions, 2009. http://archive.Defra.gov.uk/environment/quality/water/wfd/documents/2010directions.pdf
Durand, P., Breuer, L., Johnes, P.J. et al. (2011). Nitrogen processes in aquatic ecosystems. Ch. 7 in European Nitrogen Assessment. Eds. M. A Sutton, C.M. Howard, J.W Erisman et al. Cambridge University Press, Cambridge.
European Communities (2009). WFD CIS Guidance Document No 23. Eutrophication assessment in the context of European Water Policies. Technical Report 2009-030. http://circa.europa.eu/Public/irc/env/wfd/library?l=/framework_directive/guidance_documents/guidance_document_1/_EN_1.0_&a=d
González Sagrario, M. A., Jeppesesn, E., Gomà, J., Søndergaard, M., Jensen, J.P., Lauridsen, T. and Landkildehus, F. (2005). Does high nitrogen loading prevent clear-water conditions in shallow lakes at moderately high phosphorus concentrations? Freshwater Biology, 50, pp. 27-41.
Gulati, R.D., and van Donk, E. (2002). Lakes in the Netherlands, their origin, eutrophication and restoration: state-of-the-art review. Hydrobiologia, 478, 73-106.
Grizzetti, B. et al. (2011). Nitrogen as a threat to European water quality. Ch. 17 in European Nitrogen Assessment. Eds. M. A Sutton, C.M. Howard, J.W Erisman et al. Cambridge University Press, Cambridge.
Healey, F.P. and Hendzel, L.L. (1980). Physiological indicators of nutrient deficiency in lake phytoplankton. Can. J. Fish. Aquat, Sci., 37, 442-453.
Hendzel, L.L., Hecky, R.E., and D.L.Findlay (1994). Recent changes in nitrogen fixation in Canadian Precambrian Shield lakes. Can. J. Fish. Aquat, Sci., 51, 2247-2253.
Holman, I.P., Davidson, T., Burgess, A., Kelly, .A, Eaton, J. and Hatton-Ellis, T.W. (2009). Understanding the effects of coming environmental change on Bosherston Lakes as a basis for a sustainable conservation management strategy. CCW Contract Science Report 858.Bangor, Countryside Council for Wales.
Hughes, M., Hornby, D.D., Bennion, H., Kernan, M., Hilton, J., Phillips, G. and Thomas, R. (2004) The development of a GIS-based inventory of standing waters in Great Britain together with a risk-based prioritisation protocol. Water, Air and Soil Pollution: Focus, 4, 73-84.
James, C., Fisher, J. and Moss, B. (2003). Nitrogen driven lakes: The Shropshire and Cheshire Meres? Archiv für Hydrobiologie , 158, 249 –266.
James, C., Fisher, J., Russell, V., Collings, S. and Moss, B. (2005). Nitrate availability and hydrophyte species richness in shallow lakes. Freshwater Biology, 50, pp. 1049-1063.
Jeppesen , E. , Sondergaard , M., Jensen , J. P. et al. ( 2005 ). Lake responses to reduced nutrient loading: an analysis of contemporary long-term data from 35 case studies. Freshwater Biology , 50, 1747 –1771.
Jeppesen, E., Sondergaard, M., Meerhoff, M., Lauridsen, T.L. and Jensen, J.P. (2007) Shallow lake restoration by nutrient loading reduction—some recent findings and challenges ahead. Hydrobiologia, 584, 239-252.
Joint Nature Conservation Committee (JNCC) (2005). Common Standards Monitoring Guidance for Standing Waters. Peterborough, Joint Nature Conservation Committee.
Lambert, S.J. and Davey, A J. (2010). Water quality as a threat to aquatic plants: discriminating between the effects of nitrate, phosphate, boron and heavy metals on charophytes. New Phytologist, 189, pp. 1051-1059.
Maberly, S.C., King, L., Dent, M.M., Jones, R.I. and Gibson, C.E. (2002). Nutrient limitation of phytoplankton and periphyton growth in upland lakes. Freshwater Biology, 47, 2136-2152.
Maberly, S., Carvalho, L., Fisher, J., May, L., Reynolds, B., Theobald, M., Sutton, M. and Defew, L. (2004). Deriving practical guidance on the importance of nitrogen in freshwater eutrophication. Report to the Scottish Executive. ENV/7/03/07, pp. 1-76. Scottish Executive.
Maddock, A. (Ed.) (2008). UK Biodiversity Action Plan; Priority Habitat Descriptions. BRIG (now Biodiversity Research Advisory Group). See http://jncc.defra.gov.uk/page-5706.
May, L., Dudley, B., Spears, B.M. and Hatton-Ellis, T.W. (2008). Nutrient Modelling and a Nutrient Budget for Llangorse Lake. Bangor, Countryside Council for Wales. Contract Science Report, 831. pp. 76.
May, L., Spears, B.M., Dudley, B.J., Hatton-Ellis, T.W. (2010). The importance of nitrogen limitation in the restoration of Llangorse Lake, Wales, UK. Journal of Environmental Monitoring, 12, 338-346.
Moss, B., Johnes, P.J. and Phillips, G. L. (1996). The monitoring and classification of standing waters in temperate regions – a discussion and proposal based on a worked scheme for British waters. Biological Reviews , 71 , 310 –339.
Natural England (2010). Reviewing phosphorus and nitrogen targets for the SSSI meres. Report to Natural England. Report Ref: LA/C03804/1. CEH Lancaster.
OECD (1982). Eutrophication of Water, Monitoring, Assessment and Control. Organisation for Economic Co-operation and Development, Paris.
R Core Development Team (2009). R: A language and environment for statistical computing. R Foundation for Statistical Computing, Vienna, Austria. www.r-project.org
Rabalais, N.N. (2002). Nitrogen in Aquatic Ecosystems. Ambio, 31, 102-112.
Rodrigo, M.A., Rojo, C., Alvarez-Cobelas, M. and Cirujano, S. (2007). Chara hispida beds as a sink of nitrogen: Evidence from growth, nitrogen uptake and decomposition. Aquatic Botany, 87, 7-14.
Ruse, L. (2010). Classification of nutrient impact on lakes using the chironomid pupal exuvial technique. Ecological Indicators, 10, 594-601.
Schelske, C.L. and Stoermer, E.F. (1971). Eutrophication, silica depletion, and predicted changes in algal quality in Lake Michigan. Science, 173, 423 –424.
Schindler, D.W. (1971). Carbon, nitrogen and phosphorus and the eutrophication of freshwater lakes. J. Phycol., 7, 321-329
Schindler, D.W. (1974). Eutrophication and recovery in experimental lakes: implications for lake management. Science, 184, 897-899.
Schindler, D.W. (1977). Evolution of phosphorus limitation in lakes: Natural mechanisms compensate for deficiencies of nitrogen and carbon in eutrophied lakes. Science, 195, 260-262.
Schindler, D.W., Hecky, R.E., Findlay, D.L., Stainton, M.P., Parker, B.R., Paterson, M.J., Beaty, K.G., Lyng, M. and Kaslan, S.E.M. (2008). Eutrophication of lakes cannot be controlled by reducing nitrogen input: Results of a 37-year whole-ecosystem experiment. Proceedings of the National Academy of Science, 105, 11254-11258.
Smith, V.H., Joye, S.B. and Howarth, R.W. (2006). Eutrophication of freshwater and marine ecosystems. Limnol. Oceanogr., 51, 351-355.
Søndergaard, M., Jeppesen, E., Jensen, J.P. and Amsinck, S.L. (2005). Water Framework Directive: ecological classification of Danish lakes. Journal of Applied Ecology, 42, 616-629.
van der Molen, D.T., Portielje, R., de Nobel, W.T. and Boers, P.C.M. (1998). Nitrogen in Dutch freshwater lakes: trends and targets. Environmental Pollution, 102, 553–557.
Vollenweider, R.A. (1968). Scientific fundamentals of the eutrophication of lakes and flowing waters, with particular reference to nitrogen and phosphorus as factors in eutrophication. Technical Report DAS/CSI/68 27, OECD, Paris, pp. 159.
Vollenweider, R. A. (1976). Advances in defining critical loading levels for phosphorus in lake eutrophication . Memorie dell’ Istituto Italiana di Idrotiologia, 33, 53 –83.
Voss, M. et al. (2011). Nitrogen processes in coastal and marine ecosystems. Ch. 8 in European Nitrogen Assessment. Eds. M. A Sutton, C.M. Howard, J.W Erisman et al. Cambridge University Press, Cambridge.
WFD- UKTAG (2007a). Recommendations on surface water classification schemes for the purposes of the Water Framework Directive. Water Framework Directive UK Technical Advisory Group, Edinburgh. pp 62. http://www.wfduk.org/UKCLASSPUB/LibraryPublicDocs/class%20report
WFD- UKTAG (2007b). Proposed lake total phosphorus standards. pp 5. http://www.wfduk.org/stakeholder_reviews/stakeholder_review_1-2007/LibraryPublicDocs/lake_task_team_phosphorous
WFD- UKTAG (2008a). UK Environmental Standards and Conditions. Phase 1 report (SRS-2006), Water Framework Directive UK Technical Advisory Group, Edinburgh. pp. 73. http://www.wfduk.org/stakeholder_reviews/Standards_Jan_2006/LibraryPublicDocs/UKTAG%20ReportAug%202006UKEnvironmentalStandardsandConditionsFinalReport
WFD- UKTAG (2008b). UK Environmental Standards and Conditions. Phase 2 report, pp. 84. http://www.wfduk.org/stakeholder_reviews/stakeholder_review_1-2007/LibraryPublicDocs/UKTAG_Report_Surface_Water_Standards_and_Conditions
WFD- UKTAG (2008c). UKTAG Lake assessment methods macrophytes and phytobenthos. Phytobenthos –diatom assessment of lake ecological quality (DARLEQ). pp 19. Water Framework Directive UK Technical Advisory Group, Edinburgh. http://www.wfduk.org/bio_assessment/bio_assessment/lakes_phytobenthos_darleq
WFD- UKTAG (2008d). UKTAG Lake assessment methods phytoplankton. Chlorophyll a and percentage nuisance cyanobacteria. Water Framework Directive UK Technical Advisory Group, Edinburgh. pp. 9. http://www.wfduk.org/bio_assessment/bio_assessment/lake_phytoplankton
WFD- UKTAG (2008e). UKTAG Lake assessment methods benthic invertebrate fauna. Chironomid pupae exuviae technique (CPET). Water Framework Directive UK Technical Advisory Group, Edinburgh. pp 14. http://www.wfduk.org/bio_assessment/bio_assessment/lakes_cpet
WFD- UKTAG (2009). UKTAG Lake assessment methods macrophytes and phytobenthos. Macrophytes. Version 2. Water Framework Directive UK Technical Advisory Group, Edinburgh. pp 20. http://www.wfduk.org/bio_assessment/bio_assessment/lakes%20leafpacs%20method%20statement
Appendix B. Review of the scientific evidence for nutrient nitrate thresholds relevant to UK standing waters
Recent studies in the UK (James et al, 2005), The Netherlands (van der Molen et al., 1998) and Denmark (Søndergaard et al. 2005; González Sagrario et al., 2005) have stressed the importance of nitrogen in controlling eutrophication in lakes, particularly shallow lakes. Shallow lakes (<3m), in their macrophyte-dominated state are structurally more complex than deep lakes, so need to be considered separately.
Van der Molen et al. (1998) found that a summer mean TN <1.35 mg.L-1 would be required to reduce phytoplankton sufficiently to allow light to the sediments and therefore recolonization by the submerged macrophytes (based on a data set of 682 lake-years for lakes in The Netherlands). They proposed a combined lake-specific approach of nitrogen and phosphorus emission reduction to combat eutrophication, due to atmospheric nitrogen fixation by blue-green algae in lakes with a growth limiting nitrogen concentration.
Correlations among macrophyte species richness, phytoplankton and periphyton standing stock with N and P concentrations in 42 small (<75 ha), shallow, macrophyte dominated lakes within the UK also suggest that some lakes are N–limited (James et al., 2005). For these lakes it was found that winter nitrate was the most significant variable in explaining a reduction in macrophyte species richness, while no significant relationship between an increase in phosphorus concentration and reduced macrophyte species richness was found. Winter concentrations effectively give a measure of the amounts available in spring for plant growth; uptake and denitrification complicate the relationship if summer concentrations are used. Reasonably diverse plant communities were found only at winter nitrate below 1-2 mg NO3-N.L-1.
Søndergaard et al. (2005) used chemical and biological data from 709 Danish lakes to investigate whether and how different lake types respond to eutrophication. Ecological classification into high, good, moderate, bad and poor ecological quality was based on TP values; within each TP category, median values for 22 other biological and environmental indicators were determined, including TN. A mean depth of 3m was used to separate shallow (S) and deep (D) lakes. TN values ranged from <1.0 mg TN.L-1 for high and good status lakes to >2.0 mg TN.L-1 for bad status (see Table A1). TN responded markedly to changes in TP, suggesting TN is a potential indicator for the classification of lakes relative to eutrophication. However, strong correlation was found between TP, TN, total alkalinity and pH, emphasising the problem of correlation between indicators for defining ecological classes.
Table A1. Concentrations of total phosphorus (TP) and total nitrogen (TN) associated with a classification 709 deep (D) and shallow (S) lakes by ecological quality (High-Low). From Søndergaard et al. (2005)
High Good Moderate Poor Bad
D S D S D S D S D S
TP (µg P.L-1
) <12.5 <25 <25 <50 <50 <100 <100 <200 >100 >200
TN (mg N.L-1
) - <1.0 <1.0 <1.0 <1.0 <1.4 <1.4 <2.0 <2.2 <2.9
González Sagriario et al. (2005) undertook a 3-month (summer) mesocosm experiment on a shallow Danish lake to investigate the effect of TN and TP loading on trophic structure and water clarity (natural lake concentrations of 0.1 mg P.L-1, 2 mg N.L-1).
Minor or no effects on the biomass of macrophytes and phytoplankton were observed in treatments with single nutrient addition; in contrast, a strong effect was observed with high P addition (0.2 mg P .L-1) when accompanied by N addition (4 or 10 mg N.L-
1). The shift to a turbid phytoplankton dominated state with low plant coverage occurred at an overall mean TN between 1.2 and 2 mg N.L-1 and TP>0.13-0.2 mg P.L-1, suggesting high nitrogen loading may be important in the loss of submerged macrophytes in shallow lakes. Using empirical relationships between summer mean lake N concentrations, discharge-weighted inlet concentrations and an annual mean lake retention time of 3 months, a lake N concentration of 1.2 mg N.L-1 corresponds to an inlet concentration of 2.5 mg N.L-1 (similarly, 2 mg N.L-1 corresponds to 5.7 mg N.L-
1); inlet concentrations of 2.5-5.7 mg N.L-1 are well below the 11.3 mg N l-1 drinking water limit. The authors note that as the data stems from a cold northern temperate region, the results should not be transferred directly to other regions; N thresholds may be higher due to high plant growth efficacy in warmer climates.
Increased nitrogen loading may lead to changes in productivity or biodiversity in freshwater systems. Field surveys have shown reduced species richness of submerged and floating-leaved plant communities in shallow lakes as winter nitrate concentrations, a surrogate for nitrate loading, have risen above 1-2 mg NO3-N.L-1.
Barker et al (2008) reported the use of experimental tank mesocosms, containing about 3 m3 of water and sediment from Hickling Broad, Norfolk, UK that were initially planted with eleven submerged plant species from the lake and its connected waterway.
Constant phosphorus loadings (designed to give added concentrations of 50 g P.L-1) were provided to all tanks. Four nitrate loadings were given in a randomised block design with twelve-fold replication. Loadings were designed to increase the concentration in the water by 1, 2, 5 and 10 mg NO3-N .L-1 (treatments identified as N1, N2, N5 and N10, respectively). Nitrate loading increased phytoplankton and periphyton chlorophyll a in the N2, N5 and N10 treatments compared with N1. In contrast, total plant volume decreased and treatments had varied effects on different species, with most species indifferent, a few (mostly charophytes) declining above the N1 treatment, and one (Elodea canadensis) performing best in N2 and N5 compared with N1 and N10. Species richness of submerged macrophytes declined with time in all treatments and with increasing nitrogen load in the first year. In the second year, species richness did not further decline in the N1 treatment but declined at increasing rates with increasing nitrogen load in others. The rate of decline in the second year, plotted against nitrate load, fitted an exponential relationship, allowing calculation in inflow water, or of an empirically determined equivalent TN concentration in the lake water of about 1.50 mg N.L-1. This value broadly corresponds with estimates from field data for concentrations associated with declining species richness and is much lower than values currently often found in lowland agricultural areas in Europe.
A study commissioned by Natural England (2010) tried to understand the lack of response of macrophyte species richness to variation water chemistry in certain SSSI designated meres. Macrophyte species were converted to trophic ranking scores using the systems of Palmer et al. (1992) and Willby (pers comm.). The two TRS systems were strongly correlated and had a slope of 1.0 but the Palmer et al. (1992) system produced scores that were greater than the Willby system by 1.5. Relationships between the two Trophic Ranking Scores, based on the average for all the species present at a site, and winter concentrations of NOx-N or total phosphorus were not significant (see Fig. 6.4 in Natural England 2010). The data suggest, however, that above winter concentrations of about 0.5 mg NOx-N .L-1 and about 0.08 mg TP.L-1, there was not a major increase in Trophic Ranking Score. This may possibly explain the lack of response in the meres: most of the meres had concentrations of nitrogen and phosphorus that were characteristic of eutrophic water bodies. This lack of sites at lower nutrient concentrations truncates the macrophyte response to the higher, more insensitive end of the nutrient gradient. This result suggests that macrophyte species-
richness in the meres cannot be used as a response to set nutrient targets, although the values obtained from the combined study of UK and Polish lakes (James et al. 2005; Barker et al. 2008) could still be applicable, suggesting targets of around 1.5 mg.L-1 NO3-N.
The presence of nitrogen limitation or co-limitation in the meres means that nitrogen targets are also appropriate at some of the sites. Total nitrogen targets were derived from European datasets relating concentrations of chlorophyll a to total nitrogen for different types of lakes. In turn, the chlorophyll a target was derived from Water Framework Directive standards for different lake types. The Good/ Moderate total nitrogen target varied between 0.4 - 1.4 mg.L-1.
Lambert & Davy (2010) investigated the relationship between aquatic vegetation and water quality at the principal sites for charophyte biodiversity in the UK. They used hierarchical partitioning to discriminate independent effects of pollutants on their occurrence. A laboratory experiment examined the growth responses of a representative species (Chara globularis) to nitrate. Nitrate-N exerted the greatest detrimental effect on charophyte occurrence in the field. Furthermore, growth of C. globularis in the laboratory was inhibited above very low concentrations. Smaller independent effects of certain trace metals and phosphate-P on charophyte occurrence were discriminated. The study demonstrated that it is possible to separate the deleterious effects of phosphorus and nitrogen on aquatic plant species in the field. Nitrate is a critical factor. The upper limit for charophyte persistence was shown to be c. 2.5 mg.L-1 nitrate-N. An in vitro experiment showed that a concentration of 1-2 mg.L-1 NO3-N might be necessary to protect charophytes and their services within wetland ecosystems.
Schindler et al. (2008) reported the results of experimental nutrient enrichment (nitrogen and phosphorus) of a single, small Canadian lake. The study concluded that controlling N alone may have limited benefits in controlling eutrophication and, under conditions of P enrichment, N limitation may provide N-fixing cyanobacteria with a competitive advantage.
The experimental nutrient enrichment of the lake was undertaken for approx 20 years and peak total nitrogen concentrations of c. 1.2 mg-N.L-1 were recorded towards the end of this time. The highest peak concentrations of total inorganic nitrogen (nitrate plus nitrite plus ammonium) were observed to be 0.128 mg.L-1. These peak concentrations are considerably lower than the threshold of 1-2 mg.N.L-1 used to help identify and screen lakes with elevated nutrient N as part of this review. Indeed, 75%ile TON concentrations in the vast majority of candidate lakes considered as part of this review are x10-x80 higher (see Fig 2.1) than the maximum TIN concentrations reported in the Schindler et al. (2008) study.
Whilst the need to focus on phosphorus is accepted as important in tackling freshwater eutrophication it should be noted that the Schindler et al. (2008) study relates primarily to a single Canadian lake and his conclusions may not be directly relevant to nutrient enriched lakes in England and Wales. It also focussed on the effects of nutrient enrichment on the phytoplankton without considering the effects, indicated in other recent studies on higher plant (macrophyte) communities (e.g. James et al., 2005). Jeppesen et al. (2005) concluded that control of both N and P may be necessary to improve the ecological status of shallow lakes.
Appendix C. Example of a draft eutrophic water proforma report provided as part of local elicitation exercise.
See separate document.
Appendix D. Criteria for nominating groups of lakes as candidates for designation as Nitrate eutrophic waters
The conservation agencies asked the Defra MRG whether it would be possible to designate groups of similar lakes located within a geographically localised area. The Environment Agency worked with the Conservation Agencies to identify what principles and evidence might be appropriate and sufficient to support such designations. In order to consider groups of lakes for designation, the Defra/WAG MRG agreed the following principles.
D.1 The following minimum set of evidence should be provided.
There should be monitoring data on TON and/or TN, demonstrating elevated levels of nitrogen, for at least one lake included within each group.
There should be monitoring data or other evidence of eutrophic disturbance in one or more lakes within each group. This may include but is not restricted to the lines of evidence included in the Eutrophic waters risk assessment report.
There should be evidence that the lakes form a relatively homogenous natural grouping. It is anticipated that this evidence will be primarily typological and ecological. It might include lists of characteristic species or species communities.
There should be a description of the principal physical-chemical characteristics of each lake within the group, as outlined in the Eutrophic water proforma reports.
There should be a description of the hydrological catchments of each lake. This should include an assessment of the principal sources and pathways of nutrient nitrogen and phosphorus input to the lakes. Where possible, individual lakes should be ranked in order of the risk of nutrient delivery.
It will be important to identify any groundwater dependent waters. This should identify those that are dependent on groundwater levels but whose principal (natural) source of nutrient inputs may be atmospheric.
The Conservation Agencies should provide suitable GIS catchment boundaries for the drainage catchments for the group of lakes. The EA will then aim to provide estimates of nitrate loadings to each lake, where appropriate.
D.2 The evidence should be summarised in a written statement of case to be prepared by the conservation agencies.
D.3 The statement of case should highlight any dissimilarity between lakes within the group, by reference to the evidence in D1 above.
D.4 The statements of case would be provided to the National Panel for their consideration on a case-by-case basis.
Appendix E. Criteria used to identify eutrophication in estuaries and coastal waters
E.1 Nutrients (category I)
Chemical nutrient status is assessed from winter nutrient data to determine the degree of hypernutrification, analysing for Total Oxidised Nitrogen (TON), ammonium, and nitrite to establish levels of Dissolved Available Inorganic Nitrogen (DAIN) and orthophosphate to establish levels of Dissolved Available Inorganic Phosphorus (DAIP). Hypernutrification (elevated nutrient concentrations) was considered in the context of the thresholds for nitrogen and phosphorus defined in the UK Comprehensive Studies Task Team report, 1997, and/or exceeding the relevant Water Framework Directive standard for dissolved inorganic nitrogen.
E.2 Plants/ algae (category II)
The biological status of the transitional water is determined by assessing a combination of the concentration of chlorophyll a, the phytoplankton status or the macroalgal status.
Where phytoplankton growth is considered significant, summer sampling for cell counts and chlorophyll a is undertaken. It is considered exceptional if the normal pattern of growth (a spring bloom with increased light levels) has changed as a result of nutrient enrichment. Attention is given to blooms of unusual scale and duration, species or toxicity or changes in algal species or abundance. Elevated chlorophyll a is considered in the context of thresholds of 25 µg/l mean and 100 µg/l maximum at the freshwater limit of an estuary, decreasing proportionately with salinity through to the 10 µg/l threshold which is considered relevant for open coastal waters. In many estuaries the fast flushing times and/or high suspended solids means that excessive phytoplankton biomass does not have time and/or sufficient light to develop.
Macroalgal growth is examined in the summer and for sites with excessive growth quantitative information on % cover was collected. A substantiated trend of increasing cover of nuisance species is a cause for concern where changes could reflect a species shift from long lived to short lived nuisance species with dense and widespread growth e.g. of Enteromorpha and Ulva species. Excessive growth is considered when there are areas of greater than 10 hectares (and greater than 25% of available intertidal area) in which the average algal cover exceeded 25%. Assessments undertaken using the new WFD toolkit were also considered and for some sites assessments made using a method developed for the Habitats Directive were taken into account, illustrated below:
Concern is focussed on the consequences of the excess algal coverage on the function of the ecosystem, for example whether the macroalgae overwinter making the underlying mud anoxic and affecting the invertebrates which are an important food source for birds.
E.3 Secondary and other effects (category III)
Evidence of undesirable disturbance was also based, where relevant, on:
Decreased dissolved oxygen concentration at the surface as well as in deeper layers. Median values of less than 7mg/l during the growing season would indicate a cause for concern.
Changes in fauna such as substantial increases or decreases in zoobenthic biomass, shifts in species composition.
Formation of algal scums on beaches.
Occurrence of paralytic shellfish poisoning, although this could be due to a variety of natural causes.
Supporting information on the waterbody, its uses and catchment are included.