23
in Developing the National Health Care Quality and Health Care Disparities Reports Julia Holmes NCHS 2004 NCHS Data User’s Conference Washington DC July 12, 2004
| Date post: | 02-Jan-2016 |
| Category: |
Documents |
| Upload: | corey-carson |
| View: | 216 times |
| Download: | 0 times |
Methodological Challenges inDeveloping the National Health Care Quality and Health Care
Disparities Reports
Julia HolmesNCHS
2004 NCHS Data User’s ConferenceWashington DCJuly 12, 2004

Presentation Outline
1. Background and Development Ed Kelley (AHRQ)
2. Adapting NCHS and HP2010 measures Suzanne Proctor (NCHS)
for the reports Richard Klein (NCHS)
3. Methodological Challenges Julia Holmes (NCHS)
in developing the reports
4. Results and Next Steps Ernest Moy (AHRQ)
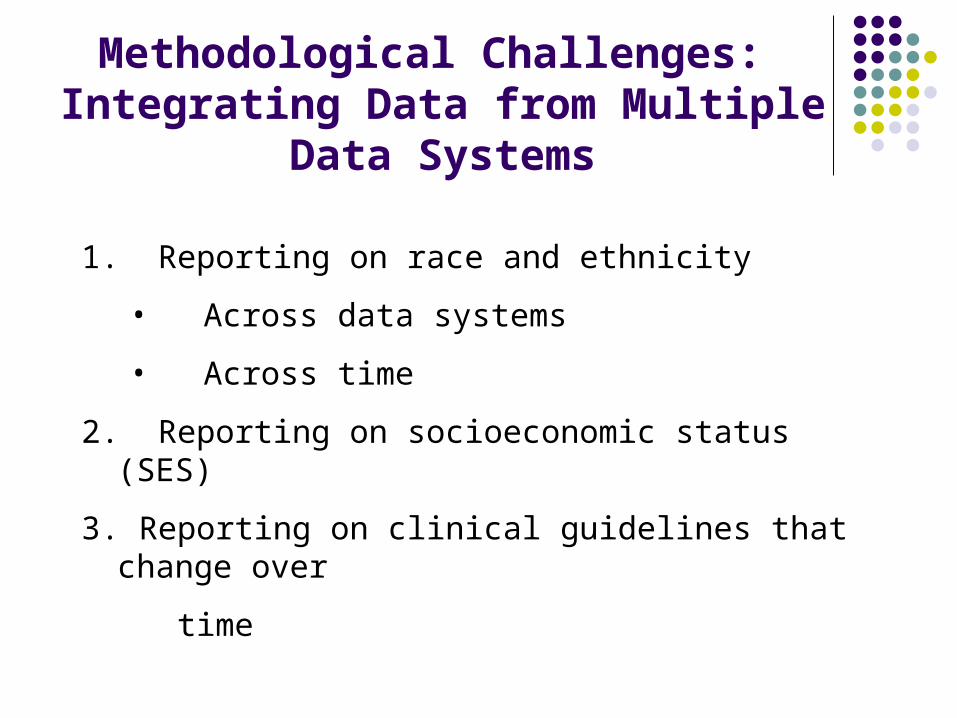
Methodological Challenges: Integrating Data from Multiple Data
Systems
1. Reporting on race and ethnicity
• Across data systems
• Across time
2. Reporting on socioeconomic status (SES)
3. Reporting on clinical guidelines that change over
time
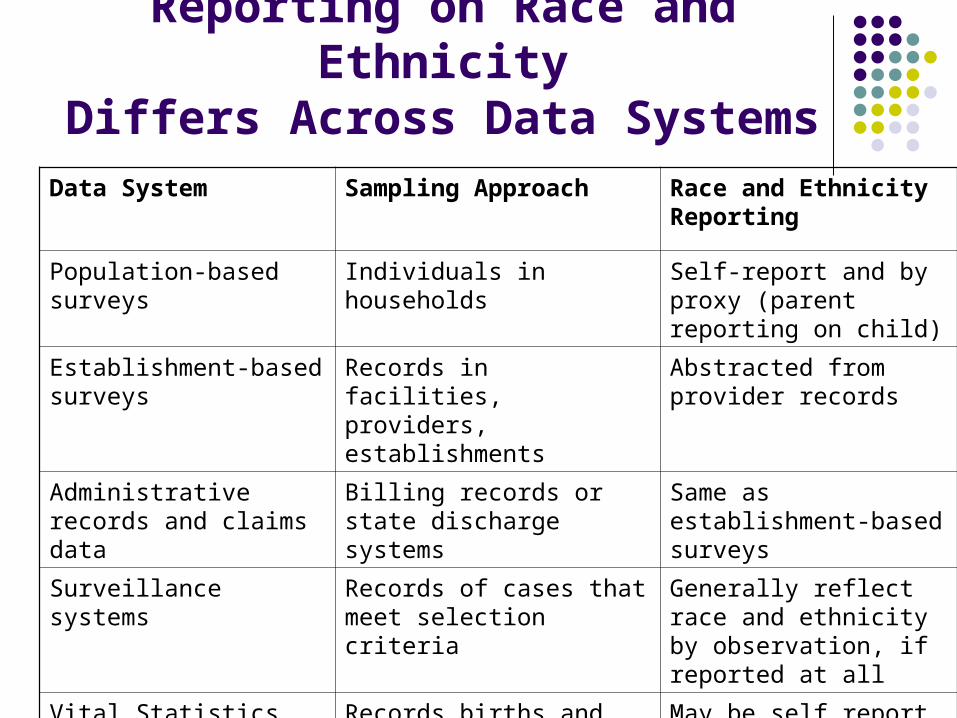
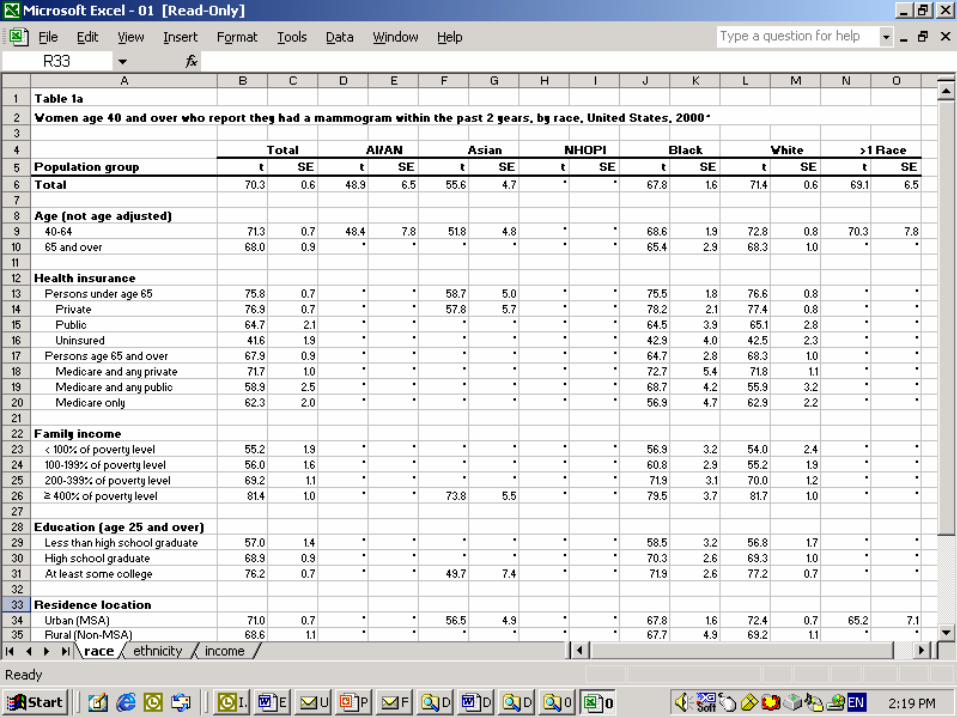
Reporting on Race and EthnicityDiffers Across Data Systems
Data System Sampling Approach Race and Ethnicity Reporting
Population-based surveys Individuals in households Self-report and by proxy (parent reporting on child)
Establishment-based surveys
Records in facilities, providers, establishments
Abstracted from provider records
Administrative records and claims data
Billing records or state discharge systems
Same as establishment-based surveys
Surveillance systems Records of cases that meet selection criteria
Generally reflect race and ethnicity by observation, if reported at all
Vital Statistics Records births and deaths for state registries
May be self report (mother for herself); proxy (mother for child); other (funeral director)
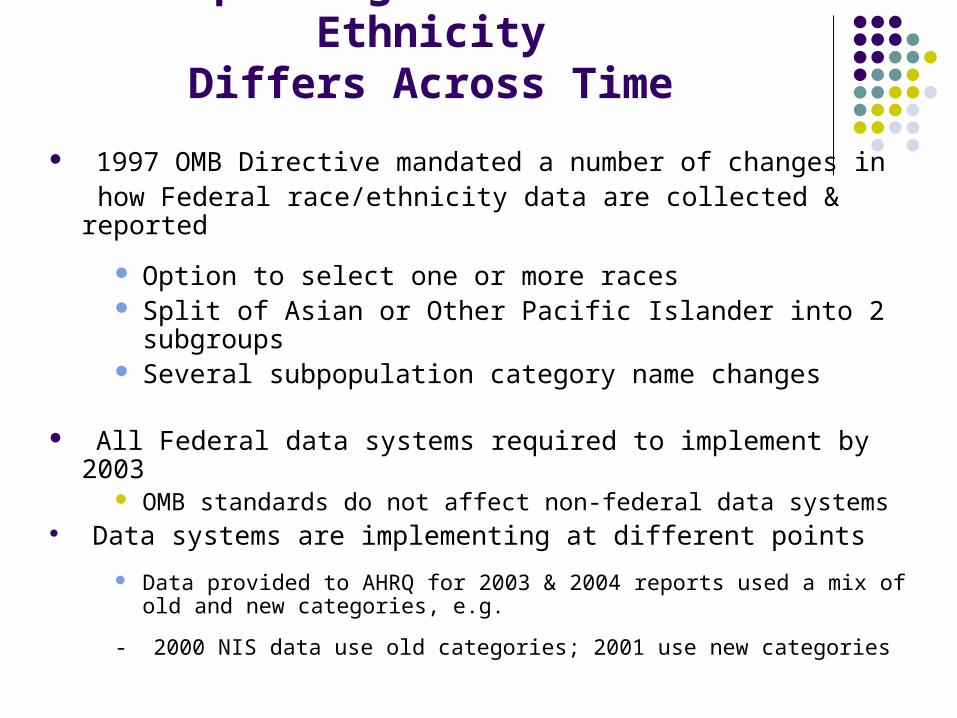
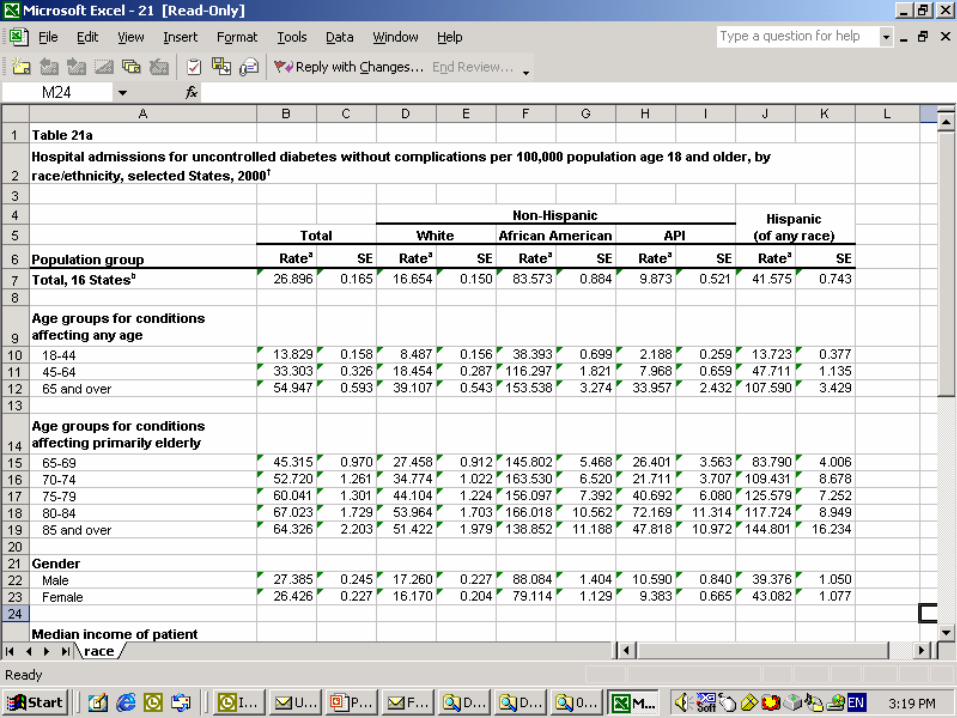
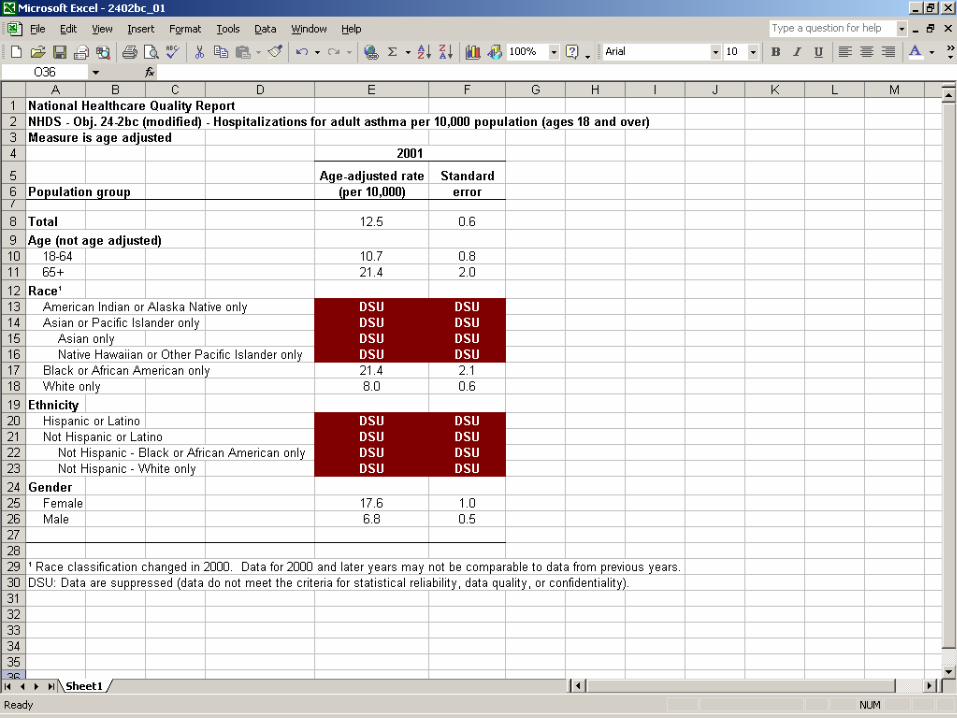
Reporting on Race and EthnicityDiffers Across Time
1997 OMB Directive mandated a number of changes in how Federal race/ethnicity data are collected & reported
Option to select one or more races Split of Asian or Other Pacific Islander into 2 subgroups Several subpopulation category name changes
All Federal data systems required to implement by 2003 OMB standards do not affect non-federal data systems
Data systems are implementing at different points
Data provided to AHRQ for 2003 & 2004 reports used a mix of old and new categories, e.g.
- 2000 NIS data use old categories; 2001 use new categories
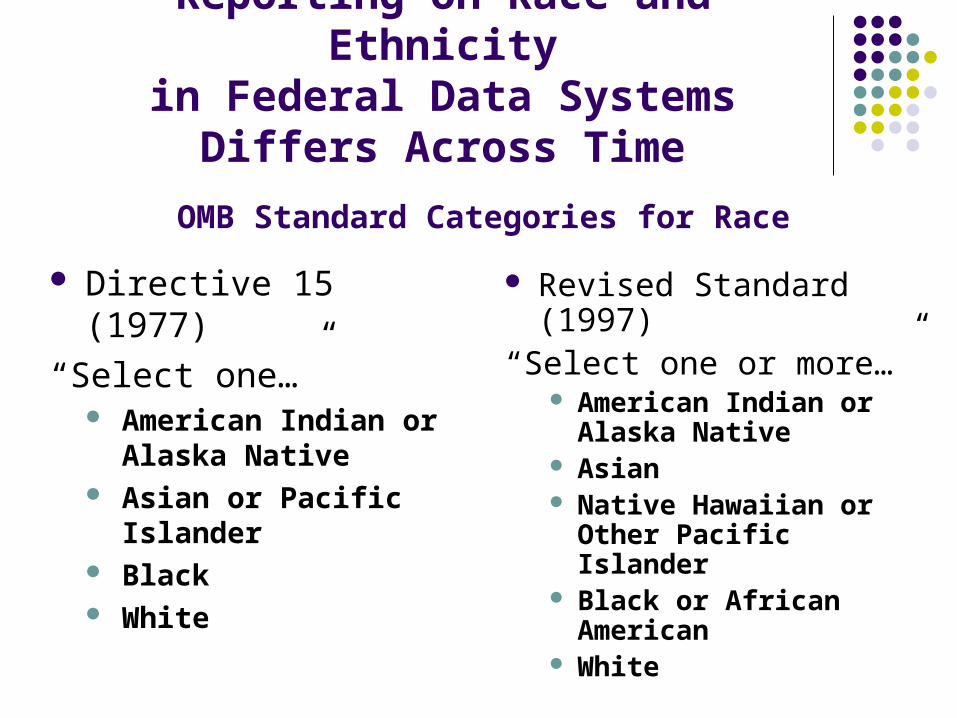
Reporting on Race and Ethnicityin Federal Data Systems Differs
Across Time
OMB Standard Categories for Race
Directive 15 (1977)
“Select one…” American Indian or
Alaska Native Asian or Pacific
Islander Black White
Revised Standard (1997)
“Select one or more…” American Indian or
Alaska Native Asian Native Hawaiian or
Other Pacific Islander Black or African
American White
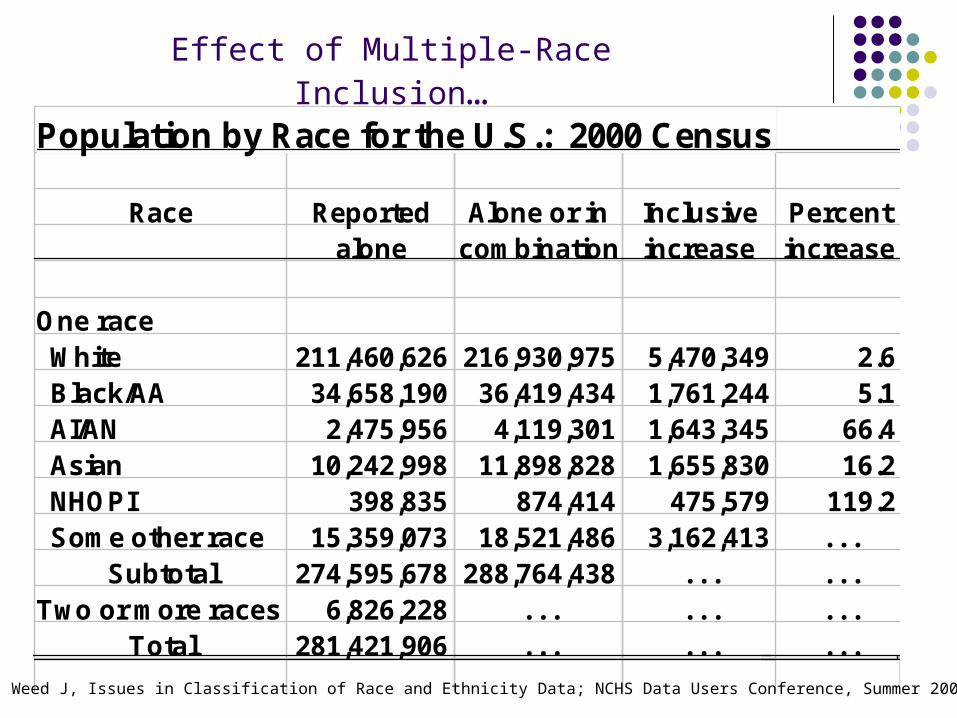
Population by Race for the U.S.: 2000 Census
Race Reported Alone or in Inclusive Percentalone combination increase increase
One race White 211,460,626 216,930,975 5,470,349 2.6 Black/AA 34,658,190 36,419,434 1,761,244 5.1 AI/AN 2,475,956 4,119,301 1,643,345 66.4 Asian 10,242,998 11,898,828 1,655,830 16.2 NHOPI 398,835 874,414 475,579 119.2 Some other race 15,359,073 18,521,486 3,162,413 . . .
Subtotal 274,595,678 288,764,438 . . . . . .Two or more races 6,826,228 . . . . . . . . .
Total 281,421,906 . . . . . . . . .1990-Based
Effect of Multiple-Race Inclusion…
SOURCE: Weed J, Issues in Classification of Race and Ethnicity Data; NCHS Data Users Conference, Summer 2002
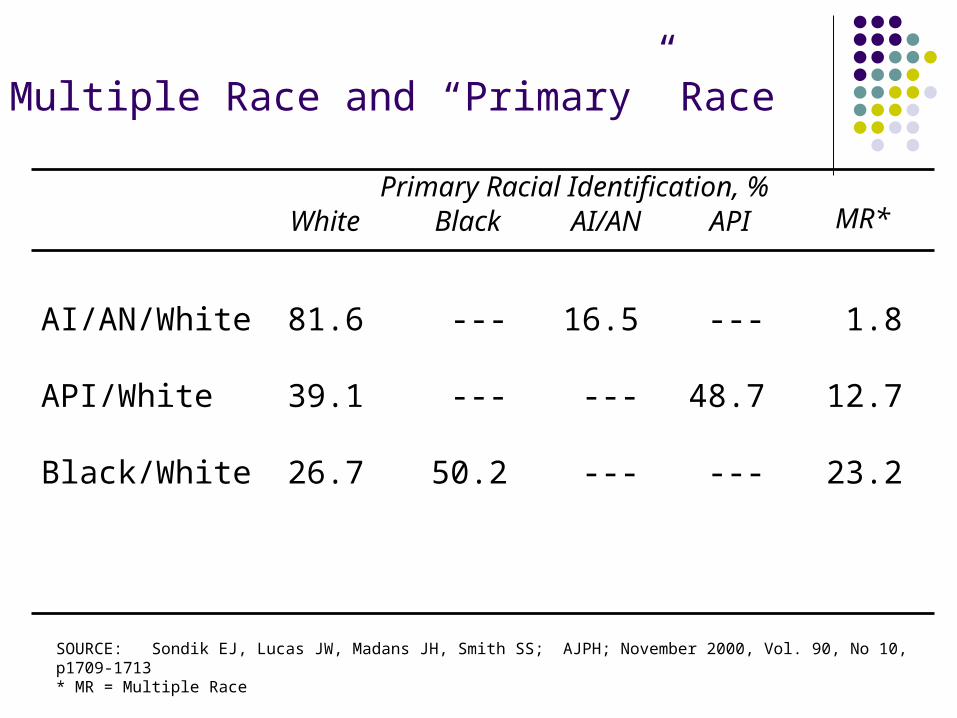
Multiple Race and “Primary” Race
AI/AN/White 81.6 --- 16.5 --- 1.8
API/White 39.1 --- --- 48.7 12.7
Black/White 26.7 50.2 --- --- 23.2
MR*White Black AI/AN API
SOURCE: Sondik EJ, Lucas JW, Madans JH, Smith SS; AJPH; November 2000, Vol. 90, No 10, p1709-1713* MR = Multiple Race
Primary Racial Identification, %
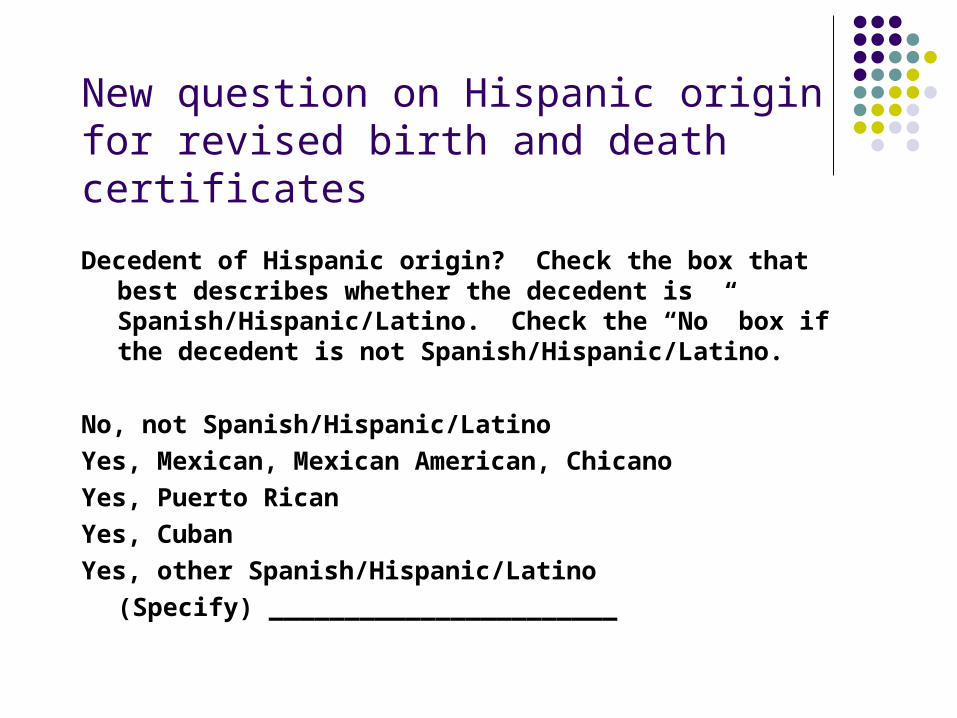
New question on Hispanic originfor revised birth and death certificates
Decedent of Hispanic origin? Check the box that best describes whether the decedent is Spanish/Hispanic/Latino. Check the “No” box if the decedent is not Spanish/Hispanic/Latino.
No, not Spanish/Hispanic/Latino
Yes, Mexican, Mexican American, Chicano
Yes, Puerto Rican
Yes, Cuban
Yes, other Spanish/Hispanic/Latino
(Specify) _______________________
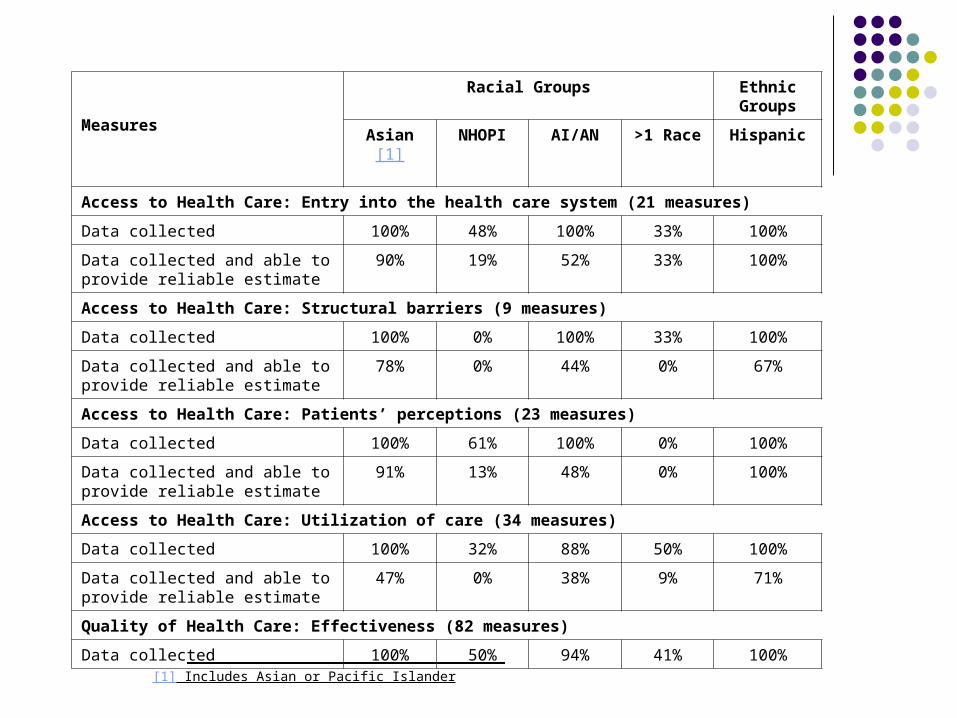
Measures
Racial Groups Ethnic Groups
Asian[1] NHOPI AI/AN >1 Race Hispanic
Access to Health Care: Entry into the health care system (21 measures)
Data collected 100% 48% 100% 33% 100%
Data collected and able to provide reliable estimate
90% 19% 52% 33% 100%
Access to Health Care: Structural barriers (9 measures)
Data collected 100% 0% 100% 33% 100%
Data collected and able to provide reliable estimate
78% 0% 44% 0% 67%
Access to Health Care: Patients’ perceptions (23 measures)
Data collected 100% 61% 100% 0% 100%
Data collected and able to provide reliable estimate
91% 13% 48% 0% 100%
Access to Health Care: Utilization of care (34 measures)
Data collected 100% 32% 88% 50% 100%
Data collected and able to provide reliable estimate
47% 0% 38% 9% 71%
Quality of Health Care: Effectiveness (82 measures)
Data collected 100% 50% 94% 41% 100%[1] Includes Asian or Pacific Islander
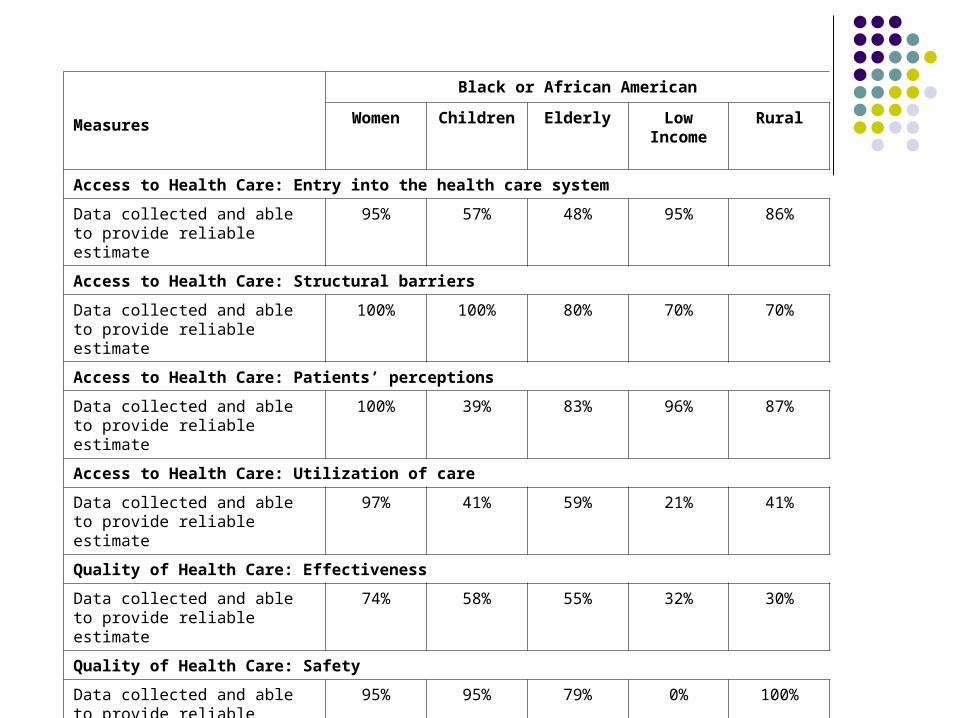
Measures
Black or African American
Women Children Elderly Low Income
Rural
Access to Health Care: Entry into the health care system
Data collected and able to provide reliable estimate
95% 57% 48% 95% 86%
Access to Health Care: Structural barriers
Data collected and able to provide reliable estimate
100% 100% 80% 70% 70%
Access to Health Care: Patients’ perceptions
Data collected and able to provide reliable estimate
100% 39% 83% 96% 87%
Access to Health Care: Utilization of care
Data collected and able to provide reliable estimate
97% 41% 59% 21% 41%
Quality of Health Care: Effectiveness
Data collected and able to provide reliable estimate
74% 58% 55% 32% 30%
Quality of Health Care: Safety
Data collected and able to provide reliable estimate
95% 95% 79% 0% 100%
Quality of Health Care: Timeliness
Data collected and able to provide reliable estimate
91% 82% 73% 64% 82%
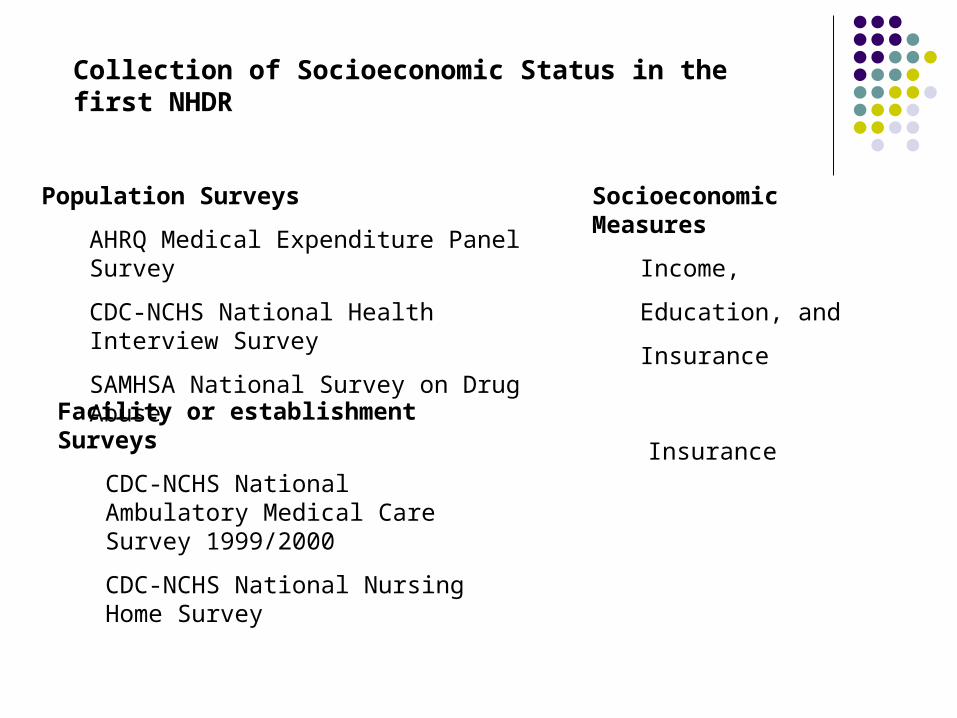
Population Surveys
AHRQ Medical Expenditure Panel Survey
CDC-NCHS National Health Interview Survey
SAMHSA National Survey on Drug Abuse
Socioeconomic Measures
Income,
Education, and
Insurance
Facility or establishment Surveys
CDC-NCHS National Ambulatory Medical Care Survey 1999/2000
CDC-NCHS National Nursing Home Survey
Insurance
Collection of Socioeconomic Status in the first NHDR
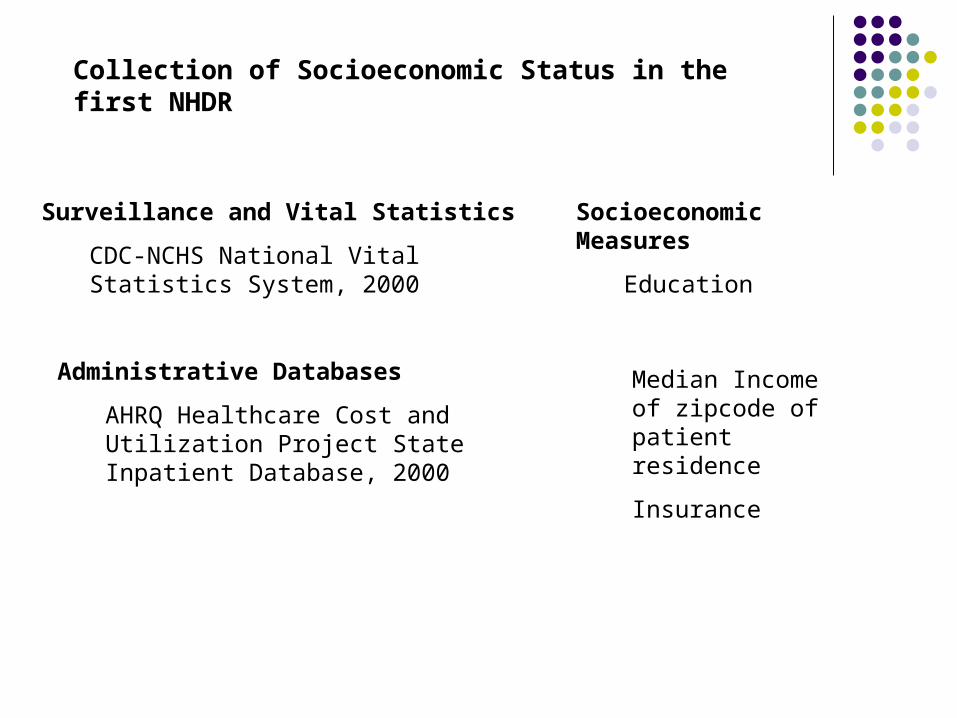
Surveillance and Vital Statistics
CDC-NCHS National Vital Statistics System, 2000
Socioeconomic Measures
Education
Administrative Databases
AHRQ Healthcare Cost and Utilization Project State Inpatient Database, 2000
Median Income of zipcode of patient residence
Insurance
Collection of Socioeconomic Status in the first NHDR
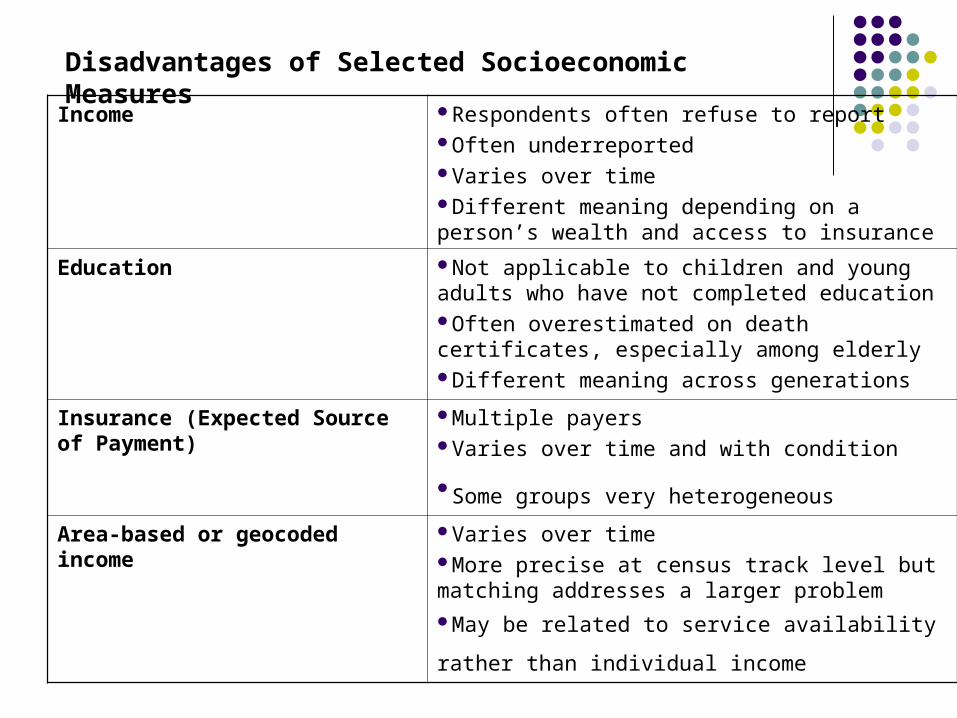
Disadvantages of Selected Socioeconomic Measures
Income Respondents often refuse to reportOften underreportedVaries over timeDifferent meaning depending on a person’s wealth and access to insurance
Education Not applicable to children and young adults who have not completed educationOften overestimated on death certificates, especially among elderlyDifferent meaning across generations
Insurance (Expected Source of Payment)
Multiple payersVaries over time and with condition
Some groups very heterogeneous Area-based or geocoded income Varies over time
More precise at census track level but matching addresses a larger problemMay be related to service availability rather than
individual income

Clinical Guidelines Sometimes Change Over Time
Change in HP2010 definition
5-12 (modified). Percent of adults (18 years and over) with diabetes who had a hemoglobin A1c test at least once in the past year Original HP2010 measure was at least once (National
Diabetes Quality Improvement Alliance and the National Quality Forum)
HP2010 Diabetes Workgroup changed the definition to at
least twice to reflect changes in clinical recommendations
AHRQ decided to report a hemoglobin A1c test at least once in the past year in the first report
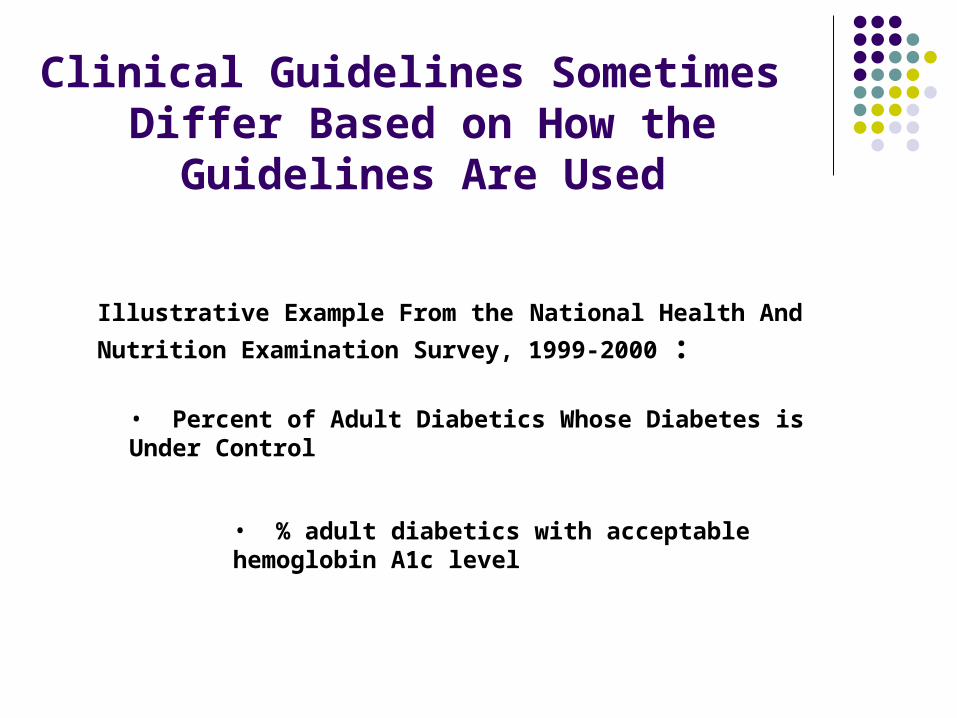
Illustrative Example From the National Health And Nutrition
Examination Survey, 1999-2000 :
Clinical Guidelines Sometimes Differ Based on How the Guidelines
Are Used
• % adult diabetics with acceptable hemoglobin A1c level
• Percent of Adult Diabetics Whose Diabetes is Under Control
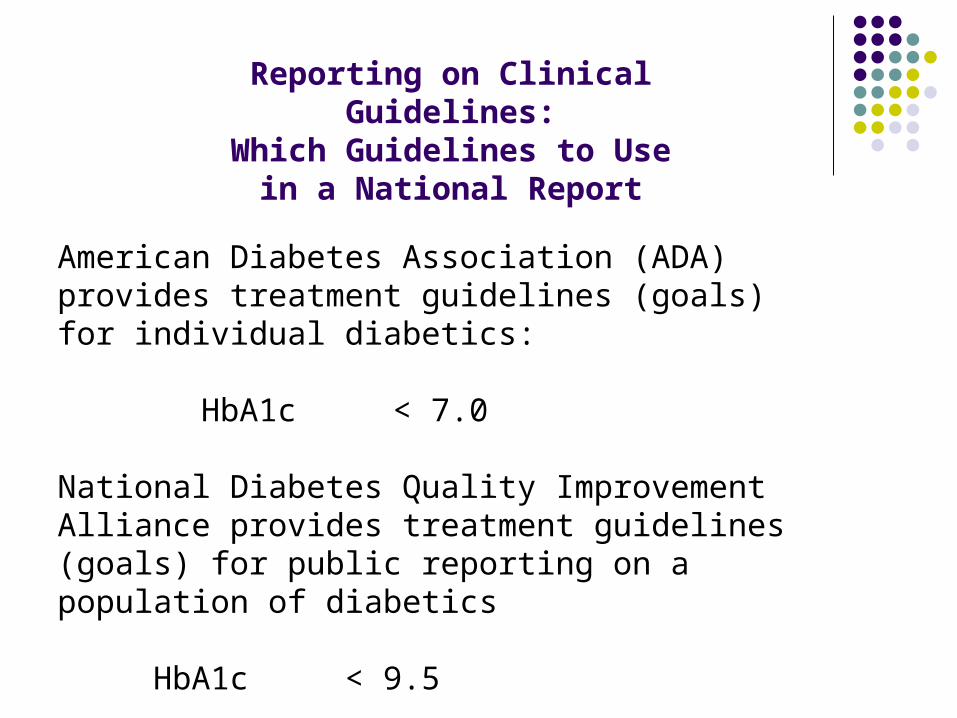
American Diabetes Association (ADA) provides treatment guidelines (goals) for individual diabetics:
HbA1c< 7.0
National Diabetes Quality Improvement Alliance provides treatment guidelines (goals) for public reporting on a population of diabetics
HbA1c < 9.5
Reporting on Clinical Guidelines:Which Guidelines to Use
in a National Report
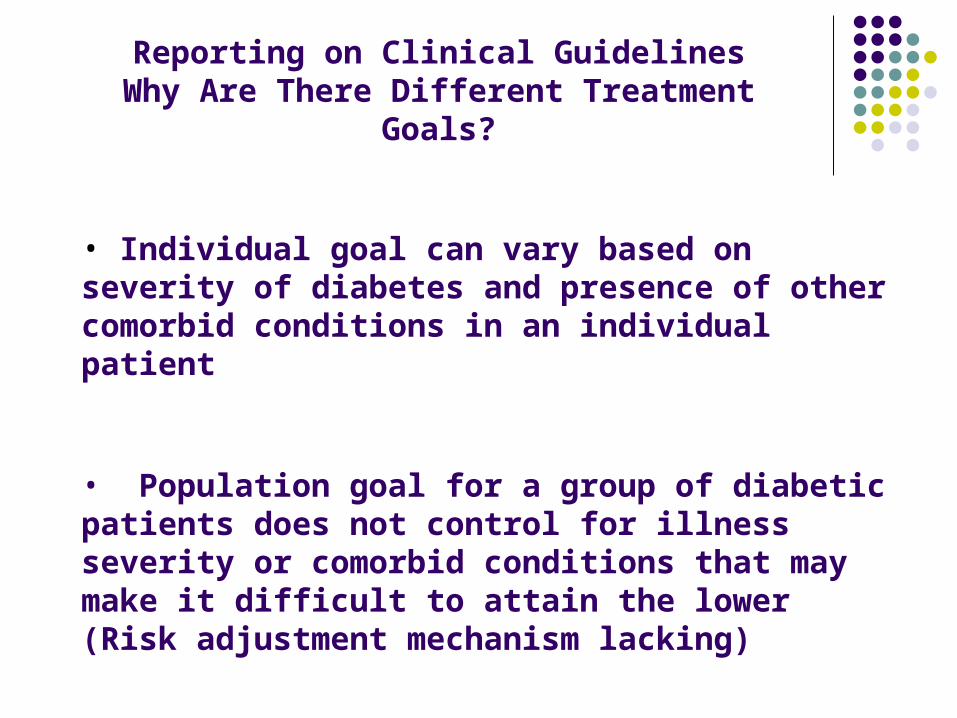
Reporting on Clinical GuidelinesWhy Are There Different Treatment Goals?
• Individual goal can vary based on severity of diabetes and presence of other comorbid conditions in an individual patient
• Population goal for a group of diabetic patients does not control for illness severity or comorbid conditions that may make it difficult to attain the lower (Risk adjustment mechanism lacking)
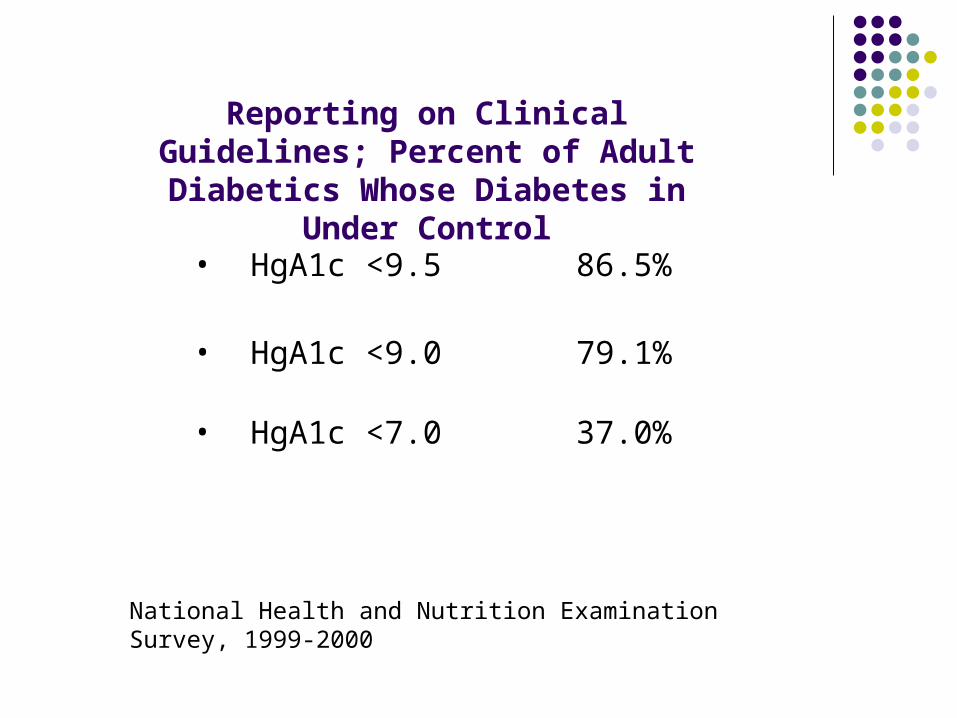
• HgA1c <9.5 86.5%
• HgA1c <9.0 79.1%
• HgA1c <7.0 37.0%
Reporting on Clinical Guidelines; Percent of Adult Diabetics Whose
Diabetes in Under Control
National Health and Nutrition Examination Survey, 1999-2000
Methodological Challenges Resolved? Not Really
Reporting on Race and Ethnicity Expand surveys to collect more data on racial groups Encourage reporting of race and ethnicity on all data
collection systems
Reporting on Socioeconomic Status Support research on optimal measures of
socioeconomic status
Reporting on Clinical Guidelines Institute mechanism in the report development
process that monitors changes in clinical guidelines and performance standards

![Summary Health Statistics for U.S.Children: National ... · PDF file[614.4’273’083] ... Introduction ... Source of Data Health Statistics (NCHS), Centers for source of information](https://static.documents.pub/doc/80x56/5ab596e57f8b9adc638d338c/summary-health-statistics-for-uschildren-national-6144273083-.jpg)


