+ All Categories
Home > Documents > Methodology CITY OF GOODYEAR Capital Improvement …

Methodology CITY OF GOODYEAR Capital Improvement …

Date post: 14-Mar-2022
Category:
Upload: others
View: 2 times
Download: 0 times
Share this document with a friend
125
analysis streets improvement program infrastructure parks public safety resource balance development growth water art mission CITY OF GOODYEAR Capital Improvement Plan Transportation Revenue Funding Improvement fees Methodology revenue Improvement Information future capital forecast data debt project project methodology program data funding tracking analysis future bond technology research indicator future capital infrastructure Capital Performance Priorities fiscal years 2015-2024
Transcript

analysis

streetsim

prov

emen

t

pro

gra

m

infr

ast

ruct

ure

parks

public safety

resource

balance

develo

pm

ent

growth

waterart

mission

CITY OF GOODYEARCapital Improvement

PlanTransportation

Revenue

FundingImprovement

fees

Methodology

revenue

Impro

vem

ent

Information

futu

re capit

al

fore

cast

data

debt

project

project

methodology

pro

gra

m

data

funding

tracking

analy

sis

futu

re

bond

tech

nolo

gy

rese

arc

h

indic

ato

r

futu

re

capit

al

infrastructure

Capit

al

Performance

Priorities

fiscal years 2015-2024


Goodyear City Council FY2015


Goodyear operates under  the Council‐Manager  form of  government.  The City’s 

Charter  provides  for  six  councilmembers  and  a  mayor,  elected  at  large  on  a  

non‐partisan  ballot.  Councilmembers  serve  four‐year  staggered  terms,  and  the 

mayor serves a four year term. The Vice‐Mayor  is elected by the rest of the City 

Council.  


CITIZENS OF GOODYEAR 

BOARD & COMMISSIONS MAYOR & CITY COUNCIL 

CITY MANAGERBrian Dalke 

CITY ATTORNEY Roric Massey 

MUNICIPAL JUDGE Michael Simonson 

Intergovernmental Relations 

Communications 

Assistant to City Manager 

PARKS & REC 

Nathan Torres 

ENGINEERING

Vacant 

Water Resources 

Division 

Municipal 

Services Division 

Environmental 

Services Division 

CITY CLERK 

Maureen Scott 

HUMAN 

RESOURCES 

Lyman Locket 

FIRE 

Paul Luizzi 

FINANCE 

Larry Lange 

DEVELOPMENT SERVICES 

Sheri Wakefield‐Saenz 

DEPUTY CITY MANAGER 

Bob Beckley 

DEPUTY CITY MANAGER 

Wynette Reed 

ITS 

Dan Cotterman 

Municipal Court 

POLICE 

DEPARTMENT 

Jerry Geier 

i

Capital Improvement Plan (CIP) Table of Contents 

Capital Improvement Plan (CIP)  The Capital Improvement Program ……………………………….……………………………………….……………………………….1 

Ten Year Capital Improvement Program ………………………………………………….……………………….…………………….2  Financing the Capital Improvement Program ………………………………………….………………………………………………3  CIP Ten Year Plan Funding Sources ……………………………………………………………………….………….…………….………3  Sources of Funding for CIP………………………………………………………………………….…………………………….……..……..4 

CIP Review …………………………………………………………………………………………………………….………….…………….………5 

Annual CIP 10 Year Plan Review Process ……………………………………………………………….………….…………….………6 

Operating Budget Impacts of the CIP …………………………………………………………………….………….…………….………8  Debt Management Best Practices ………...…………………………………………………………….………….…………….………11 

Capital Improvement Program Project Summary ………………………………………………….………….………….………12 


CIP PROJECTS FY2015 

Art Projects ……………………………………….………………………….……………………………………….……………………………..14 

Parks Projects ………………………………….………………………….……………………………………….…………………………..…..16  Facility & Technology Projects ………….………………………….……………………………………….………….…………………..20 

 Streets Projects ………………………………….………………………….……………………………………….…………………………....23 

Water Projects ………………………………….………………………….……………………………………….……………………………..26 

Wastewater Projects ……………………………………………………………………………….……………………………..…….………38 

Appendix …………….……………………………………………………………………………….……………..…………………….………50   

The Capital Improvement Program (CIP)  The Capital Improvement Program (CIP) is a ten year financial plan designed to create, support, maintain and finance Goodyear’s present and future infrastructure needs. The CIP outlines project costs, funding sources  and  estimated  future  operating  costs  associated with  each  project.  The  plan  is  designed  to ensure that  improvements will be made when and where they are needed and that the City will have the funds to pay for and maintain them.  The CIP is prepared each year for the following (9) years.  The CIP  is updated to  incorporate new funding  information, revised priorities, and Council decisions during the first year of the cycle.  Capital Projects are defined as: (1) one‐time projects; (2) not maintenance related; (3) having assets of significant value;  (4) generally over $50,000;  (5) with an expected useful  life of at  least five years. The CIP is updated annually to ensure that it addresses new and changing priorities within the City. The CIP is a plan. As such, projects are subject to change based on new or shifting service needs, special financing opportunities,  emergency  needs,  or  other  directives  established  by  the Mayor  and  Council.  Because priorities  can  change, projects  included  in outward  planning  years  are  reviewed  and  updated during each  annual  planning  process.  Capital  improvement  projects may  consist  of  street  projects,  fire  and police  facilities,  water  and  wastewater  infrastructure  and  treatment  plants,  parks  and  recreation facilities, land beautification projects and major system enhancements.  The City expends a great deal of effort reviewing and updating this plan to ensure not only that critical needs are being met, but also that the cost, scope, and timing of  projects are coordinated. The effective use of the CIP process provides for project identification, planning, evaluation, scope definition, design, public  discussion,  cost  estimating,  and  financial  planning.  CIP  projects  are  designed  to  prevent  the deterioration of the City’s existing infrastructure and respond to and anticipate the future growth.  The total FY15‐24 plan  is adopted by Council as part of the FY14‐15 Budget.   The total for the 10 year plan  is  $372.6 million.    The  Adopted  FY14‐15  Capital  Improvement  Program  budget  is  $27,988,716; consisting  of  $12.1 million  in  Non‐Utility  Capital  Improvements  and  $15.8 million  in  Utility  Capital Improvements.  The  program  takes  into  consideration  all  known  capital  improvement  needs,  while utilizing available revenue sources to those needs.   

Fund Type   FY15 

General Fund  $9,354,263

General Govt. Impact Fees  $226,808

Parks  Impact Fees  $743,600

Transportation Impact Fees  $1,664,151

Water/WW Enterprise Fund  $284,000

Water Dev. Impact Fees  $6,222,663

Sewer Impact Fees  $4,641,231

Reclaimed Water Impact Fees  $720,000

Police Impact Fees  $200,000

Other Contributions  $3,932,000

TOTAL    $27,988,716 

1


Ten Year Capital Improvement Program (CIP)  In order to meet the future needs of the community, it is necessary to plan for capital improvements far in advance.  The City of Goodyear accomplishes this by preparing a ten year plan.  The plan is dynamic and updated from year to year as we strive to meet the future needs of the City.    In preparing the FY 2015‐24 CIP, projects in the ten year plan have been prioritized based on an analysis of our existing  infrastructure  inventory,  forecast  for future service demand and availability of  funding.  Revenues for the CIP are generated from voter authorized bonds, development  impact fees, one‐time general funds, grants or user fees from municipal utilities.  Non‐Utility Capital Improvement Program The Non‐Utility Capital  Improvement Program provides  for  improvements and/or  construction of  the City’s  street  system; parks and  recreational  facilities;  libraries; police and  fire protection  facilities and equipment; other City owned  facilities and economic  incentives.   Development  impact  fees, one‐time General  Funds  and  General  Obligation  Bonds  are  the  primary  funding mechanism  for  these  capital improvements.   

Utility Capital Improvement Program The  Capital  Improvement  Program  for  the  utility  departments  consists  of  improvements  to  and/or 

construction  of  water  and  wastewater  systems.    These  projects  are  funded  primarily  with development impact fees, enterprise revenues and the issuance of debt such as bonds.    


2

 Capital Budget Process The  FY2014‐15  CIP  budget  was  developed  according  to  the  same  schedule  as  the  City’s  operating budget.    The  foundation  of  the  annual  CIP  is  development  impact  fees,  general  funds  and  general obligations  bonds.  The  development  of  the  CIP  includes  the  update  of  a  citywide  needs  inventory; citizen  input meetings; analysis of  financial and  implementation capacity; City Council workshops and amendments; and public hearings. 

 Financing the Capital Improvement Program  Projects  included  in the CIP will form the basis for appropriations  in the FY15 budget. The first year of the plan is the only year appropriated by City Council; it is called the Capital Budget. The remaining nine years serve as a guide for planning purposes and are subject to review on an annual basis.   Funding  is not guaranteed to occur in the year planned. The final decision to fund a project is made by the Council.  The  City’s  capital  improvement  program  has  a  direct  effect  on  the  operating  budget.  All  newly completed projects must be maintained and if bonds were sold to finance the construction, annual debt service  payments  are  required.  In  addition  to  operation, maintenance,  and  debt  service,  the  capital improvement program  includes pay‐as‐you‐go projects and grant matches that come directly from the operating budget. 

 CIP TEN YEAR PLAN FUNDING SOURCES 

Fund Type   FY15  FY16  FY17  FY18  FY19‐24 

General Fund  $9,354,263  $3,407,264  $5,661,758  $5,271,864   $18,585,438 

Police Impact Fees  $200,000  $2,320,139  $1,020,000     $5,888,685 

Gen. Govt.  Impact Fees  $226,808             

Park & Rec. Impact Fees  $743,600  $415,350  $457,950  $511,200   $12,470,900 

Fire Impact Fees           $4,660,500   $6,177,185 

Streets Impact Fees  $1,664,151  $7,536,233  $3,518,015  $3,607,549   $22,801,254 

Water/WW Ent. Fund  $284,000  $284,000  $284,000  $284,000   $1,704,000 

Water Dev. Impact Fees  $6,222,663  $4,455,228  $5,812,602  $20,134,636   $69,926,950 

Sewer Impact Fees  $4,641,231  $4,618,281  $2,779,921  $8,656,971   $36,444,391 

Recl Water Impact Fees  $720,000             

Developer Contributions  $3,932,000             

GO Bonds           $25,000,000   $17,110,721 

Enterprise Bonds              $42,823,375 

TOTAL   $27,988,716  $23,036,495  $19,534,246  $68,126,720   $233,932,899 


The ten year CIP totals $372,619,076.  


3


  Sources of Funding for CIP  Operating Fund Revenues – Most revenues not earmarked  for specific uses are collected  in the City’s General Fund. This  fund  is used  to support vital government operations. Each year,  the City  identifies any one‐time, non‐recurring revenues from this fund that may be used to support capital needs.  General Obligation Bonds – General Obligation (GO) Bonds require voter approval and finance a variety of public capital projects. These bonds are a common method used to raise revenues for large‐scale city projects.    Revenue Bonds – Revenue bonds can be issued for utility and street operations to support major capital improvements. These bonds are not secured by general  taxing authority. Backing comes  from specific revenues earmarked for their operations. Bond proceeds to support large water and wastewater utility projects are repaid from utility rate revenue. The City can also use Highway User Revenue Fund (HURF) and the gas tax revenue allocation to pay debt service on street revenue bonds.   Grants – Grant funding  is a contribution from one government unit or funding source to another. The contribution is usually made to support a specified program, but may be for more general purposes.    Development  Impact Fees – Development  Impact Fees were adopted by the City Council beginning  in 1986, which  required  new  development  to  pay  its  proportionate  share  of  the  costs  associated with providing  the necessary public  infrastructure. These  fees provide capital  revenues  that are needed  to meet  the  necessary  service  demands  placed  on  the  City  by  new  development.  The  updated  Infrastructure Improvement Plan (IIP) as adopted by Council, is effective August 1, 2014, as mandated by SB1525.   

Development Fees64%

General Fund12%

Developer Contribution

1%

General Obligation (GO) 

Bonds11%

Enterprise Bonds11%

Enterprise Revenue Fund

1%

10‐Year PlanFunding Sources

4

  The City currently has six Development Impact Fee categories.  They include:   Streets  –  Components  for  the  arterial  street  improvements,  regional  transportation 

improvements, traffic signals, and the development fee study. 

Police – Police Stations and the development fee study.   

Fire – Fire Stations and the development fee study. 

Parks and Recreation – Components for community parks, and the development fee study. 

Wastewater – Components for treatment projects, collection projects, and equipment, and the 

development fee study.  

Water – Components for water development and water resource projects, support facilities, and 

equipment, and the development fee study.  

Developer Contributions – Developers may provide the City with cash, certain assets, or services as part of  obtaining  a  right  to  develop  land.  Contributions  are  collected  to  ensure  that  infrastructure  and community facilities support the needs of our growing community.    Improvement District  Funds  –  Improvement Districts  are  formed  by  a  group  of  property  owners  to share  in  the cost of  infrastructure  improvements  to  their property. Bonds are  issued  to  finance  these improvements, which are  repaid by assessments on affected properties.  Improvement District debt  is paid for by a special assessment made against affected properties to defray all or part of the cost of a specific capital improvement or service deemed to benefit primarily those properties.   Community Facilities Districts – (CFDs) provide a funding mechanism to finance construction, operation, and maintenance of public infrastructure within the boundaries of the community facilities district, and to better enable the City to provide municipal services within the boundaries of the district. The Council has  established  policy  guidelines  and  application  procedures  on  establishment  of  CFDs.  The  City currently has ten CFDs.  

CIP Review  

The  CIP  Review  Committee  meets  regularly  as  part  of  an  annual  process  for  developing  and implementing  a  capital  improvement  plan.  This  Committee  consists  of  the  Deputy  City  Manager, Executive  Management  Assistant,  Budget  Manager,  Finance  Director,  Budget  &  Research  Analyst, Assistant  City  Attorney,  Grants  Administrator,  Parks  &  Recreation  Director,  Engineering  Director, Development  Services Director, Environmental  Services Division Manager, Municipal  Services Division Manager, Water Resources Manager, and IT Manager. The committee  is responsible for reviewing and prioritizing  capital  project  requests  and  creating  the  draft  capital  budget  and  ten‐year  capital improvement  plan.  The  ten‐year  capital  improvement  plan  is  presented  to  the Mayor  and  Council annually for adoption.    Requests are submitted on a CIP request form with detailed information about a project. All information included  in  this  form  is  important  in assisting  the Committee  to determine  the priority. The  following information should be included on each project submitted for funding.    

5

Prepare Revenue Projection

CIP Committee Prioritize Projects Create 1st Draft

City Management Review

Present Draft to Council

Adopt Tenative Plan, May

Adopt Final Plan with Budget, June

  Project start date  Project completion date  Location of the project  Project manager/owner  Brief description  Timelines  Categories  that need  funding  i.e.  land, design,  construction,  art or  furniture,  fixtures, 

and equipment  Revenue sources i.e. IGA’s, grants, contribution, bonds, etc.  Projected accomplishments or benefits in line with Master Plans or City goals 

 The capital planning process not only provides an orderly and routine method for planning and financing of  capital  improvements,  but  the  process  also  makes  capital  expenditures  more  responsive  to community needs by informing and involving the public. By prioritizing projects according to criteria that are grounded  in the City’s mission and plans, the CIP process also creates a more understandable and defensible  investment  in the decision making process,  improves  linkages between capital  investments, and the City’s long‐term vision and goals, and builds citizen confidence by making more efficient use of City resources. Existing projects are reviewed annually to monitor their progress. Determining how and when to schedule projects  is a complicated process.  It must take  into account all of the variables that affect the City’s ability to generate the funds to pay for these projects without jeopardizing its ability to provide routine, ongoing services and one‐time or emergency services when needed.     

           Annual CIP 10 year plan review process   The CIP brings together projects and needs identified through several capital planning processes. Master plans,  citizen’s  requests,  safety  needs,  planned  rehabilitation  cycles  and  repair  and  maintenance schedules are projects that are proposed for funding.  The CIP brings together projects and needs identified through several capital planning processes. Master plan, the General plan, citizens’ requests and safety needs.  

6

The City of Goodyear is currently updating the City’s General Plan and several Master Plans to meet the needs of  the Community  at  large.  These plans provide  the  foundation  for both  short  term  and  long range  planning  of  land  use  and  infrastructure  needs.  They  provide  project  priorities,  timing  and implementation strategies. Planning is critical to ensure a sustainable future for the City of Goodyear.    Planning efforts such as those encompassed by the city’s General Plan and various master plans provide the city with an important planning tool.  Goodyear General Plan  The City is required by Arizona Revised Statues to update the General Plan at least every ten years. The current General Plan was approved in November 2003. Although an update was due by 2013, the State Legislature approved a bill that extends the deadline until July 2015. The Goodyear General Plan 2025 update started in September 2012 and is expected to be completed by fall of 2014. This update will not only  revisit  the  elements  contained within  the  current General  Plan,  but will  add  a  number  of  new elements which are required now that the city’s population exceeds 50,000. The General Plan is a long‐range policy document that expresses a city's development goals, policies, and objectives relative to the distribution of future  land uses, both public and private, as well as a number of other topics. Although each element of the plan addresses a different topic, they work together to form a future vision of the community and highlight the goals and policies of the City.  Parks and Recreation Master Plan  The  purpose  of  the  City’s  Parks  and  Recreation  Master  Plan  is  to  guide  the  development  and preservation  of  all  city  parks  through  the  community.  The  community  driven  plan  provides  the framework within each new development, rather than merely considering them as afterthoughts of the development process. The citizens of Goodyear and surrounding communities will benefit through the use of the athletic facilities, open spaces, and recreational opportunities that have been envisioned and incorporated into the elements of this type of plan.  Transportation Master Plan   The transportation master plan will provide direction and guides the development and delivery of the transportation system. The transportation system includes public streets and public transit. This plan will identify projects, priorities and programs. The public will benefit from the systematic planning of public streets and public transit to ensure that the short‐term and long‐term needs of the City are met through responsible planning and prioritization of transportation projects.   

 Brine Management Study ‐ Deep Well Injection  The  City  of Goodyear  intends  to  partner with  ADEQ  and  other  interested  Valley  Cities  to  study  the viability of deep well  injection  for disposal of brine  from  the Bullard Water Campus Reverse Osmosis (RO) Facility. The City  is  looking  to define  the permitting requirements  for  implementation of  the  full‐scale program, should the study prove that deep well  injection of brine  is environmentally, financially, and technically feasible. 


7

 Integrated Water Master Plan  

 The proposed  Integrated Master Plan will update,  replace,  and expound upon  the City's 2007 Water Master Plan, related 2013 Integrated Master Plan updates, and 2013 hydrolic water modeling data/2020 Assured Water Supply analysis.  The purpose of the Integrated Utility Master Plan is to provide a unified planning effort that addresses all of the City's water, wastewater and reuse water systems to: 1) address recent development changes that have affected short and long term demand projections, 2) provide the guidance for the orderly expansion for all of the City's water systems, and 3) address how to maintain the  reliability  of  the  existing  infrastructure.  Technical memoranda will  be  prepared  for  each  section including water resources, water system, wastewater system, and reclaimed water system.  In addition to the Master Plan report, the City is seeking a master planning tool that stays current, can be evaluated at anytime, and provide scenarios and analysis specified by city staff.    Ideally, the data will be housed within a sequel database server whereby  it  is  integrated  into the CIty geographical  information system (GIS) for spatial and temporal analysis and displays. 

 Operating Budget Impacts of the CIP  Although  the Capital  Improvement Program  is prepared separate  from  the operating budget,  the  two have a direct  relationship. Budget appropriations  lapse at  the end of  the  fiscal year, however, capital appropriations  are  re‐budgeted  (carryover  funding)  until  the  project  is  finished  and  capitalized.  As capital  improvements  are  completed, operating  cost  considerations  for  all new CIP projects must be absorbed  in  the  operating  budget,  to  provide  on‐going  services  to  citizens.  Most  new  capital improvement projects have ongoing expenses  for  routine maintenance and operation of  facilities and equipment including utilities, staffing, repair and maintenance and fuel for heavy equipment. The costs of  future operations and maintenance  for new CIP projects are estimated based on past expenditures and anticipated increase in materials, labor and other related costs.  Operating  costs  associated  with  capital  projects  would  include  one‐time  items  such  as  operating equipment and others that are on‐going such as: new positions, contract services, utility costs, custodial or landscaping maintenance, office or chemical supplies.   There are a number of projects in the CIP that will require substantial operating funds. The following CIP projects could have a significant impact on the operating budget.   

New well installations  Expansion of a wastewater treatment plant  Street/Sanitation Equipment  New facilities – police, fire, city buildings 

 CIP  projects may  or may  not  include  operation  and maintenance  costs  depending  on  the  type  and timeline  of  projects  being  funded. Operation  and maintenance  costs may  not  be  required  until  the second or third year after completion. Below are several expense categories that need to be considered when approving a CIP project.     

8


Staffing – the estimated salary and benefits  Supplies/Contracts – professional services; supplies and postage  Utilities – based on facility size, hours of operation and types of systems used, number 

of staff and customers frequenting the facility  Building Maintenance – personnel and equipment costs  including electrical, plumbing, 

carpentry, painting, service vehicles, supplies and custodial services  Equipment Maintenance – specialized equipment, maintenance and repairs  Insurance: Fire and Liability – personnel and property  Electrical – maintain security and electronic systems Information   Technology – cost of new or replacement equipment  Vehicles – purchase cost, annual replacement, repairs and maintenance, and fuel  Landscape – maintenance, water rate, right‐of‐way costs  Water – water usage based on prior size and costs  Refuse – costs to provide trash services based on use   

  These operating costs are carefully considered  in deciding which projects move forward  in the CIP. This process ensures  the  city’s operating budget  is able  to absorb  the additional  costs. City Council  should carefully stagger capital projects so the operating impacts are manageable.    CIP projects  involving  land acquisitions or water rights  for  future needs  increase costs  in  the operating budget. Maintenance  costs  such  as  fencing,  security  and  weed  control  can  increase  operating  costs without receiving any benefits or revenue from the projects at the time of purchase. Many improvements make a positive contribution to the fiscal well being of the city and therefore help promote the economic development and growth that generates additional operating revenues. These new revenue sources can potentially provide the funding needed to maintain, improve and expand the city’s infrastructure. 

 Bond financing is primarily used to finance long term capital projects. The City’s debt plan analysis and bonding  limits  are  determined  by  State  statutes,  available  revenues,  ability  to  pay,  and  existing outstanding debt. When deciding which debt  financing alternative  is best when planning  future bond sales and identifying available revenues for servicing principal and interest payments, there are several types of bonds. In the Capital Improvement Plan over the next five years, there are no new bond sales planned.  

General Obligation Bonds (GO)  All projects funded with General Obligation bonds require voter approval through a city‐wide election. GO Bonds are backed by the taxing authority of the City.   State law states the total value of General Obligation bonds issued for capital improvement projects for water, wastewater,  artificial  light,  open  spaces,  parks,  playgrounds,  and  recreational  facilities,  public safety,  law enforcement, fire and emergency services facilities, and streets and transportation facilities cannot exceed 20% of the assessed valuation. The total value of General Obligation bonds issued for all other purposes other than those listed above cannot exceed 6% of the assessed valuation.    

9

GENERAL OBLIGATION BOND RATING (GO)  

Moody’s  Aa2 Standards  AA 

PUBLIC IMPROVEMENT CORPORATION (PIC) BOND  

Moody’s  Aa3 Standards  AA‐ 

REVENUE BOND RATING  

Moody’s  A2 Standards  AA‐ 

  The City has its general obligation credit reviewed by 2 national bond rating agencies. In February 2014, the Cities GO bond ratings were upgraded by Standard & Poor. These increases in ratings will generate significant savings for the City of Goodyear in favorable interest rates.    

      Revenue Bonds  Revenue bonds are used to finance projects that have an identifiable revenue source. Most are used to fund utility projects, backed by user fees of the utility.  Revenue bonds also require voter approval, and are  limited only by  the ability of  the  revenue  source  to  support  the debt  service. Like GO bonds,  the interest rate is determined by the bond rating. In March 2014, Goodyear’s rating was raised by Standard & Poor. 


 Public Improvement Corporation (PIC) Bond  Public  Improvement Corporation  (PIC)  is  a non‐profit  corporation  created by  the City  as  a  financing mechanism  for  the purpose of  financing  the  construction or acquisition of City  capital  improvement projects.  PIC  bonds  are  secured  by  excise  tax  or  other  undesignated General  fund  revenues.  These bonds can be issued without a vote of the citizens and without limitation as to interest rate or amount. 


10

IMPROVEMENT DISTRICT BOND RATING 

 Moody’s  A1 

Standards  A 

 Improvement District Bonds  Improvement District bonds  are used  to  finance  infrastructure projects  for multiple property owners that have created an Improvement District. The creation of the district requires a majority of the owners within  the proposed district  to agree on  the  formation of  the district. The debt service  is paid by  the collection  of  property  assessments  levied  on  the  property  within  the  district.  In  February  2014, Goodyear’s rating was raised by Standard & Poor.        

  Water Infrastructure Finance Authority (WIFA)  WIFA is a low interest loan provided by the Arizona Clean Water State Revolving Fund. These funds are eligible to fund: water and energy efficiency projects, green  infrastructure, construction of wastewater treatment  plants,  wastewater  facilities  expansions,  water  reclamation  facilities  expansions  and construction of district sewer collection systems.   

DEBT MANAGEMENT BEST PRACTICES  

Debt will only be used  to  finance  long  term capital  improvement projects and will not be used  to finance reoccurring operating expenses. 

Debt term should match useful life of the project. 

All  projects  funded with  GO  bonds  can  only  be  undertaken  after  voter  authorization  through  a citywide election.   

State  law  states,  the  total  value of GO bonds  issued  for  capital  improvement projects  for water, wastewater, artificial light, open spaces, parks, playgrounds, and recreational facilities, public safety, law  enforcement,  fire  and  emergency  services  facilities,  and  streets  and  transportation  facilities cannot  exceed  20%  of  the  assessed  valuation.  The  total  value  of GO  bonds  issued  for  all  other purposes other than those listed above cannot exceed 6% of the assessed valuation.


11

AD

OP

TED

10-Y

EA

R P

LAN

Adopted10-Year Plan

Project TypeProject No. FY15 FY16 FY17 FY18 FY19 - 24

Total Estimated Funding

Non-UtilityArt Projects

Art Projects $60,000 $60,000 $60,000 $60,000 $360,000 $600,000

Subtotal Art Projects $60,000 $60,000 $60,000 $60,000 $360,000 $600,000

Parks Projects

Median Improvements to unimproved areas (4 identified areas) (Phase I) $381,500 $381,500

Newland Reimbursement EMR Park $362,100 $415,350 $457,950 $511,200 $2,687,358 $4,433,958

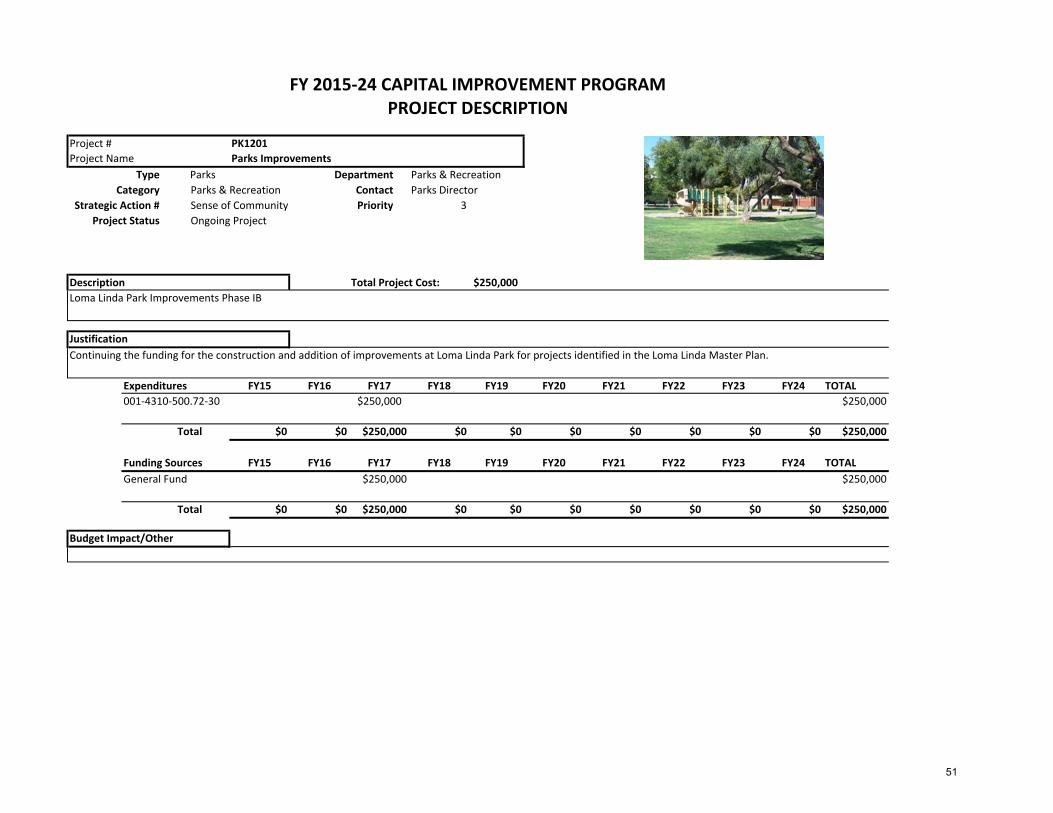
Park Improvements $250,000 $250,000 $250,000 $750,000

Lighting Improvements $450,000 $450,000

Loma Linda Park Improvements $250,000 $250,000

Community Recreation Center (Multi-Gen) $1,021,071 $ 1,361,428 $ 701,758 $2,042,142 $4,753,601 $9,880,000

Playground equipment $480,000 $480,000

Irrigation Improvements (Parks Rights of Way) Phase II $463,000 $463,000Improvements to medians, rights of way and park landscaping Various Locations (Phase II) $824,275 $824,275

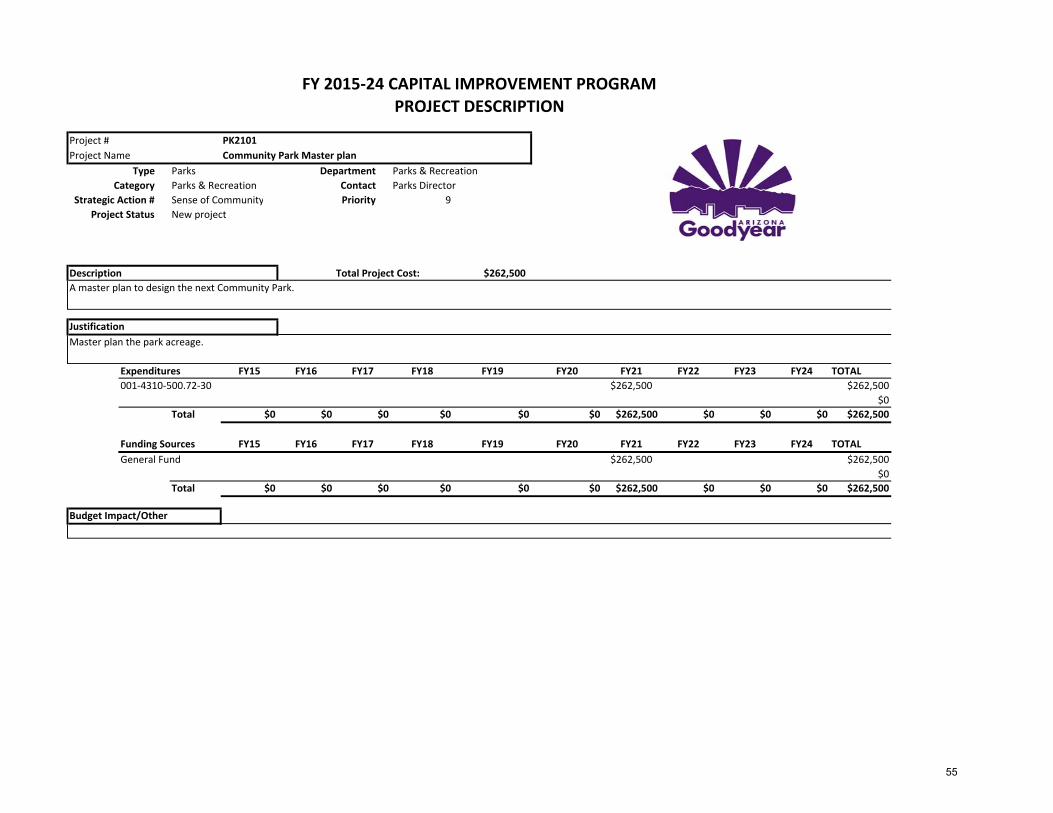
Community Park #1 Master Plan $262,500 $262,500

Central Goodyear 30 acre Park (Community Park #1) $9,521,042 $9,521,042

Subtotal Parks Projects $2,014,671 $2,476,778 $1,409,708 $2,803,342 $18,991,776 $27,696,275

Facility & Technology Projects

ERP Solution $4,500,000 $4,500,000

Police Building (operations) $3,950,000 $3,070,139 $750,000 $4,808,685 $12,578,824

Police Apparatus $270,000 $1,080,000 $1,350,000

City Hall $25,000,000 $17,110,721 $42,110,721

Fire Station Harrison & Citrus $4,020,000 $4,020,000

Fire Apparatus $640,500 $2,157,185 $2,797,685

Fire Station Willis & Rainbow Valley Rd. $4,020,000 $4,020,000

Subtotal Facility & Technology Projects $8,450,000 $3,070,139 $1,020,000 $29,660,500 $29,176,591 $71,377,230

Streets Projects

Fiber Project: Loop 303 (Camelback and Indian School) $63,291 $63,291

Newland Reimbursement Cotton Lane Bridge $400,860 $459,810 $506,970 $565,920 $707,400 $2,640,960

Traffic Signals: Indian School & Cotton $1,200,000 $1,200,000

Bullard Ave & VanBuren Intersection Improvements $350,000 $650,000 $1,000,000

Fiber Project: Van Buren Street, Estrella Pkwy to Cotton Lane $ 185,836 $185,836

Sarival Ave: I-10 to Van Buren St $ 2,712,123 $1,800,000 $4,512,123

Van Buren St. @ Litchfield Road $ 2,364,300 $2,364,300

Van Buren: Estrella to Sarival (design incl intersection) $ 2,000,000 $2,000,000

Pavement Management Program $3,000,000 $2,810,156 $8,511,562 $14,321,718

Yuma Rd. @ Bullard Ave. (intersection Improvements) $1,289,145 $724,855 $2,014,000

Sarival Ave. Jefferson St. to Yuma Rd $1,721,900 $1,721,900

West Airport Enterance $1,000,000 $1,000,000

Citrus Rd: McDowell Rd to Van Buren St $2,316,774 $1,760,126 $4,076,900Fiber Project: Yuma (Estrella to Cotton) and Cotton (Yuma to Canyon Trails Blvd/Lilac St) $109 566 $109 566

CAPITAL IMPROVEMENT PROGRAM PROJECT SUMMARY

Blvd/Lilac St) $109,566 $109,566

Citrus & Van Buren St. $491,899 $491,899

McDowell Rd @ Citrus Rd. $1,656,900 $1,656,900

Indian School Rd @ Cotton Lane $1,729,700 $1,729,700

McDowell Rd: Citrus to Loop 303 $4,945,922 $4,945,922

3 signlization EMR along Estrella Parkway $1,200,000 $1,200,000

Traffic Signals $0

Yuma Cotton Lane to Sarival $2,193,000 $2,193,000

Indian School: Loop 303 to west of Sarival Rd. (imp to 4 lanes) $1,983,500 $1,983,500

Willis Road: Callistoga to Rainbow Valley $3,926,000 $3,926,000

Van Buren St. Citrus Rd to Cotton Ln. $960,807 $960,807

Yuma Road Bridge @ Bullard Wash $1,000,000 $1,000,000

MC85 @ Estrella Pkwy $1,639,000 $1,639,000

Subtotal Streets Projects $1,664,151 $8,072,069 $8,168,015 $6,527,271 $34,505,816 $58,937,322

Subtotal Non-Utility $12,188,822 $13,678,986 $10,657,723 $39,051,113 $83,034,183 $158,610,827

12

Project TypeProject No. FY15 FY16 FY17 FY18 FY19 - 24

Total Estimated Funding

CAPITAL IMPROVEMENT PROGRAM PROJECT SUMMARY

Utility

Water Projects

Well & Treatment facility (Developer Contribution) $3,932,000 $3,932,000

CAP Subcontract Capital Charges WA0510 $284,000 $284,000 $284,000 $284,000 $1,704,000 $2,840,000

Intergrated Water Master Plan $720,000 $720,000

EPCOR Install of 36" transmission line from EPCOR to West Goodyear (5MGD) (CAP Water) $1,000,000 $7,051,754 $7,975,565 $16,027,319

Well #3 2 MGD $1,293,000 $1,293,000

Well #3 Arsenic Treatment 1.5 MGD $4,300,000 $4,300,000

Lower Buckeye & Cotton Site 12 Booster 9 MGD $2,078,000 $2,078,000

Citrus & Harrison - Silva Site Booster 6MGD $1,778,000 $1,778,000

Citrus & Harrison Silva Site Reservoir 2MG (same as West Goodyear 2MG Storage and Booster) $4,060,000 $4,060,000

Citrus Harrison - Silva Site Booster 2 MG $889,000 $889,000

Well #4 2 MGD $1,293,000 $1,293,000

Well #4 Arsenic Treatment 2 MGD $4,920,000 $4,920,000

Site 18 Reservoir 2.0 MGD $1,500,000 $1,500,000

Well #5 2 MGD $1,293,000 $1,293,000

Well #5 Arsenic Treatment 2 MGD $4,920,000 $4,920,000

Van Buren Citrus to 175th (West Goodyear Dev. Agreement) $89,816 $89,816 $89,816 $89,816 $89,816 $449,080

Van Buren Citrus to RID (West Goodyear Dev. Agreement) $132,963 $132,963 $132,963 $132,963 $132,963 $664,815

Yuma Citrus to 183rd (West Goodyear Dev. Agreement) $89,286 $89,286 $89,286 $89,286 $89,286 $446,430

Yuma 183rd to Perryville (West Goodyear Dev. Agreement) $89,286 $89,286 $89,286 $89,286 $89,286 $446,430

Durango 185th to Citrus (West Goodyear Dev. Agreement) $96,586 $96,586 $96,586 $96,586 $96,586 $482,930

Perryville Yuma to W Amber (West Goodyear Dev. Agreement) $136,392 $136,392 $136,392 $136,392 $136,392 $681,960

Citrus Broadway to 175th & Elwood (West Goodyear Dev. Agreement) $166,323 $166,323 $166,323 $166,323 $166,323 $831,615

Lower Buckeye & Cotton Site 12 Booster 4 MGD $1,810,000 $1,810,000

EPCOR 2nd Transmission Line & WTP (6.7 MD) Full Capacity $46,966,000 $46,966,000

RO Facility $7,635,514 $7,635,514

Southern Solutions Brine Beds $4,718,934 $4,718,934

Transmission Mains $4,685,295 $4,685,295

Cotton Lane "20 Transmission Main 1900000 $1,900,000

Rainbow Valley & Site 13 Booster $1,750,000 $1,750,000

Southern Solution Well #1 $1,750,000 $1,750,000

Southern Solution Well #2 $1,750,000 $1,750,000

Southern Solution Well #3 $1,750,000 $1,750,000

Site 13 storage tank $1,500,022 $1,500,022

12" Brine Line $1,275,928 $1,275,928

Estrella Parkway Transmission Main $1,052,189 $1,052,189

Cotton Ln to Site 13 $720,000 $720,000

Southern Solution Raw Water Storage tank $500,000 $500,000

Southern Solution (development & Design) $433,162 $433,162

Waterman Facilities Site Plan $277,084 $277,084

Site 13 Offsite $270,000 $270,000

R i b V ll (2500 ) $200 000 $200 000Rainbow Valley pump (2500 gpm) $200,000 $200,000

Waterman - complete above design $150,000 $150,000

Southern Solution Raw Water Tank $150,000 $150,000

Parallel main to park building $125,000 $125,000

Newland Zone 3 Reimbursement $3,029,910 $3,340,670 $3,729,120 $4,661,400 $2,000,000 $16,761,100

Transfer To Debt Svc (WIFA) #1 $314,101 $313,906 $282,830 $282,830 $1,696,980 $2,890,647

Subtotal Water Projects $11,158,663 $4,739,228 $6,096,602 $20,418,636 $114,454,325 $156,867,454

Wastewater Projects

183rd Ave & Yuma IIP $187,305 $187,305 $187,305 $187,305 $187,305 $936,527

Citrus/Lower Buckeye Line IIP $142,907 $142,907 $142,907 $142,907 $142,907 $714,533

Corgett RF Expansion IIP $6,200,000 $6,200,000

Durango Line IIP $69,216 $69,216 $69,216 $69,216 $69,216 $346,079

E Lower Buckeye Line IIP $116,376 $116,376 $116,376 $116,376 $116,376 $581,880

Effluent Injection Wells IIP $500,000 $500,000 $1,000,000

GWRF Expansion IIP $2,000,000 $1,400,000 $5,800,000 $20,600,000 $29,800,000

Las Brisas (West Goodyear D.A.) IIP $270,940 $270,940 $270,940 $270,940 $270,940 $1,354,698

Lower Buckeye Line (West Goodyear D.A.) IIP $217,468 $217,468 $217,468 $217,468 $217,468 $1,087,342

N. Citrus (Las Palmas) (West Goodyear D.A.) IIP $187,305 $187,305 $187,305 $187,305 $187,305 $936,527

N. Citrus Line (West Goodyear D.A.) IIP $187,305 $187,305 $187,305 $187,305 $187,305 $936,527

Newland Reimbursement IIP $523,940 $600,990 $662,630 $739,680 $4,777,100 $7,304,340

S. Citrus Line (West Goodyear D.A.) IIP $141,259 $141,259 $141,259 $141,259 $141,259 $706,295

S. Citrus Line (West Goodyear D.A.) IIP $147,210 $147,210 $147,210 $147,210 $147,210 $736,049

Transfer to Wastewater Fund (debt service) IIP $450,000 $450,000 $450,000 $450,000 $2,700,000 $4,500,000

Subtotal Wastewater $4,641,231 $4,618,281 $2,779,921 $8,656,971 $36,444,391 $57,140,797

Subtotal Utility $15,799,894 $9,357,509 $8,876,523 $29,075,607 $150,898,716 $214,008,251

Total Funding $27,988,716 $23,036,495 $19,534,246 $68,126,720 $233,932,899 $372,619,078

13

Arts

AR

TS

AT0701

10

W MC 85

W MC 85

NSa

riva l

Ave

W Broadway Rd

SLitc

hfield

Rd

W Van Buren St

W Vineyard Ave

W Thomas Rd

W Mcdowell Rd

NEs

trella

Pkwy

NL it

chf ie

ldR d

NCo

t tonL

n

S Cotton Ln

NBu

l lard

Ave NDy

sart

RdW Elwood St

W Southern Ave

S143rd Ave

W Wigwam Blvd

SSa

rival

Ave

SDys

artR

d

W Yuma Rd

SCi

t rusR

d

SBu

llard

Ave

S Estre

llaPk

wy

W Indian School Rd

W Indian Springs Rd

W Virginia Ave

W Mcdowell Rd

N Pebblecreek Pkwy

N Ci

trus R

d

City of Goodyear CIP Projects FY 2015

0 0.45 0.90.225Miles

LegendCIP ProjectsProject Type

Art Project

Art

Number DescriptionAT 1 AT0701 Public Art, City Wide (City Hall)

14

Project # AT0701

Project Name Art Projects 

Type      Arts Department      Parks & Recreation

Contact      Arts Coordinator

Category      Arts Priority     

Strategic Action #           Sense of Community

Project Status           Ongoing Project

Description Total Project Cost: $600,000

Art projects will be identified in conjunction with Arts & Culture Commission and the Arts & Culture Strategic Plan.

Justification

Allocation for Public Art projects related to % for Art Ordinance.

Expenditures FY15 FY16 FY17 FY18 FY19 FY20 FY21 FY22 FY23 FY24 TOTAL

Acct # $60,000 $60,000 $60,000 $60,000 $60,000 $60,000 $60,000 $60,000 $60,000 $60,000 $600,000

Acct #

Total

Useful Life     

FY 2015‐24 CAPITAL IMPROVEMENT PROGRAM                                           

PROJECT DESCRIPTION

Funding Sources FY15 FY16 FY17 FY18 FY19 FY20 FY21 FY22 FY23 FY24 TOTAL

Acct # $60,000 $60,000 $60,000 $60,000 $60,000 $60,000 $60,000 $60,000 $60,000 $60,000 $600,000

Acct #

Total

Budget Impact/Other

15

Parks

PAR

KS

PK1401PK1402 PK1501

10

W MC 85

NSa

rival

A ve

W Broadway Rd

SLitc

hfield

Rd

W Vineyard Ave

NEs

t rella

Pkwy

NDy

sart

R d

NBu

llard

A ve

NLit

chfi e

ldR d

NCo

ttonL

n

S Cotton Ln

W Elwood St

W Van Buren St

S 143rd Ave

S Sar

ivalA

ve

SDy

sart

Rd

W Yuma Rd

W Indian Springs Rd

SBull

ardA

ve

S Estre

llaPk

wy

W Mcdowell Rd

Bullard Wash

City of Goodyear CIP Projects FY 2015

0 0.35 0.70.175Miles

LegendCIP ProjectsProject Type

Park ProjectParks

Number DescriptionPK 1 PK1401 Park Improvements, Master Plan Implementation, City Wide (City Hall)PK 2 PK1402 Median Improvements to unimproved areas Van Buren Median from 146th to Bullard WashPK 3 PK1501 Recreation Complex (TBD)

16

Project # PK1401

Project Name Parks Improvements

Type      Parks Department      Parks & Recreation

Category           Parks & Recreation Contact      Parks Director

Strategic Action #           Sense of Community Priority      2

Project Status           Ongoing Project

Description Total Project Cost: $750,000

Park improvements

Justification

Funding for the construction and addition of improvements at city parks for projects recommended by the Parks Improvement Master Plan.

Expenditures FY15 FY16 FY17 FY18 FY19 FY20 FY21 FY22 FY23 FY24 TOTAL

001‐4310‐500.72‐30 $250,000 $250,000 $250,000 $750,000

Total $250,000 $250,000 $250,000 $750,000

FY 2015‐24 CAPITAL IMPROVEMENT PROGRAM                                                    PROJECT DESCRIPTION

Funding Sources FY15 FY16 FY17 FY18 FY19 FY20 FY21 FY22 FY23 FY24 TOTAL

General Fund $250,000 $250,000 $250,000 $750,000

Total $250,000 $250,000 $250,000 $750,000

Budget Impact/Other

17

Project # PK1402Project Name Median Improvements

Type      Parks Department      Parks & RecreationCategory           Parks & Recreation Contact      Parks Director

Strategic Action #           Sense of Community Priority      3Project Status           Ongoing Project

Description Total Project Cost: $381,500Median Improvements to unimproved areas;  1) Van Buren median from 146th to Bullard Wash; 2) Bullard Ave median from Yuma to turn by Ballpark; 3) Estrellaparkway Vineyard to Star Tower; 4) Pebble Creek median from Virginia to APS sub station

JustificationThis project enhances the overall appearance of the City.

Expenditures FY15 FY16 FY17 FY18 FY19 FY20 FY21 FY22 FY23 FY24 TOTAL001‐4310‐500.72‐30 $381,500 $381,500

Total $381,500 $0 $0 $0 $0 $0 $0 $0 $0 $0 $381,500

Funding Sources FY15 FY16 FY17 FY18 FY19 FY20 FY21 FY22 FY23 FY24 TOTALParks Impact Fees $381,500 $381,500

Total $381,500 $0 $0 $0 $0 $0 $0 $0 $0 $0 $381,500

Budget Impact/Other

FY 2015‐24 CAPITAL IMPROVEMENT PROGRAM                                                          

18

Project # PK1501

Project Name Recreation Complex

Type      Facility Department      Parks & Recreation

Category      Parks & Recreation Contact      Parks Director

Strategic Action #      Sense of Community Priority     

Project Status      New project

Description Total Project Cost: $9,880,000

30,000 square foot Recreation Complex Building with indoor gym, weight/fitness room and classrooms

Justification

 programs.  A Recreation Complex is identified in the Parks & Recreation Master Plan.

Expenditures FY15 FY16 FY17 FY18 FY19 FY20 FY21 FY22 FY23 FY24 TOTAL

440‐4310‐500‐72.30 $1,021,071 1,361,428$   701,758$  $2,042,142 $3,382,499 $8,508,898

001‐4310‐500‐72.30 $1,326,445 $44,657 $1,371,102

Total $1,021,071 $1,361,428 $701,758 $2,042,142 $3,382,499 $0 $0 $0 $0 $0 $9,880,000

FY 2015‐24 CAPITAL IMPROVEMENT PROGRAM                                                                 PROJECT DESCRIPTION

Goodyear currently has one community center in Loma Linda park.  The YMCA on Litchfield Road meets some community needs, but does not have a gym.  This project would create a Recreation 

Complex to meet the needs of the diverse citizenry of Goodyear and provide needed classroom space for Goodyear resident recreation and leisure

Funding Sources FY15 FY16 FY17 FY18 FY19 FY20 FY21 FY22 FY23 FY24 TOTAL

Ballpark setaside (GF) $1,021,071 1,361,428$   701,758$  $2,042,142 $3,382,499 $8,508,898

General Fund $1,326,445 $44,657 $1,371,102

Total $1,021,071 $1,361,428 $701,758 $2,042,142 $3,382,499 $0 $0 $0 $0 $0 $9,880,000

Budget Impact/Other

Ongoing staffing costs are estimated to be $470,000; maintenance costs are estimated at $257,600 annually.

19

Facilities andTechnology

FAC

ILITIES A

ND

TECH

NO

LOG

Y

FA1404TC1301

10

W MC 85

NSa

rival

Ave

W Broadway Rd

SLit

chfie

ldRd

W Vineyard Ave

NEs

trella

Pkw y

NDy

sar t

R d

NB u

ll ard

Ave

NLit

chfie

ldR d

NCo

ttonL

n

S Cotton LnW Elwood St

W Van Buren St

S 143rd Ave

SSa

rival

Ave

SDy

sart

Rd

W Yuma Rd

W Indian Springs Rd

SBull

ardA

ve

S Estre

llaPk

wy

W Virginia Ave

W Mcdowell Rd

City of Goodyear CIP Projects FY 2015

0 0.35 0.70.175Miles

LegendCIP ProjectsProject Type

Facility Project

Facility & Technology

Number DescriptionFA 1 FA1404 Police Building (TBD - City Hall)TC 1 TC1301 Business Solutions Replacement , Enterprise Resource Planning, City Hall

20

Project # FA1404

Project Name Police Operations building

Type      Facility Department      PD

Category      Police Department Contact      Police Chief

Strategic Action #      Quality of Life Priority      1

Project Status      New Project

Description Total Project Cost: $12,578,821

Patrol Operations Building to contain facilities/rooms for prisoner processing with pre‐booking, AFIS/fingerprinting and holding (including sight and sound separation of adult 

 and juvenile suspects). Building includes suspect and witness interview rooms, evidence and property, forensics Lab,  specialized patrol functions, multi‐lane indoor 

firing range, quartermaster supply, offices for patrol.

Justification

The current patrol operations functions are scattered among multiple older buildings limiting the Police Department's ability to respond to growing needs such as secure 

holding for juveniles, securing processing of prisoners, and the safety of officers utilitizing the squad room.  One patrol operations building will maximize the efficiency 

of police operations/increase interactivity between divisions and provide necessary speciality facilities for evidence processing, adult and juvenile holding, as well as 

modern and secure area for patrol officers. 

Expenditures FY15 FY16 FY17 FY18 FY19 FY20 FY21 FY22 FY23 FY24 TOTAL

145‐2110‐500.74.35 $750,000 $2,704,736 $669,116 $223,047 $1,211,783 $5,558,682

FY 2015‐24 CAPITAL IMPROVEMENT PROGRAM                                                              PROJECT DESCRIPTION

145 2110 500.74.35 $750,000 $2,704,736 $669,116 $223,047 $1,211,783 $5,558,682

001‐2110‐500.74.35 $3,950,000 $3,070,139 $7,020,139

Total $0 $0 $750,000 $0 $0 $2,704,736 $669,116 $223,047 $1,211,783 $0 $12,578,821

Funding Sources FY15 FY16 FY17 FY18 FY19 FY20 FY21 FY22 FY23 FY24 TOTAL

Police Impact Fees $750,000 $2,704,736 $669,116 $223,047 $1,211,783 $5,558,682

General Fund $3,950,000 3070139 $7,020,139

Total $0 $0 $750,000 $0 $0 $2,704,736 $669,116 $223,047 $1,211,783 $0 $12,578,821

Budget Impact/Other

21

Project # TC1301

Project Name ERP

Type      Technology Department      ITS

Category      Technology Contact      IT Director

Strategic Action #      Fiscal & Resource Management Priority      1

Project Status      Ongoing project

Description Total Project Cost: $4,500,000

Upgrade/replace the current Business Solution, H.T.E. and other apps used for Acctg and Budget, Utility Billing, Payroll, Purchasing, Planning & Engineering, Building 

Permits , Business License and Code Enforcement.  Also includes vendor solicitation, electronic timesheets, and Human Resources Information System.

Justification

More productive/efficient business process resulting in improved city fiscal and resource management.

Expenditures FY15 FY16 FY17 FY18 FY19 FY20 FY21 FY22 FY23 FY24 TOTAL

122‐1740‐500‐74.35 $0

001‐1740‐500.74.35 $4,500,000 $4,500,000

Total $0 $0 $0 $0 $0 $0 $0 $0 $0 $0 $4,500,000

FY 2015‐24 CAPITAL IMPROVEMENT PROGRAM                                                        PROJECT DESCRIPTION

Funding Sources FY15 FY16 FY17 FY18 FY19 FY20 FY21 FY22 FY23 FY24 TOTAL

General Fund $4,500,000 $4,500,000

$0

Total $4,500,000 $0 $0 $0 $0 $0 $0 $0 $0 $0 $4,500,000

Budget Impact/Other

Annual O&M cost will be $500,000.

22

Streets

STRE

ETS

ST1402

ST140310

W MC 85

NLitc

hfield

Rd

NSa

rival

Ave

W Broadway Rd

SLitc

hfield

Rd

W Van Buren St

SEstr

e llaP

kwy

W Thomas Rd

W Mcdowell Rd

NEs

trella

Pkw y

NC o

ttonL

n

NBu

l lard

Ave

SBull

ardAv

e

NDy

sart

R d

W Elwood St

W Wigwam Blvd

W Camelback Rd

SSari

valA

ve

SDys

artRd

SCott

onLn

W Yuma Rd

SCitr

usRd

W Indian School Rd

W Virginia Ave

W Mcdowell Rd

N Pebblecreek Pkwy

N Ci

trus R

dCity of Goodyear CIP Projects FY 2015

Streets0 0.4 0.80.2

Miles

LegendCIP ProjectsProject Type

Street ProjectNumber DescriptionST 3 ST1402 Indian School, Litchfield to 303 fiber installationST 6 ST1403 I-10/303 Landscape, IGA with ADOT

23

Project # ST1402

Project Name Fiber Project: Loop 303 (Camelback & Indian School)

Type      Streets Department      Engineering

Category      Engineering Contact      Project Manager

Strategic Action #      Quality of Life Priority      1

Project Status      New Project

Description Total Project Cost: $63,291

Install fiber optic cable and related traffic management equipment

Justification

Timing with MAG matching funds will determine scope of project

Expenditures FY15 FY16 FY17 FY18 FY19 FY20 FY21 FY22 FY23 FY24 TOTAL

147‐3431‐500.72.30 $63,291 $63,291

$0

Total $63,291 $0 $0 $0 $0 $0 $0 $0 $0 $0 $63,291

FY 2015‐24 CAPITAL IMPROVEMENT PROGRAM                                                      PROJECT DESCRIPTION

Funding Sources FY15 FY16 FY17 FY18 FY19 FY20 FY21 FY22 FY23 FY24 TOTAL

Transportation Impact $63,291 $63,291

$0

Total $63,291 $0 $0 $0 $0 $0 $0 $0 $0 $0 $63,291

Budget Impact/Other

24

Project # ST1403

Project Name Traffic Signals:  Indian School & Cotton Lane

Type      Streets Department      Engineering

Category      Engineering Contact      Project Manager

Strategic Action #      Quality of Life Priority      1

Project Status      New Project

Description Total Project Cost: $1,200,000

Signalization 

Justification

Project identified in the prior 5 yr CIP, and is being carried forward as necessary to support growth.

Expenditures FY15 FY16 FY17 FY18 FY19 FY20 FY21 FY22 FY23 FY24 TOTAL

146‐3431‐500‐73.45 $1,200,000 $1,200,000

$0

Total $1,200,000 $0 $0 $0 $0 $0 $0 $0 $0 $0 $1,200,000

FY 2015‐24 CAPITAL IMPROVEMENT PROGRAM                                                      PROJECT DESCRIPTION

Funding Sources FY15 FY16 FY17 FY18 FY19 FY20 FY21 FY22 FY23 FY24 TOTAL

Transportation Fees $1,200,000 $1,200,000

$0

Total $1,200,000 $0 $0 $0 $0 $0 $0 $0 $0 $0 $1,200,000

Budget Impact/Other

25

Water

WA

TER

WA1504

WA1506

WA1505

WA1507

WA1508

WA1510

WA1401

WA1501WA1503

WA1502

WA1509

10

W MC 85

W MC 85

W Mcdowell RdN

Citru

sRd

W Broadway Rd

SLitc

hfield

Rd

NPe

rryvil

leR d

SPe

rryvil

leRd

W Vineyard Ave

W Thomas Rd

NEs

tr ella

Pkwy

NBu

ll ard

Ave

NLit

c hfie

l dRd

NCo

tton L

n

S Cotton Ln

W Elwood St

W Van Buren St

W Elliot Rd

S 143rd Ave

SSa

rival

Ave

SDy

sart

RdW Indian Springs Rd

W Yuma Rd

SCitr

usRd

SBu

llard

Ave

S Estre

llaPk

wy

W Virginia Ave

NDy

sar t

Rd

W Southern Ave

City of Goodyear CIP Projects FY 2015

Water0 0.5 10.25

Miles

LegendProject Type

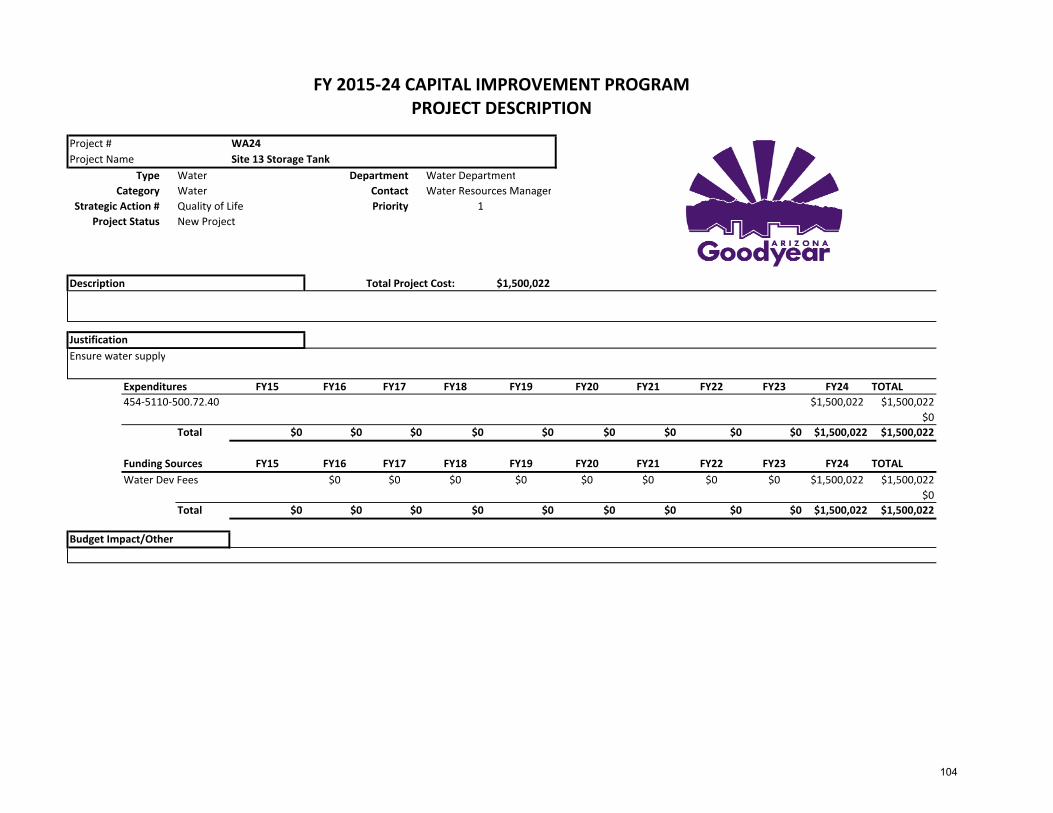
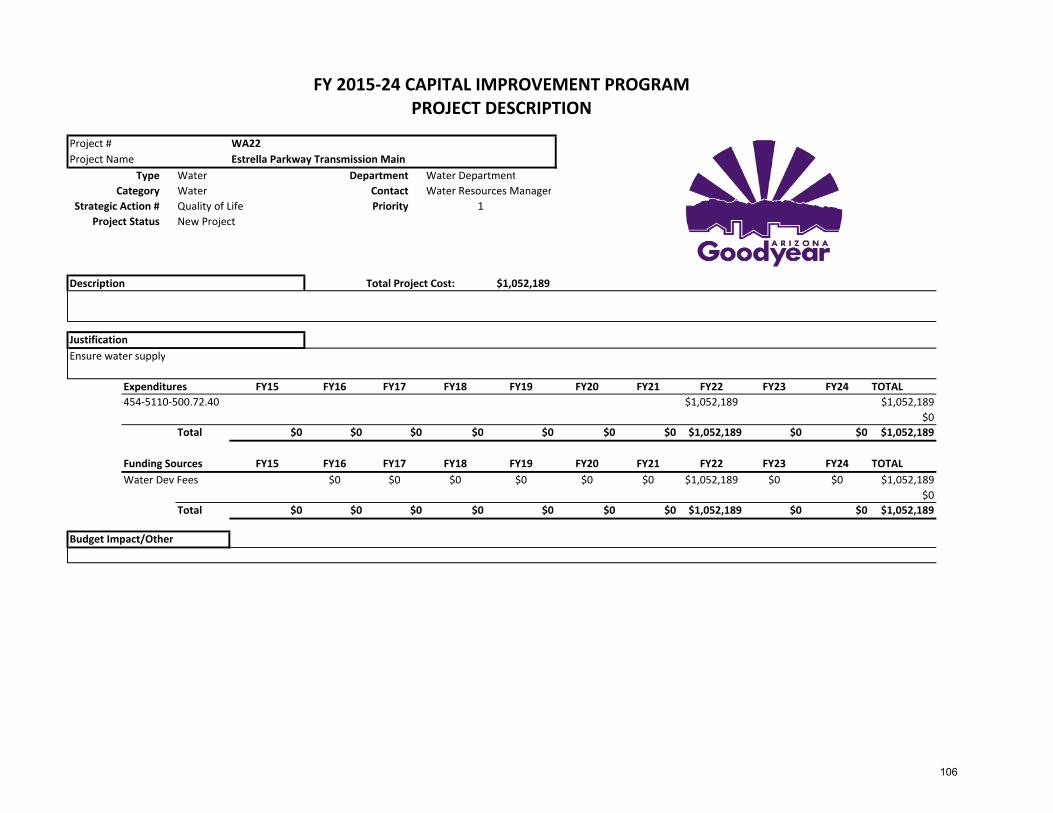
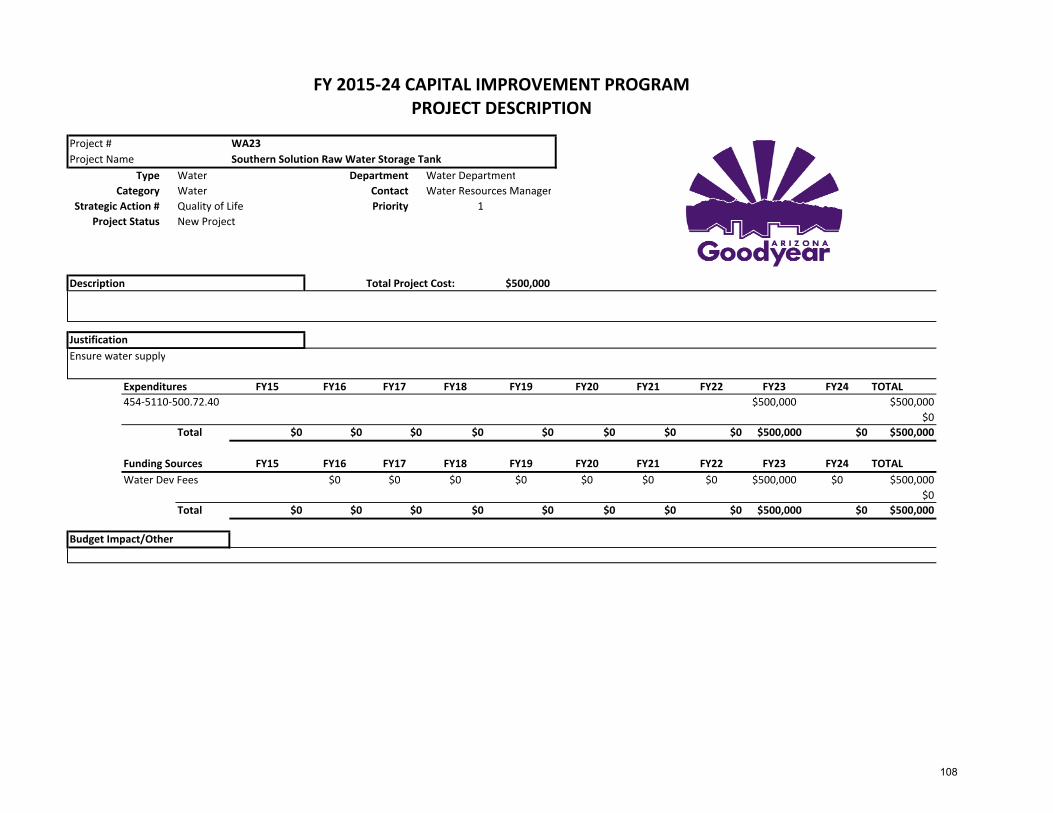
Water ProjectNumber DescriptionWA1510 Adaman Water Well (Developer Contribution) Sarival and I-10WA 4 WA1401 CAP Water purchase, 157th Av.WA1501 Intergrated Water Master Plan (City Hall)WA1502 Lower Buckeye & Cotton Site 12 Booster 9 MGDWA1503 Van Buren Citrus to 175th WA1504 Van Buren Citrus to RID WA1505 Yuma Citrus to 183rd WA1506 Yuma 183rd to Perryville WA1507 Durango 185th to Citrus WA1508 Perryville Yuma to W AmberWA1509 Citrus Broadway:175th & Elwood

26

Project # FY1510Project Name Well & Treatment Facility

Type      Water Department      Water DevelopmentCategory      Water Contact      Water Environmental Services Manager

Strategic Action #      Quality of Life Priority      1Project Status      New Project

Description Total Project Cost: $3,932,000Adding a well and treatment facility as part of the Northern Solutions Development Agreement with NNP.

JustificationPursuant to a Development Agreement with Newland CON‐CX‐12‐2096

Expenditures FY15 FY16 FY17 FY18 FY19 FY20 FY21 FY22 FY23 FY24 TOTAL001‐3430‐500‐72.30 $3,932,000 $3,932,000

$0Total $3,932,000 $0 $0 $0 $0 $0 $0 $0 $0 $3,932,000

Funding Sources FY15 FY16 FY17 FY18 FY19 FY20 FY21 FY22 FY23 FY24 TOTALGen Fund (Dev Contribution) $3,932,000 $3,932,000

$0Total $3,932,000 $0 $0 $0 $0 $0 $0 $0 $0 $0 $3,932,000

Budget Impact/Other

FY 2015‐24 CAPITAL IMPROVEMENT PROGRAM                                                        PROJECT DESCRIPTION

27

Project # WA0510

Project Name CAP Subcontract Capital Charges

Type      Water Department      Water Department

Category      Water  Contact      Water Resources Manager

Strategic Action #      Quality of Life Priority      1

Project Status      New Project

Description Total Project Cost: $2,840,000

Purchase CAP water

Justification

Long term water purchase

Expenditures FY15 FY16 FY17 FY18 FY19 FY20 FY21 FY22 FY23 FY24 TOTAL

411‐5110‐500.72.40 $284,000 $284,000 $284,000 $284,000 $284,000 $284,000 $284,000 $284,000 $284,000 $284,000 $2,840,000

$0

Total $284,000 $284,000 $284,000 $284,000 $284,000 $284,000 $284,000 $284,000 $284,000 $284,000 $2,840,000

FY 2015‐24 CAPITAL IMPROVEMENT PROGRAM                                                       PROJECT DESCRIPTION

Funding Sources FY15 FY16 FY17 FY18 FY19 FY20 FY21 FY22 FY23 FY24 TOTAL

Water Ent CIP Funds $284,000 $284,000 $284,000 $284,000 $284,000 $284,000 $284,000 $284,000 $284,000 $284,000 $2,840,000

$0

Total $284,000 $284,000 $284,000 $284,000 $284,000 $284,000 $284,000 $284,000 $284,000 $284,000 $2,840,000

Budget Impact/Other

28

Project # WR1501Project Name Integrated Water Master Plan

Type      Water Department      Water DepartmentCategory      Water Contact      Water Resources Manager

Strategic Action #      Quality of Life Priority      1Project Status      New Project

Description Total Project Cost: $720,000Master plan for Water, Wastewater, Reclaimed Water and Water Resources

JustificationMaster Plan to provide analysis on the City's long term water needs and approaches to provide in a sustainable, cost effective manner.

Expenditures FY15 FY16 FY17 FY18 FY19 FY20 FY21 FY22 FY23 FY24 TOTAL427‐5010‐500.72.40 $720,000 $720,000

$0Total $720,000 $0 $0 $0 $0 $0 $0 $0 $0 $0 $720,000

Funding Sources FY15 FY16 FY17 FY18 FY19 FY20 FY21 FY22 FY23 FY24 TOTALWater Resources $720,000 $720,000

$0Total $720,000 $0 $0 $0 $0 $0 $0 $0 $0 $0 $720,000

Budget Impact/Other

FY 2015‐24 CAPITAL IMPROVEMENT PROGRAM                                                       PROJECT DESCRIPTION

29

Project # WA1502Project Name Lower Buckeye & Cotton (Site 12) Booster 9 MGD

Type      Water Department      Water DepartmentCategory      Water Contact      Water Resources Manager

Strategic Action #      Quality of Life Priority      1Project Status      New Project

Description Total Project Cost: $2,078,000

JustificationEnsure water supply

Expenditures FY15 FY16 FY17 FY18 FY19 FY20 FY21 FY22 FY23 FY24 TOTAL453‐5110‐500.72.40 $2,078,000 $2,078,000

$0Total $2,078,000 $0 $0 $0 $0 $0 $0 $0 $0 $0 $2,078,000

Funding Sources FY15 FY16 FY17 FY18 FY19 FY20 FY21 FY22 FY23 FY24 TOTALWater Dev Fees $2,078,000 $2,078,000

$0Total $2,078,000 $0 $0 $0 $0 $0 $0 $0 $0 $0 $2,078,000

Budget Impact/Other

FY 2015‐24 CAPITAL IMPROVEMENT PROGRAM                                                       PROJECT DESCRIPTION

30

Project # WA1503Project Name Van Buren Citrus to 175th (West Goodyear Dev Agreement)

Type      Water Department      Water DepartmentCategory      Water Contact      Water Resources Manager

Strategic Action #      Quality of Life Priority      1Project Status      New Project

Description Total Project Cost: $449,080

JustificationEnsure water supply

Expenditures FY15 FY16 FY17 FY18 FY19 FY20 FY21 FY22 FY23 FY24 TOTAL453‐5110‐500.72.40 $89,816 $89,816 $89,816 $89,816 $89,816 $449,080

$0Total $89,816 $89,816 $89,816 $89,816 $89,816 $0 $0 $0 $0 $0 $449,080

Funding Sources FY15 FY16 FY17 FY18 FY19 FY20 FY21 FY22 FY23 FY24 TOTALWater Dev Fees $89,816 $89,816 $89,816 $89,816 $89,816 $4,900,000 $5,349,080

$0Total $89,816 $89,816 $89,816 $89,816 $89,816 $0 $0 $0 $0 $4,900,000 $5,349,080

Budget Impact/Other

FY 2015‐24 CAPITAL IMPROVEMENT PROGRAM                                                        PROJECT DESCRIPTION

31

Project # WA1504Project Name Van Buren Citrus to RID (West Goodyear Dev Agreement)

Type      Water Department      Water DepartmentCategory      Water Contact      Water Resources Manager

Strategic Action #      Quality of Life Priority      1Project Status      New Project

Description Total Project Cost: $664,815

JustificationEnsure water supply

Expenditures FY15 FY16 FY17 FY18 FY19 FY20 FY21 FY22 FY23 FY24 TOTAL453‐5110‐500.72.40 $132,963 $132,963 $132,963 $132,963 $132,963 $664,815

$0Total $132,963 $132,963 $132,963 $132,963 $132,963 $0 $0 $0 $0 $0 $664,815

Funding Sources FY15 FY16 FY17 FY18 FY19 FY20 FY21 FY22 FY23 FY24 TOTALWater Dev Fees $132,963 $132,963 $132,963 $132,963 $132,963 $664,815

$0Total $132,963 $132,963 $132,963 $132,963 $132,963 $0 $0 $0 $0 $0 $664,815

Budget Impact/Other

FY 2015‐24 CAPITAL IMPROVEMENT PROGRAM                                                        PROJECT DESCRIPTION

32

Project # WA1505Project Name Yuma Citrus to 183rd (West Goodyear Dev Agreement)

Type      Water Department      Water DepartmentCategory      Water Contact      Water Resources Manager

Strategic Action #      Quality of Life Priority      1Project Status      New Project

Description Total Project Cost: $449,430

JustificationEnsure water supply

Expenditures FY15 FY16 FY17 FY18 FY19 FY20 FY21 FY22 FY23 FY24 TOTAL453‐5110‐500.72.40 $89,886 $89,886 $89,886 $89,886 $89,886 $449,430

$0Total $89,886 $89,886 $89,886 $89,886 $89,886 $0 $0 $0 $0 $0 $449,430

Funding Sources FY15 FY16 FY17 FY18 FY19 FY20 FY21 FY22 FY23 FY24 TOTALWater Dev Fees $89,886 $89,886 $89,886 $89,886 $89,886 $449,430

$0Total $89,886 $89,886 $89,886 $89,886 $89,886 $0 $0 $0 $0 $0 $449,430

Budget Impact/Other

FY 2015‐24 CAPITAL IMPROVEMENT PROGRAM                                                        PROJECT DESCRIPTION

33

Project # WA1506Project Name Yuma 183rd to Perryville (West Goodyear Dev Agreement)

Type      Water Department      Water DepartmentCategory      Water Contact      Water Resources Manager

Strategic Action #      Quality of Life Priority      1Project Status      New Project

Description Total Project Cost: $449,430Water Lines

JustificationEnsure water supply

Expenditures FY15 FY16 FY17 FY18 FY19 FY20 FY21 FY22 FY23 FY24 TOTAL453‐5110‐500.72.40 $89,886 $89,886 $89,886 $89,886 $89,886 $449,430

$0Total $89,886 $89,886 $89,886 $89,886 $89,886 $0 $0 $0 $0 $0 $449,430

Funding Sources FY15 FY16 FY17 FY18 FY19 FY20 FY21 FY22 FY23 FY24 TOTALWater Dev Fees $89,886 $89,886 $89,886 $89,886 $89,886 $449,430

$0Total $89,886 $89,886 $89,886 $89,886 $89,886 $0 $0 $0 $0 $0 $449,430

Budget Impact/Other

FY 2015‐24 CAPITAL IMPROVEMENT PROGRAM                                                        PROJECT DESCRIPTION

34

Project # WA1507Project Name Durango 185th to Citrus (West Goodyear Dev Agreement)

Type      Water Department      Water DepartmentCategory      Water Contact      Water Resources Manager

Strategic Action #      Quality of Life Priority      1Project Status      New Project

Description Total Project Cost: $482,930

JustificationEnsure water supply

Expenditures FY15 FY16 FY17 FY18 FY19 FY20 FY21 FY22 FY23 FY24 TOTAL453‐5110‐500.72.40 $96,586 $96,586 $96,586 $96,586 $96,586 $482,930

$0Total $96,586 $96,586 $96,586 $96,586 $96,586 $0 $0 $0 $0 $0 $482,930

Funding Sources FY15 FY16 FY17 FY18 FY19 FY20 FY21 FY22 FY23 FY24 TOTALWater Dev Fees $96,586 $96,586 $96,586 $96,586 $96,586 $482,930

$0Total $96,586 $96,586 $96,586 $96,586 $96,586 $0 $0 $0 $0 $0 $482,930

Budget Impact/Other

FY 2015‐24 CAPITAL IMPROVEMENT PROGRAM                                                        PROJECT DESCRIPTION

35

Project # WA1508Project Name Perryville Yuma to W Amber (West Goodyear Dev Agreement)

Type      Water Department      Water DepartmentCategory      Water Contact      Water Resources Manager

Strategic Action #      Quality of Life Priority      1Project Status      New Project

Description Total Project Cost: $681,960

JustificationEnsure water supply

Expenditures FY15 FY16 FY17 FY18 FY19 FY20 FY21 FY22 FY23 FY24 TOTAL453‐5110‐500.72.40 $136,392 $136,392 $136,392 $136,392 $136,392 $681,960

$0Total $136,392 $136,392 $136,392 $136,392 $136,392 $0 $0 $0 $0 $0 $681,960

Funding Sources FY15 FY16 FY17 FY18 FY19 FY20 FY21 FY22 FY23 FY24 TOTALWater Dev Fees $136,392 $136,392 $136,392 $136,392 $136,392 $681,960

$0Total $136,392 $136,392 $136,392 $136,392 $136,392 $0 $0 $0 $0 $0 $681,960

Budget Impact/Other

FY 2015‐24 CAPITAL IMPROVEMENT PROGRAM                                                        PROJECT DESCRIPTION

36

Project # WA1509Project Name Citrus Broadway to 175th & Elwood (West Goodyear Dev Ag)

Type      Water Department      Water DepartmentCategory      Water Contact      Water Resources Manager

Strategic Action #      Quality of Life Priority      1Project Status      New Project

Description Total Project Cost: $831,615

JustificationEnsure water supply

Expenditures FY15 FY16 FY17 FY18 FY19 FY20 FY21 FY22 FY23 FY24 TOTAL453‐5110‐500.72.40 $166,323 $166,323 $166,323 $166,323 $166,323 $831,615

$0Total $166,323 $166,323 $166,323 $166,323 $166,323 $0 $0 $0 $0 $0 $831,615

Funding Sources FY15 FY16 FY17 FY18 FY19 FY20 FY21 FY22 FY23 FY24 TOTALWater Dev Fees $166,323 $166,323 $166,323 $166,323 $166,323 $831,615

$0Total $166,323 $166,323 $166,323 $166,323 $166,323 $0 $0 $0 $0 $0 $831,615

Budget Impact/Other

FY 2015‐24 CAPITAL IMPROVEMENT PROGRAM                                                        PROJECT DESCRIPTION

37

Wastewater

WA

STEW

ATE

R

WW1501

WW1502

WW1503WW1504

WW1510

WW1505

WW1508

WW1509

WW1506

WW1507

WW1302

10

W MC 85

W MC 85

W Lower Buckeye Rd

W Mcdowell Rd

NSa

rival

Ave

W Broadway Rd

SLitc

hfield

Rd

NPe

rryvil

leRd

SPerr

yville

Rd

W Vineyard Ave

NEs

t rella

P kwy

NBu

l lard

Ave

NL it

chf ie

ldR d

NC o

ttonL

n

S Cotton Ln

W Van Buren St

W Elwood St

W Elliot Rd

S 143rd Ave

S Sari

valA

ve

W Indian Springs Rd

W Yuma Rd

SCitr

usR d

SBull

ardAv

e

S Estre

llaPk

wy

W Virginia Ave

N Ci

trus R

d

W Southern Ave

City of Goodyear CIP Projects FY 2015

0 0.5 10.25Miles

LegendWastewater Project

Wastewater

Number DescriptionWW1501 183rd Ave & YumaWW1502 Citrus/Lower Buckeye LineWW1503 Durango LineWW1504 E Lower Buckeye LineWW1302 GWRF ExpansionWA1505 Las Brisas WW1506 Lower Buckeye Line WW1507 N. Citrus (Las Palmas) WW1508 N. Citrus Line WW1509 S. Citrus Line WW1510 S. Citrus Line

38

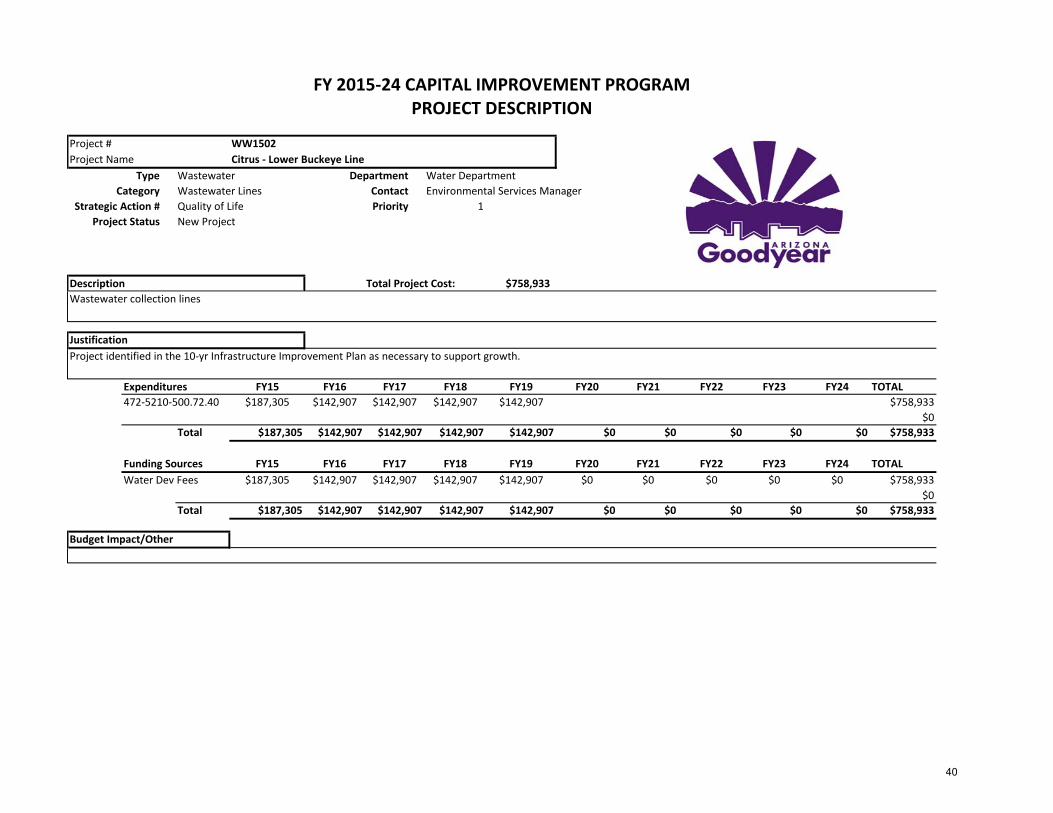
Project # WW1501Project Name 183rd Ave & Yuma

Type      Wastewater Department      Water DepartmentCategory      Wastewater Lines Contact      Environmental Services Manager

Strategic Action #      Quality of Life Priority      1Project Status      New Project

Description Total Project Cost: $936,525Wastewater collection lines

JustificationProject identified in the 10‐yr Infrastructure Improvement Plan as necessary to support growth.

Expenditures FY15 FY16 FY17 FY18 FY19 FY20 FY21 FY22 FY23 FY24 TOTAL472‐5210‐500.72.40 $187,305 $187,305 $187,305 $187,305 $187,305 $936,525

$0Total $187,305 $187,305 $187,305 $187,305 $187,305 $0 $0 $0 $0 $0 $936,525

Funding Sources FY15 FY16 FY17 FY18 FY19 FY20 FY21 FY22 FY23 FY24 TOTALWater Dev Fees $187,305 $187,305 $187,305 $187,305 $187,305 $0 $0 $0 $0 $0 $936,525

$0Total $187,305 $187,305 $187,305 $187,305 $187,305 $0 $0 $0 $0 $0 $936,525

Budget Impact/Other

FY 2015‐24 CAPITAL IMPROVEMENT PROGRAM                                                          PROJECT DESCRIPTION

39

Project # WW1502Project Name Citrus ‐ Lower Buckeye Line

Type      Wastewater Department      Water DepartmentCategory      Wastewater Lines Contact      Environmental Services Manager

Strategic Action #      Quality of Life Priority      1Project Status      New Project

Description Total Project Cost: $758,933Wastewater collection lines

JustificationProject identified in the 10‐yr Infrastructure Improvement Plan as necessary to support growth.

Expenditures FY15 FY16 FY17 FY18 FY19 FY20 FY21 FY22 FY23 FY24 TOTAL472‐5210‐500.72.40 $187,305 $142,907 $142,907 $142,907 $142,907 $758,933

$0Total $187,305 $142,907 $142,907 $142,907 $142,907 $0 $0 $0 $0 $0 $758,933

Funding Sources FY15 FY16 FY17 FY18 FY19 FY20 FY21 FY22 FY23 FY24 TOTALWater Dev Fees $187,305 $142,907 $142,907 $142,907 $142,907 $0 $0 $0 $0 $0 $758,933

$0Total $187,305 $142,907 $142,907 $142,907 $142,907 $0 $0 $0 $0 $0 $758,933

Budget Impact/Other

FY 2015‐24 CAPITAL IMPROVEMENT PROGRAM                                                          PROJECT DESCRIPTION

40

Project # WW1503Project Name Durango Line

Type      Wastewater Department      Water DepartmentCategory      Wastewater Lines Contact      Environmental Services Manager

Strategic Action #      Quality of Life Priority      1Project Status      New Project

Description Total Project Cost: $346,080Wastewater collection lines

JustificationProject identified in the 10‐yr Infrastructure Improvement Plan as necessary to support growth.

Expenditures FY15 FY16 FY17 FY18 FY19 FY20 FY21 FY22 FY23 FY24 TOTAL472‐5210‐500.72.40 $69,216 $69,216 $69,216 $69,216 $69,216 $346,080

$0Total $69,216 $69,216 $69,216 $69,216 $69,216 $0 $0 $0 $0 $0 $346,080

Funding Sources FY15 FY16 FY17 FY18 FY19 FY20 FY21 FY22 FY23 FY24 TOTALWater Dev Fees $69,216 $69,216 $69,216 $69,216 $69,216 $0 $0 $0 $0 $0 $346,080

$0Total $69,216 $69,216 $69,216 $69,216 $69,216 $0 $0 $0 $0 $0 $346,080

Budget Impact/Other

FY 2015‐24 CAPITAL IMPROVEMENT PROGRAM                                                          PROJECT DESCRIPTION

41

Project # WW1504Project Name E Lower Buckeye Line

Type      Wastewater Department      Water DepartmentCategory      Wastewater Lines Contact      Environmental Services Manager

Strategic Action #      Quality of Life Priority      1Project Status      New Project

Description Total Project Cost: $581,880Wastewater collection lines

JustificationProject identified in the 10‐yr Infrastructure Improvement Plan as necessary to support growth.

Expenditures FY15 FY16 FY17 FY18 FY19 FY20 FY21 FY22 FY23 FY24 TOTAL472‐5210‐500.72.40 $116,376 $116,376 $116,376 $116,376 $116,376 $581,880

$0Total $116,376 $116,376 $116,376 $116,376 $116,376 $0 $0 $0 $0 $0 $581,880

Funding Sources FY15 FY16 FY17 FY18 FY19 FY20 FY21 FY22 FY23 FY24 TOTALWater Dev Fees $116,376 $116,376 $116,376 $116,376 $116,376 $0 $0 $0 $0 $0 $581,880

$0Total $116,376 $116,376 $116,376 $116,376 $116,376 $0 $0 $0 $0 $0 $581,880

Budget Impact/Other

FY 2015‐24 CAPITAL IMPROVEMENT PROGRAM                                                          PROJECT DESCRIPTION

42

Project # WW1302Project Name GWRF Expansion

Type      Wastewater Department      Water DepartmentCategory      Wastewater Lines Contact      Environmental Services Manager

Strategic Action #      Quality of Life Priority      1Project Status      New Project

Description Total Project Cost: $29,800,000Wastewater collection lines

JustificationProject identified in the 10‐yr Infrastructure Improvement Plan as necessary to support growth.

Expenditures FY15 FY16 FY17 FY18 FY19 FY20 FY21 FY22 FY23 FY24 TOTAL472‐5210‐500.72.40 $2,000,000 $1,400,000 $5,800,000 $8,352,154 $7,141,728 $5,106,118 $29,800,000

$0Total $2,000,000 $1,400,000 $0 $5,800,000 $0 $0 $0 $8,352,154 $7,141,728 $5,106,118 $29,800,000

Funding Sources FY15 FY16 FY17 FY18 FY19 FY20 FY21 FY22 FY23 FY24 TOTALWater Dev Fees $2,000,000 $1,400,000 $0 $5,800,000 $0 $0 $0 $8,352,154 $7,141,728 $5,106,118 $29,800,000

$0Total $2,000,000 $1,400,000 $0 $5,800,000 $0 $0 $0 $8,352,154 $7,141,728 $5,106,118 $29,800,000

Budget Impact/Other

FY 2015‐24 CAPITAL IMPROVEMENT PROGRAM                                                          PROJECT DESCRIPTION

43

Project # WW1505Project Name Las Brisas (West Goodyear D.A.)

Type      Wastewater Department      Wastewater DepartmentCategory      Wastewater Lines Contact      Environmental Services Manager

Strategic Action #      Quality of Life Priority      1Project Status      New Project

Description Total Project Cost: $1,354,700Wastewater collection lines

JustificationProject identified in the 10‐yr Infrastructure Improvement Plan as necessary to support growth.

Expenditures FY15 FY16 FY17 FY18 FY19 FY20 FY21 FY22 FY23 FY24 TOTAL472‐5210‐500.72.40 $270,940 $270,940 $270,940 $270,940 $270,940 $1,354,700

$0Total $270,940 $270,940 $270,940 $270,940 $270,940 $0 $0 $0 $0 $0 $1,354,700

Funding Sources FY15 FY16 FY17 FY18 FY19 FY20 FY21 FY22 FY23 FY24 TOTALWater Dev Fees $270,940 $270,940 $270,940 $270,940 $270,940 $0 $0 $0 $0 $0 $1,354,700

$0Total $270,940 $270,940 $270,940 $270,940 $270,940 $0 $0 $0 $0 $0 $1,354,700

Budget Impact/Other

FY 2015‐24 CAPITAL IMPROVEMENT PROGRAM                                                          PROJECT DESCRIPTION

44

Project # WW1506Project Name Lower Buckeye Line (West Goodyear D.A.)

Type      Wastewater Department      Water DepartmentCategory      Wastewater Lines Contact      Environmental Services Manager

Strategic Action #      Quality of Life Priority      1Project Status      New Project

Description Total Project Cost: $1,087,340Wastewater collection lines

JustificationProject identified in the 10‐yr Infrastructure Improvement Plan as necessary to support growth.

Expenditures FY15 FY16 FY17 FY18 FY19 FY20 FY21 FY22 FY23 FY24 TOTAL472‐5210‐500.72.40 $217,468 $217,468 $217,468 $217,468 $217,468 $1,087,340

$0Total $217,468 $217,468 $217,468 $217,468 $217,468 $0 $0 $0 $0 $0 $1,087,340

Funding Sources FY15 FY16 FY17 FY18 FY19 FY20 FY21 FY22 FY23 FY24 TOTALWater Dev Fees $217,468 $217,468 $217,468 $217,468 $217,468 $0 $0 $0 $0 $0 $1,087,340

$0Total $217,468 $217,468 $217,468 $217,468 $217,468 $0 $0 $0 $0 $0 $1,087,340

Budget Impact/Other

FY 2015‐24 CAPITAL IMPROVEMENT PROGRAM                                                          PROJECT DESCRIPTION

45

Project # WW1507Project Name North Citrus (Las Palmas) Line (West Goodyear D.A.)

Type      Wastewater Department      Water DepartmentCategory      Wastewater Lines Contact      Environmental Services Manager

Strategic Action #      Quality of Life Priority      1Project Status      New Project

Description Total Project Cost: $936,525Wastewater collection lines

JustificationProject identified in the 10‐yr Infrastructure Improvement Plan as necessary to support growth.

Expenditures FY15 FY16 FY17 FY18 FY19 FY20 FY21 FY22 FY23 FY24 TOTAL472‐5210‐500.72.40 $187,305 $187,305 $187,305 $187,305 $187,305 $936,525

$0Total $187,305 $187,305 $187,305 $187,305 $187,305 $0 $0 $0 $0 $0 $936,525

Funding Sources FY15 FY16 FY17 FY18 FY19 FY20 FY21 FY22 FY23 FY24 TOTALWater Dev Fees $187,305 $187,305 $187,305 $187,305 $187,305 $0 $0 $0 $0 $0 $936,525

$0Total $187,305 $187,305 $187,305 $187,305 $187,305 $0 $0 $0 $0 $0 $936,525

Budget Impact/Other

FY 2015‐24 CAPITAL IMPROVEMENT PROGRAM                                                          PROJECT DESCRIPTION

46

Project # WW1508Project Name North Citrus Line (Las Palmas) (West Goodyear D.A.)

Type      Wastewater Department      Water DepartmentCategory      Wastewater Lines Contact      Environmental Services Manager

Strategic Action #      Quality of Life Priority      1Project Status      New Project

Description Total Project Cost: $936,525Wastewater collection lines

JustificationProject identified in the 10‐yr Infrastructure Improvement Plan as necessary to support growth.

Expenditures FY15 FY16 FY17 FY18 FY19 FY20 FY21 FY22 FY23 FY24 TOTAL472‐5210‐500.72.40 $187,305 $187,305 $187,305 $187,305 $187,305 $936,525

$0Total $187,305 $187,305 $187,305 $187,305 $187,305 $0 $0 $0 $0 $0 $936,525

Funding Sources FY15 FY16 FY17 FY18 FY19 FY20 FY21 FY22 FY23 FY24 TOTALWater Dev Fees $187,305 $187,305 $187,305 $187,305 $187,305 $0 $0 $0 $0 $0 $936,525

$0Total $187,305 $187,305 $187,305 $187,305 $187,305 $0 $0 $0 $0 $0 $936,525

Budget Impact/Other

FY 2015‐24 CAPITAL IMPROVEMENT PROGRAM                                                          PROJECT DESCRIPTION

47

Project # WW1509Project Name S.  Citrus Line (Las Palmas) (West Goodyear D.A.)

Type      Wastewater Department      Water DepartmentCategory      Wastewater Lines Contact      Environmental Services Manager

Strategic Action #      Quality of Life Priority      1Project Status      New Project

Description Total Project Cost: $706,295Wastewater collection lines

JustificationProject identified in the 10‐yr Infrastructure Improvement Plan as necessary to support growth.

Expenditures FY15 FY16 FY17 FY18 FY19 FY20 FY21 FY22 FY23 FY24 TOTAL472‐5210‐500.72.40 $141,259 $141,259 $141,259 $141,259 $141,259 $706,295

$0Total $141,259 $141,259 $141,259 $141,259 $141,259 $0 $0 $0 $0 $0 $706,295

Funding Sources FY15 FY16 FY17 FY18 FY19 FY20 FY21 FY22 FY23 FY24 TOTALWater Dev Fees $141,259 $141,259 $141,259 $141,259 $141,259 $0 $0 $0 $0 $0 $706,295

$0Total $141,259 $141,259 $141,259 $141,259 $141,259 $0 $0 $0 $0 $0 $706,295

Budget Impact/Other

FY 2015‐24 CAPITAL IMPROVEMENT PROGRAM                                                          PROJECT DESCRIPTION

48

Project # WW1510Project Name S.  Citrus Line (Las Palmas) (West Goodyear D.A.)

Type      Wastewater Department      Water DepartmentCategory      Wastewater Contact      Environmental Services Manager

Strategic Action #      Quality of Life Priority      1Project Status      New Project

Description Total Project Cost: $736,050Wastewater collection lines

JustificationProject identified in the 10‐yr Infrastructure Improvement Plan as necessary to support growth.

Expenditures FY15 FY16 FY17 FY18 FY19 FY20 FY21 FY22 FY23 FY24 TOTAL472‐5210‐500.72.40 $147,210 $147,210 $147,210 $147,210 $147,210 $736,050

$0Total $147,210 $147,210 $147,210 $147,210 $147,210 $0 $0 $0 $0 $0 $736,050

Funding Sources FY15 FY16 FY17 FY18 FY19 FY20 FY21 FY22 FY23 FY24 TOTALWater Dev Fees $147,210 $147,210 $147,210 $147,210 $147,210 $0 $0 $0 $0 $0 $736,050

$0Total $147,210 $147,210 $147,210 $147,210 $147,210 $0 $0 $0 $0 $0 $736,050

Budget Impact/Other

FY 2015‐24 CAPITAL IMPROVEMENT PROGRAM                                                          PROJECT DESCRIPTION

49

Appendix

AP

PE

ND

IX


APPENDIX   

CIP Projects for years 2‐10 

50

Project # PK1201

Project Name Parks Improvements

Type      Parks Department      Parks & Recreation

Category           Parks & Recreation Contact      Parks Director

Strategic Action #           Sense of Community Priority      3

Project Status           Ongoing Project

Description Total Project Cost: $250,000

Loma Linda Park Improvements Phase IB

Justification

Continuing the funding for the construction and addition of improvements at Loma Linda Park for projects identified in the Loma Linda Master Plan.

Expenditures FY15 FY16 FY17 FY18 FY19 FY20 FY21 FY22 FY23 FY24 TOTAL

001‐4310‐500.72‐30 $250,000 $250,000

Total $0 $0 $250,000 $0 $0 $0 $0 $0 $0 $0 $250,000

FY 2015‐24 CAPITAL IMPROVEMENT PROGRAM                                                    PROJECT DESCRIPTION

Funding Sources FY15 FY16 FY17 FY18 FY19 FY20 FY21 FY22 FY23 FY24 TOTAL

General Fund $250,000 $250,000

Total $0 $0 $250,000 $0 $0 $0 $0 $0 $0 $0 $250,000

Budget Impact/Other

51

Project # FY1601

Project Name Lighting Improvements

Type      Parks & Recreation Department      Parks & Recreation

Category      Parks & Recreation Contact      Parks Director

Strategic Action #      Sense of Community Priority     

Project Status      New project

Description Total Project Cost: $450,000

Replace light poles in older parks that have deteriorated.  Also renovate the entire lighting system at Rio Paseo Park.

Justification

Increase saftety and reduce rising on‐going lighting repair costs.

Expenditures FY15 FY16 FY17 FY18 FY19 FY20 FY21 FY22 FY23 FY24 TOTAL

001‐4310‐500.72‐30 $450,000 $450,000

$0

Total $0 $0 $0 $450,000 $0 $0 $0 $0 $0 $0 $450,000

FY 2015‐24 CAPITAL IMPROVEMENT PROGRAM                                                         PROJECT DESCRIPTION

Funding Sources FY15 FY16 FY17 FY18 FY19 FY20 FY21 FY22 FY23 FY24 TOTAL

General Fund $450,000 $450,000

$0

Total $0 $0 $0 $450,000 $0 $0 $0 $0 $0 $0 $450,000

Budget Impact/Other

52

Project # FY1601

Project Name Playground Equipment

Type      Parks  Department      Parks & Recreation

Category      Parks & Recreation Contact      Parks Director

Strategic Action #      Sense of Community Priority      6

Project Status      New project

Description Total Project Cost: $480,000

Renovate playgrounds to include new play structure, shade canopy and play surface at various parks.

Justification

Provides funding for playground equipment replacement for identified parks that are below performance standards. 

Expenditures FY15 FY16 FY17 FY18 FY19 FY20 FY21 FY22 FY23 FY24 TOTAL

001‐4310‐500.72‐30 $480,000 $480,000

$0

Total $0 $0 $0 $0 $0 $480,000 $0 $0 $0 $0 $480,000

Funding Sources FY15 FY16 FY17 FY18 FY19 FY20 FY21 FY22 FY23 FY24 TOTAL

FY 2015‐24 CAPITAL IMPROVEMENT PROGRAM                                                         PROJECT DESCRIPTION

General Fund $480,000 $480,000

$0

Total $0 $0 $0 $0 $0 $480,000 $0 $0 $0 $0 $480,000

Budget Impact/Other

53

Project # PK2301

Project Name Irrigation Improvements

Type      Landscape Department      Parks & Recreation

Category      Parks & Recreation Contact      Parks Director

Strategic Action #      Sense of Community Priority     

Project Status      New project

Description Total Project Cost: $480,000

Replace irrigation controllers in parks and right of ways.  Introduce ET web based controllers where possible to maximize water savings and increase staff efficiency as opposed 

to manual controls.

Justification

Introduce ET web based controllers where possible to maximize water savings and increase staff efficiency as opposed to manual controls.

Expenditures FY15 FY16 FY17 FY18 FY19 FY20 FY21 FY22 FY23 FY24 TOTAL

001‐4310‐500.72‐30 $480,000 $480,000

$0

Total $0 $0 $0 $0 $0 $480,000 $0 $0 $0 $0 $480,000

FY 2015‐24 CAPITAL IMPROVEMENT PROGRAM                                                               PROJECT DESCRIPTION

Funding Sources FY15 FY16 FY17 FY18 FY19 FY20 FY21 FY22 FY23 FY24 TOTAL

General Fund $480,000 $480,000

$0

Total $0 $0 $0 $0 $0 $480,000 $0 $0 $0 $0 $480,000

Budget Impact/Other

54

Project # PK2101

Project Name Community Park Master plan

Type      Parks    Department      Parks & Recreation

Category      Parks & Recreation Contact      Parks Director

Strategic Action #      Sense of Community Priority      9

Project Status      New project

Description Total Project Cost: $262,500

A master plan to design the next Community Park.

Justification

Master plan the park acreage.

Expenditures FY15 FY16 FY17 FY18 FY19 FY20 FY21 FY22 FY23 FY24 TOTAL

001‐4310‐500.72‐30 $262,500 $262,500

$0

Total $0 $0 $0 $0 $0 $0 $262,500 $0 $0 $0 $262,500

Funding Sources FY15 FY16 FY17 FY18 FY19 FY20 FY21 FY22 FY23 FY24 TOTAL

FY 2015‐24 CAPITAL IMPROVEMENT PROGRAM                                                          PROJECT DESCRIPTION

General Fund $262,500 $262,500

$0

Total $0 $0 $0 $0 $0 $0 $262,500 $0 $0 $0 $262,500

Budget Impact/Other

55

Project # PK2101

Project Name Central Goodyear Community Park 

Type      Parks    Department      Parks & Recreation

Category      Parks & Recreation Contact      Parks Director

Strategic Action #      Sense of Community Priority      10

Project Status      New project

Description Total Project Cost: $4,021,042

A 30‐acre park to be located in the Northwest quadrant of the Central Planning Area. 

Justification

The city currently has 2 community parks, one in North Goodyear and one in South Goodyear. This park will serve the central city.

Expenditures FY15 FY16 FY17 FY18 FY19 FY20 FY21 FY22 FY23 FY24 TOTAL

141‐4320‐500‐7230 $611,758 $1,704,642 $1,704,642 $4,021,042

$0

Total $0 $0 $0 $0 $0 $0 $0 $611,758 $1,704,642 $1,704,642 $4,021,042

FY 2015‐24 CAPITAL IMPROVEMENT PROGRAM                                                          PROJECT DESCRIPTION

Funding Sources FY15 FY16 FY17 FY18 FY19 FY20 FY21 FY22 FY23 FY24 TOTAL

Parks Impact Fees $611,758 $1,704,642 $1,704,642 $4,021,042

$0

Total $0 $0 $0 $0 $0 $0 $0 $611,758 $1,704,642 $1,704,642 $4,021,042

Budget Impact/Other

56

Project # PD1701

Project Name Police Apparatus

Type      Equipment Department      PD

Category      Police Department Contact      Police Chief

Strategic Action #      Quality of Life Priority      3

Project Status      New Project

Description Total Project Cost: $1,350,000

Expand the fleet of police vehicles and purchase additional equipment that has a useful life of at least 3 years.

Justification

To maintain the current level of service as the City continues to experience growth.

Expenditures FY15 FY16 FY17 FY18 FY19 FY20 FY21 FY22 FY23 FY24 TOTAL

145‐2110‐500.74.35 $270,000 $270,000 $270,000 $270,000 $270,000 $1,350,000

$0

Total $0 $0 $270,000 $0 $270,000 $0 $270,000 $0 $270,000 $270,000 $1,350,000

FY 2015‐24 CAPITAL IMPROVEMENT PROGRAM                                                        PROJECT DESCRIPTION

Funding Sources FY15 FY16 FY17 FY18 FY19 FY20 FY21 FY22 FY23 FY24 TOTAL

Police Impact Fees $270,000 $270,000 $270,000 $270,000 $270,000 $1,350,000

$0

Total $0 $0 $270,000 $0 $270,000 $0 $270,000 $0 $270,000 $270,000 $1,350,000

Budget Impact/Other

57

Project # FD1801

Project Name Fire Station @ Citrus and Harrison

Type      Facility Department      FD

Category      Fire Department Contact      Fire Chief

Strategic Action #      Quality of Life Priority      1

Project Status      New Project

Description Total Project Cost: $4,020,000

Fire station to serve new development North of the Gila River in the Central zone.

Justification

To maintain the current level of service as the City continues to experience growth.

Expenditures FY15 FY16 FY17 FY18 FY19 FY20 FY21 FY22 FY23 FY24 TOTAL

143‐2210‐500.74.35 $4,020,000 $4,020,000

$0

Total $0 $0 $0 $4,020,000 $0 $0 $0 $0 $0 $0 $4,020,000

FY 2015‐24 CAPITAL IMPROVEMENT PROGRAM                                                      PROJECT DESCRIPTION

Funding Sources FY15 FY16 FY17 FY18 FY19 FY20 FY21 FY22 FY23 FY24 TOTAL

Fire Impact Fees $4,020,000 $4,020,000

$0

Total $0 $0 $0 $4,020,000 $0 $0 $0 $0 $0 $0 $4,020,000

Budget Impact/Other

Annual O&M is approximately $1,500,000.

58

Project # FD1802

Project Name Fire Apparatus

Type      Facility Department      FD

Category      Fire Department Contact      Fire Chief

Strategic Action #      Quality of Life Priority      3

Project Status      New Project

Description Total Project Cost: $2,797,685

Expand the fleet of fire vehicles and purchase additional equipment that has a useful life of at least 3 years.

Justification

To maintain the current level of service as the City continues to experience growth.

Expenditures FY15 FY16 FY17 FY18 FY19 FY20 FY21 FY22 FY23 FY24 TOTAL

143‐2210‐500.74.35 $640,500 $820,500 $1,336,685 $2,797,685

$0

Total $0 $0 $0 $640,500 $0 $0 $0 $0 $820,500 $1,336,685 $2,797,685

FY 2015‐24 CAPITAL IMPROVEMENT PROGRAM                                                      PROJECT DESCRIPTION

Funding Sources FY15 FY16 FY17 FY18 FY19 FY20 FY21 FY22 FY23 FY24 TOTAL

Fire Impact Fees $640,500 $820,500 $1,336,685 $2,797,685

$0

Total $0 $0 $0 $640,500 $0 $0 $0 $0 $820,500 $1,336,685 $2,797,685

Budget Impact/Other

59

Project # FD1801

Project Name Fire Station @ Willis & Rainbow Valley Rd.

Type      Facility Department      FD

Category      Fire Department Contact      Fire Chief

Strategic Action #      Quality of Life Priority      2

Project Status      New Project

Description Total Project Cost: $4,020,000

Fire station to serve new development South of the Gila River.

Justification

To maintain the current level of service as the City continues to experience growth.

Expenditures FY15 FY16 FY17 FY18 FY19 FY20 FY21 FY22 FY23 FY24 TOTAL

143‐2210‐500.74.35 $3,000,000 $1,020,000 $4,020,000

$0

Total $0 $0 $0 $0 $0 $0 $3,000,000 $1,020,000 $0 $0 $4,020,000

FY 2015‐24 CAPITAL IMPROVEMENT PROGRAM                                                      PROJECT DESCRIPTION

Funding Sources FY15 FY16 FY17 FY18 FY19 FY20 FY21 FY22 FY23 FY24 TOTAL

Fire Impact Fees $3,000,000 $1,020,000 $4,020,000

$0

Total $0 $0 $0 $0 $0 $0 $3,000,000 $1,020,000 $0 $0 $4,020,000

Budget Impact/Other

Annual O&M is approximately $1,500,000.

60

Project # FA1801

Project Name City Hall

Type      Facility Department      Engineering

Category      City Management Contact      Project Manager

Strategic Action #      Sense of Community Priority      1

Project Status      New Project

Description Total Project Cost: $42,110,721

Administration building will include Council chambers, public meeting rooms, and municipal offices.  This project outlines future space needs for administrative offices.

Justification

Previous studies have estimated that the City Hall will need to accommodate at least 150 additional employees and be approximately 75,000 sq. ft.

Expenditures FY15 FY16 FY17 FY18 FY19 FY20 FY21 FY22 FY23 FY24 TOTAL

376‐3431‐500‐7215 $25,000,000 $17,110,721 $42,110,721

$0

Total $0 $0 $0 $25,000,000 $0 $17,110,721 $0 $0 $0 $0 $42,110,721

FY 2015‐24 CAPITAL IMPROVEMENT PROGRAM                                                          PROJECT DESCRIPTION

Funding Sources FY15 FY16 FY17 FY18 FY19 FY20 FY21 FY22 FY23 FY24 TOTAL

Bond Financing $25,000,000 $17,110,721 $42,110,721

$0

Total $0 $0 $0 $25,000,000 $0 $17,110,721 $0 $0 $0 $0 $42,110,721

Budget Impact/Other

61

Project # ST18

Project Name Citrus ‐ McDowell to Van Buren (4 miles of street widening)

Type      Streets Department      Engineering

Category      Engineering Contact      Project Manager

Strategic Action #      Quality of Life Priority      1

Project Status      New Project

Description Total Project Cost: $4,076,900

4 miles of street widening

Justification

Project identified in the 10‐yr Infrastructure Improvement Plan as necessary to support growth.

Expenditures FY15 FY16 FY17 FY18 FY19 FY20 FY21 FY22 FY23 FY24 TOTAL

147‐3431‐500‐73.30 $2,316,774 $1,760,126 $4,076,900

$0

Total $0 $0 $0 $2,316,774 $1,760,126 $0 $0 $0 $0 $0 $4,076,900

FY 2015‐24 CAPITAL IMPROVEMENT PROGRAM                                                            PROJECT DESCRIPTION

Funding Sources FY15 FY16 FY17 FY18 FY19 FY20 FY21 FY22 FY23 FY24 TOTAL

Transportation Fees $2,316,774 $1,760,126 $4,076,900

$0

Total $0 $0 $0 $2,316,774 $1,760,126 $0 $0 $0 $0 $0 $4,076,900

Budget Impact/Other

62

Project # ST19

Project Name Citrus & VanBuren 

Type      Streets Department      Engineering

Category      Engineering Contact      Project Manager

Strategic Action #      Quality of Life Priority      1

Project Status      New Project

Description Total Project Cost: $491,899

Construct intersection improvements including a traffic signal.

Justification

Project identified in the 10‐yr Infrastructure Improvement Plan as necessary to support growth

Expenditures FY15 FY16 FY17 FY18 FY19 FY20 FY21 FY22 FY23 FY24 TOTAL

147‐3431‐500‐73.45 $491,899 $491,899

$0

Total $0 $0 $0 $0 $491,899 $0 $0 $0 $0 $0 $491,899

FY 2015‐24 CAPITAL IMPROVEMENT PROGRAM                                                            PROJECT DESCRIPTION

Funding Sources FY15 FY16 FY17 FY18 FY19 FY20 FY21 FY22 FY23 FY24 TOTAL

Transportation Fees $491,899 $491,899

$0

Total $0 $0 $0 $0 $491,899 $0 $0 $0 $0 $0 $491,899

Budget Impact/Other

63

Project # ST22

Project Name 3 signalization EMR along Estrella Parkway

Type      Streets Department      Engineering

Category      Engineering Contact      Project Manager

Strategic Action #      Quality of Life Priority      1

Project Status      New Project

Description Total Project Cost: $1,200,000

Intersection improvements including signalization, street widening  which will add 3.3 lane miles of capacity.

Justification

Project identified in the 10‐yr Infrastructure Improvement Plan as necessary to support growth

Expenditures FY15 FY16 FY17 FY18 FY19 FY20 FY21 FY22 FY23 FY24 TOTAL

148‐3431‐500.73.45 $1,200,000 $1,200,000

$0

Total $0 $0 $0 $0 $0 $0 $0 $1,200,000 $0 $0 $1,200,000

FY 2015‐24 CAPITAL IMPROVEMENT PROGRAM                                                            PROJECT DESCRIPTION

Funding Sources FY15 FY16 FY17 FY18 FY19 FY20 FY21 FY22 FY23 FY24 TOTAL

Transportation Fees $1,200,000 $1,200,000

$0

Total $0 $0 $0 $0 $0 $0 $0 $1,200,000 $0 $0 $1,200,000

Budget Impact/Other

64

Project # ST18

Project Name Fiber Project: Yuma Estrella to Cotton

Type      Streets Department      Engineering

Category      Engineering Contact      Project Manager

Strategic Action #      Quality of Life Priority      1

Project Status      New Project

Description Total Project Cost: $109,566

Install fiber optic cable and related traffic management equipment

Justification

Timing with MAG matching funds will determine scope of project

Expenditures FY15 FY16 FY17 FY18 FY19 FY20 FY21 FY22 FY23 FY24 TOTAL

147‐3431‐500.72.30 $109,566 $109,566

$0

Total $0 $0 $0 $109,566 $0 $0 $0 $0 $0 $0 $109,566

FY 2015‐24 CAPITAL IMPROVEMENT PROGRAM                                                            PROJECT DESCRIPTION

Funding Sources FY15 FY16 FY17 FY18 FY19 FY20 FY21 FY22 FY23 FY24 TOTAL

Transportation Impact Fees $109,566 $109,566

$0

Total $0 $0 $0 $109,566 $0 $0 $0 $0 $0 $0 $109,566

Budget Impact/Other

65

Project # ST16

Project Name Fiber Project: Van Buren Estrella to Cotton Ln.

Type      Streets Department      Engineering

Category      Engineering Contact      Project Manager

Strategic Action #      Quality of Life Priority      1

Project Status      New Project

Description Total Project Cost: $185,836

Install fiber optic cable and related traffic management equipment

Justification

Timing with MAG matching funds will determine scope of project

Expenditures FY15 FY16 FY17 FY18 FY19 FY20 FY21 FY22 FY23 FY24 TOTAL

147‐3431‐500.72.30 $185,836 $185,836

$0

Total $0 $185,836 $0 $0 $0 $0 $0 $0 $0 $0 $185,836

FY 2015‐24 CAPITAL IMPROVEMENT PROGRAM                                                      PROJECT DESCRIPTION

Funding Sources FY15 FY16 FY17 FY18 FY19 FY20 FY21 FY22 FY23 FY24 TOTAL

Transportation Impact Fees $185,836 $185,836

$0

Total $0 $185,836 $0 $0 $0 $0 $0 $0 $0 $0 $185,836

Budget Impact/Other

66

Project # ST20

Project Name Indian School & Cotton Lane

Type      Streets Department      Engineering

Category      Engineering Contact      Project Manager

Strategic Action #      Quality of Life Priority      1

Project Status      New Project

Description Total Project Cost: $1,729,700

Intersection improvements

Justification

Project identified in the 10‐yr Infrastructure Improvement Plan as necessary to support growth.

Expenditures FY15 FY16 FY17 FY18 FY19 FY20 FY21 FY22 FY23 FY24 TOTAL

147‐3431‐500.72.30 $1,729,700 $1,729,700

$0

Total $0 $0 $0 $0 $0 $1,729,700 $0 $0 $0 $0 $1,729,700

FY 2015‐24 CAPITAL IMPROVEMENT PROGRAM                                                      PROJECT DESCRIPTION

Funding Sources FY15 FY16 FY17 FY18 FY19 FY20 FY21 FY22 FY23 FY24 TOTAL

Transportation Impact Fees $1,729,700 $1,729,700

$0

Total $0 $0 $0 $0 $0 $1,729,700 $0 $0 $0 $0 $1,729,700

Budget Impact/Other

67

Project # ST21

Project Name MC85 @ Estrella Parkway

Type      Streets Department      Engineering

Category      Engineering Contact      Project Manager

Strategic Action #      Quality of Life Priority      1

Project Status      New Project

Description Total Project Cost: $1,639,000

Lane widening improve to 6 lanes

Justification

Project identified in the 10‐yr Infrastructure Improvement Plan as necessary to support growth.

Expenditures FY15 FY16 FY17 FY18 FY19 FY20 FY21 FY22 FY23 FY24 TOTAL

147‐3431‐500.72.30 $1,639,000 $1,639,000

$0

Total $0 $0 $0 $0 $0 $0 $1,639,000 $0 $0 $0 $1,639,000

FY 2015‐24 CAPITAL IMPROVEMENT PROGRAM                                                            PROJECT DESCRIPTION

Funding Sources FY15 FY16 FY17 FY18 FY19 FY20 FY21 FY22 FY23 FY24 TOTAL

Transportation Fees $1,639,000 $1,639,000

$0

Total $0 $0 $0 $0 $0 $0 $1,639,000 $0 $0 $0 $1,639,000

Budget Impact/Other

68

Project # ST20

Project Name McDowell Rd Citrus to Loop 303

Type      Streets Department      Engineering

Category      Engineering Contact      Project Manager

Strategic Action #      Quality of Life Priority      1

Project Status      New Project

Description Total Project Cost: $4,945,922

Street widening

Justification

Project identified in the 10‐yr Infrastructure Improvement Plan as necessary to support growth

Expenditures FY15 FY16 FY17 FY18 FY19 FY20 FY21 FY22 FY23 FY24 TOTAL

147‐3431‐500.72.30 $1,414,152 $3,531,770 $4,945,922

$0

Total $0 $0 $0 $0 $0 $1,414,152 $0 $3,531,770 $0 $0 $4,945,922

FY 2015‐24 CAPITAL IMPROVEMENT PROGRAM                                                      PROJECT DESCRIPTION

Funding Sources FY15 FY16 FY17 FY18 FY19 FY20 FY21 FY22 FY23 FY24 TOTAL

Transportation Fees $1,414,152 $3,531,770 $4,945,922

$0

Total $0 $0 $0 $0 $0 $1,414,152 $0 $3,531,770 $0 $0 $4,945,922

Budget Impact/Other

69

Project # ST18

Project Name McDowell Rd @ Citrus 

Type      Streets Department      Engineering

Category      Engineering Contact      Project Manager

Strategic Action #      Quality of Life Priority      1

Project Status      New Project

Description Total Project Cost: $1,656,900

Intersection improvements

Justification

Project identified in the 10‐yr Infrastructure Improvement Plan as necessary to support growth

Expenditures FY15 FY16 FY17 FY18 FY19 FY20 FY21 FY22 FY23 FY24 TOTAL

147‐3431‐500.72.30 $1,656,900 $1,656,900

$0

Total $0 $0 $0 $1,656,900 $0 $0 $0 $0 $0 $0 $1,656,900

FY 2015‐24 CAPITAL IMPROVEMENT PROGRAM                                                      PROJECT DESCRIPTION

Funding Sources FY15 FY16 FY17 FY18 FY19 FY20 FY21 FY22 FY23 FY24 TOTAL

Transportation Fees $1,656,900 $1,656,900

$0

Total $0 $0 $0 $1,656,900 $0 $0 $0 $0 $0 $0 $1,656,900

Budget Impact/Other

70

Project # ST17

Project Name Pavement Management Program

Type      Streets Department      Engineering

Category      Engineering Contact      Project Manager

Strategic Action #      Quality of Life Priority      1

Project Status      New Project

Description Total Project Cost: $15,321,718

Repair and replacement of pavement to roadways

Justification

This project will extend the life of roadways in Goodyear and will improve drivability, safety and physical appearance, which will improve the quality of life for 

residents and help encourage development.

Expenditures FY15 FY16 FY17 FY18 FY19 FY20 FY21 FY22 FY23 FY24 TOTAL

001‐3431‐500.72.30 $3,000,000 $2,810,156 $1,679,239 $2,809,484 $988,948 $2,533,891 $1,500,000 $15,321,718

$0

Total $0 $0 $3,000,000 $2,810,156 $1,679,239 $0 $2,809,484 $988,948 $2,533,891 $1,500,000 $15,321,718

FY 2015‐24 CAPITAL IMPROVEMENT PROGRAM                                                      PROJECT DESCRIPTION

Funding Sources FY15 FY16 FY17 FY18 FY19 FY20 FY21 FY22 FY23 FY24 TOTAL

General Fund $3,000,000 $2,810,156 $1,679,239 $2,809,484 $988,948 $2,533,891 $1,500,000 $15,321,718

$0

Total $0 $0 $3,000,000 $2,810,156 $1,679,239 $0 $2,809,484 $988,948 $2,533,891 $1,500,000 $15,321,718

Budget Impact/Other

71

Project # ST17

Project Name Sarival Ave Jefferson St to Yuma Rd

Type      Streets Department      Engineering

Category      Engineering Contact      Project Manager

Strategic Action #      Quality of Life Priority      1

Project Status      New Project

Description Total Project Cost: $1,721,900

Street widening

Justification

Project identified in the 10‐yr Infrastructure Improvement Plan as necessary to support growth.

Expenditures FY15 FY16 FY17 FY18 FY19 FY20 FY21 FY22 FY23 FY24 TOTAL

147‐3431‐500‐73.30 $1,721,900 $1,721,900

$0

Total $0 $0 $1,721,900 $0 $0 $0 $0 $0 $0 $0 $1,721,900

FY 2015‐24 CAPITAL IMPROVEMENT PROGRAM                                                      PROJECT DESCRIPTION

Funding Sources FY15 FY16 FY17 FY18 FY19 FY20 FY21 FY22 FY23 FY24 TOTAL

Transportation Fees $1,721,900 $1,721,900

$0

Total $0 $0 $1,721,900 $0 $0 $0 $0 $0 $0 $0 $1,721,900

Budget Impact/Other

72

Project # ST22

Project Name Traffic Signals

Type      Streets Department      Engineering

Category      Engineering Contact      Project Manager

Strategic Action #      Quality of Life Priority      1

Project Status      New Project

Description Total Project Cost: $1,800,000

Signalization for various locations

Justification

Project identified in the 10‐yr Infrastructure Improvement Plan as necessary to support growth.

Expenditures FY15 FY16 FY17 FY18 FY19 FY20 FY21 FY22 FY23 FY24 TOTAL

147‐3431‐500‐73.45 $400,000 $500,000 $900,000 $1,800,000

$0

Total $0 $0 $0 $0 $0 $0 $0 $400,000 $500,000 $900,000 $1,800,000

FY 2015‐24 CAPITAL IMPROVEMENT PROGRAM                                                      PROJECT DESCRIPTION

Funding Sources FY15 FY16 FY17 FY18 FY19 FY20 FY21 FY22 FY23 FY24 TOTAL

Transportation Fees $400,000 $500,000 $900,000 $1,800,000

$0

Total $0 $0 $0 $0 $0 $0 $0 $400,000 $500,000 $900,000 $1,800,000

Budget Impact/Other

73

Project # ST16

Project Name Van Buren @ Litchfield Rd. 

Type      Streets Department      Engineering

Category      Engineering Contact      Project Manager

Strategic Action #      Quality of Life Priority      1

Project Status      New Project

Description Total Project Cost: $2,364,300

Intersection improvements

Justification

Project identified in the 10‐yr Infrastructure Improvement Plan as necessary to support growth

Expenditures FY15 FY16 FY17 FY18 FY19 FY20 FY21 FY22 FY23 FY24 TOTAL

147‐3431‐500‐73.30 $2,364,300 $2,364,300

$0

Total $0 $2,364,300 $0 $0 $0 $0 $0 $0 $0 $0 $2,364,300

FY 2015‐24 CAPITAL IMPROVEMENT PROGRAM                                                      PROJECT DESCRIPTION

Funding Sources FY15 FY16 FY17 FY18 FY19 FY20 FY21 FY22 FY23 FY24 TOTAL

Transportation Fees $2,364,300 $2,364,300

$0

Total $0 $2,364,300 $0 $0 $0 $0 $0 $0 $0 $0 $2,364,300

Budget Impact/Other

74

Project # ST24

Project Name Van Buren @ Citrus Rd. to Cotton Ln.

Type      Streets Department      Engineering

Category      Engineering Contact      Project Manager

Strategic Action #      Quality of Life Priority      1

Project Status      New Project

Description Total Project Cost: $960,807

Street Widening

Justification

Project identified in the 10‐yr Infrastructure Improvement Plan as necessary to support growth.

Expenditures FY15 FY16 FY17 FY18 FY19 FY20 FY21 FY22 FY23 FY24 TOTAL

147‐3431‐500‐73.30 $960,807 $960,807

$0

Total $0 $0 $0 $0 $0 $0 $0 $0 $0 $960,807 $960,807

FY 2015‐24 CAPITAL IMPROVEMENT PROGRAM                                                      PROJECT DESCRIPTION

Funding Sources FY15 FY16 FY17 FY18 FY19 FY20 FY21 FY22 FY23 FY24 TOTAL

Transportation Fees $960,807 $960,807

$0

Total $0 $0 $0 $0 $0 $0 $0 $0 $0 $960,807 $960,807

Budget Impact/Other

75

Project # ST24

Project Name Van Buren:  Estrella to Sarival

Type      Streets Department      Engineering

Category      Engineering Contact      Project Manager

Strategic Action #      Quality of Life Priority      1

Project Status      New Project

Description Total Project Cost: $2,000,000

Street Widening

Justification

Project identified in the 10‐yr Infrastructure Improvement Plan as necessary to support growth.

Expenditures FY15 FY16 FY17 FY18 FY19 FY20 FY21 FY22 FY23 FY24 TOTAL

147‐3431‐500‐73.30 $2,000,000 $2,000,000

$0

Total $0 $2,000,000 $0 $0 $0 $0 $0 $0 $0 $0 $2,000,000

FY 2015‐24 CAPITAL IMPROVEMENT PROGRAM                                                      PROJECT DESCRIPTION

Funding Sources FY15 FY16 FY17 FY18 FY19 FY20 FY21 FY22 FY23 FY24 TOTAL

Transportation Fees $2,000,000 $2,000,000

$0

Total $0 $2,000,000 $0 $0 $0 $0 $0 $0 $0 $0 $2,000,000

Budget Impact/Other

76

Project # ST23

Project Name Willis Rd:  Callistoga to Rainbow Valley

Type      Streets Department      Engineering

Category      Engineering Contact      Project Manager

Strategic Action #      Quality of Life Priority      S1

Project Status      New Project

Description Total Project Cost: $3,926,000

Street widening

Justification

Project identified in the 10‐yr Infrastructure Improvement Plan as necessary to support growth.

Expenditures FY15 FY16 FY17 FY18 FY19 FY20 FY21 FY22 FY23 FY24 TOTAL

148‐3431‐500‐73.30 $1,029,579 $2,896,421 $3,926,000

$0

Total $0 $0 $0 $0 $0 $0 $0 $0 $1,029,579 $2,896,421 $3,926,000

FY 2015‐24 CAPITAL IMPROVEMENT PROGRAM                                                      PROJECT DESCRIPTION

Funding Sources FY15 FY16 FY17 FY18 FY19 FY20 FY21 FY22 FY23 FY24 TOTAL

Transportation Fees $1,029,579 $2,896,421 $3,926,000

$0

Total $0 $0 $0 $0 $0 $0 $0 $0 $1,029,579 $2,896,421 $3,926,000

Budget Impact/Other

77

Project # ST22

Project Name Yuma Road:  Cotton to Sarival

Type      Streets Department      Engineering

Category      Engineering Contact      Project Manager

Strategic Action #      Quality of Life Priority      S1

Project Status      New Project

Description Total Project Cost: $2,193,000

Street widening

Justification

Project identified in the 10 yer Infrastructure Improvement Plan as necessary to support growth.

Expenditures FY15 FY16 FY17 FY18 FY19 FY20 FY21 FY22 FY23 FY24 TOTAL

001‐3431‐500.73.30 $2,193,000 $2,193,000

$0

Total $0 $0 $0 $0 $0 $0 $0 $2,193,000 $0 $0 $2,193,000

FY 2015‐24 CAPITAL IMPROVEMENT PROGRAM                                                      PROJECT DESCRIPTION

Funding Sources FY15 FY16 FY17 FY18 FY19 FY20 FY21 FY22 FY23 FY24 TOTAL

General Fund $2,193,000 $2,193,000

$0

Total $0 $0 $0 $0 $0 $0 $0 $2,193,000 $0 $0 $2,193,000

Budget Impact/Other

78

Project # ST24

Project Name Yuma Road Bridge @ Bullard Wash

Type      Streets Department      Engineering

Category      Engineering Contact      Project Manager

Strategic Action #      Quality of Life Priority      S1

Project Status      New Project

Description Total Project Cost: $1,000,000

Install a bridge over Bullard Wash at Yuma Road

Justification

Received grant funds for design work, which has been completed.

Expenditures FY15 FY16 FY17 FY18 FY19 FY20 FY21 FY22 FY23 FY24 TOTAL

001‐3431‐500‐73.30 $1,000,000 $1,000,000

$0

Total $0 $0 $0 $0 $0 $0 $0 $0 $0 $1,000,000 $1,000,000

FY 2015‐24 CAPITAL IMPROVEMENT PROGRAM                                                      PROJECT DESCRIPTION

Funding Sources FY15 FY16 FY17 FY18 FY19 FY20 FY21 FY22 FY23 FY24 TOTAL

General Fund $1,000,000 $1,000,000

$0

Total $0 $0 $0 $0 $0 $0 $0 $0 $0 $1,000,000 $1,000,000

Budget Impact/Other

79

Project # FY17

Project Name Yuma Rd @ Bullard Ave 

Type      Streets Department      Engineering

Category      Engineering Contact      Project Manager

Strategic Action #      Quality of Life Priority      1

Project Status      New Project

Description Total Project Cost: $2,014,000

Construct intersection improvements, turn lanes and a traffic signal

Justification

Project identified in the 10‐yr Infrastructure Improvement Plan as necessary to support growth.

Expenditures FY15 FY16 FY17 FY18 FY19 FY20 FY21 FY22 FY23 FY24 TOTAL

147‐3431‐500.73.30 $1,289,145 $724,855 $2,014,000

$0

Total $0 $0 $1,289,145 $724,855 $0 $0 $0 $0 $0 $0 $2,014,000

FY 2015‐24 CAPITAL IMPROVEMENT PROGRAM                                                      PROJECT DESCRIPTION

Funding Sources FY15 FY16 FY17 FY18 FY19 FY20 FY21 FY22 FY23 FY24 TOTAL

Transportation Fees $1,289,145 $724,855 $2,014,000

$0

Total $0 $0 $1,289,145 $724,855 $0 $0 $0 $0 $0 $0 $2,014,000

Budget Impact/Other

80

Project # WA17

Project Name EPCOR Install of 36" transmission line 

Type      Water Department      Water Department

Category      Water Contact      Water Resources Manager

Strategic Action #      Quality of Life Priority      1

Project Status      New Project

Description Total Project Cost: $16,027,319

Transmission line from EPCOR to West Goodyear (5 MGD)

Justification

Ensure water supply (facilitate transmission of CAP water to city).

Expenditures FY15 FY16 FY17 FY18 FY19 FY20 FY21 FY22 FY23 FY24 TOTAL

453‐5110‐500.72.40 $1,000,000 $7,051,754 $7,554,091 $421,474 $16,027,319

$0

Total $0 $0 $1,000,000 $7,051,754 $7,554,091 $421,474 $0 $0 $0 $0 $16,027,319

FY 2015‐24 CAPITAL IMPROVEMENT PROGRAM                                                       PROJECT DESCRIPTION

Funding Sources FY15 FY16 FY17 FY18 FY19 FY20 FY21 FY22 FY23 FY24 TOTAL

Water Dev Fees $1,000,000 $7,051,754 $7,554,091 $421,474 $16,027,319

$0

Total $0 $0 $1,000,000 $7,051,754 $7,554,091 $421,474 $0 $0 $0 $0 $16,027,319

Budget Impact/Other

81

Project # WA20

Project Name Well #3 ‐ 2 MGD

Type      Water Department      Water Department

Category      Water Contact      Water Resources Manager

Strategic Action #      Quality of Life Priority      1

Project Status      New Project

Description Total Project Cost: $1,293,000

Justification

Ensure water supply

Expenditures FY15 FY16 FY17 FY18 FY19 FY20 FY21 FY22 FY23 FY24 TOTAL

453‐5110‐500.72.40 $1,293,000 $1,293,000

$0

Total $0 $0 $0 $0 $0 $1,293,000 $0 $0 $0 $0 $1,293,000

FY 2015‐24 CAPITAL IMPROVEMENT PROGRAM                                                       PROJECT DESCRIPTION

Funding Sources FY15 FY16 FY17 FY18 FY19 FY20 FY21 FY22 FY23 FY24 TOTAL

Water Dev Fees $1,293,000 $1,293,000

$0

Total $0 $0 $0 $0 $0 $1,293,000 $0 $0 $0 $0 $1,293,000

Budget Impact/Other

82

Project # WA20

Project Name Well #3 ‐ Arsenic Treatment Plant 1.5 MGD

Type      Water Department      Water Department

Category      Water Contact      Water Resources Manager

Strategic Action #      Quality of Life Priority      1

Project Status      New Project

Description Total Project Cost: $4,300,000

Justification

Ensure water supply

Expenditures FY15 FY16 FY17 FY18 FY19 FY20 FY21 FY22 FY23 FY24 TOTAL

453‐5110‐500.72.40 $4,300,000 $4,300,000

$0

Total $0 $0 $0 $0 $0 $4,300,000 $0 $0 $0 $0 $4,300,000

FY 2015‐24 CAPITAL IMPROVEMENT PROGRAM                                                       PROJECT DESCRIPTION

Funding Sources FY15 FY16 FY17 FY18 FY19 FY20 FY21 FY22 FY23 FY24 TOTAL

Water Dev Fees $4,300,000 $4,300,000

$0

Total $0 $0 $0 $0 $0 $4,300,000 $0 $0 $0 $0 $4,300,000

Budget Impact/Other

83

Project # WA15

Project Name Citrus & Harrison ‐ Silva Site Booster 6 MGD

Type      Water Department      Water Department

Category      Water Contact      Water Resources Manager

Strategic Action #      Quality of Life Priority      1

Project Status      New Project

Description Total Project Cost: $1,778,000

Justification

Ensure water supply

Expenditures FY15 FY16 FY17 FY18 FY19 FY20 FY21 FY22 FY23 FY24 TOTAL

453‐5110‐500.72.40 $1,778,000 $1,778,000

$0

Total $0 $0 $0 $1,778,000 $0 $0 $0 $0 $0 $0 $1,778,000

FY 2015‐24 CAPITAL IMPROVEMENT PROGRAM                                                       PROJECT DESCRIPTION

Funding Sources FY15 FY16 FY17 FY18 FY19 FY20 FY21 FY22 FY23 FY24 TOTAL

Water Dev Fees $1,778,000 $1,778,000

$0

Total $0 $0 $0 $1,778,000 $0 $0 $0 $0 $0 $0 $1,778,000

Budget Impact/Other

84

Project # WA18

Project Name Citrus & Harrison ‐ Silva Site 2 MG (same as West Goodyear)

Type      Water Department      Water Department

Category      Water Contact      Water Resources Manager

Strategic Action #      Quality of Life Priority      1

Project Status      New Project

Description Total Project Cost: $4,060,000

Justification

Ensure water supply

Expenditures FY15 FY16 FY17 FY18 FY19 FY20 FY21 FY22 FY23 FY24 TOTAL

453‐5110‐500.72.40 $4,060,000 $4,060,000

$0

Total $0 $0 $0 $4,060,000 $0 $0 $0 $0 $0 $0 $4,060,000

FY 2015‐24 CAPITAL IMPROVEMENT PROGRAM                                                       PROJECT DESCRIPTION

Funding Sources FY15 FY16 FY17 FY18 FY19 FY20 FY21 FY22 FY23 FY24 TOTAL

Water Dev Fees $4,060,000 $4,060,000

$0

Total $0 $0 $0 $4,060,000 $0 $0 $0 $0 $0 $0 $4,060,000

Budget Impact/Other

85

Project # WA24

Project Name Well #4 2 MGD

Type      Water Department      Water Department

Category      Water Contact      Water Resources Manager

Strategic Action #      Quality of Life Priority      1

Project Status      New Project

Description Total Project Cost: $1,293,000

Justification

Ensure water supply

Expenditures FY15 FY16 FY17 FY18 FY19 FY20 FY21 FY22 FY23 FY24 TOTAL

453‐5110‐500.72.40 $1,293,000 $1,293,000

$0

Total $0 $0 $0 $0 $0 $0 $0 $0 $0 $1,293,000 $1,293,000

FY 2015‐24 CAPITAL IMPROVEMENT PROGRAM                                                        PROJECT DESCRIPTION

Funding Sources FY15 FY16 FY17 FY18 FY19 FY20 FY21 FY22 FY23 FY24 TOTAL

Water Dev Fees $1,293,000 $1,293,000

$0

Total $0 $0 $0 $0 $0 $0 $0 $0 $0 $1,293,000 $1,293,000

Budget Impact/Other

86

Project # WA24

Project Name Well #4 Arsenic Treatment 

Type      Water Department      Water Department

Category      Water Contact      Water Resources Manager

Strategic Action #      Quality of Life Priority      1

Project Status      New Project

Description Total Project Cost: $4,920,000

Justification

Ensure water supply

Expenditures FY15 FY16 FY17 FY18 FY19 FY20 FY21 FY22 FY23 FY24 TOTAL

453‐5110‐500.72.40 $4,920,000 $4,920,000

$0

Total $0 $0 $0 $0 $0 $0 $0 $0 $0 $4,920,000 $4,920,000

FY 2015‐24 CAPITAL IMPROVEMENT PROGRAM                                                        PROJECT DESCRIPTION

Funding Sources FY15 FY16 FY17 FY18 FY19 FY20 FY21 FY22 FY23 FY24 TOTAL

Water Dev Fees $4,920,000 $4,920,000

$0

Total $0 $0 $0 $0 $0 $0 $0 $0 $0 $4,920,000 $4,920,000

Budget Impact/Other

87

Project # WA18

Project Name Site 18 Reservoir 2 MGD

Type      Water Department      Water Department

Category      Water Contact      Water Resources Manager

Strategic Action #      Quality of Life Priority      1

Project Status      New Project

Description Total Project Cost: $1,500,000

Justification

Ensure water supply

Expenditures FY15 FY16 FY17 FY18 FY19 FY20 FY21 FY22 FY23 FY24 TOTAL

451‐5110‐500.72.40 $1,500,000 $1,500,000

$0

Total $0 $0 $0 $1,500,000 $0 $0 $0 $0 $0 $0 $1,500,000

FY 2015‐24 CAPITAL IMPROVEMENT PROGRAM                                                        PROJECT DESCRIPTION

Funding Sources FY15 FY16 FY17 FY18 FY19 FY20 FY21 FY22 FY23 FY24 TOTAL

Water Dev Fees $1,500,000 $1,500,000

$0

Total $0 $0 $0 $1,500,000 $0 $0 $0 $0 $0 $0 $1,500,000

Budget Impact/Other

88

Project # WA24

Project Name Well #5 ‐ 2 MGD

Type      Water Department      Water Department

Category      Water Contact      Water Resources Manager

Strategic Action #      Quality of Life Priority      1

Project Status      New Project

Description Total Project Cost: $1,293,000

Justification

Ensure water supply

Expenditures FY15 FY16 FY17 FY18 FY19 FY20 FY21 FY22 FY23 FY24 TOTAL

453‐5110‐500.72.40 $1,293,000 $1,293,000

$0

Total $0 $0 $0 $0 $0 $0 $0 $0 $0 $1,293,000 $1,293,000

FY 2015‐24 CAPITAL IMPROVEMENT PROGRAM                                                        PROJECT DESCRIPTION

Funding Sources FY15 FY16 FY17 FY18 FY19 FY20 FY21 FY22 FY23 FY24 TOTAL

Water Dev Fees $1,293,000 $1,293,000

$0

Total $0 $0 $0 $0 $0 $0 $0 $0 $0 $1,293,000 $1,293,000

Budget Impact/Other

89

Project # WA24

Project Name Well #5 ‐Arsenic Treatment  2 MGD

Type      Water Department      Water Department

Category      Water Contact      Water Resources Manager

Strategic Action #      Quality of Life Priority      1

Project Status      New Project

Description Total Project Cost: $4,900,000

Justification

Ensure water supply

Expenditures FY15 FY16 FY17 FY18 FY19 FY20 FY21 FY22 FY23 FY24 TOTAL

453‐5110‐500.72.40 $4,900,000 $4,900,000

$0

Total $0 $0 $0 $0 $0 $0 $0 $0 $0 $4,900,000 $4,900,000

FY 2015‐24 CAPITAL IMPROVEMENT PROGRAM                                                        PROJECT DESCRIPTION

Funding Sources FY15 FY16 FY17 FY18 FY19 FY20 FY21 FY22 FY23 FY24 TOTAL

Water Dev Fees $4,900,000 $4,900,000

$0

Total $0 $0 $0 $0 $0 $0 $0 $0 $0 $4,900,000 $4,900,000

Budget Impact/Other

90

Project # WA23

Project Name Lower Buckeye & Cotton Site 12 Booster 4 MGD

Type      Water Department      Water Department

Category      Water Contact      Water Resources Manager

Strategic Action #      Quality of Life Priority      1

Project Status      New Project

Description Total Project Cost: $1,810,000

Justification

Ensure water supply

Expenditures FY15 FY16 FY17 FY18 FY19 FY20 FY21 FY22 FY23 FY24 TOTAL

453‐5110‐500.72.40 $1,810,000 $1,810,000

$0

Total $0 $0 $0 $0 $0 $0 $0 $0 $1,810,000 $0 $1,810,000

FY 2015‐24 CAPITAL IMPROVEMENT PROGRAM                                                        PROJECT DESCRIPTION

Funding Sources FY15 FY16 FY17 FY18 FY19 FY20 FY21 FY22 FY23 FY24 TOTAL

Water Dev Fees $0 $0 $0 $0 $0 $1,810,000 $1,810,000

$0

Total $0 $0 $0 $0 $0 $0 $0 $0 $1,810,000 $0 $1,810,000

Budget Impact/Other

91

Project # WA24

Project Name EPCOR 2nd Transmission Line & WTP (6.7 MGD) Full Capacity

Type      Water Department      Water Department

Category      Water Contact      Water Resources Manager

Strategic Action #      Quality of Life Priority      1

Project Status      New Project

Description Total Project Cost: $46,966,000

Justification

Ensure water supply

Expenditures FY15 FY16 FY17 FY18 FY19 FY20 FY21 FY22 FY23 FY24 TOTAL

453‐5110‐500.72.40 $46,966,000 $46,966,000

$0

Total $0 $0 $0 $0 $0 $0 $0 $0 $0 $46,966,000 $46,966,000

FY 2015‐24 CAPITAL IMPROVEMENT PROGRAM                                                         PROJECT DESCRIPTION

Funding Sources FY15 FY16 FY17 FY18 FY19 FY20 FY21 FY22 FY23 FY24 TOTAL

Water Dev Fees $0 $0 $0 $0 $0 $0 $0 $0 $46,966,000 $46,966,000

$0

Total $0 $0 $0 $0 $0 $0 $0 $0 $0 $46,966,000 $46,966,000

Budget Impact/Other

92

Project # WA21

Project Name Southern Solution Brine Beds

Type      Water Department      Water Department

Category      Water Contact      Water Resources Manager

Strategic Action #      Quality of Life Priority      1

Project Status      New Project

Description Total Project Cost: $4,718,934

Justification

Ensure water supply

Expenditures FY15 FY16 FY17 FY18 FY19 FY20 FY21 FY22 FY23 FY24 TOTAL

454‐5110‐500.72.40 $2,359,467 $2,359,467 $4,718,934

$0

Total $0 $0 $0 $0 $0 $0 $2,359,467 $0 $2,359,467 $0 $4,718,934

FY 2015‐24 CAPITAL IMPROVEMENT PROGRAM                                                         PROJECT DESCRIPTION

Funding Sources FY15 FY16 FY17 FY18 FY19 FY20 FY21 FY22 FY23 FY24 TOTAL

Water Dev Fees $0 $0 $0 $0 $0 $2,359,467 $0 $2,359,467 $0 $4,718,934

$0

Total $0 $0 $0 $0 $0 $0 $2,359,467 $0 $2,359,467 $0 $4,718,934

Budget Impact/Other

93

Project # WA22

Project Name Transmission Mains

Type      Water Department      Water Department

Category      Water Contact      Water Resources Manager

Strategic Action #      Quality of Life Priority      1

Project Status      New Project

Description Total Project Cost: $4,685,295

Justification

Ensure water supply

Expenditures FY15 FY16 FY17 FY18 FY19 FY20 FY21 FY22 FY23 FY24 TOTAL

454‐5110‐500.72.40 $4,685,295 $4,685,295

$0

Total $0 $0 $0 $0 $0 $0 $0 $4,685,295 $0 $0 $4,685,295

FY 2015‐24 CAPITAL IMPROVEMENT PROGRAM                                                         PROJECT DESCRIPTION

Funding Sources FY15 FY16 FY17 FY18 FY19 FY20 FY21 FY22 FY23 FY24 TOTAL

Water Dev Fees $0 $0 $0 $0 $0 $0 $4,685,295 $0 $0 $4,685,295

$0

Total $0 $0 $0 $0 $0 $0 $0 $4,685,295 $0 $0 $4,685,295

Budget Impact/Other

94

Project # WA23

Project Name Cotton Lane 20" Transmission Main

Type      Water Department      Water Department

Category      Water Contact      Water Resources Manager

Strategic Action #      Quality of Life Priority      1

Project Status      New Project

Description Total Project Cost: $1,900,000

Justification

Ensure water supply

Expenditures FY15 FY16 FY17 FY18 FY19 FY20 FY21 FY22 FY23 FY24 TOTAL

454‐5110‐500.72.40 $1,900,000 $1,900,000

$0

Total $0 $0 $0 $0 $0 $0 $0 $0 $1,900,000 $0 $1,900,000

FY 2015‐24 CAPITAL IMPROVEMENT PROGRAM                                                         PROJECT DESCRIPTION

Funding Sources FY15 FY16 FY17 FY18 FY19 FY20 FY21 FY22 FY23 FY24 TOTAL

Water Dev Fees $0 $0 $0 $0 $0 $0 $0 $1,900,000 $0 $1,900,000

$0

Total $0 $0 $0 $0 $0 $0 $0 $0 $1,900,000 $0 $1,900,000

Budget Impact/Other

95

Project # WA23

Project Name Rainbow Valley & Site 13 Booster

Type      Water Department      Water Department

Category      Water Contact      Water Resources Manager

Strategic Action #      Quality of Life Priority      1

Project Status      New Project

Description Total Project Cost: $1,750,000

Justification

Ensure water supply

Expenditures FY15 FY16 FY17 FY18 FY19 FY20 FY21 FY22 FY23 FY24 TOTAL

454‐5110‐500.72.40 $1,750,000 $1,750,000

$0

Total $0 $0 $0 $0 $0 $0 $0 $0 $1,750,000 $0 $1,750,000

FY 2015‐24 CAPITAL IMPROVEMENT PROGRAM                                                         PROJECT DESCRIPTION

Funding Sources FY15 FY16 FY17 FY18 FY19 FY20 FY21 FY22 FY23 FY24 TOTAL

Water Dev Fees $0 $0 $0 $0 $0 $0 $0 $1,750,000 $0 $1,750,000

$0

Total $0 $0 $0 $0 $0 $0 $0 $0 $1,750,000 $0 $1,750,000

Budget Impact/Other

96

Project # WA23

Project Name Waterman Complete above design

Type      Water Department      Water Department

Category      Water Contact      Water Resources Manager

Strategic Action #      Quality of Life Priority      1

Project Status      New Project

Description Total Project Cost: $150,000

Justification

Ensure water supply

Expenditures FY15 FY16 FY17 FY18 FY19 FY20 FY21 FY22 FY23 FY24 TOTAL

454‐5110‐500.72.40 $150,000 $150,000

$0

Total $0 $0 $0 $0 $0 $0 $0 $0 $150,000 $0 $150,000

FY 2015‐24 CAPITAL IMPROVEMENT PROGRAM                                                         PROJECT DESCRIPTION

Funding Sources FY15 FY16 FY17 FY18 FY19 FY20 FY21 FY22 FY23 FY24 TOTAL

Water Dev Fees $0 $0 $0 $0 $0 $0 $0 $150,000 $0 $150,000

$0

Total $0 $0 $0 $0 $0 $0 $0 $0 $150,000 $0 $150,000

Budget Impact/Other

97

Project # WA23

Project Name Southern Solution Raw Water Tank

Type      Water Department      Water Department

Category      Water Contact      Water Resources Manager

Strategic Action #      Quality of Life Priority      1

Project Status      New Project

Description Total Project Cost: $150,000

Justification

Ensure water supply

Expenditures FY15 FY16 FY17 FY18 FY19 FY20 FY21 FY22 FY23 FY24 TOTAL

454‐5110‐500.72.40 $150,000 $150,000

$0

Total $0 $0 $0 $0 $0 $0 $0 $0 $150,000 $0 $150,000

FY 2015‐24 CAPITAL IMPROVEMENT PROGRAM                                                         PROJECT DESCRIPTION

Funding Sources FY15 FY16 FY17 FY18 FY19 FY20 FY21 FY22 FY23 FY24 TOTAL

Water Dev Fees $0 $0 $0 $0 $0 $0 $0 $150,000 $0 $150,000

$0

Total $0 $0 $0 $0 $0 $0 $0 $0 $150,000 $0 $150,000

Budget Impact/Other

98

Project # WA22

Project Name Transmission Mains

Type      Water Department      Water Department

Category      Water Contact      Water Resources Manager

Strategic Action #      Quality of Life Priority      1

Project Status      New Project

Description Total Project Cost: $4,685,295

Justification

Ensure water supply

Expenditures FY15 FY16 FY17 FY18 FY19 FY20 FY21 FY22 FY23 FY24 TOTAL

454‐5110‐500.72.40 $4,685,295 $4,685,295

$0

Total $0 $0 $0 $0 $0 $0 $0 $4,685,295 $0 $0 $4,685,295

FY 2015‐24 CAPITAL IMPROVEMENT PROGRAM                                                         PROJECT DESCRIPTION

Funding Sources FY15 FY16 FY17 FY18 FY19 FY20 FY21 FY22 FY23 FY24 TOTAL

Water Dev Fees $0 $0 $0 $0 $0 $0 $4,685,295 $0 $0 $4,685,295

$0

Total $0 $0 $0 $0 $0 $0 $0 $4,685,295 $0 $0 $4,685,295

Budget Impact/Other

99

Project # WA23

Project Name Cotton Lane 20" Transmission Main

Type      Water Department      Water Department

Category      Water Contact      Water Resources Manager

Strategic Action #      Quality of Life Priority      1

Project Status      New Project

Description Total Project Cost: $1,900,000

Justification

Ensure water supply

Expenditures FY15 FY16 FY17 FY18 FY19 FY20 FY21 FY22 FY23 FY24 TOTAL

454‐5110‐500.72.40 $1,900,000 $1,900,000

$0

Total $0 $0 $0 $0 $0 $0 $0 $0 $1,900,000 $0 $1,900,000

FY 2015‐24 CAPITAL IMPROVEMENT PROGRAM                                                         PROJECT DESCRIPTION

Funding Sources FY15 FY16 FY17 FY18 FY19 FY20 FY21 FY22 FY23 FY24 TOTAL

Water Dev Fees $0 $0 $0 $0 $0 $0 $0 $1,900,000 $0 $1,900,000

$0

Total $0 $0 $0 $0 $0 $0 $0 $0 $1,900,000 $0 $1,900,000

Budget Impact/Other

100

Project # WA23

Project Name Rainbow Valley & Site 13 Booster

Type      Water Department      Water Department

Category      Water Contact      Water Resources Manager

Strategic Action #      Quality of Life Priority      1

Project Status      New Project

Description Total Project Cost: $1,750,000

Justification

Ensure water supply

Expenditures FY15 FY16 FY17 FY18 FY19 FY20 FY21 FY22 FY23 FY24 TOTAL

454‐5110‐500.72.40 $1,750,000 $1,750,000

$0

Total $0 $0 $0 $0 $0 $0 $0 $0 $1,750,000 $0 $1,750,000

FY 2015‐24 CAPITAL IMPROVEMENT PROGRAM                                                         PROJECT DESCRIPTION

Funding Sources FY15 FY16 FY17 FY18 FY19 FY20 FY21 FY22 FY23 FY24 TOTAL

Water Dev Fees $0 $0 $0 $0 $0 $0 $0 $1,750,000 $0 $1,750,000

$0

Total $0 $0 $0 $0 $0 $0 $0 $0 $1,750,000 $0 $1,750,000

Budget Impact/Other

101

Project # WA23

Project Name Southern Solution Well #1

Type      Water Department      Water Department

Category      Water Contact      Water Resources Manager

Strategic Action #      Quality of Life Priority      1

Project Status      New Project

Description Total Project Cost: $1,750,000

Justification

Ensure water supply

Expenditures FY15 FY16 FY17 FY18 FY19 FY20 FY21 FY22 FY23 FY24 TOTAL

454‐5110‐500.72.40 $1,750,000 $1,750,000

$0

Total $0 $0 $0 $0 $0 $0 $0 $0 $1,750,000 $0 $1,750,000

FY 2015‐24 CAPITAL IMPROVEMENT PROGRAM                                                         PROJECT DESCRIPTION

Funding Sources FY15 FY16 FY17 FY18 FY19 FY20 FY21 FY22 FY23 FY24 TOTAL

Water Dev Fees $0 $0 $0 $0 $0 $0 $0 $1,750,000 $0 $1,750,000

$0

Total $0 $0 $0 $0 $0 $0 $0 $0 $1,750,000 $0 $1,750,000

Budget Impact/Other

102

Project # WA24

Project Name Southern Solution Well #2

Type      Water Department      Water Department

Category      Water Contact      Water Resources Manager

Strategic Action #      Quality of Life Priority      1

Project Status      New Project

Description Total Project Cost: $1,750,000

Justification

Ensure water supply

Expenditures FY15 FY16 FY17 FY18 FY19 FY20 FY21 FY22 FY23 FY24 TOTAL

454‐5110‐500.72.40 $1,750,000 $1,750,000

$0

Total $0 $0 $0 $0 $0 $0 $0 $0 $0 $1,750,000 $1,750,000

FY 2015‐24 CAPITAL IMPROVEMENT PROGRAM                                                         PROJECT DESCRIPTION

Funding Sources FY15 FY16 FY17 FY18 FY19 FY20 FY21 FY22 FY23 FY24 TOTAL

Water Dev Fees $0 $0 $0 $0 $0 $0 $0 $0 $1,750,000 $1,750,000

$0

Total $0 $0 $0 $0 $0 $0 $0 $0 $0 $1,750,000 $1,750,000

Budget Impact/Other

103

Project # WA24

Project Name Site 13 Storage Tank

Type      Water Department      Water Department

Category      Water Contact      Water Resources Manager

Strategic Action #      Quality of Life Priority      1

Project Status      New Project

Description Total Project Cost: $1,500,022

Justification

Ensure water supply

Expenditures FY15 FY16 FY17 FY18 FY19 FY20 FY21 FY22 FY23 FY24 TOTAL

454‐5110‐500.72.40 $1,500,022 $1,500,022

$0

Total $0 $0 $0 $0 $0 $0 $0 $0 $0 $1,500,022 $1,500,022

FY 2015‐24 CAPITAL IMPROVEMENT PROGRAM                                                         PROJECT DESCRIPTION

Funding Sources FY15 FY16 FY17 FY18 FY19 FY20 FY21 FY22 FY23 FY24 TOTAL

Water Dev Fees $0 $0 $0 $0 $0 $0 $0 $0 $1,500,022 $1,500,022

$0

Total $0 $0 $0 $0 $0 $0 $0 $0 $0 $1,500,022 $1,500,022

Budget Impact/Other

104

Project # WA23

Project Name 12" Brine Line

Type      Water Department      Water Department

Category      Water Contact      Water Resources Manager

Strategic Action #      Quality of Life Priority      1

Project Status      New Project

Description Total Project Cost: $1,275,928

Justification

Ensure water supply

Expenditures FY15 FY16 FY17 FY18 FY19 FY20 FY21 FY22 FY23 FY24 TOTAL

454‐5110‐500.72.40 $1,275,928 $1,275,928

$0

Total $0 $0 $0 $0 $0 $0 $0 $0 $1,275,928 $0 $1,275,928

FY 2015‐24 CAPITAL IMPROVEMENT PROGRAM                                                         PROJECT DESCRIPTION

Funding Sources FY15 FY16 FY17 FY18 FY19 FY20 FY21 FY22 FY23 FY24 TOTAL

Water Dev Fees $0 $0 $0 $0 $0 $0 $0 $1,275,928 $0 $1,275,928

$0

Total $0 $0 $0 $0 $0 $0 $0 $0 $1,275,928 $0 $1,275,928

Budget Impact/Other

105

Project # WA22

Project Name Estrella Parkway Transmission Main

Type      Water Department      Water Department

Category      Water Contact      Water Resources Manager

Strategic Action #      Quality of Life Priority      1

Project Status      New Project

Description Total Project Cost: $1,052,189

Justification

Ensure water supply

Expenditures FY15 FY16 FY17 FY18 FY19 FY20 FY21 FY22 FY23 FY24 TOTAL

454‐5110‐500.72.40 $1,052,189 $1,052,189

$0

Total $0 $0 $0 $0 $0 $0 $0 $1,052,189 $0 $0 $1,052,189

FY 2015‐24 CAPITAL IMPROVEMENT PROGRAM                                                         PROJECT DESCRIPTION

Funding Sources FY15 FY16 FY17 FY18 FY19 FY20 FY21 FY22 FY23 FY24 TOTAL

Water Dev Fees $0 $0 $0 $0 $0 $0 $1,052,189 $0 $0 $1,052,189

$0

Total $0 $0 $0 $0 $0 $0 $0 $1,052,189 $0 $0 $1,052,189

Budget Impact/Other

106

Project # WA23

Project Name Cotton Lane to Site 13

Type      Water Department      Water Department

Category      Water Contact      Water Resources Manager

Strategic Action #      Quality of Life Priority      1

Project Status      New Project

Description Total Project Cost: $720,000

Justification

Ensure water supply

Expenditures FY15 FY16 FY17 FY18 FY19 FY20 FY21 FY22 FY23 FY24 TOTAL

454‐5110‐500.72.40 $720,000 $720,000

$0

Total $0 $0 $0 $0 $0 $0 $0 $0 $720,000 $0 $720,000

Funding Sources FY15 FY16 FY17 FY18 FY19 FY20 FY21 FY22 FY23 FY24 TOTAL

FY 2015‐24 CAPITAL IMPROVEMENT PROGRAM                                                          PROJECT DESCRIPTION

Water Dev Fees $0 $0 $0 $0 $0 $0 $0 $720,000 $0 $720,000

$0

Total $0 $0 $0 $0 $0 $0 $0 $0 $720,000 $0 $720,000

Budget Impact/Other

107

Project # WA23

Project Name Southern Solution Raw Water Storage Tank

Type      Water Department      Water Department

Category      Water Contact      Water Resources Manager

Strategic Action #      Quality of Life Priority      1

Project Status      New Project

Description Total Project Cost: $500,000

Justification

Ensure water supply

Expenditures FY15 FY16 FY17 FY18 FY19 FY20 FY21 FY22 FY23 FY24 TOTAL

454‐5110‐500.72.40 $500,000 $500,000

$0

Total $0 $0 $0 $0 $0 $0 $0 $0 $500,000 $0 $500,000

FY 2015‐24 CAPITAL IMPROVEMENT PROGRAM                                                         PROJECT DESCRIPTION

Funding Sources FY15 FY16 FY17 FY18 FY19 FY20 FY21 FY22 FY23 FY24 TOTAL

Water Dev Fees $0 $0 $0 $0 $0 $0 $0 $500,000 $0 $500,000

$0

Total $0 $0 $0 $0 $0 $0 $0 $0 $500,000 $0 $500,000

Budget Impact/Other

108

Project # WA23

Project Name Waterman Complete above design

Type      Water Department      Water Department

Category      Water Contact      Water Resources Manager

Strategic Action #      Quality of Life Priority      1

Project Status      New Project

Description Total Project Cost: $150,000

Justification

Ensure water supply

Expenditures FY15 FY16 FY17 FY18 FY19 FY20 FY21 FY22 FY23 FY24 TOTAL

454‐5110‐500.72.40 $150,000 $150,000

$0

Total $0 $0 $0 $0 $0 $0 $0 $0 $150,000 $0 $150,000

FY 2015‐24 CAPITAL IMPROVEMENT PROGRAM                                                         PROJECT DESCRIPTION

Funding Sources FY15 FY16 FY17 FY18 FY19 FY20 FY21 FY22 FY23 FY24 TOTAL

Water Dev Fees $0 $0 $0 $0 $0 $0 $0 $150,000 $0 $150,000

$0

Total $0 $0 $0 $0 $0 $0 $0 $0 $150,000 $0 $150,000

Budget Impact/Other

109

Project # WW15

Project Name Las Brisas (West Goodyear D.A.)

Type      Wastewater Department      Wastewater Department

Category      Wastewater Lines Contact      Environmental Services Manager

Strategic Action #      Quality of Life Priority      1

Project Status      New Project

Description Total Project Cost: $1,354,700

Wastewater collection lines

Justification

Project identified in the 10‐yr Infrastructure Improvement Plan as necessary to support growth.

Expenditures FY15 FY16 FY17 FY18 FY19 FY20 FY21 FY22 FY23 FY24 TOTAL

472‐5210‐500.72.40 $270,940 $270,940 $270,940 $270,940 $270,940 $1,354,700

$0

Total $270,940 $270,940 $270,940 $270,940 $270,940 $0 $0 $0 $0 $0 $1,354,700

FY 2015‐24 CAPITAL IMPROVEMENT PROGRAM                                                         PROJECT DESCRIPTION

Funding Sources FY15 FY16 FY17 FY18 FY19 FY20 FY21 FY22 FY23 FY24 TOTAL

Water Dev Fees $270,940 $270,940 $270,940 $270,940 $270,940 $0 $0 $0 $0 $0 $1,354,700

$0

Total $270,940 $270,940 $270,940 $270,940 $270,940 $0 $0 $0 $0 $0 $1,354,700

Budget Impact/Other

110

Project # WW16

Project Name Effluent Injection Wells

Type      Wastewater Department      Wastewater Department

Category      Wastewater Lines Contact      Environmental Services Manager

Strategic Action #      Quality of Life Priority      1

Project Status      New Project

Description Total Project Cost: $1,000,000

Wastewater collection lines

Justification

Project identified in the 10‐yr Infrastructure Improvement Plan as necessary to support growth.

Expenditures FY15 FY16 FY17 FY18 FY19 FY20 FY21 FY22 FY23 FY24 TOTAL

473‐5210‐500.72.40  $  500,000   $      500,000  $1,000,000

$0

Total $0 $500,000 $0 $0 $500,000 $0 $0 $0 $0 $0 $1,000,000

FY 2015‐24 CAPITAL IMPROVEMENT PROGRAM                                                         PROJECT DESCRIPTION

Funding Sources FY15 FY16 FY17 FY18 FY19 FY20 FY21 FY22 FY23 FY24 TOTAL

Wastewater Dev Fees  $  500,000   $      500,000  $0 $0 $0 $0 $0 $1,000,000

$0

Total $0 $500,000 $0 $0 $500,000 $0 $0 $0 $0 $0 $1,000,000

Budget Impact/Other

111

Project # WW15

Project Name GWRF Expansion

Type      Wastewater Department      Wastewater Department

Category      Wastewater Lines Contact      Environmental Services Manager

Strategic Action #      Quality of Life Priority      1

Project Status      New Project

Description Total Project Cost: $29,800,000

Wastewater collection lines

Justification

Project identified in the 10‐yr Infrastructure Improvement Plan as necessary to support growth.

Expenditures FY15 FY16 FY17 FY18 FY19 FY20 FY21 FY22 FY23 FY24 TOTAL

472‐5210‐500.72.40  $    2,000,000   $   1,400,000   $ 5,800,000  $8,352,154 $7,141,728 $5,106,118 $29,800,000

$0

Total $2,000,000 $1,400,000 $0 $5,800,000 $0 $0 $0 $8,352,154 $7,141,728 $5,106,118 $29,800,000

FY 2015‐24 CAPITAL IMPROVEMENT PROGRAM                                                           PROJECT DESCRIPTION

Funding Sources FY15 FY16 FY17 FY18 FY19 FY20 FY21 FY22 FY23 FY24 TOTAL

Wastewater Dev Fees  $      500,000   $      500,000  $0 $0 $8,352,154 $7,141,728 $5,106,118 $21,600,000

$0

Total $0 $500,000 $0 $0 $500,000 $0 $0 $8,352,154 $7,141,728 $5,106,118 $21,600,000

Budget Impact/Other

112

Project # WW15

Project Name Rainbow Valley Reclamation Facility

Type      Wastewater Department      Wastewater Department

Category      Wastewater Lines Contact      Environmental Services Manager

Strategic Action #      Quality of Life Priority      1

Project Status      New Project

Description Total Project Cost: $6,200,000

Wastewater collection lines

Justification

Project identified in the 10‐yr Infrastructure Improvement Plan as necessary to support growth.

Expenditures FY15 FY16 FY17 FY18 FY19 FY20 FY21 FY22 FY23 FY24 TOTAL

473‐5210‐500.72.40 $6,200,000 $6,200,000

$0

Total $0 $0 $0 $0 $0 $0 $0 $0 $0 $6,200,000 $6,200,000

FY 2015‐24 CAPITAL IMPROVEMENT PROGRAM                                                           PROJECT DESCRIPTION

Funding Sources FY15 FY16 FY17 FY18 FY19 FY20 FY21 FY22 FY23 FY24 TOTAL

Wastewater Dev Fees $0 $0 $0 $0 $6,200,000 $6,200,000

$0

Total $0 $0 $0 $0 $0 $0 $0 $0 $0 $6,200,000 $6,200,000

Budget Impact/Other

113


Recommended